Article

Osseointegration of Maxillary Dental Implants in Diabetes Mellitus Patients: A Randomized Clinical Trial Human Histomorphometric Study

by
Lyly Sam
1,
Siriporn Chattipakorn
2 and
Pathawee Khongkhunthian
1,*
1
Center of Excellence for Dental Implantology, Faculty of Dentistry, Chiang Mai University, Chiang Mai 50200, Thailand
2
Department of Oral Biology and Diagnostic Sciences, Faculty of Dentistry, Chiang Mai University, Chiang Mai 50200, Thailand
*
Author to whom correspondence should be addressed.
Submission received: 31 August 2020 / Revised: 25 September 2020 / Accepted: 25 September 2020 / Published: 27 September 2020
(This article belongs to the Special Issue Implant Dentistry)

Abstract

:
Background: Survival of dental implants in well-controlled Type 2 diabetes (T2DM) was found to be comparable to that in healthy patients. However, to our best knowledge, there have been no studies of the bone histomorphometry of osseointegration in patients with Type 2 diabetes. Purpose: To compare bone-implant-contact (BIC) and new bone formation between well-controlled Type 2 diabetes with HbA1c of less than 8% and healthy controls. Methods: 10 diabetic (T2DM) patients and 10 healthy controls were selected. Each patient received a 2.5 mm × 5 mm micro-implant in the maxilla, in either the premolar or first molar area. After 8 weeks of healing, the micro-implant was retrieved using a trephine bur and sent for bone histomorphometric analysis. A commercial titanium implant was immediately placed as the conventional treatment. Results: The mean BIC (30.73%) in T2DM patients was significantly lower than in the healthy patients (41.75%) (p = 0.01). New bone formation around the implant surface was reduced in T2DM patients (36.25%) compared to that in the control group (44.14%) (p = 0.028). The Pearson correlation coefficient revealed a strong correlation between increased HbA1c and decreased BIC (p < 0.05) and decreased new bone formation (p < 0.05). Conclusions: Within the limitation of this study, bone-to-implant contact and bone healing around dental implants in T2DM patients were significantly lower than in healthy patients.

1. Introduction

The connections between success of dental implantation and various systemic conditions have been started to be investigated and published during the past decade [1,2,3]. It is well known that any conditions that interfere with normal homeostasis of bone might have detrimental effects on the survival of dental implants [4]. Understanding the medically-compromised conditions that might affect dental implants, for example diabetes mellitus or osteoporosis, helps reduce failures and complications following the treatment [3]. Diabetes mellitus impairs bone healing, therefore, this systemic condition has to be taken into the consideration for dental implant treatment.
Four hundred and twenty-two million people worldwide were diagnosed with diabetes mellitus (DM) in 2014 and the number of affected people is estimated to be on the rise [5]. The increasing number of DM cases is due to increasing prevalence of obesity, since these two disorders are metabolically associated [6]. Increasing sugar intake, physical inactivity and sedentary life are the key factors for developing these two disorders, commonly found among people in developed countries [7,8].
The most common forms of DM are type 1 and type 2. Type 1 (T1DM), or insulin-dependent diabetes mellitus is the result of failure of the pancreas to produce insulin. Type 2 (T2DM), or non–insulin-dependent diabetes, results from deficiency in insulin production, or its mechanism of action, or both. Unlike T1DM, T2DM is linked to obesity, which is the predominant form in the adult population, contributing about 90% to 95% of diabetes cases [9]. This form of diabetes is characterized by insulin resistance, hyperglycemia and dysfunction of the pancreas to produce sufficient insulin. All of these disorders can be seen in the late stage of T2DM [10]. In addition, obesity and T2DM contribute to metabolic syndrome, which is associated with abdominal obesity, blood lipid disorders, inflammation, insulin resistance or full-blown diabetes, and increased risk of developing cardiovascular disease [11]. T2DM is associated with various systemic complications, including microvascular and macrovascular complications, such as retinopathy, nephropathy, neuropathy, cerebrovascular disease and cardiovascular disease [12]. Furthermore, DM has been found to be associated with increased prevalence of periodontitis and tooth loss [13], impaired wound healing, and increased susceptibility to infection [14].
Glycemic control is important for long term maintenance of DM to prevent associated major complications, such as cardiovascular diseases [15]. Glycosylated hemoglobin percentage (HbA1c) is considered a more reliable indicator for glycemic level in the previous six to eight weeks than fasting plasma glucose (FPG) [16]. The quality of glycemic control was found, in some studies [17,18,19,20], to affect the survival of dental implants and the healing of their supporting bone whereas, in others studies no differences were found [21,22,23]. “Well-controlled: “better-controlled,” “moderately-controlled,” and “poorly-controlled” DM are among the common terms to describe the quality of diabetic condition by different researchers in their respective studies. To determine the cut-off point for HbA1c to differentiate between well- and poorly-controlled DM is unclear, although many authors consider HbA1c of more than 8% as poorly-controlled [24]. This is possibly the reason why the results of bone healing around dental implants in T2DM were inconsistent due to different methods to define the glycemic status of the patients.
The long-term clinical performance of dental implants in diabetic patients is less than in healthy individuals [25,26,27]. Moreover, many clinical studies have investigated the effect of T2DM on soft and hard tissue healing following dental implant treatment [18,19,20,28]. In a recent systematic review, it was concluded that dental implant treatment is safe and predictable for diabetic patients; patients with well-controlled DM were able to achieve similar implant survival compared to healthy controls [29]. However, in poor-controlled DM, many studies reported impaired osseointegration [17,21], higher risk of peri-implantitis [18] and higher level of implant failure [27]. Clinically, the osseointegration in well- controlled DM has not been investigated.
A number of animal studies have evaluated bone healing around implants in patients with DM to understand its effects on osseointegration [30,31,32,33]. The results from these studies were convincing that DM adversely affects bone healing around implants by decreasing intrafibrillar collagen mineralization [30], trabecular bone formation [31], bone removal torque [32], bone mineralization and bone-implant contact significantly [33].
Various kinds of animal models have been used as testing steps with dental implants before clinical applications in human. The most commonly-used animals for evaluation of bone implant interaction are the dog, sheep, goat, pig and rabbit [34]. Among many characteristics to be considered when choosing a specific animal for an experiment, bone macrostructure, microstructure, composition and remodeling are the most important factors for consideration. The pig is considered a good likeness to human; however, size and ease of handling may limit its use for research [34]. There are a number of studies evaluating bone-implant contact (BIC) in humans [35,36,37,38,39]. For ethical reasons, dental implants placed in humans jaw bone and later retrieved for histologic evaluation are mostly used as transitional implants to support provisional dentures during the healing period.
Several studies conducted in animals show the adverse effect of DM such as peri-implantitis and disintegration on survival and healing of dental implants [30,31,32,33]; however, the similarity of bone healing around biocompatible materials still varies between animals and humans.
Therefore, the clinical study on humans is more appropriate for evaluating the effect of DM on bone healing and bone-implant contact. The purpose of this study was to compare bone-implant contact (BIC) and new bone formation at the bone implant connection in maxilla between healthy subjects and those with T2DM. The null hypothesis is no significant difference in bone implant contact and new bone formation between healthy and T2DM patients.

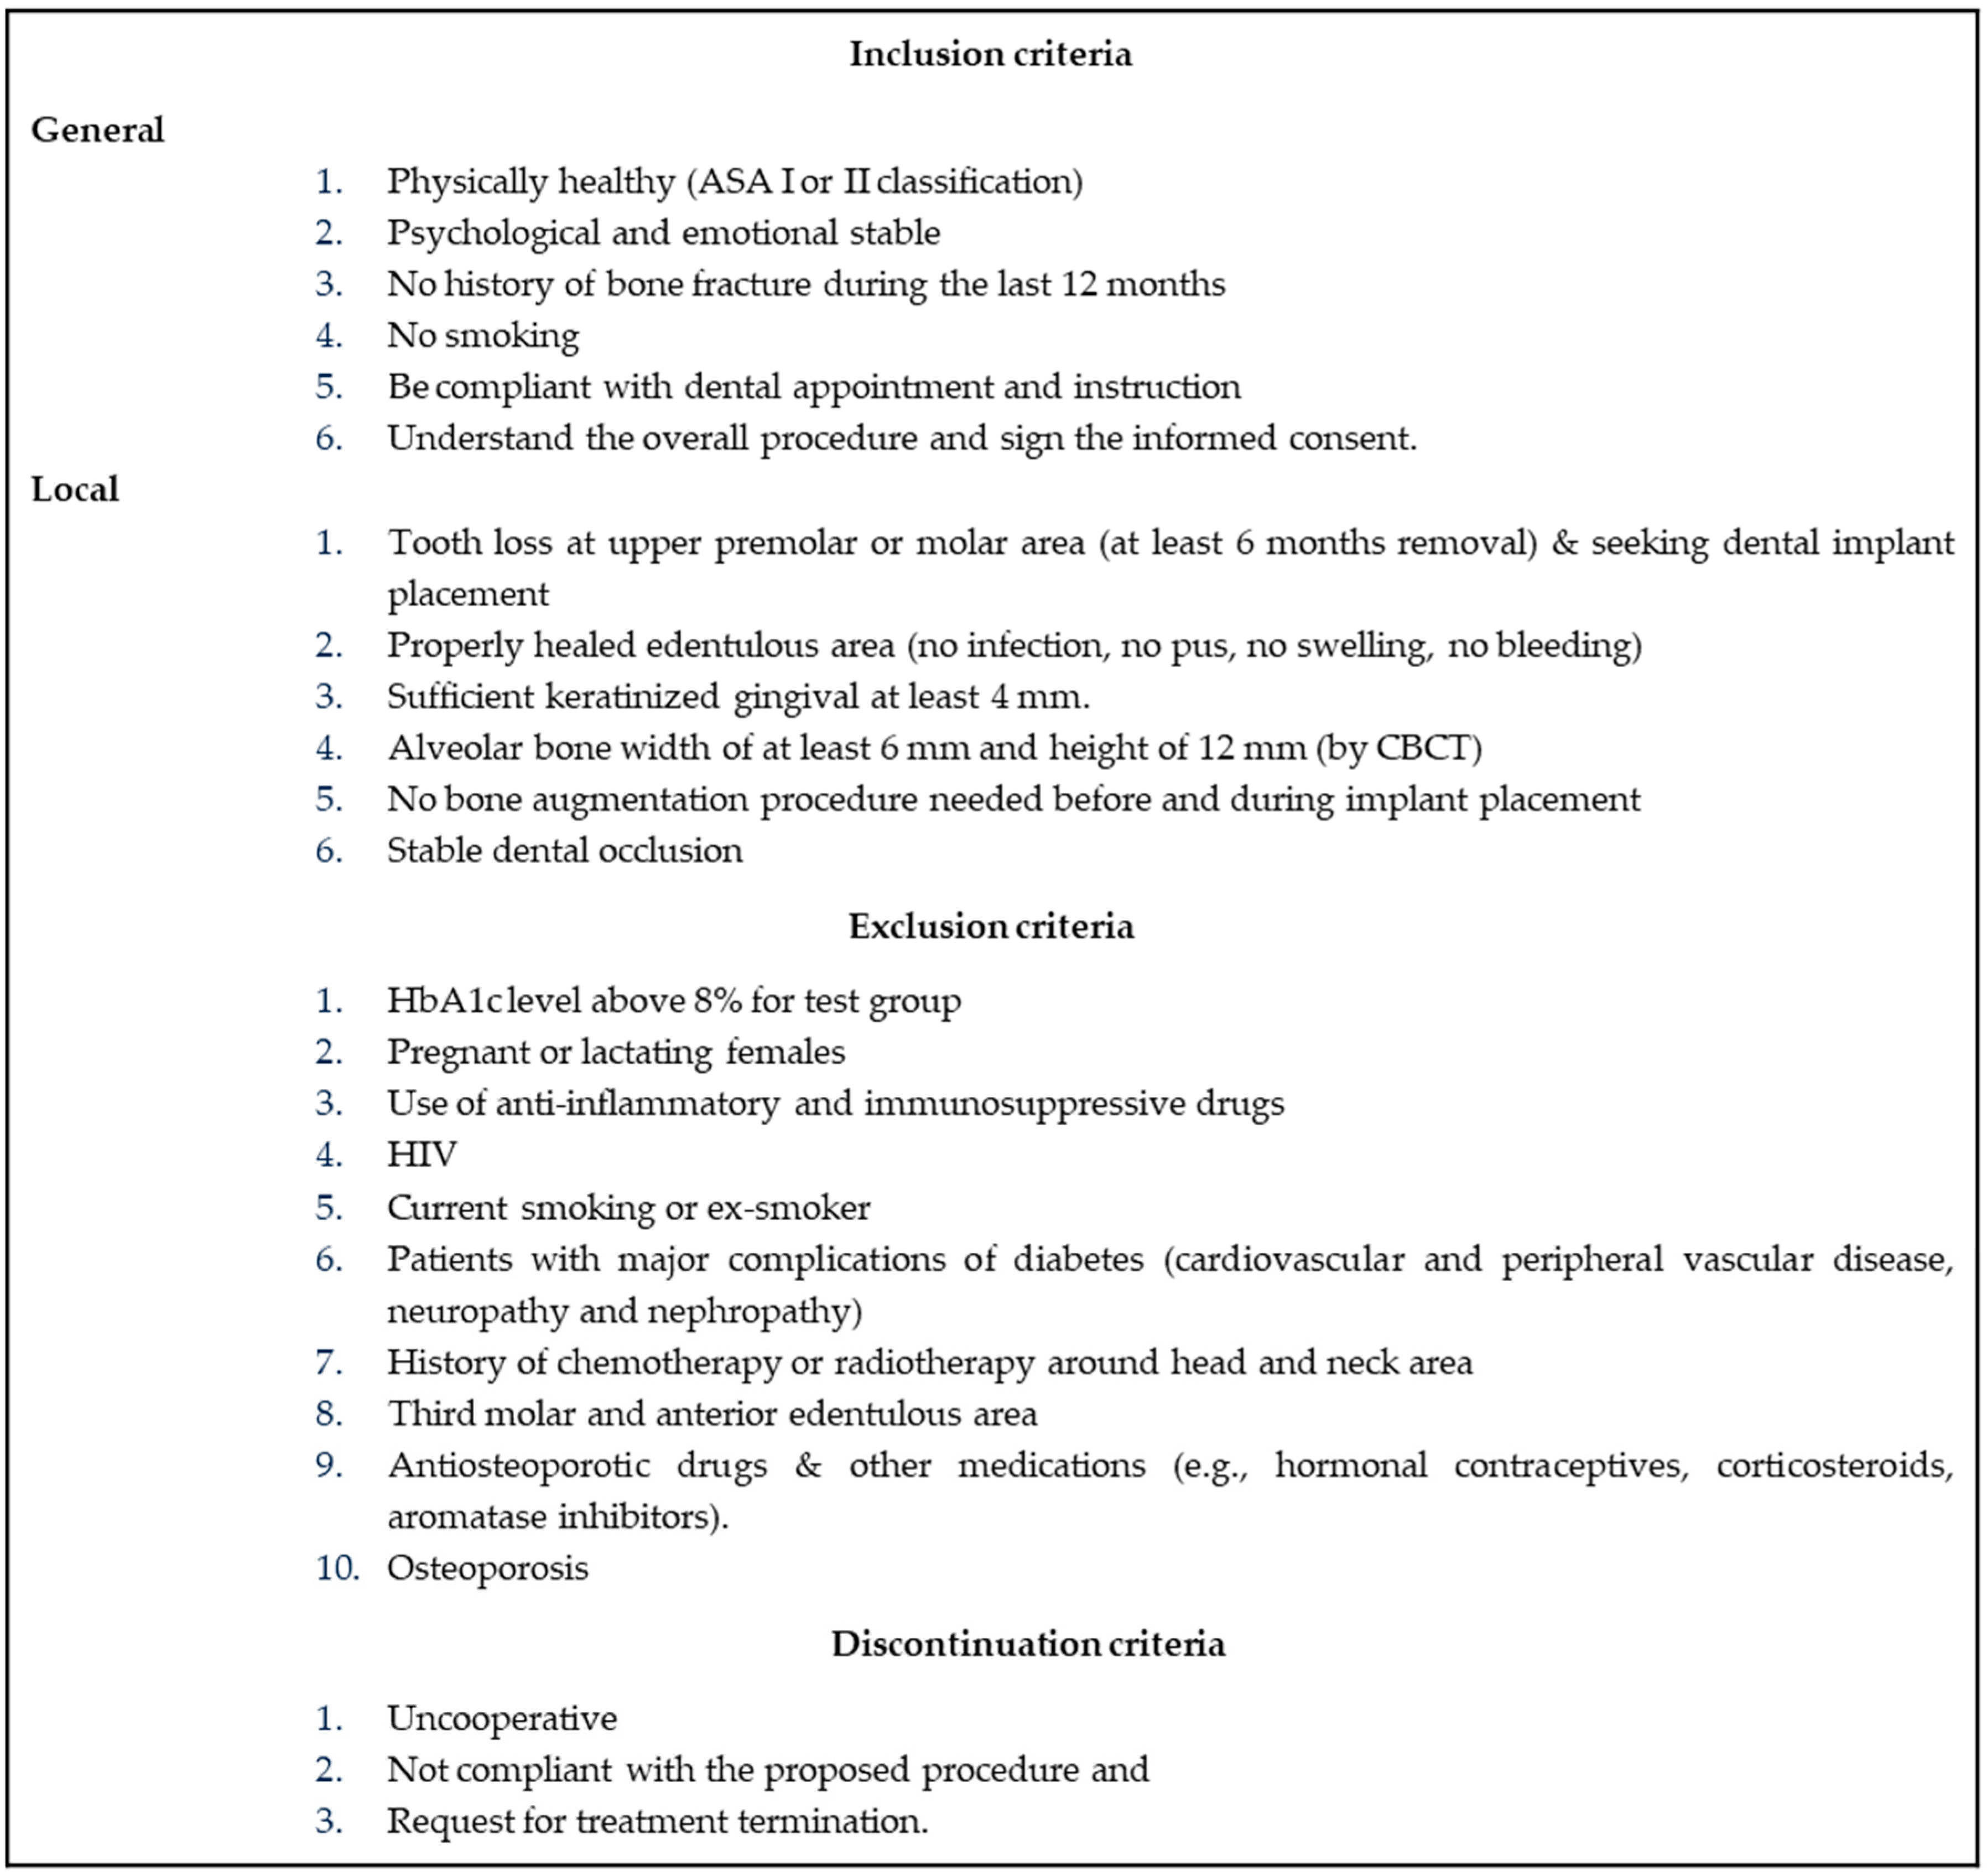
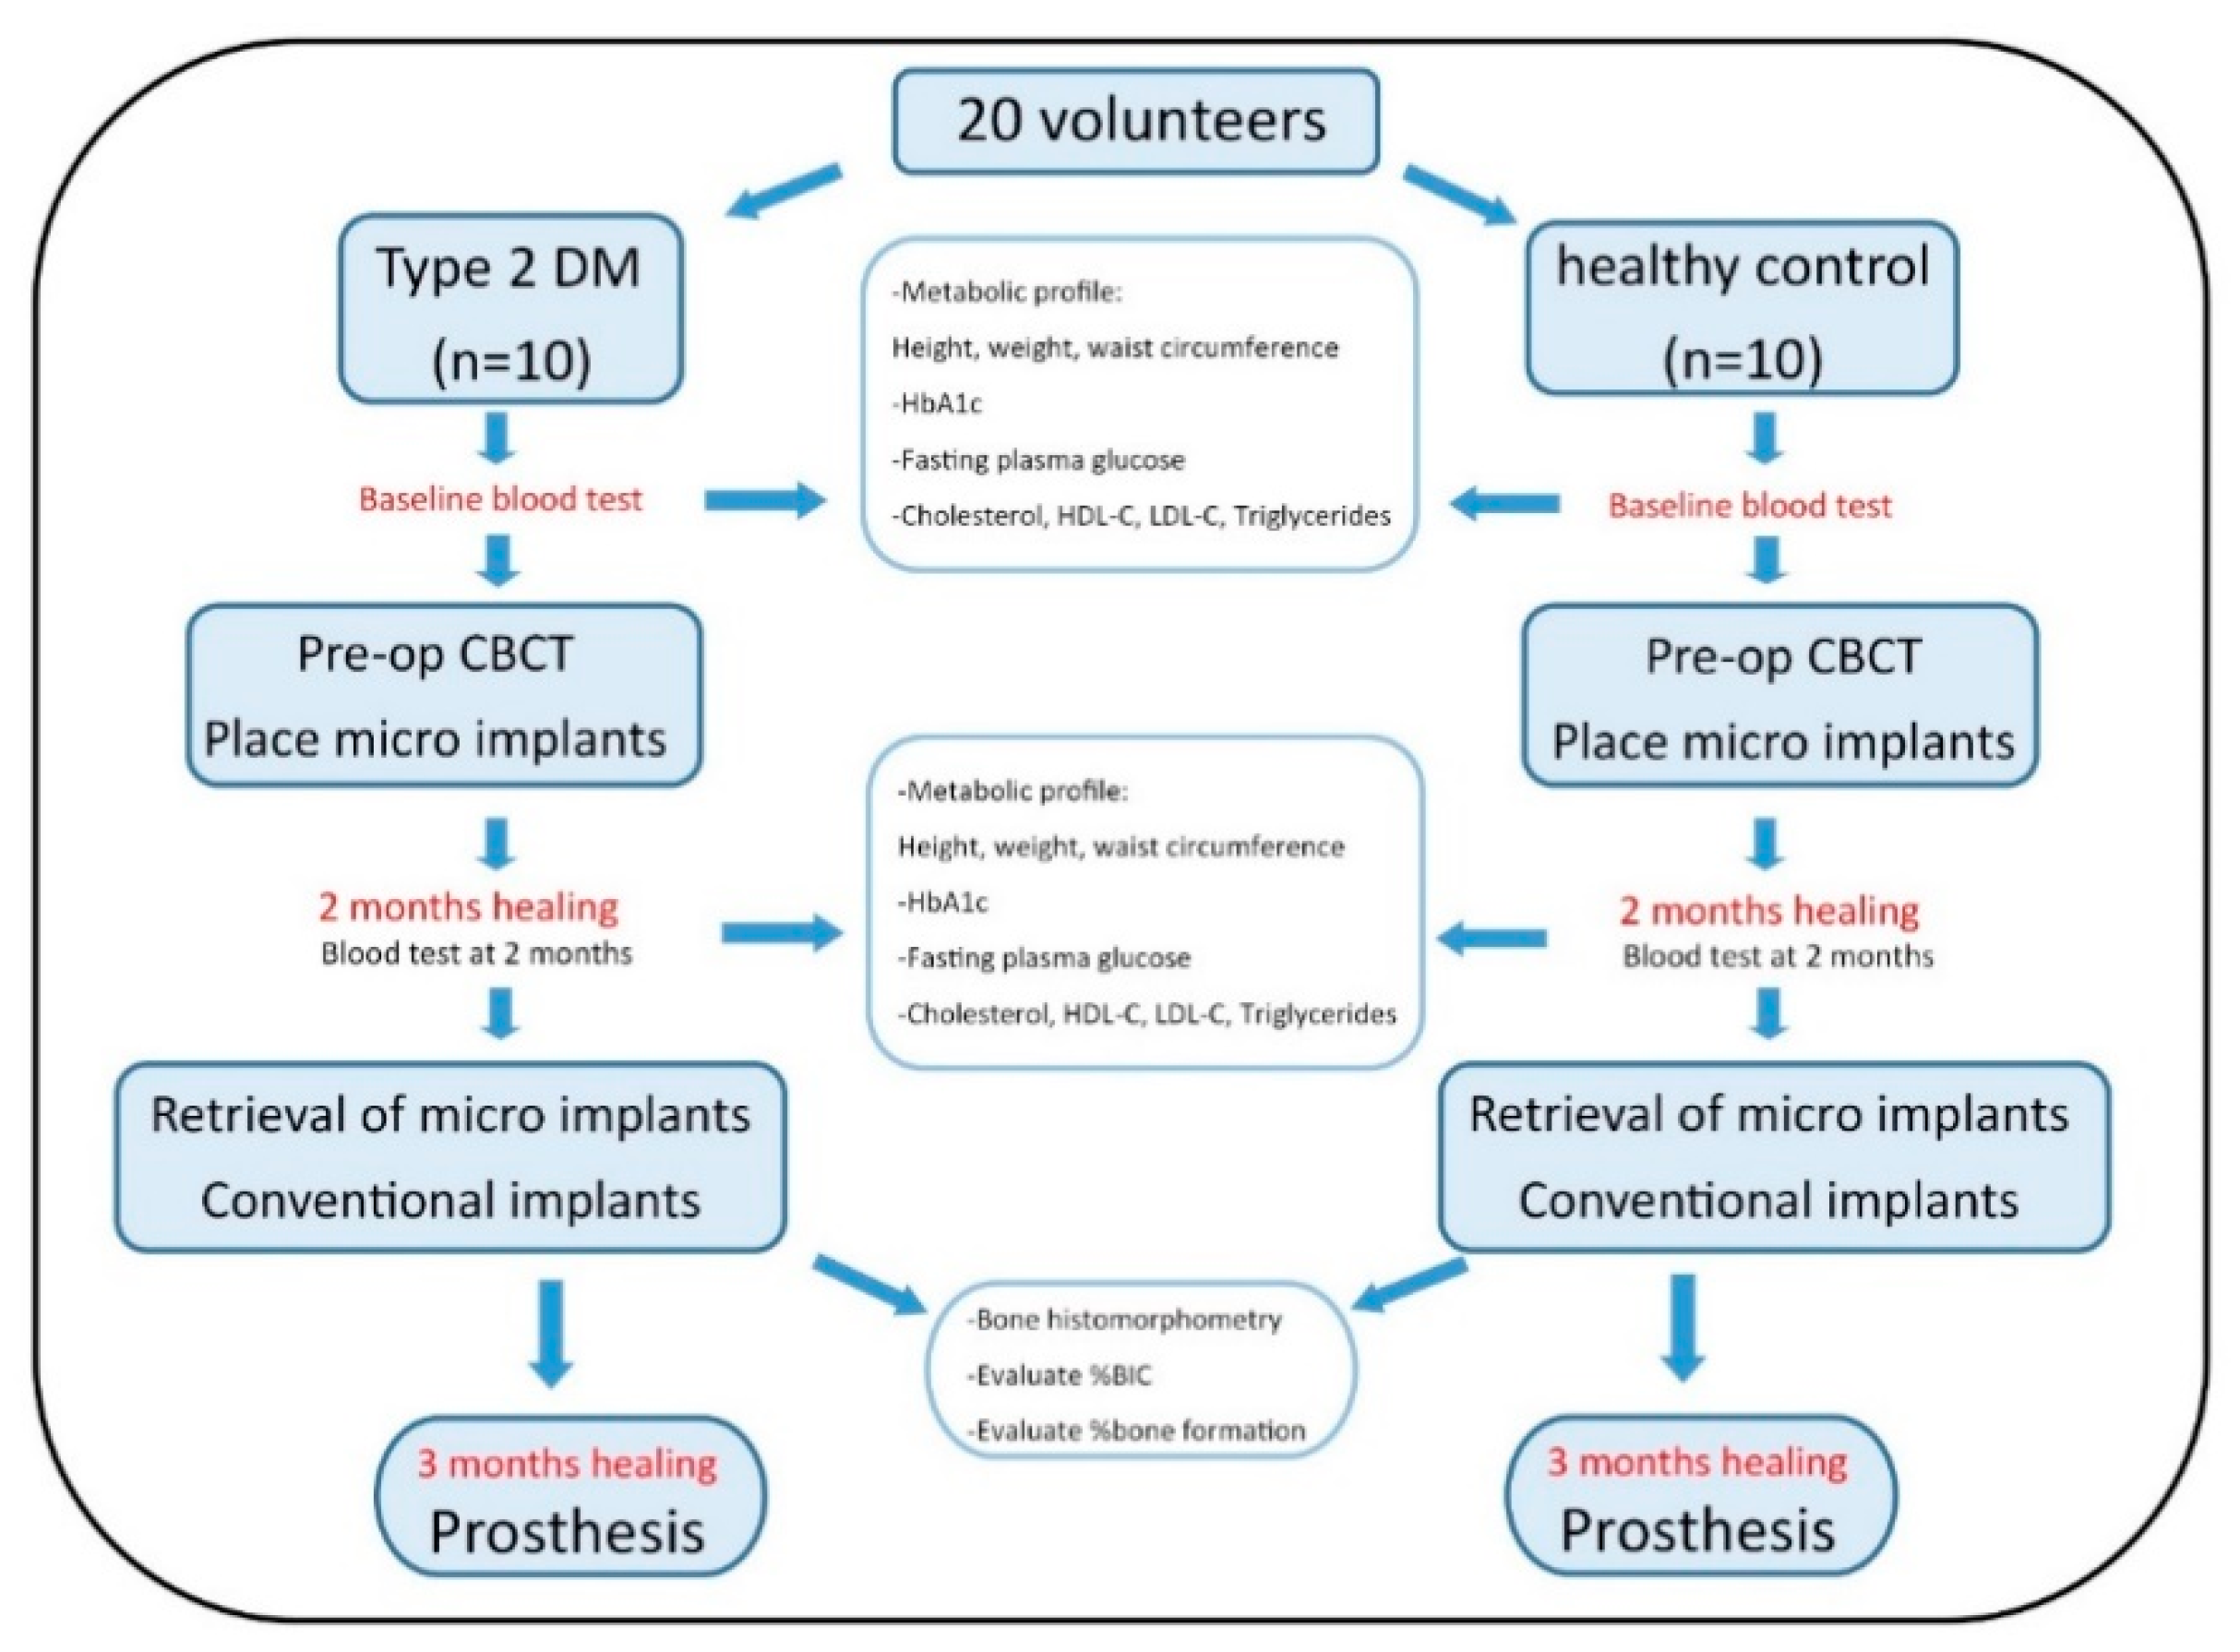
2. Materials and Methods

According to the WMA Declaration of Helsinki-Ethical Principles for Medical Research Involving Human Subjects, this study was approved by the Human Experimentation Committee of the Faculty of Dentistry, Chiang Mai University (No. 33/2561) and Thai Clinical Trials Registry (TCTR20190103004). All patients involving in the study have signed the inform consents. This prospective clinical study was designed (following the consort guideline) to compare BIC between well-controlled T2DM and healthy group. Ten T2DM and 10 healthy volunteers participated in this study. Patients who needed an implant in upper premolar and molar region were included in the study. All participants were well informed regarding to the whole procedure and an informed consent form was signed. For the T2DM patients, only those with well-controlled condition (HbA1c ≤ 8%) were admitted.
General inclusion criteria were physically healthy (ASA I or II), emotionally and psychologically stable and local inclusion criteria were tooth loss at premolar and molar area (at least 6months extraction), and sufficient keratinized tissue (>4 mm). Exclusion criteria were cardiovascular complications, history of bone fracture during the last 6 months, HIV, smoking and any type of cancers. List of all inclusion and exclusion criteria were presented in Figure 1. After intra-oral examination, patients were sent for dental cone-beam computed tomography to determine the bone width and height, which is the final criteria required for participating in this project.
Under local anesthesia, both groups had a micro-implants with 2.5 mm in diameter and 5 mm in length placed in their right or left maxilla in the premolar and first molar edentulous area. After eight weeks of healing, another surgery was performed to retrieve the micro-implant using trephine bur, and the retrieved micro-implant was sent for bone histomorphometric analysis to evaluate BIC and new bone formation. Upon removal of the micro implant, the bone bed was prepared for conventional implant placement. Either 4.2 mm or 5 mm diameter of conventional implant was used depends on the width of alveolar bone and location of implant placed. Dental prosthesis was delivered after 12 weeks of uneventful healing. Height, weight, and waist circumference were recorded and blood was taken at the baseline and two months after healing of micro-implants to evaluate FPG, HbA1c, cholesterol, triglycerides, HDL-C and LDL-C. A summary of the research protocol is shown in Figure 2.

2.1. Micro-Implant Design and Characteristics

All micro-implants (Novem, PW plus Company, Nakorn Pathom, Thailand) were made from commercially available pure (CP) titanium grade 4.
The implants have minimal surface roughness by sandblast acid etch technique the same as a commercial dental implant. The implant has 2.5 mm of diameter and 5 mm of length with characteristics of four outer rings and three chambers similar to the implants used in another study [40] (Figure 3).

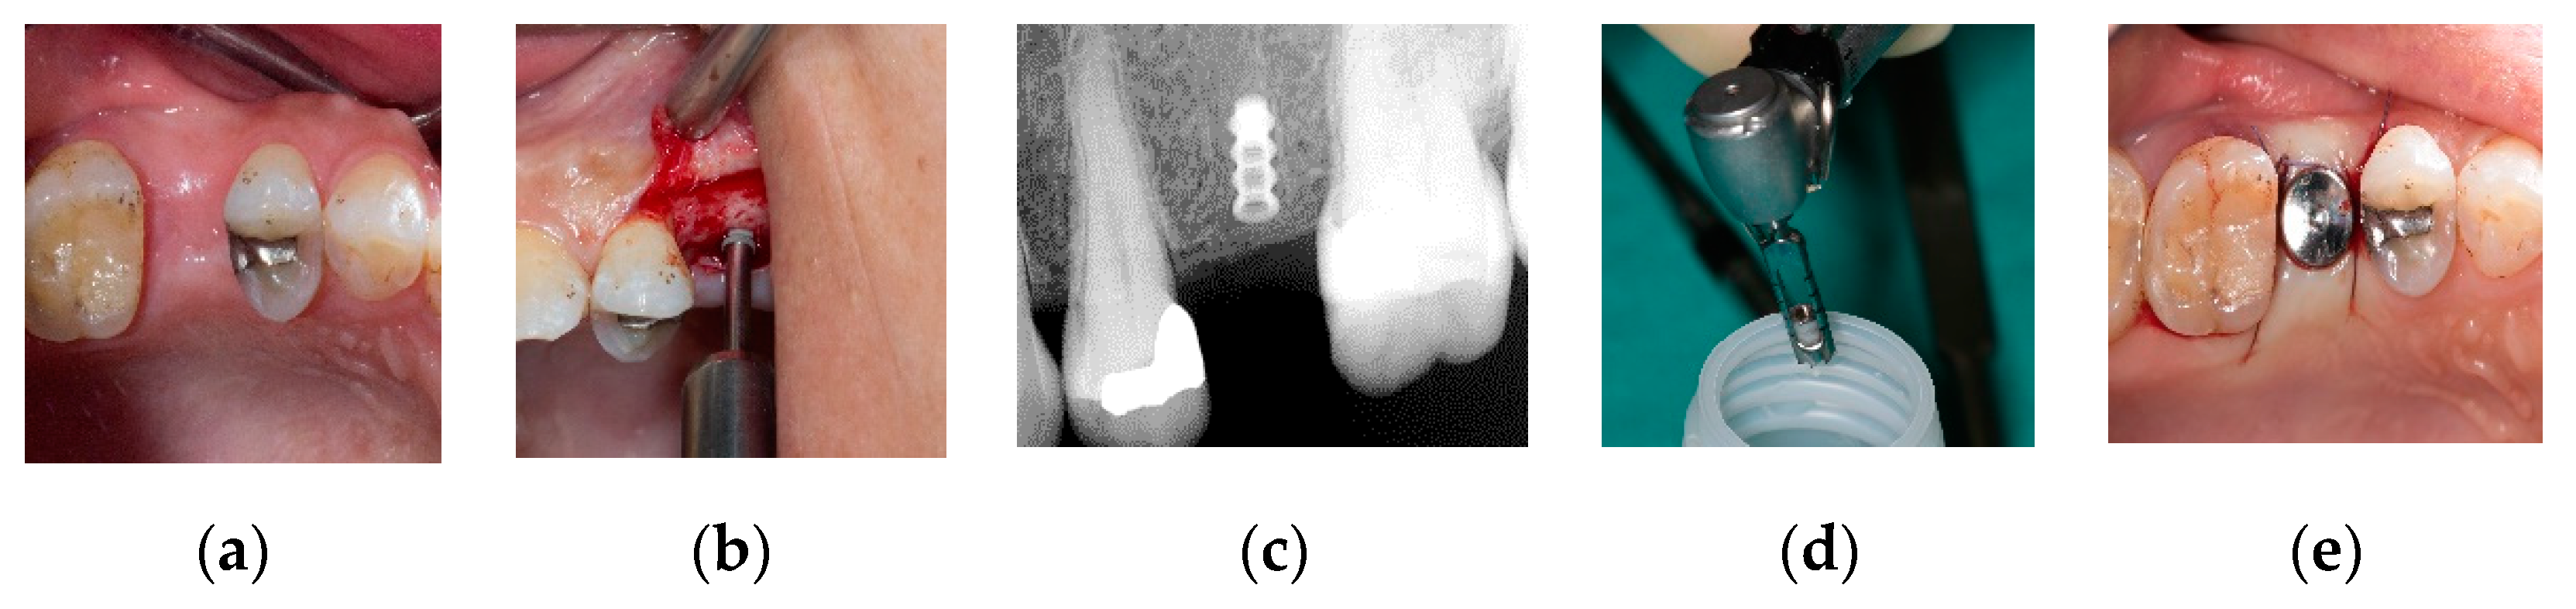
2.1.1. Surgical Procedure

Micro-Implant Placement

Edentulous area in the maxillary premolar and first molar region both right and left side were included in the experiment protocol with bone diameter of at least 6 mm in order to accommodate the future conventional implant of between 4.2 mm to 5 mm and bone length of at least 10 mm to 12 mm. All of patients in control and test groups first underwent surgical placement of a 2.5 mm × 5 mm micro-implant (Figure 4c). Local anesthesia was administered using articaine 4% with epinephrine 1:100,000 concentration (Septanest SP, Septodont, Saint-Maur-des-Fosses, France) and mid-crestal incision was made using number 15c carbon steel blade (Swann-Morton, Sheffield, England) and full thickness flap was raised using periosteal elevator. Implant bed was made using a cylindrical carbide bur drilled in the middle of the crestal bone and the micro-implant was placed by press-fit technique using percussion manually until all the threads completely embedded in the alveolar bone. The mucoperiosteal flap was then repositioned and 4-0 nylon suture (Sofilon, Novamedic, Samut Prakan, Thailand) was used to close the surgical site. Analgesic (paracetamol 500 mg, GPO, Bangkok, Thailand) and antibiotics (either amoxycillin 500 mg (GPO) or clindamycin 150 mg (GPO) were prescribed for all patients for 3 days and 7 days respectively. Sutures were removed after 7 days post-operation, and wound healing was monitored at 1 week, 4 weeks and 8 weeks after implant placement before retrieval and placement of conventional implants.

Conventional Implant Placement

After 8 weeks healing of micro-implants, all patients were appointed for another surgery to retrieve the integrated micro-implant. A conventional dental implant (Novem, PW plus) was placed in the existing socket as part of a missing tooth replacement with implant supported prosthesis. The surgical procedure began with local anesthesia administration with articaine 4% with epinephrine 1:100,000 concentration (Septanest SP, Septodont, Saint-Maur-des-Fossés, France). A 15c scalpel blade (Swann-Morton, Sheffield, England) was used to make mid-crestal incision before full thickness flap was raised with periosteal elevator. Upon the exposure of micro-implant head, trephine bur was used to remove the implant along with intact bone surrounding (Figure 4d). The specimen was then placed in 10% buffered formalin solution and sent to the laboratory for histomorphometric evaluation. In the same surgical site, implant bed was further prepared by implant shaping and final drills following the implant manufacturer’s instruction of drilling protocol. Implant of 4.2 mm or 5 mm diameter and 10 mm or 12 mm in length was then placed (Figure 4e) followed by insertion torque and resonance frequency analysis (RFA) to measure implant stability as part of conventional implant surgery procedure. Transmucosal healing abutment was tightened on top of the conventional implant fixture and the soft tissue was repositioned with 4-0 nylon sutures (Sofilon, Novamedic, Samut Prakan, Thailand). Patients were appointed for 1 week follow up and suture removal. After 12 weeks of uneventful healing, dental impression was made and sent to dental laboratory for prosthesis fabrication.

2.2. Blood Test

All participants were required to fast for at least 10 h before blood withdrawal to evaluate HbA1c, FPG, cholesterol, HDL-C, LDL-C and triglycerides at baseline and 8 weeks after micro-implant placement. Ten milliliters of blood was collected from median cubital vein and separated into 3 different tubes for different parameters. Whole blood in EDTA tube was for testing HbA1c and sodium fluoride tube was for fasting plasma glucose. Another tube (red tube) with no anticoagulant or preservative was used for testing of cholesterol, HDL-C, LDL-C and triglycerides. All data was analyzed and correlated with the value of BIC and new bone formation.

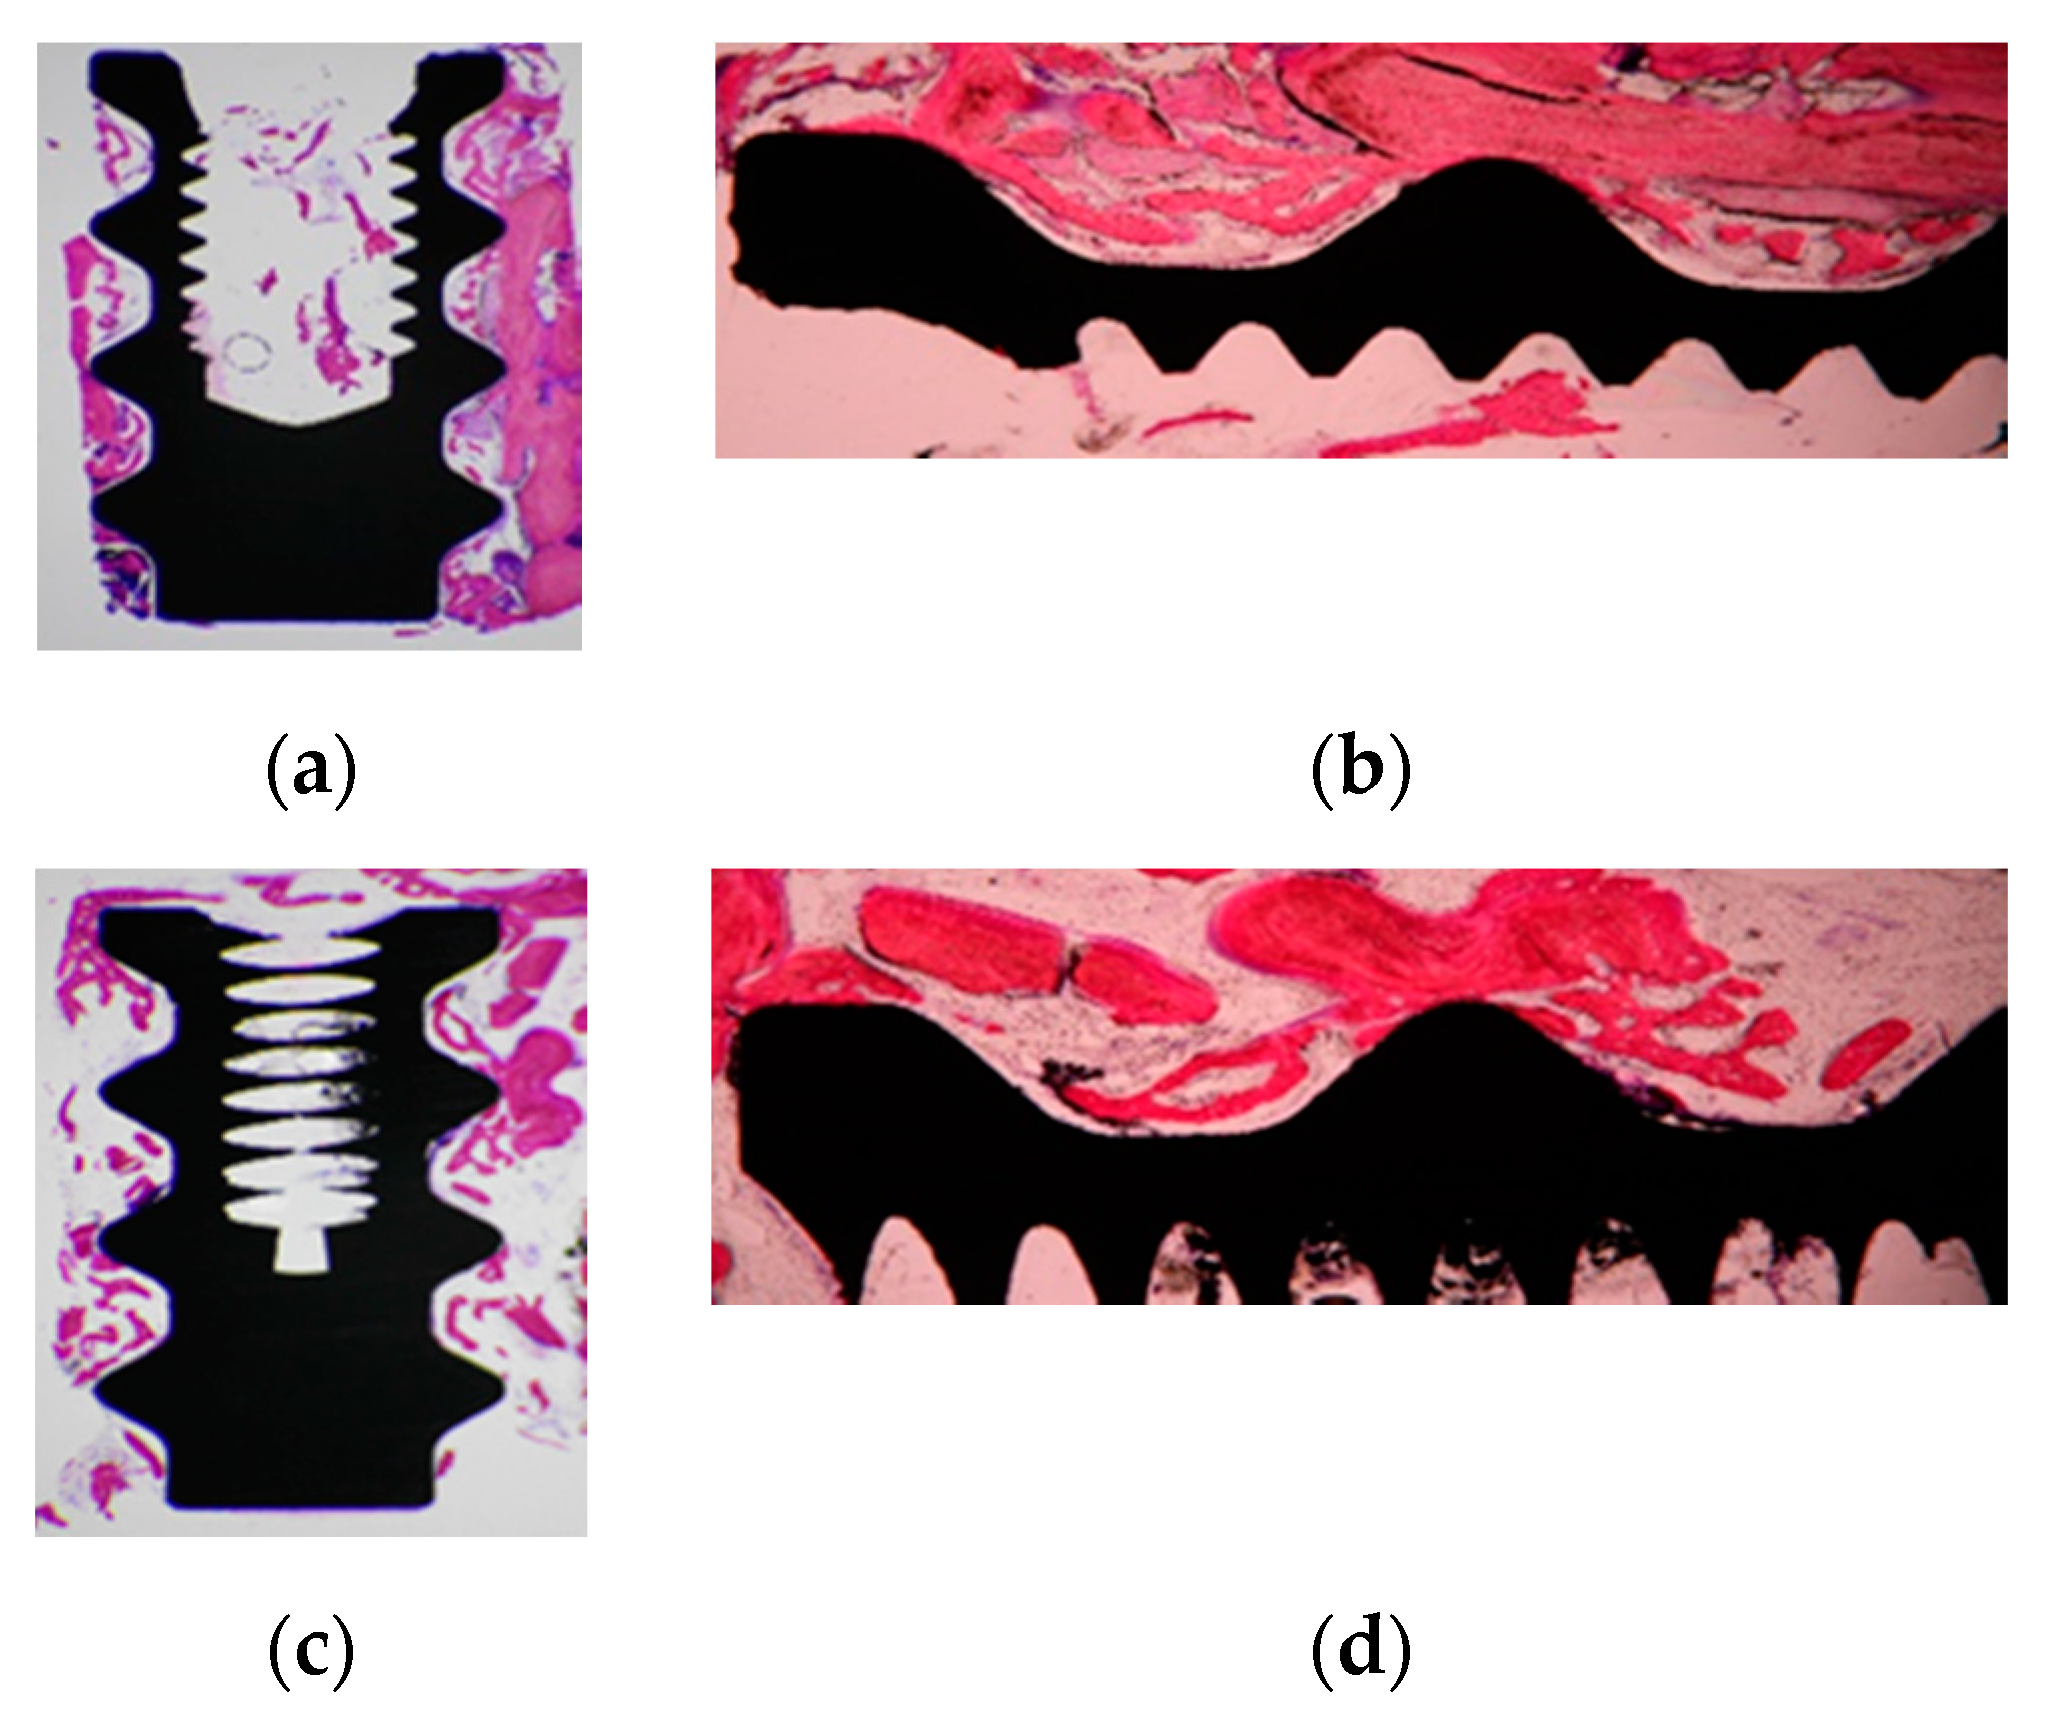
2.3. Histological Preparation and Histomorphometric Analysis

Sample processing included fixation, dehydration, infiltration and embedding following the method described by Donath et al. [41]. The final thickness after grinding the sample was about 8–10 µm. After staining with toluidine blue, image processing was captured by Carl Zeiss microscope and analyzed by AxioVision SE64 Rel. 4.9.1 Software (Carl Zeiss, Jena, Germany). The total length of implant surface and the length of the surface where the bone tissue directly contacted the implant were measured to calculate bone contact with the implant surface. For the new bone formation, the total area of implant chamber and the area of new bone growth were measured to calculate the percentage of bone formation. Two separated evaluators analyzed and calculated the samples and inter-calibration between the examiners was done before statistical analysis.

2.4. Statistical Analysis
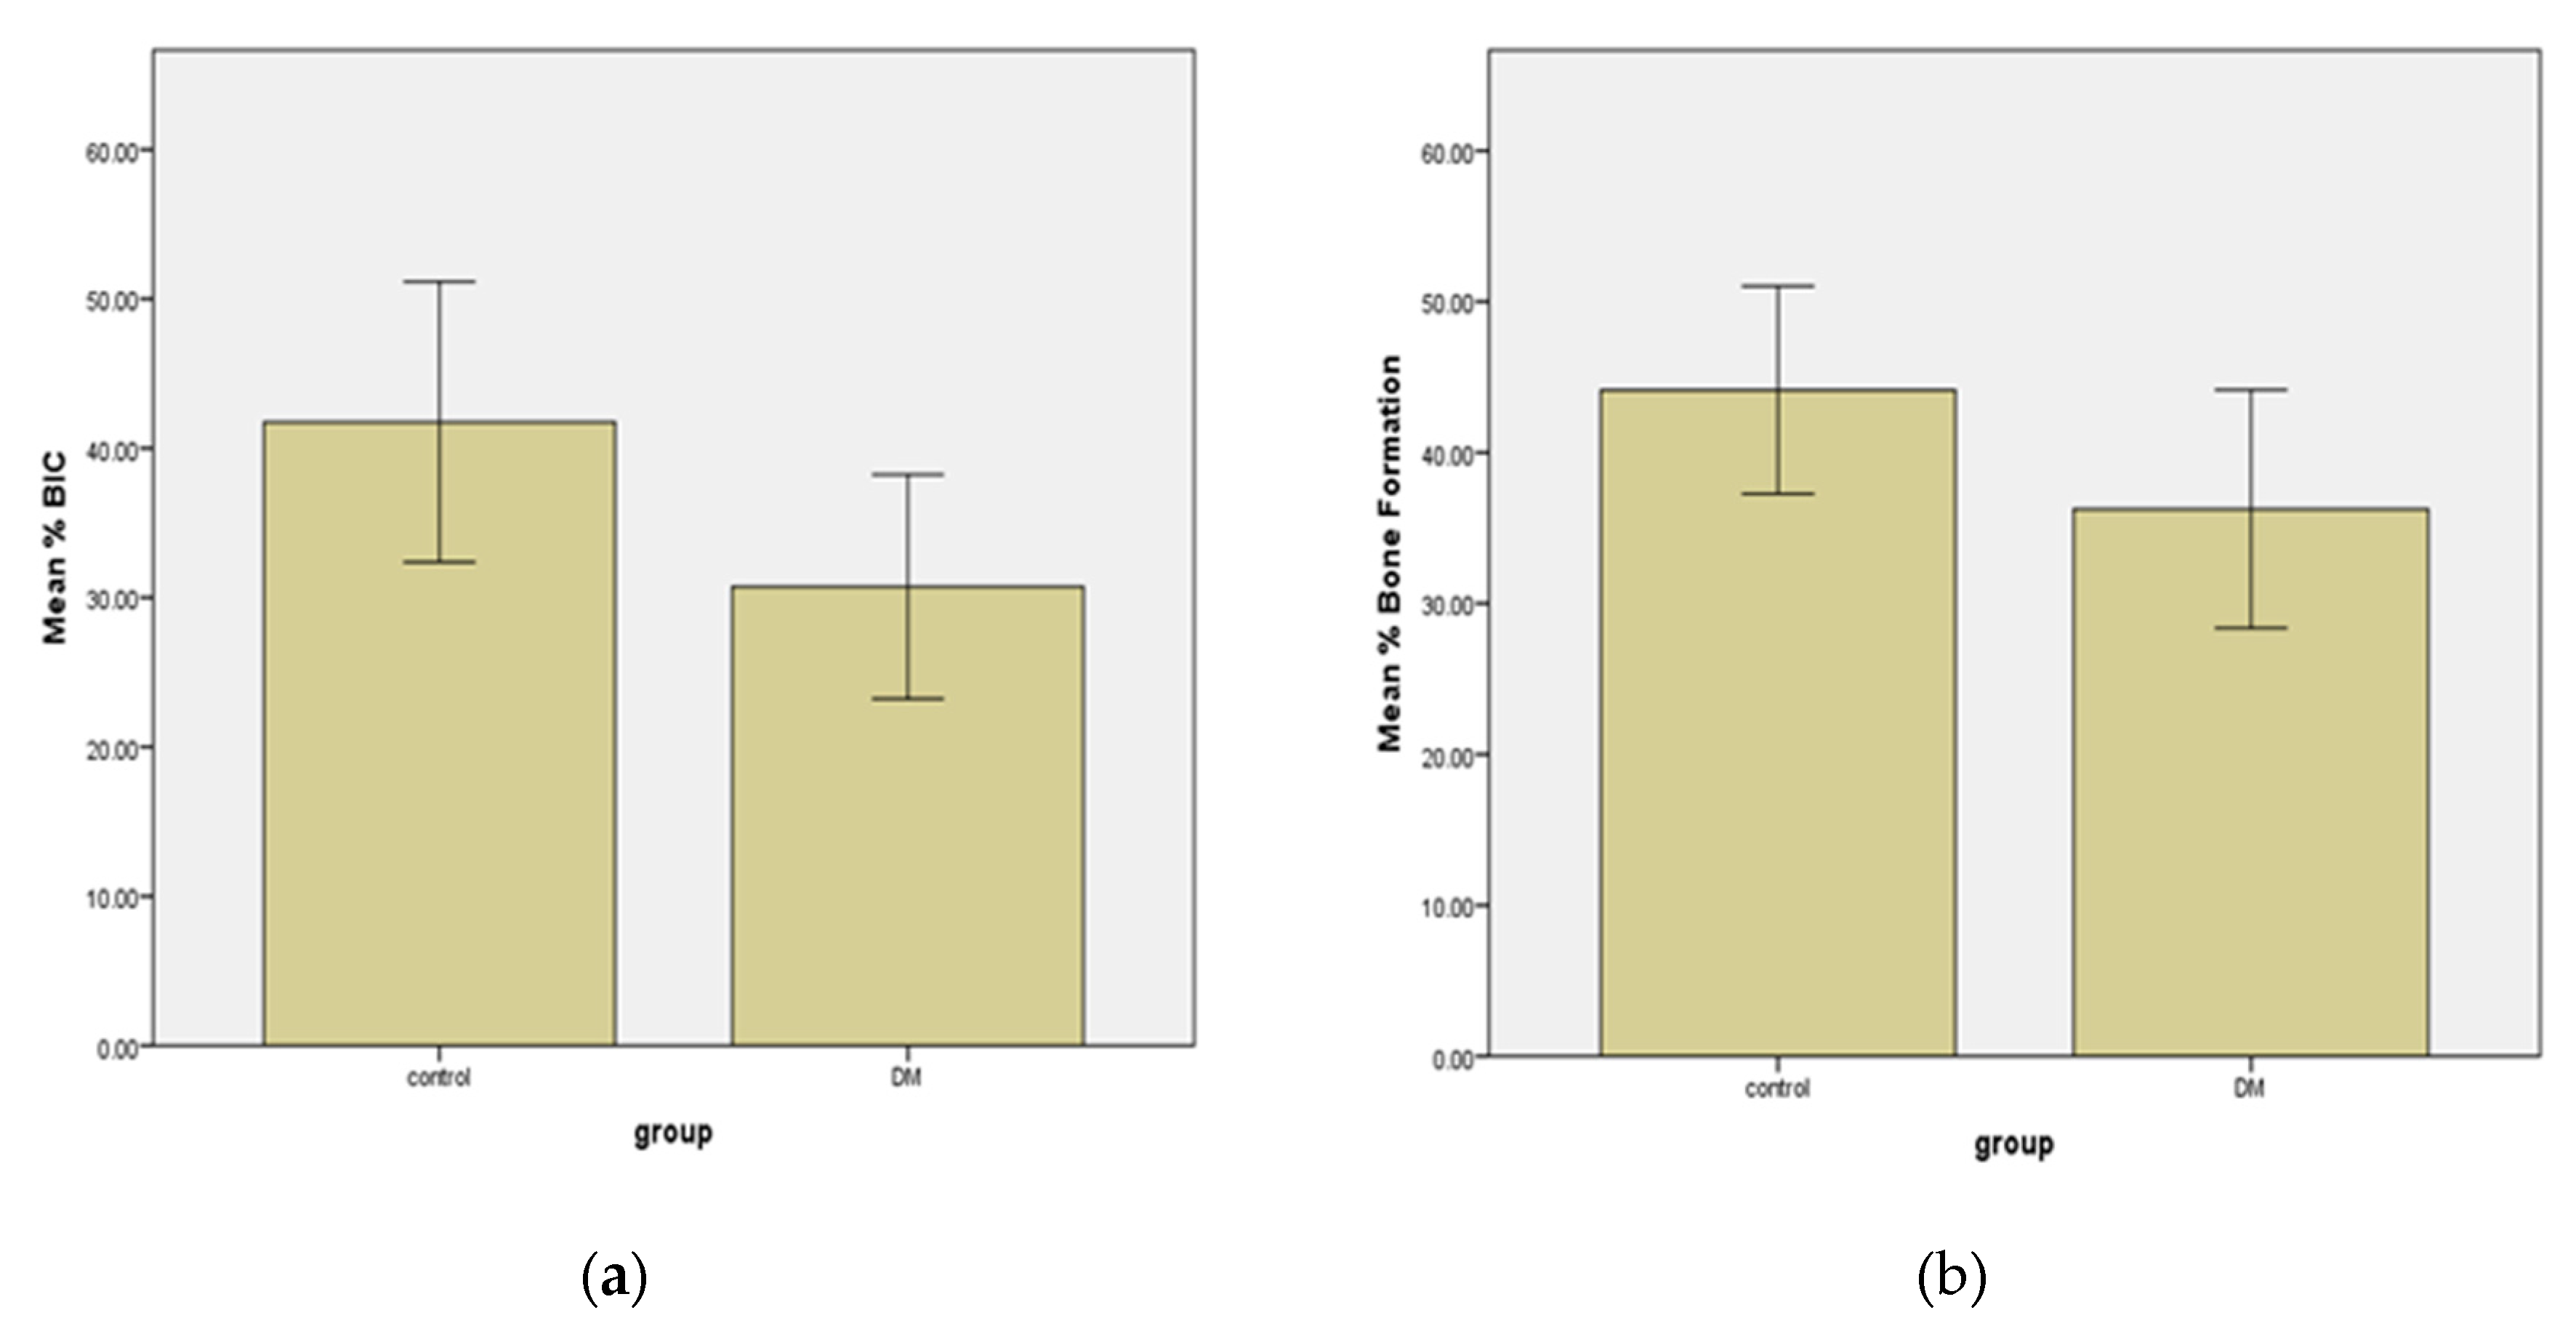
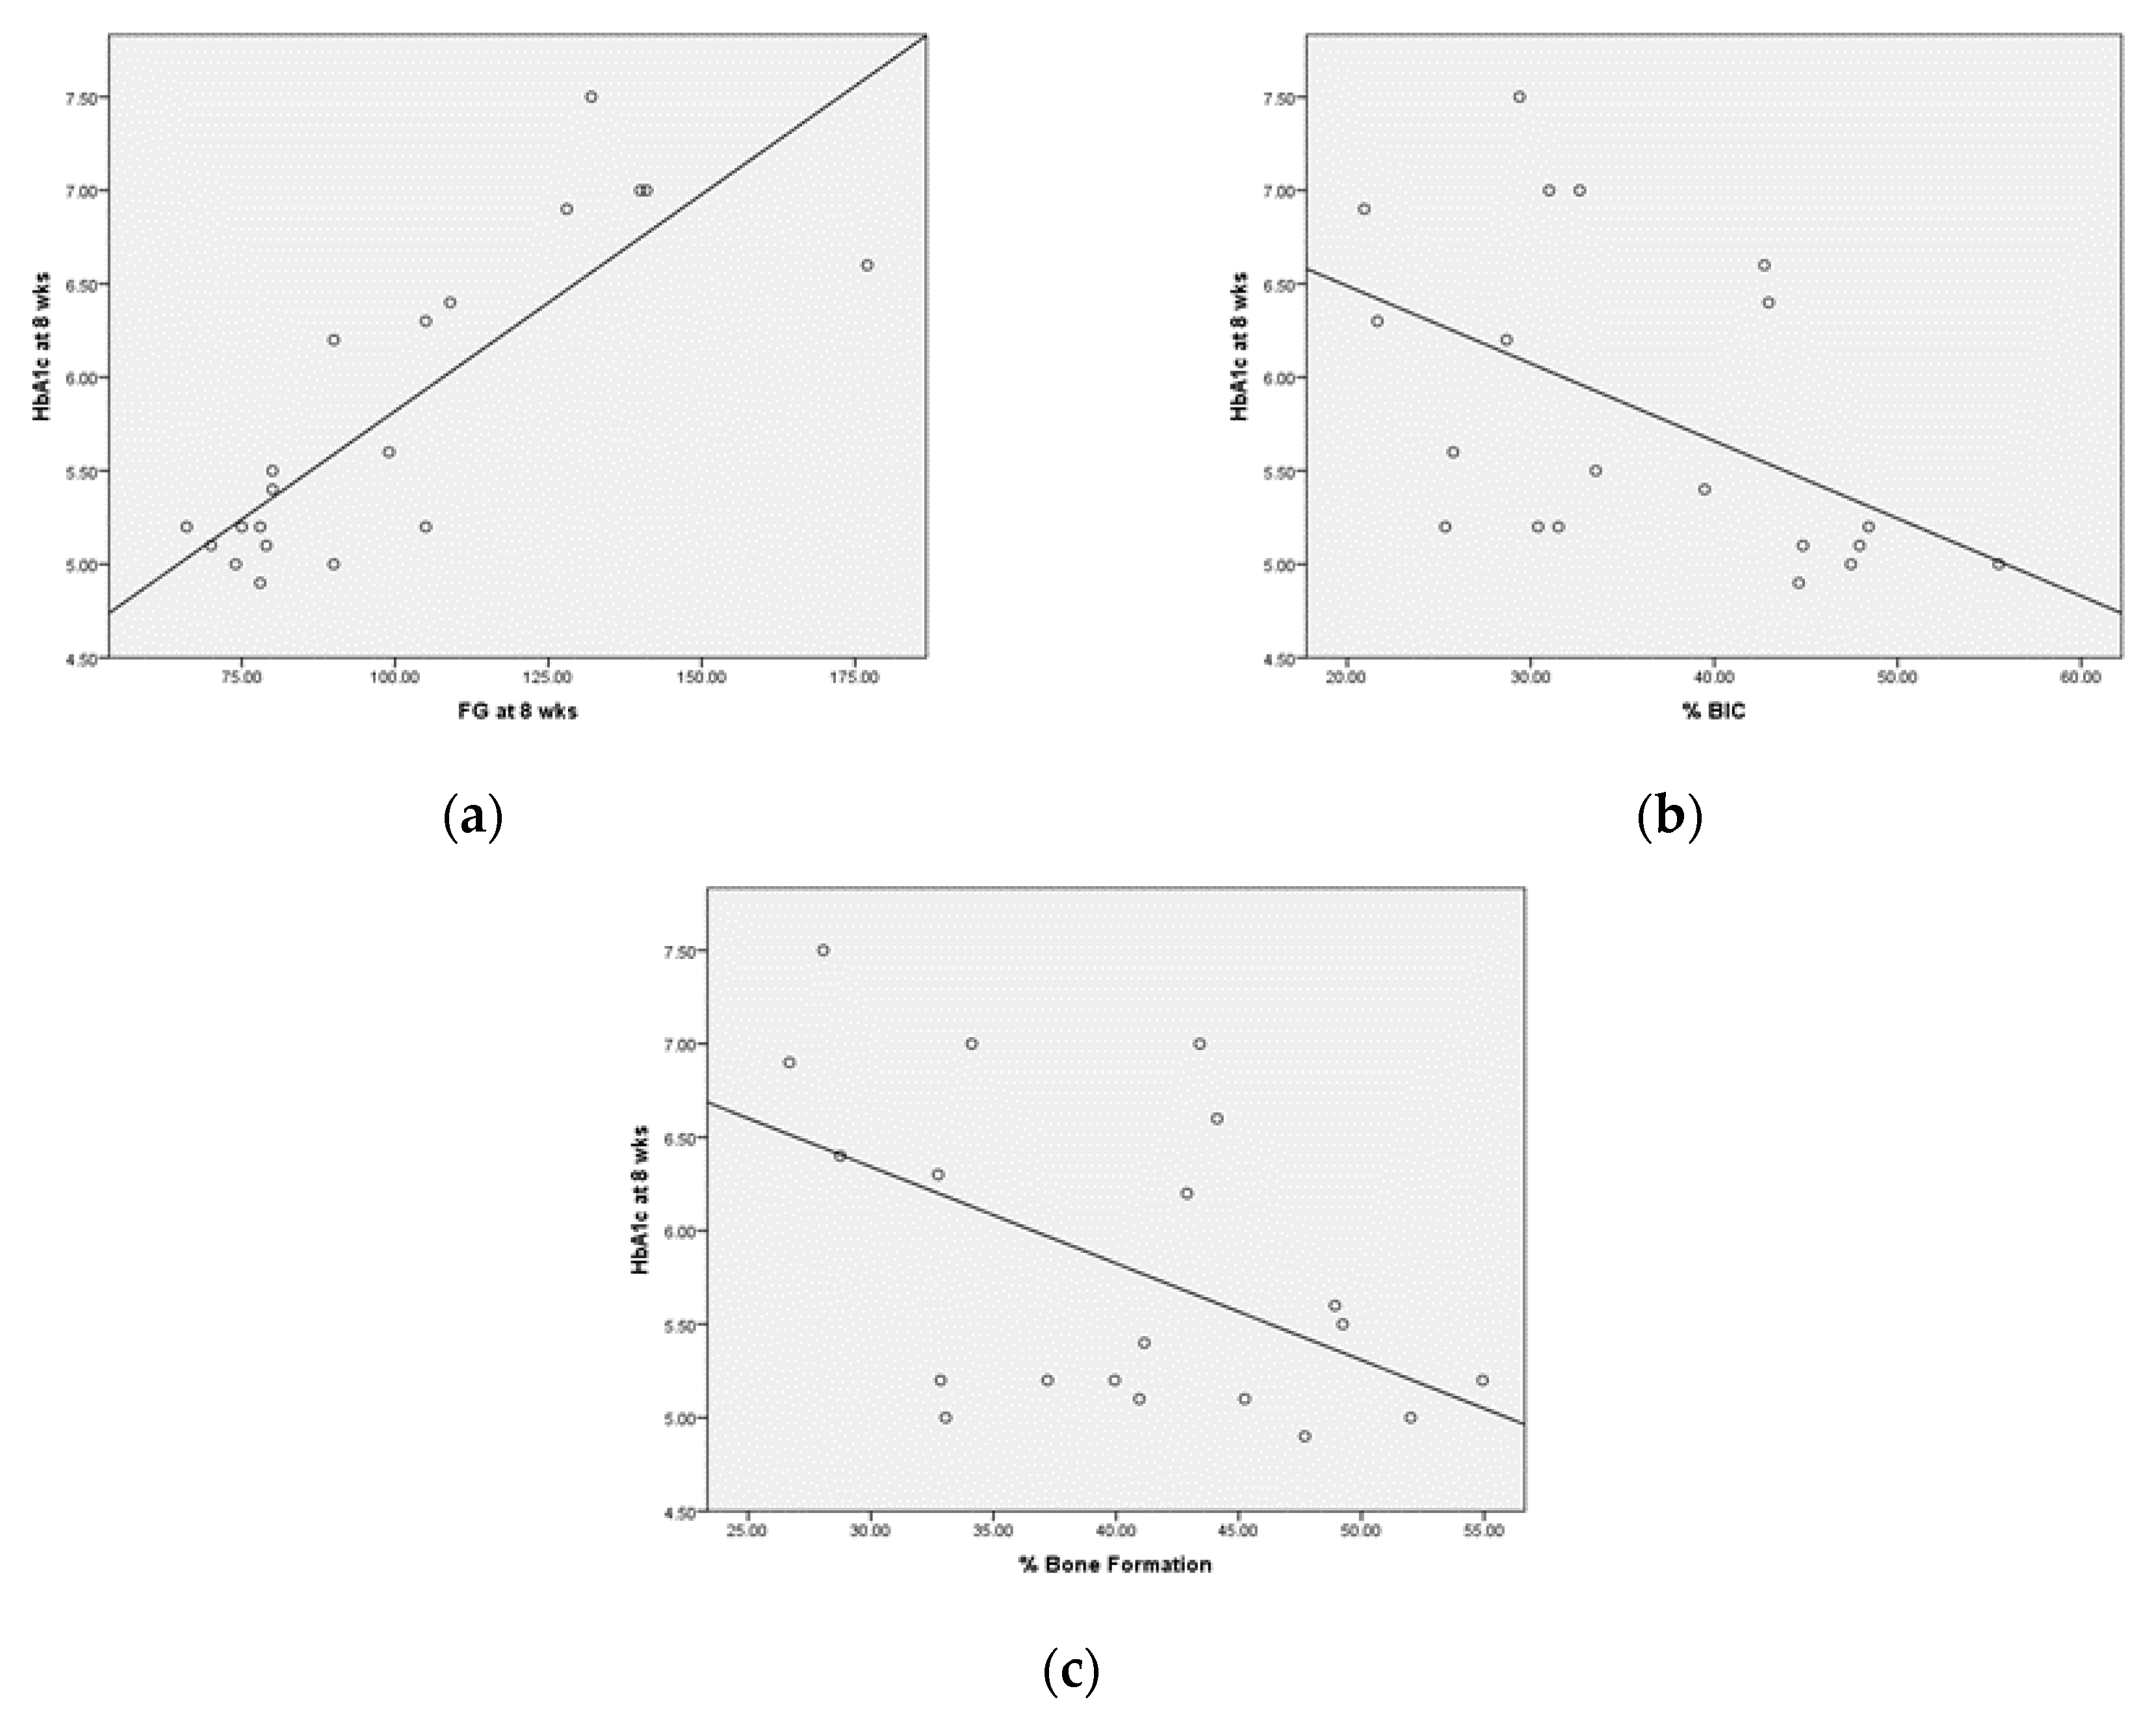
Sample size calculation was based on a previous study which could provide an α error of 5 and 90% power of test [33]. Shapiro-Wilk test was used to test the normality between test and control groups. All variances were compared using independent t-test. The Pearson correlation coefficient was performed to find any correlation between the parameters. p < 0.05 was considered significantly different.

3. Results

Ten T2DM (5 males and 5 females) and ten healthy (3 males and 7 females) participants were included in this study (No drop-outs of patients). T2DM patients were significantly older than the control group (50.3 years ± 3.1 years vs. 60.5 years ± 1.2 years, p = 0.01). Anthropometric measurement showed no significant difference of body mass index (BMI) (T2DM 24.1 ± 1.0; controls 24.6 ± 1.2) and waist circumference (T2DM 33.4 ± 1.3 inches; control 33.6 ± 1.2 inches) (p > 0.05) (Table 1).
Results from blood test of metabolic parameters and lipid profile at both baseline and at 8 weeks are shown in Table 2. FPG (122.6 mg/dL vs. 77 mg/dL, p < 0.05) and HbA1c in T2DM (6.47% vs. 5.16%, p < 0.05) at 8 weeks were significantly higher than in controls as expected although the other lipid profile parameters (cholesterol, HDL-C, LDL-C and triglycerides) were not significantly different (Table 2).
Data from bone histomorphometric analysis demonstrated that the collected data from both groups were normally distributed by using Kolmogorov-Smirnov and Shapiro-Wilk test. After 8 weeks of placement, all micro-implants placed in both groups showed no sign of failure from both clinical evaluation and periapical radiograph; therefore, osseointegration occurred (Figure 5).
The calculation of BIC from both groups showed that T2DM had significantly lower BIC (30.73%) than its control counterpart (41.75%) (p = 0.01). Similarly, new bone formation in the implant chamber was reduced in the tested group (36.25%) compared to the healthy group (44.14%) (p = 0.028). The Pearson correlation indicated that higher FPG was closely related to higher HbA1c. Moreover, higher HbAc1 was adversely related to lowered BIC and new bone formation on titanium implants surface indicating that the higher HbA1c, the lower bone formation around implants (Figure 6 and Figure 7). However, other parameters including cholesterol, HDL-C, LDL-C and triglycerides did not show any correlation with BIC and new bone formation.

4. Discussion

T2DM is the most common form of all DM and the number of affected patients were on the rise. T2DM was linked to being overweight and obese [6]. BMI and waist circumference are the most common measurements for obesity. In this study, both T2DM and healthy had normal range of BMI and WC demonstrating that none of the participants were obese.
There were studies about the success and survival of dental implants in T2DM patients in recent systematic reviews [29,42]. Good glycemic control seemed to be closely associated with the higher survival rate and fewer complications of dental implants in T2DM patients. FPG and HbA1c are the most commonly used parameters to determine glycemic status for T2DM; however, HbA1c is considered more reliable since it indicates the average glycemic status of T2DM patients in the last 3 months due to the life cycle of red blood cells [16]. Only T2DM patients with well-controlled glycemic status having HbA1c below 8% were included in this study. Clinically and histologically, all implants were successfully integrated to the alveolar bone.
Only patients with a missing tooth on the maxilla in the premolar and molar region were included in this study. Peri-implant bone healing in the posterior maxilla is more rapid than in other areas of the jaw bones. Posterior maxilla consists of almost all trabecular bone; therefor, bone regeneration and remodeling are far quicker than in cortical bone. In addition, osteoconduction and de-novo bone formation only occur in peri-implant healing in trabecular bone [43]. Therefore, premolar and molar of maxilla were chosen for this study.
Bone histomorphometry is crucial for understanding osseointegration of dental implant. Osseointegration has been defined as a direct and functional connection between bone and an artificial implant. Both macroscopic and microscopic characteristics of dental implants could influence the success of these procedures. There were animal studies regarding to bone healing around implants in diabetic models [30,31,32]. In hyperglycemia condition, it was found that early bone mineralization was interrupted [30], trabecular bone, signaling molecules of fibronectin and Integrin α5β1 were reduced [31], BIC and implant removal torque were lower comparing to controls [32]. However, there are a few downsides of using animals for experiments. In case of DM, the diabetic animals might not accurately represent the pathologic condition of the T2DM in human as animals were either drug-induced or genetically modified to create the diabetic condition. In addition, bone healing and turnover rates of these animals such as rats and rabbits are not comparable to human [33,34]. All of these might interfere with the interpretation of the data received. Interesting, our study showed similar result of negative effects of hyperglycemia or DM on BIC and new bone formation in the implant thread indicating that bone healing capacity of T2DM patients was significantly lower than in those healthy group. Moreover, In genetically modified and drug-induced diabetic rats, it was found that new trabecular bone around implant surfaces was reduced compared to those rats treated with insulin [31,32] and thus presented lower removal torque values [32]. Most of our T2DM patients were using anti-diabetic medications to control their blood glucose to a well-controlled state. However, that was not effective in increasing BIC and new bone formation around dental implants in our findings which is contradicted with what was found in the animal experiments.
Another significant finding was the strong correlation between HbA1c and BIC and new bone formation. The higher HbA1c, the lower bone formation around implants (Figure 7b,c) and this finding might explain the result from the studies regarding to the lower resonance frequency analysis (RFA) of dental implants in clinical situation [17,21]. Clinically, it is impractical to retrieve implant for histomorphometric analysis even though it is a more reliable method to observe the osseointegration phenomenon. Thus, a less invasive method to reflect the healing process of dental implant is to measure implant stability by RFA. Oates and colleges [17,21] found that the implant stability of T2DM with higher HbA1c was significantly lower than those with lower HbA1c and required longer time to return to baseline stability indicating that the healing capacity of hyperglycemic condition in T2DM was adversely affected. These findings supported the result of our study of the association between higher HbA1c and lower BIC and new bone formation which in turn demonstrated lower implant stability clinically.
Previous studies showed that success of dental implants in diabetic patient ranged from 92% [44] to 97.2% [23], which was comparable to their healthy counterparts. Long-term clinical comparison was reported in a prospective study up to 12 years which showed no significant difference between T2DM and controls for simple dental implants placement as well as more complicated cases such as sinus lift and bone augmentation [23]. However, other studies demonstrated the adverse effect of DM on dental implants in terms of success rate [25,26,27], osseointegration by resonance frequency test [17,21], and peri-implant tissue such as increased bleeding on probing (BOP) [19] and peri-implantitis [28]. For these inconsistent reports of the clinical outcome of DM on dental implants, a few factors should be considered. Firstly, the study of success of dental implant in diabetic patients were conducted in different manners such as retrospective, prospective and cross-sectional studies as shown in recent literature reviews; therefore, a meta-analysis was not possible [29,45]. Secondly, not all the studies stated the type of their diabetic patients whether they are type 1 or type 2. In addition, the status of their glycemic control was not clearly defined; for instance, most authors considered HbA1c below 8% well-controlled while some others accepted less than 8%, used other parameter such as fasting plasma glucose, or did not even report the glycemic status of the participants. To our best knowledge, this study is the first clinical study that compared histologically osseointegration between healthy and T2DM patients. From the results of our study, dental implants in T2DM patients had lower osseointegration although all implants show 100% success clinically within our study period; therefore, long-term follow-up is required.

5. Conclusions

Within the limitations of this study, it can be concluded that bone healing around dental implants of T2DM patients was significantly lower than healthy patients. Long term follow-up for the clinical results of dental implant treatment in patients with DM is required.

Author Contributions

L.S.: conception, design, data collection, data interpretation, manuscript. S.C.: conception, design, data interpretation, manuscript revision. P.K.: conception, design, data analysis and interpretation, critical revision of the manuscript, final approval of manuscript. All authors have read and agreed to the published version of the manuscript.

Funding

Chiang Mai University Funding number R 000023419.

Conflicts of Interest

The authors declare no conflict of interest.

References

  1. Alsaadi, G.; Quirynen, M.; Komarek, A.; van Steenberghe, D. Impact of local and systemic factors on the incidence of oral implant failures, up to abutment connection. J. Clin. Periodontol. 2007, 34, 610–617. [Google Scholar] [CrossRef]
  2. Mombelli, A.; Cionca, N. Systemic diseases affecting osseointegration therapy. Clin. Oral Implant. Res. 2006, 17, 97–103. [Google Scholar] [CrossRef] [PubMed]
  3. Diz, P.; Scully, C.; Sanz, M. Dental implants in the medically compromised patient. J. Dent. 2013, 41, 195–206. [Google Scholar] [CrossRef] [PubMed]
  4. Marx, R.E.; Garg, A.K. Bone structure, metabolism, and physiology: Its impact on dental implantology. Implant. Dent. 1998, 7, 267–276. [Google Scholar] [CrossRef]
  5. World Health Organization. Global Report on Diabetes 2016. Available online: http://www.who.int/diabetes/global-report/en/ (accessed on 15 April 2019).
  6. Mokdad, A.H.; Ford, E.S.; Bowman, B.A.; Dietz, W.H.; Vinicor, F.; Bales, V.S.; Marks, J.S. Prevalence of obesity, diabetes, and obesity-related health risk factors, 2001. JAMA 2003, 289, 76–79. [Google Scholar] [CrossRef] [PubMed]
  7. Zimmet, P.; Alberti, K.; Shaw, J. Global and societal implications of the diabetes epidemic. Nature 2001, 414, 782–787. [Google Scholar] [CrossRef]
  8. Hu, F.B.; Leitzmann, M.F.; Stampfer, M.J.; Colditz, G.A.; Willett, W.C.; Rimm, E.B. Physical activity and television watching in relation to risk for type 2 diabetes mellitus in men. Arch. Intern. Med. 2001, 161, 1542–1548. [Google Scholar] [CrossRef]
  9. Americal Diabetes Association. Diagnosis and classification of diabetes mellitus. Diabetes Care 2010, 33, 62–69. [Google Scholar] [CrossRef] [Green Version]
  10. DeFronzo, R.A. Pathogenesis of type 2 diabetes mellitus. Med. Clin. N. Am. 2004, 88, 787–835. [Google Scholar] [CrossRef]
  11. Després, J.P.; Lemieux, I. Abdominal obesity and metabolic syndrome. Nature 2006, 444, 881–887. [Google Scholar] [CrossRef]
  12. Cade, W.T. Diabetes-related microvascular and macrovascular diseases in the physical therapy setting. Phys. Ther. 2008, 88, 1322. [Google Scholar] [CrossRef] [PubMed] [Green Version]
  13. Khader, Y.S.; Dauod, A.S.; El-Qaderi, S.S.; Alkafajei, A.; Batayha, W.Q. Periodontal status of diabetics compared with nondiabetics: A meta-analysis. J. Diabetes Complicat. 2006, 20, 59–68. [Google Scholar] [CrossRef]
  14. Abiko, Y.; Selimovic, D. The mechanism of protracted wound healing on oral mucosa in diabetes. review. Bosn. J. Basic Med. Sci. 2010, 10, 186–191. [Google Scholar] [CrossRef] [PubMed]
  15. Ahmed, A.A. Glycemic Control in Diabetes. Oman Med. J. 2010, 25, 232–233. [Google Scholar] [CrossRef] [PubMed]
  16. Bonora, E.; Tuomilehto, J. The pros and cons of diagnosing diabetes with A1C. Diabetes Care 2011, 34, 184–190. [Google Scholar] [CrossRef] [PubMed] [Green Version]
  17. Oates, T.W.; Dowell, S.; Robinson, M.; McMahan, C.A. Glycemic control and implant stabilization in type 2 diabetes mellitus. J. Dent. Res. 2009, 88, 367–371. [Google Scholar] [CrossRef]
  18. Aguilar-Salvatierra, A.; Calvo-Guirado, J.L.; Gonzalez-Jaranay, M.; Moreu, G.; Delgado-Ruiz, R.A.; Gomez-Moreno, G. Peri-implant evaluation of immediately loaded implants placed in esthetic zone in patients with diabetes mellitus type 2: A two-year study. Clin. Oral Implant. Res. 2016, 27, 156–161. [Google Scholar] [CrossRef]
  19. Gomez-Moreno, G.; Aguilar-Salvatierra, A.; Roldan, J.R.; Guardia, J.; Gargallo, J.; Calvo-Guirado, J.L. Peri-implant evaluation in type 2 diabetes mellitus patients: A 3-year study. Clin. Oral Implant. Res. 2015, 26, 1031–1035. [Google Scholar] [CrossRef]
  20. Ghiraldini, B.; Conte, A.; Casarin, R.C.; Casati, M.Z.; Pimentel, S.P.; Cirano, F.R.; Ribeiro, F.V. Influence of Glycemic Control on Peri-Implant Bone Healing: 12-Month Outcomes of Local Release of Bone-Related Factors and Implant Stabilization in Type 2 Diabetics. Clin. Implant. Dent. Relat. Res. 2016, 18, 801–809. [Google Scholar] [CrossRef]
  21. Oates, T.W.; Galloway, P.; Alexander, P.; Green, A.V.; Huynh-Ba, G.; Feine, J.; McMahan, C.A. The effects of elevated hemoglobin A1c in patients with type 2 diabetes mellitus on dental implants. J. Am. Dent. Assoc. 2014, 145, 1218–1226. [Google Scholar] [CrossRef] [Green Version]
  22. Dowell, S.; Oates, T.W.; Robinson, M. Implant success in people with type 2 diabetes mellitus with varying glycemic control: A pilot study. J. Am. Dent. Assoc. 2007, 138, 355–361. [Google Scholar] [CrossRef] [PubMed] [Green Version]
  23. Tawil, G.; Younan, R.; Azar, P.; Sleilati, G. Conventional and advanced implant treatment in the type II diabetic patient: Surgical protocol and long-term clinical results. Int. J. Oral Maxillofac. Implant. 2008, 23, 744–752. [Google Scholar]
  24. Americal Diabetes Association. The absence of a glycemic threshold for the development of long-term complications: The perspective of the Diabetes Control and Complications Trial. Diabetes 1996, 45, 1289–1298. [Google Scholar] [CrossRef]
  25. Busenlechner, D.; Fürhauser, R.; Haas, R.; Watzek, G.; Mailath, G.; Pommer, B. Long-term implant success at the Academy for Oral Implantology: 8-year follow-up and risk factor analysis. J. Periodontal Implant. Sci. 2014, 44, 102–108. [Google Scholar] [CrossRef]
  26. Morris, H.F.; Ochi, S.; Winkler, S. Implant survival in patients with type 2 diabetes: Placement to 36 months. Ann. Periodontol. 2000, 5, 157–165. [Google Scholar] [CrossRef]
  27. Daubert, D.M.; Weinstein, B.F.; Bordin, S.; Leroux, B.G.; Flemmig, T.F. Prevalence and predictive factors for peri-implant disease and implant failure: A cross-sectional analysis. J. Periodontol. 2015, 86, 337–347. [Google Scholar] [CrossRef]
  28. Ferreira, S.; Silva, G.; Cortelli, J.; Costa, J.; Costa, F. Prevalence and risk variables for peri-implant disease in Brazilian subjects. J. Clin. Periodontol. 2006, 33, 929–935. [Google Scholar] [CrossRef]
  29. Naujokat, H.; Kunzendorf, B.; Wiltfang, J. Dental implants and diabetes mellitus—A systematic review. Int. J. Implant. Dent. 2016, 2, 5. [Google Scholar] [CrossRef] [Green Version]
  30. Ajami, E.; Bell, S.; Liddell, R.S.; Davies, J.E. Early bone anchorage to micro- and nano-topographically complex implant surfaces in hyperglycemia. Acta Biomater. 2016, 39, 169–179. [Google Scholar] [CrossRef]
  31. Liu, Z.; Zhou, W.; Tangl, S.; Liu, S.; Xu, X.; Rausch-Fan, X. Potential mechanism for osseointegration of dental implants in Zucker diabetic fatty rats. Br. J. Oral Maxillofac. Surg. 2015, 53, 748–753. [Google Scholar] [CrossRef]
  32. De Molon, R.S.; Morais-Camilo, J.A.; Verzola, M.H.; Faeda, R.S.; Pepato, M.T.; Marcantonio, E., Jr. Impact of diabetes mellitus and metabolic control on bone healing around osseointegrated implants: Removal torque and histomorphometric analysis in rats. Clin. Oral Implant. Res. 2013, 24, 831–837. [Google Scholar] [CrossRef] [PubMed]
  33. Von Wilmowsky, C.; Stockmann, P.; Harsch, I.; Amann, K.; Metzler, P.; Lutz, R.; Moest, T.; Neukam, F.W.; Schlegel, K.A. Diabetes mellitus negatively affects peri-implant bone formation in the diabetic domestic pig. J. Clin. Periodontol. 2011, 38, 771–779. [Google Scholar] [CrossRef] [PubMed]
  34. Pearce, A.; Richards, R.; Milz, S.; Schneider, E.; Pearce, S. Animal models for implant biomaterial research in bone: A review. Eur. Cell Mater. 2007, 13, 1–10. [Google Scholar] [CrossRef] [PubMed]
  35. Grassi, S.; Piattelli, A.; De Figueiredo, L.C.; Feres, M.; De Melo, L.; Iezzi, G.; Alba, R.C.; Shibli, J.A. Histologic evaluation of early human bone response to different implant surfaces. J. Periodontol. 2006, 77, 1736–1743. [Google Scholar] [CrossRef] [PubMed]
  36. Wei, N.; Bin, S.; Jing, Z.; Wei, S.; Yingqiong, Z. Influence of implant surface topography on bone-regenerative potential and mechanical retention in the human maxilla and mandible. Am. J. Dent. 2014, 27, 171–176. [Google Scholar] [PubMed]
  37. Shibli, J.A.; Mangano, C.; Mangano, F.; Rodrigues, J.A.; Cassoni, A.; Bechara, K.; Ferreia, J.D.B.; Dottore, A.M.; Iezzi, G.; Piattelli, A. Bone-to-Implant Contact Around Immediately Loaded Direct Laser Metal-Forming Transitional Implants in Human Posterior Maxilla. J. Periodontol. 2013, 84, 732–737. [Google Scholar] [CrossRef] [PubMed]
  38. Degidi, M.; Perrotti, V.; Piattelli, A.; Iezzi, G. Mineralized bone-implant contact and implant stability quotient in 16 human implants retrieved after early healing periods: A histologic and histomorphometric evaluation. Int. J. Oral Maxillofac. Implant. 2010, 25, 45–48. [Google Scholar]
  39. Mangano, C.; Shibli, J.A.; Pires, J.T.; Luongo, G.; Piattelli, A.; Iezzi, G. Early bone formation around immediately loaded transitional implants inserted in the human posterior maxilla: The effects of fixture design and surface. BioMed Res. Int. 2017, 2017, 4152506. [Google Scholar] [CrossRef]
  40. Buser, D.; Broggini, N.; Wieland, M.; Schenk, R.; Denzer, A.; Cochran, D.; Hoffmann, B.; Lussi, A.; Steinemann, S. Enhanced bone apposition to a chemically modified SLA titanium surface. J. Dent. Res. 2004, 83, 529–533. [Google Scholar] [CrossRef]
  41. Donath, K.; Breuner, G. A method for the study of undecalcified bones and teeth with attached soft tissues* The Säge-Schliff (sawing and grinding) Technique. J. Oral. Patho. Med. 1982, 11, 318–326. [Google Scholar] [CrossRef]
  42. Shi, Q.; Xu, J.; Huo, N.; Cai, C.; Liu, H. Does a higher glycemic level lead to a higher rate of dental implant failure?: A meta-analysis. JADA 2016, 147, 875–881. [Google Scholar] [PubMed]
  43. Davies, J.E. Understanding peri-implant endosseous healing. J. Dent. Educ. 2003, 67, 932–949. [Google Scholar] [PubMed]
  44. Anner, R.; Grossmann, Y.; Anner, Y.; Levin, L. Smoking, diabetes mellitus, periodontitis, and supportive periodontal treatment as factors associated with dental implant survival: A long-term retrospective evaluation of patients followed for up to 10 years. Implant. Dent. 2010, 19, 57–64. [Google Scholar] [PubMed] [Green Version]
  45. Oates, T.W.; Huynh-Ba, G.; Vargas, A.; Alexander, P.; Feine, J. A critical review of diabetes, glycemic control, and dental implant therapy. Clin. Oral Implant. Res. 2013, 24, 117–127. [Google Scholar]
Figure 1. Criteria for participating in this study.
Applsci 10 06762 g001
Figure 2. Summary of research protocol.
Applsci 10 06762 g002
Figure 3. Micro-implant design with outer diameters of 2.5 mm and length 5 mm. the implant is designed with 3 bone chambers and 4 outer rings.
Applsci 10 06762 g003
Figure 4. Surgical placement of micro-implant. (a). Initial situation with one missing tooth on maxillary second pre-molar area; (b). Full thickness flap raised and micro implant was inserted; (c). Periapical radiograph immediately after the surgery; (d). Trephine bur was used to retrieve the implant after 8 weeks of healing; (e). Conventional implant was placed immediately after removal of the micro-implant and healing abutment was used.
Applsci 10 06762 g004
Figure 5. Histomorphometric examination of micro-implant of control (a,b) and T2DM group (c,d). T2DM group showed less bone implant contact (BIC) and new bone formation inside the implant thread.
Applsci 10 06762 g005
Figure 6. Comparison of %BIC and % bone formation between T2DM and controls. %BIC and % bone formation in T2DM group were significantly lower than their counterpart. ((a) % BIC) ((b) % Bone formation).
Applsci 10 06762 g006
Figure 7. Correlation between fasting glucose (FG) and HbA1c (a), HbA1c and %BIC (b), HbA1c and % bone formation (c). There was a strong correlation between increased HbA1c and decreased BIC (p < 0.05) and decreased new bone formation (p < 0.05).
Applsci 10 06762 g007
Table 1. Comparison of anthropometry (BMI and waist circumference) between T2DM group and control group.
ParticipantGenderAgeBMIWaist Circumference (WC)
nMaleFemaleMean ± SEMean ± SEMean ± SE
GroupControl103750.3 ± 3.1 (years)24.6 ± 1.233.6 ± 1.2 (inches)
T2DM105560.5 ± 1.2 (years)24.1 ± 1.033.4 ± 1.3 (inches)
Total number20
Significance p = 0.01p = 0.844p = 0.796
Table 2. Comparison of lipid profile of control and T2DM groups. Only fasting plasma glucose (FPG) and HbA1c showed significant difference (p < 0.05).
Control (n = 10)T2DM (n = 10)
FPG at baseline80.4 ± 8.9 (mg/dL)117.1 ± 20.5 (mg/dL) *
FPG at 8 weeks77 ± 6.4 (mg/dL)122.6 ± 26.1 (mg/dL) *
HbA1c at baseline5.3 ± 0.2 (%)6.43 ± 0.6 (%)
HbA1c at 8 weeks5.1 ± 0.1 (%)6.47 ± 0.6 (%) *
Cholesterol at baseline222.1 ± 43.7 (mg/dL)164.3 ± 48.9 (mg/dL)
Cholesterol at 8 weeks213.1 ± 51.8 (mg/dL)164.9 ± 44.6 (mg/dL)
HDL-C at baseline61 ± 16.1 (mg/dL)53.7 ±17 (mg/dL)
HDL-C at 8 weeks60.7 ± 17.8 (mg/dL)55.2 ± 17.3 (mg/dL)
LDL-C at baseline136.3 ± 42 (mg/dL)90.5 ± 35.1 (mg/dL)
LDL-C at 8 weeks134.2 ± 46.8 (mg/dL)87.1 ± 37.3 (mg/dL)
Triglycerides at baseline124 ± 96.6 (mg/dL)101 ± 49.9 (mg/dL)
Triglycerides at 8 weeks91.4 ± 40.5 (mg/dL)112.8 ± 80.7 (mg/dL)
* significant difference between the groups (p < 0.05).

