Advances on Water Quality Detection by UV-Vis Spectroscopy


1
College of Information and Electrical Engineering, China Agricultural University, Beijing 100083, China
2
Key Laboratory of Agricultural Information Acquisition Technology, College of Information and Electrical Engineering, China Agricultural University, Beijing 100083, China
*
Author to whom correspondence should be addressed.
Appl. Sci. 2020, 10(19), 6874; https://0-doi-org.brum.beds.ac.uk/10.3390/app10196874
Submission received: 3 September 2020
/
Revised: 25 September 2020
/
Accepted: 27 September 2020
/
Published: 30 September 2020
(This article belongs to the Special Issue Applications and Advancements of Spectroscopy)
Abstract
:Water resources are closely linked to human productivity and life. Owing to the deteriorating water resources environment, accurate and rapid determination of the main water quality parameters has become a current research hotspot. Ultraviolet-visible (UV-Vis) spectroscopy offers an effective tool for qualitative analysis and quantitative detection of contaminants in a water environment. In this review, the principle and application of UV-Vis technology in water quality detection were studied. The principle of UV-Vis spectroscopy for detecting water quality parameters and the method of modeling and analysis of spectral data were presented. Various UV-Vis technologies for water quality detection were reviewed according to the types of pollutants, such as chemical oxygen demand, heavy metal ions, nitrate nitrogen, and dissolved organic carbon. Finally, the future development of UV-Vis spectroscopy for the determination of water quality was discussed.
1. Introduction
Since the 21st century, with the continuous improvement in human living standards, the problems of global climate change, rapid population growth, and environmental pollution have become increasingly serious. Human activities have exerted great pressure on the environment. Among the many environmental problems, addressing water pollution is an urgent need [1].
Water is an indispensable element of human production and life, and is also related to food security, environmental protection, and human health, among other aspects. With rapid social development and the increasing use of agricultural fertilizers, an increasing number of industrial pollutants are discharged into rivers and oceans, causing eutrophication. When the original ecosystem is destroyed, the oxygen content of water is reduced, and many fish and other species are killed, leading to challenges in terms of water resource conservation [2]. As the living standards of consumers have standardized upward, demand for higher a quality and quantity of water has emerged relative to the past [3].
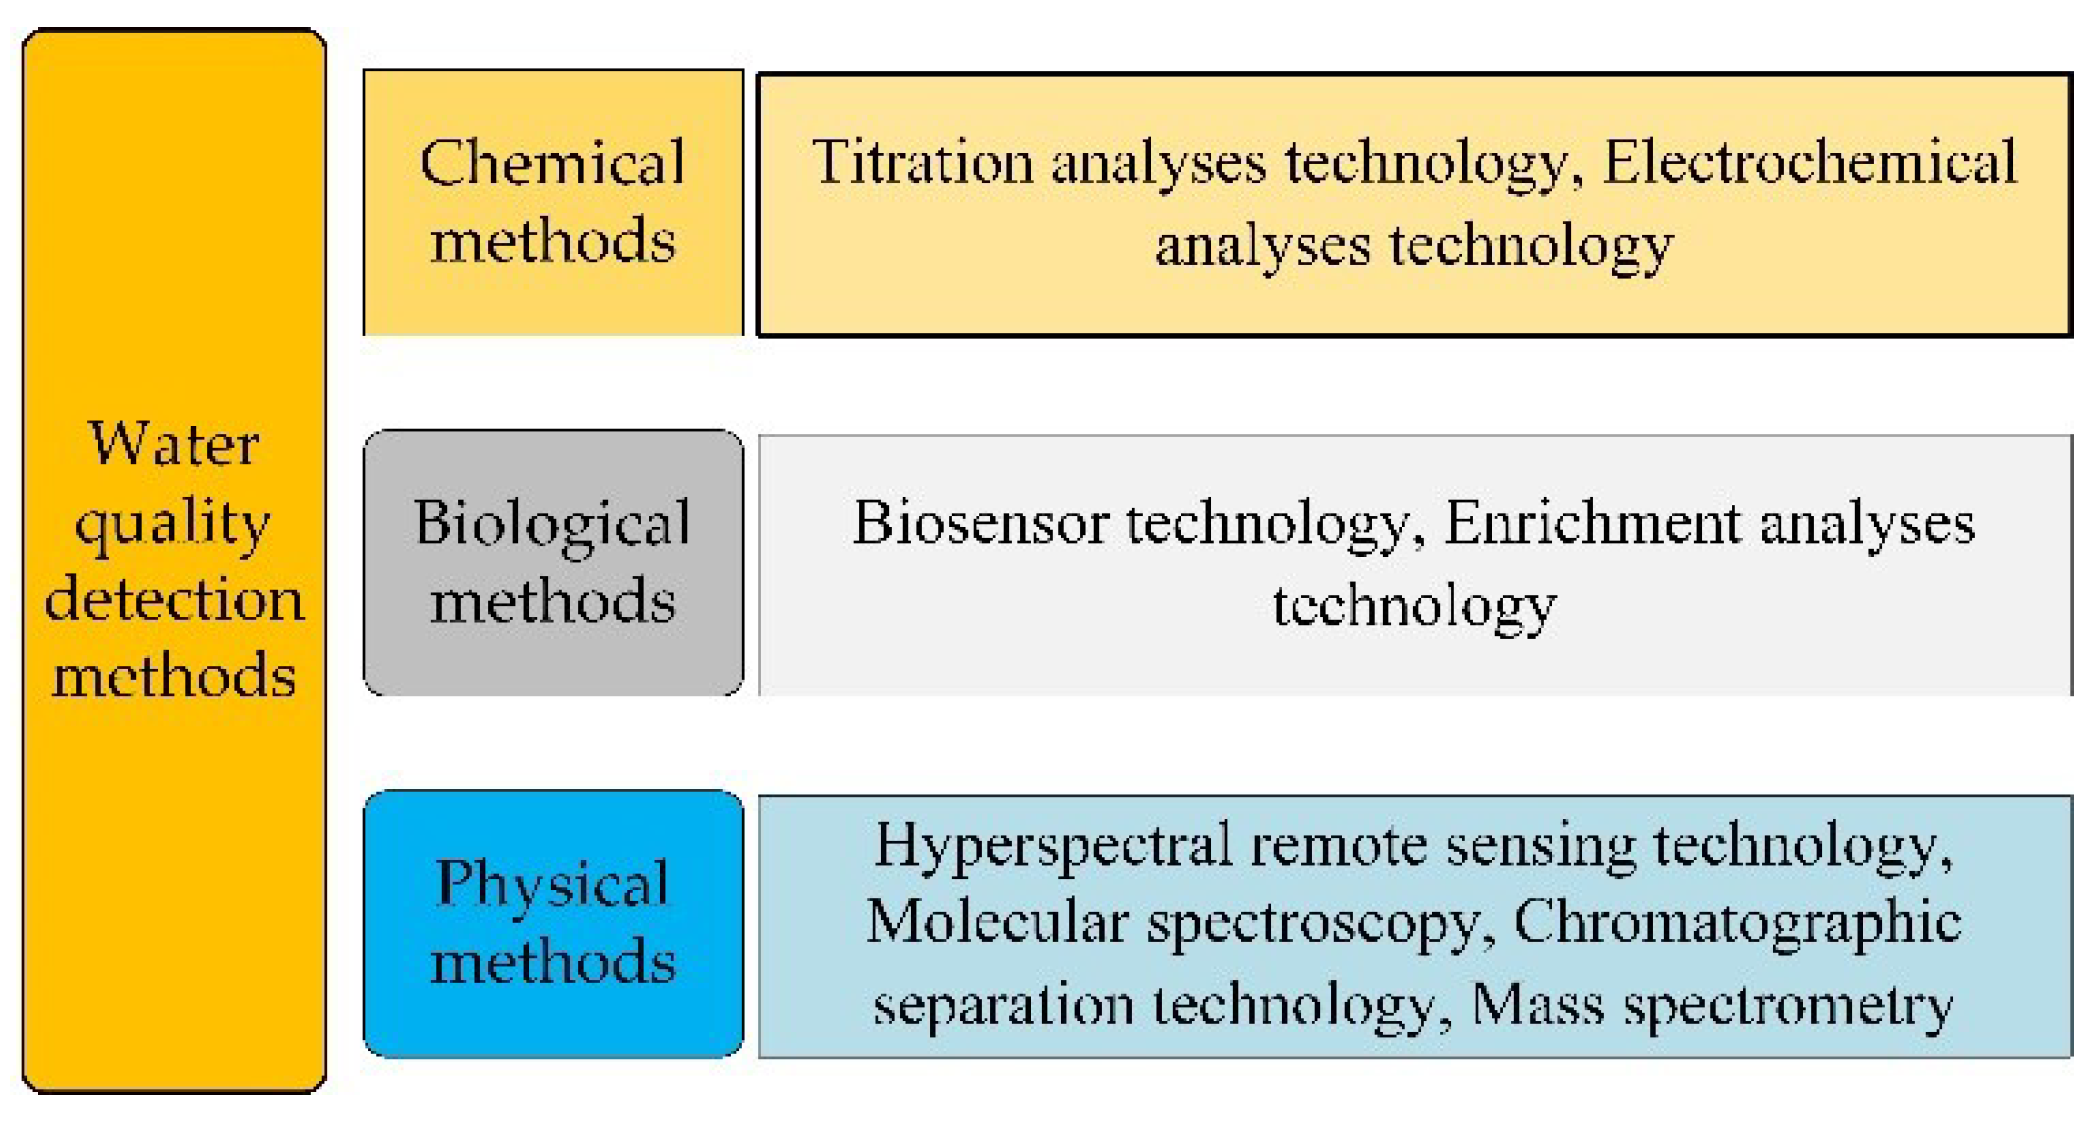
Scientifically based water quality index (WQI) models then become important to measure the degree of contamination and advise whether specific water resources require restoration and to what extent [4]. The main water quality parameters include chemical oxygen demand (COD), heavy metal content, nitrate nitrogen (NO3-N), dissolved organic carbon (DOC), and turbidity. At present, the methods for determining water quality parameters mainly include chemical, biological, and physical methods [5]. As shown in Figure 1, the main chemical methods are titration analysis and electrochemical analysis, both of which determine the pollutant content in the laboratory. The instrument used is bulky and expensive, and a large number of reagents are required, leading to secondary pollution; further, the results are not real-time results. Biological methods mainly include enrichment analysis and biosensor technology; however, the detection accuracy and sensitivity are far lower than in other methods. Physical methods mainly include hyper spectral remote sensing technology and molecular spectroscopy technology. Spectroscopy is a method to identify substances and conduct quantitative determination through the emission or absorption spectra of substances, which have been frequently used in the field of rapid water quality determination in recent years [6].
In recent years, due to the advantages of high precision, high detection efficiency, nondestructive sampling, environmental protection, low cost, and portability, ultraviolet-visible (UV-Vis) technology combined with a variety of advanced technologies has developed into an excellent and effective tool for detecting pollutants in aqueous environments [7]. UV-Vis spectrum analysis is an important development direction for water quality monitoring, which evaluates the degree of water pollution by establishing a correlation model of absorbance, organic matter, and inorganic matter concentration (Section 3.3) [8].
Although some researchers have tried to summarize the field before [9], with the deepening of UV-Vis spectroscopy in this field of water quality detection, its research objects and research methods have also undergone tremendous changes. Many researchers have proposed many novel research methods for different water quality parameters. For example, Giudicianni et al. [10] used principal component analysis (PCA) and wavelet transform to calculate water quality index. Its applicability was discussed. Ma et al. [11] used the modified water quality index (WQI) to evaluate the water quality of the aquaculture area. The main factors affecting water quality were determined by using PCA. Therefore, a review is very necessary to sort out the research process and methods in this field, especially in the latest application progress of ultraviolet spectroscopy technology.
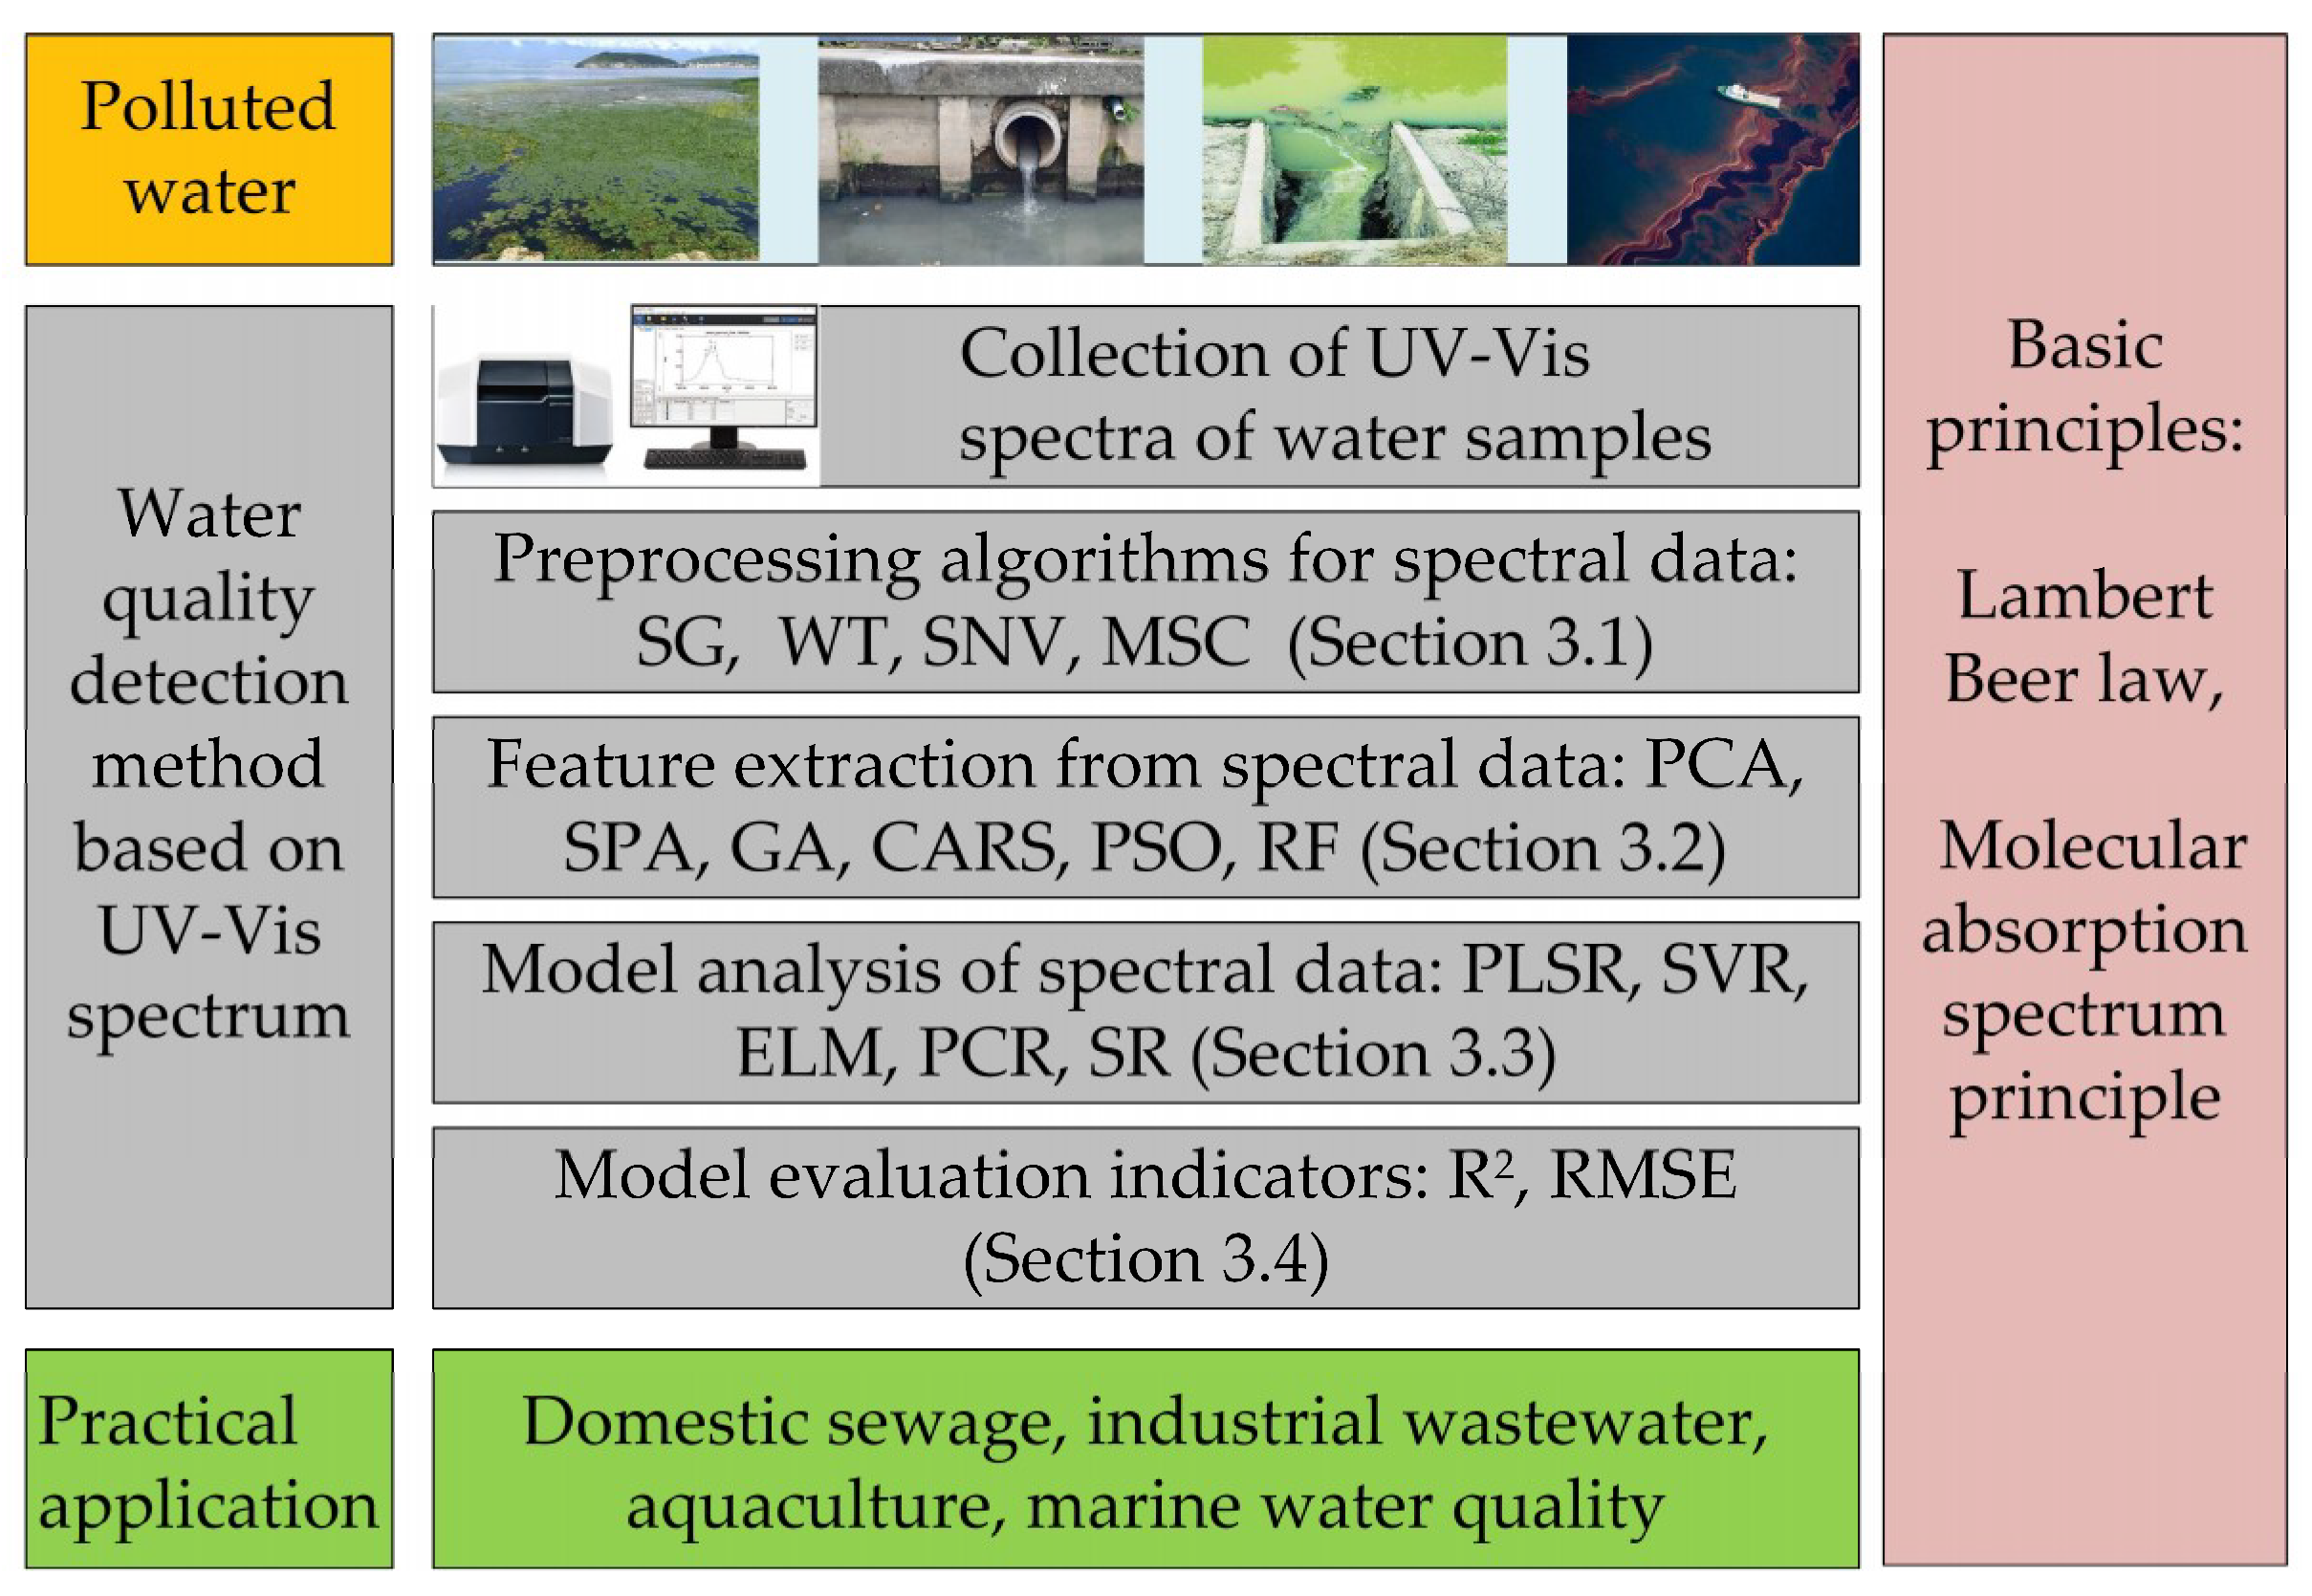
This paper introduced the theoretical basis of determining various water quality parameters by UV-Vis spectroscopy and expounds the complete spectral data analysis process, including data preprocessing (Section 3.1), extraction of the characteristic wavelength (Section 3.2), establishment of absorbance and relevant water quality parameter model (Section 3.3), as shown in Figure 2. In addition, the research progress on the determination of COD, heavy metal ions, nitrate nitrogen, and DOC by UV-Vis spectroscopy was described in detail.
2. Basic Principles
2.1. Lambert–Beer Law
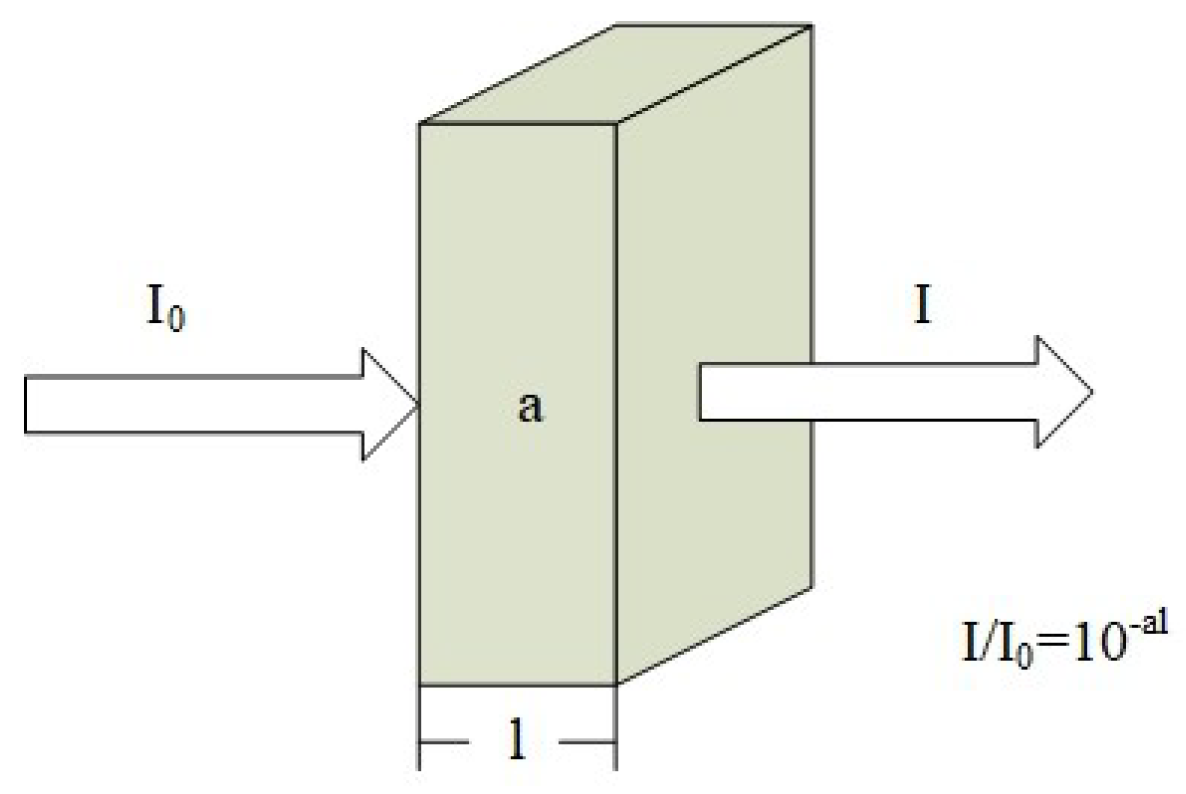
The Lambert-Beer law is the basis of quantitative analysis of water quality parameters using UV-Vis spectroscopy. The measurement principle of the Lambert-Beer law relies on a beam of monochromatic parallel light that irradiates the surface of the tested medium [12]. After passing through the medium with a certain thickness, the medium absorbs part of the light energy, weakening the intensity of the transmitted light passing through the medium. The absorbance of the absorption medium is directly proportional to its thickness (Figure 3, Equation (1)).
Mathematical expression of the Lambert Beer law is as follows:
A = log(1/T) = Kal.
In Equation (1): A is the absorbance; T is the transmittance that the ratio of the intensity of the outgoing light (I) to the intensity of the incident light (I0); K is the molar absorption coefficient related to the nature of the absorbing substance and the wavelength λ of the incident light; a is the concentration of the absorbing substance in mol/L; and l is the thickness of the absorbing layer in cm.
2.2. Basic Principle of UV-Vis Spectrometry
UV-Vis spectroscopy is based on the fact that pollutant molecules in the water can absorb UV-Vis light of a specific wavelength. Light of specific wavelength is absorbed by electron movement from the ground state to an excited state, which reduces the amount of transmitted light. According to the Lambert–Beer law, the absorption spectrum and the concentration of the substance have a strong correlation, which is the principle of UV-Vis spectroscopy being used to detect water pollutants [13].
Pollutants differ by absorption characteristics and yielded spectral curves but most of them absorb light in the UV-Vis region. Therefore, by using the Lambert–Beer law as the theoretical basis, we can effectively detect the concentration of pollutants in water. Various parameters commonly used for water quality detection, such as the spectral absorption range of NO3-N and NO2-N, are 200–250 nm. Organic matter and turbidity are effectively absorbed within the range of 380–750 nm (Table 1).
3. Theoretical Basis of UV-Vis Spectrum Data Processing
The accuracy of the UV-Vis method used to detect water quality parameters is highly dependent on the established mathematical model. Therefore, the selection of an appropriate mathematical model to improve the prediction accuracy has become the focus of water quality parameter study in UV-Vis detection. The UV spectrum data processing is divided into four steps: spectrum data preprocessing (Section 3.1), characteristic wavelength extraction (Section 3.2), water quality parameter model establishment (Section 3.3), and model performance evaluation (Section 3.4). In recent years, researchers have improved and innovated based on various algorithms in the field of UV-Vis spectrum detection of water quality parameters and established a high-precision prediction model between water quality spectrum data and water quality parameters. These studies have significantly contributed to rapid, accurate detection of water quality parameters [14].
3.1. Data Preprocessing
During data acquisition, due to high-frequency noise, personnel operation, external environment, and other factors of the instrument and equipment, some undesirable factors are often involved in the establishment of the model, which affect its prediction accuracy. This interference information cannot completely depend on the equipment modification and can be eliminated. Therefore, before the qualitative and quantitative analysis of spectral data, effective preprocessing should be completed. The prediction accuracy of the model can be improved by selecting the appropriate preprocessing method.
Since Savitzky and Golay published their research results in 1967, the Savitzky-Golay (SG) smoothing filter has gradually become a broadly used method to improve the signal-to-noise ratio of most signals [15]. Therefore, the SG smoothing filter plays an important role as a data preprocessing method for the UV-Vis spectrum. If the window size changes, the smoothing effect will be different. The larger the window is, the smoother the spectral curve becomes. However, with the increase in the window size, the spectral data also loses some information. Quan et al. [16] proposed a time-domain method to analyze the estimation performance of SG filters, which included estimation performance of SG smoothing filters and SG differentiation filters.
In recent years, with continuous algorithm innovation, wavelet analysis has been gradually adopted by many researchers to effectively suppress spectral data noise. The wavelet algorithm can effectively solve the problem that spectral data are often disturbed by high-frequency noise. Wavelet analysis has more advantages in processing non-stationary process signals and broadband noise signals [17,18]. Through the use of wavelet transform and other noise reduction algorithms to process UV-Vis spectrum data followed by complete wavelength modeling, the researchers found that the wavelet transform can not only remove noise from the spectrum data but also improve the modeling effect. Other common algorithms for reducing the noise impact of spectral data include standard normal variate (SNV), first-order differential, second-order differential, and multiple scattering correction (MSC) (Table 2).
In addition to the above-mentioned common algorithms for noise reduction of spectral data, some researchers have explored some relatively novel noise reduction methods and made significant contributions in processing UV-Vis spectral data. Wu et al. [19] conducted made a continuous sampling of a water sample spectrum with equal intervals and stretched the spectrum data into a two-dimensional matrix composed of a spectrum axis and time axis. After two-dimensional wavelet transforms, a window pane with variable width was set to slide horizontally in the coefficient matrix, using the wavelet coefficient in the windowpane to calculate the dynamic denoising threshold, and building the denoising threshold vector along with the windowpane slide to perform the spectrum denoising. Zhao et al. [20] applied the compressed sensing de-noising algorithm based on wavelet transform to the on-line water quality detection system of ultraviolet visible spectrometry. The core idea of compressed sensing theory is to acquire a non-adaptive linear projection of the signal, and then reconstruct the original signal from the measured value through an optimization algorithm. This method can effectively de-noise as the absorption characteristics of the original spectral signal of the water samples are retained. Moreover, the de-noising effect is superior to that of the wavelet threshold denoising algorithm.
3.2. Characteristic Wavelength Extraction of Spectral Data
In water quality detection, there are serious non-linear overlaps in water quality spectral data. The high-dimensional data contain many redundant, hidden important relationships. Modeling directly using the original spectrum increases the model complexity and calculation time, which is not conducive to the application and promotion of the model. Because the whole spectrum data may contain irrelevant information that participates in the model building, the prediction accuracy of the model cannot be improved by using the above-preprocessing methods. Through data dimensionality reduction, the dimension and complexity can be reduced while enhancing the extraction of useful information [21].
Principal component analysis (PCA) is a method of characteristic wavelength extraction based on linear algebra [22]. PCA transforms multiple variables into a few uncorrelated comprehensive variables to reflect the whole dataset comprehensively and uses a few variables to represent all variables to explain the problems to be studied. PCA can simplify complex data structure and obtain potential characteristic variables. During processing of UV-Vis spectral water quality parameter data, researchers often use it to reduce the dimensions, reduce model complexity, and extract useful information from the spectral data. Hou et al. [23] used PCA to capture the characteristics of the main pollutant varieties from the spectral matrix and reduce its dimensions, and then constructed a new statistical variable. The local outlying degree was evaluated according to the chi-square distribution in the main molecular space. Tang et al. [24] compared the modeling results after a PCA dimensionality reduction with those obtained without a PCA dimensionality reduction, and found that the model prediction effect of the input sample after a PCA dimensionality reduction was better.
The successive projections algorithm (SPA) is a forward variable selection algorithm that minimizes the collinearity of vector space. Its advantage lies in the extraction of several characteristic wavelengths in the whole band, which can eliminate redundant information in the original spectral matrix and can be used to screen spectral characteristic wavelengths. In recent years, when using UV-Vis spectroscopy to detect some parameters in water, researchers selected SPA to extract the characteristic wavelength of spectral data. Li et al. [25] used SPA to start with an initial feature, then selected a new feature in each iteration, and ended with a specified number of N features. Finally, the characteristic wavelength of spectral data was extracted, and the collinearity of spectral data was solved. Zhang et al. [26] used the SPA algorithm and other algorithms to extract characteristic wavelengths from spectral data, which eliminated redundant and collinear information in the original spectral data, and improved the operation speed and robustness of the model. On the basis of analyzing the correlation matrix of spectral data, Tang et al. [27] proposed a correlation-based SPA (CB-SPA) which can select the variables subset with more valuable variables and less multicollinearity.
For data dimensionality reduction, many researchers have performed a variety of research on feature wavelength extraction, among which the methods found to have better modeling effects after dimensionality reduction are the genetic algorithm (GA), competitive adaptive reweighted sampling (CARS), particle swarm optimization (PSO), and random frog (RF) algorithm (Table 3).
3.3. Method of Establishing Data Model
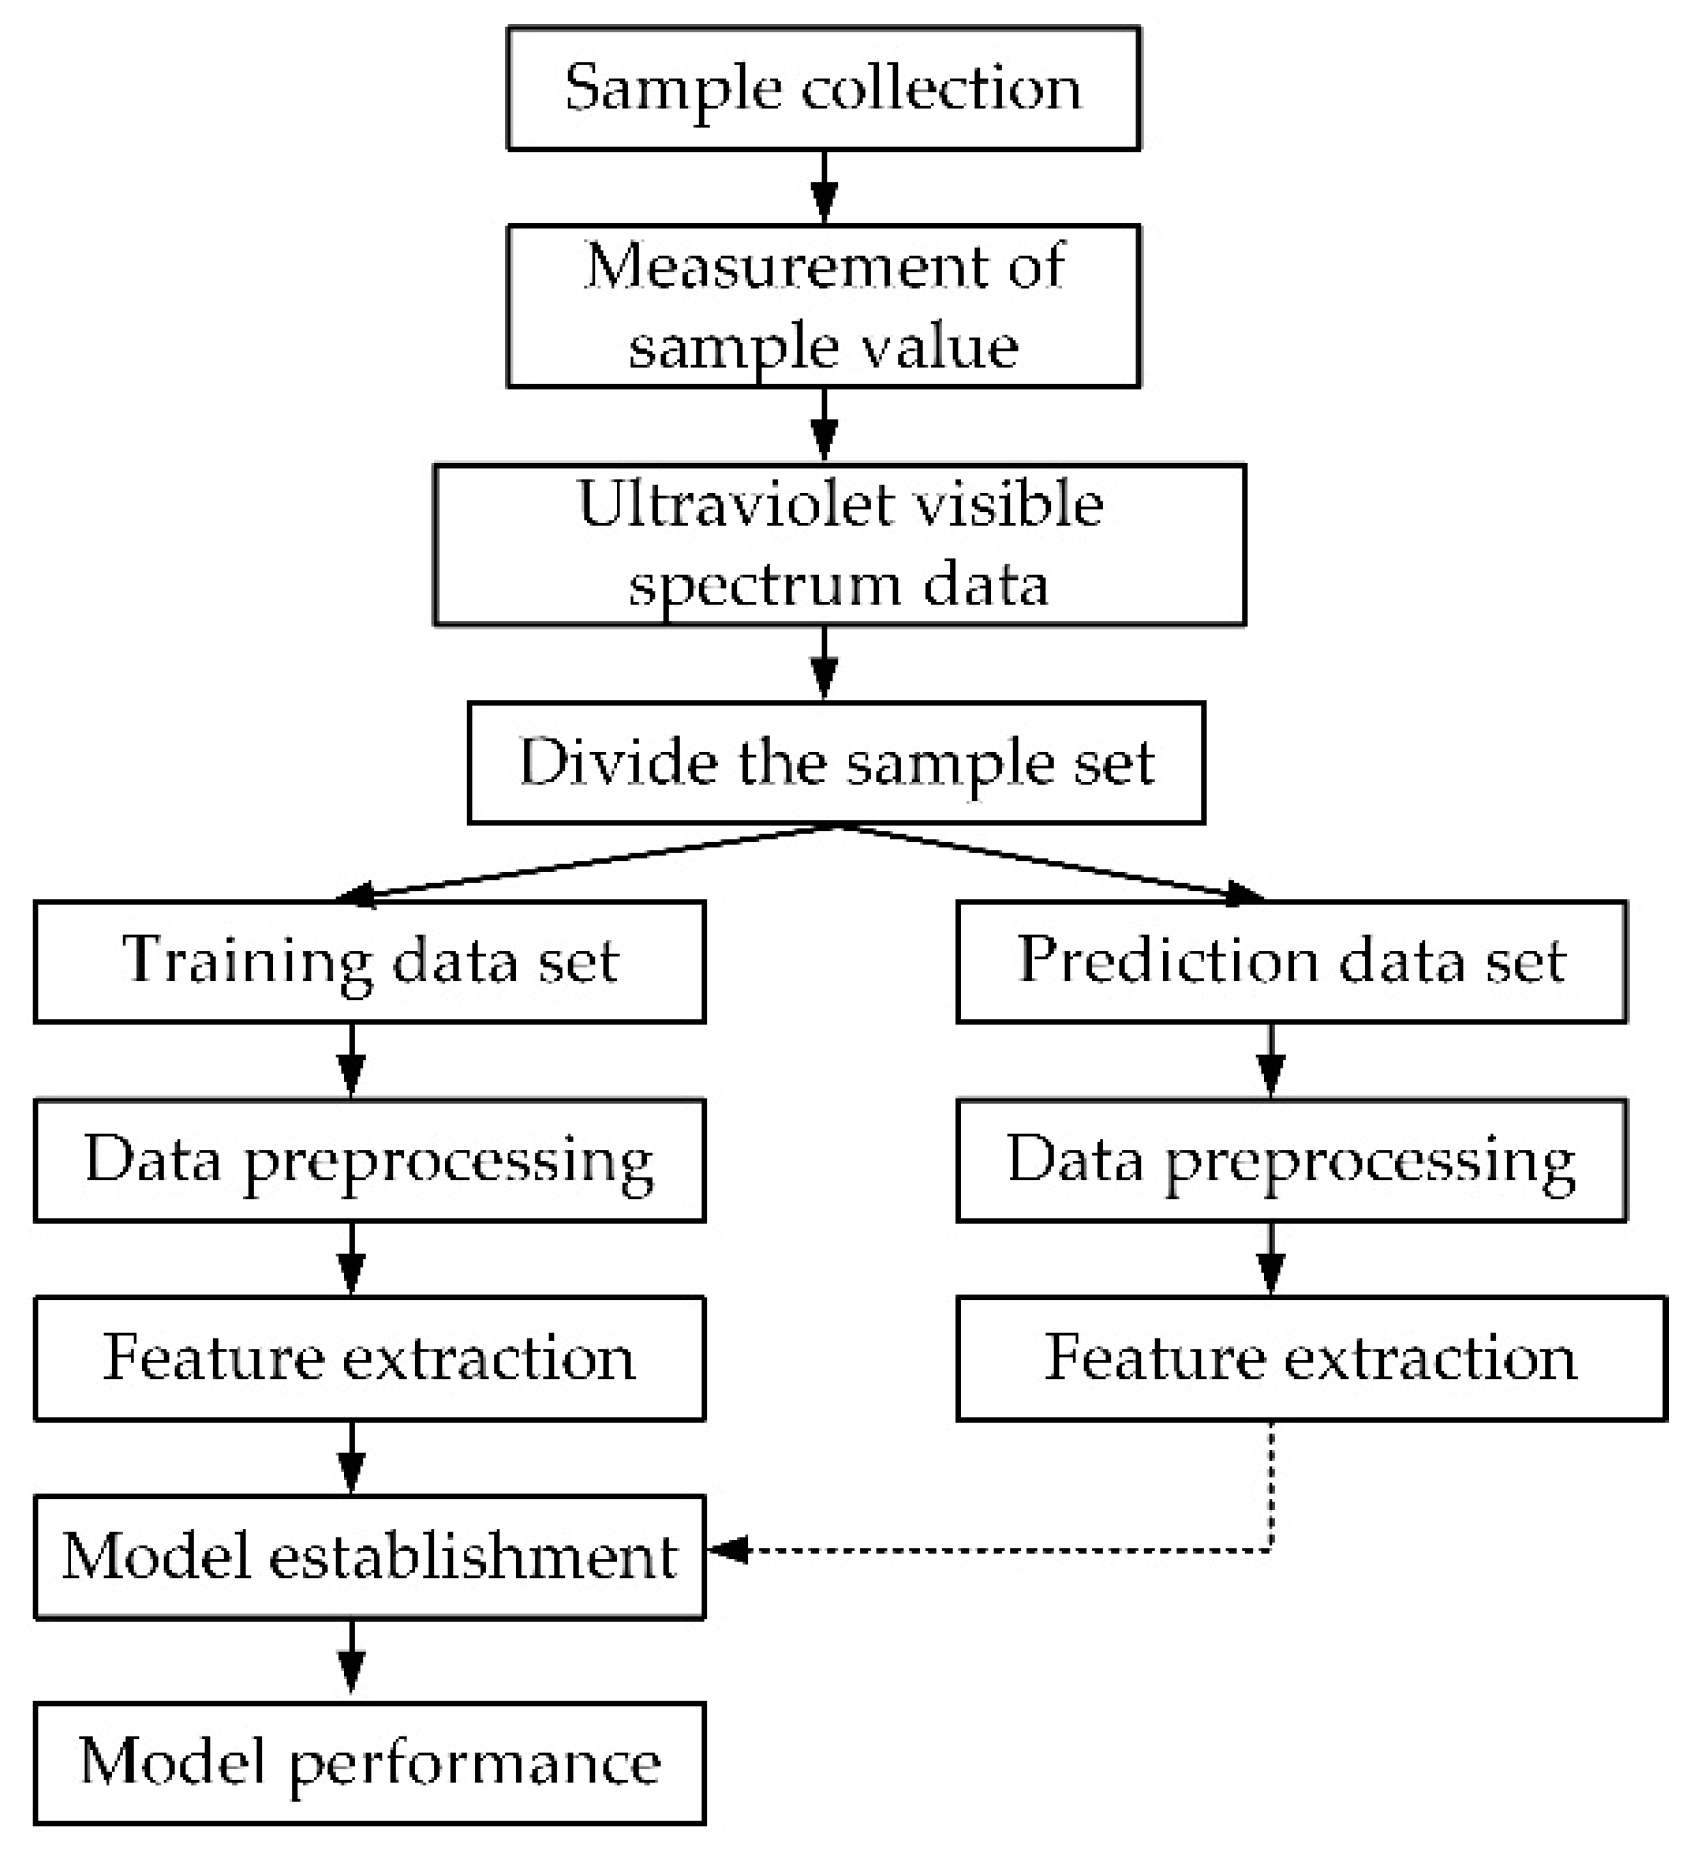
According to Lambert-Beer’s law, the amount of spectral absorption has a strong correlation with the concentration of water quality parameters, such that a high-precision prediction model between water quality spectral data and water quality parameters can be established [28]. The steps of establishing the prediction model of water quality parameters was shown in Figure 4. Currently, the main methods of model analysis include partial least squares regression (PLSR) and support vector machine regression (SVR).
In linear analysis modeling, PLSR is a commonly used multivariate analysis method in chemometrics. The principle of regression modeling is to project prediction variables and observation variables into a new space and establish a linear correlation between these variables to achieve the purpose of prediction [29]. The PLSR is a combination of PCA, canonical correlation analysis, and multiple linear regression analysis. Both PCA and PLSR attempt to extract the maximum information reflecting data variation; however, PCA only considers an independent variable matrix, while PLSR has a "response" matrix, so it incorporates a prediction function [30].
SVR is a machine learning algorithm based on structural risk minimization, which can be used for classification and regression. It specializes in the problem of statistical estimation and prediction in the case of small samples and discusses how to obtain the best solution in the case of existing limited samples. This method embodies the idea of compromising empirical risk and confidence range. Practical problems such as small samples, nonlinearity, and high dimensionality can be solved [31,32].
Many studies have focused on the use of other models to establish the linear relationship between absorbance and water quality parameter. The modeling algorithms with more notable capabilities in simulating such a relationship are the extreme learning machine (ELM) model, principal component regression (PCR), and stepwise regression (SR) (Table 4).
3.4. Model Evaluation Indicators
The selection of appropriate and accurate model evaluation criteria is crucial for selecting the optimal prediction model and evaluating its performance. The results of the evaluation parameters determine the final modeling method. The commonly used standard parameters for model evaluation are the coefficient of determination (R2) and root means square error (RMSE).
The corresponding definitions are as follows:
In Formula (2) and (3): where yc represents the actual value of the sample, yp represents the predicted value of the prediction model, represents the average of predicted values, and N represents the number of test samples. The closer to 1 the correlation coefficient is, the smaller the RMSE, the better the prediction performance of the model.
4. Research Status and Progress of Main Water Quality Parameters
4.1. Research Status of COD in Water
COD is a very important parameter in water quality detection. COD refers to the amount of oxidant consumed by the reducing substances in the oxidized one liter water sample under certain conditions, expressed in milligrams per liter. It reflects the degree of pollution caused by adding reducing substances to water [33].
Because it is easily influenced by human factors or machine equipment in the process of data acquisition, many researchers preprocess the spectral data before establishing the COD prediction model. Kang et al. [34] collected spectral data in the samples to be tested by the UV-Vis spectrum, preprocessed the data by using the wavelet transform method, reduced the dimension of the data by using a local linear embedding (LLE) method, and finally established a prediction model based on SVR. Liu et al. [35] used a smoothing algorithm, empirical mode decomposition algorithm, and wavelet analysis to reduce the noise of UV-Vis spectrum data, and obtained six potential variables from PLSR modeling as the input of a partial least squares support vector machine (LS-SVM) to establish a COD prediction model. Wang et al. [36] used a competitive adaptive reweighting algorithm (CARS) to obtain the characteristic wavelength of the UV-Vis spectrum and used ELM to model, which can accurately and rapidly detect the COD content in aquaculture water. Cao et al. [37] used the UVE-SPA variable selection algorithm to obtain the UV-Vis spectrum characteristic wavelength, which when combined with LS-SVM modeling, quickly and accurately measured COD concentrations in aquaculture water. Wang et al. [38] accurately determined COD by combining UV-Vis spectroscopy and multivariate calibration and established a calibration model of COD values by using the partial least squares method (PLS). To improve the prediction performance of COD content in water, Chen et al. [39] used variable pathlength UV–Vis spectroscopy combined with PLSR model to achieve high-precision monitoring of COD in wastewater.
While studying the use of UV-Vis spectroscopy to detect COD of water quality, many researchers also noticed that the scattering caused by turbidity has an impact on the UV-Vis absorption spectrum of the water sample, such as baseline drift and nonlinear uplift of spectral lines [40,41]. Turbidity seriously interferes with the output accuracy of the COD detection model. Xue et al. [42] studied the influence of temperature and turbidity on COD detection. The single temperature parameter required a long-span change to have a significant impact on the UV absorbance data of COD detection of water quality but the turbidity parameter caused the deviation in COD measurement. Finally, the non-linear compensation model was used to effectively suppress the influence of turbidity in water; Hu et al. [43] used the normalization technique to estimate the turbidity and dynamically simulated its absorption spectrum. The absorption peak in the mixed solution to shift blue was caused by hydrogen bonds; thus, a numerical fitting curve to describe the relationship between the blue shift and the turbidity was established, and then the position of the peak was corrected. After the turbidity compensation process, the coefficient of determination was 0.99 and the predicted RMSE was only 2.42 mg/L, which highlights the potential of this method in improving the accuracy of COD measurement based on the UV-Vis spectrum. Jon et al. [44] simultaneously determined COD and turbidity concentration by UV-Vis in the wavelength range of 200–1100 nm. The PLS method was used to analyze the regression, and relatively reliable detection results were obtained.
4.2. Detection of Heavy Metal Ions in Water
In recent years, researchers have found that colorimetry can accurately reflect the concentration of heavy metal ions in water. Colorimetry is a method used to detect the content in substances by comparing the color change of the substance or measuring the color depth of substance solution [45]. It is performed by selecting a suitable color reagent to react with the component to be tested to form a colored substance or to change the color of the solution, and then the generated colored substance is compared with the standard solution, the color of the reaction solution and the standard solution are observed, or the spectrum of its UV-Vis wave band is measured to quantitatively determine the substance [46].
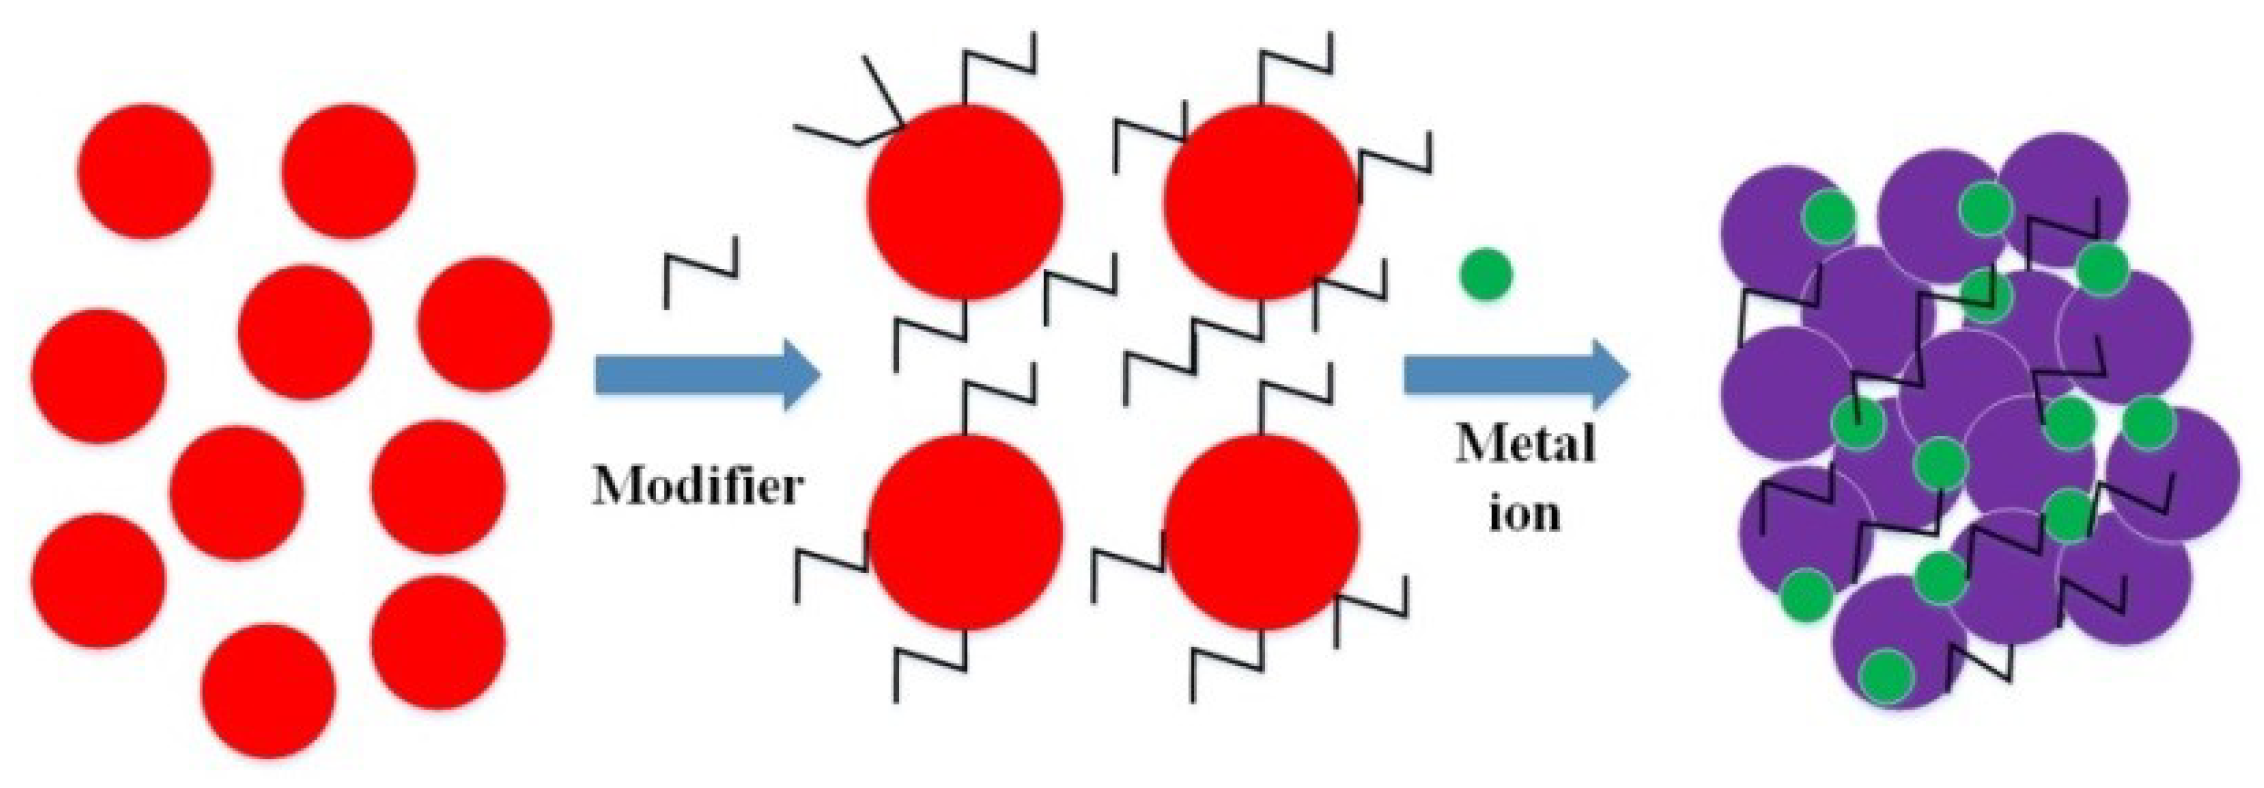
The change in the surface properties of nanomaterials will cause an obvious change in their apparent color. Many kinds of research have established methods based on nanogold colorimetry to detect the concentration of heavy metal ions. Many metal ions can cause the aggregation and dispersion state transition of the nanogold probe solution such that the absorbance and color of the mixed solution can change with an increase in the metal ion concentration [47,48]. Figure 5 shows the reaction mechanism of using nanogold to detect heavy metal ions.
Zhu et al. [49] used the Akaike information criterion to select the optimal model. A method based on modeling was proposed to detect the concentration of Zn2+ and Co2+ ions by using UV-Vis absorption spectroscopy. In addition, Zhu et al. [50] also proposed a method based on the improved Monte Carlo uninformative variable elimination (MC-UVE) method to detect the concentration of multi metal ions, which solved the problem of spectral overlap. Zhao et al. [51] used Hg2+ mediated gold nanoparticles to rapidly detect Hg2+ ions with high sensitivity and selectivity. Ono et al. [52] prepared a thymine rich DNA single-strand aptamer by using the characteristic that mercury ions can be covalently mismatched with thymine, thus establishing a colorimetric sensor for detecting mercury ion. Based on the adsorption of Hg2+ and polydopamine, Luo et al. [53] agglomerated gold nanoparticles, which changed the absorption signal of the system and the color of the solution. The UV-Vis spectrophotometry and a colorimetric method of Hg2+ were established.
Liu et al. [54] established two novel isomeric colorimetric probes for the simultaneous determination of copper ions. Two new colorimetric probes can produce obvious peaks at 498 nm in the UV-Vis absorption spectrum, as well as a rapid color change from colorless to dark yellow. Xue et al. [55] connected the pyridyl group with tetrathiafulvalene by using a double bond bridge, and the pyridyl group acted as a single dentate ligand of metal ions. π-conjugated double bonds were designed to optimize the communication between the receptor and the tetrathiafulvalene core. When exposed to micro molar concentration Pb2+, its UV-Vis spectrum showed obvious changes. Zhao et al. [56] created a portable analytical system for the detection of metal ions in water, using two single-step methods based on gold nanoparticles to detect Pb2+ and Al3+ in water with high selectivity and low detection limit. Zhang et al. [57] established a highly selective visualization method for the determination of trace Cr3+ in water based on citric acid-modified gold nanoparticles.
4.3. Research on the Detection of Nitrate Nitrogen in Water
Nitrate nitrogen is an important indicator to reflect the degree of water pollution. Increasing amounts of nitrogen-containing compounds are being discharged into the environment [58]. If the discharge exceeds the standard, the balance of the water body will be destroyed, resulting in rapid algae and plankton growth in the water body. The decrease in concentration and the death of fish and shrimp in a large area will eventually worsen the water quality, thus affecting human production activities in the ocean [59].
Li et al. [60] obtained the predicted concentration of nitrate by fitting the corrected concentration and absorbance of nitrate with the PLS method. Chen et al. [61] proposed a fast quantitative prediction method to determine the nitrate concentration in water by combining UV spectroscopy with the partial least squares support vector machine (LS-SVM) model, and the prediction accuracy of the model was significantly improved. Li et al. [62] used the PLSR model established by using wavelet transform, first-order differential, and SPA to predict the effect very effectively, as it can quickly and accurately determine the total nitrogen content in water.
Because the UV absorption peaks of nitrate nitrogen and nitrite nitrogen are very close, and the UV absorption curves overlap significantly, mutual interference is not conducive to the determination of their concentrations. Wang et al. [63] combined UV-Vis spectrophotometry with the second-order differential method to solve the problem of serious overlapping of absorption spectra of nitrite nitrogen and nitrate nitrogen. The rapid determination of nitrite nitrogen and nitrate nitrogen in samples was realized. Turbidity can reflect the degree of obstruction caused by the solution when light passes through it, and it includes the reflection of light suspended by the solution and the absorption of light by solute molecules. Turbidity is not only related to the content of suspended matter, but also its shape, size, and refractive index. In the detection of nitrate-nitrogen by using UV-Vis spectroscopy, due to the scattering effect of suspended matter in water, the absorption spectrum will change significantly, which will cause a large error in the measured modeling data, resulting in an inaccurate detection result.
Chen et al. [64] proposed a method of nitrate concentration measurement based on the first derivative of the UV absorption spectrum, which can reduce turbidity interference, to improve the accuracy of rapid detection of nitrate content by using the UV spectrum. Chen et al. [65] analyzed the influence of formalin turbidity standard solution on the UV absorption spectrum of a nitrate nitrogen standard solution. Based on this, a turbidity compensation method for the compensation curve method was proposed to compensate and correct the UV absorption spectrum of nitrate nitrogen, and the method was verified by using experiments; the RMSE of the prediction set was 0.124.
4.4. Research on the Detection of DOC in Water
DOC is a universal part of the freshwater carbon cycle. It can weaken ultraviolet radiation and affect the function of aquatic ecosystems. As a by-product of water disinfection, DOC has an impact on human health [66].
The 0.22 μm membrane is hydrophilic microporous membrane. The 0.45 μm filter membrane is hydrophobic microporous membrane. DOC is the fraction of organics that pass through a 0.45 μm membrane. The type of wastewater plays an important role in the quality of DOC and it has been shown that DOC may be related to aquatic humic substances, hydrophobic bases, hydrophobic neutrals, hydrophilic acids, hydrophilic bases, and hydrophilic neutrals [67].
DOC is commonly measured directly using two laboratory methods. DOC can be measured as ‘non-purgeable’ organic carbon by converting inorganic carbon into carbon dioxide (CO2) and purging this CO2. The remaining organic carbon is then converted to CO2 through thermal oxidation and measured by using the absorbance of infrared radiation [68]. The second method involves measuring total carbon (TC) and inorganic carbon (IC) and deriving the DOC by subtracting the IC from TC. The water sample and oxygen are respectively introduced into the high temperature combustion tube and the low temperature reaction tube. The water sample passing through the high temperature combustion tube is converted into carbon dioxide under the action of the catalyst and oxygen. The water sample passing through the low temperature reaction tube is acidified to decompose the inorganic carbonate into carbon dioxide. The generated carbon dioxide enters the non-dispersive infrared detector in turn. Since the intensity of infrared absorption of carbon dioxide is directly proportional to the concentration of carbon dioxide, the TC and IC in water samples can be quantitatively determined [69]. Both these methods require access to relatively expensive analytical equipment.
In the water treatment industry, absorbance at 254 nm is often used as a proxy for DOC because aromatic humic substances are the dominant source of DOC in natural waters, and these absorb light in the UV region of the electromagnetic spectrum. Cook et al. [70] studied the applicability of UV-Vis spectroscopy for tropical DOC water samples from any tropical peatland. First, the applicability of single-wavelength and dual-wavelength proxies for tropical DOC determination was explored; then calibration data sets and parameter sets were established to indirectly calculate DOC concentrations, providing researchers with guidance on the best spectrophotometric method.
The aim of Avagyan’s study was to test the performance of a portable, submersible UV-Vis spectrophotometer during the snowmelt period in a boreal mire-forest catchment. A conceptual understanding of the spatial and temporal dynamics of DOC concentrations was provided during and after snowmelt. Based on PLSR, the local calibration showed good agreement with the results obtained from the high-resolution absorption measurements and the wet persulfate oxidation method [71].
Peacock et al. [72] investigated the appropriateness of different wavelengths (230 nm, 254 nm, and 263 nm) as proxies for DOC concentration. These findings should enable the use of UV-Vis spectroscopy as a tool to analyze DOC concentration and quality in natural waters.
5. Development Trend of Water Quality Monitoring Based on UV-Visible Spectroscopy
The commonly used water quality monitoring technology involves manually collecting water samples in the laboratory for analysis, which makes it difficult to use to meet the requirements of on-line real-time monitoring. Even the more advanced chemical analysis methods for water quality monitoring require at least 20 min to obtain the detection results, which cannot provide timely warning for the occurrence of water pollution events [73,74].
5.1. Combination of UV-Vis Spectroscopy and Wireless Communication Network Technology
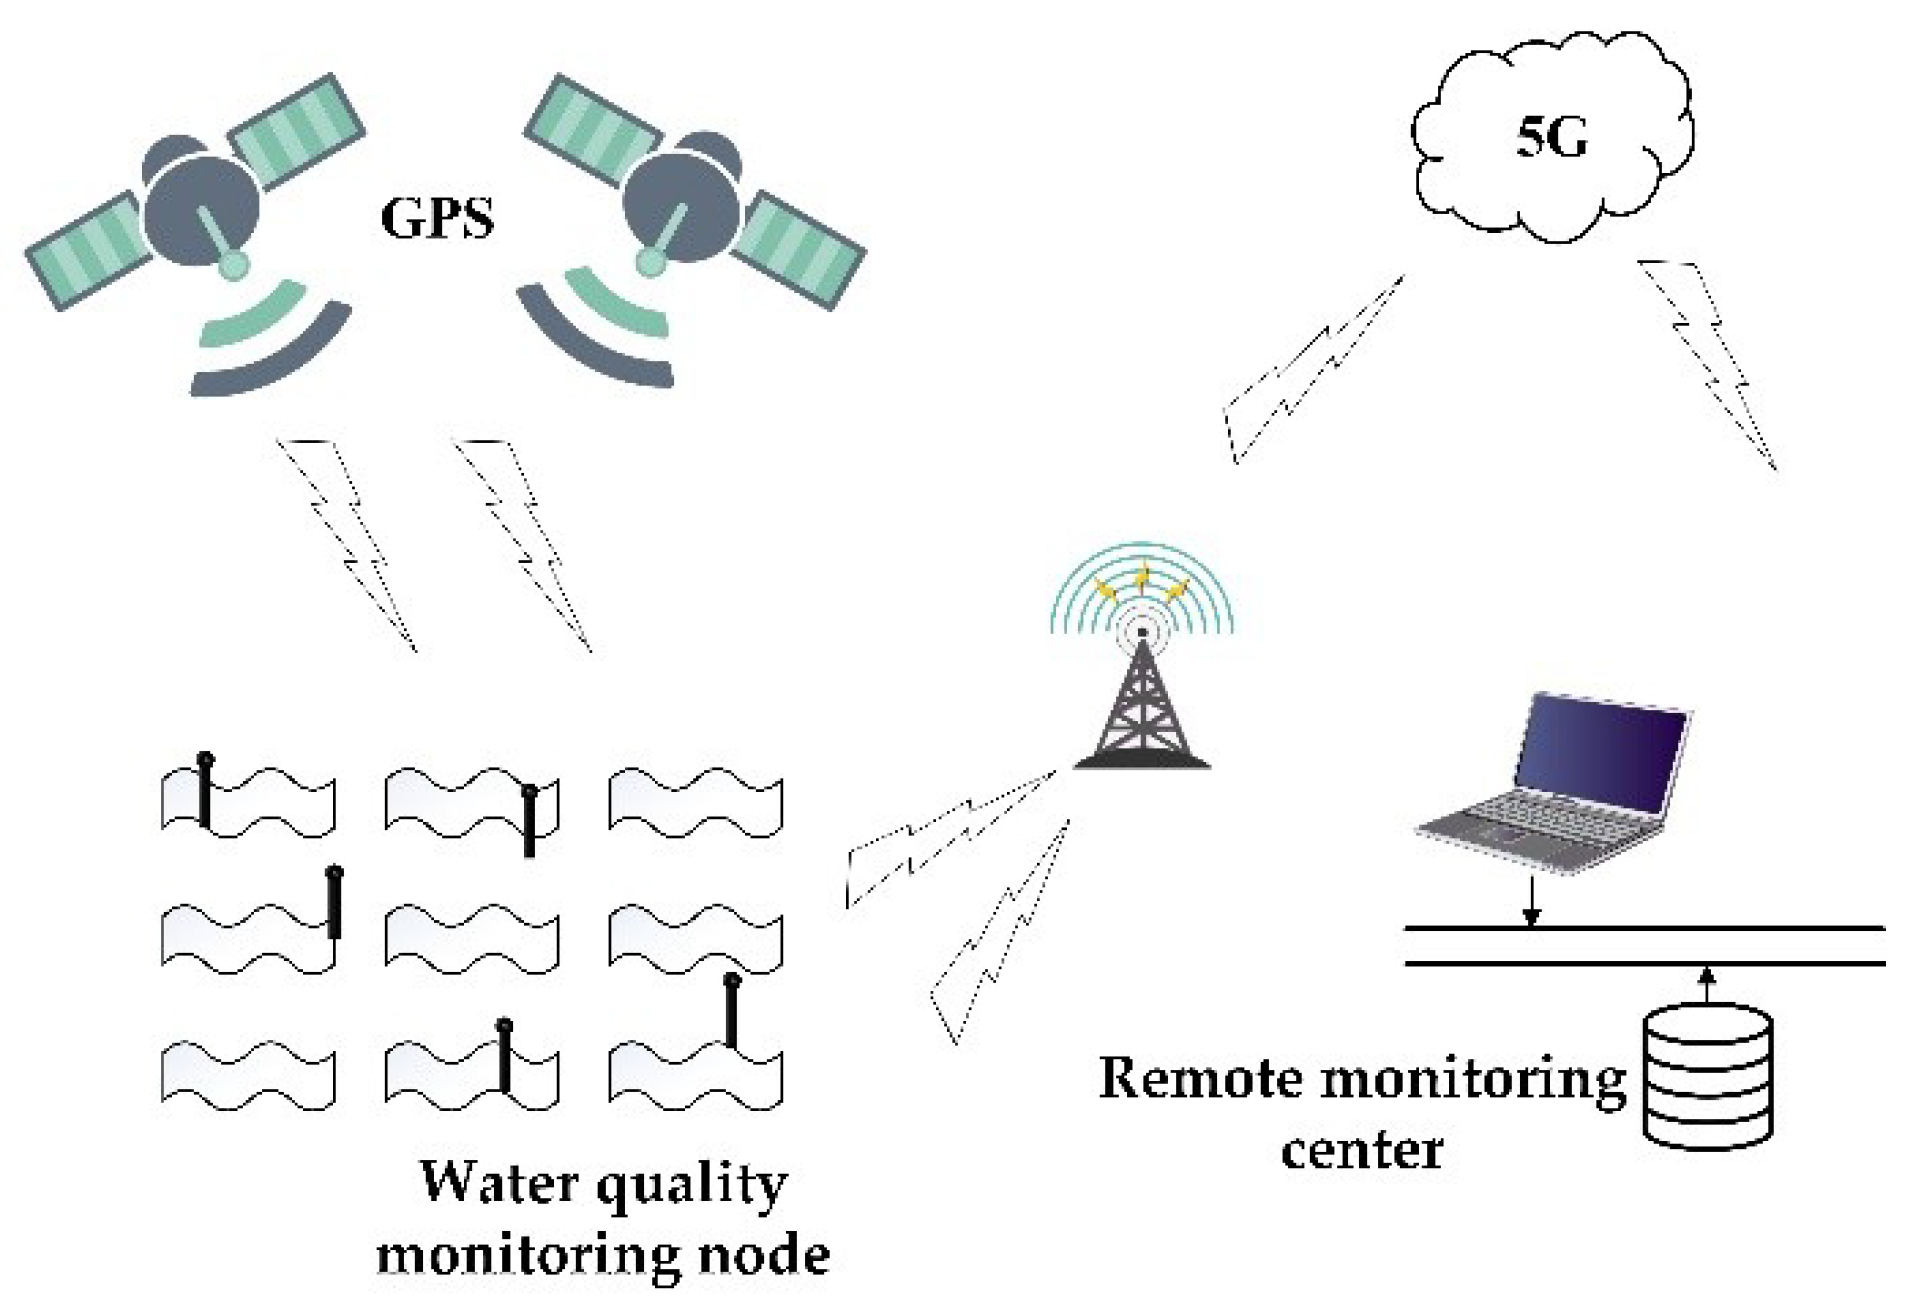
Since 5G networks are expected to massive expand today’s Internet of Things (IoT), humankind has entered the era of big data through the rapid development of IoT technology, With the help of the IoT, key information of target objects can be easily obtained and relevant data stored in cloud space [75]. Through the combination of UV-Vis spectrum technology and data communication technology, real-time monitoring and early warning water quality parameter data can be obtained, which is one of the main development trends for water quality monitoring based on UV-Vis spectroscopy in the future [76,77,78]. Water quality monitoring in the form of an early warning system was shown in Figure 6.
5.2. Detection of Water Quality Parameters Based on Multi-Source Data Fusion Technology
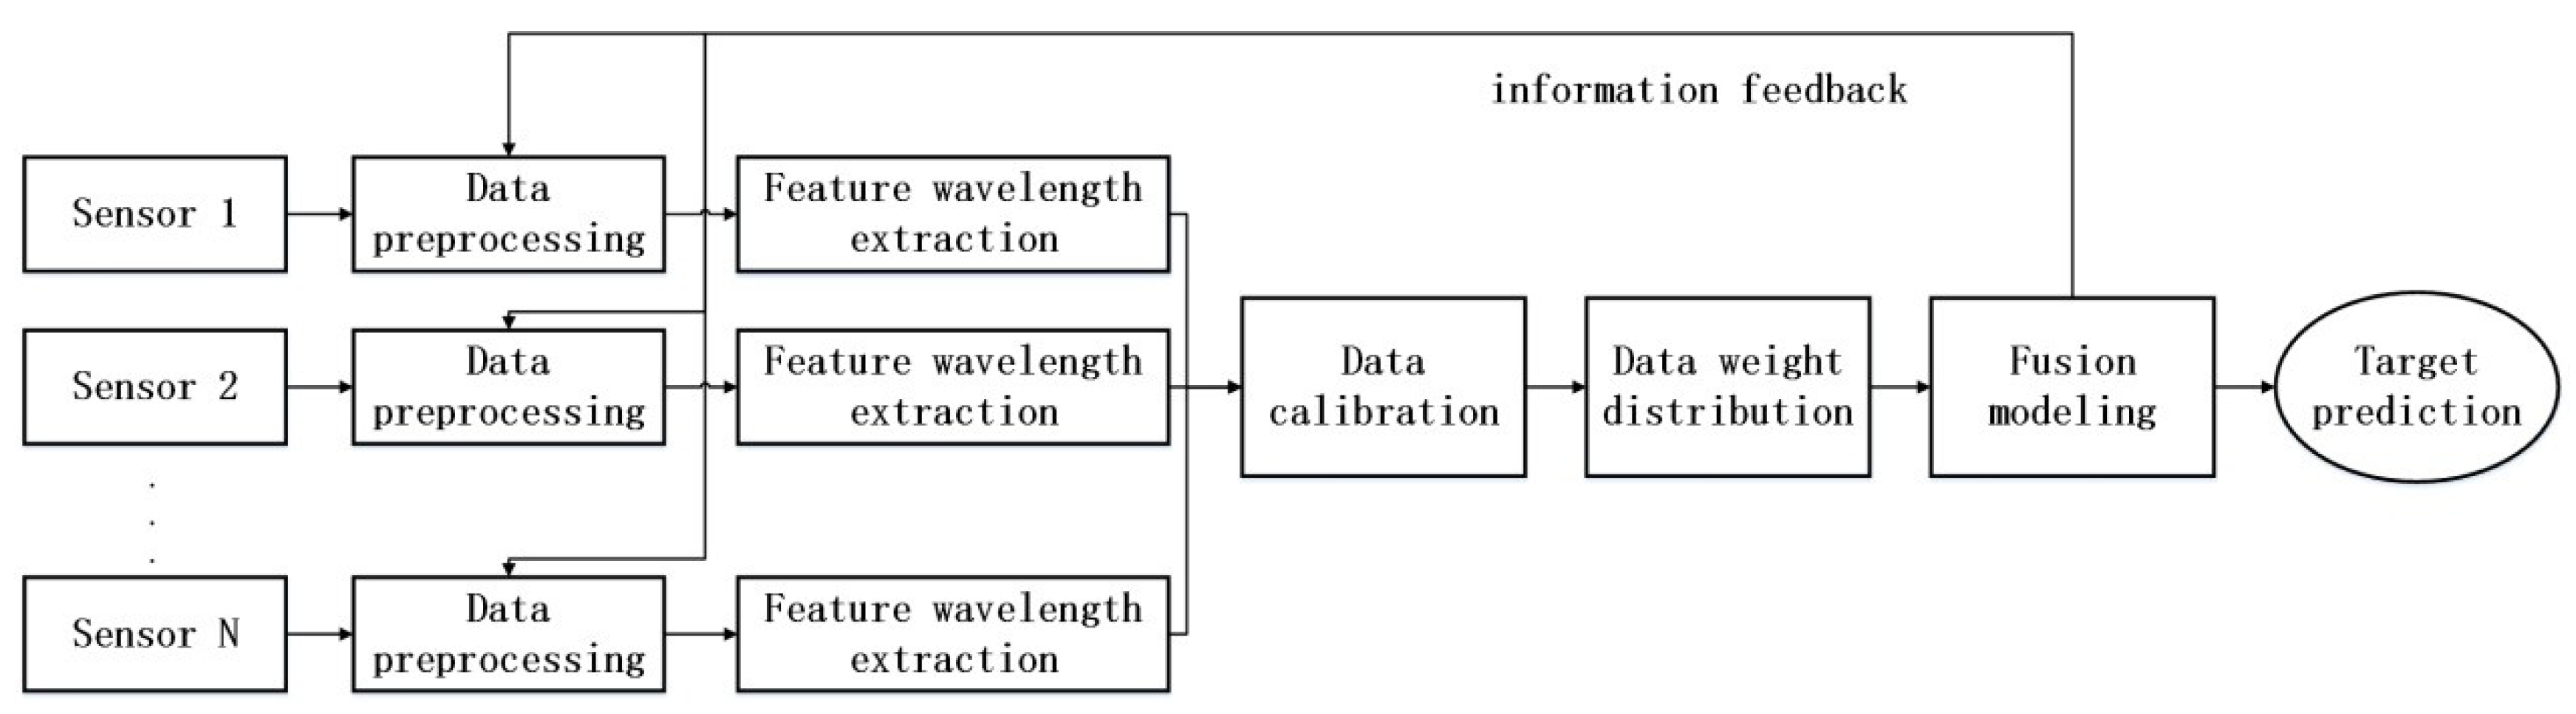
With deeper scientific research in recent years, many methods to detect water quality parameters have been proposed by many researchers. Each of these methods has its own advantages and disadvantages, and significant contributions have been made to the detection of water quality parameter concentrations [79]. However, the results of a single detection method would be biased. If there are human errors in the method, then it cannot accurately reflect the water pollution. Therefore, one of the development trends in water pollution detection in the future is to integrate all the information of water quality parameters obtained from investigation and analysis such that the information is unified by the evaluation method. Finally, a unified multi-source data fusion technology can be obtained. This technology integrates different data, absorbs the characteristics of different data sources, and then extracts better and richer information than a single data source [80]. The process of multi-source data fusion to detect water quality parameters was shown in Figure 7.
6. Conclusions and Discussion
This paper discusses the application of UV-Vis spectroscopy for water quality detection. As described in this paper, a variety of UV-Vis spectroscopy techniques have been widely used to detect pollutants in different water environments, including organic and inorganic substances. In this paper, the detection method of water quality parameters, data analysis method, and existing problems are introduced in detail. UV-Vis spectroscopy has become a rapid analysis tool for qualitative and quantitative detection of water quality.
Although these studies show the ability of UV-Vis spectroscopy to detect pollutants in water environments, the practical application of UV-Vis spectroscopy in water quality detection is still difficult. One of the main problems is the detection limit. At present, the detection limit of many studies has been below the environmental safety value; however, it is worth noting that the experimental processes have been performed in the laboratory rather than in true field environments. The field environment is complex and contains many pollutants, which have significant impacts on the detection results. Another problem is that it is difficult to detect the UV-Vis spectra of some pollutants in water, such as suspended solids, dissolved inorganic substances, and pathogenic microorganisms. In addition, there are significant differences in the methods of UV-Vis spectrometric determination of various pollutants, which may be affected by many factors, including sample preparation and instrument settings.
Therefore, future research needs to include greater progress in the field of instrumentations. The miniaturization and integration of instruments for measuring UV-Vis spectra are the key factors for achieving accurate and rapid detection of water quality parameters in the 5G era. In addition, with the rapid development of other spectral detection technologies, the combination of Raman spectroscopy with UV-Vis or near-infrared spectroscopy with UV-Vis technology can also be used in rapid water quality quantitative detection.
Author Contributions
Y.G. wrote the paper. C.L., R.Y., and Q.D. reviewed the manuscript. All authors have read and agreed to the published version of the manuscript.
Funding
This research is supported by China’s national key research and development program (Project No.: 2017YFE0122100).
Acknowledgments
We are deeply grateful to the reviewers and the editors for their valuable comments and suggestions, which improved the technical content and presentation of the paper.
Conflicts of Interest
There are no conflicts to declare.
References
- Karthe, D.; Chalov, S.; Borchardt, D. Water resources and their management in central Asia in the early twenty first century: Status, challenges and future prospects. J. Environ. Earth Sci. 2015, 73, 487–499. [Google Scholar] [CrossRef]
- Helder, I. Water resources meet sustainability: New trends in environmental hydrogeology and groundwater engineering. Environ. Earth Sci. 2015, 73. [Google Scholar] [CrossRef]
- Lee, C.W.; Yoo, D.G. Decision of Water Quality Measurement Locations for the Identification of Water Quality Problems under Emergency Link Pipe Operation. Appl. Sci. 2020, 10, 2707. [Google Scholar] [CrossRef] [Green Version]
- Banda, D.; Kumarasamy, M. Development of a Universal Water Quality Index (UWQI) for South African river catchments. Water 2020, 12, 1534. [Google Scholar] [CrossRef]
- Briciu, E.; Graur, A.; Oprea, I. Water Quality Index of Suceava River in Suceava City Metropolitan Area. Water 2020, 12, 2111. [Google Scholar] [CrossRef]
- Pashkova, G.V.; Revenko, A.G. A Review of Application of Total Reflection X-ray Fluorescence Spectrometry to Water Analysis. J. Appl. Spectrosc. Rev. 2015, 50. [Google Scholar] [CrossRef]
- Samir, B.; Kalalian, C.; Roth, E.; Salghi, R.; Chakir, A. Gas-phase UV absorption spectra of pyrazine, pyrimidine and pyridazine. Chem. Phys. Lett. 2020, 751. [Google Scholar] [CrossRef]
- Bardik, V.; Fisenko, I.; Magazu, S.; Malomuzh, P. The crucial role of water in the formation of the physiological temperature range for warm-blooded organisms. J. Mol. Liq. 2020, 306, 112818. [Google Scholar] [CrossRef]
- Hou, B.; Jian, Z.; Jie, P. Water Quality Analysis by UV-Vis Spectroscopy: A Review of Methodology and Application. Spectrosc. Spect Anal. 2013, 33, 1839–1844. [Google Scholar]
- Giudicianni, C.; Herrera, M.; Di Nardo, A.; Greco, R.; Creaco, E.; Scala, A. Topological Placement of Quality Sensors in Water-Distribution Networks without the Recourse to Hydraulic Modeling. J. Water Resour. Plan. Manag. 2020, 146, 04020030. [Google Scholar] [CrossRef]
- Ma, Z.; Li, H.; Ye, Z. Application of modified water quality index (WQI) in the assessment of coastal water quality in main aquaculture areas of Dalian, China. Mar. Pollut. Bull. 2020, 157, 111285. [Google Scholar] [CrossRef] [PubMed]
- Jiang, Z.; Zhou, K.; Sharma, V.K. Occurrence, transportation, monitoring and treatment of emerging micro-pollutants in waste water—A review from global views. Microchem. J. 2013, 110, 292–300. [Google Scholar] [CrossRef]
- Maisano, G.; Majolino, D.; Migliardo, P.; Venuto, S.; Aliotta, F.; Magazú, S. Sound velocity and hydration phenomena in aqueous polymeric solutions. J. Mol. Phys. 1993, 78, 421–435. [Google Scholar] [CrossRef]
- Atamas, N.; Bardik, V.; Bannikova, A.; Grishina, O.; Lugovskoi, E.; Lavoryk, S.; Makogonenko, Y.; Korolovych, V.; Nerukh, D.; Paschenko, V. The effect of water dynamics on conformation changes of albumin in pre-denaturation state: Photon correlation spectroscopy and simulation. J. Mol. Liq. 2017, 235, 17–23. [Google Scholar] [CrossRef] [Green Version]
- Savitzky, A.; Golay, M. Smoothing and Differentiation of Data by Simplified Least Squares Procedures. Anal. Chem. 1964, 36, 1627–1639. [Google Scholar] [CrossRef]
- Quan, Q.; Cai, K.Y. Time-domain analysis of the Savitzky–Golay filters. Digit. Signal Process. 2012, 22, 238–245. [Google Scholar] [CrossRef]
- Huang, P.; Wang, K.; Hou, D.; Zhang, J.; Yu, J.; Zhang, G. In situ detection of water quality contamination events based on signal complexity analysis using online ultraviolet-visible spectral sensor. J. Appl. Opt. 2017, 56, 6317. [Google Scholar] [CrossRef]
- Guan, L.; Tong, Y.; Li, J.; Li, D.; Wu, S. Research on ultraviolet-visible absorption spectrum preprocessing for water quality contamination detection. Optik 2018, 164, 277–288. [Google Scholar] [CrossRef]
- Wu, C.; Wei, B.; Fen, P. Denoising algorithm of UV-Visible spectrum based on two-dimensional reconstruction and dynamic pane. Spectrosc. Spect Anal. 2016, 36, 1044–1050. [Google Scholar]
- Zhao, F.; Tang, P.; Tang, B. Research on Denoising of Ultraviolet-Visible Spectral Data of Water Quality Detection Based on Compressed Sensing Theory Based on Wavelet Transform. Spectrosc. Spect Anal. 2018, 38, 844–850. [Google Scholar]
- Li, J.; Tong, Y.; Guan, L.; Wu, S.; Li, D. A UV-visible absorption spectrum denoising method based on EEMD and an improved universal threshold filter. RSC Adv. 2018, 8, 8558–8568. [Google Scholar] [CrossRef] [Green Version]
- Liu, J. Design and Implementation of Distributed Ultraviolet-Visible Water Quality COD Monitoring System Based on Wireless Sensor Network. Ph.D. Thesis, Chongqing University, Chongqing, China, 2016. [Google Scholar]
- Hou, D.; Zhang, J.; Yang, Z. Distribution water quality anomaly detection from UV optical sensor monitoring data by integrating principal component analysis with chi-square distribution. Opt. Express 2015, 23, 17487–17510. [Google Scholar] [CrossRef]
- Tang, B.; Zhao, X.; Wei, B. Optimization method of COD prediction model for detecting water quality by ultraviolet-visible spectroscopy. China Environ. Sci. 2015, 35, 478–483. [Google Scholar]
- Guan, L.; Tong, Y.; Li, J.; Wu, S.; Li, D. An online surface water COD measurement method based on multi-source spectral feature-level fusion. RSC Adv. 2019, 9, 11296–11304. [Google Scholar] [CrossRef] [Green Version]
- Zhang, L.; Sun, H.; Rao, Z.; Ji, H. Hyperspectral imaging technology combined with deep forest model to identify frost-damaged rice seeds. Spectrochim. Acta A 2020, 229, 117973. [Google Scholar] [CrossRef] [PubMed]
- Tang, R.; Chen, X.; Li, C. Detection of Nitrogen Content in Rubber Leaves Using Near-Infrared (NIR) Spectroscopy with Correlation Based Successive Projections Algorithm (SPA). Appl. Spectrosc. 2018, 72, 740–749. [Google Scholar] [CrossRef]
- Jing, L.; Yi, F. Optimization of COD determination by UV-visible spectroscopy using PLS chemometrics algorithms. Optik 2018, 17, 162–163. [Google Scholar]
- Skou, B.; Berg, A.; Aunsbjerg, D.; Thaysen, D.; Rasmussen, A.; Berg, F. Monitoring Process Water Quality Using Near Infrared Spectroscopy and Partial Least Squares Regression with Prediction Uncertainty Estimation. J. Appl. Spectrosc. 2017, 71, 410–421. [Google Scholar] [CrossRef]
- Huo, A.; Zhang, J.; Qiao, C.; Li, C.; Xie, J.; Wang, J.; Zhang, X. Multispectral remote sensing inversion for city landscape water eutrophication based on Genetic Algorithm-Support Vector Machine. Water Qual. Res. J. 2014, 49, 285–293. [Google Scholar] [CrossRef]
- Jiao, L.; Dong, D.; Zheng, W.; Zhao, X.; Zhang, S.; Shen, C. Determination of thiophanate-methyl using UV absorption spectra based on multiple linear regression. Optik 2014, 125, 183–185. [Google Scholar] [CrossRef]
- Zhao, J. Study on the Detection Technology of Water Quality COD by Ultraviolet-Visible Spectroscopy. Ph.D. Thesis, Chongqing University, Chongqing, China, 2015. [Google Scholar]
- Wu, Q.; Du, X.; Yan, B. Ultraviolet spectrum analysis method in the detection of organic pollutant concentration in water. Spectrosc. Spect Anal. 2011, 31, 233–237. [Google Scholar]
- Kang, B.; Ma, J. Research on Detection Method of Water Quality COD Ultraviolet Spectrum Based on LLE-SVR. Sensor world. 2018, 24, 11–15. [Google Scholar]
- Liu, M.; Zhang, L. Research on Detection of COD in Aquaculture Water Based on LS-SVM Ultraviolet and Visible Spectra. C. In Proceedings of the Near-Infrared Spectroscopy Branch of Chinese Instrumentation Society, Proceedings of the Fifth National Conference on Near-Infrared Spectroscopy, Montreal, QC, Canada, 10 October 2014; p. 114. [Google Scholar]
- Wang, M.; Zhang, L.; Luo, W. Research on Detection of Chemical Oxygen Demand in Aquaculture Water Based on UV-Vis. Spectrosc. Spect Anal. 2016, 36, 177–180. [Google Scholar]
- Cao, H.; Qu, T.; Yang, L. Study on Rapid Detection of Organic Matter Concentration in Aquaculture Water by UV-Vis Spectra. Spectrosc. Spect. Anal. 2014, 11, 3015–3019. [Google Scholar]
- Wang, L.; Liu, H.; Shi, X.; Lu, R.; Qi, Y.; Wang, Y. Study on Real-Time Monitoring of Seawater COD by UV-Vis Spectroscopy. Adv Mater. 2013, 726–731, 1534–1537. [Google Scholar] [CrossRef]
- Chen, B.; Wu, H.; Li, Y. Development of variable pathlength UV–vis spectroscopy combined with partial-least-squares regression for wastewater chemical oxygen demand (COD) monitoring. Talanta 2014, 120, 325–330. [Google Scholar] [CrossRef]
- Rongling, L.; Xiaole, D.; Fei, G. The Heuristic Algorithms for Selecting the Parameters of Support Vector Machine for Classification. J. Electron. 2012, 21, 485–488. [Google Scholar]
- Dioan, L.; Rogozan, A.; Pecuchet, P. Improving classification performance of Support Vector Machine by genetically optimising kernel shape and hyper-parameters. J. Appl. Intell. 2012, 36, 280–294. [Google Scholar] [CrossRef]
- Xue, F. Research on Water Quality COD Detection Method Based on Ultraviolet-Visible Spectrum. Ph.D. Thesis, Nanjing University of Information Science Technology, Nanjing, China, 2019. [Google Scholar]
- Hu, Y.; Wen, Y.; Wang, X. Novel method of turbidity compensation for chemical oxygen demand measurements by using UV–vis spectrometry. Sens. Actuators B 2016, 227, 393–398. [Google Scholar] [CrossRef]
- Agustsson, J.; Akermann, O.; Barry, D.A.; Rossi, L. Non-contact assessment of COD and turbidity concentrations in water using diffuse reflectance UV-Vis spectroscopy. Environ. Sci. Proc. Impacts 2014, 16, 1897–1902. [Google Scholar] [CrossRef]
- Lv, M.; Hu, T.; Gao, Y. Spectral COD measurement method based on water sample type identification. Spectrosc. Spect. Anal. 2017, 37, 3797–3802. [Google Scholar]
- Yang, L.; Yun, W.; Chen, Y.; Wu, H.; Liu, X.; Fu, M.; Huang, Y. Ultrasensitive colorimetric and fluorometric detection of Hg(II) based on the use of gold nanoparticles and a catalytic hairpin assembly. Microchim. Acta 2017, 184, 4741–4747. [Google Scholar] [CrossRef]
- Wu, B.; Xu, L.; Wang, S.; Wang, Y.; Zhang, W. A PEG ylated colorimetric and turn-on fluorescent sensor based on BODIPY for Hg(II) detection in water. J. Polym. Chem. 2015, 6, 4279–4289. [Google Scholar] [CrossRef]
- Moreno-Martin, G.; León-González, M.E.; Madrid, Y. Simultaneous determination of the size and concentration of AgNPs in water samples by UV-vis spectrophotometry and chemometrics tools. Talanta 2018, 188, 393–403. [Google Scholar] [CrossRef] [PubMed]
- Zhu, Q.; Zhou, T.; Li, G. Ultraviolet-visible absorption spectrum detection method of zinc ion and cobalt ion concentration based on lifting modeling. Anal. Chem. 2019, 47, 576–582. [Google Scholar]
- Zhu, Q.; Chen, M.; Yin, H. Multi-metal ion concentration detection method based on ultraviolet-visible spectrum. J. Chem. Eng. 2017, 68, 998–1004. [Google Scholar]
- Zhao, Y.; Gui, L.; Chen, Z. Colorimetric detection of Hg2+ based on target-mediated growth of gold nanoparticles. Sens. Actuators B 2017, 241, 262–267. [Google Scholar] [CrossRef]
- Tanaka, Y.; Oda, S.; Yamaguchi, H.; Kondo, Y.; Kojima, C.; Ono, A. 15N−15NJ-Coupling Across Hg(II): Direct Observation of Hg(II)-Mediated T−T Base Pairs in a DNA Duplex. J. Am. Chem. Soc. 2007, 129, 244–245. [Google Scholar] [CrossRef]
- Luo, S.; Wang, Y.; Tan, J. Detection of Hg2+ based on silver nanoparticle colorimetry. In Proceedings of the National Annual Conference of Analytical Chemistry of Chinese Chemical Society, Qingdao, China, 26–29 October 2012. [Google Scholar]
- Guanhong, L.; Peipei, R.; Fan, Y. Two Novel Colorimetric Probes (5-HMBA-FH and 3-HMBA-FH) Based on Fluorescein for Copper(II) ion Detection. Can. J. Chem. 2018, 96, 1037–1045. [Google Scholar]
- Xue, H.; Tang, J.; Wu, Z. Highly Selective Colorimetric and Electrochemical Pb2+ Detection Based on TTF-pi-Pyridine Derivatives. J. Org. Chem. 2005, 70, 9727–9734. [Google Scholar] [CrossRef]
- Zhao, C.; Zhong, G.; Kim, E. A portable lab-on-a-chip system for gold-nanoparticle-based colorimetric detection of metal ions in water. Biomicrofluidics 2014, 8, 052107. [Google Scholar] [CrossRef] [Green Version]
- Zhang, T.; Zhong, H.; Zhang, T. Visual detection of Cr3+ based on surface plasmon resonance effect based on gold nanoparticles. Anal. Chem. 2019, 47, 1373–1381. [Google Scholar]
- Wang, L.; Ren, X.; Ma, R. Research progress of UV-VIS on-site determination of nitrate and nitrite in seawater. Environ. Sci. Technol. 2010, S2, 372–374. [Google Scholar]
- Alam, F.; Yamamoto, T.; Umino, T.; Nakahara, S.; Hiraoka, K. Estimating Nitrogen and Phosphorus Cycles in a Timber Reef Deployment Area. Water 2020, 12, 2515. [Google Scholar] [CrossRef]
- Li, D.; Feng, W.; Chen, X. A seawater nitrate online monitoring system based on ultraviolet spectroscopy. Spectrosc. Spect. Anal. 2016. [Google Scholar] [CrossRef]
- Chen, Y.; He, L.; Cui, N. Study on Mixed Prediction Model of Nitrate Concentration in Water Based on Ultraviolet Spectrum. Spectrosc. Spect. Anal. 2019, 39, 167–172. [Google Scholar]
- Li, X.; Zhou, Q.; Tang, H. Research on rapid detection of total nitrogen content in aquaculture water quality based on ultraviolet spectrum. Spectrosc. Spect. Anal. 2020, 40, 195–201. [Google Scholar]
- Wang, M.; Zhang, C.; Zhang, J. Rapid determination of nitrate nitrogen and nitrite nitrogen by second derivative spectroscopy. Spectrosc. Spect. Anal. 2019, 39, 167–171. [Google Scholar]
- Chen, W.; Yin, F.; Zhao, J. Study on UV Derivative Spectroscopy Detection Method of Nitrate Concentration under Turbidity Interference. Spectrosc. Spect. Anal. 2019, 39, 2912–2916. [Google Scholar]
- Chen, Y.; He, L.; Cui, N. Study on Nitrate Nitrogen Turbidity Compensation Based on Ultraviolet Spectrum. Spectrosc. Spect. Anal. 2020, 40, 472–477. [Google Scholar]
- Karlsson, J.; Bystrom, P.; Ask, J.; Persson, L.; Jansson, M. Light limitation of nutrient-poor lake ecosystems. Nature 2009, 460, 506–509. [Google Scholar] [CrossRef]
- Rowe, C.; Tipping, E.; Posch, M.; Oulehle, F.; Cooper, M.; Jones, G.; Burden, A.; Hall, J.; Evans, D. Predicting nitrogen and acidity effects on long-term dynamics of dissolved organic matter. J. Environ. Pollut. 2014, 184, 271–282. [Google Scholar] [CrossRef] [PubMed] [Green Version]
- Wallage, E.; Holden, J. Spatial and temporal variability in the relationship between water colour and dissolved organic carbon in blanket peat pore waters. Sci. Total Environ. 2010, 408, 6235–6242. [Google Scholar] [CrossRef] [PubMed]
- Pudeko, A.; Chodak, M. Estimation of total nitrogen and organic carbon contents in mine soils with NIR reflectance spectroscopy and various chemometric methods. J. Geoderma 2020, 368, 114306. [Google Scholar] [CrossRef]
- Cook, S.; Peacock, M.; Evans, C. Quantifying tropical peatland dissolved organic carbon (DOC) using UV-visible spectroscopy. Water Res. 2017, 115, 229–235. [Google Scholar] [CrossRef] [Green Version]
- Avagyan, A.; Runkle, B.; Kutzbach, L. Application of a UV-Vis submersible probe for capturing changes in DOC concentrations across a mire complex during the snowmelt and summer periods. EGU Gen. Assem. 2013, 15, EGU2013-7474-1. [Google Scholar]
- Peacock, M.; Evans, C.D.; Fenner, N. UV-visible absorbance spectroscopy as a proxy for peatland dissolved organic carbon (DOC) quantity and quality: Considerations on wavelength and absorbance degradation. Environ. Sci. Process. Impacts 2014, 16, 1445–1461. [Google Scholar] [CrossRef] [Green Version]
- Mladenov, N.; Zheng, Y.; Miller, P. Dissolved Organic Matter Sources and Consequences for Iron and Arsenic Mobilization in Bangladesh Aquifers. Environ. Sci. Technol. 2010, 44, 123–128. [Google Scholar] [CrossRef]
- Knoepp, J.; Zausen, L.; Jaffe, R. Effects of watershed history on dissolved organic matter characteristics in headwater streams. Ecosystems 2011, 14, 1110–1122. [Google Scholar]
- Emblanch, C.; Blondel, T.; Boyer, D. Punctual and continuous estimation of transit time from dissolved organic matter fluorescence properties in karst aquifers, application to groundwaters of ’Fontaine de Vaucluse’experimental basin (SE France). Environ. Earth Sci. 2012, 65, 2299–2309. [Google Scholar]
- Davydova, A.; Davydov, S.; Spencer, M. Controls on the composition and lability of dissolved organic matter in Siberia’s Kolyma River basin. J. Geophys. Res. B 2012, 117. [Google Scholar] [CrossRef] [Green Version]
- Shreeram, I.; Myron, M.; Patrick, M. Dissolved organic matter (DOM) concentration and quality in a forested mid-Atlantic watershed. Biogeochemistry 2012, 108, 55–76. [Google Scholar]
- Zhi, Q.; Song, H.; Duan, L. Study on Ultraviolet Absorption Spectra of Dissolved Organic Matter in Qixing Wetland of Liaohe Nature Reserve. J. Environ. Eng. 2014, 4, 35–39. [Google Scholar]
- Yuan, T. A Water Monitoring and Early Warning System of COD Using UV-Vis Spectroscopy. Int. J. Environ. Monit. Anal. 2015, 3, 298–303. [Google Scholar] [CrossRef]
- Finger, N. Dissolved Organic Matter (DOM) Concentrations and Quality for Watershed Compartments in a Forested Mid-Atlantic Watershed. Ph.D. Thesis, University of Delaware, Newark, DE, USA, 2010. [Google Scholar]
Figure 1.
Methods for determining water quality.

Figure 2.
Steps for determining water quality parameters based on UV-Vis spectroscopy (Note: The polluted water from left to right is eutrophication water body, factory sewage, domestic wastewater and marine pollution. The instrument used to collect spectral data is UV-2450. Savitzky–Golay smooth filter (SG), Wavelet transform (WT), Standard normal variate (SNV), Multiple scattering correction (MSC), Principal component analysis (PCA), Successive projections algorithm (SPA), Genetic algorithm (GA), Competitive adaptive reweighted sampling (CARS), Particle swarm optimization (PSO), Random frog (RF) algorithm, Partial least squares regression (PLSR), Support vector machine regression (SVR), Extreme learning machine (ELM) model, Principal component regression (PCR), and Stepwise regression (SR).

Figure 3.
Schematic diagram of thr Lambert-Beer law.

Figure 4.
The steps of establishing a prediction model of water quality.

Figure 5.
Reaction mechanism of nano gold in detecting heavy metal ions.

Figure 6.
Schematic diagram of water quality parameter monitoring and an early warning system.

Figure 7.
Process of using multi-source data fusion to detect water quality parameters.


Table 1.
Absorption spectrum range and substance characteristics of various substances.
| Wavelength Range | Material Characteristics |
|---|---|
| 200–220 nm | nitrate, nitrite |
| 220–250 nm | conjugated diene, unsaturated aldehyde, unsaturated ketone |
| 250–380 nm | organic matter |
| 380–750 nm | turbidity |
Table 2.
Algorithms for reducing spectral data noise.
| Pretreatment Method | Algorithm Principle | Advantages | Related Literature |
|---|---|---|---|
| Savitzky–Golay (SG) smooth filter | Polynomial smoothing algorithm based on the least squares principle. | Improve smoothness of spectrum to reduce noise interference. | Savitzky Abraham (1964), Zhang Liu (2020), Li Jingwei (2018), Wu Yuanqing (2011), Kang Bei (2018), Cao Hong (2014), Xue Haifeng (2019) Chen Xiaowei (2019). |
| Wavelet transform (WT) | The wavelet coefficients larger than the threshold are generated by signal, and the ones smaller than the threshold are generated by noise. | It can effectively solve the interference problem of high frequency noise of spectral data. | Li Guan (2018), Wu Decao (2016), Zhao Mingfu (2018), Li Jingwei (2018), Li Guan (2019), Kang Bei (2018), Xue Haifeng (2019). |
| Standard normal variate (SNV) | The calculation processes a spectrum based on the row of the spectrum array. | To eliminate the influence of the size of solid particles, surface scattering and the change of optical path on the spectrum. | Zhang Liu (2020), Li Jingwei (2018), Wu Yuanqing (2011), Kang Bei (2018), Wang Xiaoming (2016), Cao Hong (2014). |
| First-order differential Second-order differential | A simple derivative method of discrete spectrum. | Eliminating the interference of baseline and other background, overlapping peaks, improving resolution and recognition. | Li Jingwei (2018), Kang Bei (2018), Wang Xiaoming (2016), Cao Hong (2014), Li Xinxing(2020), Wang Jiamin (2019), Chen Xiaowei (2019). |
| Multiple scattering correction (MSC) | The average spectrum is regarded as the standard spectrum, and each sample spectrum is regressed with the standard spectrum. | It can effectively eliminate the influence of scattering and enhance the spectral absorption information related to the content of components. | Zhang Liu (2020), Li Jingwei (2018), Wang Xiaoming (2016), Cao Hong (2014). |
| Two dimensional recombination Dynamic pane | The pane slides in the coefficient matrix calculates the denoising threshold by using a wavelet coefficient, and constructs a denoising threshold vector. | It removes the nonstationary noise, retains the detail information, and improves the measurement accuracy. | Wu Decao (2016). |
| Compressed sensing algorithm | The non adaptive linear projection of the collected signal is used to reconstruct the original signal through the optimization algorithm. | The complex selection of wavelet threshold is avoided. | Zhao Mingfu (2018). |
Table 3.
Algorithms for characteristic wavelength extraction of spectral data.
| Characteristic Wavelength Extraction Algorithm | Algorithm Principle | Advantages and Characteristics | Disadvantages | Related Literature |
|---|---|---|---|---|
| Principal component analysis (PCA) | The n-dimension feature is mapped to the k-dimension (k < n), which is a new orthogonal feature. | Reduces the algorithm calculations, removes noise, has no parameter limitation. | Does not have good nonlinear dependence, Does not effectively estimate the number of potential hidden variables. | Hou Dibo (2013), Li Guan (2018), Hou Dibo (2015), Tang Bin (2015), Xue Haifeng (2019) |
| Successive projections algorithm (SPA) | A forward variable selection algorithm minimizes the collinearity of vector space. | Eliminates redundant information in the original spectral matrix. | The selection of the initial band is random, which makes the subsequent band have more redundant information. | Zhang Liu (2020), Cao Hong (2014), Li Xinxing (2020). |
| Genetic algorithm (GA) | A search algorithm based on natural selection and a population genetic mechanism. | Has low complexity, few parameters, high efficiency, and is easy to realize. | Limited exploration ability, it is too easy to converge on the local optimal solution. | L Jiao (2014), Hu Yingtian (2016), |
| Competitive adaptive reweighted sampling (CARS) | Through the search method and the criteria of evaluating the importance degree of variables, the optimal subset of variables can be obtained. | The calculation speed is fast while the number of wavelengths is small. | Excessive emphasis on the cross-validation results of the calibration set is prone cause inconsistencies between the calibration set and the validation set. | Zhu Hongqiu (2019), Wang Xiaoming (2016). |
| Particle swarm optimization (PSO) | A random particle is initialized with a random solution, and then the optimal solution is found through an iterative process. In each iteration, the particle tracks two extremum to update itself. | There is no crossover or mutation operation, few parameters need to be adjusted, and the structure is simple. | It is easy to fall into the local optimum, resulting in low convergence accuracy. Discrete and combinatorial optimization problems are difficult to solve. | Tang Bin (2015). |
| Random frog (RF) algorithm | Bionic optimization algorithm based on swarm intelligence. | This method is easy to understand and is robust. | The local exploration ability is poor, The optimization result is not ideal, and the convergence is slow | Alam F (2020), Wang Xiaoming (2016). |
Table 4.
Modeling algorithms of spectral data.
| Modeling Algorithm | Algorithm Principle | Advantages | Disadvantages | Literature |
|---|---|---|---|---|
| Partial least squares regression (PLSR) | Based on the criterion of covariance maximization, the regression equation between variables is established. | It is simple to calculate, has high prediction accuracy, and is easy to use for qualitative interpretation. | It has a large fitting error and less independent variable deviation information. | Hou Dibo (2013), Tang Bin (2015) Peter Skou (2017), Cook S (2017). |
| Support vector machine regression (SVR) | Linear regression is realized by constructing a linear decision function in high dimensional space after dimension increasing. | It can solve high dimensional feature data and has a large number of kernel functions. | It is not suitable for a large sample size and a large calculation amount. | Wu Yuanqing (2011), Chen Ying (2019), Lang Rongqing (2012), Laura Dioan (2012), Lv Meng (2017). |
| Extreme learning machine (ELM) | A machine learning method based on a feed-forward neural network. | The learning speed is fast and easy to use to obtain results. | It is easy to over fit and has poor robustness. | Wang Xiaoming(2016). |
| Principal component regression (PCR) | After multi-collinearity is eliminated by using PCA, principal component variables are taken as independent variables, and the original variables are replaced with the new model based on the score coefficient matrix. | It solves multi-collinearity problems and provides precise results. | It is difficult to use to solve nonlinear data, while the calculation process is complex. | Xue Haifeng (2019), Li Xinxing (2020). |
| Stepwise regression (SR) | An independent variable selection method for a linear regression model. | This method has high prediction accuracy, is easy to operate, and retains significant variables. | The regression results are affected by the number of samples used. | Li Xinxing (2020). |
© 2020 by the authors. Licensee MDPI, Basel, Switzerland. This article is an open access article distributed under the terms and conditions of the Creative Commons Attribution (CC BY) license (http://creativecommons.org/licenses/by/4.0/).
Share and Cite
MDPI and ACS Style
Guo, Y.; Liu, C.; Ye, R.; Duan, Q. Advances on Water Quality Detection by UV-Vis Spectroscopy. Appl. Sci. 2020, 10, 6874. https://0-doi-org.brum.beds.ac.uk/10.3390/app10196874
AMA Style
Guo Y, Liu C, Ye R, Duan Q. Advances on Water Quality Detection by UV-Vis Spectroscopy. Applied Sciences. 2020; 10(19):6874. https://0-doi-org.brum.beds.ac.uk/10.3390/app10196874
Chicago/Turabian StyleGuo, Yuchen, Chunhong Liu, Rongke Ye, and Qingling Duan. 2020. "Advances on Water Quality Detection by UV-Vis Spectroscopy" Applied Sciences 10, no. 19: 6874. https://0-doi-org.brum.beds.ac.uk/10.3390/app10196874
Note that from the first issue of 2016, this journal uses article numbers instead of page numbers. See further details here.