Review

Electrical Resistivity and Electrical Impedance Measurement in Mortar and Concrete Elements: A Systematic Review

by
Gloria Cosoli
1,*,
Alessandra Mobili
2,*,
Francesca Tittarelli
2,
Gian Marco Revel
1 and
Paolo Chiariotti
3
1
Department of Industrial Engineering and Mathematical Sciences, Università Politecnica delle Marche, 60131 Ancona, Italy
2
Department of Materials, Environmental Sciences and Urban Planning, Università Politecnica delle Marche, INSTM Research Unit, 60131 Ancona, Italy
3
Department of Mechanical Engineering, Politecnico di Milano, 20156 Milan, Italy
*
Authors to whom correspondence should be addressed.
Submission received: 6 December 2020 / Revised: 16 December 2020 / Accepted: 18 December 2020 / Published: 21 December 2020
(This article belongs to the Special Issue Non-destructive Testing in Civil Engineering)

Abstract

:

Featured Application

Systematic review of electrical resistivity and impedance measurements methods and applications on cement-based materials.

Abstract

This paper aims at analyzing the state-of-the-art techniques to measure electrical impedance (and, consequently, electrical resistivity) of mortar/concrete elements. Despite the validity of the concept being widely proven in the literature, a clear standard for this measurement is still missing. Different methods are described and discussed, highlighting pros and cons with respect to their performance, reliability, and degree of maturity. Both monitoring and inspection approaches are possible by using electrical resistivity measurements; since electrical resistivity is an important indicator of the health status of mortar/concrete, as it changes whenever phenomena modifying the conductivity of mortar/concrete (e.g., degradation or attacks by external agents) occur, this review aims to serve as a guide for those interested in this type of measurements.

1. Introduction

An effective maintenance strategy of concrete structures asks for a strong involvement of Structural Health Monitoring (SHM) because this makes it possible to minimize the required interventions and to optimize their cost-effectiveness. However, despite, in developed countries, the maintenance and repairing costs of concrete structures being estimated at around 3–4% of gross national product [1], at present, no regular monitoring techniques are widely applied. Inspections are preferred, even if their efficiency is more limited than the one provided by monitoring, which continuously provides data and information on the health status of the target structure. Furthermore, it is worth noting that the service life of a non-temporary concrete structure is quite long: for a common structure, it accounts to 50 years, for a strategic structure (e.g., a monument, a bridge, or other civil engineering structures), at least 100 years [2].
Since non-destructive techniques (NDTs) can provide data on the structure without the necessity of sampling the structure (therefore exposing the structure itself to higher risks of damage), they are preferred for SHM. Among NDTs, the measurement of electrical resistivity of concrete is gaining wider and wider consensus among the scientific and technical community. Indeed, the technique is easy to adopt, tests can be performed rapidly, and several factors related to concrete durability [3,4,5] can modify the resistivity of concrete, like water and chlorides penetration, carbonation, or presence of cracks.
Electrical resistivity (ρ [Ω∙m]) is the ability of a material to oppose the flow of electric current. The electrical resistivity of concrete varies from 101 to 105 Ω∙m, mainly in relation to its moisture content and composition [6,7,8,9,10]. The composition includes cement type (fineness, composition, and soluble salts content), water to cement (w/c) ratio, type and size of aggregates, and presence of additions, either conductive or not. Indeed, as aggregates are concerned, they act as an obstacle in the electric current path, hence increasing the electrical resistivity of concrete [11]. Electrical resistivity depends on cement paste microstructure, characterized by the volume, the size, and the interconnection of pores, besides the pore solution, where different salts are dissolved, releasing ions (mainly K+, Na+, OH, and, in smaller extent, also Ca2+ and SO2−) that enable conduction [12]. Porosity is governed by the w/c ratio: the higher the w/c ratio, the higher the total porosity [13] and, consequently, the lower the electrical resistivity [14,15]. However, in highly saturated concrete, the effect of w/c ratio on electrical resistivity is less significant [6,16] because moisture (thus water) plays a major role in defining concrete electrical properties. Supplementary cementitious materials (e.g., fly ash, silica fume, and ground granulated blast furnace slag (GGBFS), just to cite those mostly used) reduce both pores size and volume. A refinement of the pore structure increases ρ. Indeed, these mineral additions (e.g., blast-furnace slag [17], fly ash [18], and silica fume [19]), are also generally added to release more durable concretes [20]. On the other hand, if conductive fillers or fibers are added to the mix-design, electrical resistivity decreases, and the material conduction partially moves from electrolytic to electric [21,22,23]. The electrolytic conductivity is related to mobile ionic species that form when water and binder are mixed together; concrete can be thought of as an electrolytic conductor, since the current mainly passes through the pore solution [24]. On the other hand, the electronic conductivity is related to the transportation of free electrons through the conductive phase (carbon or metal fillers/fibers). Contrarily, non-conductive polymeric fibers seem not to have a significant effect on the matrix electrical resistivity [22]. The literature reports some reference values of electrical resistivity related to cement type and exposure conditions [25,26]; however, it is worth considering that each mix-design would provide different electrical resistivity values.
In reinforced concrete structures (RCS), another parameter affecting electrical resistivity is the short circuit effect related to the embedded steel reinforcement [27]; in fact, reinforcement, being metallic, attracts the electric current [28], distorting the measurement result. Besides the intrinsic characteristics of concrete, also the environmental conditions, particularly temperature (T) and relative humidity (RH) [29], impact concrete electrical resistivity. Concerning T, a higher value increases the ions mobility, making ρ decrease. Concerning RH, since water has a good electrical conductivity, the material electrical conductivity increases with its saturation degree. In this regard, also aging of concrete influences the electrical resistivity, since it gives a reduction in the moisture content due to the continuous hydration of the cement paste, which modifies the paste microstructure.
Electrical resistivity also correlates with concrete degradation status, represented by different durability indicators as saturation degree, porosity, and chloride penetration [30]; electrical resistivity of concrete makes it possible to detect the penetration of aggressive agents prior to the onset of the degradation process [31]. If porosity is high, permeability increases and, consequently, so does the ingress of aggressive substances. This ingress mines the integrity of concrete and reinforcements, especially if the pore interconnection is high. In addition, thanks to the piezoresistive behavior of concrete (piezo-resistivity is a physical characteristic of electrically-conductive materials, whose electrical resistivity changes with deformations [32]), electrical resistivity measurements make it possible to monitor the stress/strain behavior of concrete [33].
The electrical resistivity of concrete can be measured by direct current (DC) or alternating current (AC). The type of current used (DC or AC) and the electrodes configuration (e.g., electrode spacing [34,35]) adopted influence the measurement result, especially in terms of accuracy. A minimum of two electrodes is needed to excite the material with an electric current (or potential) and to measure the corresponding electrical potential difference (or current). Another configuration can adopt 4-electrode measurement points, separating excitation and measurement electrodes in order to avoid sharing electric current and potential. Also, the electrodes positioning, which the current path depends from [36], heavily affects the measurement results. Different types of electrodes are used in the literature, such as wires, plates, meshes, bars, tapes, and conductive paints.
However, one of the major problems regarding electrical resistivity measurement in concrete is that no widely accepted standards are currently available, and many different methodologies are reported in the literature. Therefore, this review paper aims at providing the reader with an overview of the different approaches suggested by the scientific community when addressing electrical resistivity measurements, as well as highlighting some issues that may be tackled by the experimenter as well as the real missing item related to the topic, i.e., measurement uncertainty. Also, several target applications of this measurement method are discussed, with a focus on inspection and monitoring of cement-based structures. Finally, suggestions on how to perform electrical resistivity/impedance measurements, either at lab-scale or in-field, are provided.

2. Electrical Resistivity/Impedance Measurement: Is It Really that Simple?

2.1. DC Measurement of Electrical Resistivity

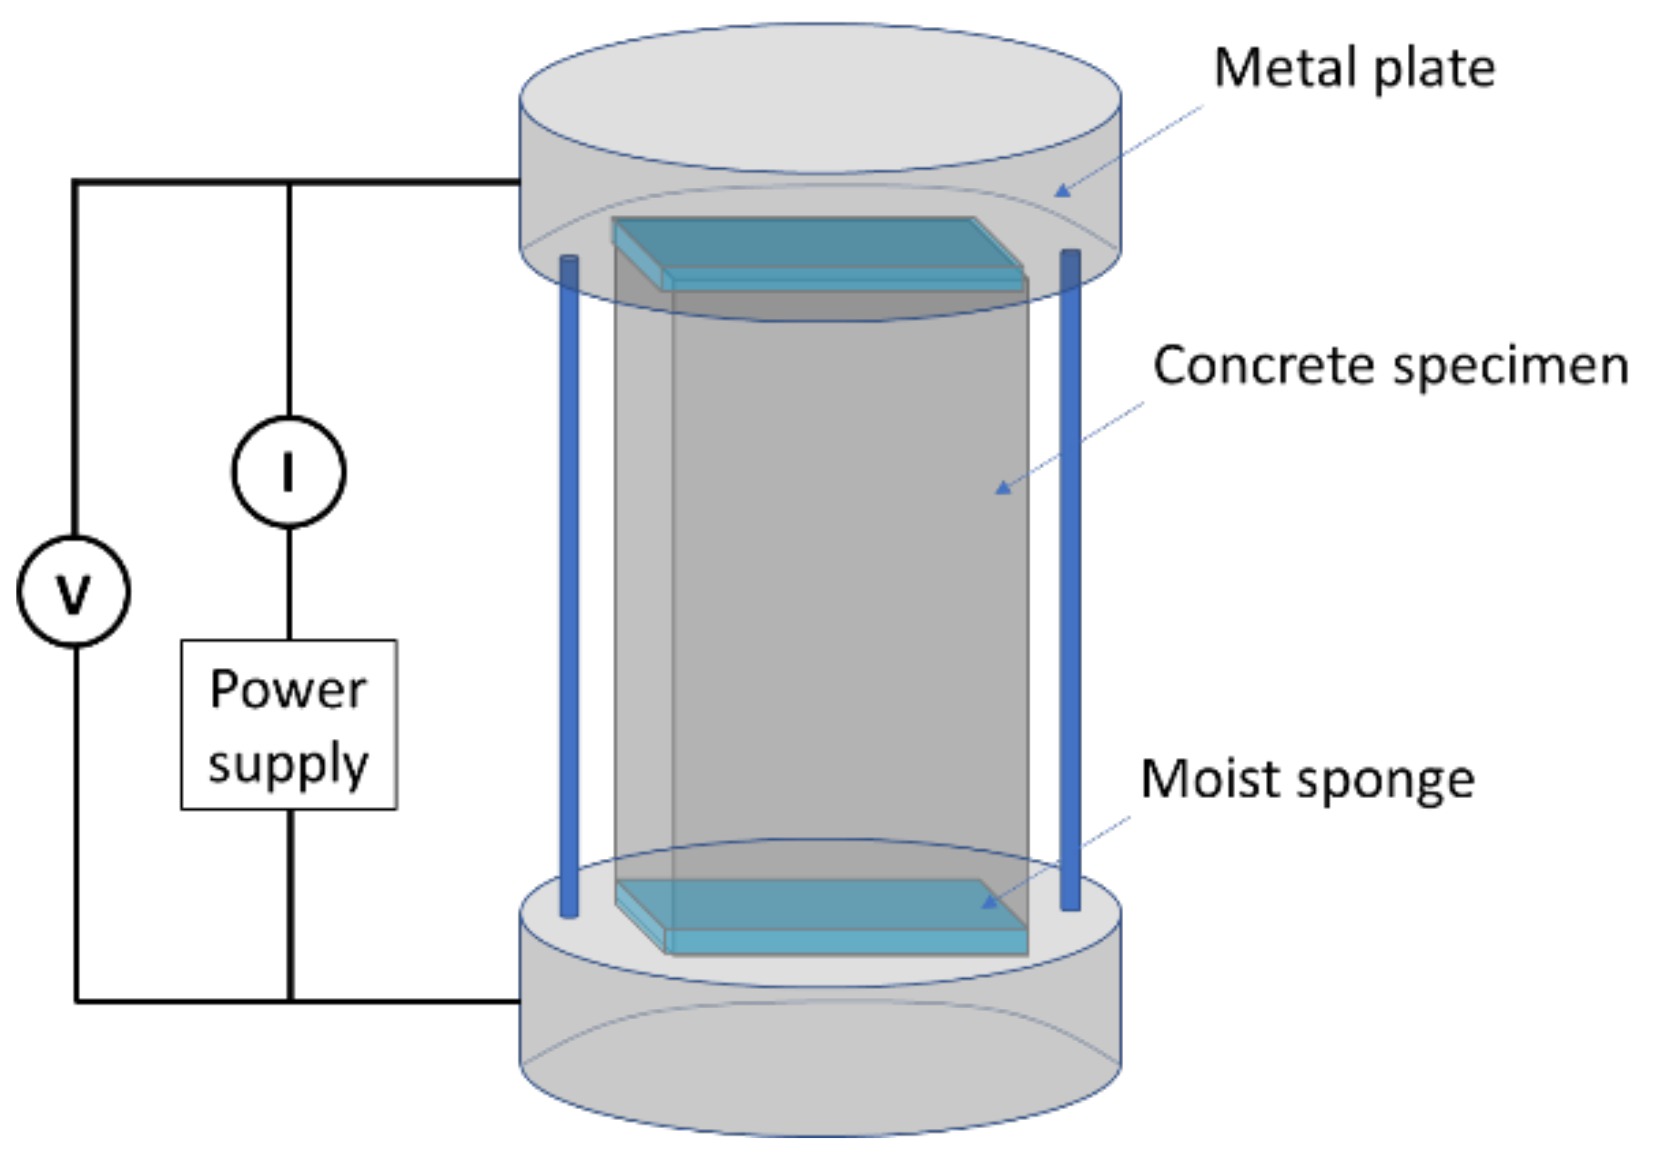
2.1.1. 2-Electrode Configuration

The two-point probe method, also known as uniaxial method, enables the measurement of bulk electrical resistivity. The specimen is placed between two electrodes (commonly parallel metal plates) with moist sponge contacts, then a DC electric current is injected and the consequent potential drop is measured (Figure 1).
The standard to perform electrical resistivity measurements with the uniaxial method is the ASTM C1760 “Standard test method for bulk electrical conductivity of hardened concrete” [37]. The standard foresees the use of saturated cylindrical (100 mm diameter, 200 mm length) hardened concrete specimens, with a standard 28-day curing (56-day curing in the presence of supplementary cementitious materials, such as GGBFS or fly ash, since they prolong the time to dry). A 60 V DC potential difference is applied and the electric current is measured after 1 min; therefore, the electrical conductivity is obtained according to Equation (1):
σ = k · I 1 V · L D 2 mS / m
where:
  • I1 is the electric current at minute 1 (±5 s), in mA
  • V is the applied potential difference, in V
  • L is the average length of the sample, in mm
  • D is the average diameter of the sample, in mm
  • K is the conversion factor, equal to 1273.2
Literature reports the use of different electrode configurations as well as different geometrical configurations of the specimen with respect to the standard (see Table 1). Indeed, the standard is rarely followed: in the last 20 years, no study has been carried out in compliance with ASTM C1760, probably because authors prefer to use their own instrumentations and to prepare specimens with molds available in their laboratories, adopting the measurement configuration that better fits their study objectives.
Stainless steel meshes are often used as electrodes. D’Alessandro et al. [38] used a wire net as electrode in concrete cubic specimens. These specimens would have been embedded in concrete structures as distributed sensors for SHM purposes. Zhang et al. [39] used the same configuration but in concrete prisms manufactured with carbon nanotubes and nanocarbon black filler. Ding et al. [40] realized stainless steel gauzes to be embedded in cementitious prisms, whereas Dong et al. [41] inserted these electrodes in concrete prisms reinforced with super-fine stainless wires.
Also, copper is used for the electrodes; Melugiri-Shankaramurthy et al. [42] used copper mesh electrodes embedded in cubic cement paste specimens. Huang et al. [43] used copper tapes, glued with silver conductive epoxy around the surface of dog-bone paste specimens manufactured with fly ash and carbon black. Wen and Chung [44] used silver paint and copper wires as electrodes in prismatic specimens. Brass-made wires were used as electrodes by Chen et al. [45] in both prismatic and cubic specimens.
Plates are another type of electrodes used in the literature. Lim et al. [46] embedded stainless steel plate electrodes in prisms. Dehghanpour and Yilmaz [47] guaranteed a good electric and mechanical contact between metal plate electrodes and specimens surface by means of a cloth moistened with NaCl solution and a clamp, testing concrete specimens manufactured with conductive carbon fibers different in terms of shape and dimensions.

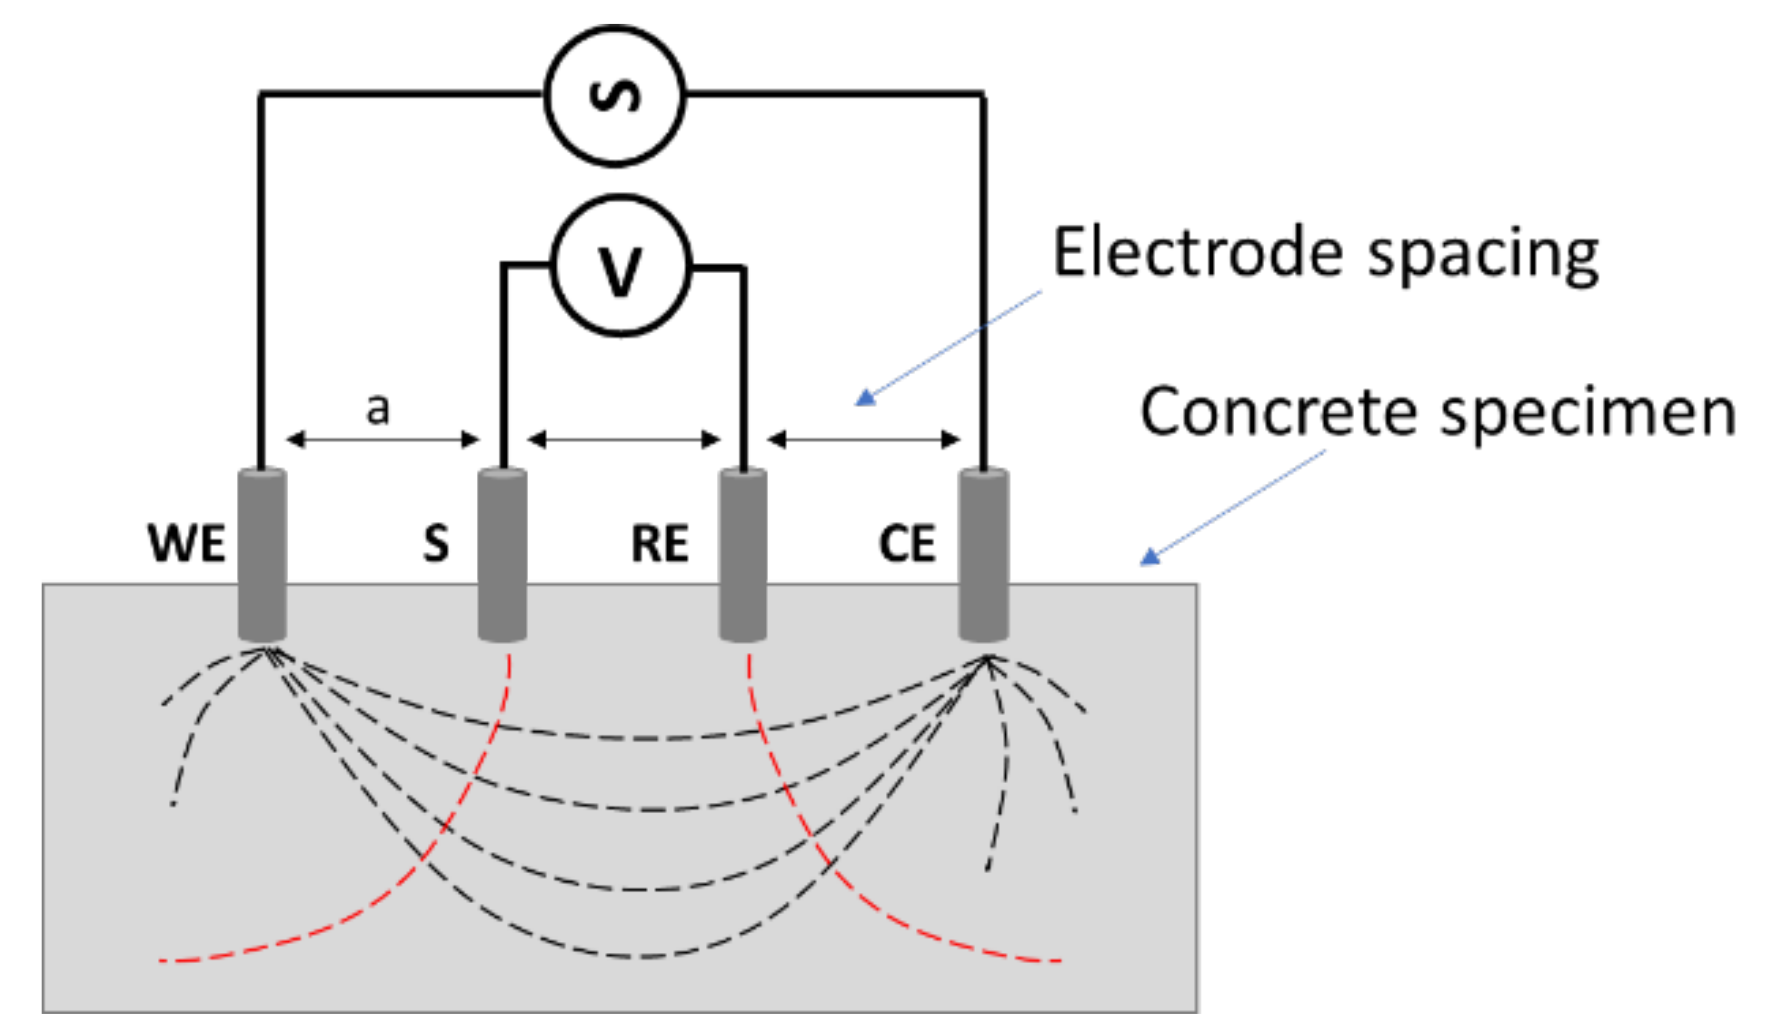
2.1.2. 4-Electrode Configuration

In the 4-electrode configuration, excitation and measurement electrodes are distinct. In particular, the two external electrodes (namely Working Electrode, WE, and Counter Electrode, CE) are used to inject the excitation electric signal (current or potential difference), whereas the two internal ones (namely Sensing Electrode, SE; and Reference Electrode, RE) are used to measure the electrical response (potential difference or current). Different types of electrodes and specimens are used in the literature (see Table 2).
Mesh electrodes were often used in the literature, manufactured with different materials: stainless steel [48,49], titanium [22], and titanium platinum-coated [50]. Also, copper is widely used in different forms: wire mesh [33,51,52], tapes [53,54] and loops [55]; silver paint is employed to realize electrodes on specimens surface [56,57,58,59,60,61,62,63,64], e.g., in the form of silver paint stripes perpendicular to the length of the specimen or combined with copper wires. Other types of electrodes are brass wires (with carbon powder interposed between electrodes and paste, to ensure a good electric contact) [65,66] and small pieces of reinforcing rebars plus Ag/AgCl reference electrodes (with wet sponges guaranteeing a good electric contact) [27].
Table 2. DC measurements with 4-point probe method.
ReferenceSpecimensElectrodesMaterialAdditions
Belli et al. [48]Prisms: 40 × 40 × 160 mmSteel meshes (30 × 30 mm immersed, 40 mm spacing)MortarGraphene nanoplatelet filler and/or carbon fibers (virgin or recycled)
Liu and Wu [49]Cylinders: 150 mm (diameter) × 130 mm (height)Stainless steel netsConcreteLimestone powder, graphite powder, and carbon fibers
Berrocal et al. [22]Prisms: 40 × 40 × 160 mmTitanium meshes (40 × 60 × 0.7 mm) and copper wires (at 30 mm from meshes)Mortar-
Boulay et al. [50]Cylinders: 110 mm (diameter) × 220 mm (height)Titanium platinum-coated gridsConcrete-
Han and Ou [67]PrismsGauzes (2.03 × 2.03 mm opening)PasteCarbon fibers and carbon black
Teomete and Kocyigit [51]Cubes: 50 mm (side)Copper wire meshesPasteSteel fibers
Lee et al. [33]Cubes: 50 mm (side)Copper electrodes (20 × 75 × 0.3 mm, 10 mm spacing)PasteSilica fume, carbon fibers, and multi-walled carbon nanotubes
Wen and Chung [56,58,59]Dog bones: 30 × 20 mm (narrow part)
Cubes: 51 mm (side)
Silver paint and copper wiresPaste-
Cao and Chung [60]Cylinders: 125 mm (diameter) × 250 mm (height)Silver paint and copper electrodesConcrete-
Chen and Liu [61]Prisms: 40 × 40 × 160 mmCopper wires and silver paintConcrete-
Cao and Chung [62,63]Prisms: 150 × 12 × 11 mmSilver paintPasteFly ash or silica fume; coke powder
Cao and Chung [64]Prisms: 160 × 40 × 40 mm
Cubes: 51 mm (side)
Silver paintPasteCarbon fiber or carbon black
Wen and Chung [57]Prisms: 150 × 12 × 11 mm
Cubes: 51 mm (side)
Silver paint and copper wiresPasteCarbon fibers
Wang et al. [65,66]Prisms: 25 × 25 × 70 mmBrass wires and carbon powderPasteGround granulated blast-furnace slag
Luo and Chung [52]Mortar strips (90.0 × 14.0 × 13.3 mm and 95.0 × 14.2 × 13.9 mm) overlapped at 90°Copper wires fixed with silver paintMortar-
Nguyen et al. [53,54]Bell-shaped (25 × 50 mm rectangular section)Copper tapes and silver pasteConcrete-
Han et al. [55]Prisms: 20 × 20 × 40 mmCopper loopsPaste-
Garzon et al. [27]Cylinders: 150 mm (diameter) × 300 mm (length)
Prisms: 40 × 40 × 160 mm
Reinforcing steel (external electrodes) and Ag/AgCl reference (internal) electrodesConcrete-

2.2. AC Measurement of Electrical Resistivity

With respect to DC measurements, AC measurements of electrical resistivity give electrical impedance as result value, which includes a real part (R, electrical resistance) and an imaginary part (X, electrical reactance). It is worth noting that only electrical resistance represents the ionic movement in the pore network and is related to concrete durability [22]. Recent studies [68] reported that the real part of impedance can be correlated to degradation phenomena in cement-based materials.

2.2.1. 2-Electrode Configuration

The measurement setup defined by the uniaxial method of Section 2.1.1 can be also adopted with AC excitation (see Table 3). However, there are no general statements on optimal frequency to be used and both sine and square waves are deployed. In fact, it is worth noting that materials electrical properties are frequency-dependent [69] and, consequently, the measurement frequency deeply affects the results.
AASHTO TP 119 [70] suggests the use of an AC 60 V voltage, a testing period of 6 h, and a 100 × 50 mm (or 150 × 75 mm) cylindrical specimen, where two stainless steel plates connected to the Wenner probe tips (short-circuiting WE and SE electrodes and RE and CE electrodes, respectively) are applied as electrodes. As for uniaxial test of ASTM C1760 [37], this procedure is not widely adopted, and everyone prefers to set up its measurement bench configuration.
Electrodes in pin/bar forms are often used for this configuration: stainless steel pins [71], also covered with heat-shrink tubes apart from the 10 mm tip [72], brass electrodes [73] or screws can be used to improve the contact between electrodes and material, at different depths to obtain information on different layers [74]. Also, gauzes can be used, in different materials, such as copper (with water-saturated paper towel strips to ensure a good electric contact between electrodes and specimen surface) [75], titanium [22], stainless steel [21], and iron [76]. Plate electrodes were employed [77], maintaining the contact through different methods: clamps [78], wet sponges [11], absorbent cloth with a soap diluted solution by placing 5 kg on the top face of the specimen [79], sponges saturated with Ca(OH)2 solution [80], or saturated with 20 wt.% NaCl solution [81], applying an external pressure of 6 kPa on the top electrode to improve the electrode/specimen contact [82]. Chiarello and Zinno [23] used G-clamps or wood cubes to ensure a good contact between electrodes and specimens; furthermore, they spread a paste of ethyl alcohol and carbon dust on the specimen ends to apply the excitation signal. Other electrodes used in the literature are stainless steel circular electrodes [83,84], red-copper electrodes with thin absorbent sponges to guarantee the contact [85], and graphite electrodes [86].
Commercial systems are also used to measure electrical resistivity. For example, Carsana et al. [87] used a commercial conductivity meter. As electrodes, parallel wires of mixed metal oxide activated titanium were embedded in the concrete specimens. Ghosh and Tran [88] employed the commercial Merlin meter (working at 325 Hz) to perform electrical resistivity measurement in cylindrical concrete specimens (100 mm diameter, 200 mm height). The electric contact between the clamp electrodes and the specimen faces was guaranteed by means of interposed sponges. Finally, Velay-Lizancos et al. [89] used an analogue sensor (65 × 8 × 3 mm) embedded in prismatic concrete specimens (300 × 200 × 110 mm) to measure temperature and electrical resistivity at 100 kHz.
Table 3. AC measurements with 2-point probe method.
ReferenceSpecimensElectrodesMaterialAdditionsFrequency
Kim et al. [72]Cubes: 50 mm (side)Stainless steel pins (2.4 mm diameter, 10 mm electrode spacing), embedded for 30 mmMortar-20 Hz–1 MHz
Mason et al. [71]Prisms: 25 × 25 × 100 mmStainless steel electrodes (20 × 30 × 0.5 mm)PasteSteel/carbon fibers5 mHz–10 MHz
Osterminski et al. [73]Cubes: 150 mm (side)Brass electrodes (6 mm diameter), at a center-to-center distance of 50 mmConcreteSCMs107, 108, and 120 Hz
Polder and Peelen [74]Prisms: 100 × 100 × 300 mmStainless steel screws, at depths of 10 mm and 50 mmConcrete-120 Hz
Peled et al. [75]Prisms: 25 × 180 × 4(8) mmCopper gauze strips (18 × 18 mm), with 63 mm spacingPaste-0.5 Hz–10 MHz
Berrocal et al. [22]Prisms: 40 × 40 × 160 mmTitanium meshMortarSteel fibers100 mHz–1 MHz
Donnini et al. [21]Prisms: 40 × 40 × 160 mmStainless steel netsMortar-10 Hz–1 MHz
Zeng et al. [76]-Iron netsConcrete--
Rovnaník et al. [78]Prisms: 40 × 40 × 160 mm
Cubes: 100 mm (side)
Brass plates (30 × 100 mm)
Gauzes (2.5 mm mesh size)
Concrete-40 Hz–1 MHz
Hou et al. [11]Cylinders: 100 mm (diameter) × 200 mm (height)Stainless steel platesConcrete-1 kHz, according to ASTM C1760 [37]
McCarter et al. [77]Cubes: 50 mm (side)Stainless steel plates (50 × 50 mm)Paste-1–100 kHz
McCarter et al. [80]Cubes: 150 mm (side)Stainless steel plates (with a polymethyl methacrylate backing)Concrete-1 kHz
Wang et al. [90]Cylinders: 50 mm (diameter) × 100 mm (height)Stainless steel platesMortar-1 kHz
Van Noort et al. [79]Cubes: 150 mm (side)Stainless steel platesConcrete-1 kHz
Sengul et al. [5]Cylinders: 100 mm (diameter) × 200 mm (height)Steel platesConcreteFly ash, GGBFS, silica fume, ad natural pozzolan1 kHz (correlation coefficient R = 0.999 when comparing the results with those obtained in compliance with ASTM C1760 [37])
Chiarello and Zinno [23]Prisms: 40 × 40 × 160 mmCopper sheets (0.3 mm thickness, 40 × 18 mm transverse dimensions, 8 mm set in the composite); lead plates (1 mm thickness, with 40 × 50 mm transverse dimensions)Concrete-100 kHz
Zhu et al. [91]Prisms: 40 × 40 × 160 mmSpecial metal electrodes resistant to high alkaline environmentsMortar and engineered cementitious composite (ECC)Fly ash and polyvinyl alcohol (PVA) fibers0.01 Hz–10 kHz
Sato and Beaudoin [83]Cylinders: 9.64 mm (diameter) × 19.05 mm (length)Stainless steel discs with soldered wiresPaste-100 Hz–5 MHz
Perron and Beaudoin [84]Cylinders:8 mm (diameter) × 16 mm (height)Stainless steel electrodes with soldered wiresPaste--
Zhou et al. [85]Cylinders: 150 mm (diameter) × 400 mm (height)Red copperConcrete-500 Hz
Díaz et al. [86]Cylinders: 200 mm (diameter) × 90 mm (length)Graphite electrodesMortar-100 Hz–40 MHz
Carsana et al. [87]-Parallel wires of mixed oxide activated titaniumConcrete--
Ghosh and Tran [88]Cylinders: 100 mm (diameter) × 200 mm (height)External clampConcrete-325 Hz
Velay-Lizancos et al. [89]Prisms: 300 × 200 × 110 mmCommercial analogue sensor (65 × 8 × 3 mm)Concrete-100 kHz

2.2.2. 4-Electrode Configuration

The AC 4-point probe method, also known as Wenner array method, derived from soil mechanics to evaluate the possible corrosion of buried structures, is one of the most applied methodologies for field concrete structures [35,92]. Four electrodes equally spaced are used, guaranteeing their electric contact with the surface e.g., by water pre-wetting, contact graphite gel or pastes; the two internal electrodes measure the voltage created by the application of an electric current between the two external electrodes (Figure 2).
The frequency range commonly used is wide (Table 4). The Wenner-array method appears a suitable and reliable test method for in-field measurements and performance-based quality control of concrete durability [4]; the electrical resistivity measured by this approach is the average electrical resistivity of a hemisphere of radius equal to the electrode spacing (a), as reported in Equation (2):
ρ = 2 π a V I
This relationship is valid with the hypothesis of homogeneous medium and semi-infinite dimensions. In real conditions and with the use of surface electrodes, the apparent resistivity (ρa) is measured; in fact, because of non-homogeneity and finite geometric dimensions of the specimen under test, a cell constant correction factor (K) needs to be applied. The correction factor K can be obtained in two different ways: from theoretical considerations or from calibration by means of standard concrete samples or electrolytes of known resistivity. The relationship between the electrical resistivity and its apparent value is reported in Equation (3):
ρ = ρ a K
There are no widely accepted standards for the measurement of electrical resistivity using a Wenner array (ASTM G57-06 “Standard Test Method for Field Measurement of Soil Resistivity Using the Wenner Four-Electrode Method” [93] is used in soil mechanics). A Spanish standard (UNE 83988-2 “Concrete durability. Test methods. Determination of the electrical resistivity. Four points or Wenner method”) suggests the use of cylindrical samples (100 mm diameter, 200 mm height); measurements should be carried out in saturated surface dry (s.s.d.) conditions, in order to consider the means homogeneous (since the inter-particle voids are water-saturated) [94]. Another provisional standard, namely AASHTO T 358 [95], was made in 2015 by the Department of Transportation (DoT) community of the American Association of State Highway and Transportation Officials (AASHTO); this standard suggests to apply current (flat-topped trapezoidal wave at approximately 13 Hz and a nominal peak-to-peak voltage of 25 V) by a Wenner probe located on the specimen surface (electrode spacing of 38 mm) and measure the voltage drop to calculate the impedance of the specimen. Tibbets et al. [96] applied this standard to cylindrical specimens (102 mm diameter, 205 mm height) containing different SCMs. They found a very strong linear correlation with the bulk resistivity measured according to the AASHTO TP119 “Standard Method of Test for Electrical Resistivity of a Concrete Cylinder Tested in a Uniaxial Resistance Test” [70] (y = 1.93x, with R2 = 0.99). Also Spragg et al. [81] performed measurement according to AASHTO T 358, using stainless steel plate electrodes, ensuring a good electric contact with the specimen by lime-water saturated sponges. They compared their results with the surface resistivity method described in FM 5-578 [97], obtaining very good correlation (R2 = 0.9986); moreover, they observed variation coefficients of approximately 4% and 13% for intra- and inter- operator measurements, respectively.
A resistivity profile can be obtained by moving the electrodes along a horizontal section at constant depth, whereas a vertical electric sounding can be achieved by progressively widening the electrode spacing and keeping the quadrupole center fixed. By realizing more resistivity profiles at increasing depths, a pseudo-section of the apparent resistivity can be obtained through inversion algorithms: this is known as electrical resistivity tomography [98]. A system suitable for this aim was employed by Alhajj et al. [99], using a multi-electrode probe consisting of 14 electrodes equally spaced at intervals of 20 mm; four different electrode spacing are possible, namely 20, 40, 60, and 80 mm. It is worth underlining that the measurement results are influenced by cracks, reinforcing rebars, humidity, and voids.
Commercial systems are also available: Simon and Vass [12] used a commercial resistivity meter, RESI (whose current version is Resipod by Proceq), intended for the assessment of the risk of corrosion. This meter exploits the Wenner method (with a measurement frequency of 40 Hz) and gives an estimation of corrosion rate, besides evaluating concrete homogeneity and curing conditions. Ramezanianpour et al. [100] used a surface resistivity meter [97] with four equally spaced electrodes and an excitation signal at 13 Hz with a peak-to-peak amplitude of 25 V (trapezoidal wave), as indicated in [101]. They took measurements at 4 quaternary longitudinal locations and considered the average value. They stated that the four-point Wenner array probe is one of the best methods to measure electrical resistivity, being non-destructive, easy to perform, and fast. Also, Ferreira and Jalali [16] used a commercial resistivity meter based on 4-point probe method, using an electrode spacing of 30 mm and a low-frequency (13 Hz) AC excitation current. They considered both cubic (150 mm side) and cylindrical (100 mm diameter, 200 mm height) specimens; for the former, two measurements on three perpendicular surfaces were performed, whereas for the latter two opposite headings (180°) measurements parallel to the length of the cylinders, 120° apart from each other. Presuel-Moreno et al. [102] applied a commercial surface resistivity meter on cylindrical specimens; Medeiros-Junior and Lima [103] used a commercial system based on the four-point Wenner probe (50 mm spacing) on cubic specimens of 250 mm per side (cast with three different w/c ratios of 0.4, 0.5 and 0.6) after 28 days of curing in a moist chamber and then in unsaturated condition in a laboratory environment (air-dried, T = 22 ± 3 °C, RH ± 65%) for two years. CNS RM MKII commercial resistivity meter was used by Kessler et al. [104], who considered three different sets of concrete specimens; Nilsson model 400 soil resistivity meter was used also in [105], considering cylindrical test specimens, with 4 rebars segments. Chen et al. [35] used a resistivity meter to investigate the effect of the probe spacing on resistivity by testing cylindrical and prismatic specimens. Ghosh and Tran [88] used a commercial surface resistivity meter (50 mm electrode spacing) on cylindrical concrete specimens.
Surface electrodes are widely used in 4-point probe AC configuration. Gowers and Millard [106] considered prisms, as well as Lubeck et al. [31]. Mendes et al. [94] used the four-point Wenner probe (50 mm spacing) according to the standard UNE 83988-2 “Concrete durability. Test methods. Determination of the electrical resistivity. Part 2: Four points or Wenner method.” [107], averaging the results on three measurements spaced at 120°. Cylindrical specimens (manufactured with the addition of fly ash, high-volume fly ash (HVFA), and fine limestone powder) were considered also by Tanesi et al. [101] and the same method is used by Wiwattanachang and Giao [98], adopting an increasing spacing of the electrodes in order to perform a vertical sounding of the tested prisms. Sengul et al. [4,108] compared the results obtained with the Wenner method with those obtained with 2-point probe method. Millard and Sadowski [109] used the Wenner technique with a modified electrode array, with two copper-copper sulphate reference electrodes to give a stable surface potential for the measurement of electrical potential difference caused by the excitation given through the outer electrodes; the same configuration was used in [110,111,112]. Moreover, Sadowski [113] used the four-point Wenner array in the frequency range of 50–1000 Hz on slab specimens; the area where the measurement was made had been prior wetted with tap water, to optimize the electrical contact. A grid of measurement points was defined on the specimen surface, to obtain a resistivity map. Nguyen et al. [28] used surface electrodes to perform electrical resistivity measurements on concrete prisms; they guaranteed a good electric contact by means of conductive gel based on potassium hydroxide. Zhang et al. [114,115,116] used a four-electrode array on prisms and performed the measurement in the 0.01–1000 Hz band. Also, Nguyen et al. [117] used the 4-point probe method, but they did not consider a constant spacing among electrodes.
Goueygou et al. [118] used a specific square probe (50 mm spacing) on prisms reinforced with rebars (10 mm diameter), repeating the measurement twice for each tested location; the same probe is used by Lataste et al. [119]. A square array is used also by Yim et al. [120], employing an excitation signal of 1 V (peak amplitude) at 100 Hz to scan a series of 12 electrodes placed around a cylindrical concrete specimen, in order to average the results on 12 measurements. They used brass electrodes, inserted for 10 mm in the specimen. The measurement was performed 30 min after the cast. The square array was reported to be sensitive to the specimen anisotropy.
Also attached or embedded electrodes can be used for 4-electrode configuration. Azhari and Banthia [121] used copper electrodes attached with silver paste on cylindrical specimens, as well as Lee et al. [122]. Fan et al. [123] used copper tapes as electrodes, attached with conductive silver colloidal paste. Loche et al. [124] used two platinum electrodes and two reference electrodes, controlling the field stability in the specimen. Yim et al. [125] used copper electrodes, with insulating coating at the extremities.
Chiarello and Zinno [23] tested 4-electrode configuration with different materials, both embedded or coupled externally to the specimens. In particular, they used copper electrodes, lead plates, and copper wires. They tested three different electrodes configurations: 4 copper electrodes (internal electrode distance of 80 mm, external electrodes distance of 120 mm), 2 copper electrodes (internal, at a distance of 120 mm) and 2 lead plates (external, clamped on the specimens), and 4 copper wires (internal electrode distance of 80 mm, external electrodes distance of 120 mm). They reported that the most reliable system is the one composed by 4 copper sheets. Two different types of electrodes were tested by Yu et al. [126]: square sheets of conductive film and cylindrical urethane sponges penetrated by a gold-coated needle along the longitudinal axis and containing water; the electrode spacing was equal to 75 mm. Also, McCarter et al. [80] tested two different electrode configurations: four stainless steel rod-electrodes with heat-shrink sleeving (keeping uncovered a 10-mm tip), and a spacing of 30 mm; two internal rod-electrodes and two external stainless steel plate-electrodes with a polymethyl methacrylate backing. They performed the measurements at 1 kHz on cubic concrete specimens (150 mm side), noticing that the latter configuration is not suitable at higher resistivity values, when the boundary effects at the concrete/air interface become significant, overestimating the measured resistivity. The same measurement frequency was adopted by Hope and Ip [34], making the two external electrodes adhere to the external opposite prismatic specimen faces by means of gel, whereas the internal electrodes were brass or stainless knurled steel bars cast in concrete. Finally, Lübeck et al. [31] performed electrical resistivity measurements on prismatic specimens containing blast furnace slag.
The Wenner probe method, using a probe with 50 mm spacing and an AC excitation at 40 Hz, was exploited also within the Long-Term Bridge Performance (LTPB) Program of the Federal HighWay Administration (FHWA) [127], where the RABIT-CETM multifunctional Non-Destructive Evaluation (NDE) platform has been employed to enhance the assessment of bridge decks. The electrodes for the measurement of electrical resistivity were equipped with sponges, which were saturated with soapy water to assure electrical coupling between electrodes and concrete. The analysis of the data measured (which should be repeated five times at each location) enables to derive contour maps reporting the spatial distribution of the electrical resistivity values: areas with low resistivity describe highly corrosive environment, facilitating high corrosion rates. It is worth noting that, contrarily to AC 2-electrode measurement (Section 2.2.1), literature (Table 3) reports more documents involving concrete than paste or mortar specimens when addressing the 4-electrode configurations. To the best of the authors’ knowledge, there are no specific reasons for this; a hypothesis could be that this is a simple costs-benefits issue, being paste/mortar specimens easier to be manufactured (and, often, smaller specimens are realized with respect to concrete ones, so that 2-electrode configuration appears more practical to be applied), being the cost of devices involved lower and being the overall test set-up easier to be prepared. Of course, the lower precision and accuracy of a 2-electrode test with respect to a 4-electrodes test still holds.

2.2.3. Other Methods Exploiting AC Excitation

Also other methods are reported in the literature. Li et al. [128] invented and patented [129] a non-contact device for monitoring electrical resistivity during the hydration process of cement paste. This system is based on the transformer principle to avoid the issues related to the electrode-specimen interface. Tang et al. [130,131] used the same technique with a 1–100 kHz sine wave in frequency domain, inducing the signal on a ring specimen of 1.4 L volume identified as the secondary coil of the transformer. The transformer-based method [132] for the measurement of electrical resistivity was used also by Wei and Xiao [133] and by Wei et al. [134,135] on ring-shaped specimens (1.67 L volume); the sampling interval was 1 min and the test was performed for 24 h. Similarly, Dong et al. [14] performed measurements on cement paste ring-shaped specimens for 1 day every 5 s. Lianzhen et al. [136] adopted the same test setup, prolonging the measurement up to 72 h. The same method was used by Shao et al. [137]. A specimen volume of 1.4 L was required and the test was carried out in a thermo-chamber with T = 20 °C, equal to the curing room. An electrical induced potential of 0.1 V at 1 kHz was used, and the measured data were recorded. The test lasted 3 days, starting when cement is mixed with water. Finally, Xiao and Li [138] used the non-contact method in specimens with a trapezoidal section (1.67 L in volume), carrying out the measurements for 48 h with 1-min sampling intervals.
Guthrie et al. [139] used a rolling probe, including a guard ring and a center electrode, for testing concrete bridge decks. They proved that this method is significantly faster (190 m2/h) than static probes (30 m2/h [140]), with a spatial resolution (0.1 m) 12 times higher than the latter. An excitation 3.3 V peak-to-peak sinusoidal signal at 190 Hz is used [141]. Pre-wetting of concrete surface (using a water and liquid soap solution) was necessary to guarantee a proper electric contact with the sensing electrodes [142]; the alterations caused by water were considered negligible. This method can provide an impedance map with valuable information on the reinforcement steel status related to protection against corrosion.
Finally, Melara et al. [143] used a three-electrode electrochemical cell, with an excitation signal of low-amplitude (25 mV) in the frequency range of 0.01 Hz–100 kHz, considering prismatic specimens (40 × 90 × 100 mm). They used the reinforcement (carbon steel rebar, 6.3 mm diameter) with a copper wire at its end and a graphite bar as electrodes. They performed the measurement according to ASTM G106 [144].
Table 4. AC measurements with 4-point probe method.
ReferenceSpecimensElectrodesMaterialAdditionsFrequency
Tibbetts et al. [96]Cylinders: 102 mm (diameter) × 205 (height)Surface electrodesConcreteFly ash, silica fume, metakaolin, ground glass, and sugarcane bagasse ashes13 Hz
Spragg et al. [81]Cylinders: 102 mm (diameter) × 205 (height)Surface electrodesConcrete-13 Hz
Alhajj et al. [99]Slabs: 900 × 700 × 150 mmMulti-electrode array (14 electrodes, equally spaced at 20 mm)Concrete-2 Hz (square wave)
Simon and Vass [12]-Surface electrodes (RESI system)Concrete-40 Hz
Ramezanianpour et al. [100]Cylinders: 100 mm (diameter) × 200 mm (height)Surface electrodes (Florida method resistivity meter)Concrete-13 Hz
Ferreira and Jalali [16]Cubes: 150 mm side
Cylinders: 100 mm (diameter) × 200 mm (height)
Surface electrodes (commercial resistivity meter)Concrete-13 Hz
Presuel-Moreno et al. [102]Cylinders: 101.6 mm (diameter) × 203.2 (height)Surface electrodes (commercial resistivity meter)Concrete--
Medeiros-Junior and Lima [103]Cubes: 250 mm (side)Surface electrodes (commercial equipment)Concrete--
Kessler et al. [104]Cylinders: 101.6 mm (diameter) × 203.2 mm (height)Surface electrodes (CNS RM MKII resistivity meter)Concrete-13 Hz
Morris et al. [105]Cylinders: 150 mm (diameter) × 200 mm (height)Reinforcement rebarsConcrete-97 Hz (square wave)
Chen et al. [35]Cylinders: 100(150) mm (diameter) × 200(300) mm (height)
Prisms: 200 × 200 × 175 mm; 160 × 160 × 140 mm; 120 × 120 × 110 mm
Surface electrodesConcrete--
Ghosh and Tran [88]Cylinders: 100/150 mm (diameter) × 200/300 mm (height)Surface electrodesConcrete--
Lubeck et al. [31]Prisms: 100 × 100 × 170 mm-ConcreteSlag (50% and 70% by mass)-
Mendes et al. [94]Cylinders: 100 mm (diameter) × 200 mm (height)Surface electrodesConcreteFly ash, HVFA, fine limestone powder-
Tanesi et al. [101]CylindersSurface electrodesConcreteHVFA and fine limestone powder-
Wiwattanachang and Giao [98]Beams: 100 × 200 × 1500 mmSurface electrodesConcreteFibers-
Sengul et al. [4,108]-Surface electrodesConcrete--
Millard and Sadowski [109]Slabs: 400 × 300 × 100 mmSurface electrodesConcrete--
Sadowski [110,111,112]Slabs: 400 × 300 × 100 mmSurface electrodesConcrete--
Sadowski [113]Slabs: 200 × 750 × 750 mmSurface electrodesConcrete-50–1000 Hz
Nguyen et al. [28]Slabs: 250 × 250 × 500 mmSurface electrodesConcrete--
Zhang et al. [114,115,116]Blocks: 89 × 114 × 406 mmSurface electrodesConcrete-0.01–1000 Hz
Nguyen et al. [117]Slabs: 500 × 250 × 120 mmSurface electrodesConcrete-5 Hz
Goueygou et al. [118]Slabs: 600 × 600 × 120 mmSpecific square probeConcrete--
Lataste et al. [119]SlabSpecific square probeConcrete--
Yim et al. [120]Cylinder: 150 mm (diameter) × 540 mm (height)Brass electrodes (5 mm diameter)Concrete-100 Hz
Azhari and Banthia [121]Cylinders: 50.8 mm (diameter) × 100 mm (height)Copper electrodes attached with silver pastePasteCarbon fibers and CNTs100 kHz
Lee et al. [122]Cylinders: 100 mm (diameter) × 200 mm (height)Copper wires and silver pasteConcrete-100 kHz
Fan et al. [123]Prisms: 152 × 50 × 12.5 mmCopper tape (spacing of 100 mm and 60 mm for external and internal electrodes, respectively) attached with silver pasteMortar-0.1 Hz–1 MHz
Loche et al. [124]Prisms: 150 × 150 × 180 mmTwo platinum electrodes (100 mm diameter) and two reference electrodesMortar-50 mHz–10 MHz
Yim et al. [125]PrismsCopper electrodes (1.78 mm diameter)Mortar-500 kHz
Chiarello and Zinno [23]Slabs: 40 × 40 × 160 mm4 copper electrodes (0.3 mm thickness, 40 × 18 mm transverse dimensions, 8 mm set in the composite), 2 copper electrodes and 2 lead plates (1 mm thickness, with 40 × 50 mm transverse dimensions, G-clamped on the specimen); 4 copper wires (0.5 mm diameter, fixed by a conductive silver paint) attached with silver paint.Concrete-100 kHz
Yu et al. [126]Prisms: 300 × 300 × 100 mmSquare sheets of conductive films (15 mm side); cylindrical urethane sponges (10 mm diameter)Concrete-0.01 Hz–1 MHz
McCarter et al. [80]Cubes: 150 mm (side)Stainless steel rod-electrodes (6 mm diameter), also in combination with external stainless-steel plate-electrodes (150 × 150 mm)Concrete-1 kHz
Hope and Ip [34]Prisms: 25 × 25 × 100 mmExternal plates; embedded brass or stainless knurled steel barsConcrete-1 kHz
Lübeck et al. [31]Prisms: 100 × 100 × 170 mm-ConcreteBlast furnace slag-

2.3. Effect of Reinforcements in Electrical Resistivity Measurements

In case of embedded steel, the short circuit effect can be minimized by making the excitation current flow orthogonally with respect to the rebars (e.g., placing the sensing probe perpendicular to the rebars, in case of Wenner’s method [102]). Garzon et al. [27] examined this effect both through experimental and numerical tests highlighting its dependence on both the specimen geometry and the electrode spacing; they introduces a rebar presence factor quantifying the effect on the measured resistivity. Also, Alhajj et al. [99] used numerical simulations to evaluate the effect of steel rebars on electrical resistivity measurements, carrying out parametric studies to evaluate the effect of different geometries and sensor positioning. As a rule of thumb, the distance between the Wenner’s array and the reinforcement rebar should be at least twice the electrode spacing. Mc Carter et al. [80] have found that also the sponge used for electric contact can contribute to the measured result, increasing the electrical resistivity; therefore, particular attention should be paid to each component of the measurement chain. Millard et al. reported numerous factors causing deviations from the real resistivity value when using the Wenner array [145], such as size and geometry of specimens, rebars positioning, and presence of surface layers with different conductivity. Sengul et al. [4,108] compared the results obtained with the Wenner method with those obtained with 2-point probe method; they highlighted the necessity of performing the measurement as far as possible from the metallic reinforcement of concrete structures or adopting a sufficiently small electrode spacing (in relation to the cover depth), concluding that the Wenner method is suitable for a reliable quality control of concrete durability also during the construction process.

2.4. Uncertainty and Calibration in Electric Resistivity/Impedance Measurements: The Missing Items in Literature

Uncertainty [146] is a key aspect in every measurement system. Yet, it is also one the most missing item even in scientific documents targeting applications that involve measurement systems. This is also the case for electrical resistivity measurements. Indeed, to the best of the authors’ knowledge, the uncertainty associated with an electrical resistivity measurement has been rarely tackled by the scientific community dealing with this approach in concrete. Actually, very few studies face this issue. Bourreau et al. analyzed the uncertainty associated with resistivity measurement for a coastal bridge [147]. The uncertainty was assessed based on measurements repeatability (1800 measurements) and considering local material anisotropy. The Wenner 4-probe approach was adopted to perform the measurements. The authors also tried to correlate the results of the uncertainty analysis with the corrosion risk from RILEM TC154 recommendation [148]. This way, they suggested a parameter, namely probability of wrong assessment (PWA), that was adopted, together with uncertainty, to help the bridge owner in the maintenance of the infrastructure.
Spragg et al. [81] focused on the variability of bulk electrical resistivity measurements (uniaxial method) on concrete cylinders. They considered both within and multi-laboratory variability exploiting the coefficient of variation (COV) as parameter addressing the variability. They claimed that, in both conditions (within and multi-laboratory), variability increases over time. Operator variability, variability of specimens, and the inherent variability in the mixture are all associated together into the within-laboratory variability, which does not exceed 4.36%. As the multi-laboratory variability is concerned, this was evaluated from ten laboratories and twelve differing mixtures, resulting in a variability of 13.22%. An important aspect underlined by the authors is that specimen geometry can greatly influence the results of an electrical test. Hence, they suggest using a geometry correction factor (e.g., in cylinders the ratio of sample area to sample length). As for the electrode resistance, which was addressed using a series model, they showed that, for the materials used in their evaluation, the needed correction is quite small.
Indeed, the variabilities reported by Spragg et al. can become even higher (10–40%), as discussed in [149,150], due to both concrete heterogeneity or measurement system metrological characteristics [151], just to cite some.
The concept of uncertainty associated with resistivity/impedance measurements becomes even more relevant when in-field testing is considered. In fact, in in-field applications, the whole measurement chain (instrument to inject/measure electrical quantities, wires, electrodes, concrete) related to the resistivity/impedance measurement becomes difficult to be controlled, mainly because it is highly affected by the conditions of concrete (it is indeed non-stationary) and the interaction of the whole chain with the environment (e.g., temperature, relative humidity, etc.).
Su et al. [152] discussed the decrease of electrical resistivity with the increase of temperature and RH. As RH is concerned, Su et al. identified a linear relationship between concrete resistivity and RH (correlation coefficient > 0.83). The higher the RH level, the higher the moisture content in concrete. Hence, the easier the flow of current within concrete. The results provided by Su et al. well match with the findings previously discussed in their paper of 2002 [153], in which they investigated the effect of moisture content on concrete resistivity on both air-dried specimens and oven-dried specimens. They demonstrated that resistivity decreases with an increase in w/c ratio, but for the saturated concrete specimens with high w/c ratios (w/c > 0.55) the resistivity difference is small. Mostly important, they showed that with consistent water loss ratio (>3%) concrete resistivity increases no matter the mix adopted. This is indeed justified by the fact that current is carried by ions [152], and ions constitute the conductive phase of concrete as pore solution, whose electrical resistivity is linked to concrete resistivity through the empirical law of Archie [154]. As for temperature, electrical resistivity and temperature are linked through the Arrhenius equation, involving the empirical computation of activation energy [155], which in turn is linked to moisture content itself [154]; when temperature rises, the movement of the charged ions dissolved into the pore solution increases according to a linear function [152].
Given this high-variability of concrete resistivity/impedance, it becomes clear that in-situ calibration becomes relevant when addressing in-field applications. Despite this is a recognized need, it is not widely addressed in the literature. Corva et al. [156] proposed to use LCR meters to derive proper correction factors to be applied to the results to improve their accuracy. Priou et al. [155] combined numerical models with laboratory tests to evaluate the uncertainty associated with the measurement and using water (instead of concrete) as a reference for calibrating the sensor to be used in-field. Recommendations on calibration are available mostly for in-lab tests, given that in-field measurements are much more complicated and often just connections and contacts are verified [25]. Indeed, calibration of the measurement system is carried out in-situ more as a performance verification. “Dummy cells” (electric circuits with high precision components of known value) are typically used for this purpose. However, the characteristics of these reference devices may differ quite a lot from those of the target structure.
In this sense, long-term monitoring applications can be considered more significant than inspections, because they make it possible to evaluate trends over time on a more solid statistical basis than the one provided by single inspections (even though multiple measurements are performed).

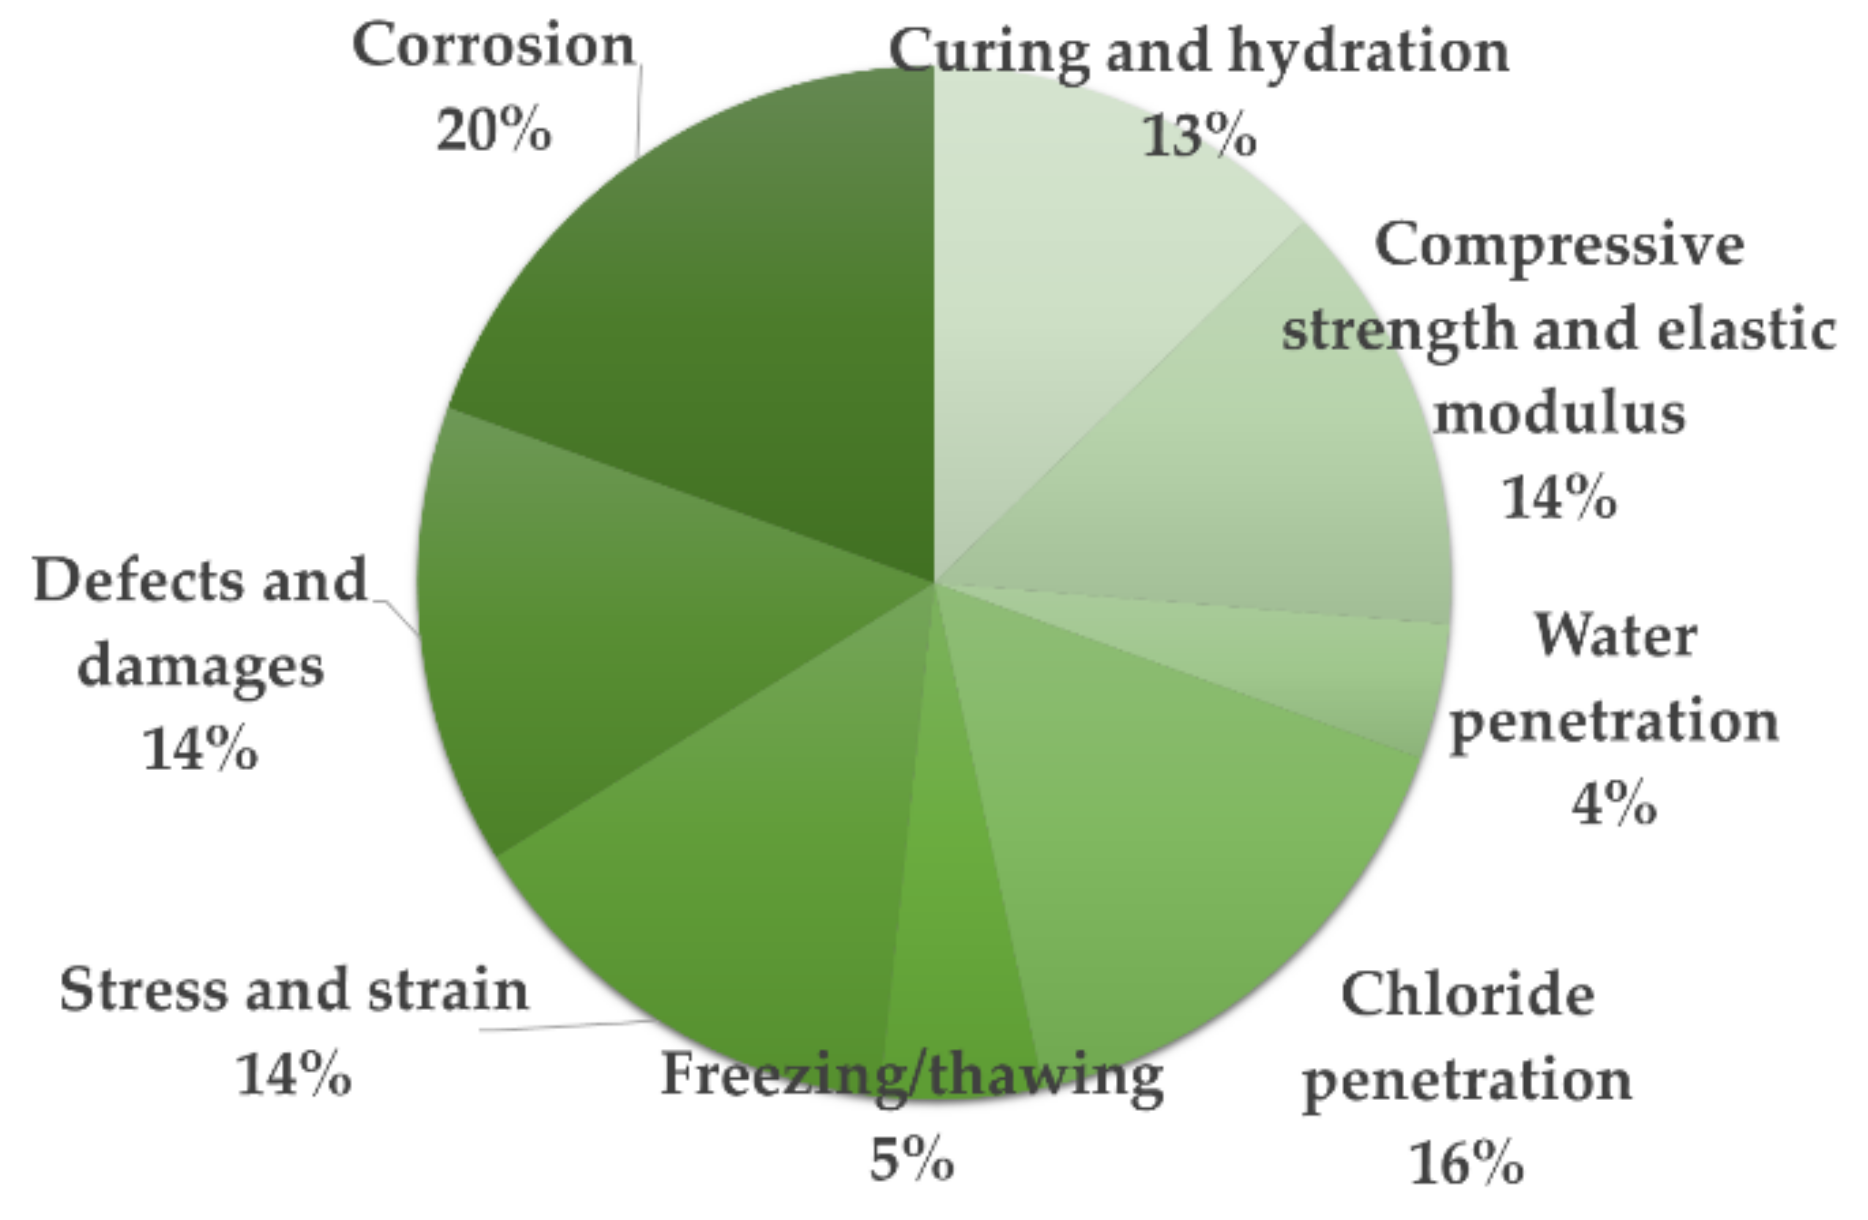
3. Electrical Resistivity/Impedance Measurement: Measuring One Variable Aiming at Several Target Applications

3.1. Curing and Hydration

The hydration process of cement-based materials varies with chemical composition, eventual additions and admixtures, mix proportions and curing conditions, such as T and RH. While time passes, porosity decreases because of the formation of more hydration products [157] (the decrease of porosity is associated with the difference between hydration products and hydrated cement in terms of volume [138]). In particular, in the early stages, the pore structure densifies and the formed hydration products block ions conductive paths, hence electrical resistivity increases. When higher strength cement is used, porosity decreases more rapidly (while the solid phase increases) and the electrical resistivity increase is steeper [135]. Indeed, electrical resistivity is highly correlated to porosity and pore solution characteristics (conductivity reflects the volume fraction and the interconnectivity of pores, besides the conductivity of pore solution and the saturation degree [81]), hence it can be related also to hydration. This measurement can be performed in situ in real-time [158], also when concrete is in a weak and plastic state [159], avoiding the influence on the development of the microstructure [130]. Non Destructive Techniques (NDT) and in particular electrical resistivity are used to monitor concrete porosity during its early age evolution [160] and, generally, the microstructure evolution in cement-based materials during hydration processes [77]. According to Wiwattanachang and Giao [98], during the first week of curing, electrical resistivity rapidly increase up to 60% of the final value, according to a logarithmic trend. Approximately 60 days of curing are necessary to reach an almost stationary value in mortar with carbon fibers [21]. McCarter et al. [77] underlined how electrical conductivity reduces with the hardening process considering 1, 10, and 100 kHz measurements.
Also non-contact devices based on transformer principle [128] can be used for measuring electrical resistivity during early hydration. This makes it possible to identify five distinct phases, namely dissolution, induction, acceleration, deceleration, and diffusion-controlled periods [161]. The ionic concentration of pore solution gives a significant contribution to electrical resistivity [160]. Tang et al. [130] used non-contact electrical impedance measurements [129] for the characterization of pore structure in cement pastes for three days from casting time. Through the use of pore fractal theory (combining fractal electrical network and pore structure network [162]), they obtained a relationship between the cumulative pore volume (important parameter to understand the contribution of different size pores in hydration kinetic and transportation [163]) and electrical impedance, which proved to be suitable for the assessment of pores ranging from μm to mm. Xiao and Li [138] measured the electrical resistivity of concrete during the first 48 h of hydration; they noticed that the characteristic points on the resistivity curve over time mirror the transition processes of hydration, namely the supersaturation point (lowest point) and the final setting of concrete (first peak point of the derivative curve). Dong et al. [14] evidenced that the electrical resistivity of concrete decreases with the gradual increase of ion concentration in the hydration process; moreover, there is a linear relationship between electrical resistivity and compressive strength at an early age, which means that standard compressive strength could be predicted by ρ. Carsana et al. [87] evidenced that in the first hours of curing there is a conductivity peak, linked to the ions released from the binder to the solution; then, hydration products form, and the pore structure develops, making electrical resistivity increase. The increase of electrical resistivity over time is confirmed by Polder and Peelen [74], who attributed this rise to drying out and hydration of concrete. In particular, after 3 weeks in air (T = 20 °C, RH = 80%) ρ increases by a factor 3-5, stronger in outer layers (due to pore water evaporation); at approximately 30 weeks, ρ increases by a factor 6–20 in the outer layers (10 mm depth) and by a factor 10–30 in the inner parts (50 mm depth) compared to 1-week values.
Tibbetts et al. [96] highlighted that, since pozzolanic reactions occur later, after the first 28 days in concrete with SCMs the electrical resistivity increases more than in plain concrete [164]. In fact, for concrete mixes with the addition of SCMs a curing period of 56 days is recommended [165]. Presuel-Moreno et al. [102] evaluated the effects of different curing regimens (immersion in tap water or 3.5% NaCl solution, exposure to fog room, high humidity, and laboratory humidity) on the electrical resistivity of concrete. In general, the exposure to fog room and high humidity levels cause lower resistivity values with respect to curing at room conditions. Tomlinson et al. [166] evaluated the effect of thermal cycling (between −24 °C and +24 °C, at a rate of 1 °C/h) on the electrical resistivity of concrete at early ages. Resistivity increases when temperature decreases and when the pore solution freezes (phase transition temperature, typically between −5 °C and 0 °C); in fact, ice is an insulator and limits ion mobility [167]. It is worth noting that phase transition temperature varies with concrete composition (e.g., GGBFS decreases it, because of changes in the ionic combination of the pore solution) and decreases with the ageing of concrete (because of different water content and, consequently, different ionic concentrations influencing the ice formation). Moreover, the phase transition temperature is higher during thawing cycles than freezing ones, meaning that in the former, there is more ice than in the latter, at the same temperature.
Also, the setting time of concrete has been evaluated by means of electrical resistivity measurements. Dong et al. [14] explored the relationship between setting time and electrical resistivity in the early hydration of cement-based materials; in particular, they identified linear relationship between the minimum of electrical resistivity curve and initial setting time (with R2 > 0.956) and between the first peak of electrical resistivity curve and final setting time (with R2 > 0.986). Also, Yim et al. [125] evaluated the setting time of mortar specimens by means of electrical resistivity, noticing that electrical resistivity increases with hydration depending on mix and chemical admixtures. In particular, they considered the rising time of electrical resistivity (indicating the increase onset) and the increasing ratio over time, which reflects the evolution of the cement-based materials microstructure.

3.2. Compressive Strength and Elastic Modulus

The prediction of concrete strength in a simple and effective way is fundamental in order to optimize the construction times. There are some applications of electrical resistivity measurement related to the prediction of compressive strength (commonly controlled at 28 days) and elastic modulus. The increase of hydration products goes together with the microstructure formation; when hydration products start blocking the pores conduction path and tortuosity increases, electrical resistivity sharply increases, as well as a compressive strength gain [35]. Therefore, the electrical resistivity can be considered as a predictor of the compressive strength of cementitious materials; since compressive strength value is used for quality control, also electrical resistivity measurement can be employed with that aim.
Many authors identified linear relationships between compressive strength and electrical resistivity of concrete [31,168], since both ρ and compressive strength depends on the matrix porosity and structure compactness. Hope and Ip [34] stated that electrical resistivity of concrete increases with increasing age—the more the lower w/c ratio is— cement, and aggregates used [137]. Wei et al. [135] evidenced a linear relationship (y = 8.7648x + 20.406, with R2 = 0.9634) considering compressive strength at 28 days and electrical resistivity at 24 h. Ferreira and Jalali [16] found relationships between 28-day compressive strength and 7-day electrical resistivity values. They report errors < 10% in the compressive strength estimation when a model based on a theoretical equation related to concrete hydration process is used, considering also a correction factor for the surface temperature of concrete. Shao et al. [137] observed a linear relationship between electrical resistivity and concrete strength, reporting a strong correlation (R2 = 0.97). This was justified by the presence of dissolved ions. Similarly, Lianzhen et al. [136], after temperature correction, established a linear relationship between compressive strength and concrete electrical resistivity, independent of curing temperature and w/c ratio (y = 4.51x − 3.80, with R2 = 0.98). Dong et al. [14] established a linear relationship between 1-day compressive strength and 24-h electrical resistivity of cement paste (y = 0.1725x + 36.106, with R2 = 0.9371). Lübeck et al. [31] found a linear relationships between electrical resistivity and compressive strength at 28 and 91 days of curing also in the presence of GGBFS. Wei et al. [134] established a power relationship between 1-day electrical resistivity and w/c ratio similar to that between compressive strength and w/c ratio [169]. On the other hand, they established a linear relationship between 2-day compressive strength and 1-day resistivity (y = 1.609 + 3.8497x, with R2 = 0.993) and a logarithmic relationship between 7-day (or 28-day) compressive strength and 1-day resistivity (y = 5.4302 + 19.179lnx with R2 = 0.987 and y = 15.427 + 21.835lnx with R2 = 0.976 for 7-day and 28-day compressive strength, respectively).
Finally, Wei and Xiao [133] established a logarithmic relationship between 7-day or 28-day elastic modulus and 1-day electrical resistivity (R2 > 0.90). Moreover, knowing the aggregate content, the 7-day (or 28-day) compressive strength can be derived from the 1-day electrical resistivity, according to a linear relationship (R2 > 0.95). Aggregates largely increase the concrete bulk electrical resistivity with an exponential correlation [120]. On the other hand, Ramezanianpour et al. [100] do not recommend to use ρ as a compressive strength indicator since the pore solution greatly affects electrical resistivity, but has no influence on compressive strength.
Also the elastic modulus can be related to electrical resistivity; Shao et al. [137] found a non-linear regression during the early age hydration process of concrete [128]. As compressive strength, also elastic modulus increases as hydration proceeds. Using electrical resistivity for the evaluation of the modulus of elasticity is a meaningful, cheap, sensitive, and non-destructive method, as opposed to the analysis of the load-deformation curve of concrete specimens, which turns to be quite complicated and time consuming, requiring the cast of several dedicated specimens. Moreover, hydration products formation determines the electrical resistivity value, as the propagation velocity of ultrasound waves does. Since the ultrasonic pulse velocity measurement method can be used to investigate the elastic modulus, the combination of electrical resistivity and the elastic modulus obtained with ultrasound techniques enables a more accurate measurement with a correlation coefficient of 0.92 ≤ R2 ≤ 0.98.

3.3. Water Penetration

Water penetration can be evaluated according to EN-12390-8 “Testing hardened concrete—Part 8: Depth of penetration of water under pressure” [170]. Water penetration test is used to evaluate the concrete permeability and, consequently, its performance and durability [171]. Water is applied on one face of a cubic specimen under a pressure of 0.5 MPa, kept constant for 72 h; then, the specimen is split into two halves and the maximum penetration depth is considered as an indicator of water penetration. When water penetrates, some soluble salts (e.g., chloride ions) can go through concrete, easing corrosion of embedded reinforcements and undermining its durability. Concrete electrical resistivity has proved to be correlated with concrete permeability and water penetration [100].
Ramezanianpour et al. [100] highlighted a strong power relationship between concrete electrical resistivity (measured as surface resistivity—SR—with four-point Wenner array probe) and water penetration (measured in compliance to EN 12390-8) when the same type of cementitious materials are considered (y = 107.88x − 0.777, with R2 ≈ 0.87). On the other hand, when different cementitious materials are used, the correlation is slightly reduced (R2 ≈ 0.83), since the surface resistivity test depends on microstructure and pore solution, whereas water penetration only on pore solution. Tibbets et al. [96] investigated the correlation between water permeability and electrical resistivity; they used a pressurized, uniaxial, steady-state flow permeameter [172] and the procedure reported in AASHTO T358 [95] (surface resistivity) and AASHTO TP119 [70] (bulk resistivity). They proved that electrical resistivity increases as water permeability decreases; different trends are observable with different designs and SCMs; in particular, electrical resistivity measurements in specimens containing sugarcane bagasse ashes and ground glass tend to overestimate the concrete penetrability. Tang et al. [131] used non-contact electrical impedance measurements [129] for the development of a fractal permeability model to evaluate the permeability of young cement pastes (ring-shaped specimens); pores with a diameter < 6.2 nm were not considered, since the ions movement is constrained by pore walls [163]. Finally, Nguyen et al. [28] found a power relationship between electrical resistivity and saturation degree (y = 24.848x−3.262, with R2 = 0.9702), since resistivity increases while water content decreases.

3.4. Chloride Penetration

Chloride penetration is the main degradation cause of reinforced concrete structure. When a critical threshold is overcome, depassivation induces the corrosion of reinforcements. Therefore, a proper service life design of concrete infrastructures, verifying the durability requirements for concrete exposed to aggressive environments due to seawater or de-icing salts [173,174], is required for minimizing repair and maintenance costs.
Good correlations has been found [5] between concrete electrical resistivity [74] and chloride ingress [175] and this relationship can be used as a durability indicator, also for quality control and concrete classification [176]. In general, the chloride diffusion coefficient is inversely proportional to the electrical resistivity of concrete [177]. Similarly, Layssi et al. [178] evidenced a linear correlation (R2 = 0.93) between the diffusion coefficient and the electrical conductivity of concrete. Electrical resistivity reflects the ions mobility in pore solution; therefore, the relationship with chloride penetration is reasonable [100]. Indeed, electrical resistivity can be used as a NDT for the evaluation of the service life [92], since it reflects charge flow and ions mobility, easing the corrosion process [103]. Chloride ions modify the electrical impedance response of cementitious materials; in particular, as chloride migration proceeds, first the bulk electrical resistance increases, then decreases [124]. McCarter et al. [77] monitored concrete blocks (300 × 200 × 200 mm) exposed in a marine site in three different locations: just above the low-water mark, just below the high-water mark, and well above it. They employed multielectrode arrays to evaluate the advancement of NaCl in the concrete cover, given that the increasing ionic concentration in the pore fluid, due to seawater penetration, decreases the concrete electrical resistivity.
Several works in the literature aim at correlating electrical resistivity and chloride penetration [7]; however, the relationships found are very different from each other, and this can lead to a difficult interpretation of measurement results, also considering that in-field measurements cannot benefit from controlled conditions, contrary to laboratory setups [92]. In fact, electrical resistivity mainly depends on the chemical composition of the pore solution and the presence of ions different from chlorides could be misleading in the evaluation of chloride permeability through electrical resistivity assessment. As a matter of fact, Archie’s law provides the estimation of chlorides through multilinear regression considering the relationship between concrete electrical resistance and porosity, saturation degree, and the interstitial fluid resistance [30].
The Surface Resistivity (SR) Test has been judged as a promising alternative to Rapid Chloride Permeability Test (RCPT), since it is easier, more rapid, does not require sample preparation, and with results affected by lower variability [101]. However, SR Tests needs to be accurately set-up, as electrode configuration (Figure 2), contact force between electrodes, and specimen might severely affect the results of test [179]. In fact, the electrode-specimen contact area influences the measurement, with a maximum error in electrical resistivity estimated at 6% when passing from 1 mm to 40 mm electrode diameter (it is worth underlining that this effect is much more problematic in 2-electrode configuration, also limiting the suitable measurement frequency range) [155]. RCPT method, specified by ASTM C1202, is really a measure of electric conductivity, since it monitors the amount of electric current passing through a cylindrical specimen when a 60 V DC electrical potential difference is applied for 6 h [165]. The total charge is obtained by integrating the measured current over time, and corresponding levels of penetrability to chlorides are given (high, moderate, low, very low, or negligible) [180]. Even if this test is relatively simple and rapid (despite requiring an extensive specimen preparation), some issues have been raised, such as absence of steady-state conditions, heat evolution (its increase enhances the total passing charges, besides increasing the microstructure damages and possibly changing the pore solution chemical composition; especially in younger concretes or with high w/c ratio [181]), and pore solution alteration in the presence of pozzolanic materials [182]. Tanesi et al. [101] reported a decreasing exponential relationship between RCPT and SR test results, with a high correlation (R2 = 0.92) and a quite low variability (5.3%). Balestra et al. [92] found a power relationship between chloride concentration and SE (y = 25.724∙x−0.5, with R2 = 0.9568). Lower electrical resistivity values can indicate an easier chloride penetration through pores; in particular, they state that for ρ > 17 kΩ∙cm the chloride penetration is lower, whereas it becomes very low for ρ > 41 kΩ∙cm and negligible for ρ > 220 kΩ∙cm. on the other hand, there is a very high chloride penetration for ρ < 5 kΩ∙cm.
Ramezanianpour et al. [100] found a strong power relationship (y = 67998x−1.028, with R2 ≈ 0.90) between RCPT and SR for a wide range of concrete specimens also containing SCMs, such as natural pozzolans (pumice and tuff), rice husk ash, silica fume, and metakaolin. The relationship between electrical resistivity and total passing charge would be linear if the specimen temperature was kept constant during the test (R2 ≈ 0.99) [181]. Similarly, good correlations were found by Kessler et al. [104] (y = 5801.2x−0.819, with R2 ≈ 0.95) and Tibbets et al. [96] (y = 7.535x−0.88 with R2 = 0.95 and y = 15.712x−0.90 with R2 = 0.98, for bulk and surface resistivities, respectively), measuring surface/bulk electrical resistivity according to AASHTO T358 and AASHTO TP119, respectively. Therefore, SR can be considered an indicator of permeability and represents a valuable alternative (faster and more precise) to RCPT test, changing the type of measured data (electrical resistivity instead of total passing charge) but remaining a measurement linked to concrete electrical resistance. Surface resistivity can be used as a quality control predictor of the chloride penetration resistance, but not of diffusion behavior, requiring dedicated long-term diffusion tests.
However, according to Shi et al. [183] the AC impedance measurement is a simple, reproducible and therefore valuable technique for determining the diffusion coefficient in concrete. Similarly, Sengul [5] stated that electrical resistivity can be used as an indirect control of chloride diffusivity thanks to the Nernst-Einstein’s equation, correlating electrical resistivity and ion diffusivity (y = 49.13x−0.91, R2 = 0.97). Connectivity and pores play a fundamental role: fewer pores with lower connectivity, higher electrical resistivity and lower diffusivity are obtained.
When chlorides penetrate, the material microstructure evolves, changing porosity and tortuosity. Electrical resistivity mirrors these variations, decreasing together with the ionic concentration [86]. Electrochemical Impedance Spectroscopy (EIS) can be used to monitor reinforced specimens during chloride ingress, allowing the detection of chloride arrival on the reinforcement as well as the steel depassivation, the corrosion onset, and the chloride exit [143]. Finally, Van Noort et al. [79] found a linear correlation between conductivity and chloride migration coefficient, (y = 1195x, with R2 = 0.88); therefore, electrical resistivity measurement can be considered as a quicker and cheaper alternative method to the standard Rapid Chloride Migration (RCM) test [184].

3.5. Corrosion Risk of Reinforcements

The corrosion of steel rebars is the principal cause of structural deterioration of concrete [31], heavily impacting the service life of a structure. The corrosion rate depends on both the oxygen availability and the electrical resistivity of concrete, which mirrors the ion mobility in concrete and, consequently, the corrosion speed [7]. A low resistivity is generally linked to the concrete susceptibility to corrosion, since it is related to more rapid chloride penetration and corrosion rate [25]. Indeed, during corrosion, local electrical cells continuously generate a very little current, which can cause great harm, especially if the electrical resistivity of concrete is low. The electrical resistivity of concrete, being related to the ion mobility in the solution and to the microstructure itself, can act as an indicator for the ingress of CO2 and chlorides [185]. This holding, electrical resistivity is directly linked to structural durability [31]. The literature proposes several threshold values; however, these thresholds are very variable. For instance, Morris et al. [105] indicated active corrosion when ρ < 10 kΩ∙cm, whereas low corrosion probability when ρ > 30 kΩcm. Sengul [5] highlighted the importance of controlling moisture and temperature on specimens to obtain reliable and comparable data. Despite such different ranges, concrete electrical resistivity is considered as a valuable parameter for the evaluation of corrosion risk, provided that the concrete composition influencing the “baseline value” of electrical resistivity is considered. The quantification of corrosion risk is decisive for maintenance, protection, and repair decision-making [186,187]. Moreover, corrosion can occur only in a small range of temperature, w/c ratio, and relative humidity; Yu et al. [188], developed a probabilistic evaluation method for the estimation of corrosion risk by means of electrical resistivity measurements, taking into account the corrosion rate and identifying different corrosion risk levels (negligible, low, moderate, and high). Sadowski [113] proposed a methodology to evaluate the corrosion probability in concrete slabs by using electrical resistivity measurements (according to the four-point Wenner array method) in combination with half-cell potential method (defined in ASTM C876 [189]). The latter requires direct access to the steel reinforcement for the connection of a high impedance voltmeter and a reference half-cell, to obtain a map of the potentials that could be associated with areas of active corrosion. Among the other factors, corrosion probability depends on the ionic conductivity. Ionic conductivity can be estimated by measuring the electrical resistivity of concrete [190], therefore the two quantities may be correlated. The combined evaluation of electrical resistivity and corrosion potential may improve the quantification of the probability of corrosion, which seems higher when ρ < 5 kΩ∙cm. In fact, the corrosion potential sharply increases for ρ < 4 kΩ∙cm. On the other hand, Hope and Ip [34] considered 10 kΩ∙cm as the upper limit for the corrosion probability in concrete. However, both the methods have their own disadvantages and provide better results when used in combination, even if they do not directly assess the instantaneous corrosion rate [110]. Polder [191] found a reasonable linear relationship between corrosion probability and concrete electrical resistivity (y = −0.11x + 118, with R2 = 0.89), indicated by steel potential after 20 weeks of salt/drying cycles. However, this does not imply a direct relationship between electrical resistivity and critical chloride content (i.e., the chloride quantity that is believed tolerable before corrosion starts); electrical conductivity is strongly related to chloride penetration, as previously demonstrated [192]. The same author in [74] highlighted that electrical resistivity reflects the concrete properties related to chloride penetration, corrosion initiation (i.e., corrosion probability), and propagation (i.e., corrosion rate).
Since electrical resistivity of concrete reflects the transport of ions (including chloride), it is quite immediate to infer a possible correlation between resistivity and corrosion initiation. Poupard et al. [193] quantified the chloride concentration threshold leading to corrosion initiation by means of low-frequency impedance response (in the frequency range of 10 mHz–10 Hz). This threshold corresponds to the polarization resistance drop, which increases with low w/c ratio. The microstructure properties are reflected by polarization resistance, which consequently is able to characterize the activation of the corrosion process. However, this methodology can be used only as a comparative test because the external field used for the measurement accelerates chlorides transfer, thus distorting the steel behavior.
Once the corrosion process has started, a low resistivity gives a high corrosion rate [191]; when corrosion begins, ρ can represent a “controlling factor” of its speed [194,195]. After depassivation, an inverse relationship between concrete electrical resistivity and corrosion rate has been found [28,175,196,197] but not with a general validity, since it depends on concrete composition [197], age, carbonation, and environmental conditions, especially with low chloride content [74]. Millard and Sadowski [109] adapted the four-point Wenner resistivity method to evaluate the corrosion rate of steel without the requirement of a direct electrical connection to the reinforcement rebars, as necessary for the Linear Polarization Resistance (LPR) method [198]. LPR consists in the introduction of a small perturbative DC signal to a corroding steel rebar and in the measurement of the corresponding electric potential change, to derive the polarization resistance; it requires the knowledge of the area of steel being perturbed. Wenner’s method alone cannot directly measure the corrosion rate; however, in this study, the short-circuit effect caused by steel reinforcement rebars was exploited to do measurements both in DC and AC (directly over a steel bar, parallel to the bar itself) to assess the resistive (i.e., the charge transfer resistance) and the capacitive (i.e., the double layer of charged ions on the surface of the steel rebar) components of the corrosion interface. This offers a quick method to quantify the corrosion rate on the surface of the considered rebar, since its instantaneous value is proportional to the charge transfer resistance itself [110].
Sadowski [112] combined the resistivity measurement performed by four-point probe method and the galvanostatic resistivity measurement [110] with the use of a Multi-Layer Perceptron (MLP) artificial neural network (ANN) model. A dataset of 70% of the available experimental data was used for training, 15% for testing, and 15% for the MLP verification process. A correlation coefficient R2 ≈ 0.85 with a MAPE (mean absolute percentage error) of 0.000266 was obtained for the first set of data (related to a specimen with a high corrosion rate), whereas R2 ≈ 0.98 and MAPE error of 0.000027 for the second dataset (related to a specimen with a moderate corrosion rate), indicating very good performance of the neural network in the prediction of the corrosion current rate. In this way, also the influence of environmental conditions on electrical resistivity is considered. It is worth noting how ANNs have spread also in civil engineering applications [199,200], giving important contributions to SHM. Sadowski and Nikoo [111] considered electrical resistivity (both in DC and AC) as input parameters for an artificial neural network base model for the estimation of corrosion current density. They found that imperialist competitive algorithm (ICA) provides higher accuracy and flexibility than genetic algorithms (GA).
Simon and Vass [12] underlined the existence of an inverse correlation between corrosion current density and the electrolyte resistance, as reported in Equation (4):
I c o r r 1 ρ
where ρ [Ω∙m] is the electrical resistivity of concrete. This indicates that the rate of corrosion increases together with decreasing electrical resistivity of concrete. Gulikers [175] stated that the relationship between the corrosion current density and the electrical resistance (and resistivity, if anodic and cathodic sites are considered fixed) can be considered almost linear for a wide range of corrosion current density values. However, many times cathodic activation control (electrical charge transfer) dominates on concrete resistance in driving the corrosion resistance, as well as oxygen diffusion can play a significant role in the cathodic control (particularly in wet environments).
EIS can provide information on the corrosion kinetics, indicating the corrosion mechanism (activation, concentration, or diffusion), monitoring the situation over time [201]. McCarter et al. [202] investigated the electrical resistivity of concrete through the cover region to the reinforcement rebar, at intervals of 5 mm. Considering that the electrical resistivity of pore water, salt solution, and pore fluid mixture can be represented by parallel conduction elements (equivalent electric circuit), the concentration of NaCl in the pore water after salt solution exposure can be estimated. Yu et al. [126] used the Wenner method to measure the electrical impedance of concrete for corrosion detection, without connecting to the rebars, by placing the electrodes just above the reinforcements. They found that the impedance decreases as corrosion proceeds, enabling a clear discrimination between healthy and corroded rebars. Therefore, the impedance difference in a certain frequency range (10-100 Hz) can be considered as a suitable parameter for monitoring reinforced concrete structures. However, they stressed that corrosion detection is more difficult if the rebar is located more deeply and that above 1 kHz the passive film formation on the rebars cause a sharp increase in electrical impedance. Guthrie et al. [139] identified the frequency range between 10 Hz and 1 kHz as the best to investigate the corrosion degree of reinforcing steel. Also, Zhang et al. [116] aligned the electrodes with the reinforcement rebar, stating that polarization resistance and double layer capacitance are clearly visible in the measured electrical impedance. This approach provides results comparable to standard EIS method without the need of contact with the reinforcement rebar and faster thanks to the use of higher frequency values. However, the result heavily depends on the geometry, the electrodes positioning, the concrete cover depth, the diameter of reinforcement rebars and the concrete electrical resistivity. Morris et al. [105] investigated corrosion on concrete specimens exposed to seashore and submerged. In the former scenario, the electrical resistivity values are approximately three times greater than in the latter and, in both cases, electrical resistivity increases over time. It worth noting that chloride concentration does not significantly influence concrete electrical resistivity; reinforcement steel rebars are probably in an active corrosion state when electrical resistivity is < 10 kΩ∙cm, whereas they remain in their passive state when ρ > 30 kΩ∙cm. Electrical resistance is important not only for estimating the corrosion rate but also in the design of cathodic protection systems against corrosion [203].

3.6. Freezing/Thawing

In cold regions, the formation of frost inside cement-based structure is of great concern, since rapid cooling causes significant temperature and moisture gradients, thus resulting in considerable internal pressure caused by water confined in pores, as well as the crystallization pressure, giving possible damages. This is mirrored also by a compressive strength loss and cracks formation. Electrical resistivity, being related to moisture content and temperature, can provide information on the ice content; moreover, ice alters the porosity and connectivity of the material, which induce changes in the electrical resistivity.
Kim et al. [72] studied the influence of freezing/thawing on electrical impedance of concrete. They adopted specific thermal cycling, passing from 120 °C to −70°C (at a rate of 10 °C/h), maintaining the temperature for 3 h to reach thermal equilibrium, then they increased the temperature of 20 °C (at the same rate) till equilibrium; the cycle was repeated twice in a day. Both the real and the imaginary parts of impedance change with temperature; in particular, the impedance increases with the ice formation in the pore network [90,204], making the pore-water volume decrease, besides increasing slightly ionic concentration in the unfrozen pore water [83]. Moreover, the ions mobility decreases when temperature decreases, consequently decreasing electrical impedance as confirmed by Wang et al. [65]. Furthermore, the maximum value of ρ increases with the number of freezing/thawing cycles, indicating progressive damage caused by frost [205,206]). After ice nucleation, a linear relationship between the logarithm of electrical resistivity and temperature can be identified. This curve provides valuable information on the effect of frost on concrete durability [83].
Wang et al. [90] estimated the ice content of mortar through electrical impedance measurements. If the electrical impedance variations are not constant over cycles, it means that some frost damages have occurred. The freezing point is identified at approximately −7 °C; above 0 °C, there is a linear relationship between the logarithm of electrical resistivity and temperature (no ice formation), whereas the increase of electrical impedance is sharp below the freezing point (which increases with cycles). The ice content is higher during thawing than freezing, reasonably because of the natural supercooling effect of the material (during freezing, water cannot form ice because of lack of ice nucleation crystals). Sato and Beaudoin [83] highlighted that, during freezing, ice formation increases salt concentration in the unfrozen pore water, making its electrical resistance decrease. Therefore, another resistance component, linked to the paste-pore water interface, which increases with temperature decrease, appears. Moreover, after melting, there is a residual expansion in cement pastes causing cracking and pore deformation, possibly changing the micro-scale structure. Wang et al. [66] analyzed cement pastes with different moisture contents, highlighting that electrical resistivity is very sensitive to nucleation and growth of ice crystals in pores of cement-based materials. As already said, electrical resistivity increases with temperature decrease (because of a decrease in ion mobility); at first, the decrease proceeds slightly, then rapidly, indicating crystallization of the pore solution. The variation of electrical resistivity is stronger in thawing than in freezing as a consequence of moisture redistribution. When moisture content is higher, both freezing and melting temperatures increase; moreover, electrical resistivity is lower. It is possible to find a log-linear relationship between electrical resistivity and temperature that is due to changes in both pore solution molecular activities and conductive pathways. Finally, Perron and Beaudoin [84] underlined that EIS can provide valuable information on the effects of pore structure in water transfer and ice crystals formation. In fact, temperature decrease causes a reduction in pore solution conductivity and pore water movement, hence resulting in an increased resistance. When freezing begins, the slope of the electrical resistance vs. temperature curve changes; when there is no still pore water freezing, the resistance increases, but with a decreased rate, linked to the only temperature decrease.

3.7. Stress and Strain

Self-sensing construction materials have gained much interest for SHM purposes, enabling the perception of stress/strain by means of electrical resistivity measurements. Indeed, electrical resistivity enables concrete to behave as a smart material for the self-sensing of strain and stresses (piezoresistive effect), especially when conductive additions are used [68].
A good electrical conductivity is a fundamental prerequisite for piezoresistive behavior; it can be stated that cement-based material is the stress sensor, whereas the conductive addition makes the piezoresistive effect significative. Conductive fillers and/or fibers can be used at this aim, such as carbon-based materials (e.g., virgin/recycled carbon fibers, carbon nanotubes [207], carbon nanofibers [208], char, and carbon black [209]), graphene (e.g., graphene nanoplatelets [48]), steel fibers, graphite powder, nickel powder, titanium dioxide, and iron oxide. These functional fillers increase the concrete ability to sense not only stress and strain, but also internal damages (e.g., cracks). When a cement-based material contains a conductive addition, its electrical resistivity depends on its dispersion degree, the electrical conductivity of the addition, and of the interface between the addition and the cement matrix. Also, moisture plays an important role in the piezoresistive ability of concrete [48].
There are manifold applications of piezoresistivity property of concrete, such as SHM [121], traffic monitoring [210] (also including self-sensing pavement applications for vehicle detection [122]), and cement-based sensors [55]. Fractional Change of Resistivity (FCR)—or Fractional Change of Resistance—during loading/unloading phases is commonly considered and the sensitivity is evaluated by means of the Gauge Factor (GF), defined as the ratio of electrical resistivity variation (∆ρ/ρ) and strain (ε) [33]. Intrinsic self-sensing concrete is advantageous in terms of sensitivity, mechanical performance, durability, ease of installation, and maintenance [211].
Carbon fibers are often used to enhance the piezoresistive behavior; when short carbon fibers are added to the mortar mix, it can be noted that the electrical resistivity varies with the applied stress; in particular, ρ decreases with compression longitudinal loads (fiber push-in), whereas increases upon tension (fiber pull-out) [21]. Wen and Chung [212] observed that the DC electrical resistance increases upon tensile loading in specimens containing carbon fibers, due to the degradation of the fiber-matrix interface. This degradation is partly reversible, meaning that carbon fibers composites behave as strain sensors, in both transverse and longitudinal directions (even if FCR is higher in the case of longitudinal resistivity) [59]. The same authors [57] evaluated the electrical resistivity of cement pastes subjected to uniaxial compression; they considered paste specimens of two types, namely carbon fiber silica fume cement paste and carbon fiber latex cement paste. They evaluated electrical resistivity both in longitudinal and transverse directions, considering cubic (51 mm side) and rectangular specimens (150 × 12 × 11 mm), observing a reversible decrease in both the resistivities, with the exception of some irreversible increase at the end of the first stress cycle due to minor damage.
Carbon fibers were used also in combination with graphite [45]: the former form a conductive network, whereas the latter fill the spaces among fibers, increasing the smart agility of smart concrete. Electrical resistivity is negatively correlated with stress: it is possible to establish a quadratic polynomial relationship between the variance ratio of resistance (∆R/R) and stress (or strain), with R2 > 0.95 for different concrete compositions. The same materials combinations was tested by Liu and Wu [49] in conductive asphalt concrete; they noticed that FCR slows down with more loading cycles, meaning that piezoresistivity tends to decrease because of viscoelasticity.
Also steel fibers can be used. According to Teomete and Kocyigit [51], the relationship between the percent change in electrical resistance and tensile strain is almost linear before cracking (R2 = 0.92 and R2 > 0.94 for mixtures without and with fibers, respectively; the correlation coefficient converges at 0.99 approximately at percolation threshold). The gage factor increases with fibers volume, converging approximately in correspondence of the percolation threshold (1 vol.%). Nguyen et al. [53,54] evaluated different types of steel fibers, namely smooth, twisted, and hooked, noticing that the most effective for enhancing mechanical resistance are those twisted (better meso than macro twisted), followed by smooth and hooked ones. Electrical resistivity decreases with tensile strain until post-cracking, due to the formation of multiple cracks due to strain-hardening.
Cementitious strain sensors can be realized to be embedded in structures to be monitored, providing a high monitoring efficiency in continuous, low-cost, high durability, and simple construction technology to be embedded only in critical points of concrete structures, forming a distributed monitoring network. Strain sensing provides valuable information for the control of structural vibrations, traffic monitoring, and weighing [213]. Azhari and Banthia [121] highlighted a non-linear and rate-dependent relationship between change in resistivity and compressive stress, measured in electrically conductive cementitious composites with carbon fibers and CNTs (better when used in conjunction). Also, D’Alessandro et al. [38] used CNTs to realize sensors to be embedded on a concrete beam (250 × 250 × 2200 mm) at a distance of 250 mm from each other, forming a durable distributed SHM solution able to provide results in agreement with traditional strain gauges. Han and Ou [67] employed carbon fibers and carbon black to realize piezoresistive sensors embedded in concrete structures. They obtained a linear relationship between FCR and compressive stress (y = −1.35x); another linear relationship was established between FCR and compressive strain (y = −0.0227x). The response of the contact resistance to elastic deformation is reversible [214], whereas becomes irreversible in the case of plastic deformation. Ding et al. [40] developed cementitious sensors, manufactured with the addition of CNT/NCB (nano carbon black) composite filler, to incorporate in concrete columns. These sensors presented high stability and repeatability within the elastic regime, providing a polynomial relationship between stress/strain and FCR (y = 7.743∙10−5x3 − 0.005x2 + 0.510x, with R2 = 0.999 and y = 0.018x3 − 0.759x2 + 28.00751 with R2 = 0.997 for stress and strain, respectively). During loading, FCR decreases; no damages to the sensor are caused by the compressive stress. The change of electrical resistance is reversible upon loading and unloading phases, even if the amplitude of FCR is slightly different in subsequent load cycles; under monotonic loading, when the sensor ultimate stress has been reached, FCR remains quite stable. Similarly, Han et al. [55] developed highly sensitive piezoresistive sensors using nickel powder-filled cement-based composites; they found that electrical resistivity decreases monotonously as compressive load increases, showing a decrease by approximately 63% in the elastic regime (investigated range: 0–12.5 MPa). FCR is highly correlated to compressive force (Boltzmann sigmoidal regression curve, R2 > 0.99). Nickel powder enables contacting and tunneling conduction effects, causing a decrease in the electrical resistivity, besides enhancing the sensitivity to stress/strain. Han et al. [215] designed a self-sensing pavement (embedded with smart cement-based sensors, realized with the addition of nickel powders enhancing self-sensing capability—[216]) for traffic detection and monitoring. They proposed an FCR equal to approximately 18% with a compressive strength of 0.5 MPa (caused by a small vehicle of approximately 1000 kg on an area of the four tires of approximately 20000 mm2), thus obtaining a reversible and sensitive response in terms of electrical resistivity. Luo and Chung [52] studied contact electrical resistance under dynamic loading in two overlapped mortar strips; they observed an irreversible increase in electrical resistivity at a stress amplitude of 15 MPa, probably because of the production of severe debris. The inclusion of steel fibers decreases the noise present in FCR data [122]. Contrarily, Lee et al. [122] noticed that FCR cannot predict the compressive behavior of ultra-high-performance concretes containing CNTs, probably because the external load changes the conductive paths only slightly, due to their dense microstructure, whereas it can simulate quite well the tensile behavior (in terms of stress-strain and stress-crack opening displacement). A non-linear relationship between stress and FCR and a linear relationship between strain and FCR (R2 > 0.9) were found.

3.8. Defects and Damages Detection

Cracks (provoked by internal stresses [217] or external loadings [218], such as mechanical loads [219], drying shrinkage [220], and freezing action [221]) weaken the matrix resistance, besides constituting a preferential ingress path for contaminants [222], fluids and ion flows, which ease corrosion processes; therefore, durability of concrete is significantly affected by cracks and other damages formation. When cracks form, conductive pathways are partially destroyed. As a consequence, electrical resistivity increases. In this case, and consequently, the electrical resistance can be used as a damage sensor besides strain sensor. Teomete and Kocyigit [51] observed that electrical resistance has abrupt changes when crack initiates and propagates in steel fiber reinforced cement matrix composites.
Real-time monitoring makes it possible to promptly detect damages when they occur, easing the detection of the causes of these damages and enabling a timely repairing action, hence prolonging structural service life. Electrical resistivity of concrete is sensitive to concrete stress-strain and cracking behavior, with a response mainly depending on the load level and the water saturation degree [76]. In fact, crack formation and propagation cause changes in the path of electric current, hence ρ will change, following their evolution in time. It is worth underling that the effect will be dependent on the cracks conditions, as demonstrated by Lataste et al. [119] with a 4-probe resistivity meter. If cracks are insulating (i.e., dry concrete, where cracks are filled with air or sometimes dust, showing a high electrical resistivity), ρ will increase; if they are water-saturated (i.e., wet concrete), ρ will decrease (since water has a good electrical resistivity) [119]; in fact, possible impurities present in the mixture can alter electrical resistance, increasing or decreasing it depending on their nature (e.g., metallic or dust particles). The same meter was used by Goueygou et al. [118] for the comparison of electrical resistivity measurements and transmission of ultrasonic (US) surface waves in crack detection; both the techniques are suitable to localize the main cracks, but not to measure the crack depths. The information provided by electrical resistivity can be useful to complement US results, distinguishing between wet and dry cracks. However, secondary cracks represent a disturbing factor for electrical resistivity measurements. Wiwattanachang and Giao [98] used the resistivity meter SYSCAL R1 plus, with 24 electrode connected to a multicore cable system, for the evaluation of both artificial cracks (made of plastic sheets) and loading cracks. The wider the crack width, the higher the electrical resistivity. Electric imaging can provide 2D representation useful for crack detection. Peled et al. [75] noticed a dramatic change in impedance values when a sudden growth in crack occurred; the real part of the electrical impedance increases through the fracture process, following the crack opening. Dong et al. [41] monitored the cracks initiation and propagation by means of electrical resistivity measurements; in fact, FCR is dominated by the cracks opening, showing the same trend of opening with load.
Also, cementitious materials with conductive additions were evaluated for damage detection. It is worth noting that conductive fibers/fillers can be used as a reinforcement, providing the so-called “crack-bridging effect”. Lim et al. [46] analyzed cement composites containing CNTs, confirming the possibility to detect crack (and to evaluate their width) by means of electrical resistivity measurements, provided that the specimen under test is moist. Otherwise, under dry conditions, the crack breaks the conductive network of CNTs and the electrical conductivity is not influenced by the crack width anymore. Also, Zhang et al. [39] found that reduction in water content significantly decreases the piezoresistive property, both in terms of FCR and sensitivity to stress and strain; this can be attributed to the decrease of contact between eventual fillers (they tested both carbon nanotube and nanocarbon black) and the shrinkage increase [223]. It is worth noting that the water content generally increases with conductive fillers content because of their water absorption capability. The importance of moisture content is highlighted also in other studies. Boulay et al. [50] studied the evolution of electrical resistivity with cracking in concrete specimens saturated with a basic solution, noticing a decrease of electrical resistivity when crack opens, since the ionic solution takes up and fills it. Fan et al. [123] maintained specimens in saturated water condition before tests, to exclude moisture effect on impedance measurement; after damage, the specimens were subjected to wet/dry cycles to enable self-healing. They noticed that both opening and number of cracks influence the measurement results; the relation between electrical impedance and crack opening is frequency-dependent and presents both a resistor and a capacitor effect: the former is linked to the conductive media inside the crack, whereas the latter linearly decreases with increasing crack opening. Zhu et al. [91] considered both plain mortar and ECCs; they highlighted that in fractured mortars the electrical impedance increases several hundred times, resulting in different shape and trend curves representation in Nyquist plot.

4. Let’s Wrap Up

4.1. Discussion

This extended literature review presented so far aims to highlight that many different methods are nowadays used to measure the electrical resistivity of concrete. These methods involve different measurement setups (Figure 3) and sensing electrode (Figure 4) configuration, they provide different information, suitable for distinct applications and with different accuracies.
There are many target applications where electrical resistivity measurements can provide valuable information (Figure 5). The approach representing the best compromise between ease of application, time to result, and measurement accuracy should be chosen by considering the target application. For example, the uniaxial method is suitable for laboratory measurements on specimens, but it cannot be exploited for in-field testing, whereas the non-contact method is hardly exploitable for continuous monitoring due to the specific testing configuration (particularly the ring-shaped specimens needed). Surface electrodes are widely used in 4-point probe AC configuration, but this setup is valid only for inspection purposes and not for continuous monitoring. Embedded electrodes are considered more durable and can ensure better bonding with the cement-based material with respect to pasted electrodes [55].
In electrical impedance testing, it is fundamental to take into account all the possible side effects that might increase the uncertainty associated with the measurement. Different issues with DC measurement with two electrodes are pointed out in the literature, namely possible electrochemical reactions linked to the electrical potential difference applied between the two electrodes, polarization at the electrode/specimen interface, and accuracy affected by the contact resistance between electrodes and the specimen [158]. The excitation signal causes an accumulation of charges at the interface between the electrodes and the material itself (the electrodes behave like capacitors, whose conductive planes are the electrode itself and the underneath material) and such interface polarization gives an important contribution to the measurement result (since it includes the contact impedance). This holding, it becomes clear that measurements performed with two electrodes significantly overestimate the concrete electrical resistivity [80] and it would be necessary to take into account the electrodes polarization contribution, subtracting it from the result [175,224] to get accurate resistivity values. The addition of conductive materials (e.g., carbon fibers) can decrease polarization effect, since conductors cannot support high electric fields [44].
Differentiating between excitation and measurement electrodes significantly avoid polarization phenomena and minimizes the insertion error [44,125]. For these reasons, the 4-electrode configuration should be preferred since separating the excitation/response electrodes results in increasing the measurement accuracy. Polder et al. [7] gave some recommendations on the approaches for measuring the electrical resistivity of concrete, including the four-point method (i.e., Wenner’s array) for the on-site measurement; they also addressed reinforced structures. However, the variability of the measurement results is quite high: 10% variation coefficients are considered good, 20% normal; also values up to 25% in the field are possible [25]. Some commercial devices are available, but they are targeted to inspection purposes and not suitable for continuous monitoring, for which a fix sensor network regularly measuring the electrical resistivity of concrete would be necessary [68].
The use of an AC approach in electrical resistivity measurement makes it possible to focus on the material microstructure, thus excluding electrode polarization as a possible interfering input. The measurement of electrical impedance of concrete should be performed according to the EIS method, thus spanning multiple frequencies. This is of utmost importance, since the material electrical properties (both the electrical resistivity and the dielectric permittivity) are frequency-dependent [69] and the analysis in different ranges allows to investigate several different aspects of materials (e.g., the composite resistance of specimens with conductive fibers is visible at a higher frequency, since at low frequency the superficial passive layer makes them non-conductive [22]). The results of an electrical resistivity measurement are strictly linked to the frequency and the shape of the electric signal used for the measurement. Frequencies greater than 1 kHz should be employed to avoid the effect of material polarization (i.e., the orientation of dipoles according to the electromagnetic field originated from the measurement itself) [80,224]. McCarter et al. [77] monitored the electrical impedance of cement pastes in the frequency range of 1–100 kHz, with a sampling time of 10 min in 48 h test period. They highlighted that electrode polarization at the lowest frequency (1 kHz) masks the bulk response from the paste, which instead vanishes with increasing frequency. Moreover, in order to examine composite materials, e.g., concrete with the addition of carbon fibers, higher frequency values, which mirror the interaction between the conductive addition and the cement-based material, should be considered.
To avoid measurement errors, attention should be paid to several aspects, including the specimen geometry, the possible non-homogeneity of the material, the environmental conditions (particularly temperature and relative humidity) and their changes, the interface between electrodes and material (a good electric contact should be maintained), the presence of reinforcing steel rebars or other conductive materials close to the measurement electrodes, the different resistivity of bulk and surface layers, the local variations in concrete, and the electronic noise.

4.2. Conclusions

This review paper aims at providing the interested reader with hints and suggestions on how to approach electrical resistivity/impedance measurements on cement-based structures. Indeed, it was one of the authors’ priority to demonstrate that, depending on target applications, several variables should be considered to ensure reliability and accuracy of results, e.g., electrode configuration or excitation type (DC vs. AC), just to cite some. Literature can indeed provide useful recommendations in approaching electrical resistivity/impedance measurements in concrete [106], in particular:
  • The use of an AC excitation signal (electric current or potential difference) is important to avoid the Faradic effect of charges (ions) separation in the material;
  • Frequencies greater than 1 kHz should be used to fully avoid the alignment of dipoles consequent to the excitation;
  • A low-frequency (less than hundreds of MHz or some GHz) AC excitation current should be applied to avoid spurious mode voltage;
  • The 4-point probe method should be used to avoid any influence from the contact surface area;
  • A good electrical connection between each contact and the concrete surface should be ensured;
  • A contact spacing of at least 1.5 times the size of the maximum aggregate size in the concrete should be used;
  • A Wenner contact spacing less than or equal to one quarter of the concrete section thickness should be used;
  • Concrete resistivity should be measured at a minimum distance of twice the contact spacing from the edge of the concrete section;
  • An electromagnetic cover meter or bar locator should be used to locate the reinforcement rebars;
  • A contact spacing less than or equal to two thirds of the concrete cover should be used where the proximity of steel reinforcements is unavoidable, in order to minimize the error due to the presence of the rebar;
  • A contact spacing of at least 4 cm should be used where surface wetting effect might be expected;
  • The measurement should be performed at least 24 h after a rainfall has occurred;
  • A contact spacing not less than eight times the thickness of this layer should be used if the presence of a low-resistivity surface layer is unavoidable;
  • A temperature compensation of +1 kW∙cm per 3 °C fall in ambient temperature might be used to convert resistivity measurements to a standard temperature.
Moreover, it is worth noting that electrical resistivity is a parameter varying within the volume, since there is no homogeneity in concrete elements; in addition, those layers close to the surface are more sensitive to variations of climate conditions (e.g., temperature changes or rain events). For this reason, the measurement should be considered as a local measurement. This suggests that a proper monitoring of a concrete structure should be approached targeting a distributed monitoring system using several sensing nodes. These nodes should be places on those parts of the target structure that are considered as the most critical to concrete degradation. On the other hand, electrical resistivity measurements can be applied also targeting inspection. No matter the final approach, i.e., monitoring or inspection, the addition of self-sensing material would produce positive effects on a resistivity measurement. The calibration of the measurement devices is a key aspect that should always be considered, especially in a measurement for which environmental variables, like temperature and relative humidity, or material characteristics, like moisture content, act as disturbing inputs and consequently contribute also as sources of uncertainty. For in-lab tests, calibration can be performed with liquid of known electrical conductivity and on standard concrete specimens. The procedure is, however, difficult for in-field measurements. Hence, calibration turns out in a check on cabling and connections or a performance verification with reference devices (e.g., electronic circuits, concrete specimens of known resistivity, etc.) Measurement uncertainty would deserve more consideration by the scientific community and should be addressed more often, given the lack of documents available in the literature on this topic. Indeed, only a proper assessment of measurement uncertainty can ensure reliability of results and hence robustness to the inference on the health status of the cement-based structure that is inspected/monitored, also given the heterogeneity of the cement-based materials, surely affecting the measurement reproducibility.
Last but not least, it should be recalled that, since electrical resistivity of concrete is influenced by many factors, e.g., concrete composition, environmental conditions, etc., pre-determined ranges correlating resistivity with corrosion risks of reinforcement, or relationships correlating resistivity with concrete durability, just to cite some, should be considered in a critical manner, as they could not be considered valid in all conditions.

Author Contributions

Conceptualization, G.C. and A.M.; data curation, G.C. and A.M.; writing—original draft preparation, G.C. and A.M.; writing—review and editing, G.C., A.M., P.C., F.T., G.M.R.; visualization, G.C. and A.M.; supervision, P.C. All authors have read and agreed to the published version of the manuscript.

Funding

This research received no external funding.

Conflicts of Interest

The authors declare no conflict of interest.

References

  1. Monticelli, C.; Criado, M.; Fajardo, S.; Bastidas, J.M.; Abbottoni, M.; Balbo, A. Corrosion behaviour of a Low Ni austenitic stainless steel in carbonated chloride-polluted alkali-activated fly ash mortar. Cem. Concr. Res. 2014, 55, 49–58. [Google Scholar] [CrossRef]
  2. European Standard. EN 1990: Eurocode—Basis of Structural Design; European Standard: Brussels, Belgium, 2002. [Google Scholar]
  3. Hoła, J.; Bień, J.; Sadowski, Ł.; Schabowicz, K. Non-destructive and semi-destructive diagnostics of concrete structures in assessment of their durability. Bull. Pol. Acad. Sci. Tech. Sci. 2015, 63. [Google Scholar] [CrossRef]
  4. Sengul, O.; Gjørv, O.E. Electrical resistivity measurements for quality control during concrete construction. ACI Mater. J. 2008, 105, 541–547. [Google Scholar] [CrossRef]
  5. Sengul, O. Use of electrical resistivity as an indicator for durability. Constr. Build. Mater. 2014, 73, 434–441. [Google Scholar] [CrossRef]
  6. Gjørv, O.E.; Vennesland, Ø.E.; El-Busaidy, A.H.S. Electrical resistivity of concrete in the oceans. In Proceedings of the Offshore Technology Conference, Houston, TX, USA, 2–5 May 1977. [Google Scholar]
  7. Polder, R.; Andrade, C.; Elsener, B.; Vennesland, Ø.; Gulikers, J.; Weidert, R.; Raupach, M. Test methods for on site measurement of resistivity of concrete. Mater. Struct. 2000, 33, 603–611. [Google Scholar] [CrossRef]
  8. Bertolini, L.; Elsener, B.; Pedeferri, P.; Polder, R. Corrosion of Steel in Concrete: Prevention, Diagnosis, Repair; Wiley-VCH Verlag GmbH & Co. KGaA, Ed.; Wiley Blackwell: Weinheim, Germany, 2005; ISBN 9783527603374. [Google Scholar]
  9. Gorzelańczyk, T. Moisture influence on the failure of self-compacting concrete under compression. Arch. Civ. Mech. Eng. 2011, 11, 45–60. [Google Scholar] [CrossRef]
  10. Tuutti, K. Corrosion of Steel in Concrete; Swedish Cement and Concrete Research Institute: Stockholm, Sweden, 1982. [Google Scholar]
  11. Hou, T.C.; Nguyen, V.K.; Su, Y.M.; Chen, Y.R.; Chen, P.J. Effects of coarse aggregates on the electrical resistivity of Portland cement concrete. Constr. Build. Mater. 2017, 133, 397–408. [Google Scholar] [CrossRef]
  12. Simon, T.K.; Vass, V. The electrical resistivity of concrete. Concr. Struct. 2012, 13, 61–64. [Google Scholar] [CrossRef]
  13. Collepardi, M. The New Concrete; Tintoretto: Lancenigo, Italy, 2010; ISBN 88-903777-2-0. [Google Scholar]
  14. Dong, B.; Zhang, J.; Wang, Y.; Fang, G.; Liu, Y.; Xing, F. Evolutionary trace for early hydration of cement paste using electrical resistivity method. Constr. Build. Mater. 2016, 119, 16–20. [Google Scholar] [CrossRef]
  15. López, W.; González, J.A.; Andrade, C. Influence of temperature on the service life of rebars. Cem. Concr. Res. 1993, 23, 1130–1140. [Google Scholar] [CrossRef]
  16. Ferreira, R.M.; Jalali, S. NDT measurements for the prediction of 28-day compressive strength. NDT E Int. 2010, 43, 55–61. [Google Scholar] [CrossRef]
  17. Hope, B.B.; Ip, A.C. Corrosion of steel in concrete made with slag cement. ACI Mater. J. 1987, 84, 525–531. [Google Scholar] [CrossRef]
  18. Bijen, J. Benefits of slag and fly ash. Constr. Build. Mater. 1996, 10, 309–314. [Google Scholar] [CrossRef]
  19. Adil, G.; Kevern, J.T.; Mann, D. Influence of silica fume on mechanical and durability of pervious concrete. Constr. Build. Mater. 2020, 247, 118453. [Google Scholar] [CrossRef]
  20. Wee, T.H.; Suryavanshi, A.K.; Tin, S.S. Evaluation of rapid chloride permeability test (RCPT) results for concrete containing mineral admixtures. ACI Struct. J. 2000, 97, 221–232. [Google Scholar] [CrossRef]
  21. Donnini, J.; Bellezze, T.; Corinaldesi, V. Mechanical, electrical and self-sensing properties of cementitious mortars containing short carbon fibers. J. Build. Eng. 2018, 20, 8–14. [Google Scholar] [CrossRef]
  22. Berrocal, C.G.; Hornbostel, K.; Geiker, M.R.; Löfgren, I.; Lundgren, K.; Bekas, D.G. Electrical resistivity measurements in steel fibre reinforced cementitious materials. Cem. Concr. Compos. 2018, 89, 216–229. [Google Scholar] [CrossRef] [Green Version]
  23. Chiarello, M.; Zinno, R. Electrical conductivity of self-monitoring CFRC. Cem. Concr. Compos. 2005, 27, 463–469. [Google Scholar] [CrossRef]
  24. Whittington, H.W.; McCarter, J.; Forde, M.C. The conduction of electricity through concrete. Mag. Concr. Res. 1981, 33, 48–60. [Google Scholar] [CrossRef]
  25. Polder, R.B. Test methods for on site measurement of resistivity of concrete—A RILEM TC-154 technical recommendation. Constr. Build. Mater. 2001, 15, 125–131. [Google Scholar] [CrossRef]
  26. Polder, R. Test methods for on-site measurement of resistivity of concrete—RILEM TC 154-EMC: Electrochemical techniques for measuring metallic corrosion. Mater. Struct. 2000, 33, 603–611. [Google Scholar] [CrossRef]
  27. Garzon, A.J.; Sanchez, J.; Andrade, C.; Rebolledo, N.; Menéndez, E.; Fullea, J. Modification of four point method to measure the concrete electrical resistivity in presence of reinforcing bars. Cem. Concr. Compos. 2014, 53, 249–257. [Google Scholar] [CrossRef]
  28. Nguyen, A.Q.; Klysz, G.; Deby, F.; Balayssac, J.P. Evaluation of water content gradient using a new configuration of linear array four-point probe for electrical resistivity measurement. Cem. Concr. Compos. 2017, 83, 308–322. [Google Scholar] [CrossRef]
  29. Glass, G.K.; Page, C.L.; Short, N.R. Factors affecting the corrosion rate of steel in carbonated mortars. Corros. Sci. 1991, 32, 1283–1294. [Google Scholar] [CrossRef]
  30. Dérobert, X.; Lataste, J.F.; Balayssac, J.P.; Laurens, S. Evaluation of chloride contamination in concrete using electromagnetic non-destructive testing methods. NDT E Int. 2017, 89, 19–29. [Google Scholar] [CrossRef] [Green Version]
  31. Lübeck, A.; Gastaldini, A.L.G.; Barin, D.S.; Siqueira, H.C. Compressive strength and electrical properties of concrete with white Portland cement and blast-furnace slag. Cem. Concr. Compos. 2012, 34, 392–399. [Google Scholar] [CrossRef]
  32. Wen, S.; Chung, D.D.L. Piezoresistivity-based strain sensing in carbon fiber-reinforced cement. ACI Mater. J. 2007, 104, 171–179. [Google Scholar] [CrossRef]
  33. Lee, S.-J.; You, I.; Zi, G.; Yoo, D.-Y. Experimental investigation of the piezoresistive properties of cement composites with hybrid carbon fibers and nanotubes. Sensors 2017, 17, 2516. [Google Scholar] [CrossRef] [Green Version]
  34. Hope, B.B.; Ip, A.K.; Manning, D.G. Corrosion and electrical impedance in concrete. Cem. Concr. Res. 1985, 15, 525–534. [Google Scholar] [CrossRef]
  35. Chen, C.T.; Chang, J.J.; Yeih, W.C. The effects of specimen parameters on the resistivity of concrete. Constr. Build. Mater. 2014, 71, 35–43. [Google Scholar] [CrossRef]
  36. Schuetze, A.P.; Lewis, W.; Brown, C.; Geerts, W.J. A laboratory on the four-point probe technique. Am. J. Phys. 2004. [Google Scholar] [CrossRef]
  37. ASTM C1760—12 Standard Test Method for Bulk Electrical Conductivity of Hardened Concrete. Available online: https://www.astm.org/Standards/C1760 (accessed on 24 June 2020).
  38. D’Alessandro, A.; Meoni, A.; Ubertini, F.; Luigi Materazzi, A. Strain measurement in a reinforced concrete beam using embedded smart concrete sensors. In Lecture Notes in Civil Engineering; Springer: Cham, Switzerland, 2020; Volume 42, pp. 289–300. [Google Scholar]
  39. Zhang, L.; Ding, S.; Han, B.; Yu, X.; Ni, Y.Q. Effect of water content on the piezoresistive property of smart cement-based materials with carbon nanotube/nanocarbon black composite filler. Compos. Part. A Appl. Sci. Manuf. 2019, 119, 8–20. [Google Scholar] [CrossRef]
  40. Ding, S.; Ruan, Y.; Yu, X.; Han, B.; Ni, Y.Q. Self-monitoring of smart concrete column incorporating CNT/NCB composite fillers modified cementitious sensors. Constr. Build. Mater. 2019, 201, 127–137. [Google Scholar] [CrossRef]
  41. Dong, S.; Dong, X.; Ashour, A.; Han, B.; Ou, J. Fracture and self-sensing characteristics of super-fine stainless wire reinforced reactive powder concrete. Cem. Concr. Compos. 2020, 105, 103427. [Google Scholar] [CrossRef]
  42. Melugiri-Shankaramurthy, B.; Sargam, Y.; Zhang, X.; Sun, W.; Wang, K.; Qin, H. Evaluation of cement paste containing recycled stainless steel powder for sustainable additive manufacturing. Constr. Build. Mater. 2019, 227, 116696. [Google Scholar] [CrossRef]
  43. Huang, Y.; Li, H.; Qian, S. Self-sensing properties of engineered cementitious composites. Constr. Build. Mater. 2018, 174, 253–262. [Google Scholar] [CrossRef]
  44. Wen, S.; Chung, D.D.L. Electric polarization in carbon fiber-reinforced cement. Cem. Concr. Res. 2001, 31, 141–147. [Google Scholar] [CrossRef]
  45. Chen, M.; Gao, P.; Geng, F.; Zhang, L.; Liu, H. Mechanical and smart properties of carbon fiber and graphite conductive concrete for internal damage monitoring of structure. Constr. Build. Mater. 2017, 142, 320–327. [Google Scholar] [CrossRef]
  46. Lim, M.-J.; Lee, H.K.; Nam, I.-W.; Kim, H.-K. Carbon nanotube/cement composites for crack monitoring of concrete structures. Compos. Struct. 2017, 180, 741–750. [Google Scholar] [CrossRef]
  47. Dehghanpour, H.; Yilmaz, K. Investigation of specimen size, geometry and temperature effects on resistivity of electrically conductive concretes. Constr. Build. Mater. 2020, 250, 118864. [Google Scholar] [CrossRef]
  48. Belli, A.; Mobili, A.; Bellezze, T.; Tittarelli, F.; Cachim, P. Evaluating the self-sensing ability of cement mortars manufactured with graphene nanoplatelets, virgin or recycled carbon fibers through piezoresistivity tests. Sustainability 2018, 10, 4013. [Google Scholar] [CrossRef] [Green Version]
  49. Liu, X.; Wu, S. Research on the conductive asphalt concrete’s piezoresistivity effect and its mechanism. Constr. Build. Mater. 2009, 23, 2752–2756. [Google Scholar] [CrossRef]
  50. Boulay, C.; Dal Pont, S.; Belin, P. Real-time evolution of electrical resistance in cracking concrete. Cem. Concr. Res. 2009, 39, 825–831. [Google Scholar] [CrossRef]
  51. Teomete, E.; Kocyigit, O.I. Tensile strain sensitivity of steel fiber reinforced cement matrix composites tested by split tensile test. Constr. Build. Mater. 2013, 47, 962–968. [Google Scholar] [CrossRef]
  52. Luo, X.; Chung, D.D.L. Concrete-concrete pressure contacts under dynamic loading, studied by contact electrical resistance measurement. Cem. Concr. Res. 2000, 30, 323–326. [Google Scholar] [CrossRef]
  53. Nguyen, D.L.; Ngoc-Tra Lam, M.; Kim, D.J.; Song, J. Direct tensile self-sensing and fracture energy of steel-fiber-reinforced concretes. Compos. Part. B Eng. 2020, 183, 107714. [Google Scholar] [CrossRef]
  54. Nguyen, D.L.; Song, J.; Manathamsombat, C.; Kim, D.J. Comparative electromechanical damage-sensing behaviors of six strain-hardening steel fiber-reinforced cementitious composites under direct tension. Compos. Part. B Eng. 2015, 69, 159–168. [Google Scholar] [CrossRef]
  55. Han, B.G.; Han, B.Z.; Ou, J.P. Experimental study on use of nickel powder-filled Portland cement-based composite for fabrication of piezoresistive sensors with high sensitivity. Sens. Actuators A Phys. 2009, 149, 51–55. [Google Scholar] [CrossRef]
  56. Wen, S.; Chung, D.D.L. A comparative study of steel- and carbon-fibre cement as piezoresistive strain sensors. Adv. Cem. Res. 2003, 15, 119–128. [Google Scholar] [CrossRef]
  57. Wen, S.; Chung, D.D.L. Uniaxial compression in carbon fiber-reinforced cement, sensed by electrical resistivity measurement in longitudinal and transverse directions. Cem. Concr. Res. 2001, 31, 297–301. [Google Scholar] [CrossRef]
  58. Wen, S.; Chung, D.D.L. Damage monitoring of cement paste by electrical resistance measurement. Cem. Concr. Res. 2000, 30, 1979–1982. [Google Scholar] [CrossRef]
  59. Wen, S.; Chung, D.D.L. Uniaxial tension in carbon fiber reinforced cement, sensed by electrical resistivity measurement in longitudinal and transverse directions. Cem. Concr. Res. 2000, 30, 1289–1294. [Google Scholar] [CrossRef]
  60. Cao, J.; Chung, D.D.L. Defect dynamics and damage of concrete under repeated compression, studied by electrical resistance measurement. Cem. Concr. Res. 2001, 31, 1639–1642. [Google Scholar] [CrossRef]
  61. Chen, B.; Liu, J. Damage in carbon fiber-reinforced concrete, monitored by both electrical resistance measurement and acoustic emission analysis. Constr. Build. Mater. 2008, 22, 2196–2201. [Google Scholar] [CrossRef]
  62. Cao, J.; Chung, D.D.L. Use of fly ash as an admixture for electromagnetic interference shielding. Cem. Concr. Res. 2004, 34, 1889–1892. [Google Scholar] [CrossRef]
  63. Cao, J.; Chung, D.D.L. Coke powder as an admixture in cement for electromagnetic interference shielding. Carbon N. Y. 2003, 41, 2433–2436. [Google Scholar] [CrossRef]
  64. Wen, S.; Chung, D.D.L. Partial replacement of carbon fiber by carbon black in multifunctional cement-matrix composites. Carbon N. Y. 2007, 45, 505–513. [Google Scholar] [CrossRef]
  65. Wang, Z.; Zeng, Q.; Wang, L.; Yao, Y.; Li, K. Electrical resistivity of cement pastes undergoing cyclic freeze-thaw action. J. Mater. Civ. Eng. 2015, 27, 04014109. [Google Scholar] [CrossRef]
  66. Wang, Z.; Zeng, Q.; Wang, L.; Yao, Y.; Li, K. Effect of moisture content on freeze-thaw behavior of cement paste by electrical resistance measurements. J. Mater. Sci. 2014, 49, 4305–4314. [Google Scholar] [CrossRef]
  67. Han, B.; Ou, J. Embedded piezoresistive cement-based stress/strain sensor. Sens. Actuators A Phys. 2007, 138, 294–298. [Google Scholar] [CrossRef]
  68. Cosoli, G.; Mobili, A.; Giulietti, N.; Chiariotti, P.; Pandarese, G.; Tittarelli, F.; Bellezze, T.; Mikanovic, N.; Revel, G.M. Performance of concretes manufactured with newly developed low-clinker cements exposed to water and chlorides: Characterization by means of electrical impedance measurements. Constr. Build. Mater. 2020, 121546. [Google Scholar] [CrossRef]
  69. Taha, H.; McCarte, W.J.; Suryanto, B.; Starrs, G. Frequency- and time-domain dependency of electrical properties of cement-based materials during early hydration. Adv. Civ. Eng. Mater. 2017, 6, 20140367. [Google Scholar] [CrossRef]
  70. AASHTO TP 119—Standard Method of Test for Electrical Resistivity of a Concrete Cylinder Tested in a Uniaxial Resistance Test. Available online: https://standards.globalspec.com/std/9945672/aashto-tp-119 (accessed on 12 August 2020).
  71. Mason, T.O.; Campo, M.A.; Hixson, A.D.; Woo, L.Y. Impedance spectroscopy of fiber-reinforced cement composites. Cem. Concr. Compos. 2002, 24, 457–465. [Google Scholar] [CrossRef]
  72. Kim, J.; Suryanto, B.; McCarter, W.J. Conduction, relaxation and complex impedance studies on Portland cement mortars during freezing and thawing. Cold Reg. Sci. Technol. 2019, 166, 102819. [Google Scholar] [CrossRef]
  73. Osterminski, K.; Polder, R.B.; Schießl, P. Long term behaviour of the resistivity of concrete. Heron 2012, 57, 211–230. [Google Scholar]
  74. Polder, R.B.; Peelen, W.H.A. Characterisation of chloride transport and reinforcement corrosion in concrete under cyclic wetting and drying by electrical resistivity. Cem. Concr. Compos. 2002, 24, 427–435. [Google Scholar] [CrossRef]
  75. Peled, A.; Torrents, J.M.; Mason, T.O.; Shah, S.P.; Garboczi, E.J. Electrical impedance spectra to monitor damage during tensile loading of cement composites. ACI Mater. J. 2001, 98, 313–322. [Google Scholar]
  76. Zeng, X.; Liu, H.; Zhu, H.; Ling, C.; Liang, K.; Umar, H.A.; Xie, Y.; Long, G.; Ma, C. Study on damage of concrete under uniaxial compression based on electrical resistivity method. Constr. Build. Mater. 2020, 254, 119270. [Google Scholar] [CrossRef]
  77. McCarter, W.J.; Chrisp, T.M.; Starrs, G.; Blewett, J. Characterization and monitoring of cement-based systems using intrinsic electrical property measurements. Cem. Concr. Res. 2003, 33, 197–206. [Google Scholar] [CrossRef]
  78. Rovnaník, P.; Kusák, I.; Bayer, P.; Schmid, P.; Fiala, L. Comparison of electrical and self-sensing properties of Portland cement and alkali-activated slag mortars. Cem. Concr. Res. 2019, 118, 84–91. [Google Scholar] [CrossRef]
  79. Van Noort, R.; Hunger, M.; Spiesz, P. Long-term chloride migration coefficient in slag cement-based concrete and resistivity as an alternative test method. Constr. Build. Mater. 2016, 115, 746–759. [Google Scholar] [CrossRef]
  80. McCarter, W.J.; Starrs, G.; Kandasami, S.; Jones, R.; Chrisp, M. Electrode configurations for resistivity measurements on concrete. ACI Mater. J. 2009, 106, 258–264. [Google Scholar] [CrossRef]
  81. Spragg, R.; Castro, J.; Nantung, T.; Paredes, E.; Weiss, W.J. Variability Analysis of the Bulk Resistivity Measured Using Concrete Cylinders; Joint Transportation Research Program, Indiana Department of Transportation and Purdue University: West Lafayette, IN, USA, 2011. [Google Scholar]
  82. Newlands, M.D.; Jones, M.R.; Kandasami, S.; Harrison, T.A. Sensitivity of electrode contact solutions and contact pressure in assessing electrical resistivity of concrete. Mater. Struct. Constr. 2008, 41, 621–632. [Google Scholar] [CrossRef]
  83. Sato, T.; Beaudoin, J.J. Coupled AC impedance and thermomechanical analysis of freezing phenomena in cement paste. Mater. Struct. 2011, 44, 405–414. [Google Scholar] [CrossRef]
  84. Perron, S.; Beaudoin, J.J. Freezing of water in portland cement paste—An ac impedance spectroscopy study. Cem. Concr. Compos. 2002, 24, 467–475. [Google Scholar] [CrossRef] [Green Version]
  85. Zhou, C.; Li, K.; Han, J. Characterizing the effect of compressive damage on transport properties of cracked concretes. Mater. Struct. 2012, 45, 381–392. [Google Scholar] [CrossRef]
  86. Díaz, B.; Freire, L.; Merino, P.; Nóvoa, X.R.; Pérez, M.C. Impedance spectroscopy study of saturated mortar samples. Electrochim. Acta 2008, 53, 7549–7555. [Google Scholar] [CrossRef]
  87. Carsana, M.; Canonico, F.; Bertolini, L. Corrosion resistance of steel embedded in sulfoaluminate-based binders. Cem. Concr. Compos. 2018, 88, 211–219. [Google Scholar] [CrossRef]
  88. Ghosh, P.; Tran, Q. Influence of parameters on surface resistivity of concrete. Cem. Concr. Compos. 2015, 62, 134–145. [Google Scholar] [CrossRef]
  89. Velay-Lizancos, M.; Azenha, M.; Martínez-Lage, I.; Vázquez-Burgo, P. Addition of biomass ash in concrete: Effects on E-Modulus, electrical conductivity at early ages and their correlation. Constr. Build. Mater. 2017, 157, 1126–1132. [Google Scholar] [CrossRef]
  90. Wang, Y.; Gong, F.; Zhang, D.; Ueda, T. Estimation of ice content in mortar based on electrical measurements under freeze-thaw cycle. J. Adv. Concr. Technol. 2016, 14, 35–46. [Google Scholar] [CrossRef] [Green Version]
  91. Zhu, Y.; Zhang, H.; Zhang, Z.; Dong, B.; Liao, J. Monitoring the cracking behavior of engineered cementitious composites (ECC) and plain mortar by electrochemical impedance measurement. Constr. Build. Mater. 2019, 209, 195–201. [Google Scholar] [CrossRef]
  92. Balestra, C.E.T.; Reichert, T.A.; Pansera, W.A.; Savaris, G. Evaluation of chloride ion penetration through concrete surface electrical resistivity of field naturally degraded structures present in marine environment. Constr. Build. Mater. 2020, 230, 116979. [Google Scholar] [CrossRef]
  93. ASTM G57—06(2012) Standard Test Method for Field Measurement of Soil Resistivity Using the Wenner Four-Electrode Method. Available online: https://www.astm.org/Standards/G57.htm (accessed on 12 August 2020).
  94. Mendes, S.E.S.; Oliveira, R.L.N.; Cremonez, C.; Pereira, E.; Pereira, E.; Medeiros-Junior, R.A. Electrical resistivity as a durability parameter for concrete design: Experimental data versus estimation by mathematical model. Constr. Build. Mater. 2018, 192, 610–620. [Google Scholar] [CrossRef]
  95. AASHTO T 358. Standard Method of Test for Surface Resistivity Indication of Concrete’s Ability to Resist Chloride Ion Penetration; AASHTO: Washington, DC, USA.
  96. Tibbetts, C.M.; Paris, J.M.; Ferraro, C.C.; Riding, K.A.; Townsend, T.G. Relating water permeability to electrical resistivity and chloride penetrability of concrete containing different supplementary cementitious materials. Cem. Concr. Compos. 2020, 107, 103491. [Google Scholar] [CrossRef]
  97. Florida Department of Transportation FM 5-578. Florida Method of Test for Concrete Resistivity as an Electrical Indicator of Its Permeability; Florida Department of Transportation: Tallahassee, FL, USA, 2004; pp. 4–7.
  98. Wiwattanachang, N.; Giao, P.H. Monitoring crack development in fiber concrete beam by using electrical resistivity imaging. J. Appl. Geophys. 2011, 75, 294–304. [Google Scholar] [CrossRef]
  99. Alhajj, M.A.; Palma-Lopes, S.; Villain, G. Accounting for steel rebar effect on resistivity profiles in view of reinforced concrete structure survey. Constr. Build. Mater. 2019, 223, 898–909. [Google Scholar] [CrossRef]
  100. Ramezanianpour, A.A.; Pilvar, A.; Mahdikhani, M.; Moodi, F. Practical evaluation of relationship between concrete resistivity, water penetration, rapid chloride penetration and compressive strength. Constr. Build. Mater. 2011. [Google Scholar] [CrossRef]
  101. Tanesi, J.; Ardani, A. Surface resistivity test evaluation as an indicator of the chloride permeability of concrete. TechBrief 2012, 1–6. [Google Scholar] [CrossRef]
  102. Presuel-Moreno, F.; Wu, Y.Y.; Liu, Y. Effect of curing regime on concrete resistivity and aging factor over time. Constr. Build. Mater. 2013, 48, 874–882. [Google Scholar] [CrossRef]
  103. Medeiros, R.A.; Lima, M.G. Electrical resistivity of unsaturated concrete using different types of cement. Constr. Build. Mater. 2016, 107, 11–16. [Google Scholar] [CrossRef]
  104. Kessler, R.J.; Powers, R.G.; Paredes, M.A. Resistivity Measurements of Water Saturated Concrete as an Indicator of Permeability; Florida Department of Transportation: Gainesville, FL, USA, 2005.
  105. Morris, W.; Vico, A.; Vazquez, M.; De Sanchez, S.R. Corrosion of reinforcing steel evaluated by means of concrete resistivity measurements. Corros. Sci. 2002, 44, 81–99. [Google Scholar] [CrossRef]
  106. Gowers, K.R.; Millard, S.G. Measurement of Concrete Resistivity for Assessment of Corrosion Severity of Steel Using Wenner Technique. Mater. J. 1999, 96, 536–541. [Google Scholar] [CrossRef]
  107. UNE 83988-2:2014 Concrete Durability. Test Methods. Determination of the Electrical Resistivity. Part 2: Four Points or Wenner Method. Available online: https://www.une.org/encuentra-tu-norma/busca-tu-norma/norma?c=N0052651 (accessed on 12 August 2020).
  108. Sengul, O.; Gjørv, O.E. Effect of embedded steel on electrical resistivity measurements on concrete structures. ACI Mater. J. 2009, 106, 11–18. [Google Scholar] [CrossRef]
  109. Millard, S.; Sadowski, L. Novel method for linear polarisation resistance corrosion measurement. In Proceedings of the NDTCE’09 Non-Destructive Testing in Civil Engineering, Nantes, France, 30 June–3 July 2009. [Google Scholar]
  110. Sadowski, L. New non-destructive method for linear polarisation resistance corrosion rate measurement. Arch. Civ. Mech. Eng. 2010, 10, 109–116. [Google Scholar] [CrossRef]
  111. Sadowski, L.; Nikoo, M. Corrosion current density prediction in reinforced concrete by imperialist competitive algorithm. Neural Comput. Appl. 2014, 25, 1627–1638. [Google Scholar] [CrossRef] [PubMed] [Green Version]
  112. Sadowski, L. Non-destructive investigation of corrosion current density in steel reinforced concrete by artificial neural networks. Arch. Civ. Mech. Eng. 2013, 13, 104–111. [Google Scholar] [CrossRef]
  113. Sadowski, L. Methodology for assessing the probability of corrosion in concrete structures on the basis of half-cell potential and concrete resistivity measurements. Sci. World J. 2013, 2013. [Google Scholar] [CrossRef] [PubMed] [Green Version]
  114. Zhang, J.; Monteiro, P.J.M.; Morrison, H.F. Noninvasive surface measurement of corrosion impedance of reinforcing bar in concrete—Part 1: Experimental results. ACI Mater. J. 2001, 98, 116–125. [Google Scholar] [CrossRef]
  115. Zhang, J.; Monteiro, P.J.M.; Morrison, H.F. Noninvasive surface measurement of corrosion impedance of reinforcing bar in concrete—Part 2: Forward modeling. ACI Mater. J. 2002, 99, 242–249. [Google Scholar] [CrossRef]
  116. Zhang, J.; Monteiro, P.J.M.; Morrison, H.F.; Mancio, M. Noninvasive surface measurement of corrosion impedance of reinforcing bar in concrete—Part 3: Effect of geometry and material properties. ACI Mater. J. 2004, 101, 273–280. [Google Scholar] [CrossRef]
  117. Nguyen, A.Q.; Klysz, G.; Deby, F.; Balayssac, J.P. Assessment of the electrochemical state of steel reinforcement in water saturated concrete by resistivity measurement. Constr. Build. Mater. 2018, 171, 455–466. [Google Scholar] [CrossRef]
  118. Goueygou, M.; Abraham, O.; Lataste, J.F. A comparative study of two non-destructive testing methods to assess near-surface mechanical damage in concrete structures. NDT E Int. 2008, 41, 448–456. [Google Scholar] [CrossRef]
  119. Lataste, J.F.; Sirieix, C.; Breysse, D.; Frappa, M. Electrical resistivity measurement applied to cracking assessment on reinforced concrete structures in civil engineering. NDT E Int. 2003, 36, 383–394. [Google Scholar] [CrossRef]
  120. Yim, H.J.; Bae, Y.H.; Kim, J.H. Method for evaluating segregation in self-consolidating concrete using electrical resistivity measurements. Constr. Build. Mater. 2020, 232, 117283. [Google Scholar] [CrossRef]
  121. Azhari, F.; Banthia, N. Cement-based sensors with carbon fibers and carbon nanotubes for piezoresistive sensing. Cem. Concr. Compos. 2012, 34, 866–873. [Google Scholar] [CrossRef]
  122. Lee, S.H.; Kim, S.; Yoo, D.Y. Hybrid effects of steel fiber and carbon nanotube on self-sensing capability of ultra-high-performance concrete. Constr. Build. Mater. 2018, 185, 530–544. [Google Scholar] [CrossRef]
  123. Fan, S.; Li, X.; Li, M. The effects of damage and self-healing on impedance spectroscopy of strain-hardening cementitious materials. Cem. Concr. Res. 2018, 106, 77–90. [Google Scholar] [CrossRef]
  124. Loche, J.M.; Ammar, A.; Dumargue, P. Influence of the migration of chloride ions on the electrochemical impedance spectroscopy of mortar paste. Cem. Concr. Res. 2005, 35, 1797–1803. [Google Scholar] [CrossRef]
  125. Yim, H.J.; Lee, H.; Kim, J.H. Evaluation of mortar setting time by using electrical resistivity measurements. Constr. Build. Mater. 2017, 146, 679–686. [Google Scholar] [CrossRef]
  126. Yu, J.; Sasamoto, A.; Iwata, M. Wenner method of impedance measurement for health evaluation of reinforced concrete structures. Constr. Build. Mater. 2019, 197, 576–586. [Google Scholar] [CrossRef]
  127. FHWA. Long-Term Bridge Performance. Available online: https://highways.dot.gov/research/long-term-infrastructure-performance/ltbp/long-term-bridge-performance (accessed on 12 August 2020).
  128. Li, Z.; Wei, X.; Li, W. Preliminary interpretation of portland cement hydration process using resistivity measurements. ACI Mater. J. 2003, 100, 253–257. [Google Scholar] [CrossRef]
  129. Li, Z.; Tang, S.; Lu, Y. Pore Structure Analyzer Based on Non-Contact Impedance Measurement for Cement-Based Materials. U.S. Patent US9488635B2, 21 December 2011. [Google Scholar]
  130. Tang, S.W.; Li, Z.J.; Chen, E.; Shao, H.Y. Impedance measurement to characterize the pore structure in Portland cement paste. Constr. Build. Mater. 2014, 51, 106–112. [Google Scholar] [CrossRef]
  131. Tang, S.W.; Li, Z.J.; Zhu, H.G.; Shao, H.Y.; Chen, E. Permeability interpretation for young cement paste based on impedance measurement. Constr. Build. Mater. 2014, 59, 120–128. [Google Scholar] [CrossRef]
  132. Li, Z.; Li, W. Contactless, Transformer-Based Measurement of the Resistivity of Materials. U.S. Patent US6639401B2, 19 July 2001. [Google Scholar]
  133. Wei, X.; Xiao, L. Influence of the aggregate volume on the electrical resistivity and properties of portland cement concretes. J. Wuhan Univ. Technol. Mater. Sci. Ed. 2011, 26, 965–971. [Google Scholar] [CrossRef]
  134. Wei, X.; Tian, K.; Xiao, L. Prediction of compressive strength of Portland cement paste based on electrical resistivity measurement. Adv. Cem. Res. 2010, 22, 165–170. [Google Scholar] [CrossRef]
  135. Wei, X.; Xiao, L.; Li, Z. Prediction of standard compressive strength of cement by the electrical resistivity measurement. Constr. Build. Mater. 2012, 31, 341–346. [Google Scholar] [CrossRef]
  136. Lianzhen, X.; Xiaosheng, W. Early age compressive strength of pastes by electrical resistivity method and maturity method. J. Wuhan Univ. Technol. Sci. Ed. 2011. [Google Scholar] [CrossRef]
  137. Shao, H.; Zhang, J.; Fan, T.; Li, Z. Electrical method to evaluate elastic modulus of early age concrete. Constr. Build. Mater. 2015, 101, 661–666. [Google Scholar] [CrossRef]
  138. Xiao, L.; Li, Z. Early-age hydration of fresh concrete monitored by non-contact electrical resistivity measurement. Cem. Concr. Res. 2008, 38, 312–319. [Google Scholar] [CrossRef]
  139. Guthrie, W.S.; Baxter, J.S.; Mazzeo, B.A. Vertical electrical impedance testing of a concrete bridge deck using a rolling probe. NDT E Int. 2018, 95, 65–71. [Google Scholar] [CrossRef]
  140. Guthrie, W.S.; Mazzeo, B.A. Vertical impedance testing for assessing protection from chloride-based deicing salts provided by an asphalt overlay system on a concrete bridge deck. In Proceedings of the Cold Regions Engineering, Salt Lake City, UT, USA, 19–22 July 2015; American Society of Civil Engineers: Reston, VA, USA, 2015; Volume 2015, pp. 358–369. [Google Scholar]
  141. Argyle, H.M. Sensitivity of Electrochemical Impedance Spectroscopy Measurements to Concrete Bridge Deck Properties. Master’s Thesis, Ira A. Fulton College of Engineering and Technology, Civil and Environmental Engineering, Provo, UT, USA, 20 March 2014. [Google Scholar]
  142. Bartholomew, P.D.; Guthrie, W.S.; Mazzeo, B.A. Vertical impedance measurements on concrete bridge decks for assessing susceptibility of reinforcing steel to corrosion. Rev. Sci. Instrum. 2012, 83. [Google Scholar] [CrossRef] [PubMed]
  143. Melara, E.K.; Mendes, A.Z.; Andreczevecz, N.C.; Bragança, M.O.G.P.; Carrera, G.T.; Medeiros-Junior, R.A. Monitoring by electrochemical impedance spectroscopy of mortars subjected to ingress and extraction of chloride ions. Constr. Build. Mater. 2020, 242, 118001. [Google Scholar] [CrossRef]
  144. ASTM G106—89(2015) Standard Practice for Verification of Algorithm and Equipment for Electrochemical Impedance Measurements. Available online: https://www.astm.org/Standards/G106.htm (accessed on 14 May 2020).
  145. Page, C.L.; Treadaway, K.W.J.; Bamforth, P.B. Corrosion of Reinforcement in Concrete; Elsevier Applied Science Publishers Ltd: Amsterdam, The Netherlands, 1990; ISBN 1851664874. [Google Scholar]
  146. ISO. GUM ISO/IEC Guide 98-3:2008 Uncertainty of Measurement—Part 3: Guide to the Expression of Uncertainty in Measurement (GUM:1995); ISO: Geneva, Switzerland, 2008. [Google Scholar]
  147. Bourreau, L.; Bouteiller, V.; Schoefs, F.; Gaillet, L.; Thauvin, B.; Schneider, J.; Naar, S. Uncertainty assessment of concrete electrical resistivity measurements on a coastal bridge. Struct. Infrastruct. Eng. 2019, 15, 443–453. [Google Scholar] [CrossRef]
  148. Andrade, C.; Gulikers, J.; Polder, R.; Raupach, M. RILEM TC 154-EMC: Electrochemical techniques for measuring metallic corrosion, half-cell potential measurements—Potential mapping on reinforced concrete structures. Mater. Struct. Matrriaux Constr. 2003, 36, 461–471. [Google Scholar]
  149. Morris, W.; Moreno, E.I.; Sagüés, A.A. Practical evaluation of resistivity of concrete in test cylinders using a Wenner array probe. Cem. Concr. Res. 1996, 26, 1779–1787. [Google Scholar] [CrossRef]
  150. Andrade, C.; Polder, R.; Basheer, M. Non-Destructive Methods to Measure ion Migration; Torrent, R., Fernandez Luco, L., Eds.; RILEM Publications SARL: Paris, France, 2007; ISBN 978-2-35158-054-7. [Google Scholar]
  151. Lecieux, Y.; Schoefs, F.; Bonnet, S.; Lecieux, T.; Lopes, S.P. Quantification and uncertainty analysis of a structural monitoring device: Detection of chloride in concrete using DC electrical resistivity measurement. Nondestruct. Test. Eval. 2015, 30, 216–232. [Google Scholar] [CrossRef]
  152. Su, T.; Wu, J.; Zou, Z.; Wang, Z.; Yuan, J.; Yang, G. Influence of environmental factors on resistivity of concrete with corroded steel bar. Eur. J. Environ. Civ. Eng. 2019. [Google Scholar] [CrossRef]
  153. Su, J.K.; Yang, C.C.; Wu, W.B.; Huang, R. Effect of moisture content on concrete resistivity measurement. J. Chin. Inst. Eng. Trans. Chinese Inst. Eng. A Chung-kuo K. Ch’eng Hsuch K’an 2002, 25, 117–122. [Google Scholar] [CrossRef]
  154. Zaccardi, Y.A.V.; García, J.F.; Huélamo, P.; Maio, Á.A. Di Influence of temperature and humidity on Portland cement mortar resistivity monitored with inner sensors. Mater. Corros. 2009, 60, 294–299. [Google Scholar] [CrossRef]
  155. Azarsa, P.; Gupta, R. Electrical resistivity of concrete for durability evaluation: A review. Adv. Mater. Sci. Eng. 2017, 2017. [Google Scholar] [CrossRef] [Green Version]
  156. Corva, D.M.; Hosseini, S.S.; Collins, F.; Adams, S.D.; Gates, W.P.; Kouzani, A.Z. Miniature resistance measurement device for structural health monitoring of reinforced concrete infrastructure. Sensors 2020, 20, 4313. [Google Scholar] [CrossRef] [PubMed]
  157. Levita, G.; Marchetti, A.; Gallone, G.; Princigallo, A.; Guerrini, G.L. Electrical properties of fluidified Portland cement mixes in the early stage of hydration. Cem. Concr. Res. 2000, 30, 923–930. [Google Scholar] [CrossRef]
  158. Tang, S.W.; Cai, X.H.; He, Z.; Zhou, W.; Shao, H.Y.; Li, Z.J.; Wu, T.; Chen, E. The review of pore structure evaluation in cementitious materials by electrical methods. Constr. Build. Mater. 2016, 117, 273–284. [Google Scholar] [CrossRef]
  159. Wei, X.; Xiao, L. Kinetics parameters of cement hydration by electrical resistivity measurement and calorimetry. Adv. Cem. Res. 2014, 26, 187–193. [Google Scholar] [CrossRef]
  160. Liu, Z.; Zhang, Y.; Jiang, Q. Continuous tracking of the relationship between resistivity and pore structure of cement pastes. Constr. Build. Mater. 2014, 53, 26–31. [Google Scholar] [CrossRef]
  161. Zhang, J.; Li, Z. Hydration process of cements with superplasticizer monitored by non-contact resistivity measurement. In Proceedings of the Advanced Testing of Fresh Cementtitious Materials, Stuttgart, Germany, 3–4 August 2006; Reinhardt, H.W., Ed.; [Google Scholar]
  162. Itagaki, M.; Suzuki, S.; Shitanda, I.; Watanabe, K.; Nakazawa, H. Impedance analysis on electric double layer capacitor with transmission line model. J. Power Sources 2007, 164, 415–424. [Google Scholar] [CrossRef]
  163. Aligizaki, K.K. Pore Structure of Cement-Based Materials: Testing, Interpretation and Requirements; CRC Press: Boca Raton, FL, USA, 2019; ISBN 9780367863838. [Google Scholar]
  164. Scott, A.; Alexander, M.G. Effect of supplementary cementitious materials (binder type) on the pore solution chemistry and the corrosion of steel in alkaline environments. Cem. Concr. Res. 2016, 89, 45–55. [Google Scholar] [CrossRef]
  165. ASTM C1202. Test Method for Electrical Indication of Concretes Ability to Resist Chloride Ion Penetration; ASTM: Washington, DC, USA, 2019. [Google Scholar]
  166. Tomlinson, D.; Moradi, F.; Hajiloo, H.; Ghods, P.; Alizadeh, A.; Green, M. Early age electrical resistivity behaviour of various concrete mixtures subject to low temperature cycling. Cem. Concr. Compos. 2017, 83, 323–334. [Google Scholar] [CrossRef]
  167. Wang, Z.; Zeng, Q.; Wang, L.; Yao, Y.; Li, K. Characterizing blended cement pastes under cyclic freeze-thaw actions by electrical resistivity. Constr. Build. Mater. 2013, 44, 477–486. [Google Scholar] [CrossRef]
  168. Dinakar, P.; Babu, K.G.; Santhanam, M. Corrosion behaviour of blended cements in low and medium strength concretes. Cem. Concr. Compos. 2007, 29, 136–145. [Google Scholar] [CrossRef]
  169. Yeh, I.C. Generalization of strength versus water-cementitious ratio relationship to age. Cem. Concr. Res. 2006, 36, 1865–1873. [Google Scholar] [CrossRef]
  170. EN 12390-8. Testing Hardened Concrete—Part. 8: Depth of Penetration of Water Under Pressure; CEN: Brussels, Belgium, 2019. [Google Scholar]
  171. Djerbi Tegguer, A.; Bonnet, S.; Khelidj, A.; Baroghel-Bouny, V. Effect of uniaxial compressive loading on gas permeability and chloride diffusion coefficient of concrete and their relationship. Cem. Concr. Res. 2013, 52, 131–139. [Google Scholar] [CrossRef] [Green Version]
  172. Soongswang, P.; Tia, M.; Bloomquist, D.G.; Meletiou, C.; Sessions, L.M. Efficient test setup for determining the water-permeability of concrete. Transp. Res. Rec. 1988, 1204, 77–82. [Google Scholar]
  173. Beushausen, H.; Fernandez Luco, L. Performance-Based Specifications and Control. of Concrete Durability: State-of-the-Art Report RILEM TC 230-PSC; Springer: Dordrecht, The Netherlands, 2015; Volume 18, ISBN 9789401773096. [Google Scholar]
  174. Sengül, Ö. Probabilistic design for the durability of reinforced concrete structural elements exposed to chloride containing environments. Tek. Dergi Tech. J. Turk. Chamb. Civ. Eng. 2011, 22, 5409–5423. [Google Scholar] [CrossRef]
  175. Gulikers, J. Theoretical considerations on the supposed linear relationship between concrete resistivity and corrosion rate of steel reinforcement. Mater. Corros. 2005, 56, 393–403. [Google Scholar] [CrossRef]
  176. Luping, T. Guidelines for Practical Use of Methods for Testing the Resistance of Concrete to Chloride Ingress; Swedish National Testing and Research Institute: Boras, Sweden, 2005. [Google Scholar]
  177. Polder, R.B. Chloride diffusion and resistivity testing of five concrete mixes for marine environment. In RILEM International Workshop on Chloride Penetration into Concrete; Nilsson, L.-O., Ollivier, P., Eds.; Springer Nature: St-Remy-les-Chevreuses, France, 1997; pp. 225–233. [Google Scholar]
  178. Layssi, H.; Ghods, P.; Alizadeh, A.R.; Salehi, M. Electrical resistivity of concrete concepts, applications, and measurement techniques. Concr. Int. 2015, 37, 41–46. [Google Scholar]
  179. ASTM. New Test Method for Measuring the Surface Resistivity of Hardened Concrete Using the Wenner Four-Electrode Method; WK37880 ASTM; American Society of Testing and Materials: Washington, DC, USA, 2014. [Google Scholar]
  180. Whiting, D. Rapid Determination of the Chloride Permeability of Concrete; The Portland Cement Association: Washington, DC, USA, 1981. [Google Scholar]
  181. Julio-Betancourt, G.A.; Hooton, R.D. Study of the Joule effect on rapid chloride permeability values and evaluation of related electrical properties of concretes. Cem. Concr. Res. 2004, 34, 1007–1015. [Google Scholar] [CrossRef]
  182. Sharfuddin Ahmed, M.; Kayali, O.; Anderson, W. Chloride penetration in binary and ternary blended cement concretes as measured by two different rapid methods. Cem. Concr. Compos. 2008, 30, 576–582. [Google Scholar] [CrossRef]
  183. Shi, M.; Chen, Z.; Sun, J. Determination of chloride diffusivity in concrete by AC impedance spectroscopy. Cem. Concr. Res. 1999, 29, 1111–1115. [Google Scholar] [CrossRef]
  184. NT BUILD 492—Concrete, Mortar and Cement-Based Repair Materials: Chloride Migration Coefficient from Non-Steady-State Migration Experiments. Available online: http://www.nordtest.info/index.php/methods/item/concrete-mortar-and-cement-based-repair-materials-chloride-migration-coefficient-from-non-steady-state-migration-experiments-nt-build-492.html (accessed on 21 May 2020).
  185. DURAR. Manual for Inspecting, Evaluating and Diagnosing Corrosion in Reinforced Concrete Structures; Rincon, O.T., Carruyo, A.R., Andrade, C., Helene, P.R.L., Diaz, I., Eds.; CYTED; Ibero-American Program Science and Technology for Development, CYTED Research Network XV.B (DURAR): Maracaibo, Venezuela, 2000; ISBN 980-296-541-3. [Google Scholar]
  186. Reou, J.S.; Ann, K.Y. Electrochemical assessment on the corrosion risk of steel embedment in OPC concrete depending on the corrosion detection techniques. Mater. Chem. Phys. 2009, 113, 78–84. [Google Scholar] [CrossRef]
  187. Vedalakshmi, R.; Dolli, H.; Palaniswamy, N. Embeddable corrosion rate-measuring sensor for assessing the corrosion risk of steel in concrete structures. Control. Health Monit. 2009, 16, 441–459. [Google Scholar] [CrossRef]
  188. Yu, B.; Liu, J.; Chen, Z. Probabilistic evaluation method for corrosion risk of steel reinforcement based on concrete resistivity. Constr. Build. Mater. 2017, 138, 101–113. [Google Scholar] [CrossRef]
  189. ASTM International. ASTM C876—15 Standard Test Method for Corrosion Potentials of Uncoated Reinforcing Steel in Concrete; ASTM Int.: Washington, DC, USA, 2015; pp. 1–8. [Google Scholar] [CrossRef]
  190. Bowler, N.; Huang, Y. Electrical conductivity measurement of metal plates using broadband eddy-current and four-point methods. Meas. Sci. Technol. 2005, 16, 2193. [Google Scholar] [CrossRef] [Green Version]
  191. Polder, R.B. Critical chloride content for reinforced concrete and its relationship to concrete resistivity. Mater. Corros. 2009, 60, 623–630. [Google Scholar] [CrossRef]
  192. Andrade, C.; Sanjuán, M.A.; Recuero, A.; Río, O. Calculation of chloride diffusivity in concrete from migration experiments, in non steady-state conditions. Cem. Concr. Res. 1994, 24, 1214–1228. [Google Scholar] [CrossRef]
  193. Poupard, O.; Aït-Mokhtar, A.; Dumargue, P. Corrosion by chlorides in reinforced concrete: Determination of chloride concentration threshold by impedance spectroscopy. Cem. Concr. Res. 2004, 34, 991–1000. [Google Scholar] [CrossRef]
  194. Alonso, C.; Andrade, C.; González, J.A. Relation between resistivity and corrosion rate of reinforcements in carbonated mortar made with several cement types. Cem. Concr. Res. 1988, 18, 687–698. [Google Scholar] [CrossRef]
  195. Andrade, C.; Alonso, C.; Gulikers, J.; Polder, R.; Cigna, R.; Vennesland, M.; Salta, M.; Raharinaivo, A.; Elsener, B. Test methods for on-site corrosion rate measurement of steel reinforcement in concrete by means of the polarization resistance method. Mater. Struct. Constr. 2004, 37, 623–643. [Google Scholar] [CrossRef]
  196. Hope, B.B.; Page, J.A.; Ip, A.K.C. Corrosion rates of steel in concrete. Cem. Concr. Res. 1986, 16, 771–781. [Google Scholar] [CrossRef]
  197. Bertolini, L.; Polder, R.B. Concrete Resistivity and Reinforcement Corrosion Rate as a Function of Temperature and Humidity of the Environment; TNO Report 97-BT-R0574; Netherlands Organisation for Applied Scientific Research: Delft, The Netherlands, 1997; Volume 273, pp. 12466–12475. [Google Scholar]
  198. Millard, S.; Broomfield, J. Measuring the corrosion rate of reinforced concrete using linear polarisation resistance. Concrete 2003, 37, 36–38. [Google Scholar]
  199. Hoła, J.; Schabowicz, K. New technique of nondestructive assessment of concrete strength using artificial intelligence. NDT E Int. 2005, 38, 251–259. [Google Scholar] [CrossRef]
  200. He, S.; Zou, Y.; Quan, D.; Wang, H. Application of RBF neural network and ANFIS on the prediction of corrosion rate of pipeline steel in soil. In Lecture Notes in Electrical Engineering; Springer: Berlin/Heidelberg, Germany, 2012; Volume 124, pp. 639–644. [Google Scholar]
  201. Ribeiro, D.V.; Abrantes, J.C.C. Application of electrochemical impedance spectroscopy (EIS) to monitor the corrosion of reinforced concrete: A new approach. Constr. Build. Mater. 2016, 111, 98–104. [Google Scholar] [CrossRef]
  202. McCarter, W.J.; Ezirim, H.; Emerson, M. Properties of concrete in the cover zone: Water penetration, sorptivity and ionic ingress. Mag. Concr. Res. 1996, 48, 149–156. [Google Scholar] [CrossRef]
  203. Oleiwi, H.M.; Wang, Y.; Curioni, M.; Chen, X.; Yao, G.; Augusthus-Nelson, L.; Ragazzon-Smith, A.H.; Shabalin, I. An experimental study of cathodic protection for chloride contaminated reinforced concrete. Mater. Struct. 2018, 51, 148. [Google Scholar] [CrossRef] [Green Version]
  204. McCarter, W.J.; Starrs, G.; Chrisp, T.M.; Basheer, P.A.M.; Nanukuttan, S.V.; Srinivasan, S. Conductivity/activation energy relationships for cement-based materials undergoing cyclic thermal excursions. J. Mater. Sci. 2015, 50, 1129–1140. [Google Scholar] [CrossRef] [Green Version]
  205. Scherer, G.W. Crystallization in pores. Cem. Concr. Res. 1999, 29, 1347–1358. [Google Scholar] [CrossRef]
  206. Zeng, Q.; Fen-Chong, T.; Dangla, P.; Li, K. A study of freezing behavior of cementitious materials by poromechanical approach. Int. J. Solids Struct. 2011, 48, 3267–3273. [Google Scholar] [CrossRef]
  207. Ying Li, G.; Ming Wang, P.; Zhao, X. Pressure-sensitive properties and microstructure of carbon nanotube reinforced cement composites. Cem. Concr. Compos. 2007. [Google Scholar] [CrossRef]
  208. Gao, D.; Sturm, M.; Mo, Y.L. Electrical resistance of carbon-nanofiber concrete. Smart Mater. Struct. 2009, 18, 095039. [Google Scholar] [CrossRef]
  209. Li, H.; Xiao, H.G.; Ou, J. Ping effect of compressive strain on electrical resistivity of carbon black-filled cement-based composites. Cem. Concr. Compos. 2006, 28, 824–828. [Google Scholar] [CrossRef]
  210. Monteiro, A.O.; Loredo, A.; Costa, P.M.F.J.; Oeser, M.; Cachim, P.B. A pressure-sensitive carbon black cement composite for traffic monitoring. Constr. Build. Mater. 2017, 154, 1079–1086. [Google Scholar] [CrossRef]
  211. Han, B.; Ding, S.; Yu, X. Intrinsic self-sensing concrete and structures: A review. Meas. J. Int. Meas. Confed. 2015, 59, 110–128. [Google Scholar] [CrossRef]
  212. Wen, S.; Chung, D.D.L. Piezoresistivity in continuous carbon fiber cement-matrix composite. Cem. Concr. Res. 1999, 29, 445–449. [Google Scholar] [CrossRef]
  213. Chung, D.D.L. Piezoresistive Cement-Based Materials for Strain Sensing. J. Intell. Mater. Syst. Struct. 2002, 13, 599–609. [Google Scholar] [CrossRef]
  214. Wen, S.; Chung, D.D.L. Defect dynamics of cement paste under repeated compression studied by electrical resistivity measurement. Cem. Concr. Res. 2001, 31, 1515–1518. [Google Scholar] [CrossRef]
  215. Han, B.; Zhang, K.; Yu, X.; Kwon, E.; Ou, J. Nickel particle-based self-sensing pavement for vehicle detection. Meas. J. Int. Meas. Confed. 2011, 44, 1645–1650. [Google Scholar] [CrossRef]
  216. Han, B.; Yu, X.; Kwon, E. A self-sensing carbon nanotube/cement composite for traffic monitoring. Nanotechnology 2009, 20, 445501. [Google Scholar] [CrossRef]
  217. Acker, P.; Boulay, C.; Rossi, P. On the importance of initial stresses in concrete and of the resulting mechanical effects. Cem. Concr. Res. 1987, 17, 755–764. [Google Scholar] [CrossRef]
  218. Mehta, P.K.; Monteiro, P.J.M. Concrete: Microstructure, Properties, and Materials, 3rd ed.; McGraw-Hill: New York, NY, USA, 2005; ISBN 0071462899. [Google Scholar]
  219. Nemati, K.M.; Monteiro, P.J.M.; Scrivener, K.L. Analysis of compressive stress-induced cracks in concrete. ACI Mater. J. 1998, 95, 617–630. [Google Scholar] [CrossRef]
  220. Bisschop, J.; Van Mier, J.G.M. How to study drying shrinkage microcracking in cement-based materials using optical and scanning electron microscopy? Cem. Concr. Res. 2002, 32, 279–287. [Google Scholar] [CrossRef]
  221. Litorowicz, A. Identification and quantification of cracks in concrete by optical fluorescent microscopy. Cem. Concr. Res. 2006, 36, 1508–1515. [Google Scholar] [CrossRef]
  222. Dal Pont, S.; Durand, S.; Schrefler, B.A. A multiphase thermo-hydro-mechanical model for concrete at high temperatures-Finite element implementation and validation under LOCA load. Nucl. Eng. Des. 2007, 237, 2137–2150. [Google Scholar] [CrossRef]
  223. Loukili, A.; Khelidj, A.; Richard, P. Hydration kinetics, change of relative humidity, and autogenous shrinkage of ultra-high-strength concrete. Cem. Concr. Res. 1999, 29, 577–584. [Google Scholar] [CrossRef]
  224. Hou, T.-C. Wireless and Electromechanical Approaches for Strain Sensing and Crack Detection in Fiber Reinforced Cementitious Materials. Ph.D. Thesis, University of Michigan, Ann Arbor, MI, USA, 2008. [Google Scholar]
Figure 1. Uniaxial method (please note that electric current is measured in series to the power supply, whereas the corresponding potential drop is measured in parallel).
Applsci 10 09152 g001
Figure 2. Wenner array method.
Applsci 10 09152 g002
Figure 3. (a) Percentages of papers reporting DC and AC measurements; (b) Percentages of papers reporting 2- and 4-electrode DC/AC measurements.
Applsci 10 09152 g003
Figure 4. Different electrodes configurations used for electrical resistivity measurement in terms of (a) Materials and (b) Geometries.
Applsci 10 09152 g004
Figure 5. Percentages of papers reporting different application fields.
Applsci 10 09152 g005
Table 1. DC measurements with 2-point probe method.
ReferenceSpecimensElectrodesType of MaterialAdditions
D’Alessandro et al. [38]Cubes: 51 mm (side)Stainless steel nets (1 mm diameter wires at 0.6 mm from each other)ConcreteCNTs
Zhang et al. [39]Prisms: 40 × 40 × 80 mmStainless steel gauzes (20 mm spacing)ConcreteCNTs, nanocarbon black filler
Ding et al. [40]Prisms: 20 × 20 × 40 mmStainless steel gauzes (0.5 mm wire diameter, 2 × 2 mm mesh size)Paste-
Dong et al. [41]Beams: 40 × 40 × 160 mmStainless steel gauzesConcrete-
Melugiri-Shankaramurthy et al. [42]Cubes: 50 mm (side)Copper meshesPaste-
Huang et al. [43]Dog-bonesCopper tapes (4 mm width, 20 mm length)PasteFly ash, carbon black
Wen and Chung [44]Prisms: 150 × 12 × 11 mmSilver paint and copper electrodesPaste-
Chen et al. [45]Prisms: 56 × 56 × 280 mm
Cubes: 100 mm (side)
Brass wiresConcrete-
Lim et al. [46]Beams: 100 × 100 × 400 mmStainless steel plates (10 × 10 × 2 mm)Paste-
Dehghanpour and Yilmaz [47]Cylinders: 75/100/150 mm (diameter) × 150/200/300 mm (length)
Prisms: 75/100/150 × 75/100/150 × 150/200/300 mm
Cubes: 75/100/150 mm (side)
Metal platesConcrete-
Publisher’s Note: MDPI stays neutral with regard to jurisdictional claims in published maps and institutional affiliations.

