Investigation of the Acoustical Environment in A Shopping Mall and Its Correlation to the Acoustic Comfort of the Workers


Department of Biomedical Engineering, School of Applied Medical Sciences, The German-Jordanian University, Amman 11180, Jordan
*
Author to whom correspondence should be addressed.
Appl. Sci. 2020, 10(3), 1170; https://0-doi-org.brum.beds.ac.uk/10.3390/app10031170
Submission received: 21 December 2019
/
Revised: 6 February 2020
/
Accepted: 7 February 2020
/
Published: 9 February 2020
(This article belongs to the Special Issue Advances in Room Acoustics of Non-performing Public Spaces)
Abstract
:Noise in shopping centers and restaurants can reduce intelligibility and affect the comfort of the employees working for long periods in such environments. In this study, the interior acoustics of a shopping mall are studied by measuring the reverberation time (RT), with no occupation, and the equivalent sound pressure levels (LAeq), with occupations at different times of the day, over a period of one week. The measurements were done at different locations, chosen based on their usage (shopping areas, entrances, food courts, and playing area). The values are correlated to the subjective acoustic comfort and the experience of loudness of the staff working at these locations, as measured through a questionnaire. The average RT values that were measured ranged between 0.9 s in the food court and 1.4 s for the main entrance. The LAeq was measured with a minimum of 58 dB in the shopping area in the early morning and a maximum of 83 dB in the playing area in the evening. The results showed an increase in the LAeq for the afternoon and evening in comparison with the early morning and midday time (p < 0.05); similarly, the sound levels for the weekends were higher than the weekdays (p < 0.05). The questionnaire results showed that headaches and difficulties in communicating with others (speech intelligibility) are the most important problems induced by the noise in shopping malls, occurring for 47.1% and 38.2% of respondents, respectively.
1. Introduction
Shopping malls are a modern style of shopping center, taking the place of traditional shopping streets. People visit malls not only for shopping but also for eating, leisure, and socializing. This use of malls produces huge traffic rates in a closed area—even with the existence of open spaces—and results in raised sound levels. This leads to poor acoustic comfort due to the noisy space, and these effects primarily influence the staff working in shopping malls. In the case of a reduction in speech intelligibility, the staff may be forced to raise their voice levels and feel irritated. Further, if the sound pressure levels (SPLs) exceed the recommended 85 dBA limit set by OSHA [1], the potential of permanent hearing loss is increased. Noise’s effects on health can be auditory or non-auditory. The non-auditory effects of noise include, but are not limited to, annoyance, sleeping disorders, working performance, hypertension, and cardiovascular diseases. Adequate noise prevention and control will lower these negative health consequences [2,3].
Studies have been conducted to evaluate the acoustics of shopping malls and food courts and their effects on the patrons and staff. Hopkins highlighted the importance of the problem of indoor ambient noise pollution through a literature review on case studies in a mega-mall, given its impact on the users even when sound-level intensities are moderate. The author believes the solution for this problem lies in the potential economic benefits for the owner in improving acoustic conditions, and not solely on legislative measures [4].
Carvalho and Pereira conducted a study on four shopping malls in Portugal. In their study, they found that the acoustical measurement exceeded the proposed ideal values and that this influenced speech intelligibility. They noticed that the malls lacked acoustical treatment and also lacked the application of absorbent materials on their surfaces [5]. In the case study done by Migneron and Migneron, the staff working in the restaurant in a mall suffered from fatigue and irritation due to their exposure to noise levels (59 dB), even though these levels were far below the dangerous levels of risk for hearing health [6]. Hodgson et al. [7] investigated the reactions of talkers to excessive noise in restaurants and concluded that the customers raised their voices to maintain good communication conditions at an average rate of 0.69 dB per each dB of overall noise. Pimentel et al. investigated the background noise in food courts and found it highly relevant to the SPLs during peak hours (during lunch time) and recommended a reduction in background noise to reduce sound levels during times of occupation [8]. In a study on 30 restaurants done by Rusnock and Bush, the noise levels were low enough to allow normal conversation tones in only 23% of the surveyed restaurants [9].
Even though research has been conducted in shopping malls, the number of studies on employee comfort and experience are still limited. In their study conducted in Sheffield’s Meadowhall, Chen and Kang investigated the objective acoustic characteristics of the atriums of a large shopping mall and their reflections on users and employees through subjective measures and evaluations. The SPL changes clearly with different times of the day and days of the week. The authors suggested that acoustic comfort might correlate to different complicated features and that the staff are more tolerant than customers in terms of comfort [10]. The authors investigated the sources of sounds in shopping malls [10] and in dinning spaces [11] and investigated their influence on the acoustic comfort rating.
Similarly, Dokmeci and Yilmazer showed that the subjective rating of sound levels correlates well with the measured SPLs, and their study further showed a variation in SPLs in the food court of a shopping mall according to day type (weekdays or weekends), as well as the time of the day (morning, noon, afternoon, or evening) [12]. On a larger scale, Meng and Kang conducted a study on the users of shopping malls, with 2134 participants from six shopping malls in China. Their study reflected that income, educational level, and occupation are social characteristics influencing the subjective rating of acoustical comfort [13].
An evaluation of the acoustic comfort of hypermarket workers in Italy was done by Corciata et al. They found the A-weighted percentile sound-pressure level, LA90, and the A-weighted equivalent sound-pressure level, LAeq, best describe the subjective noise sensations in those situations [14].
The previous studies show that the sound levels in shopping centers and malls influence users and workers, with both auditory and non-auditory effects. Even though the use of shopping malls is expanding, there is not enough research on the acoustical comfort levels of the employees in these enclosed public spaces and on their relationship to acoustical parameters. The goals of this work were to measure the LAeq and reverberation time in different acoustic environments in a shopping mall in Jordan, to compare these values with international standards, including the NIOSH limits of 85 dBA for 8 h, and the NFPA 72 for the reverberation time, and to evaluate the subjective loudness and acoustic comfort ratings through a simple subjective survey and correlate these ratings to the acoustical conditions in the different locations in the shopping mall. Further, the main sources of the sounds and the main problems and health issues influenced by these sounds were investigated.
2. Methods
2.1. Sound-Level Measurements
The SPLs were measured at 12 different locations in a large shopping mall located in a very central location in Amman, Jordan. Amman is the capital city of Jordan. The population of Jordan is about 10.3 million, and around 4.3 million people live in the governorate of Amman [15].
The whole mall area is 124,000 m², and the area without parking totals 72,000 m². The number of occupied stores for the period of measurement was 125 stores, and the average number of mall entrances per month is 465,000 persons. The mall is designed with two atriums, where the largest atrium connects all seven floors with each other. For confidentiality, we have not used the mall’s name. In this study, we divided the mall into four areas based on the uses of these areas: The first type of area is the shopping area, which consists of corridors surrounded by different stores. The customers walk along the hallways to enter their goal stores; the facades of the stores are of glass, and the ceiling is made of gypsum boards with metallic structures. The second type of area is represented by the entrances; these areas are similar to the shopping areas in their wall cladding, but with large automatic glass doors. The third area is the food court—a large common seating area surrounded by food service stores; the floor is made of granite or ceramic tiles, the tables are wood covered with Formica, and the chairs are made of wood or plastic. The fourth type of area is the playing area, which consists of a soft floor covered with carpets and a large number of electrically driven metallic playing machines, such as swings, horse carousels, etc.
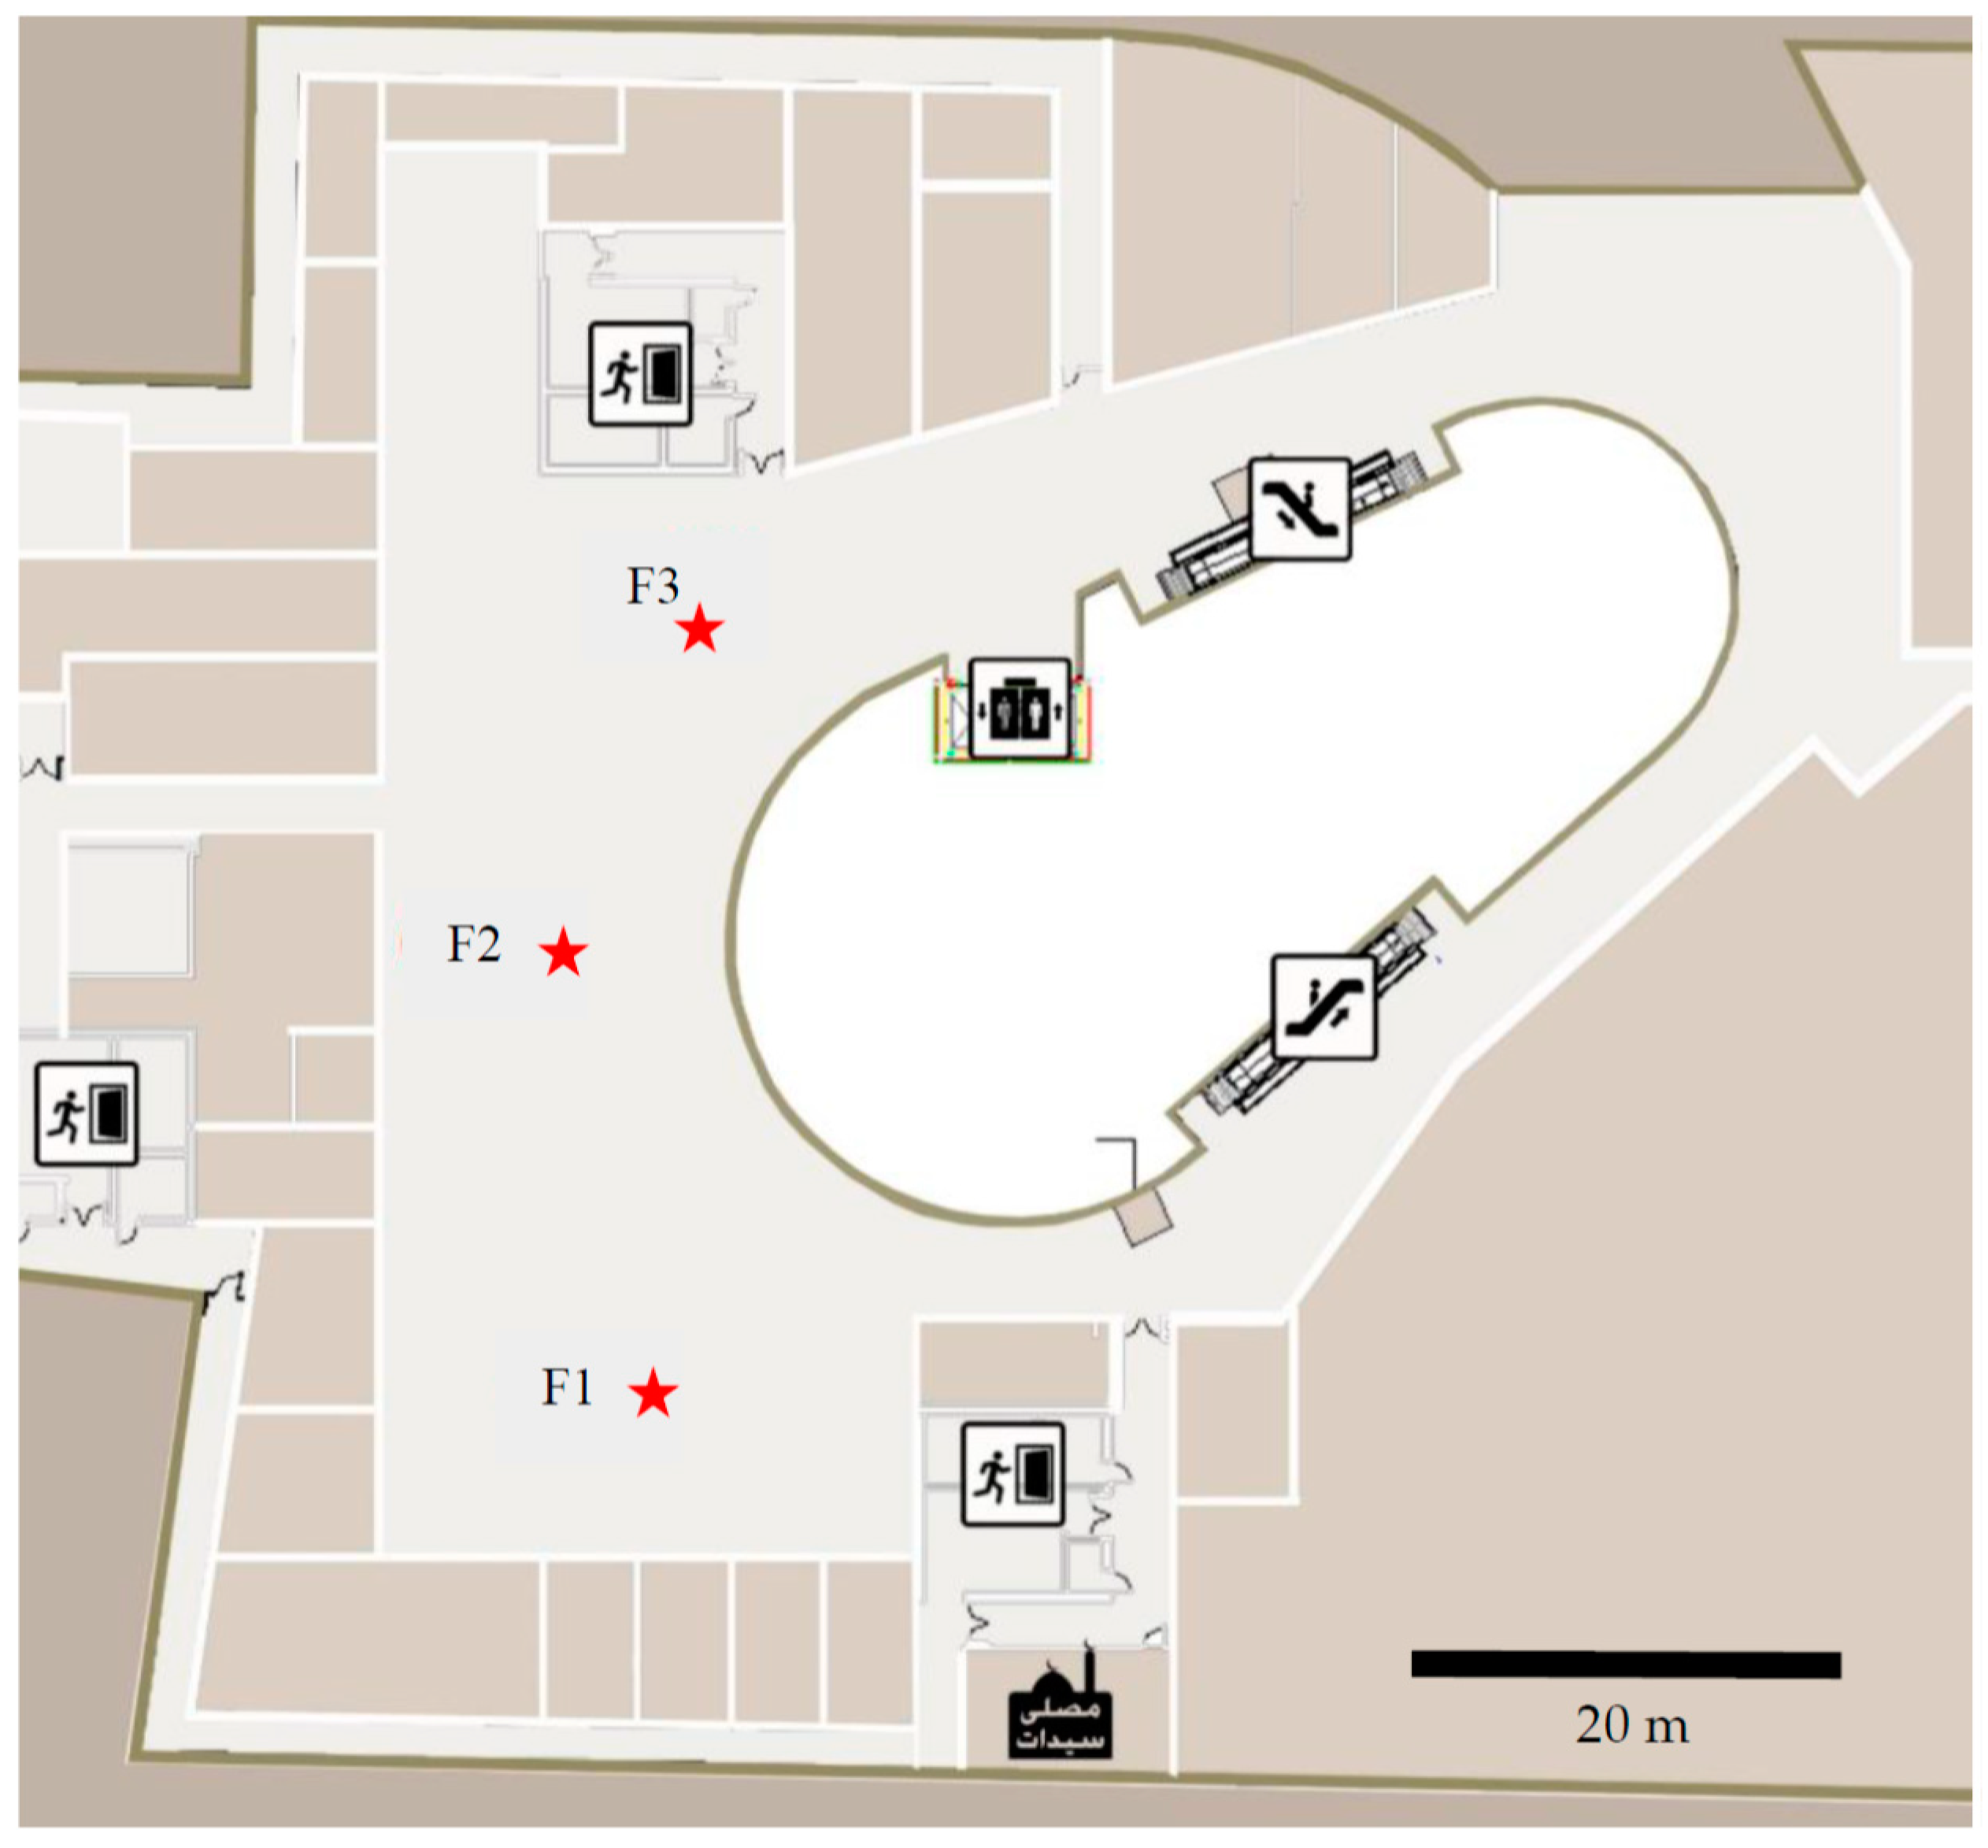
For each area type, we collected measurements at three different locations. Figure 1 and Figure 2 show sample maps of the food court and the ground floor to demonstrate an example of the location of the SPL and reverberation time (RT) measurements. The measurements were collected four times each day (Morning: 10:30–12:30, Midday: 13:30–15:30, Afternoon: 16:30–18:30, and Evening: 19:30–21:30) for a whole week. A total of 48 measurements were done daily, each over a period of 180 s (3 min).
A class 2 sound level meter was used, with a three-minute-long measurement, during which the meter saved an LA measurement twice a second (every 500 ms). The sound-level meter was about 1.35 m from the ground level and at least 1.5 m away from the surrounding reflecting surfaces. The meter was calibrated with a 94 dB acoustic calibrator. Equivalent sound-pressure levels were obtained for each record, and then the equivalent to the three records in each area of use was calculated, using Equation (1), where P1, P2, and P3 are the three measurement locations.
A sample of 60 s of measurements from the food court at the three locations is shown in Figure 3. The sample measurements are for Friday (weekend day) afternoon. It is clear from the sample, that in position 3, the LAeq are higher than the other two locations, which is likely due to the location near the food court entrance and the location near the ice cream shop, which have ringing bells and employees shouting about their products at various intervals.
To measure the LAeq contributions from background music, air-conditioning, and other sources apart from the customers, early morning measurements were performed after opening the mall. These measurements, done on Monday morning, are considered background noise for the shopping areas and entrances, since the mall has a minimal amount of traffic on Monday morning. For the food court and the playing area, Friday early measurements are considered background noise, as the stores in those areas are all closed at that time.
2.2. Reverberation Time
The measurements of reverberation time (RT) were done in a non-occupation mode in the early morning before the opening of the mall on Friday (the weekend), at the same locations used for the measurements of SPLs. No sound sources were present other than the watchers and the permanent sounds of some mechanical devices. The measurements were done while the microphone was held at a height of about 1.35 m from the ground and at least 1.5 m from the surrounding surfaces. The RT measurements are based on impulse excitation and measured in 1/1-octave frequency bands (500, 1000, and 2000 Hz). The decay is measured over the first 20 or 30 dB, after ignoring the first 5 dB of decay and avoiding measurements lower than 10 dB above the background noise, according to the ISO 3382-1 [16]. The measurements are extrapolated to the full 60 dB. The measurements of RT were repeated three times at each location, and the arithmetic mean was calculated.
The recommended RT values differ in the literature from one source to another. For public areas in shopping centers and malls, the reverberation time is linked to the fire code. The NFPA 72 requires the Public Address and Voice Alarm (PA/VA) system to be intelligible and requests a speech intelligibility index (STI) of 0.5 or better for 90% of the space [17]. The STI is heavily influenced by the reverberation time. For very large spaces, such as shopping centers and malls, as well as airports, the aim is to achieve an RT of 1.1–1.32 s (averaged at frequencies of 500, 1000, and 2000 Hz). However, this can be very challenging due to the large volume of these spaces.
2.3. The Questionnaire
To evaluate the subjective effect of LAeq in the mall on the staff working at the different facilities, a survey was conducted using a simple questionnaire consisting of two sets of questions. The first is general demographic questions about the age, gender, educational level, income level, occupation, and working time. The second group of questions is related to hearing problems, as well as the acoustical comfort ratings in the workplace and the included six questions. The questions were structured with a Likert scale (a 5-point scale) in questions 2–4, related to the subjective loudness (very quiet, quiet, fair, noisy, or very noisy), acoustic comfort (ranging from very comfortable to very uncomfortable), and preferences for working in noisy environments (ranging from very good to very bad). Questions 5 and 6 asked about the main source of noise and the main problems and health effects on the employees. The questions used in this study were adopted from different studies investigating the acoustic comfort of people in non-performance spaces [10,11,12,13]. Open-ended questions were avoided. A pilot study was done on five subjects prior to data collection to insure face validity and clarity of the questions. Based on that pilot, the questions were reviewed and formatted. The questionnaire started with a paragraph informing the user of its purpose and taking his/her approval to participate. The questionnaire and the informed consent forms were written in the Arabic language to ensure clarity for the mall employees. The English versions of the questions are shown in Table 1.
The survey was filled electronically, using Google Forms. The survey was conducted in October 2019, over one week. In the selection of the study week, the authors tried to avoid national and religious holidays, to ensure the results represented typical conditions. Participants were fully informed about the study, either by reading the first introductory paragraph and approving it electronically or by one of the researchers verbally for illiterate participants. A non-probability convenience sampling strategy was used, where everyone in each of the four locations was selected to participate, up to a minimum number of filled questionnaires. In total, 110 people were asked to fill out the questionnaire, and out of them, 104 people (94.5%) accepted and completely filled out the questionnaire. Two questionnaires (2%) were discarded because their participants already had permanent hearing problems. The questionnaire was self-administrated while one of the researchers was present during the administration for help. During the data cleaning, all incomplete questionnaires were discarded.
Data were stored in an Excel spreadsheet and then transferred to the commercial MATLAB Program for statistical analysis. Categorical questions were evaluated by the percentage of frequency of occurrence, and the mean values are given for continuous measures. Statistical comparisons between values are provided, where applicable, using a two-tailed N-1 Chi-Square test for different groups and a one-dimensional ANOVA for comparisons between more than two groups. A p < 0.05 was used to indicate a statistically significant difference.
3. Results and Discussion
3.1. The Sound-Pressure Levels
Table 2 shows the LAeq values for the four different areas (entrances, shopping areas, food court, and playing areas) at the different times of day and different weekdays. The minimum LAeq was 58 dB in the shopping area on Monday morning, and the maximum LAeq was 83 dB at the playing area on Friday evening. In comparison with possible noisy industrial environments, the maximum sound levels in the mall are low. These levels do not exceed the 80–85 dBA levels for eight working hours that may create problems and noise-induced hearing loss [18]. However, the annoyance problems are not just related to the sound-pressure levels, but also to the type of noise (children yelling, objects dragging on the floor, music, or electromechanical-systems sounds) and to other environmental factors, like temperature, lighting, and humidity [13,19].
The range of the LAeq in the playing area was the highest (71–83 dBA), followed by the food court (61–76 dBA), which included levels that may interfere with speech intelligibility. On the other hand, the sound-pressure levels in the shopping areas were the lowest (58–70 dBA), followed by the entrances (60–71 dBA). The differences in LAeq between the different locations is statistically significant, with p < 0.001 (F = 364.91), calculated using a repeated measures ANOVA. The significant difference in LAeq applies to the relation between all locations. The playing areas and food courts showed the highest sound-pressure levels, LAeq, with a very clear difference between the early morning and evening periods for the food court. This is due to the large number of users dining there in the evening, compared with other times of day, and on the weekend, compared with the weekdays. The sources of the sounds included people talking loudly, children playing and yelling, employees of restaurants shouting, background music, and dragging chairs.
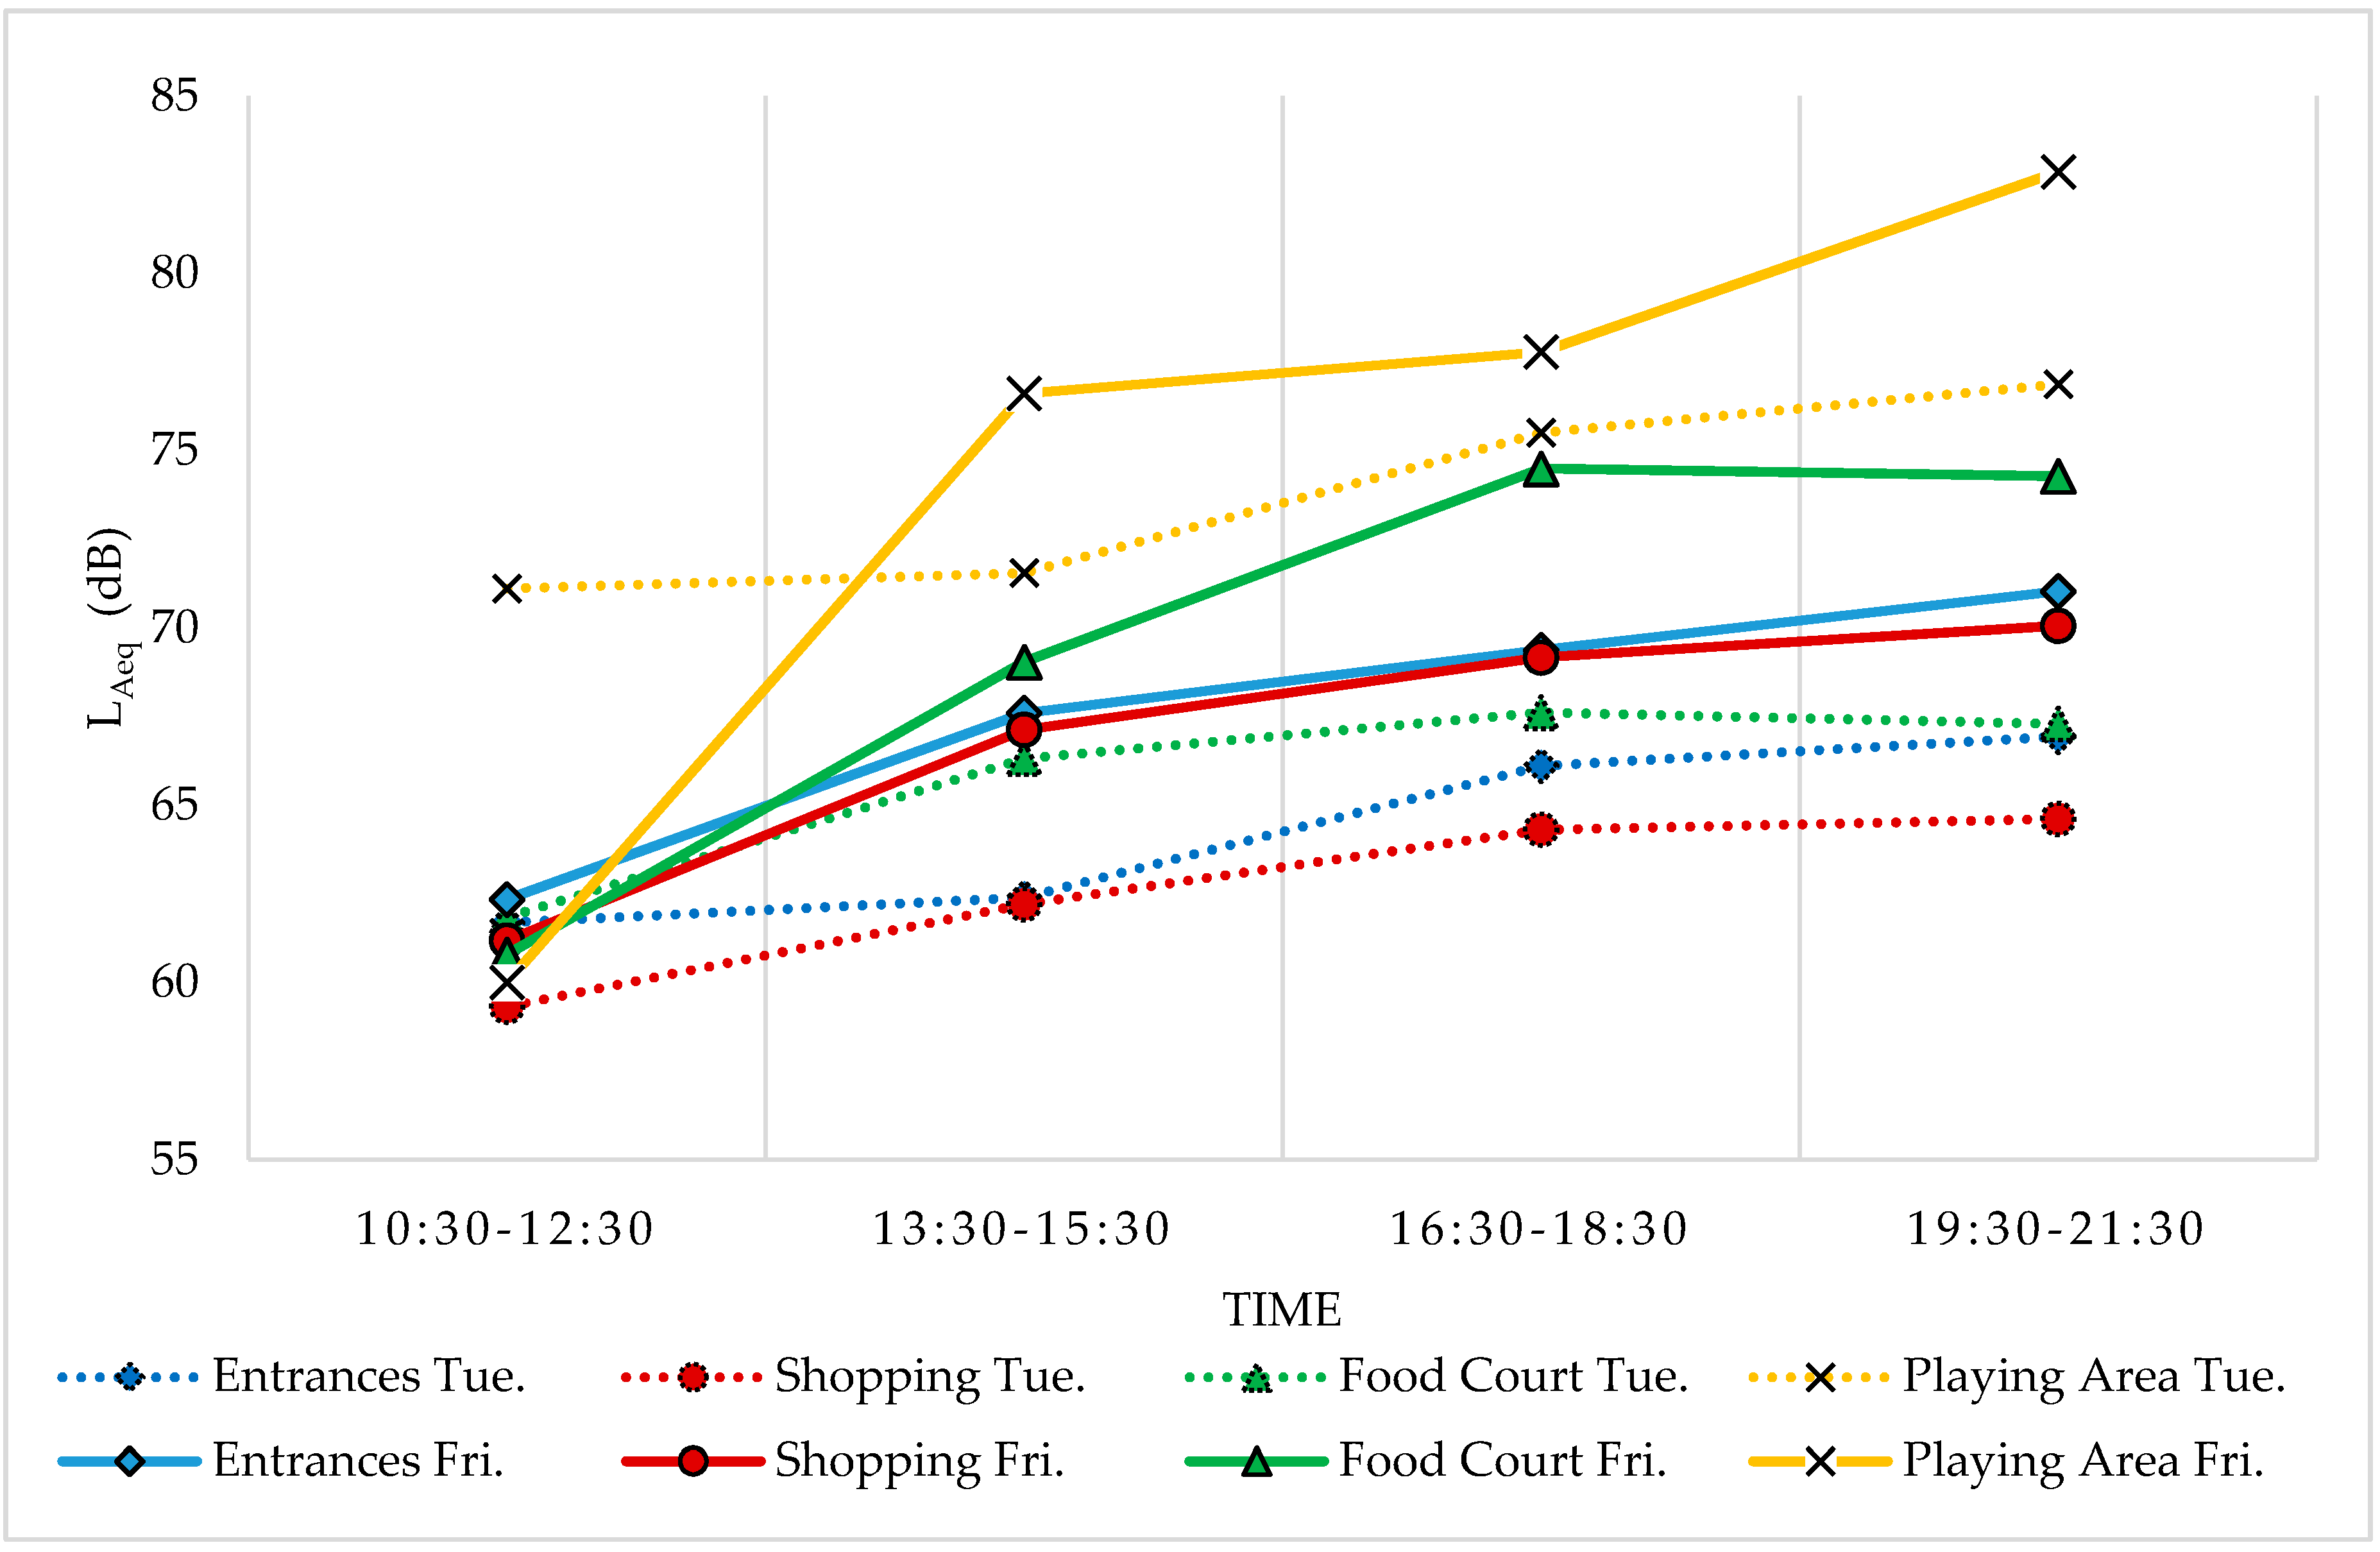
The fluctuations in the LAeq are visible between the early morning time and the late evening time, and similarly between the weekdays and weekend days. Figure 4 shows the measurement of LAeq of two days (Tuesday (a weekday) and Friday (a weekend day)). On both weekend days and weekdays, the LAeq increases from the early morning to the evening, and the differences range from 5 to 9 dB at the entrances, from 5 to 9 dB in the shopping areas, from 5 to 13 dB in the food courts, and was 6 dB in the playing areas for the mentioned days. We notice that the minimum changes occurred in the playing area, which could be related to the already high background noise due the sounds of the gaming consoles and the toys used in this area (trains, horses, swing carousels, etc.). The analysis of the differences in LAeq at different times within the day, over the whole week, were shown to be statistically significant, with p < 0.001 (F = 54.24), using a repeated-measures ANOVA. However, in a pairwise comparison, the difference in the LAeq between the last two sessions (afternoon (16:30–18:30) and Evening (19:30–21:30)) was statistically not significant p > 0.10.
Referring to the changes in the LAeq according to the day of the week, the levels on Thursday and Friday are the highest. Thursdays are the last working day in the week, and many employees go out on this day with friends, for dining or for shopping, before heading home for the weekend. This is likely why Thursdays are more active. The repeated-measures ANOVA showed a significant difference in the LAeq between the different days of the week, with p < 0.001 (F = 12.43). However, a detailed analysis for the different pairs of days showed that the most significant differences are found between Thursday and Friday, on the one hand, and between Monday, Tuesday, and Wednesday, on the other hand, with p < 0.05.
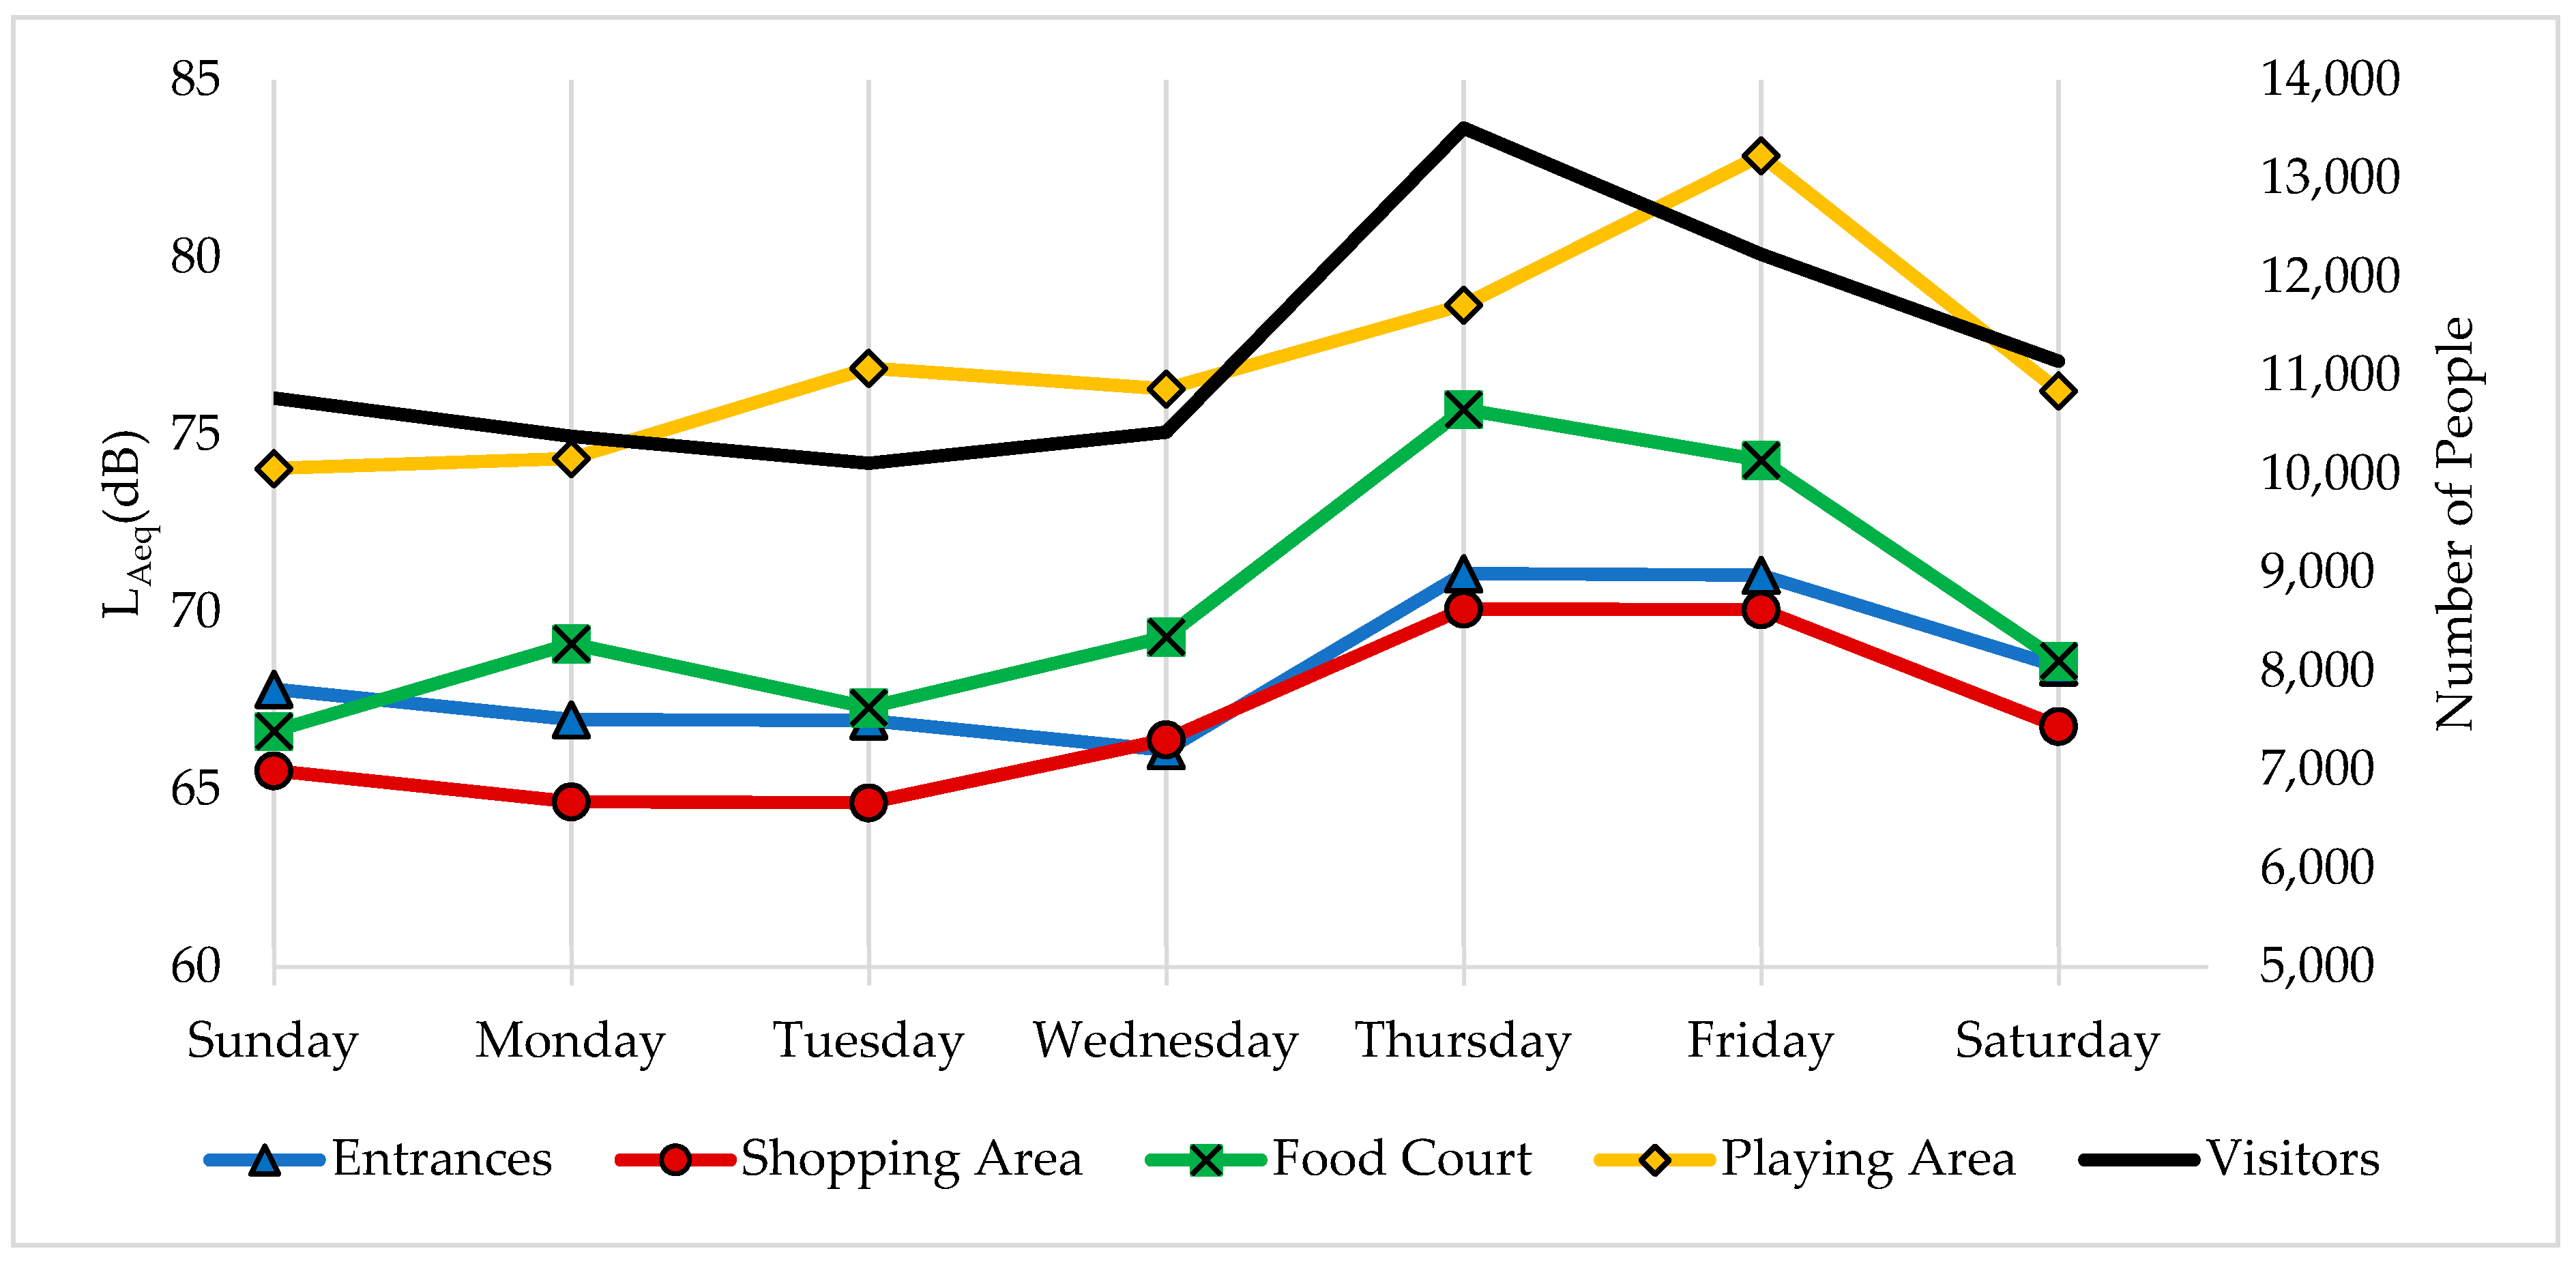
Saturday and Sunday showed the lowest difference in LAeq compared with the other days of the week. This can be explained by the relatively large number of customers in the early morning of Saturday doing shopping before the beginning of the new week, and the lower number of customers in the evening, as potential customers are at home, resting for the new week. On Sunday, in the early morning, the LAeq was also higher due to the activities in the shops, such as cleaning and product arrangement for the new week. Figure 5 shows a sample measurement from the different locations on the evening sessions across the week. The increment in the LAeq on Thursday and Friday is clear in comparison with other days of the week. The changes in LAeq in the playing area and the food court over the week are more remarkable when compared with the entrances and the shopping areas. Figure 5 also shows the number of daily visitors over the whole week. The maximum increment in the number of visitors was on Thursday and Friday, which are the days with the maximum LAeq.
During the measurement process, the background noise while the mall was occupied was relatively high because of many sources, including continuous cleaning activities, the oscillators used in the area, the air-conditioning systems, and the different machines. This background noise may force the users of the mall to talk and interact louder [7]. In comparison with a sample of studies done in Turkey [12], the average LAeq was 63.5 dBA on the weekdays and 68.3 dBA on the weekends, in Portugal (66.9–70.1 dBA) [5] and in Italy (68.8 dBA) [14]. This study shows higher average sound levels during weekdays (LAeq = 70 dB) and on the weekend (LAeq = 74 dB), but is comparable with [10], where the sound-pressure levels were around 65–80 dBA. Similar to these results, other researchers [10,12] have reported increases in the LAeq between weekdays and weekends and increases in the LAeq from the early morning to its highest values in the evening. The only exception is the food court on Saturday evening (the last day of the weekend), where the sound level decreases due to the reduced density of users, as most users tend to rest that evening before starting the new week. However, more analysis needs to be done on the users of the shopping mall to understand their behavior and why they visit the mall at different times, to correlate those factors to changes in the sound levels.
3.2. The Reverberation Time
The results of reverberation time showed variations from one location to another. The longest reverberation time was found in the location of Gate 1 (1.4 s). This location is in the center of the atrium and open to the high glass ceiling of the mall. This location also represents the largest open volume in the mall, with many glass facades and reflecting facades, which increases the reflection delays and increases reverberation. The other gates (RT: 1.2 and 1.1 s) also showed relatively high reverberation times in comparison with the rest of the mall, as they also have large open areas with high ceilings covered with sound-reflecting surfaces. The shopping areas also have RT values near to those of the entrances, as they are open to the atriums, which makes the surrounding ceilings and overall volume high. The results in the mall fall within the recommended values for large areas, according to the speech intelligibility index needs that are used in safety codes like the NFPA 72 [17].
For the food court, the average reverberation time is 0.96 s (ranging between 0.91 and 0.99 s). This is mainly due the sound-absorbing surfaces surrounding the area, which include perforated ceiling panels and a relatively low ceiling. Table 3 shows the measurements for the different locations in the mall.
In comparison with the study done on four shopping malls in Portugal [5], where the average RT values ranged from 1.7 to 3.2 s, the studies done in a large atrium within a shopping center in Italy and a sport hall [20,21], where the T30 values ranged between 1.72 and 2.23 s before acoustical modification for the atrium and around 6 s for the sport hall, and the study in the UK [10], where the RT values exceeded 2 s over the frequencies of 500, 1000, and 2000 Hz, the results in this mall are well below these values, ranging from 0.9 s to 1.4 s; and these results match the ideally recommended values between 1.1–1.32 s.
3.3. Questionnaire Results
Data considered in the analysis were taken from 102 people working in the mall with no known hearing problems. Their average age was 27 years (±8.16). The sample consisted of 78 males and 26 females, whose educational levels were 48% (n = 49) and who had a university degree or were university students; 51% (n = 53) were primary school or high school graduates. The income of 79.4% (n = 78) was around average, and 20.6% (n = 21) was below average. The authors attempted to select similar numbers of participants from each type of area. However, from the playing area, only 15 participants were found; 27 participants were found from the entrance areas, 29 participants from the food court, and 31 participants from the shopping area.
The employees work around 8 h a day and six days a week, and only 6.9% (n = 7) work only on the evening shift. The remainder, 93.1%, work on different shifts (morning, afternoon, or evening).
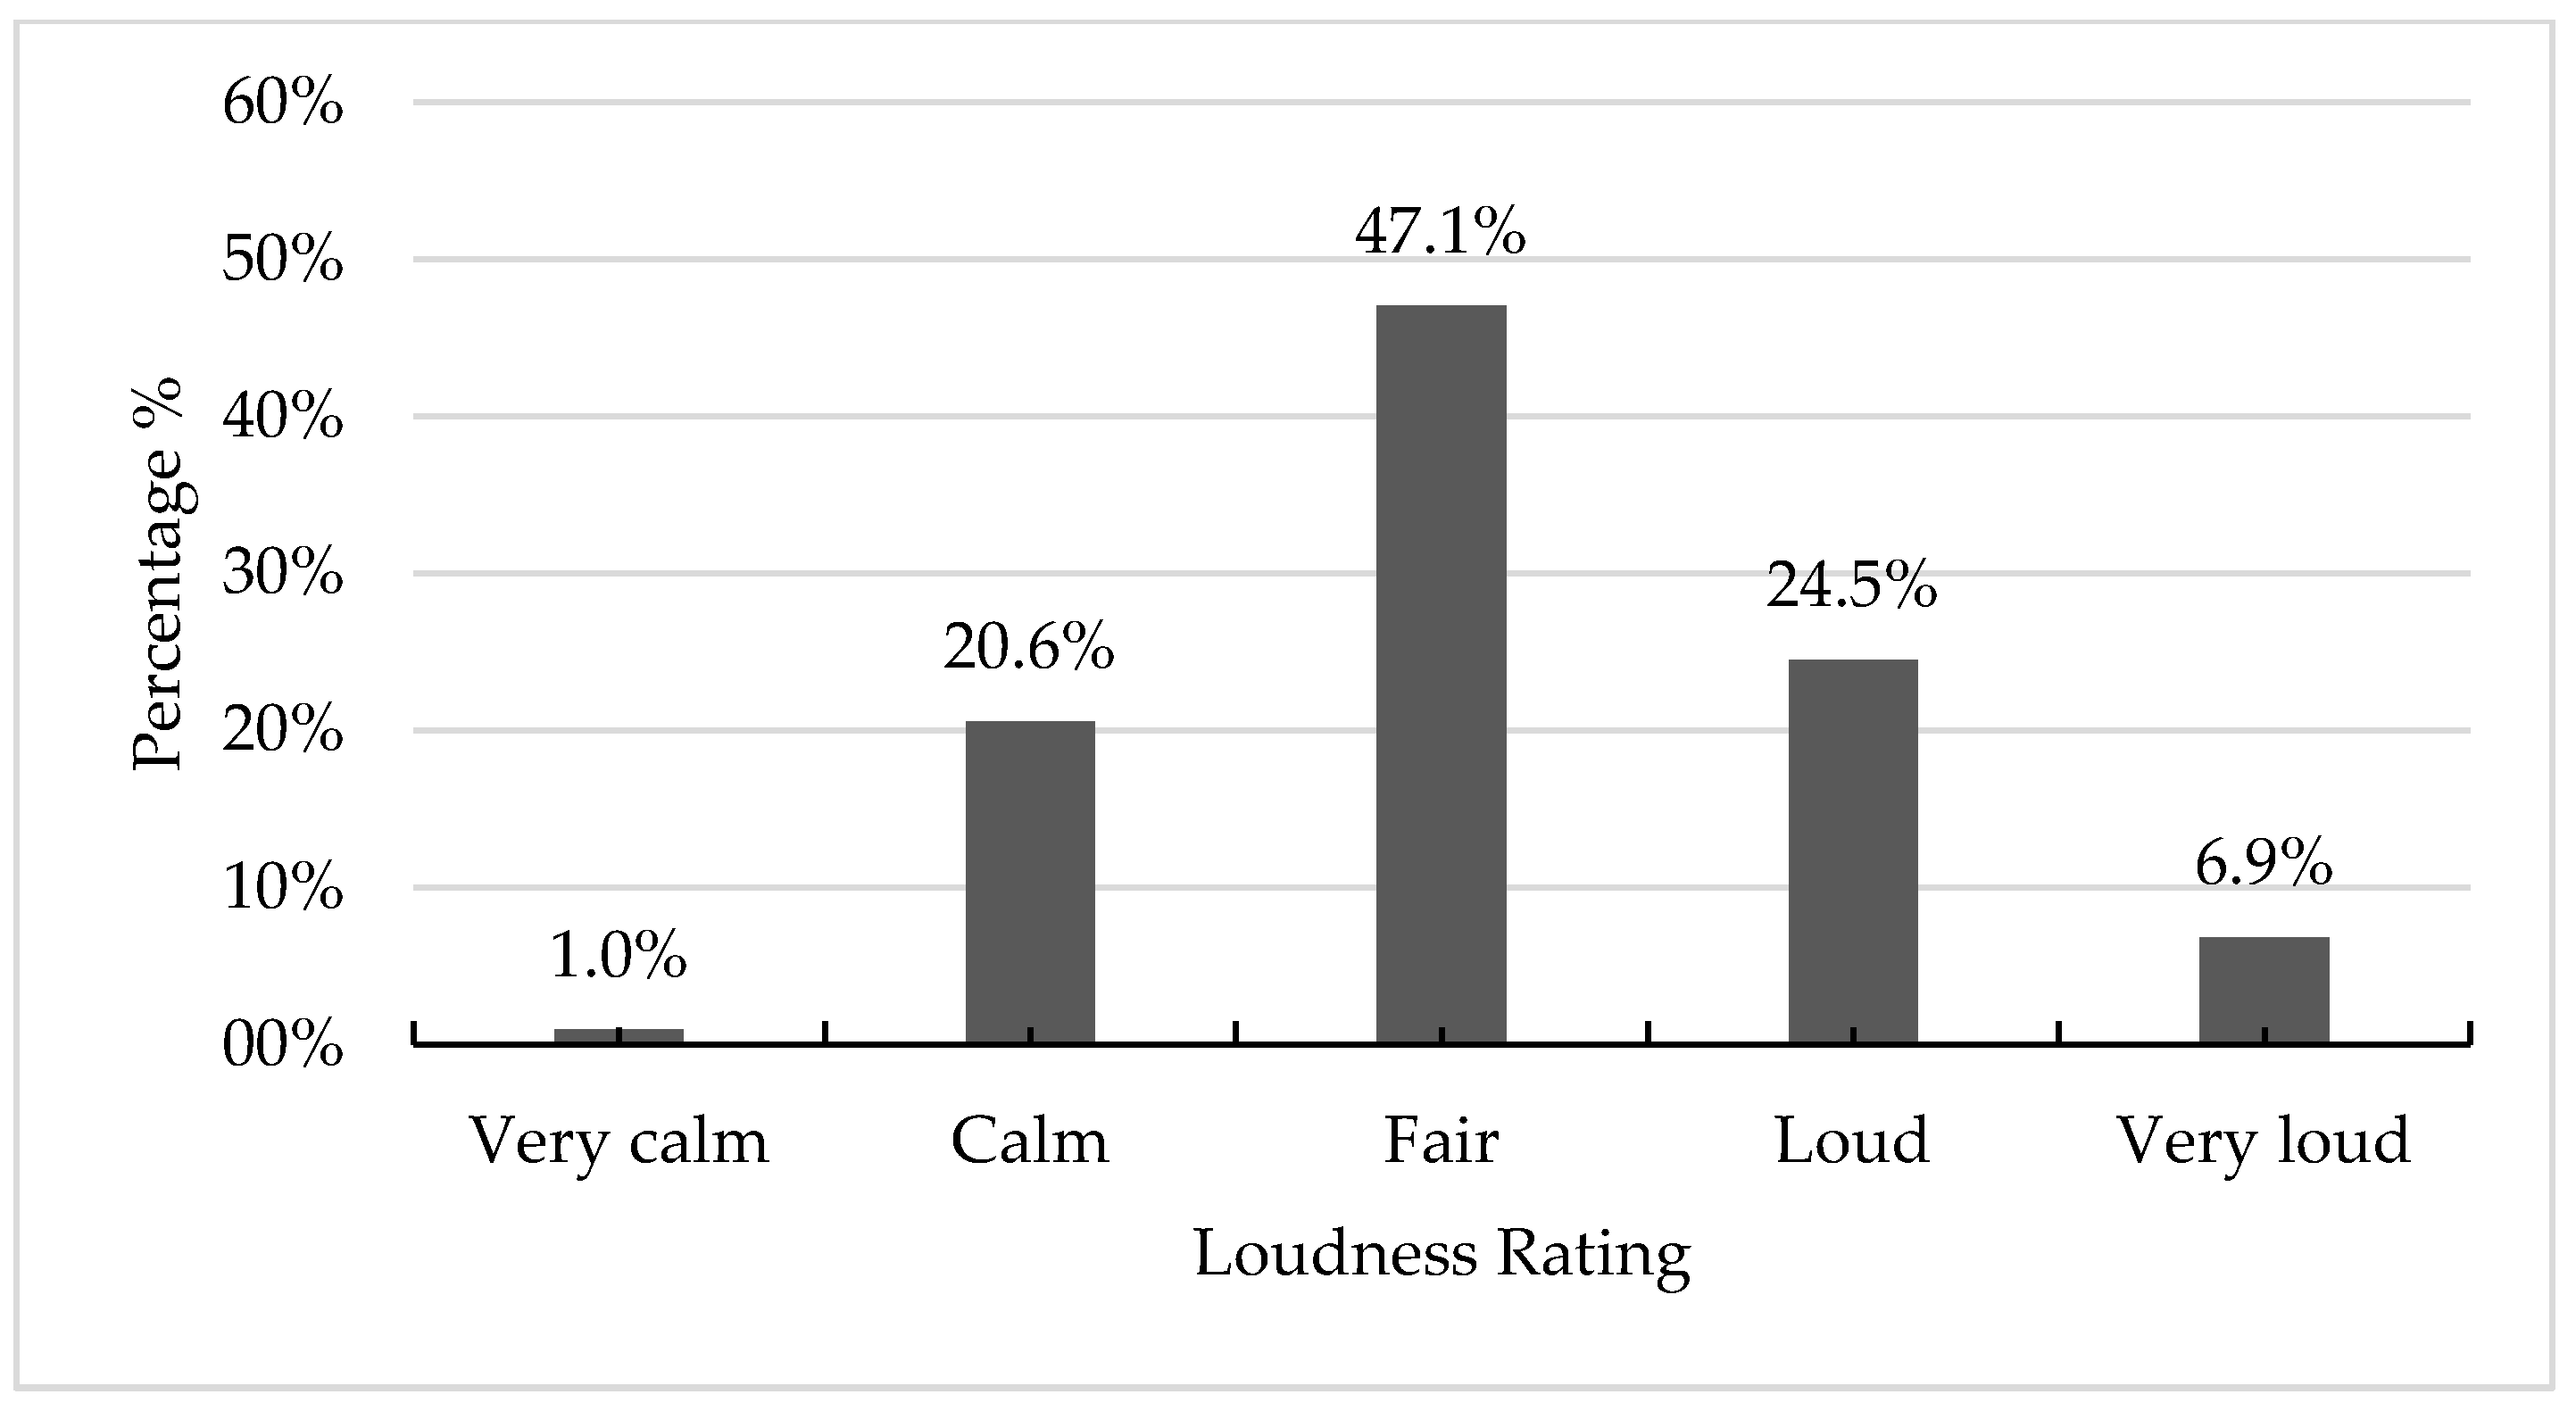
In order to gather information on the subjective rating of the noise levels/loudness in the different mall areas, two questions were asked. The first was used to evaluate the overall rating of loudness in the mall, and the second was used to evaluate the employee’s experience of acoustic comfort. The results showed that 47.1% of the employees believe that the sound-pressure levels are fair, 31.4% chose noisy or very noisy, and 21.6% chose quiet or very quiet. The average score was 3.16 out of five, which is above 3, i.e., a fair/neutral level of loudness in the mall. Figure 6 displays the percentage results of the questions for each answer.
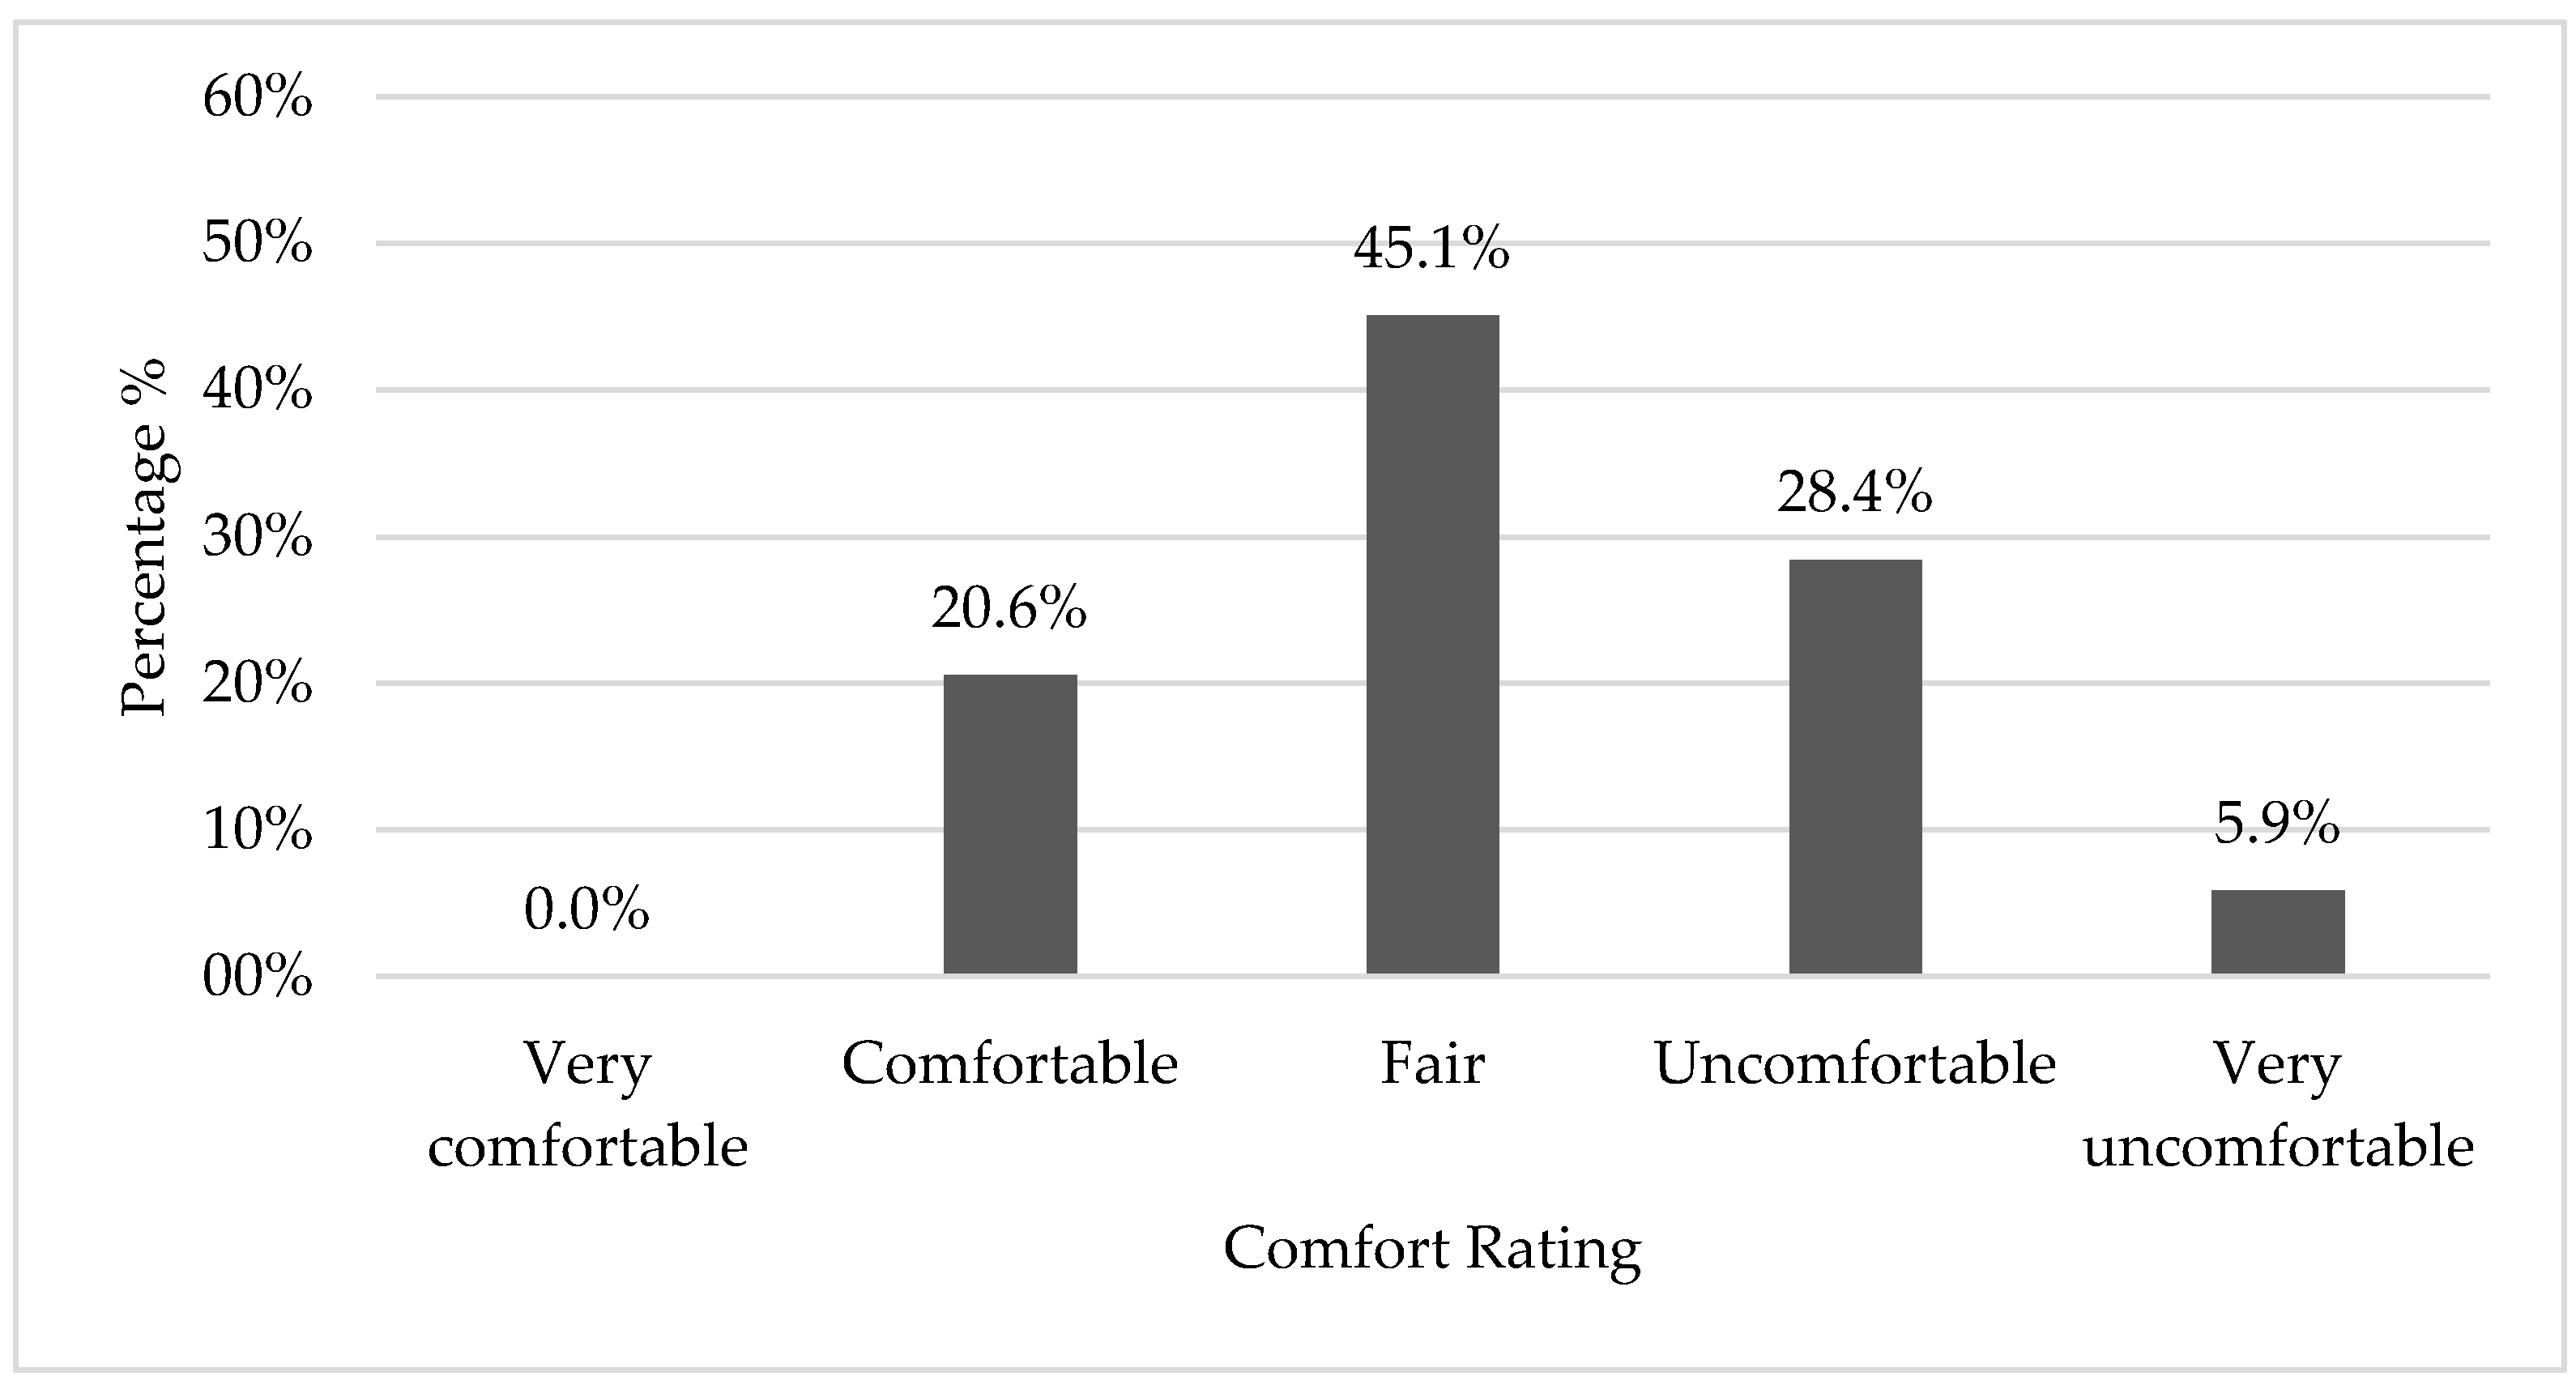
For acoustic comfort, the results were similar to those found for the loudness rating. The majority rated the acoustic comfort as fair, 34.3% rated it as uncomfortable or very uncomfortable, and the rest 20.6% rated it as comfortable. None of the users rated the mall as very comfortable. Figure 7 shows the detailed percentages. Even though the LAeq in the mall was high in comparison with other studies discussed previously [5,12,14]. The average score of acoustic comfort was 3.2, which is also above the neutral level of 3, indicating that the mall tended to be marginally acoustically uncomfortable for users. A study done within young adults in Jordan [22] showed that 36.7% of the participants believe hearing loss and hearing problems are not a big problem or not a problem at all. This may explain the relatively marginal tendency in evaluating the mall’s acoustical conditions as uncomfortable.
The study done by Meng and Kang [13] resulted in an overall sound-loudness rating for six different sites, ranging between 3.20 and 3.52 out of 5, and an acoustic comfort between 2.73 and 3.41 out of 5, on a scale starting with very uncomfortable and ending with very comfortable, opposite to the scale in this study. These results, when considered as average values, indicate that the users considered the loudness and acoustic comfort at different sites as relatively fair, even though the LAeq exceeded 70 dB. Similarly, in this study, the participants rated the sound levels and the acoustic comfort as fair in general. However, a study done in the food courts by Dokmeci and Yilmazer [12] found a higher subjective rating of loudness, with more than half (51.3%) rating the sound levels as high or very high, even though the SPLs in that study were less than those in this study. The difference from this study may relate to the sample type, which consisted of employees working for a long time in this atmosphere, many of whom are probably used to the relatively loud sounds in comparison with the customers in [12].
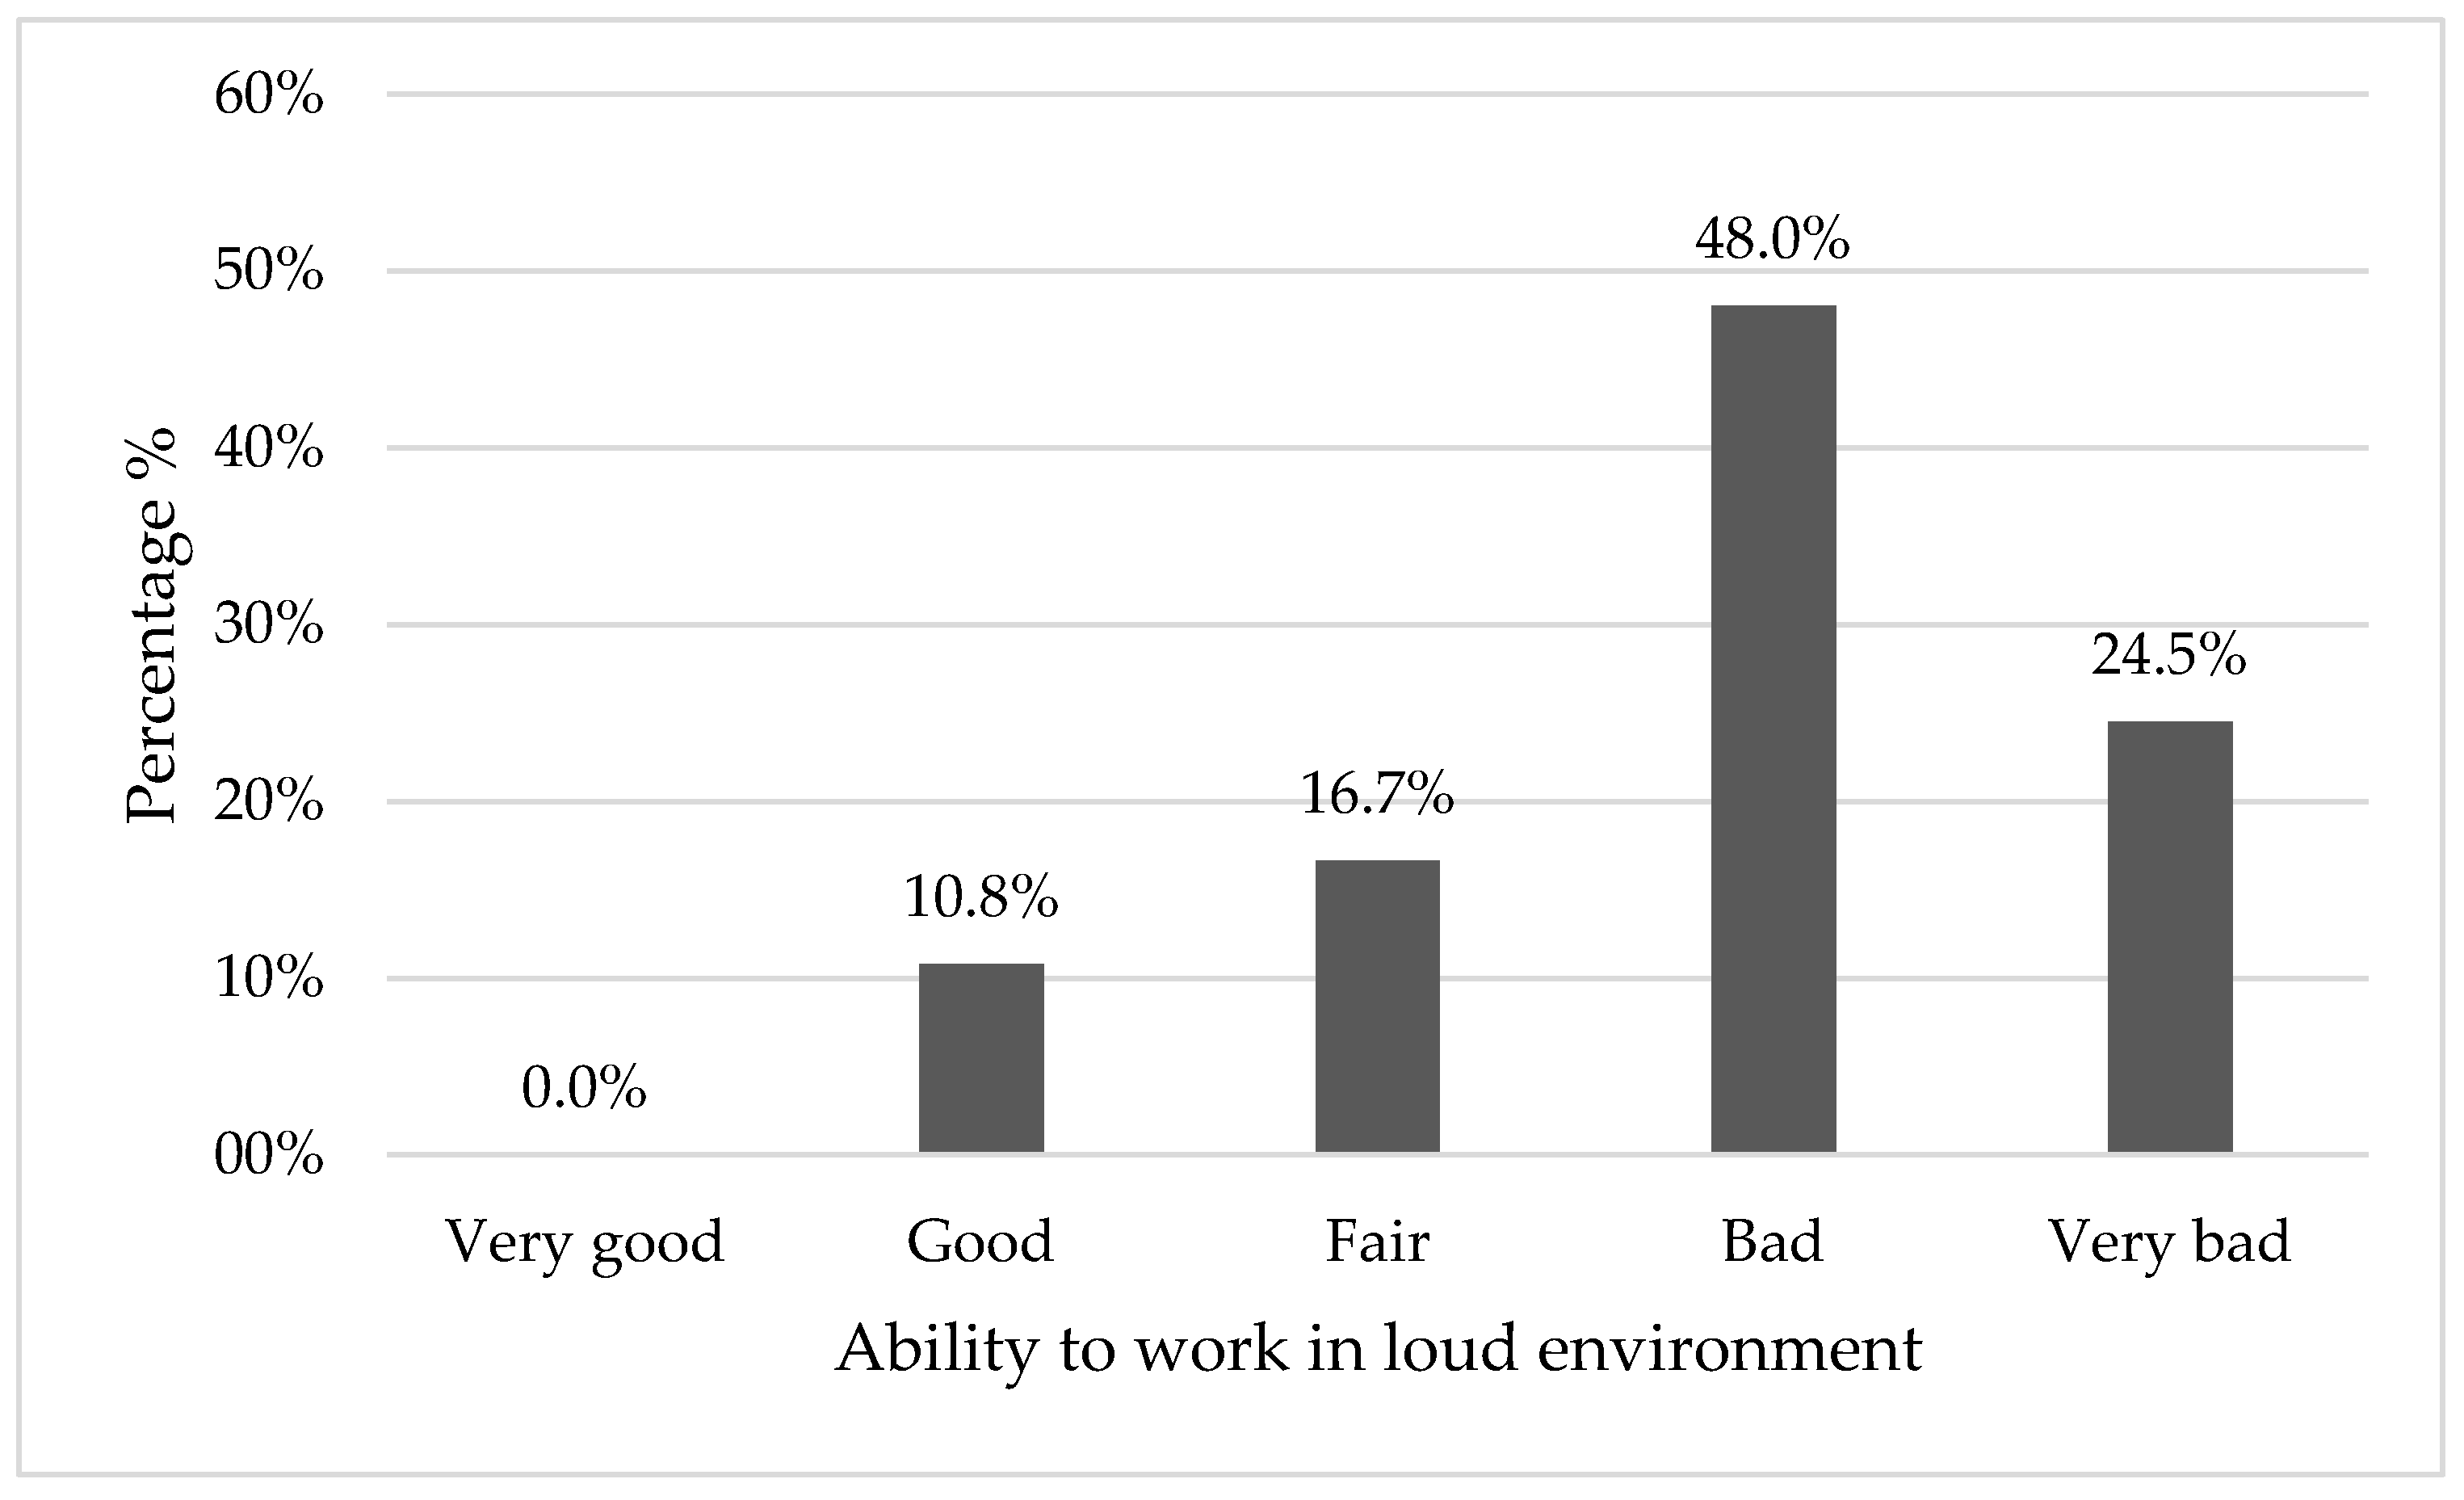
In order to understand the perception of the employees regarding noise and loud sounds, the employees were asked about their ability to work in noisy places, either in this mall or elsewhere. Most of the participating employees (72.5%) said it is bad or very bad to work in noisy places. The average score was 3.86, which means the employees disliked working in noisy environments. The detailed employee view of working in noisy environments is shown in Figure 8.
In a study in Jordan about the awareness of noise-induced hearing loss, 64.1% of participants perceived hearing loss as a problem or a big problem. However, only 9.8% of them have ever tried to protect their hearing from loud sounds, and the rest did not, either because they did not know about hearing protection or had adapted to and enjoy these loud sounds [22]. This relates to the results in this study, where 72.5% believe it is bad or very bad to work in loud environments, even though most of the employees (68.7%) rated the loudness in the mall as fair or better. The authors believe the people are unaware of the importance of protecting their hearing and of the possible other effects of loud sounds on their health, and they had adapted to the environment they live in with no tendency to change it or improve it.
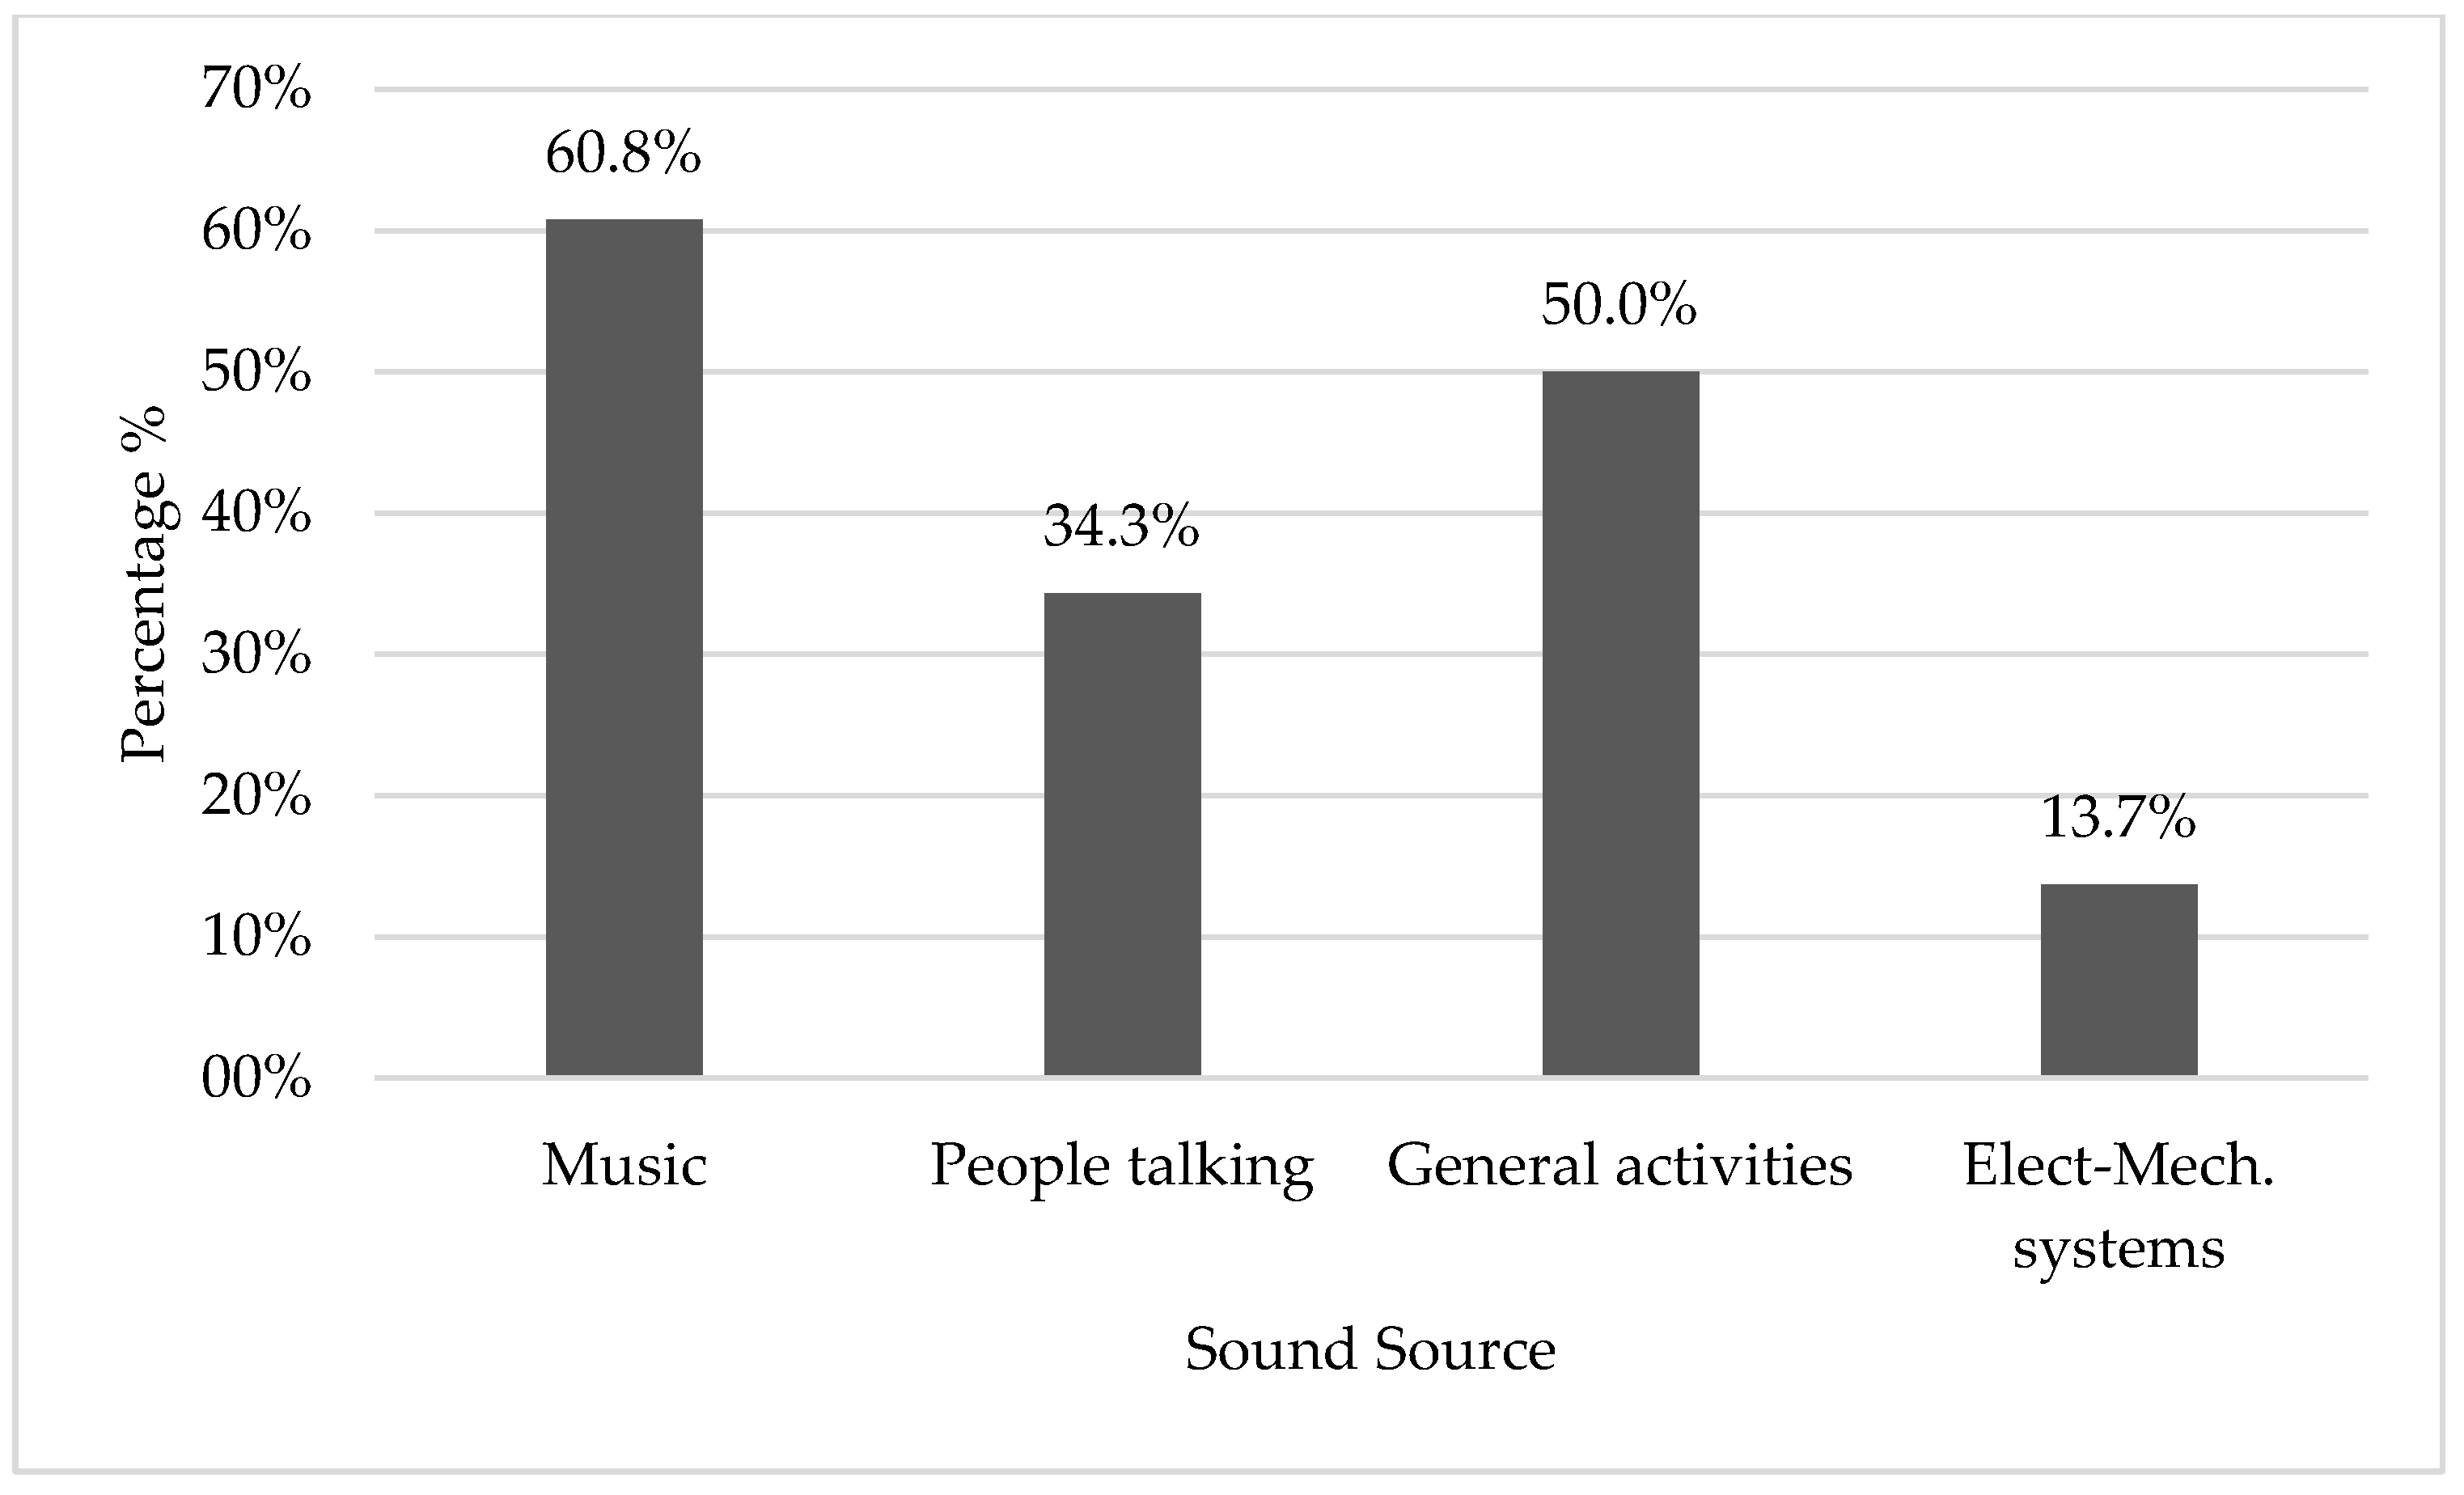
The sources of disruptive sounds in the mall vary over time; it is seen by the employees that music (61%) is the main source of aggravating sound, followed by mall activities (50%) (people walking, chairs dragging, kitchen tools, stores tools, alarms, children yelling, etc.). The speech of other people was annoying for only 34%. Figure 9 presents the results of the main sources of annoying sounds. Note that the sum of the percentages exceeds 100% because the questionnaire allows the selection of more than one choice.
The music in stores can influence people and their shopping behavior, as well as their length of stay. No study was found on the effect of music on mall workers; however, some studies considered the effects of music on customers and recommended changing music across the different areas of stores to match the different ages of customers [23]. This choice can be a relatively easy and affordable option for the mall administration to follow. It can impact customers, as well as workers, and can benefit the mall. Studies on customers in dining spaces have resulted in contradictory outcomes on whether background music increased the acoustic comfort of the users [11]. Further studies and investigations need to be done to discover the best method of music distribution and selection.
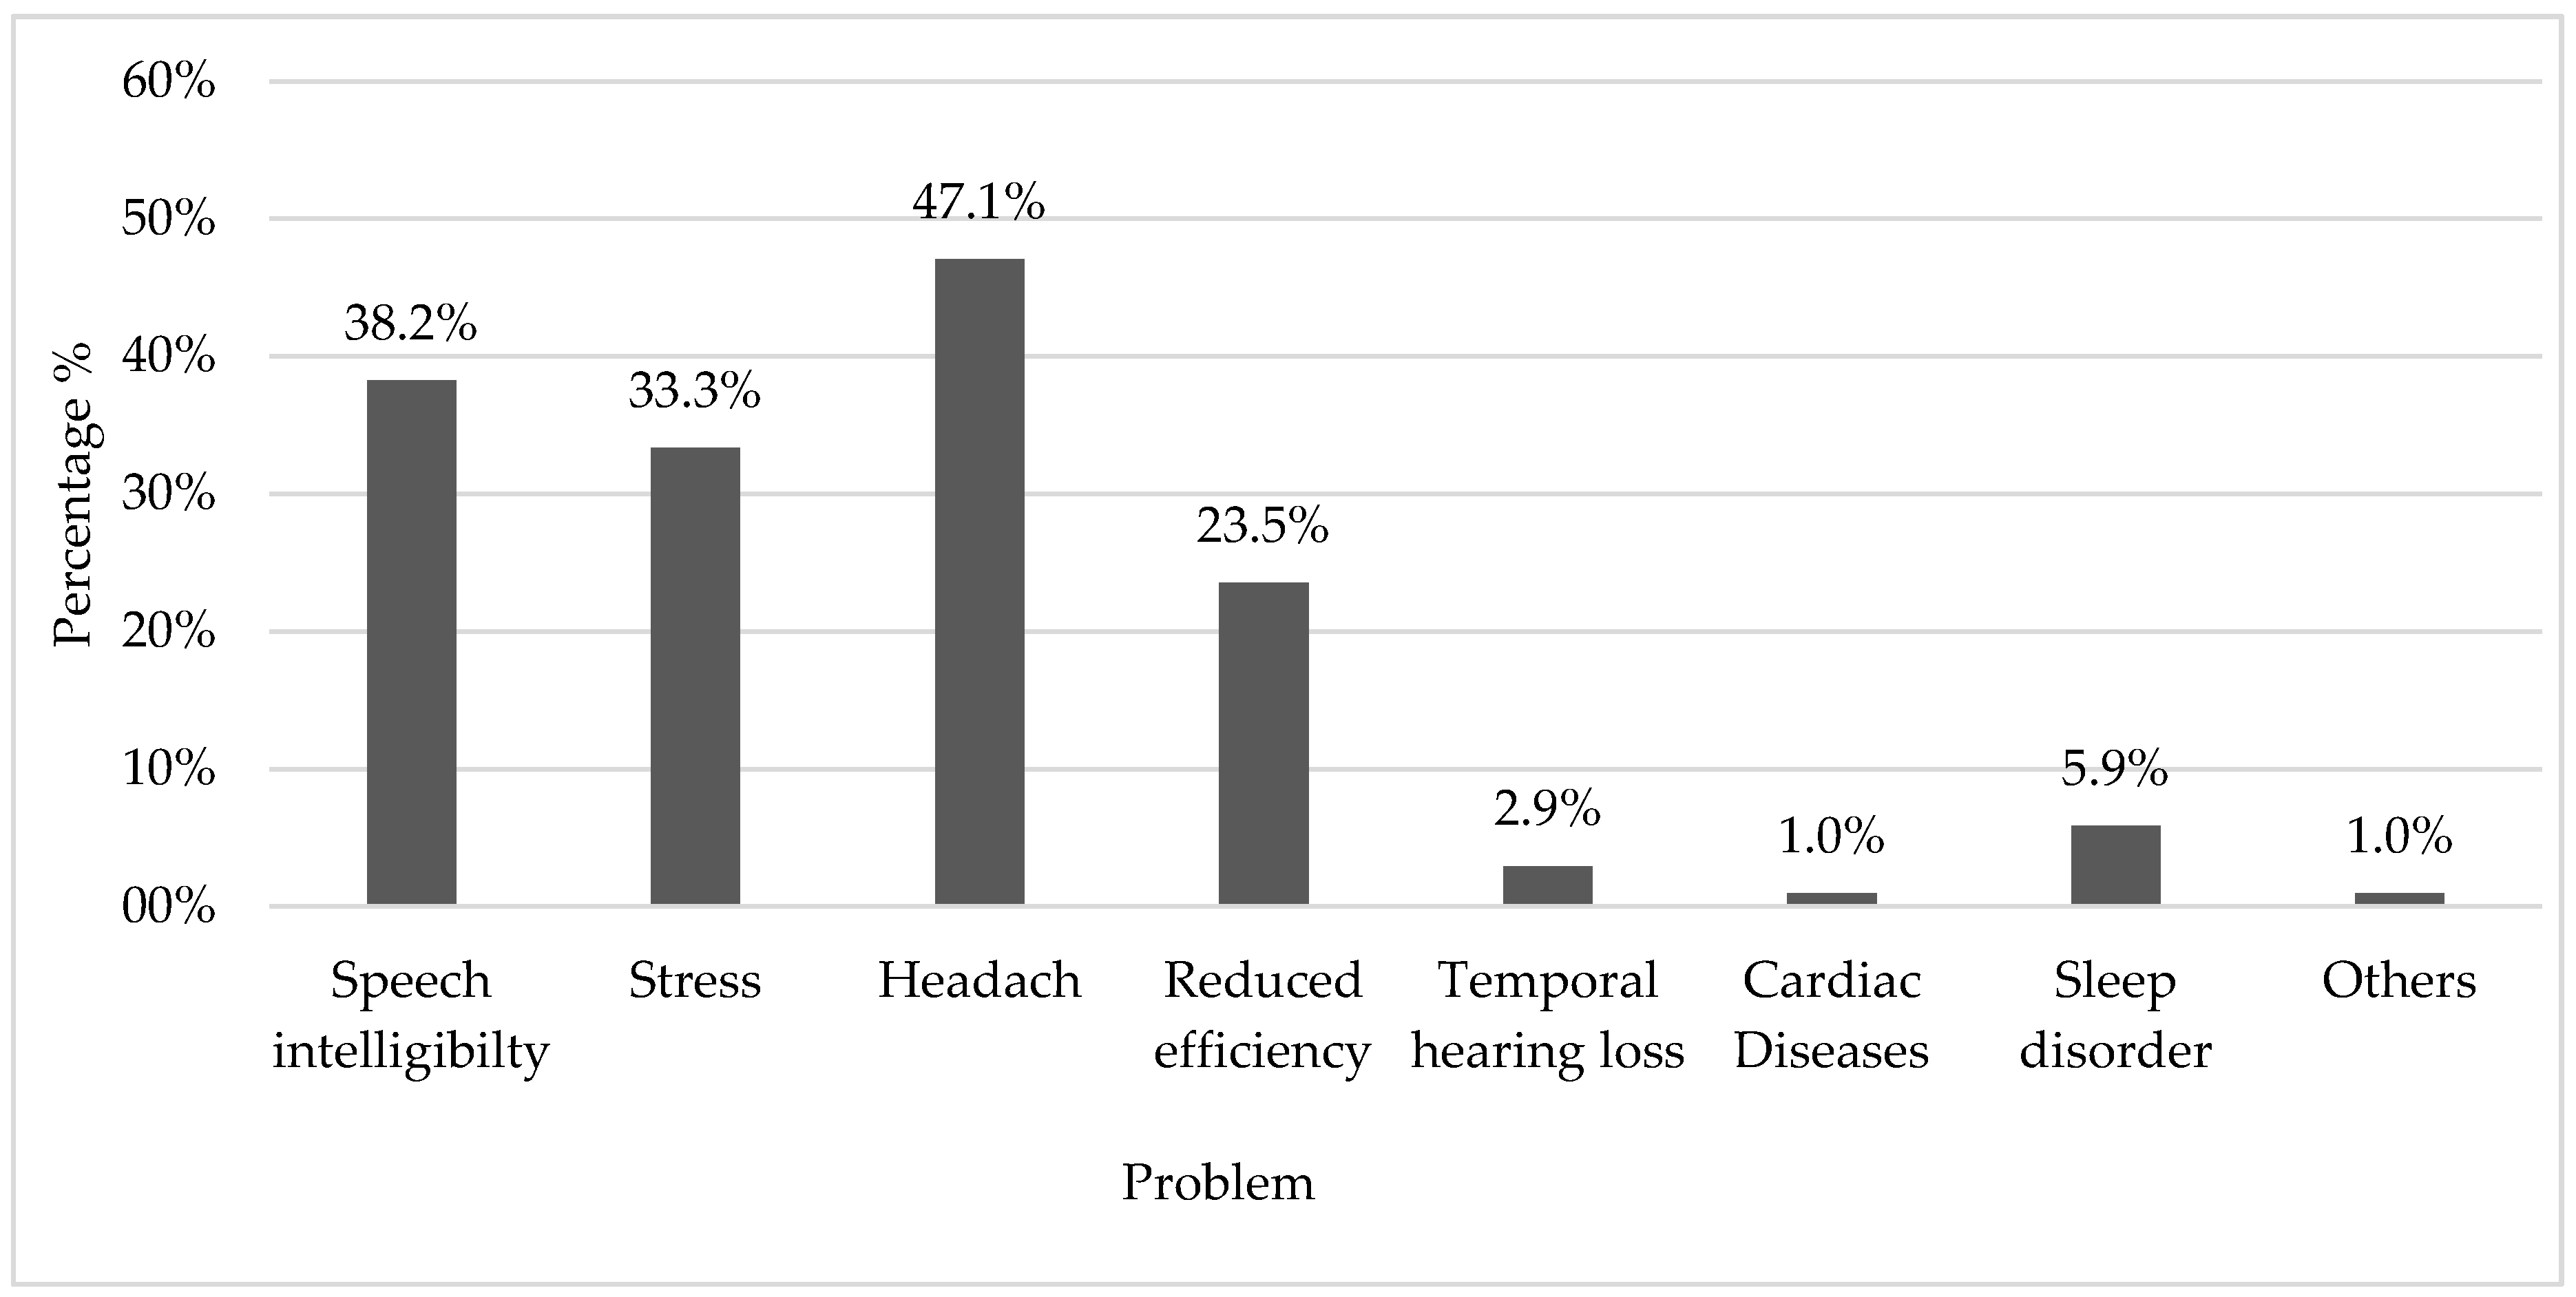
Loud sounds and noise can lead to different auditory and non-auditory problems. We asked questions related to the most common problems faced by the employees, with several answer options. The results showed that headache is the number one problem influencing 47.1% of the employees, followed by communication problems and speech intelligibility (38.2%) as a second challenge; stress placed third, with 33.3% (Figure 10). Furthermore, 23.5% of the workers felt that their working efficiency is influenced and decreased by noise levels. The evaluation here is based on subjective judgment, with no assessment to evaluate them quantitatively. This may explain the low number of employees reporting sleep disorders, which is reported in the literature as one of the most important non-auditory effects of loud sounds and noise exposure [2,3,4,24]. Cardiac diseases and temporal hearing loss are reported by just one and three subjects, respectively, within our sample.
While headache was the dominant problem in the overall evaluation, the individual evaluation based on the location in the mall showed that speech intelligibility is most important in the food court, which is the location where most people sit down to eat and talk to each other. At the food court, the employees need to hear the orders of the customers over the service counters in an open area, which we believe makes speech intelligibility even more important for this location. Using the Chi-Square test, the overall difference in the percentages was found not to be statistically significant, with p > 0.05 (Chi-Square = 5.5, p = 0.138). In Table 4, we present the results of the type of problems suffered by the employees based on their working place. Similarly, the differences in the importance of headache problems were also not statistically significant (Chi-Square = 1.48, p = 0.69).
3.4. Variations Based on Location in the Mall
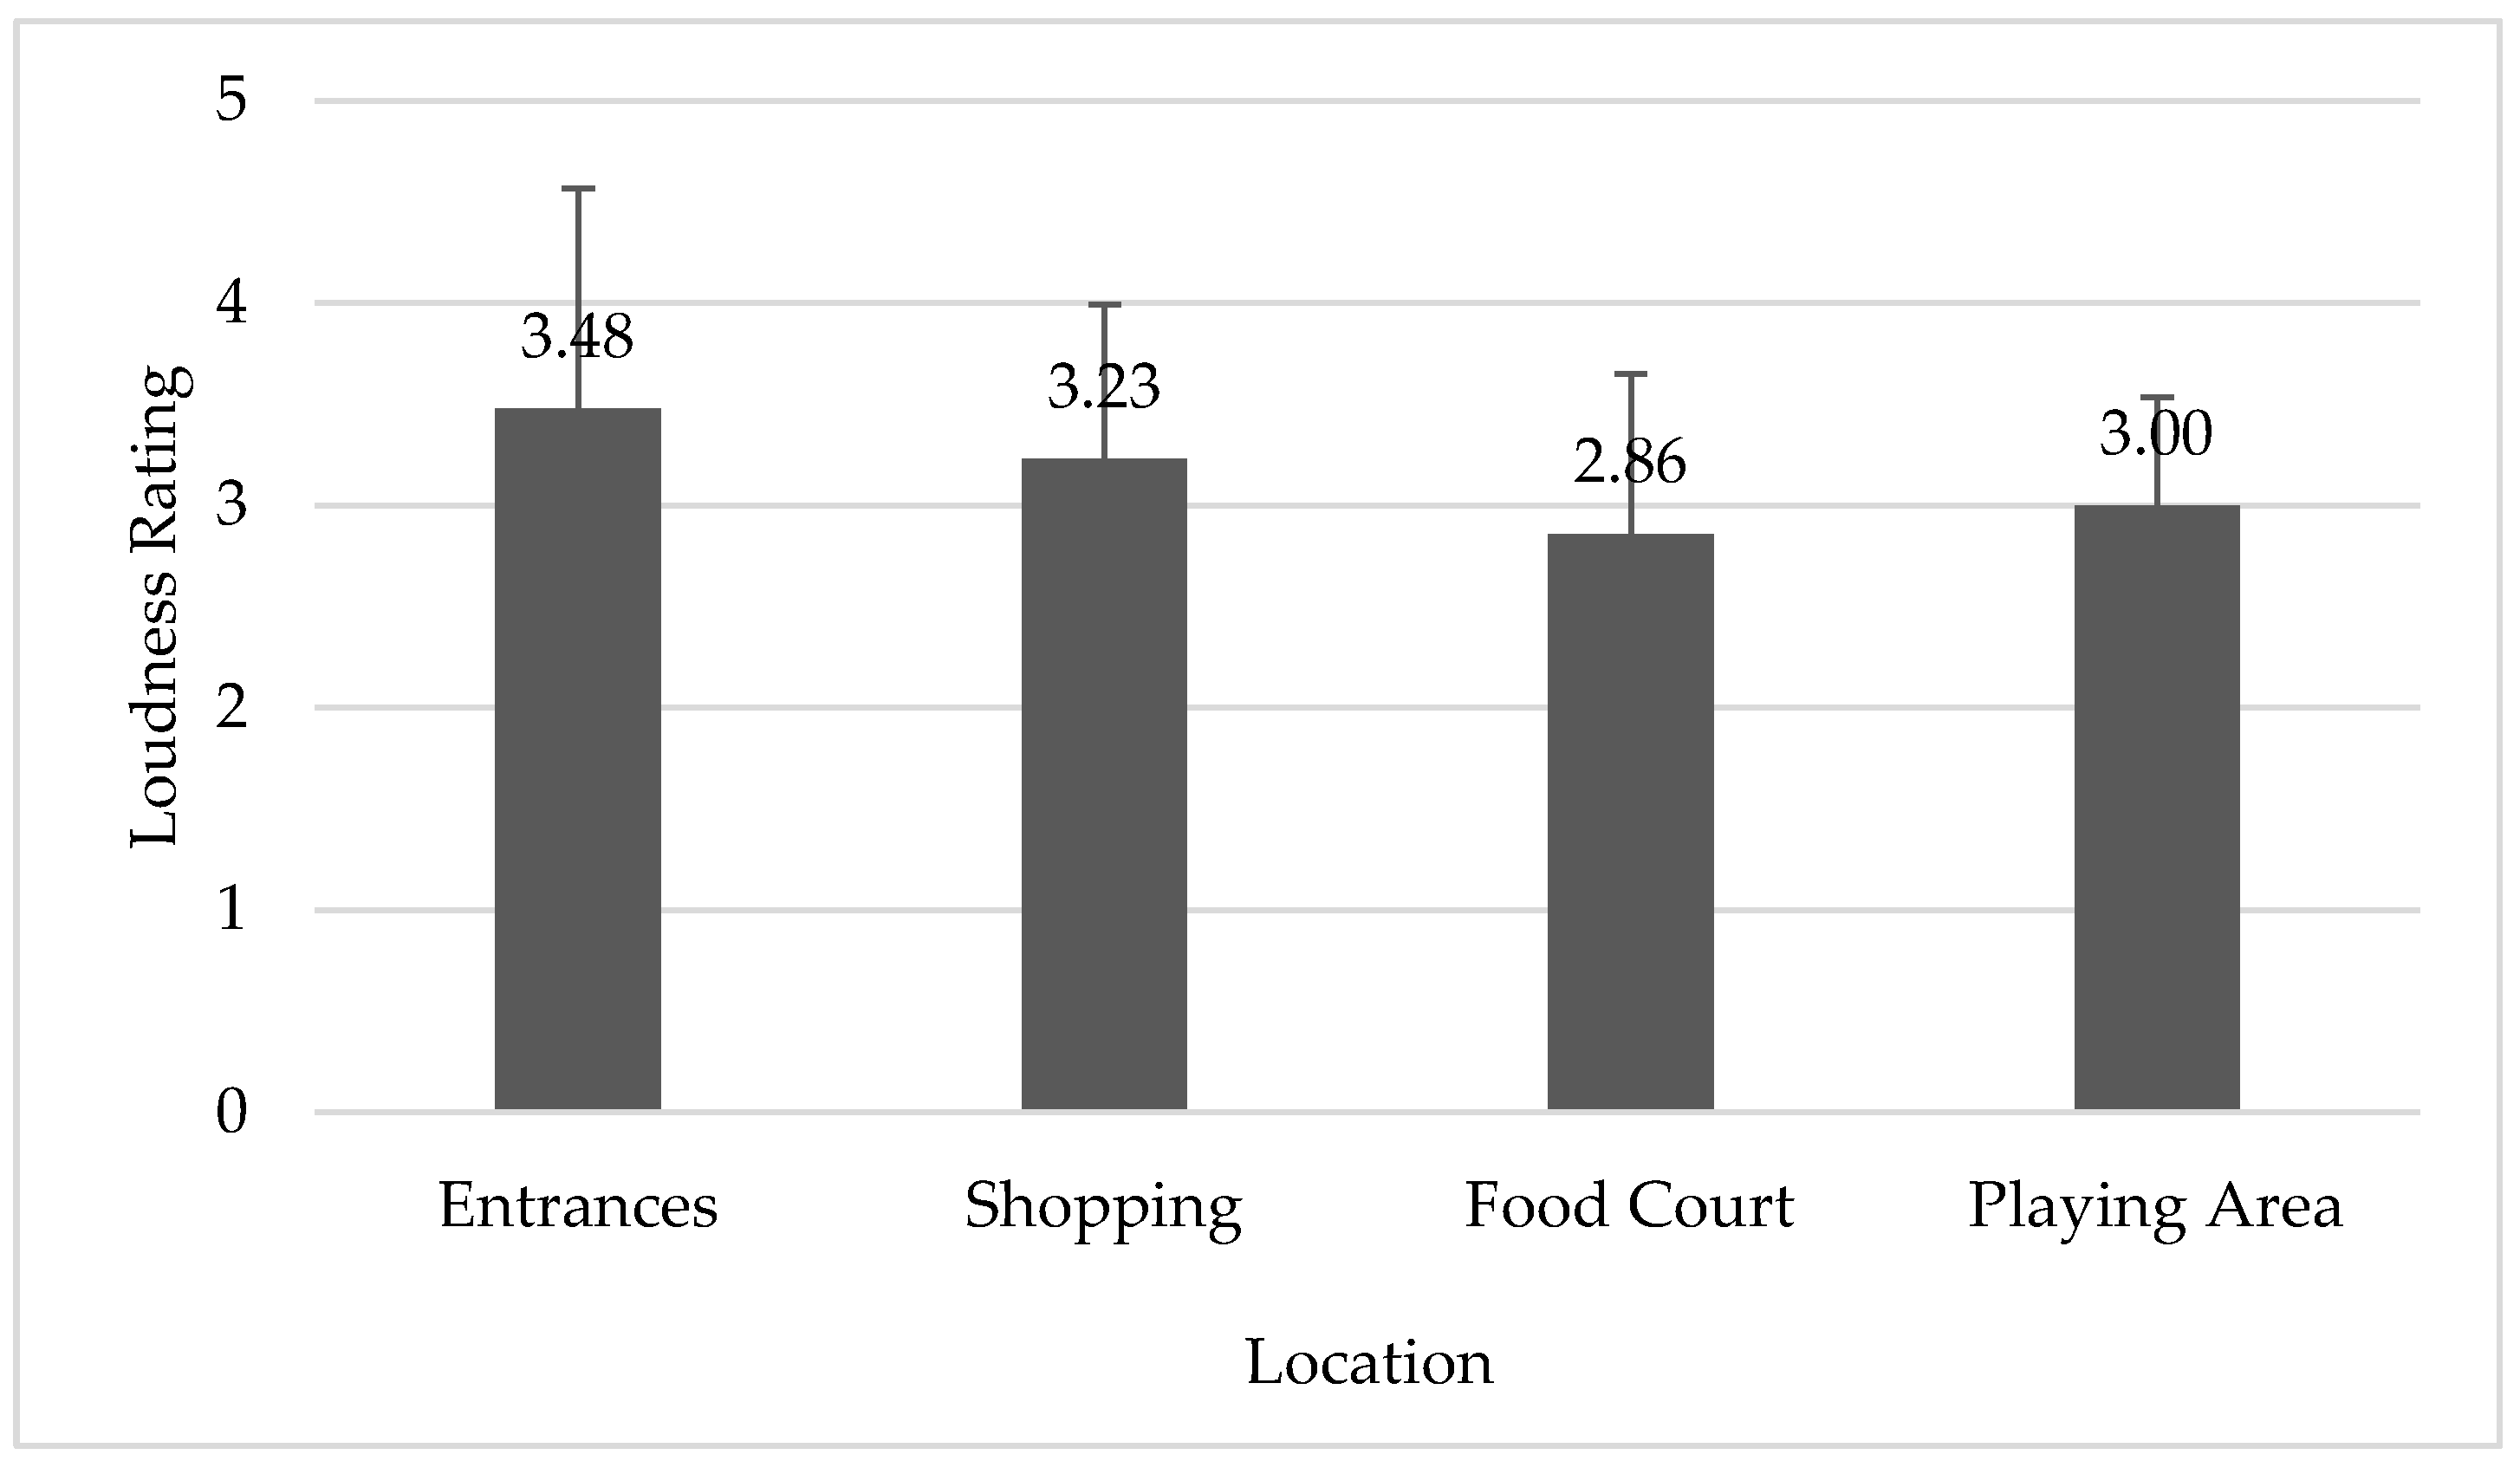
The results of the LAeq in the different locations within the mall varied significantly, as shown above. The highest levels were found in the playground, and the lowest levels were found in the shopping area. When evaluating the answers to the question rating the overall noise level in the mall based on the different locations (Figure 11), the difference in the responses was statistically significant at p < 0.05 (F = 2.76), using a one-way ANOVA. However, the subjective rating of loudness did not match the actual sound-pressure-level measurements. The employees in the shopping area and the entrances rated the loudness as higher than neutral (3.23 and 3.48, respectively), even though the sound there was the lowest. The employees in the playing area and food court evaluated the noise levels as neutral or less than neutral (3.0 and 2.86, respectively), even though the LAeq there were the highest. The statistical analysis using a one-way ANOVA for the questions related to acoustical comfort showed no statistical difference between the answers collected from the four locations (p = 0.51, F = 0.78). Similarly, the answers for the ability to work in noisy places showed no significant differences between the four different locations (p = 0.22, F = 1.48).
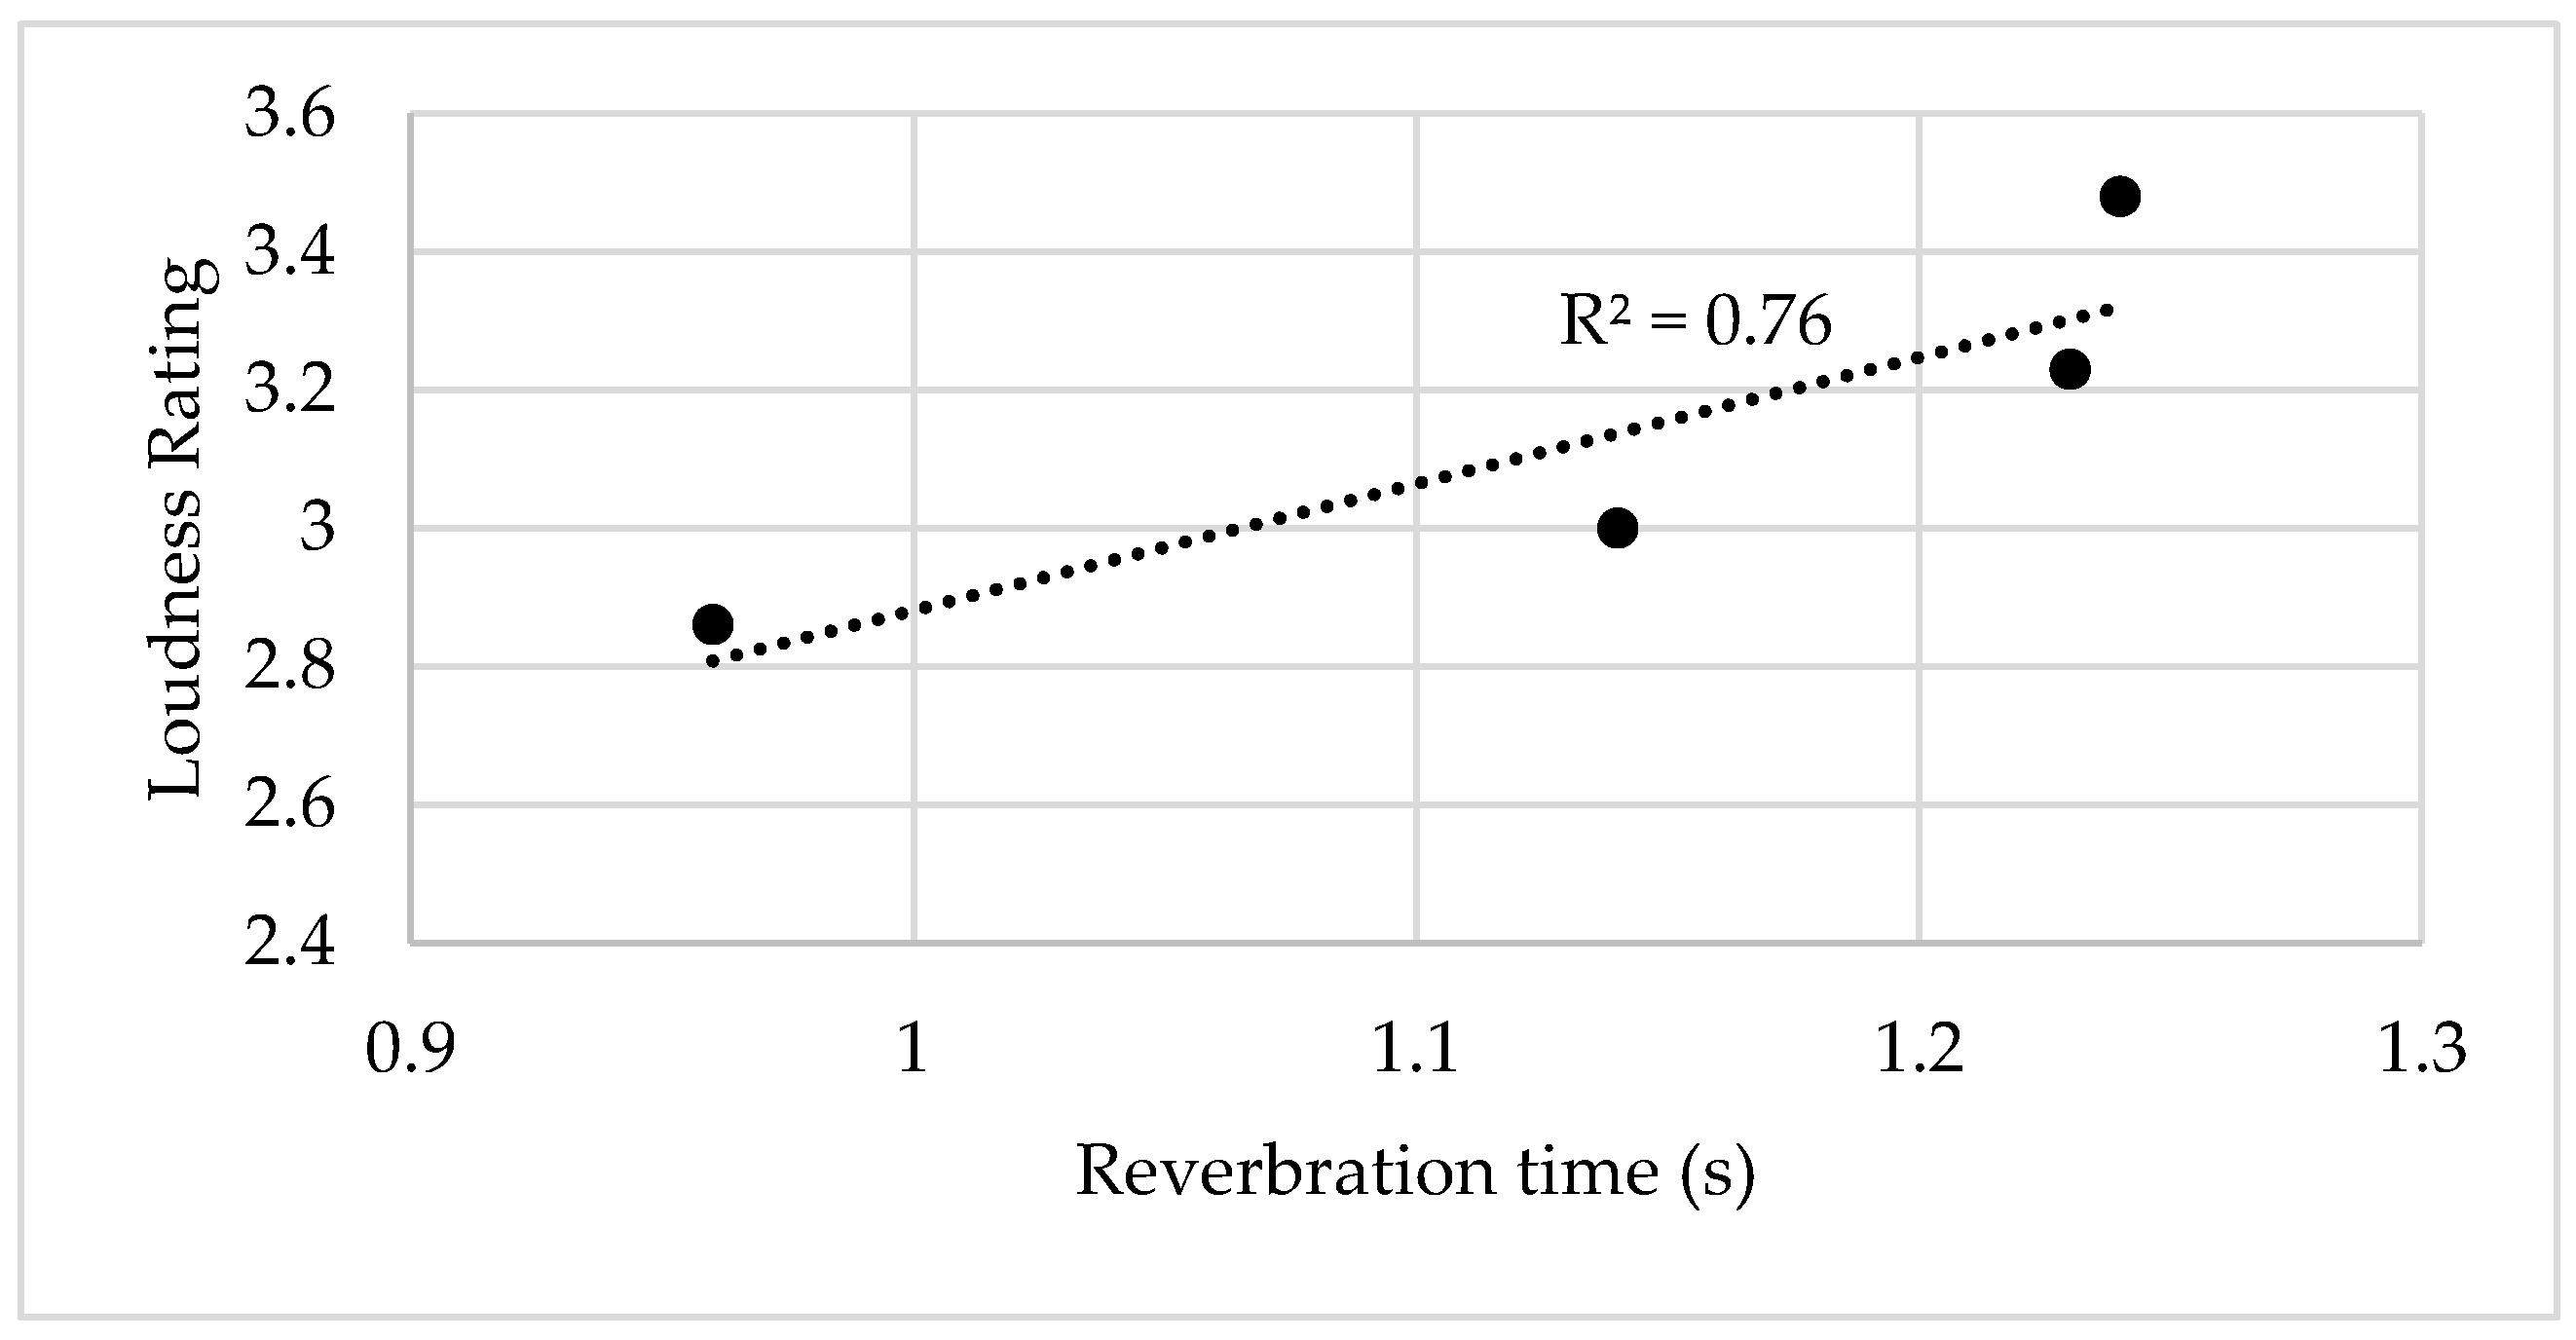
A comparison between the subjective rating of loudness with the corresponding reverberation time at the different locations showed a match between the results (Figure 12). The highest reverberation time was found at the entrances and the shopping areas, where the employees rated the loudness higher, followed by the playing area and the food court, where the employees rated the loudness lower. The linear correlation coefficient = 0.76. Even though the Pearson’s correlation coefficient indicates a positive relation, the p-value was 0.1258 (p > 0.05). More investigations with a higher number of data points are necessary to validate if this tendency can be of statistical significance.
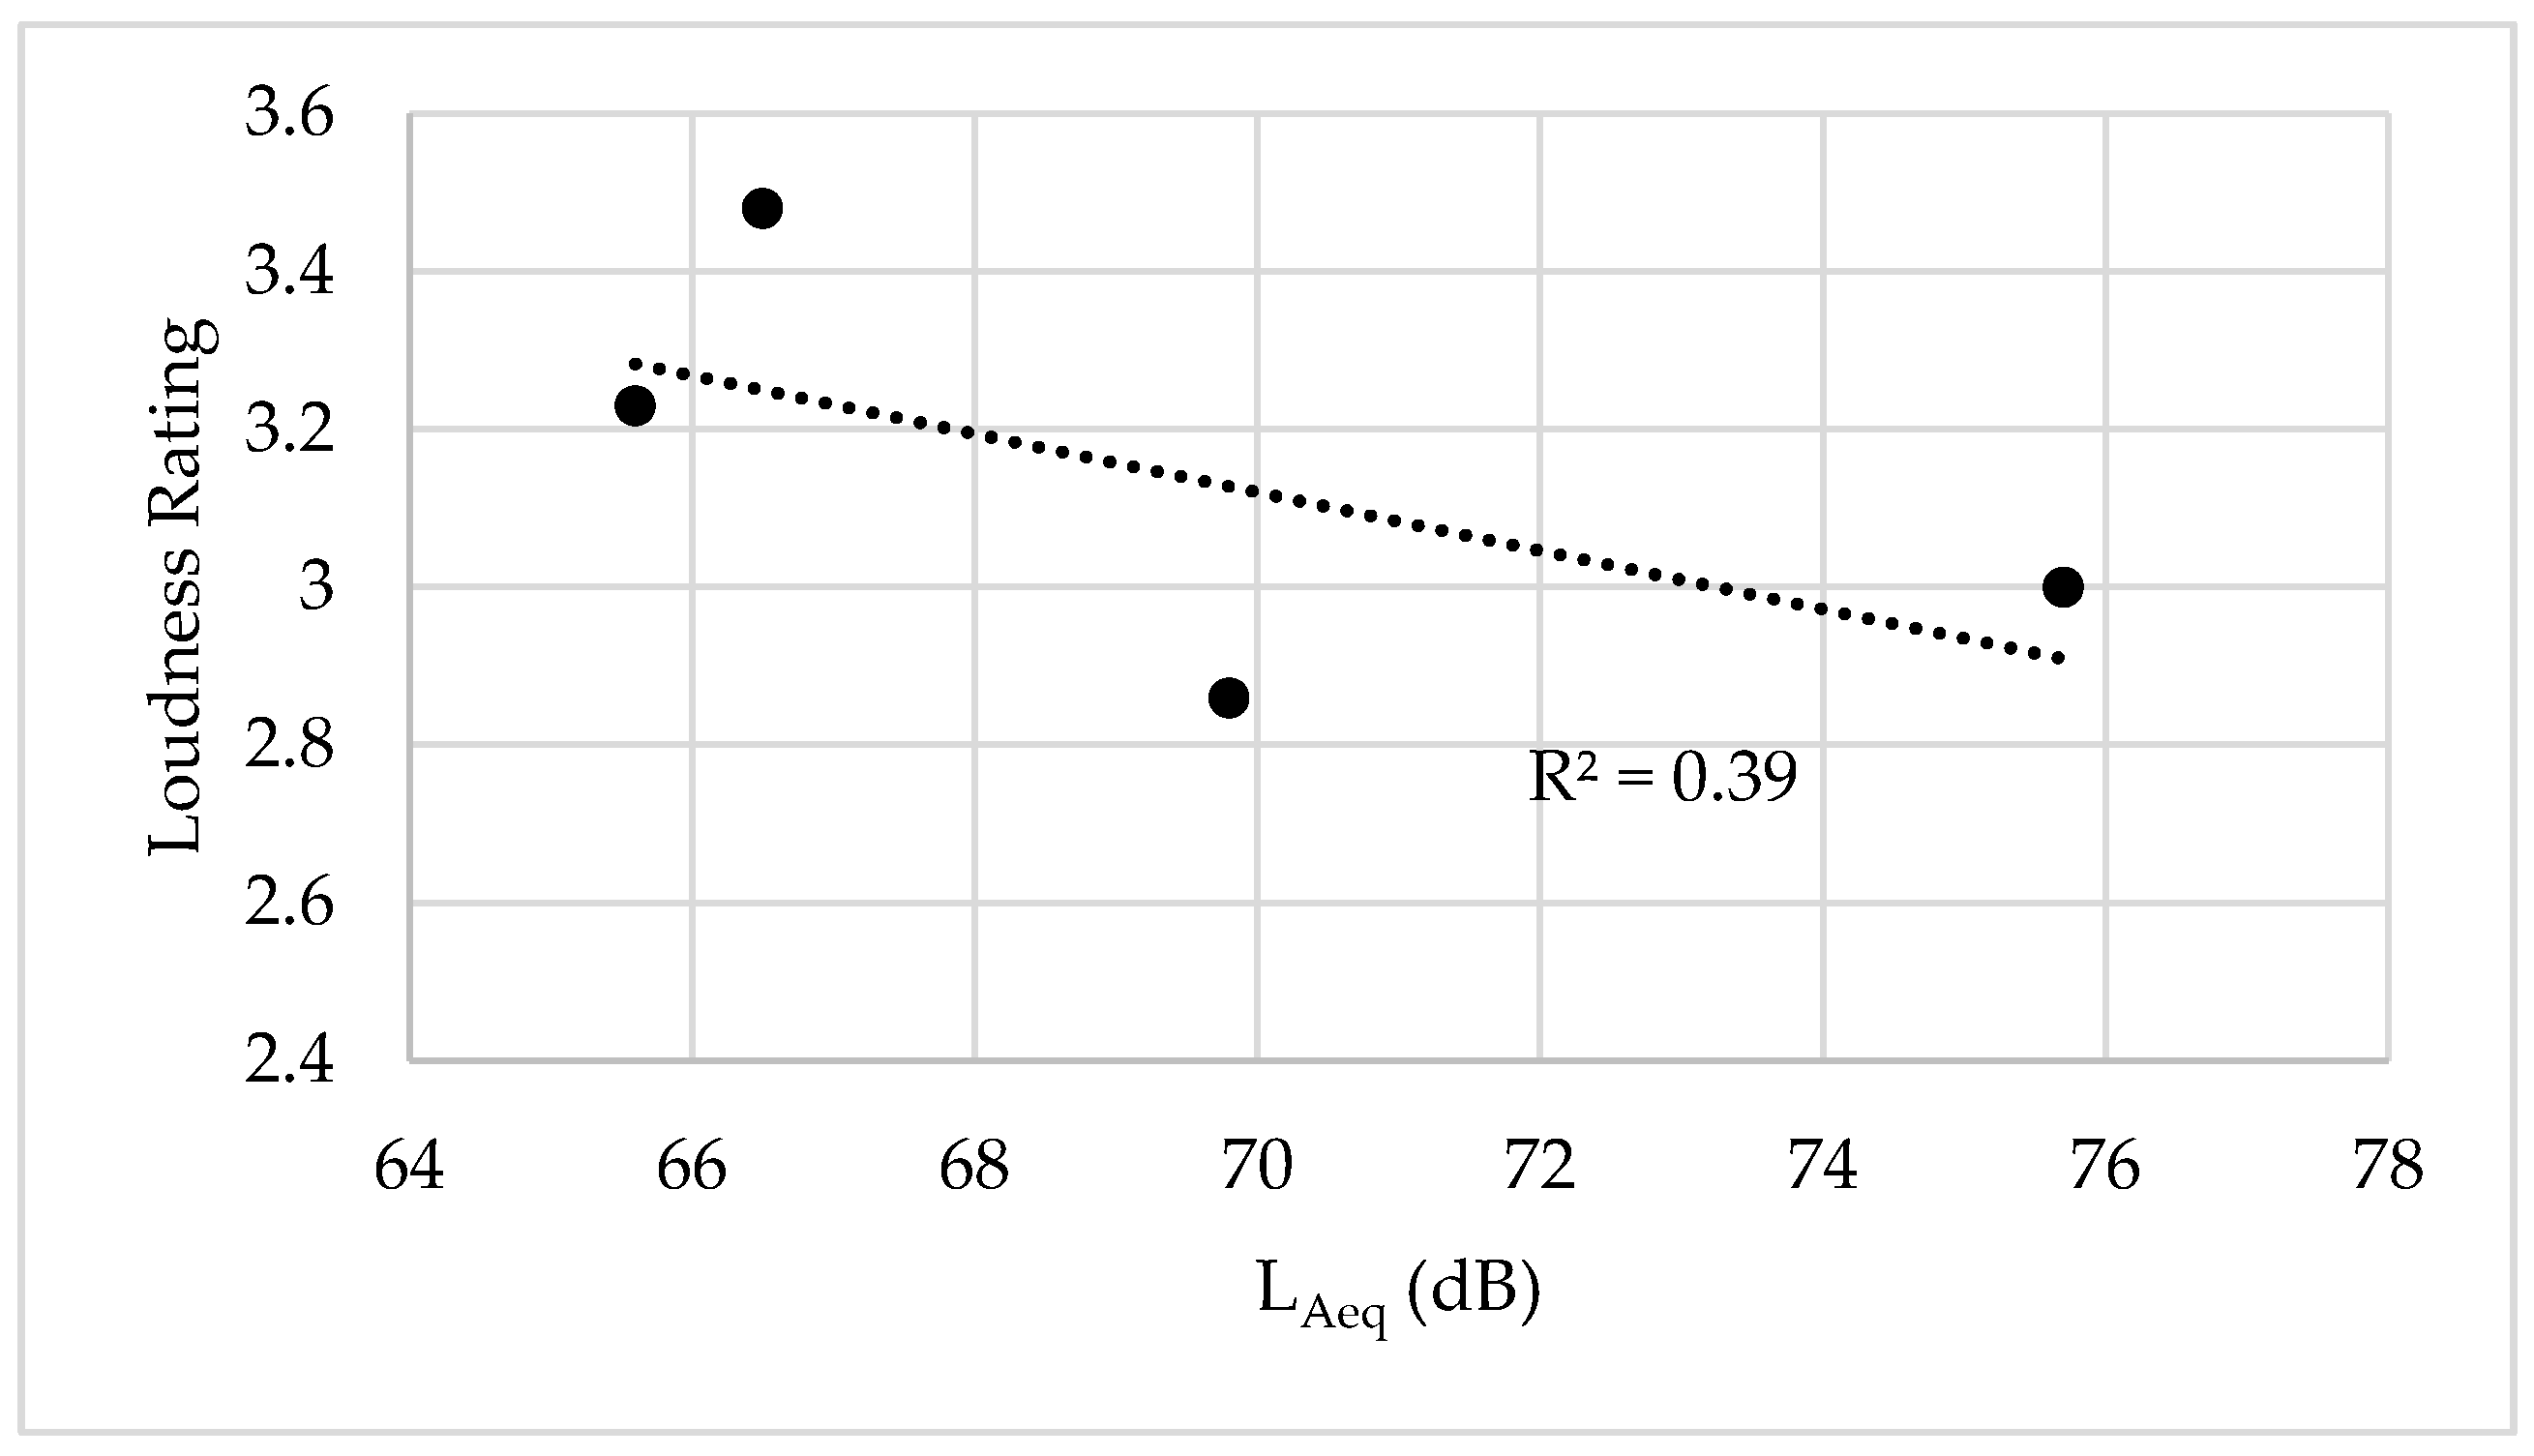
While evaluating the relation between the subjective loudness rating and the corresponding LAeq in the four areas, there is an inverse relationship, with a low linear correlation coefficient = 0.39. These results showed slight reduction in the loudness rating with the increment in the sound-pressure levels (Figure 13). The rating of the loudness here is unusual given the increase in the sound-pressure level is around 10 dB. We believe other factors may influence the subjective rating of loudness; these factors may include personal reasons, like the satisfaction with the working conditions, or environmental reasons, like relative humidity, temperature, lighting, and type of noise [13,19]. Figure 13 is based on the relation between the subjective rating of loudness with the overall LAeq. Further investigation with different frequency bands or LA90 may better explain the responses.
3.5. Limitations
The results in this study are based on the average values of LAeq collected for a limited period. Continuous measurements over a longer period and over more than one week could better represent the environment that the employees experience. For the purpose of more accurate results, using a dosimeter held by the employee could improve the accuracy of actual noise exposure (in the mall or even after work, at the home). In this study, the overall sound-pressure level was measured; the use of different frequency bands (1/1-octave of 1/3-octave bands) in the analysis could lead to a better understanding of the subjective ratings of the employees and why the different sound-pressure levels have different effects on them based on their working place.
Due the relatively small size of the sample, the analysis based on demographics, like age, gender, educational level, and income, was not significant enough to draw conclusions from and was discarded in this paper. Moreover, other parameters that may influence the participants’ answers need to be investigated in the questionnaire, for example, whether the people like their job or not.
This study considered acoustic comfort alone; however, other studies suggest the investigation of other parameters in parallel, such as the humidity, temperature, and lighting [11,19]; the social and behavioral characteristics of the users [13]; the type of activity in the mall [10]; and the Rapid Speech Transmission Index for speech intelligibility evaluation [5].
4. Conclusions
A shopping mall located in Amman, Jordan, was studied in regard to noisiness and acoustic comfort and its influence on the employees of the mall. Measurements of SPLs were carried out in four different areas of use and at three different locations for each area. The measurements were done four times a day, over a whole week. These measurements revealed a high LAeq in the mall. The measured values differed significantly between the different areas, with maximums in the playing areas and food courts, followed by the entrances and shopping areas.
The loud sounds in the playing areas referred to the different carousels and playing devices used, in addition to the yelling and crying of the children playing, with a maximum average LAeq of 83 dBA. In the food court, the main source of noise was the existence of a large number of people sitting close to each other and talking loudly, as well as the activities of food preparation, resulting in a maximum LAeq of 76 dBA. This background sound pressure level was high enough to force people sitting three feet from each other to raise their voices to a very loud level, in order to understand each other [25]. The shopping areas’ and entrance’s maximum LAeq was 70 dBA and 71 dBA, respectively.
The values in the mall, in comparison with many studies done in other countries, showed high LAeq; however, the annoyance of the employees from these sounds was moderate and showed fair levels. This suggests that the employees have adapted and are accustomed to these sounds as part of their work environment [14], mainly in the food courts and the playing areas. More care and action need to be taken to reduce these sound levels, primarily in the playing area. These sounds are close to the limits recommended for the prevention of noise-induced hearing loss. Moreover, for lower sound-pressure levels in the rest of the mall, non-auditory effects are important and need to be intensively considered. We believe this needs to be accomplished by raising the awareness of employees about the importance of this issue, given its reflection on their working efficiency, as 23.5% of the all employees believe they have a reduction in their efficiency due the noise in the mall.
The measured RT varied from one location to another. The differences in the RT values between the different locations in the mall were also significant. The overall values fall within the recommended values for large spaces, and the need for improvement is limited to just the location of Entrance 2, which is open to a large atrium. The design of the mall and the cladding on the walls present a good acoustical design. An improvement in the RT value in the Entrance 2 area (in this case, a reduction) can improve acoustic comfort. However, these improvements are not critical, and the values found in the literature showed far higher values in other malls.
This study showed a stronger direct relationship between RT values and the subjective rating of loudness. This is opposite to the relation between the LAeq measurements and the loudness rating. This result suggests that the personal judgment of loudness within this study is not related to the actual measured LAeq; other factors and important effects, such as the RT, may play a role. A generalization of these results cannot be done unless further investigation and validation are performed in other malls and on a larger sample, and considering multiple independent variables, as suggested by [11,19].
This study highlights the annoyance of the employees from the music played in the background. The mall administration needs to investigate this problem to determine the exact content of the claim, in order to change the audio system or music selection. This could produce a valuable impact on workers in the mall and may also improve the customers’ experience and satisfaction.
Although there are studies concerning noise-pressure levels and acoustic parameters in non-performance spaces, few studies investigate their relation to the customers’ subjective ratings of these environments, and, moreover, fewer consider the ratings of employees for acoustic comfort and loudness, which is unfortunate, given that they are the subjects who spend the longest time in these environments.
Author Contributions
Conceptualization, N.A.; methodology, N.A. and M.Z.A.; validation, N.A. and M.Z.A.; statistical analysis, N.A.; investigation, N.A. and M.Z.A.; resources, M.Z.A.; data curation, M.Z.A.; writing—original draft preparation, N.A.; writing—review and editing, N.A.; visualization, N.A. and M.Z.A.; supervision, N.A.; project administration, N.A. All authors have read and agreed to the published version of the manuscript.
Funding
This research received no external funding.
Acknowledgments
The authors thank the shopping mall administration and staff for their support in conducting this study.
Conflicts of Interest
The authors declare no conflicts of interest.
References
- The United State, Department of Labor, Occupational Safety and Health Administration. Code of Federal Regulations, Title 29, Part 1910, Section 1910.95—Occupational Noise Exposure. 1 July 2011. Available online: https://www.govinfo.gov/content/pkg/CFR-2011-title29-vol5/pdf/CFR-2011-title29-vol5-sec1910-95.pdf (accessed on 29 November 2019).
- Basner, M.; Babisch, W.; Davis, A.; Brink, M.; Clark, C.; Janssen, S.; Stansfeld, S. Auditory and non-auditory effects of noise on health. Lancet 2014, 383, 1325–1332. [Google Scholar] [CrossRef] [Green Version]
- Passchier-Vermeer, W.; Passchier, W.F. Noise Exposure and Public Health. Environ. Health Perspect. 2000, 108, 123. [Google Scholar] [PubMed] [Green Version]
- Hopkins, J. Orchestrating an Indoor City: Ambient Noise Inside a Mega-Mall. Environ. Behav. 1994, 26, 785–812. [Google Scholar] [CrossRef]
- Carvalho, A.; Pereira, C.F. Sound and noise in shopping malls. In Proceedings of the New-England NOISE-CON 16, Providence, RI, USA, 13–15 June 2016; pp. 70–77. [Google Scholar]
- Migneron, P.; Migneron, J.G. A case study on noise ambience and disturbance in a restaurant. In Proceedings of the 22nd international congress on sound and vibration, Florence, Italy, 12–16 July 2015. [Google Scholar]
- Hodgson, M.; Steininger, G.; Razavi, Z. Measurement and prediction of speech and noise levels and the Lombard effect in eating establishments. J. Acoust. Soc. Am. 2007, 121, 2023–2033. [Google Scholar] [CrossRef] [PubMed]
- Pimentel, R.L.; Esmeraldo, L.B.S.; Navarro, M.P.N. Sound Pressure Levels in Food Courts of Shopping Centres. Noise Vib. Worldw. 2008, 39, 26–30. [Google Scholar] [CrossRef]
- Rusnock, C.F.; Bush, P.M. Case Study: An Evaluation of Restaurant Noise Levels and Contributing Factors. J. Occup. Environ. Hyg. 2012, 9, D108–D113. [Google Scholar] [CrossRef] [PubMed]
- Chen, B.; Kang, J. Acoustic Comfort in Shopping Mall Atrium Spaces—A Case Study in Sheffield Meadowhall. Archit. Sci. Rev. 2004, 47, 107–114. [Google Scholar] [CrossRef]
- Chen, X.; Kang, J. Acoustic comfort in large dining spaces. Appl. Acoust. 2017, 115, 166–172. [Google Scholar] [CrossRef]
- Dökmeci, P.N.; Yılmazer, S. Relationships between Measured Levels and Subjective Ratings: A Case Study of the Food-Court Area in CEPA Shopping Center, Ankara. Build. Acoust. 2012, 19, 57–73. [Google Scholar] [CrossRef]
- Meng, Q.; Kang, J. Influence of Social and Behavioural Characteristics of Users on Their Evaluation of Subjective Loudness and Acoustic Comfort in Shopping Malls. PLoS ONE 2013, 8. [Google Scholar] [CrossRef] [PubMed]
- Crociata, S.D.; Simone, A.; Martellotta, F. Acoustic comfort evaluation for hypermarket workers. Build. Environ. 2013, 59, 369–378. [Google Scholar] [CrossRef]
- Department of Statistics, Jordan. Statistical Yearbook of Jordan 2018. Available online: http://dosweb.dos.gov.jo/DataBank/Yearbook_2018/Population.pdf (accessed on 1 December 2019).
- ISO 3382–1:2009 Acoustics—Measurement of Room Acoustic Parameters—Part 1: Performance Spaces; International Organization for Standardization: Geneva, Switzerland, 2009.
- NFPA 72: National Fire Alarm and Signaling Code (SCBA); NFPA National Fire Codes Online. 2016. Available online: http://codesonline.nfpa.org (accessed on 25 November 2019).
- ISO 9612:2009 Acoustics—Determination of Occupational Noise Exposure—Engineering Method; International Organization for Standardization: Geneva, Switzerland, 2009.
- Meng, Q.; Kang, J.; Jin, H. Field study on the influence of spatial and environmental characteristics on the evaluation of subjective loudness and acoustic comfort in underground shopping streets. Appl. Acoust. 2013, 74, 1001–1009. [Google Scholar] [CrossRef] [Green Version]
- Iannace, G.; Ianniello, C.; Ianniello, E. Music in an Atrium of a Shopping Center. Acoust. Aust. 2015, 43, 191–198. [Google Scholar] [CrossRef]
- Iannace, G. Sport hall acoustics. Noise Vib. Worldw. 2015, 46, 22–29. [Google Scholar] [CrossRef]
- Alnuman, N.; Ghnimat, T. Awareness of Noise-Induced Hearing Loss and Use of Hearing Protection among Young Adults in Jordan. Int. J. Environ. Res. Public Health 2019, 16, 2961. [Google Scholar] [CrossRef] [PubMed] [Green Version]
- Yalch, R.; Spangenberg, E. Effects of Store Music on Shopping Behavior. J. Consum. Mark. 1990, 7, 55–63. [Google Scholar] [CrossRef]
- Cohen, S.; Weinstein, N. Nonauditory Effects of Noise on Behavior and Health. J. Soc. Issues 1981, 37, 36–70. [Google Scholar] [CrossRef]
- Engineering ToolBox. Voice Level at Distance. Available online: https://www.engineeringtoolbox.com/voice-level-d_938.html (accessed on 13 December 2019).
Figure 1.
A map of the ground-level floor in the mall, with the red stars representing the location of the measurement points (the used letters refers to Entrance 1 (E1), Shopping 2 (S2), and Shopping 3 (S3)). The average height of the rooms is 3.75 m, and the approximate volume of the space without the atriums is 7960 m³.

Figure 2.
A map of the food-court floor in the mall, with the red stars representing the location of the measurement points (the letters refer to Food Court 1 (F1), Food Court 2 (F2), and Food Court 3 (F3)). The average height of the food court is 3.75 m, and the approximate volume of the space occupied by the food court is 5380 m³.

Figure 3.
A sample measurement of 60 s from the food court at the three different locations measured on Friday afternoon.
Figure 3.
A sample measurement of 60 s from the food court at the three different locations measured on Friday afternoon.

Figure 4.
The LAeq measurements in the four areas of the mall on Tuesday and Friday for different time intervals.
Figure 4.
The LAeq measurements in the four areas of the mall on Tuesday and Friday for different time intervals.

Figure 5.
The changes in the LAeq in the evening over the whole week for the four areas of interest. The black-colored line presents the number of people (Visitors) entering the mall on each day.
Figure 5.
The changes in the LAeq in the evening over the whole week for the four areas of interest. The black-colored line presents the number of people (Visitors) entering the mall on each day.

Figure 6.
The subjective rating of the loudness in the mall.

Figure 7.
The subjective rating of the acoustic comfort in the mall.

Figure 8.
The worker ratings of their ability to work in loud environments.

Figure 9.
The rating of the main sources of annoying sounds according to the employees.

Figure 10.
The distribution of the problems caused by mall noise.

Figure 11.
The rating of loudness based on the location in the mall. Error bars indicate STD.

Figure 12.
The relation between the reverberation time and loudness rating.

Figure 13.
The relation between LAeq and the subjective loudness rating.


Table 1.
The questionnaire used in this study.
| Part 1: General Information |
| Age: __________ Gender: ___ Male ___ Female Working Place: ______________________ Occupation: _________________________ Educational status: □ University or higher □ High school or below Income Level: □ Below average □ Within Average □ Above Average Working time and duration: ________________________ |
| Part 2: Hearing and Acoustic Comfort Related Problems |
| 1. Do you have any hearing related problems? □ Yes □ No |
| 2. How do you evaluate the sound level in the shopping mall? □ Very calm □ Calm □ Fair □ Loud □ Very loud |
| 3. How do evaluate the acoustic comfort in the mall? □ Very comfortable □ Comfortable □ Fair □ Uncomfortable □ Very uncomfortable |
| 4. How do you evaluate your ability to work in noisy environment? □ Very good □ Good □ Fair □ Bad □ very bad |
| 5. What are the main sources of noise in the shopping mall? (multiple answers are allowed) □ Music □ People Talking □ General Activities □ Electromechanical Systems |
| 6. Do you suffer from any of the following problem due your work in the mall? (multiple answers are allowed) □ Communication problems □ Stress □ Cardiac Problems □ Sleeping Disorder □ Temporary hearing loss □ Headache □ Low Working Capacity □ Others |
Table 2.
The resultant equivalent sound-pressure levels in the mall for the different locations, days of the week, and times of the day.
Table 2.
The resultant equivalent sound-pressure levels in the mall for the different locations, days of the week, and times of the day.
| Location | Time | Equivalent Sound-Pressure Levels (dBA) | ||||||
|---|---|---|---|---|---|---|---|---|
| Sun. | Mon. | Tues. | Wed. | Thurs. | Fri. | Sat. | ||
| Entrances | 10:30–12:30 | 64 | 60 | 62 | 62 | 60 | 62. | 65 |
| 13:30–15:30 | 65 | 62 | 62 | 63 | 66 | 68 | 65 | |
| 16:30–18:30 | 65 | 69 | 66 | 66 | 68 | 69 | 68 | |
| 19:30–21:30 | 68 | 67 | 67 | 66 | 71 | 71 | 69 | |
| Shopping | 10:30–12:30 | 63 | 58 | 59 | 60 | 63 | 61 | 65 |
| 13:30–15:30 | 65 | 61 | 62 | 62 | 66 | 67 | 65 | |
| 16:30–18:30 | 64 | 68 | 64 | 64 | 67 | 69 | 66 | |
| 19:30–21:30 | 66 | 65 | 65 | 66 | 70 | 70 | 67 | |
| Food Court | 10:30–12:30 | 67 | 63 | 62 | 63 | 63 | 61 | 66 |
| 13:30–15:30 | 67 | 66 | 66 | 64 | 70 | 69 | 69 | |
| 16:30–18:30 | 69 | 71 | 68 | 68 | 74 | 75 | 75 | |
| 19:30–21:30 | 67 | 69 | 67 | 69 | 76 | 74 | 69 | |
| Playing Area | 10:30–12:30 | 74 | 72 | 71 | 73 | 73 | - | 72 |
| 13:30–15:30 | 75 | 71 | 72 | 71 | 75 | 77 | 74 | |
| 16:30–18:30 | 75 | 77 | 76 | 76 | 75 | 78 | 76. | |
| 19:30–21:30 | 74 | 74 | 77 | 76 | 79 | 83 | 76 | |
Table 3.
Reverberation time in seconds.
| Location | 500 Hz | 1000 Hz | 2000 Hz | Mean (s) |
|---|---|---|---|---|
| Playing Area 1 | 1.20 | 1.22 | 1.18 | 1.20 |
| Playing Area 2 | 1.16 | 1.22 | 1.21 | 1.20 |
| Playing Area 3 | 1.01 | 1.04 | 1.00 | 1.02 |
| Food Court 1 | 1.00 | 0.95 | 0.98 | 0.98 |
| Food Court 2 | 1.02 | 0.96 | 0.75 | 0.91 |
| Food Court 2 | 1.08 | 1.06 | 0.83 | 0.99 |
| Entrance 1 | 1.16 | 1.10 | 1.02 | 1.09 |
| Entrance 2 | 2.00 | 1.30 | 0.90 | 1.41 |
| Entrance 3 | 1.12 | 1.44 | 1.12 | 1.23 |
| Shopping 1 | 1.51 | 1.21 | 1.09 | 1.27 |
| Shopping 2 | 1.23 | 1.34 | 1.12 | 1.23 |
| Shopping 3 | 1.61 | 1.05 | 0.90 | 1.19 |
Table 4.
The dominant problems and health issues due to loud sounds, evaluated based on the different locations in the mall.
Table 4.
The dominant problems and health issues due to loud sounds, evaluated based on the different locations in the mall.
| Problem | Location | |||
|---|---|---|---|---|
| Entrances | Shopping Area | Food Court | Playing Area | |
| Speech intelligibility | 25.9% | 35.5% | 55.2% | 33.3% |
| Stress | 44.4% | 32.3% | 31.0% | 20.0% |
| Headache | 48.1% | 51.6% | 37.9% | 53.3% |
| Reduced efficiency | 18.5% | 38.7% | 13.8% | 20.0% |
| Temporal hearing loss | 3.7% | 3.2% | 0.0% | 6.7% |
| Cardiac Diseases | 0.0% | 0.0% | 0.0% | 6.7% |
| Sleep disorder | 3.7% | 9.7% | 3.4% | 6.7% |
| Others | 0.0% | 0.0% | 0.0% | 0.0% |
© 2020 by the authors. Licensee MDPI, Basel, Switzerland. This article is an open access article distributed under the terms and conditions of the Creative Commons Attribution (CC BY) license (http://creativecommons.org/licenses/by/4.0/).
Share and Cite
MDPI and ACS Style
Alnuman, N.; Altaweel, M.Z. Investigation of the Acoustical Environment in A Shopping Mall and Its Correlation to the Acoustic Comfort of the Workers. Appl. Sci. 2020, 10, 1170. https://0-doi-org.brum.beds.ac.uk/10.3390/app10031170
AMA Style
Alnuman N, Altaweel MZ. Investigation of the Acoustical Environment in A Shopping Mall and Its Correlation to the Acoustic Comfort of the Workers. Applied Sciences. 2020; 10(3):1170. https://0-doi-org.brum.beds.ac.uk/10.3390/app10031170
Chicago/Turabian StyleAlnuman, Nasim, and Mhd Ziad Altaweel. 2020. "Investigation of the Acoustical Environment in A Shopping Mall and Its Correlation to the Acoustic Comfort of the Workers" Applied Sciences 10, no. 3: 1170. https://0-doi-org.brum.beds.ac.uk/10.3390/app10031170
Note that from the first issue of 2016, this journal uses article numbers instead of page numbers. See further details here.