Article

Rapid and Nondestructive Discrimination of Geographical Origins of Longjing Tea using Hyperspectral Imaging at Two Spectral Ranges Coupled with Machine Learning Methods

1
Agricultural Experiment Station, Zhejiang University, Hangzhou 310058, China
2
College of Biosystems Engineering and Food Science, Zhejiang University, Hangzhou 310058, China
3
Key Laboratory of Spectroscopy Sensing, Ministry of Agriculture and Rural Affairs, Zhejiang University, Hangzhou 310058, China
*
Author to whom correspondence should be addressed.
Submission received: 8 January 2020 / Revised: 3 February 2020 / Accepted: 5 February 2020 / Published: 10 February 2020
(This article belongs to the Special Issue Hyperspectral Imaging: Methods and Applications)

Abstract

:

Featured Application

The potential application of this work is to help the Longjing Tea planter, consumers, traders and food quality regulators to identify geographical origins of Longjing Tea in a rapid, nondestructive and accurate manner. The results of this work would also help to identify geographical origins or varieties of a single tea leaf in other tea industry.

Abstract

Longjing tea is one of China’s protected geographical indication products with high commercial and nutritional value. The geographical origin of Longjing tea is an important factor influencing its commercial and nutritional value. Hyperspectral imaging systems covering the two spectral ranges of 380–1030 nm and 874–1734 nm were used to identify a single tea leaf of Longjing tea from six geographical origins. Principal component analysis (PCA) was conducted on hyperspectral images to form PCA score images. Differences among samples from different geographical origins were visually observed from the PCA score images. Support vector machine (SVM) and partial least squares discriminant analysis (PLS-DA) models were built using the full spectra at the two spectral ranges. Decent classification performances were obtained at the two spectral ranges, with the overall classification accuracy of the calibration and prediction sets over 84%. Furthermore, prediction maps for geographical origins identification of Longjing tea were obtained by applying the SVM models on the hyperspectral images. The overall results illustrate that hyperspectral imaging at both spectral ranges can be applied to identify the geographical origin of single tea leaves of Longjing tea. This study provides a new, rapid, and non-destructive alternative for Longjing tea geographical origins identification.

1. Introduction

Tea is one of the most popular beverages worldwide. Different types of tea are cultivated and consumed, and green tea is one kind of tea favored by many people all around the world. Longjing tea is one of the most famous green teas in China and also one of China’s protected geographical indication products. Longjing tea contains various nutritious compositions [1,2]. Indeed, the planting area of Longjing tea is large, and the exact producing area of Longjing tea is a determining factor influencing its quality and price [3]. The commercial value of Longjing tea varies according to harvest time, processing technique and procedure, and producing areas, and the price of expensive Longjing tea can be ten times that of the cheap ones. The geographical origins of Longjing tea relate to different climates, soil properties, water, etc.
Due to the high commercial value of Longjing tea, adulteration of Longjing tea from different geographical origins is common. Traditionally, identification of geographical origins of Longjing tea is based on experienced tea farmers and tea experts or reagent based chemical analysis methods. Tea farmers and tea experts depend on personal experiences, such as observing the appearance as well as tasting and smelling the sensory properties. The chemical methods are reagent-wasteful, time-consuming, and require complex sample preparation and instrument operation [4,5]. These methods are not suitable for on-line, real-time, and large-scale detection. Thus, rapid and non-destructive methods are needed.
Visible/near-infrared spectroscopy (VNIRS) is widely used as a rapid and non-destructive technique for tea classification [6,7,8] and tea composition determination [9,10,11]. Hyperspectral imaging (HSI) is a technique integrating both spectroscopic techniques and imaging techniques, acquiring spectral and spatial information simultaneously. Traditional VNIRS acquires spectral information by ‘point’ scan or ‘spot’ scan, so only the spectra of a small region within the sample are measured. HSI acquires spectral information from a predefined region of interest (ROI). In general, the entire sample region is defined as the ROI. HSI acquires more comprehensive information about samples. Hyperspectral imaging is widely studied in the fields of agriculture [12,13], food [14], medical [15], and pharmaceutical [16], to name a few. Moreover, hyperspectral imaging is also studied in the tea industry for tea quality inspection [17,18,19].
In general, a certain amount of tea samples (contains tens or more tea leaves in a sample) is used for VINRS and HSI analysis and overlap of tea leaves occurs in this situation [6,7,8,9,10,17,18,19]. Thus it is difficult to identify adulterations in this amount of tea when some amounts of adulterations are mixed into the normal sample. With the advantages of HSI, spectral information of a single tea leaf on a large scale can be obtained and analyzed efficiently, making it possible to identify adulteration in tea by investigating single tea leaves. On the other, studying a single tea leaf can significantly increase the number of samples for analysis with larger variations in tea features.
The goal of this study is to explore the feasibility of using hyperspectral imaging to identify the geographical origins of Longjing tea based on single tea leaves. The specific objectives were: (1) to explore the feasibility of using single tea leaf for identification of the geographical origins of Longjing tea; (2) to explore the differences of two different hyperspectral imaging sensors at two spectral ranges; and (3) to build classification models for identification of the geographical origins of Longjing tea.

2. Materials and Methods

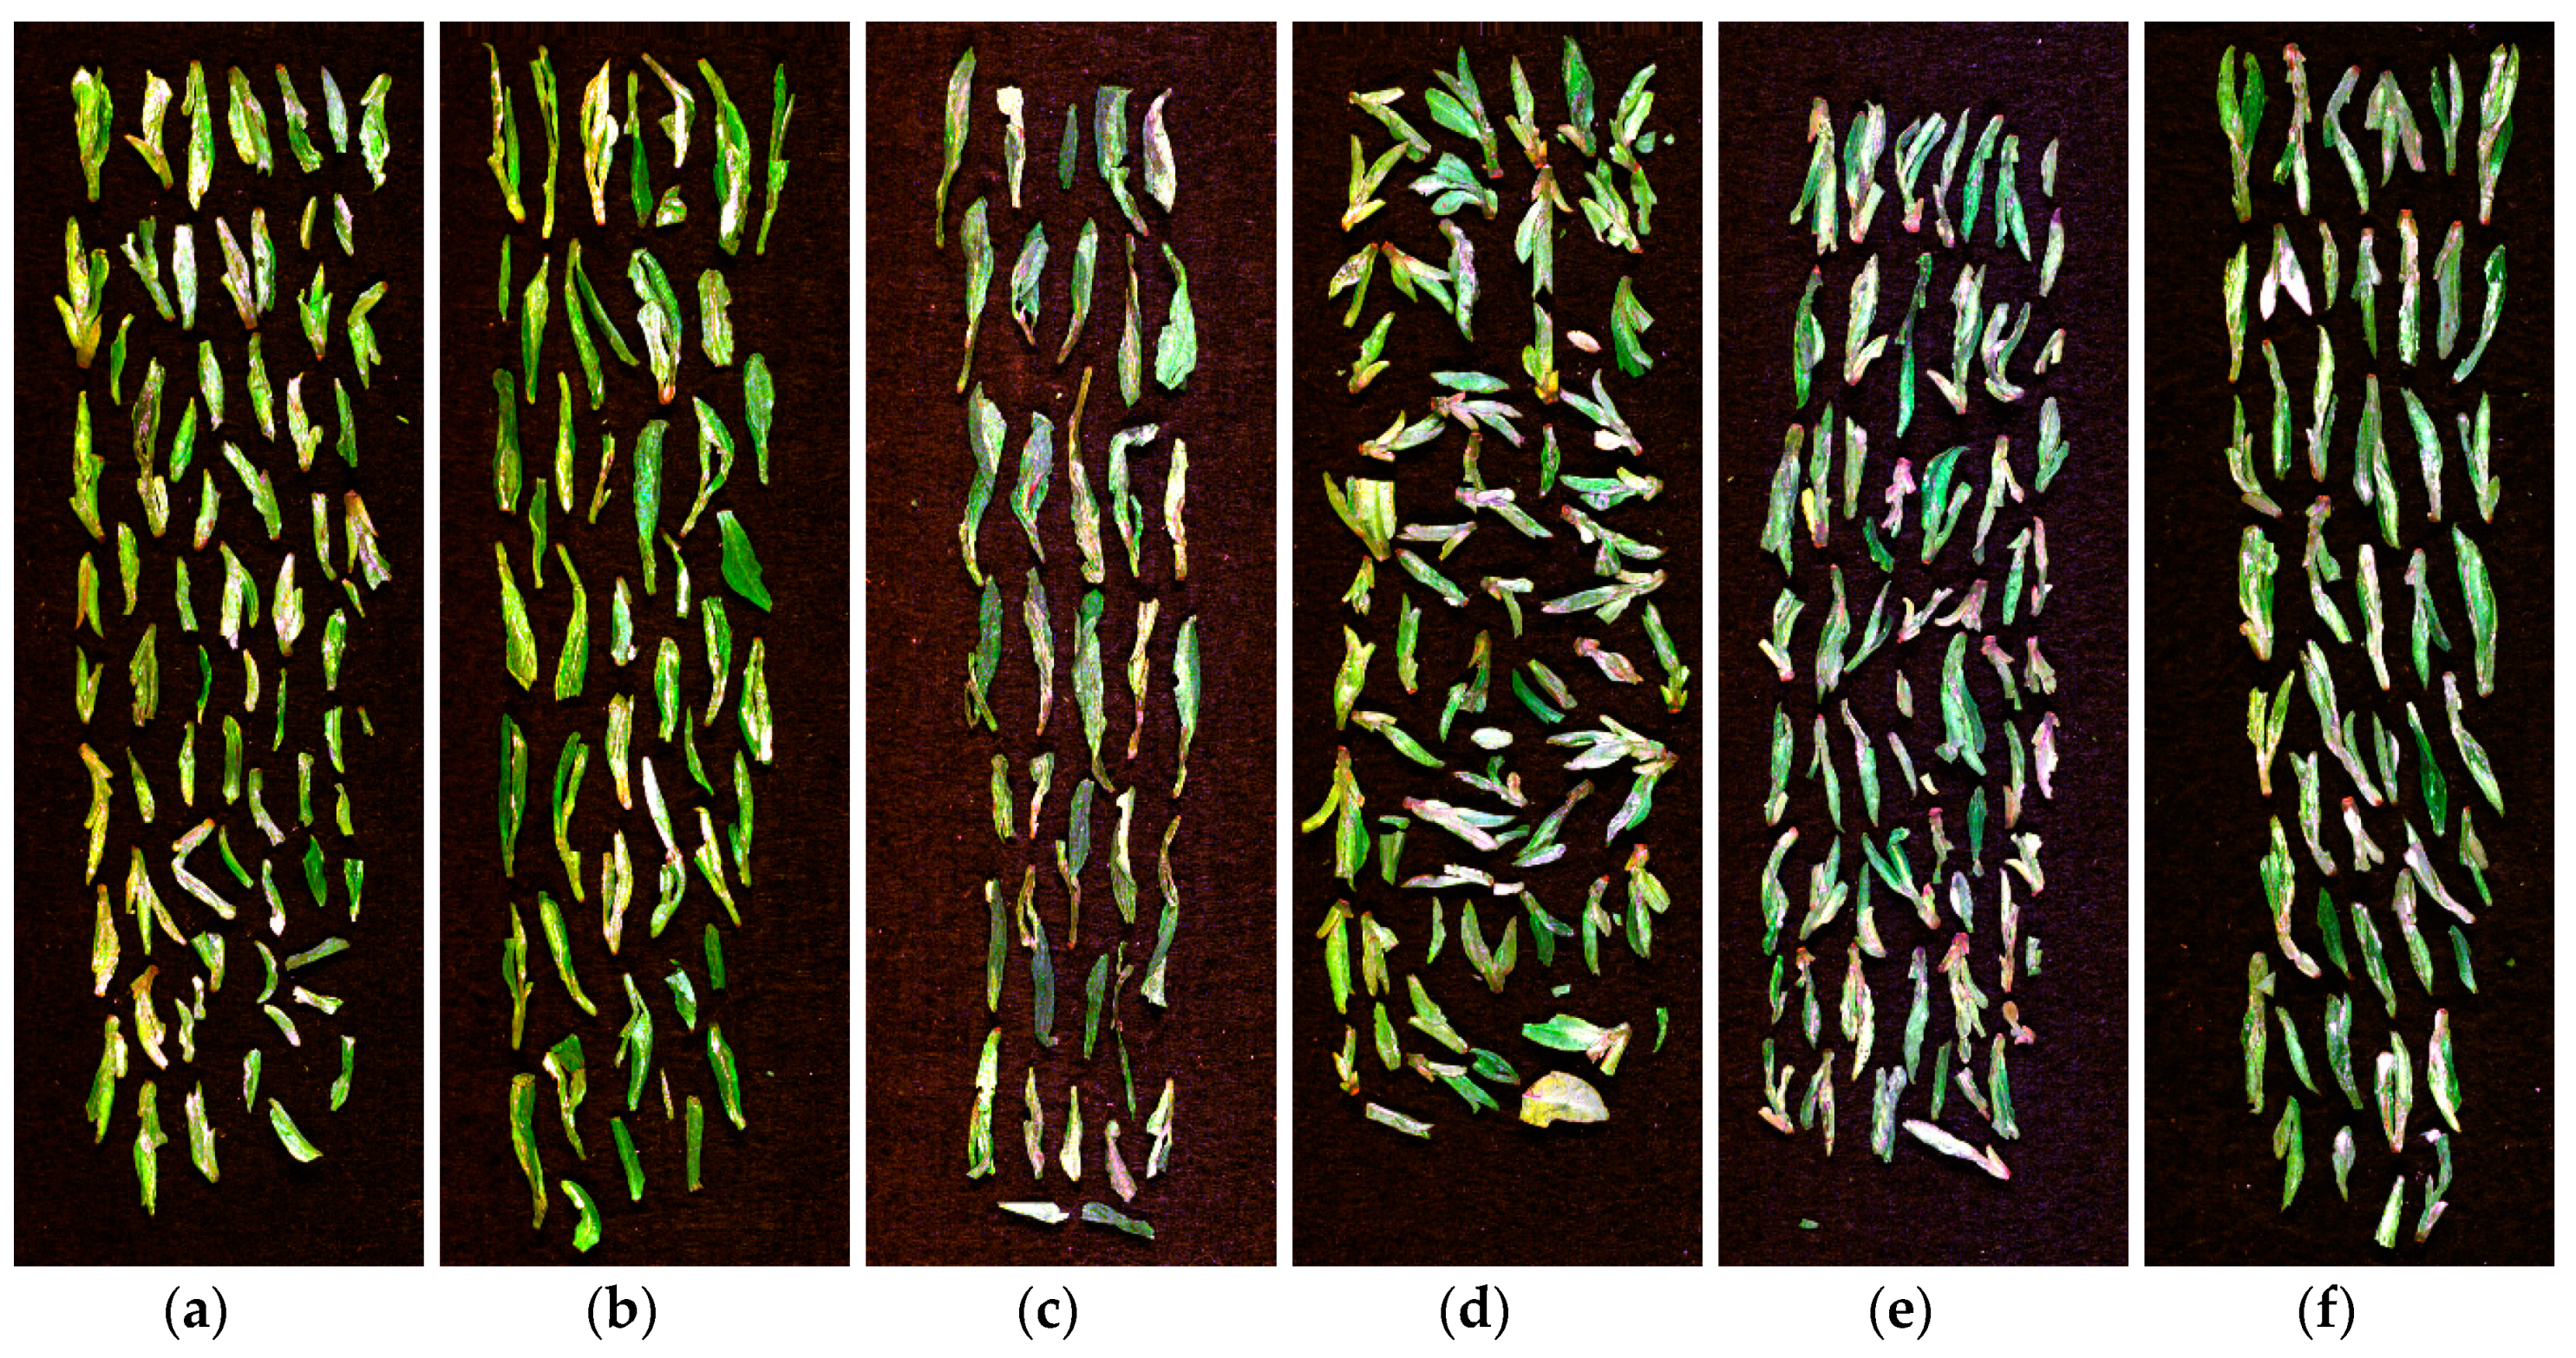
2.1. Sample Preparation

Samples of Longjing tea from six different geographical origins in Zhejiang Province, China were collected in the year of 2019, including Bashan Village (in Fuyang, Zhejiang Province, 119°51′41.4936′′ N, 30°4′44.0796′′ E), TongWu Village (in Xihu District, Hangzhou, Zhejiang Province, 120°3′10.2351′′ N, 30°11′41.8383′′ E), Meijiawu Village (Xihu District, Hangzhou City, Zhejiang Province, 120°5′15.6372” N, 30°12′21.8844′′ E), Tiedian Village (in Pan’an County, Zhejiang Province, 120°41′32.7444′′ N, 29°12′39.06′′ E), Xinxin Village (in Xinchang County, Zhejiang Province, 121°3′39.5892′′ N, 29°19′51.816′′ E), and Hujialing Village (in Yuhang District, Hangzhou City, Zhejiang Province, 119°56′56.7492′′ N, 30°12′11.88′′ E). Tea leaves were harvested from Camellis sinensis cv. Longjing 43 in the spring growth period before the Qingming Festival in 2019. The fresh green leaves were spread out in a thin layer on bamboo trays and exposed to sunlight or natural warm air for two hours. Then the leaves were processed by a traditional tea making procedure.
For each geographical origin, 40 g tea samples were collected, and single tea leaves were placed separately on a blackboard for image acquisition. Figure 1 shows the single tea leaves from six different geographical origins. During image acquisition and sample transportation, some tea leaves were broken into two or more leaves. Since these broken leaves can also be used for hyperspectral image acquisition to obtain spectral information, some of these leaves were manually selected for hyperspectral image acquisition as single tea leaf samples. Thus, the number of samples for VNIR and NIR hyperspectral image acquisition is different. To build classification models, the samples were randomly split into the calibration set and the prediction set at a ratio of 2:1. Table 1 shows the number of samples for VNIR and NIR hyperspectral image acquisition

2.2. Hyperspectral Imaging System and Image Acquisition

Two HSI systems covering two different spectral ranges (VNIR: 380–1030 nm; NIR: 874–1734 nm) were used to acquire hyperspectral images of Longjing tea. Details of the hyperspectral imaging system can be found in the literature [20].
The tea leaves for image acquisition were placed as in Figure 1. To acquire a non-deformable and clear image, three system parameters, including the distance between the camera lens and the moving plate, the camera’s exposure time, and the moving speed of the moving plate, should be determined. For VNIR HSI, these three parameters were determined as 15.6 cm, 0.14 s, and 0.8 mm/s, respectively; for NIR HSI, these three parameters were determined as 12.6 cm, 3000 μs, and 11 mm/s.
After image acquisition, the image correction procedure was conducted to transform the raw hyperspectral images into reflectance hyperspectral images [20]. The image correction is based on Equation (1):
I c = I r a w I d a r k I w h i t e I d a r k
where Ic is the corrected image, Iraw is the raw hyperspectral image, Iwhite is the white reference image acquired by using a white Teflon tile with nearly 100% reflectance to calibrate the light intensity, Idark is the dark reference image acquired by covering the camera lens completely with its opaque cap without any light to remove the influence of dark current in the camera.

2.3. Spectral Data Extraction

After image correction, each single tea leaf was defined as an ROI, and pixel-wise spectra within each ROI were extracted, preprocessed, and averaged as one spectrum to represent the sample. To extract spectral information, samples were isolated from the background using the same procedure introduced in the literature [21].
The spectra were reliable in a smaller spectral range, so only the spectra in the range of 502–947 nm for VNIR HSI and spectra in the range of 975–1646 nm for NIR HSI were used for analysis. To reduce random noises, wavelet transform was applied. For VNIR spectra, wavelet function Daubechies 9 with decomposition level 3 was used to preprocess the pixel-wise spectra, followed by moving average smoothing (window size: 7), and baseline correction; for NIR spectra, wavelet function Daubechies 8 with decomposition level 3 was used to preprocess the pixel-wise spectra, followed by moving average smoothing (window size: 7), and baseline correction. As for wavelet transform, the spectrum was decomposed into the approximation coefficients (low frequency) and the detail coefficients (high frequency). The detail coefficients contained the noisy information, and the soft threshold method was applied to the detail coefficients to reduce the noisy information. The preprocessed detail coefficients and the approximation coefficients were used to reconstruct the spectrum, which was the preprocessed spectra [22].

2.4. Data Analysis Methods

Principal component analysis (PCA) is a widely used data reduction and feature extraction method. PCA projects the original variables into new orthogonal variables (called principal components, PCs) in the new data space, and each PC is a linear combination of the original variables. The PCs are ranked according to the explained variances. In general, the first few PCs contain most of the information, and these PCs are used to represent the original data. PCA is generally used to qualitatively explore the separability and clusters of samples by projecting one PC on the other PC in the scores space. For hyperspectral images, PCA can be used to obtain pixel-wise score values to form score images at different PCs. To obtain score images, one hyperspectral image of each class was used. After background removal, pixel-wise spectra within sample regions were extracted. PCA was conducted on the pixel-wise spectra to obtain pixel-wise score values at different PCs. For each hyperspectral image, the corresponding score images at different PCs are obtained by knowing the pixel-wise score values. In other words, these score images are the products of the PCA scores. In the PCA score images, score values can be presented in color gradients, and differences among samples are observed [23,24].
Support vector machine (SVM) is a widely used pattern recognition algorithm in spectral data analysis [25,26]. For a linearly separable issue, SVM explores a set of hyperplanes to maximize the distance among the closest samples from different classes. For samples which are not linearly separable, SVM maps the original data into higher dimension spaces to make the samples linearly separable. In the new space, SVM explores a set of hyperplanes to maximize the distance among the closet samples from different classes. Kernel functions are important for SVM to map the data. In spectral data analysis, radial basis function (RBF) is the most widely used kernel function, due to its strong ability to deal with nonlinear issues. In this study, RBF was used as the kernel function. The parameters of SVM (penalty coefficient C and kernel width g) were determined by a grid-search procedure. For SVM models, the category values of Longjing tea from Bashan Village, TongWu Village, Meijiawu Village, Tiedian Village, Xinxin Village, and Hujialing Village were coded as 1, 2, 3, 4, 5, and 6, respectively.
Partial least squares discriminant analysis (PLS-DA) is one of the most used discriminant methods in spectral data analysis [27]. PLS regression tries to find the maximum correlation between the dependent variable and the independent variables. PLS-DA is conducted in the same way as PLS regression (PLSR), and PLS-DA uses integers or dummy variables which represent the sample classes as dependent variables. To establish the optimal PLS-DA model, the optimal number of latent variables (LVs) of PLS-DA is determined. For PLS-DA models, the category values of Longjing tea from Bashan Village, TongWu Village, Meijiawu Village, Tiedian Village, Xinxin Village, and Hujialing Village were coded as 000001, 000010, 000100, 001000, 010000, and 100000, respectively. In this study, both SVM and PLS-DA models were built using full spectra.

2.5. Software and Model Evaluation

The performances of PLS-DA and SVM models were evaluated by the classification accuracy which was calculated as the ratio of the number of correctly classified samples to the number of samples to be classified. Both PLS-DA and SVM models were conducted on MATLAB R2015b (The MathWorks, Matick, MA, USA).

3. Results and Discussion

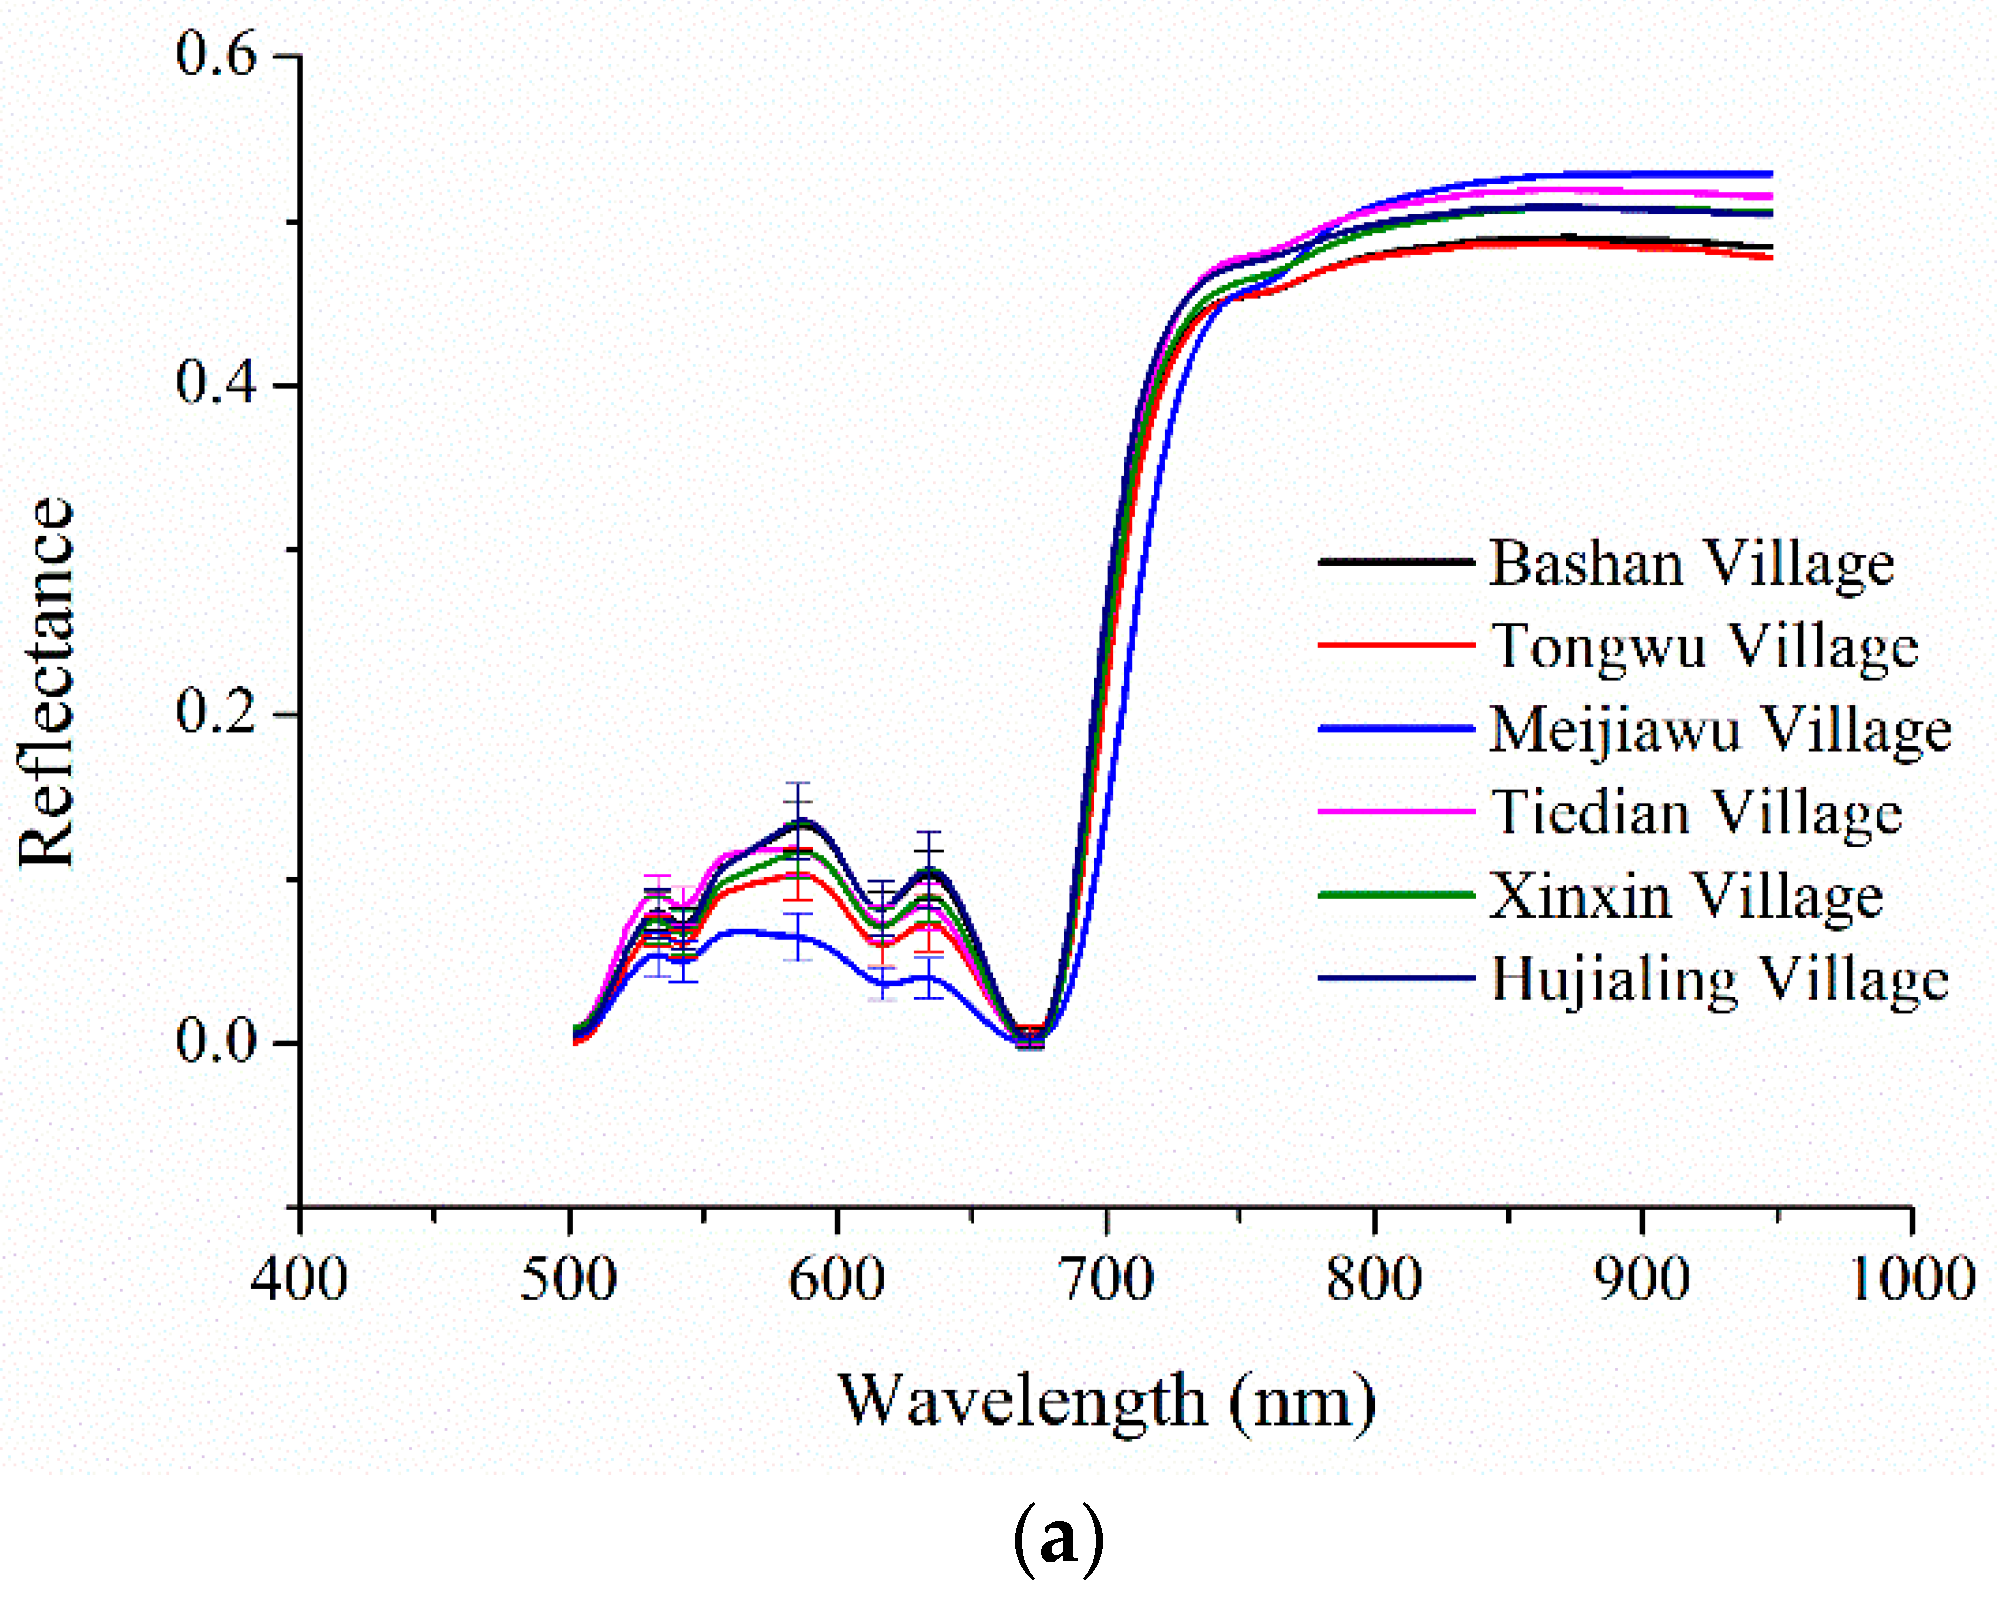
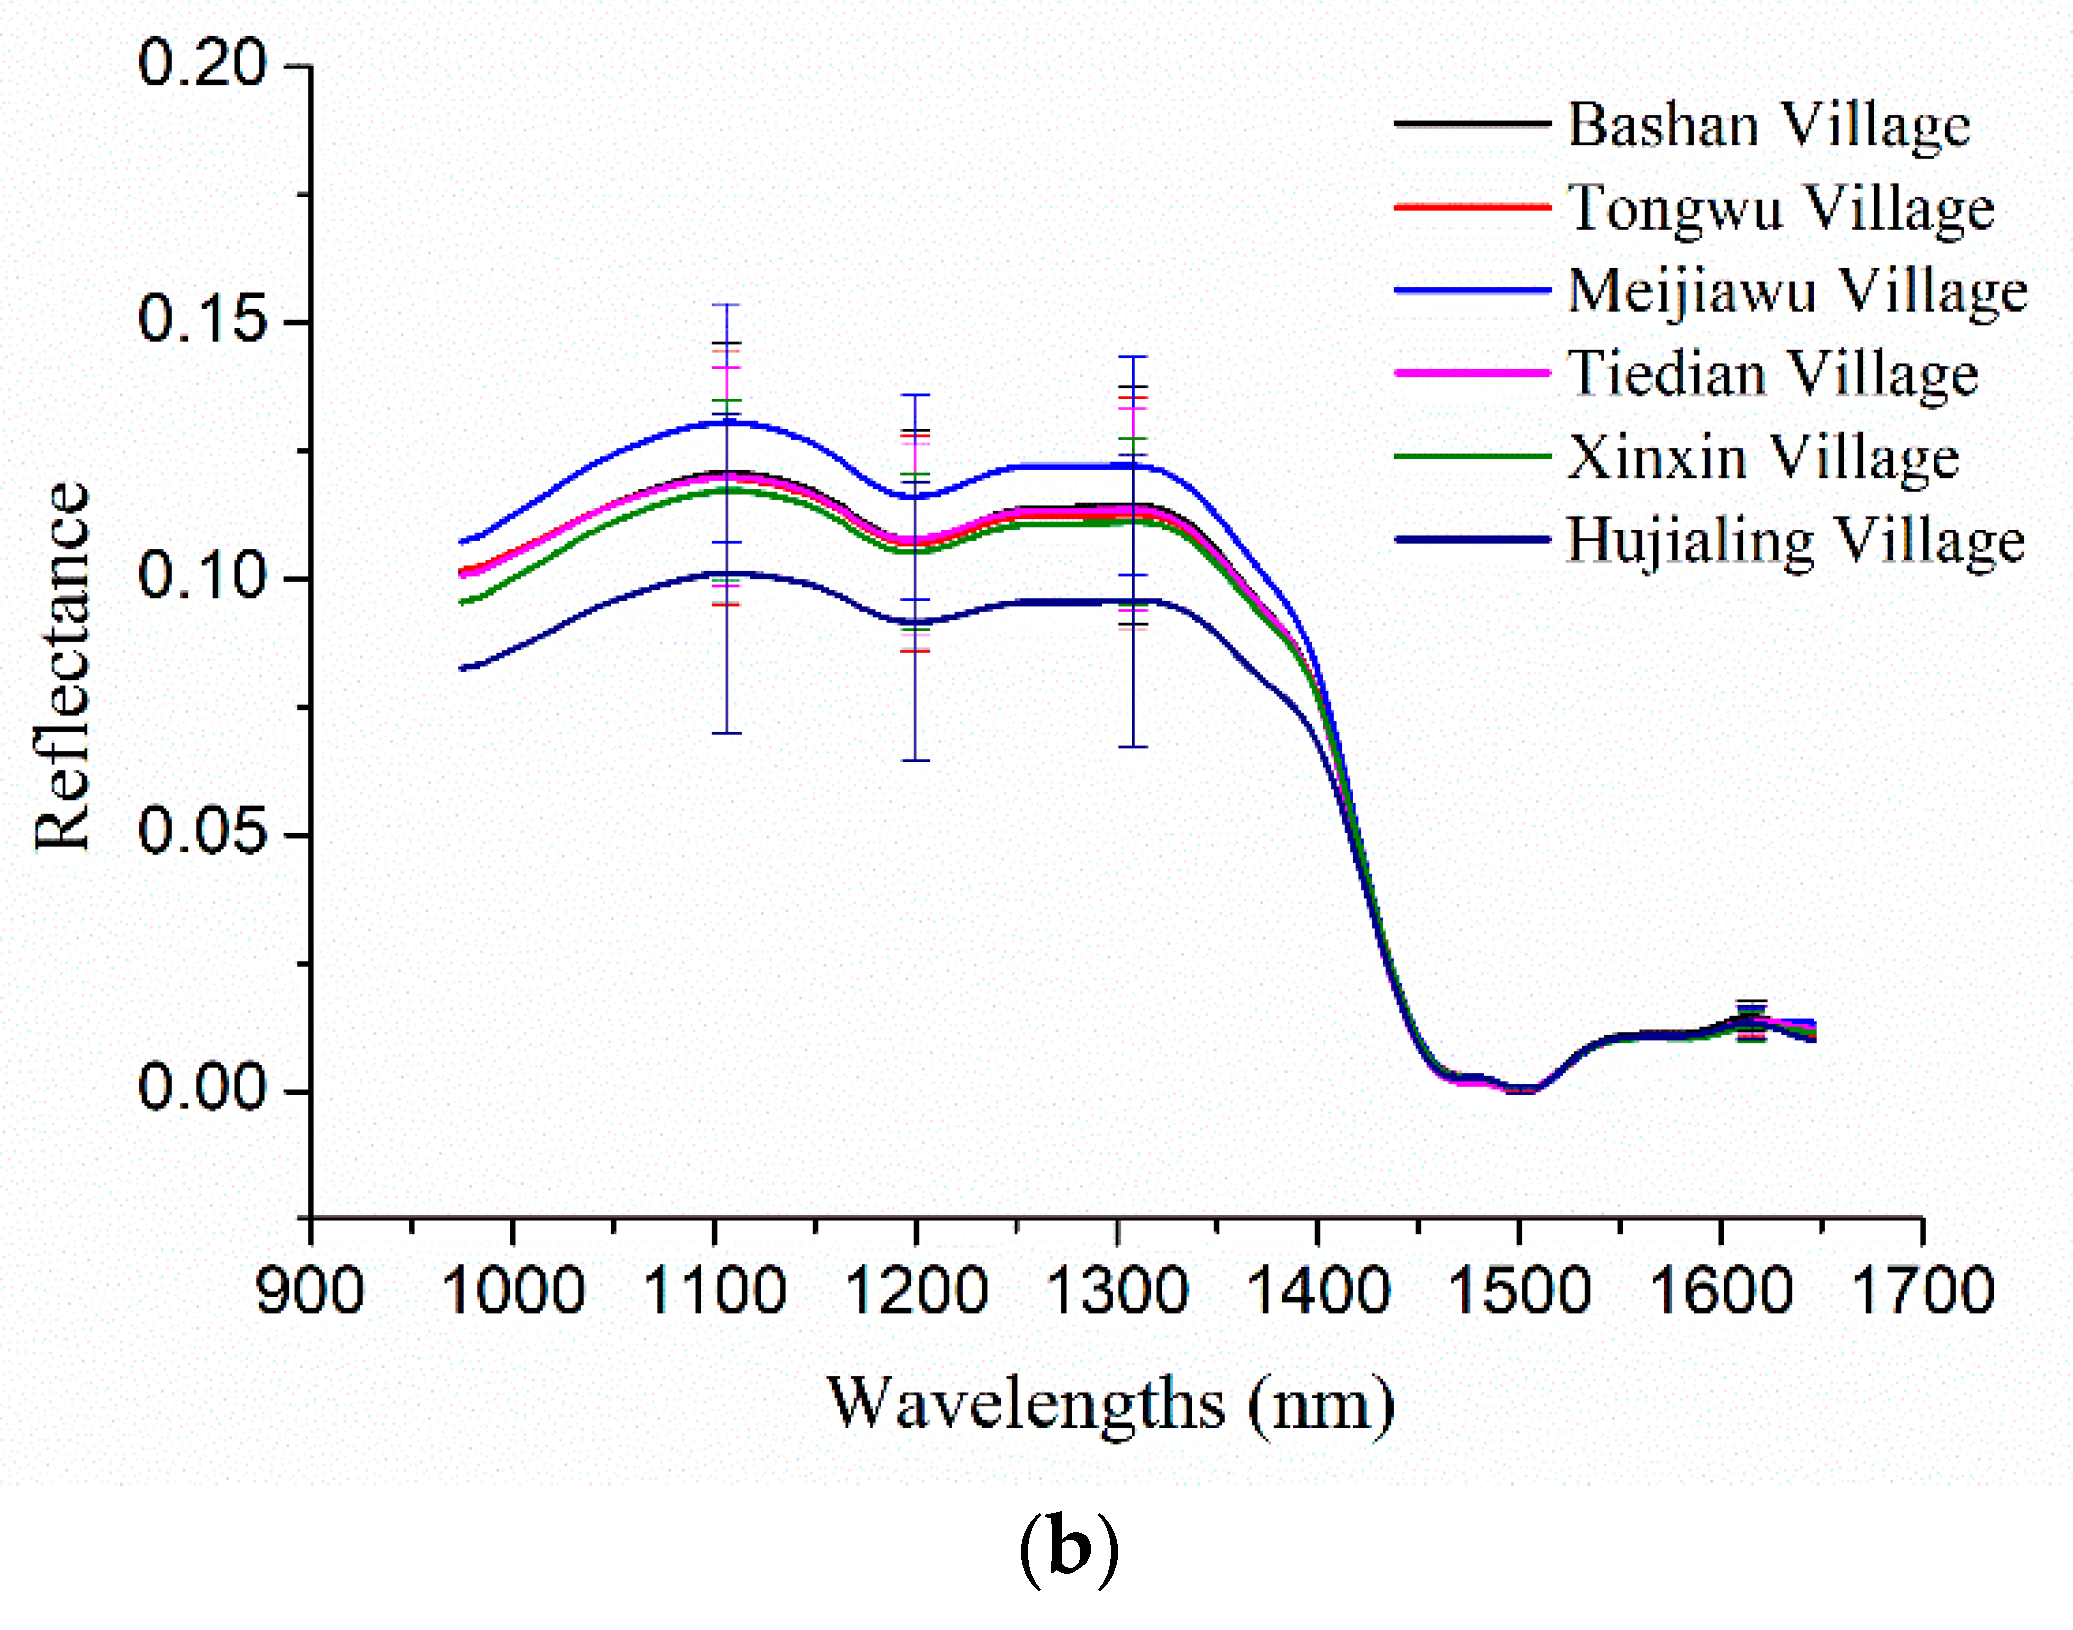
3.1. Spectral Profiles

Figure 2a,b shows the average spectra with standard deviation at certain wavelengths of Longjing tea samples from six different geographical origins at the spectral range of 502–947 nm (spectral range 1) and 975–1646 nm (spectral range 2), respectively. As shown in Figure 2a, spectra in the range of 502–947 nm shows similar spectral curves, and the differences on the reflectance of tea samples from six different geographical origins are observed. The standard deviations of 533, 543, 585, 616, 634, and 672 nm are presented in Figure 2a. Overlaps of spectra standard deviation are observed in the two spectral ranges. A similar phenomenon is also observed in Figure 2b. The standard deviations of 1200, 1500, 1106, 1308, and 1615 nm are presented in Figure 2b.

3.2. PCA Score Images

PCA was conducted on hyperspectral images to form a score image at each PC to qualitatively identify the differences among tea leaves from different geographical origins. In this study, score images of the first ten PCs were obtained for the two spectral ranges (shown in Figures S1 and S2). To conduct PCA, leave-one-out cross validation was used.
Figure S1 shows the score images of the first ten PCs of spectral range 1. These first ten PCs explained over 99% of the data viability. Indeed, the first three PCs already explained over 99% of data viability. The other seven PCs explained less than 1% of data viability. Although these PCs explained less data viability, they also contained information about samples. Thus, score images of these PCs were also studied. As shown in Figure S1, tea leaves from different geographical origins were distinguished according to color differences. Samples from Meijiawu Village had the lowest score and the bluest color in PC2 image, which was preliminary identified. In PC3 image, the score of samples from TongWu Village was relatively low, which was identified. In addition, samples from Tiedian Village were distinguished from other geographical origins in PC4 image since the score of samples from Tiedian Village was lower and the color was bluish. In addition, samples from Meijiawu Village, Xinxin Village, and Hujialing Village were intuitively distinguished from samples from the other geographical origins in score images of PC5, PC6, and PC9, respectively. These results illustrate that although the remaining seven PCs (PC4–PC10) explained less than 1% of data viability, they also contained useful information contributing to the identification of the geographical origins of Longjing tea.
Figure S2 shows the score images of the first ten PCs at spectral range 2. These first ten PCs explained over 99% of the data viability. Similarly, tea leaves from different geographical origins were distinguished according to color differences. For example, in PC1 and PC2 images, the pixel scores of samples from Bashan Village and Meijiawu Village were relatively higher than those of samples from the other geographical origins. In PC3 images, the score of samples from Hujialing Village was relatively high and was distinguished from the others. In addition, in PC7 images, the color of samples from Tiedian Village was relatively blue, which was distinguished preliminarily. In PC10 image, samples from Meijiawu Village could be further identified because of their high score. These results also illustrate that apart from the first three PCs, the other PCs also contained useful information contributing to the identification of the geographical origins of Longjing tea, even though they explained little of the data viability.

3.3. Classification Models

The PCA score images show that there were differences among tea samples from different geographical origins. To further identify the geographical origins of Longjing tea samples, SVM and PLS-DA models were built using the full spectra in the two different spectral ranges. Table 2 and Table 3 show the classification results of SVM and PLS-DA models, respectively.
As shown in Table 2, close results were obtained by SVM models using full spectra of spectral ranges 1 and 2, and variations could be found in the results of samples from different geographical origins. For the SVM model using full spectra of spectral range 1, the optimal model parameters (C, g) were (256, 1). As shown in Table 1, good classification results were obtained, with a classification accuracy of the calibration set and the prediction set of 94.31% and 88.13%, respectively. For the samples from different geographical origins, the classification accuracy of each geographical origin was over 90% in the calibration set, with worse classification results in the prediction set (all over 80%). For the SVM model using full spectra of spectral range 2, the optimal model parameters (C, g) were (256, 25.8576). As shown in Table 2, good classification results were obtained, with a classification accuracy of the calibration set and the prediction set of 94.31% and 87.66%, respectively. For the samples from different geographical origins, the classification accuracy of each geographical origin was over 89% in the calibration set, with worse classification results in the prediction set, especially for samples from Bashan Village (less than 80%).
As shown in Table 3, close results were also obtained by PLS-DA models using full spectra of spectral range 1 and spectral range 2, and variations were also found on the results of samples from different geographical origins. For the PLS-DA model using full spectra of spectral range 1, classification accuracy of the samples from most geographical origins was over 80% in the calibration and prediction sets, and classification accuracy of the prediction set of Hujialing Village was the lowest (only 64.20%). For the PLS-DA model using full spectra of spectral range 2, classification accuracy of the samples from Xinxin Village was lower than 80% in the calibration and prediction sets, and classification accuracy of the samples from the remaining five geographical was all over 80%. Overall, the PLS-DA model using spectral range 2 showed better results than the PLS-DA model using spectral range 1.
In different classification models and different spectral ranges, the classification accuracy of the samples from different geographical origins varied. Moreover, the classification accuracy of SVM models and PLS-DA models was also close. These results show that HSI systems at different spectral ranges could both be used to identify the geographical origins of single Longjing tea leaves with SVM and PLS-DA models.
Various studies using near-infrared spectroscopy and hyperspectral imaging to identify tea varieties and geographical origins have been reported. Yan et al. [28] used hyperspectral imaging (spectral range: 370–1042 nm) to classify six different varieties of Loingjing fresh tea. The classification accuracy could reach over 94%. Ge et al. [29] used hyperspectral imaging (spectral range: 400.68–1001.612 nm) to identify oolong tea varieties, and the classification accuracy was over 97%. Sun et al. [30] used hyperspectral imaging (spectral range: 390–1050 nm) to identify green tea varieties, and the classification accuracy was over 91%. Jia et al. [31] used near-infrared spectroscopy (spectral range: 1350–1800 nm) to identify the growing area of Longjing tea, and the classification accuracy of two growing areas was 97.3%. Liu et al. [32] used near-infrared spectroscopy to identify grades, varieties, and geographical origins of green tea. The classification accuracy all reached 100%. The results in our study were similar to or a little worse than the results in these studies. The reason might be that the number of samples in our study was much more than the number of samples in these studies. On the other hand, a single tea leaf, rather than a batch of tea leaves or tea powders, was studied in our manuscript. A single tea leaf is the basis of all tea products. The identification of the geographical origins based on a single leaf is of great importance for protecting Longjing tea from adulteration. By using hyperspectral imaging, spectral information of the entire single tea leaf was extracted, providing more comprehensive information than non-imaging near-infrared spectroscopy. Moreover, the PCA score images obtained from hyperspectral images provided an alternative to visually analyze the differences among samples. The overall results in this study illustrated the feasibility of using hyperspectral imaging to identify the geographical origins of a single tea leaf.

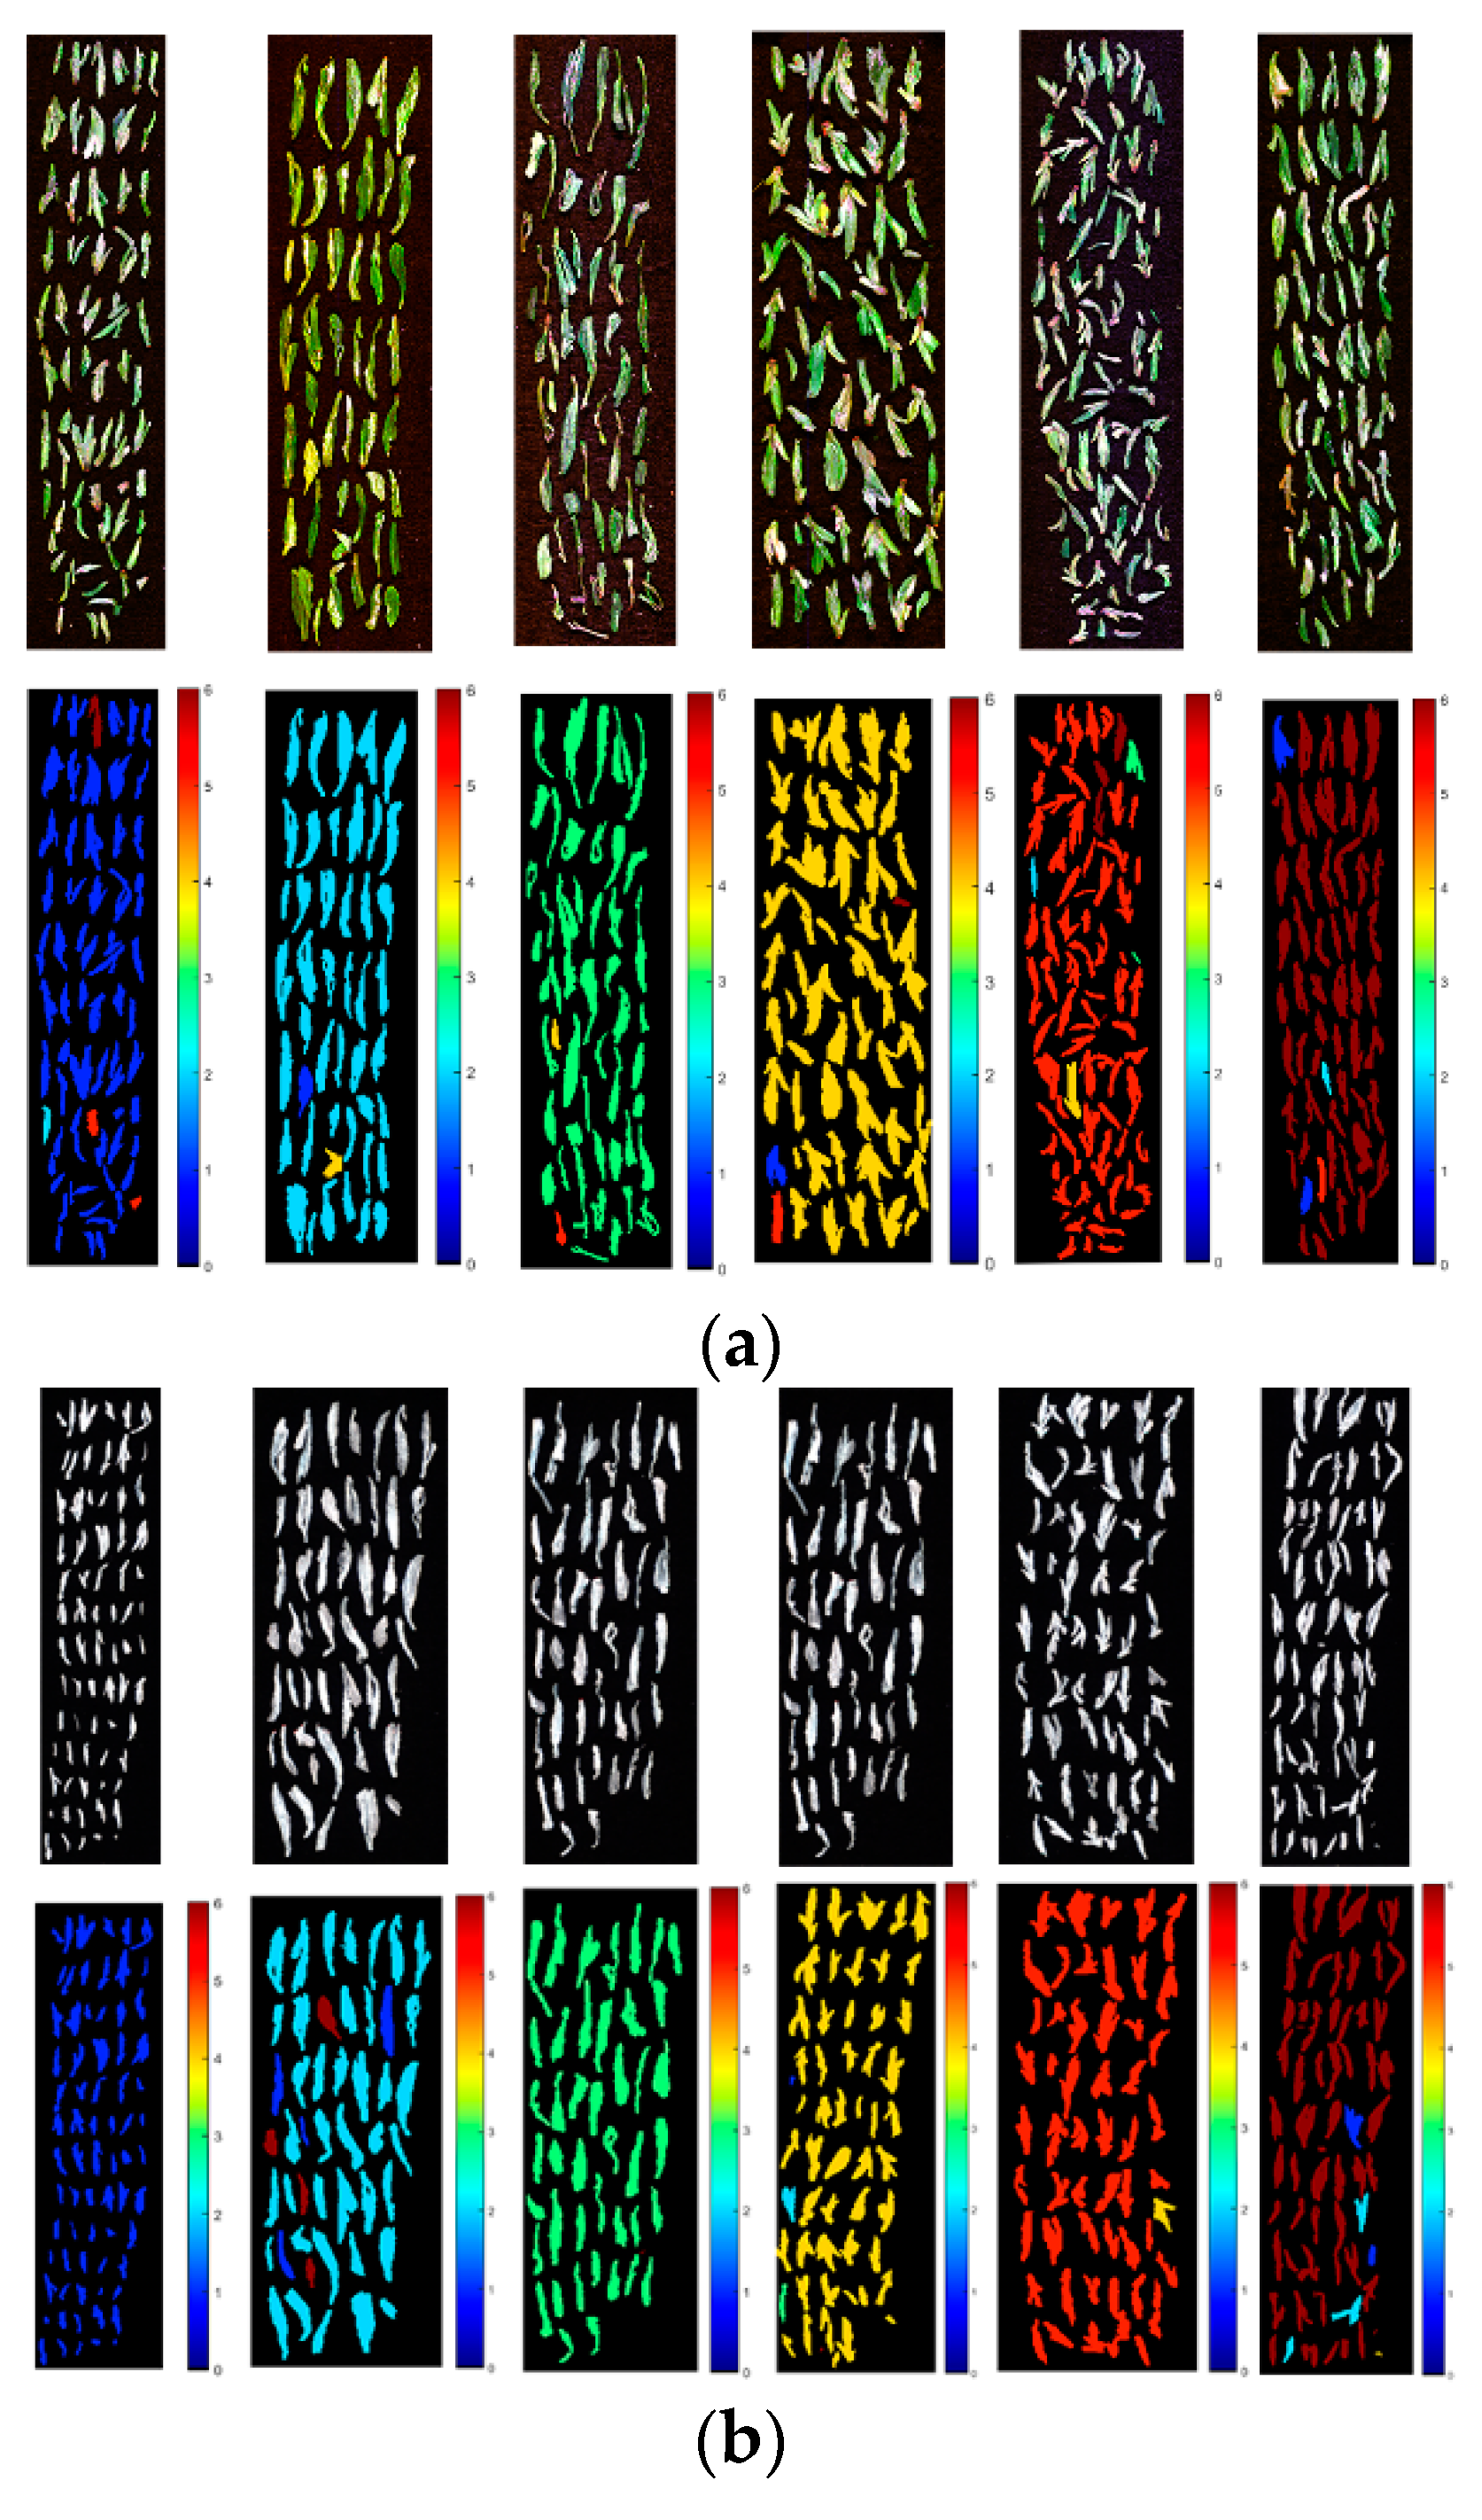
3.4. Prediction Maps

Hyperspectral imaging has the advantage of acquiring the spectral information of each pixel. By establishing models using spectral data, the model can be applied to each pixel to obtain the corresponding prediction value. Based on the prediction value of each pixel, a prediction map can be formed, and a color bar used to represent the values by colors [33]. In this research, identification of the geographical origins of Longjing tea was studied by using single tea leaves, and pixels within each tea leaf belonged to the same class. Thus, the prediction maps were formed using the class value of each single leaf rather than using the prediction value of each pixel [34]. The general procedure to form the prediction maps was to apply the established model to each single tea leaf to obtain the class value representing the geographical origins of the corresponding tea. The spectra extraction procedures for prediction maps were the same as those for modeling. In this study, SVM models were used to form prediction maps for one randomly selected image of each geographical origin.
Figure 3 shows the prediction maps obtained from the hyperspectral images of Longjing tea from six different geographical origins at the two different spectral ranges. As shown in the prediction maps, the class value of each tea leaf was visualized, and the leaves with different class values (corresponding to the geographical origins) were identified visually.

4. Conclusions

Hyperspectral imaging covering two different spectral ranges (380–1030 nm and 874–1734 nm) was successfully utilized to identify Longjing tea from six geographical origins. Single tea leaves were used for analysis. PCA was firstly applied on pixel-wise spectra to form score images of each PC. For hyperspectral images at the two spectral ranges, differences among samples from different geographical origins could be observed in the PCA score images. Furthermore, spectral data were extracted from each single tea leaf for modeling. SVM and PLS-DA models built using spectral data at the spectral range of 502–947 nm and 975–1646 nm obtained good performances, with classification accuracy of the calibration and prediction sets over 84%. SVM and PLS-DA models obtained close performances. The classification performances of hyperspectral images at two different spectral ranges were close. Moreover, the classification accuracy of tea samples from each geographical origin varied. The prediction maps for identifying the geographical origins of Longjing tea were obtained by applying SVM models on the hyperspectral images. The prediction maps provided visual classification results and helped to sort Longjing tea samples within one image. The overall results illustrate the potential of using hyperspectral imaging to identify the geographical origins of single tea leaves at two different spectral ranges. Although good classification results were obtained, more studies are needed to improve the classification results. This study indicates the great potential for the development of the on-line geographical origin tracing platform of Longjing tea based on hyperspectral imaging and machine learning methods.

Supplementary Materials

The following are available on https://0-www-mdpi-com.brum.beds.ac.uk/2076-3417/10/3/1173/s1, Figure S1: Score images of the first ten PCs of spectral range 1 (502–947 nm) for tea samples from six different geographical origins. (a–j) represent PC1, PC2, … PC10. (The numbers 1, 2, 3, 4, 5, and 6 represent the corresponding geographical origin of Bashan Village, TongWu Village, Meijiawu Village, Tiedian Village, Xinxin Village, and Hujialing Village), Figure S2: Score images of the first ten PCs of spectral range 2 (975–1646 nm) for tea samples from six different geographical origins. (a–j) represent PC1, PC2, … PC10. (The numbers 1, 2, 3, 4, 5, and 6 represent the corresponding geographical origin of Bashan Village, TongWu Village, Meijiawu Village, Tiedian Village, Xinxin Village, and Hujialing Village).

Author Contributions

Conceptualization, Z.H.; data curation, Z.H.; formal analysis, Z.H.; funding acquisition, Y.H.; investigation, Z.H.; methodology, Z.H.; project administration, Y.H.; resources, Z.H.; software, Z.H.; supervision, Y.H.; validation, Y.H.; visualization, Y.H.; writing—original draft, Z.H.; writing—review and editing, Z.H. and Y.H. All authors have read and agreed to the published version of the manuscript.

Funding

This research was funded by the National Key R&D Program of China, grant number 2018YFD0700501.

Acknowledgments

We would like to thank Chu Zhang (a postdoctoral fellow at the College of Biosystems Engineering and Food Science, Zhejiang University) for providing help on the experimental design and data analysis strategy during the research.

Conflicts of Interest

The authors declare no conflicts of interest.

References

  1. Wang, K.; Ruan, J. Analysis of chemical components in green tea in relation with perceived quality, A Case Study with Longjing Teas. Int. J. Food Sci. Tech. 2009, 44, 2476–2484. [Google Scholar] [CrossRef]
  2. Zhu, Y.; Lv, H.P.; Dai, W.D.; Guo, L.; Tan, J.F.; Zhang, Y.; Yu, F.L.; Shao, C.Y.; Peng, Q.H.; Lin, Z. Separation of aroma components in Xihu Longjing tea using simultaneous distillation extraction with comprehensive two-dimensional gas chromatography-time-of-flight mass spectrometry. Sep. Purif. Technol. 2016, 164, 146–154. [Google Scholar] [CrossRef]
  3. Zhou, G.H.; Zhu, L.X.; Ren, T.X.; Zhang, L.S.; Gu, J.Q. Geochemical characteristics affecting the cultivation and quality of Longjing Tea. J. Geochem. Explor. 1995, 55, 183–191. [Google Scholar] [CrossRef]
  4. Ni, K.; Wang, J.; Zhang, Q.F.; Yi, X.Y.; Ma, L.F.; Shi, Y.Z.; Ruan, J.Y. Multi-element composition and isotopic signatures for the geographical origin discrimination of green tea in China: A case study of Xihu Longjing. J. Food Compos. Anal. 2018, 67, 104–109. [Google Scholar] [CrossRef]
  5. Wang, L.Y.; Wei, K.; Cheng, H.; He, W.; Li, X.H.; Gong, W.Y. Geographical tracing of Xihu Longjing tea using high performance liquid chromatography. Food Chem. 2014, 146, 98–103. [Google Scholar] [CrossRef]
  6. Diniz, P.H.G.D.; Gomes, A.A.; Pistonesi, M.F.; Band, B.S.F.; de Araujo, M.C.U. Simultaneous classification of teas according to their varieties and geographical origins by using NIR spectroscopy and SPA-LDA. Food Anal. Method 2014, 7, 1712–1718. [Google Scholar] [CrossRef]
  7. Zhuang, X.G.; Shi, X.S.; Shi, X.S.; Wang, H.F.; Wang, L.L.; Fang, J.X. Rapid Determination of Green Tea Origins by Near-Infrared Spectroscopy and Multi-Wavelength Statistical Discriminant Analysis. J. Appl. Spectrosc. 2019, 86, 76–82. [Google Scholar] [CrossRef]
  8. He, W.; Zhou, J.; Cheng, H.; Wang, L.Y.; Wei, K.; Wang, W.F.; Li, X.H. Validation of origins of tea samples using partial least squares analysis and Euclidean distance method with near-infrared spectroscopy data. Spectrochim. Acta A 2012, 86, 399–404. [Google Scholar] [CrossRef]
  9. Hazarika, A.K.; Chanda, S.; Sabhapondit, S.; Sanyal, S.; Tamuly, P.; Tasrin, S.; Sing, D.; Tudu, B.; Bandyopadhyay, R. Quality assessment of fresh tea leaves by estimating total polyphenols using near infrared spectroscopy. Int. J. Food Sci. Tech. 2018, 55, 4867–4876. [Google Scholar] [CrossRef]
  10. Zhu, M.Z.; Wen, B.B.; Wu, H.; Li, J.; Li, Q.; Li, Y.H.; Huang, J.A.; Liu, Z. The Quality Control of Tea by Near-Infrared Reflectance (NIR) Spectroscopy and Chemometrics. J. Spectrosc. 2019, 2019. [Google Scholar] [CrossRef]
  11. Pan, W.X.; Zhao, J.W.; Chen, Q.S.; Zhang, D.L. Simultaneous and Rapid Measurement of Main Compositions in Black Tea Infusion Using a Developed Spectroscopy System Combined with Multivariate Calibration. Food Anal. Method 2015, 8, 749–757. [Google Scholar] [CrossRef]
  12. Feng, L.; Zhu, S.S.; Liu, F.; Liu, F.; He, Y.; Bao, Y.D.; Zhang, C. Hyperspectral imaging for seed quality and safety inspection: A review. Plant Methods 2019, 15, 91. [Google Scholar] [CrossRef] [PubMed] [Green Version]
  13. Bodner, G.; Nakhforoosh, A.; Arnold, T.; Leitner, D. Hyperspectral imaging: A novel approach for plant root phenotyping. Plant Methods 2018, 14, 84. [Google Scholar] [CrossRef] [PubMed] [Green Version]
  14. Zhang, C.; Guo, C.; Liu, F.; Kong, W.W.; He, Y.; Lou, B.G. Hyperspectral imaging analysis for ripeness evaluation of strawberry with support vector machine. J. Food Eng. 2016, 179, 11–18. [Google Scholar] [CrossRef]
  15. Lu, G.; Fei, B. Medical hyperspectral imaging: A review. J. Biomed Opt. 2014, 19, 010901. [Google Scholar] [CrossRef] [PubMed]
  16. Rocha, W.F.D.; Sabin, G.P.; Março, P.H.; Poppi, R.J. Quantitative analysis of piroxicam polymorphs pharmaceutical mixtures by hyperspectral imaging and chemometrics. Chemomert. Intell. Lab. 2011, 106, 198–204. [Google Scholar]
  17. Zhao, J.W.; Chen, Q.S.; Cai, J.R.; Ouyang, Q. Automated tea quality classification by hyperspectral imaging. Appl. Optics 2009, 48, 3557–3564. [Google Scholar] [CrossRef]
  18. Li, L.Q.; Xie, S.M.; Ning, J.M.; Chen, Q.S.; Zhang, Z.Z. Evaluating green tea quality based on multisensor data fusion combining hyperspectral imaging and olfactory visualization systems. J. Sci. Food Agric. 2019, 99, 1787–1794. [Google Scholar] [CrossRef]
  19. Ning, J.M.; Sun, J.J.; Li, S.H.; Sheng, M.; Zhang, Z.Z. Classification of five Chinese tea categories with different fermentation degrees using visible and near-infrared hyperspectral imaging. Int. J. Food Prop. 2017, 20, 1515–1522. [Google Scholar] [CrossRef] [Green Version]
  20. Feng, L.; Zhu, S.S.; Zhou, L.; Zhao, Y.Y.; Bao, Y.D.; Zhang, C.; He, Y. Detection of Subtle Bruises on Winter Jujube Using Hyperspectral Imaging With Pixel-Wise Deep Learning Method. IEEE Access 2019, 7, 64494–64505. [Google Scholar] [CrossRef]
  21. Zhu, S.S.; Feng, L.; Zhang, C.; Bao, Y.D.; He, Y. Identifying Freshness of Spinach Leaves Stored at Different Temperatures Using Hyperspectral Imaging. Foods 2019, 8, 356. [Google Scholar] [CrossRef] [PubMed] [Green Version]
  22. Dai, Q.; Cheng, J.H.; Sun, D.W.; Zhu, Z.W.; Pu, H.B. Prediction of total volatile basic nitrogen contents using wavelet features from visible/near-infrared hyperspectral images of prawn (Metapenaeus ensis). Food Chem. 2016, 197, 257–265. [Google Scholar] [CrossRef] [PubMed]
  23. Williams, P.J.; Kucheryavskiy, S. Classification of maize kernels using NIR hyperspectral imaging. Food Chem. 2016, 209, 131–138. [Google Scholar] [CrossRef] [PubMed]
  24. Zhao, Y.Y.; Zhang, C.; Zhu, S.S.; Gao, P.; Feng, L.; He, Y. Non-destructive and rapid variety discrimination and visualization of single grape seed using near-infrared hyperspectral imaging technique and multivariate analysis. Molecules 2018, 23, 1352. [Google Scholar] [CrossRef] [PubMed] [Green Version]
  25. Zhang, C.; Liu, F.; He, Y. Identification of coffee bean varieties using hyperspectral imaging: Influence of preprocessing methods and pixel-wise spectra analysis. Sci. Rep. UK 2018, 8, 2166. [Google Scholar] [CrossRef] [PubMed]
  26. Luts, J.; Ojeda, F.; Plas, R.V.D.; DeMoor, B.; VanHuffel, S.; Suykens, J.A.K. A tutorial on support vector machine-based methods for classification problems in chemometrics. Anal. Chim. Acta 2010, 665, 129–145. [Google Scholar] [CrossRef] [PubMed]
  27. Brereton, R.G.; Lloyd, G.R. Partial least squares discriminant analysis: Taking the magic away. J. Chemometr. 2014, 28, 213–225. [Google Scholar] [CrossRef]
  28. Yan, L.; Pang, L.; Wang, H.; Xiao, J. Recognition of different Longjing fresh tea varieties using hyperspectral imaging technology and chemometrics. J. Food Process Eng. e13378. Available online: https://0-onlinelibrary-wiley-com.brum.beds.ac.uk/doi/full/10.1111/jfpe.13378 (accessed on 8 February 2020).
  29. Ge, X.; Sun, J.; Lu, B.; Chen, Q.S.; Xun, W.; Jin, Y.T. Classification of oolong tea varieties based on hyperspectral imaging technology and BOSS-LightGBM model. J. Food Process Eng. 2019, 42, e13289. [Google Scholar] [CrossRef]
  30. Sun, J.; Tang, K.; Wu, X.H.; Dai, C.X.; Chen, Y.; Shen, J.F. Nondestructive identification of green tea varieties based on hyperspectral imaging technology. J. Food Process Eng. 2018, 41, e12800. [Google Scholar] [CrossRef]
  31. Jia, W.S.; Ma, Z.H.; Lan, Y.B.; Wu, W.F.; Wang, D.; Wang, J.H. An Identification of the Growing Area of Longjing Tea Based on the Fisher’s Discriminant Analysis with the Combination of Principal Components Analysis. Intell Autom Soft Co. 2013, 19, 545–553. [Google Scholar] [CrossRef]
  32. Liu, P.; Wen, Y.P.; Huang, J.S.; Xiong, A.H.; Wen, J.P.; Li, H.; Huang, Y.F.; Zhu, X.Y.; Ai, S.R.; Wu, R.M. A novel strategy of near-infrared spectroscopy dimensionality reduction for discrimination of grades, varieties and origins of green tea. Vib. Spectrosc. 2019, 105, 102984. [Google Scholar] [CrossRef]
  33. Zhang, C.; Wang, Q.N.; Liu, F.; He, Y.; Xiao, Y.Z. Rapid and non-destructive measurement of spinach pigments content during storage using hyperspectral imaging with chemometrics. Measurement 2017, 97, 149–155. [Google Scholar] [CrossRef]
  34. Zhu, S.S.; Zhou, L.; Gao, P.; Bao, Y.D.; He, Y.; Feng, L. Near-infrared hyperspectral imaging combined with deep learning to identify cotton seed varieties. Molecules 2019, 24, 3268. [Google Scholar] [CrossRef] [PubMed] [Green Version]
Figure 1. Red, green, and blue (RGB) images of Longjing tea from different geographical origins for hyperspectral image acquisition: (a) Bashan Village; (b) TongWu Village; (c) Meijiawu Village; (d) Tiedian Village; (e) Xinxin Village, and (f) Hujialing Village.
Applsci 10 01173 g001
Figure 2. Average spectra with standard deviation of each wavelength of tea samples from six different geographical origins at two different spectral ranges: (a) spectral range 1: 502–947 nm (the standard deviations of 533, 543, 585, 616, 634, and 672 nm are presented.) and (b) spectral range 2: 975–1646 nm (the standard deviations of 1200, 1500, 1106, 1308, and 1615 nm are presented).
Applsci 10 01173 g002aApplsci 10 01173 g002b
Figure 3. Prediction maps obtained from the hyperspectral images of Longjing tea from six different geographical origins at the two different spectral ranges. (a) spectral range 1: 502–947 nm; (b) spectral range 2: 975–1646 nm. (geographical origins from left to right: Bashan Village, TongWu Village, Meijiawu Village, Tiedian Village, Xinxin Village, and Hujialing Village).
Applsci 10 01173 g003
Table 1. The number of samples in the calibration set and the prediction set of Longjing tea from different geographical origins. VNIR: visible/near-infrared spectroscopy; NIR: near-infrared spectroscopy.
Geographical OriginVNIRNIR
TotalCalibrationPredictionTotalCalibrationPrediction
Bashan Village10748062681160870290
TongWu Village781620161886665221
Meijiawu Village845634211785589196
Tiedian Village9266952311037778259
Xinxin Village11718782931036777259
Hujialing Village1409105735214891117372
Table 2. Confusion matrix of support vector machine (SVM) models using full spectra for spectral range 1 (502–947 nm) and spectral range 2 (975–1646 nm).
Spectral Range aCalibration SetPrediction Set
1 c23456Acc. b (%)123456Acc. (%)
1176421084994.7924020032389.55
225585133394.359147230091.30
31262560098.582420121195.26
467165820394.687302155193.07
573398045291.57733102422882.59
694045398793.3843115229182.67
total 94.31 88.13
21829190521595.29213550721373.45
21759501393189.4741910811786.43
30158044098.47061641610083.67
421677464395.892832433093.82
5112815738394.9831525232289.58
6519012109097.584900235795.97
total 95.45 87.66
a: the spectral ranges used for analysis, spectral range 1: 502–947 nm; spectral range 2: 975–1646 nm. b: Acc. represents accuracy. c: 1, 2, 3, 4, 5 and corresponds to Bashan Village, TongWu Village, Meijiawu Village, Tiedian Village, Xinxin Village, and Hujialing Village.
Table 3. Confusion matrix of partial least squares discriminant analysis (PLS-DA) models using full spectra for spectral rage 1 and spectral range 2.
Spectral Range aCalibration SetPrediction Set
1 c23456Acc. b (%)123456Acc. (%)
1176429103994.7923627010488.06
219590052495.164157000097.52
30361956197.631120621097.63
434166961296.261002231696.54
5631177708187.7061082393981.57
61212028694589.40400012222664.20
total 92.90 84.89
2185812000098.6226723000092.07
2112550120082.7030188210085.07
302576010197.790118357098.47
411875261096.650012562098.84
500212761911079.6701282064279.54
6000310110498.840000336999.19
total 92.97 91.98
a: the spectral ranges used for analysis, spectral range 1: 502–947 nm; spectral range 2: 975–1646 nm. b: Acc. represents accuracy. c: 1, 2, 3, 4, 5 and corresponds to Bashan Village, TongWu Village, Meijiawu Village, Tiedian Village, Xinxin Village, and Hujialing Village.

