Low-Cost Biochar Adsorbents for Water Purification Including Microplastics Removal


1
VTT Technical Research Centre of Finland Ltd., P.O. Box 1000, 02044 Espoo, Finland
2
Faculty of Biological and Environmental Sciences, University of Helsinki, Niemenkatu 73, 15140 Lahti, Finland
3
Research Unit of Sustainable Chemistry, University of Oulu, P.O. Box 3000, 90014 Oulu, Finland
*
Author to whom correspondence should be addressed.
Appl. Sci. 2020, 10(3), 788; https://0-doi-org.brum.beds.ac.uk/10.3390/app10030788
Submission received: 19 December 2019
/
Revised: 14 January 2020
/
Accepted: 20 January 2020
/
Published: 22 January 2020
(This article belongs to the Special Issue New Carbon Materials from Biomass and Their Applications)
Abstract
:The applicability of steam activated pine and spruce bark biochar for storm water and wastewater purification has been investigated. Biochar samples produced from the bark of scots pine (Pinus sylvestrus) and spruce (Picea spp.) by conventional slow pyrolysis at 475 °C were steam activated at 800 °C. Steam activation was selected as a relatively inexpensive method for creating porous biochar adsorbents from the bark-containing sidestreams of the wood refining industry. A suite of standard analytical procedures were carried out to quantify the performance of the activated biochar in removing both cations and residual organics from aqueous media. Phenol and microplastics retention and cation exchange capacity were employed as key test parameters. Despite relatively low surface areas (200–600 m2/g), the steam-activated biochars were highly suitable adsorbents for the chemical species tested as well as for microplastics removal. The results indicate that ultra-high porosities are not necessary for satisfactory water purification, supporting the economic feasibility of bio-based adsorbent production.
1. Introduction
As purification standards for residential and industrial wastewaters become increasingly restrictive and the negative environmental consequences of untreated urban stormwater runoff discharge to surface waterbodies become more apparent, there is an increasing need for more efficient adsorbents. Unprocessed stormwaters are typically captured and transferred directly to the environment via separate sewer systems, or periodically processed by municipal waste water treatment plants in large volumes where sewers are combined, resulting in capacity pressures on wastewater treatment infrastructure and decreased efficiency of resource recovery processes (e.g., [1]). Stormwater runoff contains organic residues in addition to micro- and nanoplastics, e.g., from vehicle tires [2]. Biochars and activated biochars produced from a variety of forestry and agricultural sidestreams have been extensively tested for both organic and inorganic contaminant sorption (see, e.g., [3]). Their suitability for water purification is well established but the primary focus of existing studies has been the development of high surface area carbons, with limited consideration of the economic feasibility of these carbons for various intended applications. Therefore, there is a need to establish the minimum requirements for bio-based adsorbents with respect to surface area, porosity, and surface chemistry for efficient water purification. For profitable production of a bio-adsorbent, both the raw material and the treatment process need to be low-cost.
Chemical activation can be used to produce ultrahigh surface areas and porosities because of extensive microporosity development. High micropore volume promotes adsorption of particularly small-sized metals and molecules. Still, a broader pore structure plays a vital role in adsorption processes. The small micropores that are accessible to nitrogen molecules in surface area measurements may not be accessible for contaminant molecules in solution. Meso- and macroscale pores are essential as vectors to areas deeper within the biochar particle, and their respective quantities are primarily dependent on the raw materials used in biochar production. In our previous study [4], 3D-modeling of pine bark biochar and phosphoric acid activated pine bark revealed that chemical activation did not affect the micrometer scale porosity of the activated biochar. Also significant are the elevated costs arising from the use of chemicals and intensive washing procedures [5]. Producing chemically activated carbons for wastewater treatment may be uneconomical because of the large quantities of chemicals needed and reuse of the used activated carbons may not be possible. The main applications for chemically activated carbons should be in higher value products such as supercapacitors, where the surface area and specific pore size distribution are critical parameters for their functionality [6,7].
Thermal treatment of biomass can be divided into three different paths: torrefaction, gasification, and pyrolysis [8]. The most important differences are the residence times and temperature gradients used, particle size of feedstock materials, and the distribution of products into gas, pyrolytic liquids, and solid materials. The pyrolysis of biomass can further be divided into fast, medium, and slow pyrolysis; of these the fast and slow pyrolysis are the ones mostly used. Fast pyrolysis with a residence time of seconds is used for the production of liquids whereas slow pyrolysis with residence times of minutes to hours is used to produce chars. Characteristics of the individual processes are summarized in Table 1.
The chars obtained from slow pyrolysis can undergo further physical or chemical treatment to generate activated carbons. Physical activations using CO2 or steam eliminate the need for chemicals and subsequent washing procedures. The use of steam minimizes the activation chemical costs and promotes the formation of larger pores in the activated carbon (AC), although the resulting porosity is also dependent upon characteristics of the feedstock raw material [9]. The adsorption efficiency is related to the surface functionalities of the adsorbent carbon where, for example, a relatively large number of oxygen groups, enhance adsorption of cationic contaminants. The total number of surface functional groups in physically activated carbons are usually less than for chemically activated carbons because of the higher temperatures used. Critical views for their suitability for water treatment have been presented elsewhere [5]. Activated biochars possessing sufficient surface area and suitable porosity for tertiary wastewater purification that can be produced economically are of widespread interest [3,10,11].
The availability of bio-based feedstock is an essential variable for biochar and activated carbon (AC) production. Large quantities of lignocellulose sidestreams suitable for biochar production, such as sawdust and bark residues, are generated by the forest industry. The forest industry has traditionally used these sidestreams for energy production, but this use is increasingly limited because of the growing need to decrease carbon dioxide (CO2) emissions from industries. There is a need to find alternative uses for these sidestreams, of which biochar is one possibility. Bio-based carbons are creating a new market segment in water treatment and metallurgy based on their potentially low cost compared with traditional fossil carbons subdued to emission trade. Both applications present “new” industrial utilizations with positive export potential for countries with significant forest products industries, both domestically and internationally.
Based on the earlier reports on economically feasible raw materials for biochar (e.g., [12,13]), a range of different wood-based wastes and sidestreams are suitable for biochar production. The steam activation method has been used to produce ACs from various biomasses, such as white spruce sawdust, canola, and wheat straw [14], switchgrass, hard and soft wood [15], oil palm stones [16], oil palm shells [17], and seed cakes [18]. Despite the large volumes generated by the forest products industry, tree bark has not been extensively tested for production of steam activated carbons. Mixed soft wood bark residue has been successfully converted into AC in a small-scale thermogravimetric experiment [19], producing surface areas between 455 and 613 m2/g at different temperatures (600–985 °C). Poplar wood bark biochar has also been used for steam activation with similar surface areas of 547 and 555 m2/g at 700 and 800 °C, respectively [20].
In the present study, we have investigated activated biochar production from two forest industry sidestreams, pine and spruce bark. The suitability of these steam-activated biochars for application to treatment of urban runoff and wastewater purification were investigated by examining the attenuation of selected metals, microplastics, and organic contaminants. Microplastics in stormwaters originate from microscopic plastic spheres or particles that are intentionally added to a product, or from disintegrating plastic and rubber materials. One of the major sources of microplastics is created by traffic through the abrasion of vehicle tires, brakes, and the road surface itself [2]. Vehicle-generated plastic particles can be mobilized by wind and passing traffic, becoming deposited in surface waters, soil, or sediment. Deposition of a large quantity of plastic particles to surface waters can cause significant damage to the aquatic environment and organisms [21,22,23,24]. Recent studies of microplastics removal have focused on agglomerate formation [22,25] or activated sludge [26]. Biochar and activated biochar also have the potential to retain microplastics. Microplastic particles can be immobilized between biochar particles or, in the case of nano-and micrometer-scale particles, retained within the pore structure. The present study examined microplastics removal by steam-activated biochar generated from pine and spruce bark.
The particular focus of the study was on the characteristics of the biochar products, e.g., the particle size and chemical composition, as forest residues may be comprised of highly inhomogeneous raw materials. The materials and methods section is followed by a detailed presentation and discussion of the results obtained that may affect the economics of biochar and AC production from the forest residues examined herein. The results indicate that the selected low-cost biomasses were suitable as adsorbents for all tested contaminants, and that sufficient adsorption capacities do not necessitate ultrahigh surface areas.
2. Materials and Methods
The selected methods were used for testing the differences in the produced biochars and AC after the slow pyrolysis or activation treatments. Elemental composition, surface area, and porosity were used to detect the differences in the chemical and physical properties. Potential material applicability was further examined in a series of laboratory trials, including phenol adsorption as an indicator of organic contaminant removal and cation exchange capacity (CEC) determination to estimate inorganic contaminate removal capacity. The microplastics (MP) removal capacity of produced biochars and AC was tested in a column experiment using various sizes and shapes of MP particles.
2.1. Raw Materials
Materials used in the experiments were scots pine (Pinus sylvestrus) bark and spruce (Picea spp.) bark. The pine bark biomass was acquired from Sweden and the spruce bark biomass from a Finnish sawmill. The samples contained small quantities of stem wood, which were not removed prior to carbonization. The bark samples were oven-dried at <70 °C to approximately 10% moisture content.
2.2. Slow Pyrolysis and Activation Treatments
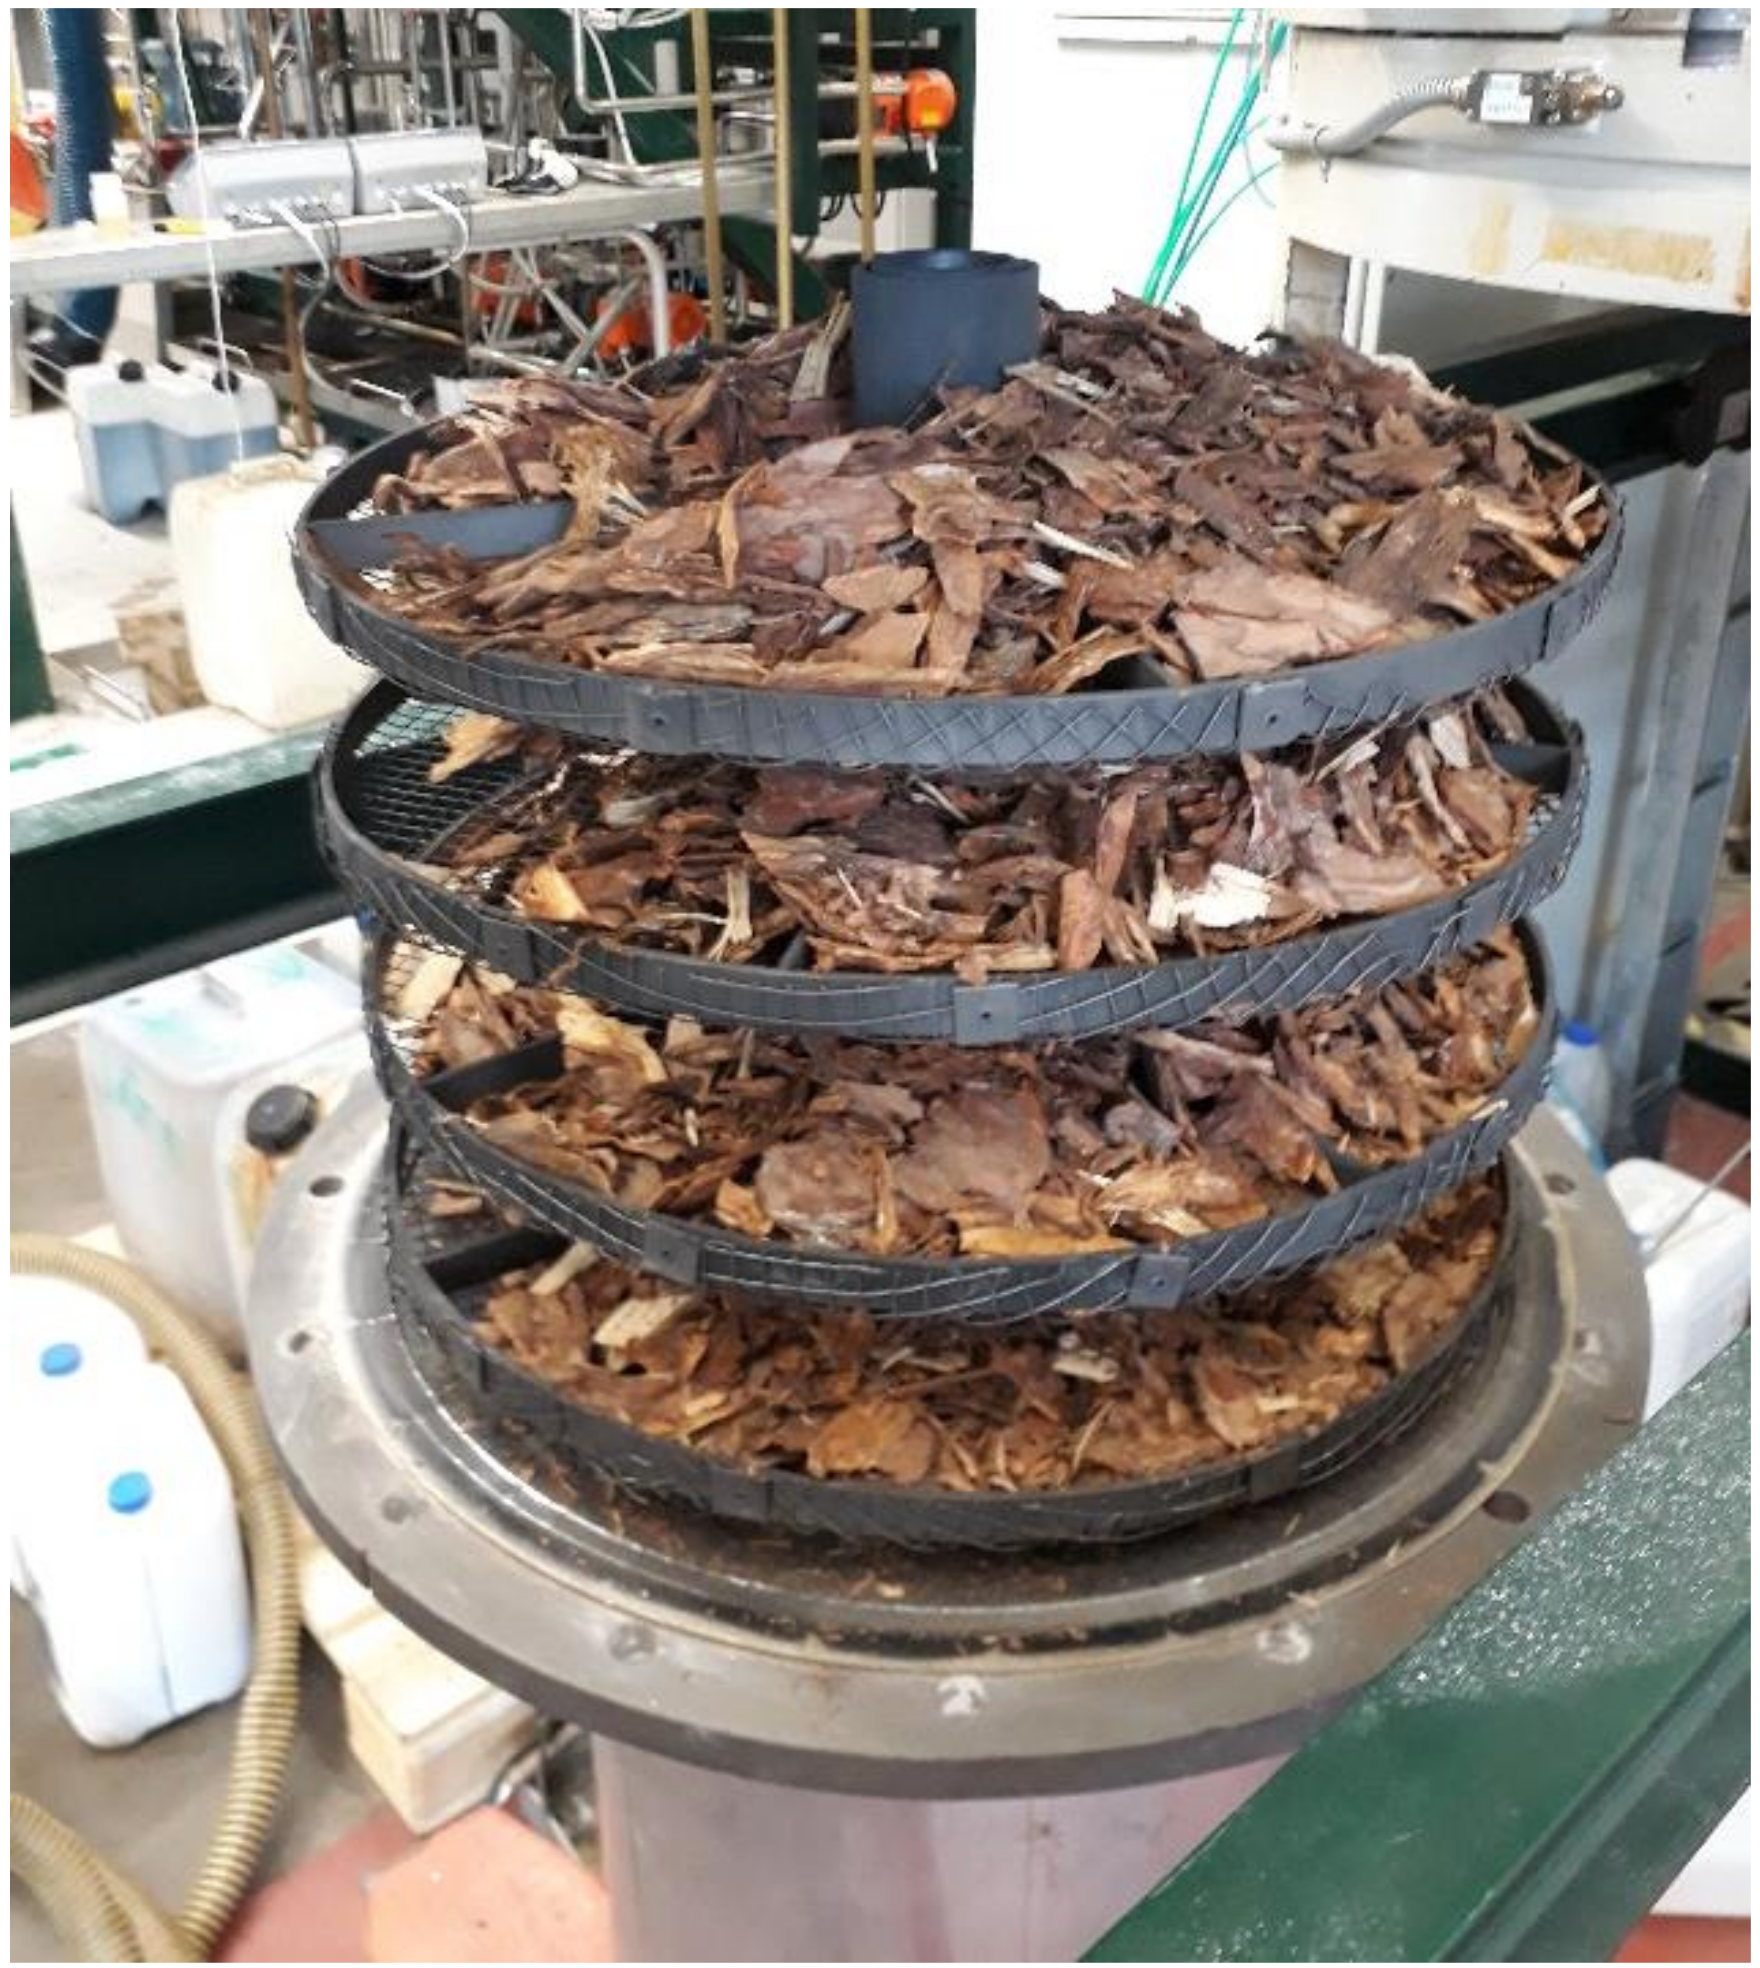
Oven-dried bark samples were carbonized using slow pyrolysis in a 115-L reactor. The samples were distributed in the reactor on four levels of steel grids (Figure 1). The carbonization time and temperature were three hours and 475 °C, respectively.
The produced biochars were steam activated using the same reactor as for slow pyrolysis. The biochars were weighed on steel vessels, which were placed on the steel grids. The particle size effect on activation results was studied via separation of the biochar particles into two different fractions. The larger particle size fraction consisted of biochar chunks up 10 cm in diameter formed directly from the biomass. The smaller particle size consisted of approximately 50% <5 mm particles and 50% <2 cm biochar particles, determined using standard sieves. The steam activations were performed using low (1.1 L/min) and high (5 L/min) N2 gas flows with different water flow rates (Table 2) such that the volumetric quantity of steam was approximately 30–40% of the total gas volume injected in the oven (steam + nitrogen). The 30% steam activations were performed using low and high gas rates while in the 40% steam treatment only high N2 flow was used. The steam was generated from deionized water and the water was pumped using a peristaltic pump. The water line was connected to the N2 gas line, which circulated the heated reactor evaporating the water before entering the oven. The activation time was 3.5 h at 800 °C.
2.3. Characterization Methods
All biomass and the produced biochars and ACs were analyzed for their elemental composition (C, H, N, S, and O) using a FLASH 2000 series analyzer (Thermo Scientific, Waltham, MA, USA). The ash content was determined gravimetrically after burning the samples at 550 °C for 23 h. The BET surface area and pore size distribution were determined via N2 adsorption using a Micromeritics ASAP 2020 analyzer (Norcross, GA, USA). Prior to the surface area measurements, the samples were degassed at 2 µm Hg and 140 °C for 3 h to clean the surfaces. The N2 adsorption tests were performed at isothermal conditions achieved by immersion of the sample tubes in liquid nitrogen. Nitrogen (N2) was added in small doses, and the resulting isotherms were used for further calculations. The specific surface areas (SSA) we calculated using the BET [27] algorithm and pore size distributions were calculated using the density functional theory (DFT) [28]. The system applied facilitated measurement of pore sizes in the range of 1.5–300 nm in diameter even where smaller pores likely contribute to the adsorption at low pressure.
2.4. Adsorption Tests
The biochars and selected AC samples were tested for their organic contaminant adsorption capacity using phenol. Sub-samples of 0.1 g biochar or AC were agitated in 15 mL of phenol solution (100, 200, 500, 1000, and 2000 mg/L) for 24 h, after which the suspensions were filtered to 0.45 µm and analyzed spectrophotometrically (Shimadzu UV-1800) at 271 nm. The ACs were tested using two replicate samples and the calculated relative standard deviations (SD/mean*100, RSD) ranged from 0.1 to 18.1%. The highest RSDs (>10%) were found with the low 100 and 200 mg/L concentrations. The biochars were tested as single determinations.
The cation exchange capacity (CEC) and the exchangeable cations were determined for selected activated biochars as described in [29]. In addition, the concentration of released phosphorus was measured. Briefly, AC cations were exchanged for NH4+ by an overnight extraction (1:10 w/v ratio) using 0.5 M NH4OAc (pH 7). After extraction, the biochars were centrifuged and resuspended twice with equal amounts of 0.5 M NH4OAc (pH 7) to ensure saturation of exchange sites with NH4+. The three supernatants were combined and analyzed. Excess NH4+ was rinsed using deionized water. The adsorbed NH4+ was then exchanged by an overnight extraction using 1 M KCl. Concentrations of Al, Ca, Fe, K, Mg, Mn, Na, and P were determined in NH4OAC extracts and the CEC from the quantity of exchangeable NH4+ in the KCl extracts. The standard deviations of the CEC measurements ranged from 0.3 to 1.1 mmol/kg.
For the microplastics experiments, three activated biochars with increasing surface areas and different pore size distributions were selected. A glass column was filled with 20 g of the respective biochar material. The filled column was washed with 5 L of tap water to remove fine biochar particles. Microplastic particles of various sizes and shapes were simulated using 2 g of spherical polyethylene (PE) microbeads (10 µm), 2 g of cylindrical, smooth PE pieces (2–3 mm) as well as 2 g fleece shirt fibers. Each column was eluated with 30 fractions of 50-mL tap water each. The fractions were filtered using pre-weighed glass fiber filters that were weighted again after drying for 3 d in a heated 25 °C closed cabinet. Each experiment was performed in triplicate. The biochar material was recycled by intensive washing with tap water and ultrasonication prior to the next use. The MP material recovered was assessed on glass fiber filters using a microscope (Pflugmacher et al. in prep).
3. Results
3.1. Yields, Surface Areas, and Porosities
The produced AC were characterized with respect to yield, elemental composition, surface area, and porosity (Table 3 and Table 4). The surface area of pine bark biochar was most affected by increasing the gas flow rate, whereas greater amounts of steam yielded improved surface area results for spruce biochar. Raising the steam proportion to 40% did not induce higher surface area for pine bark biochar despite the larger activation burn-off. Mesoporosity development was greater for both bark biochars using the higher gas flow rate.
The surface areas of the activated biochars increased as a function of the burn-off, however the results were also influenced by pore formation. Large particles exposed to 30% steam, for example, had lower burn-off than small particle size AC (24.5% vs. 28.7%) but higher surface area because of the relatively greater quantity of micropores. The particle size effect was more substantial with pine bark, but the smaller particle size of both bark biochars yielded a slightly greater surface area, as the smaller particle size provides more reaction surface for the steam.
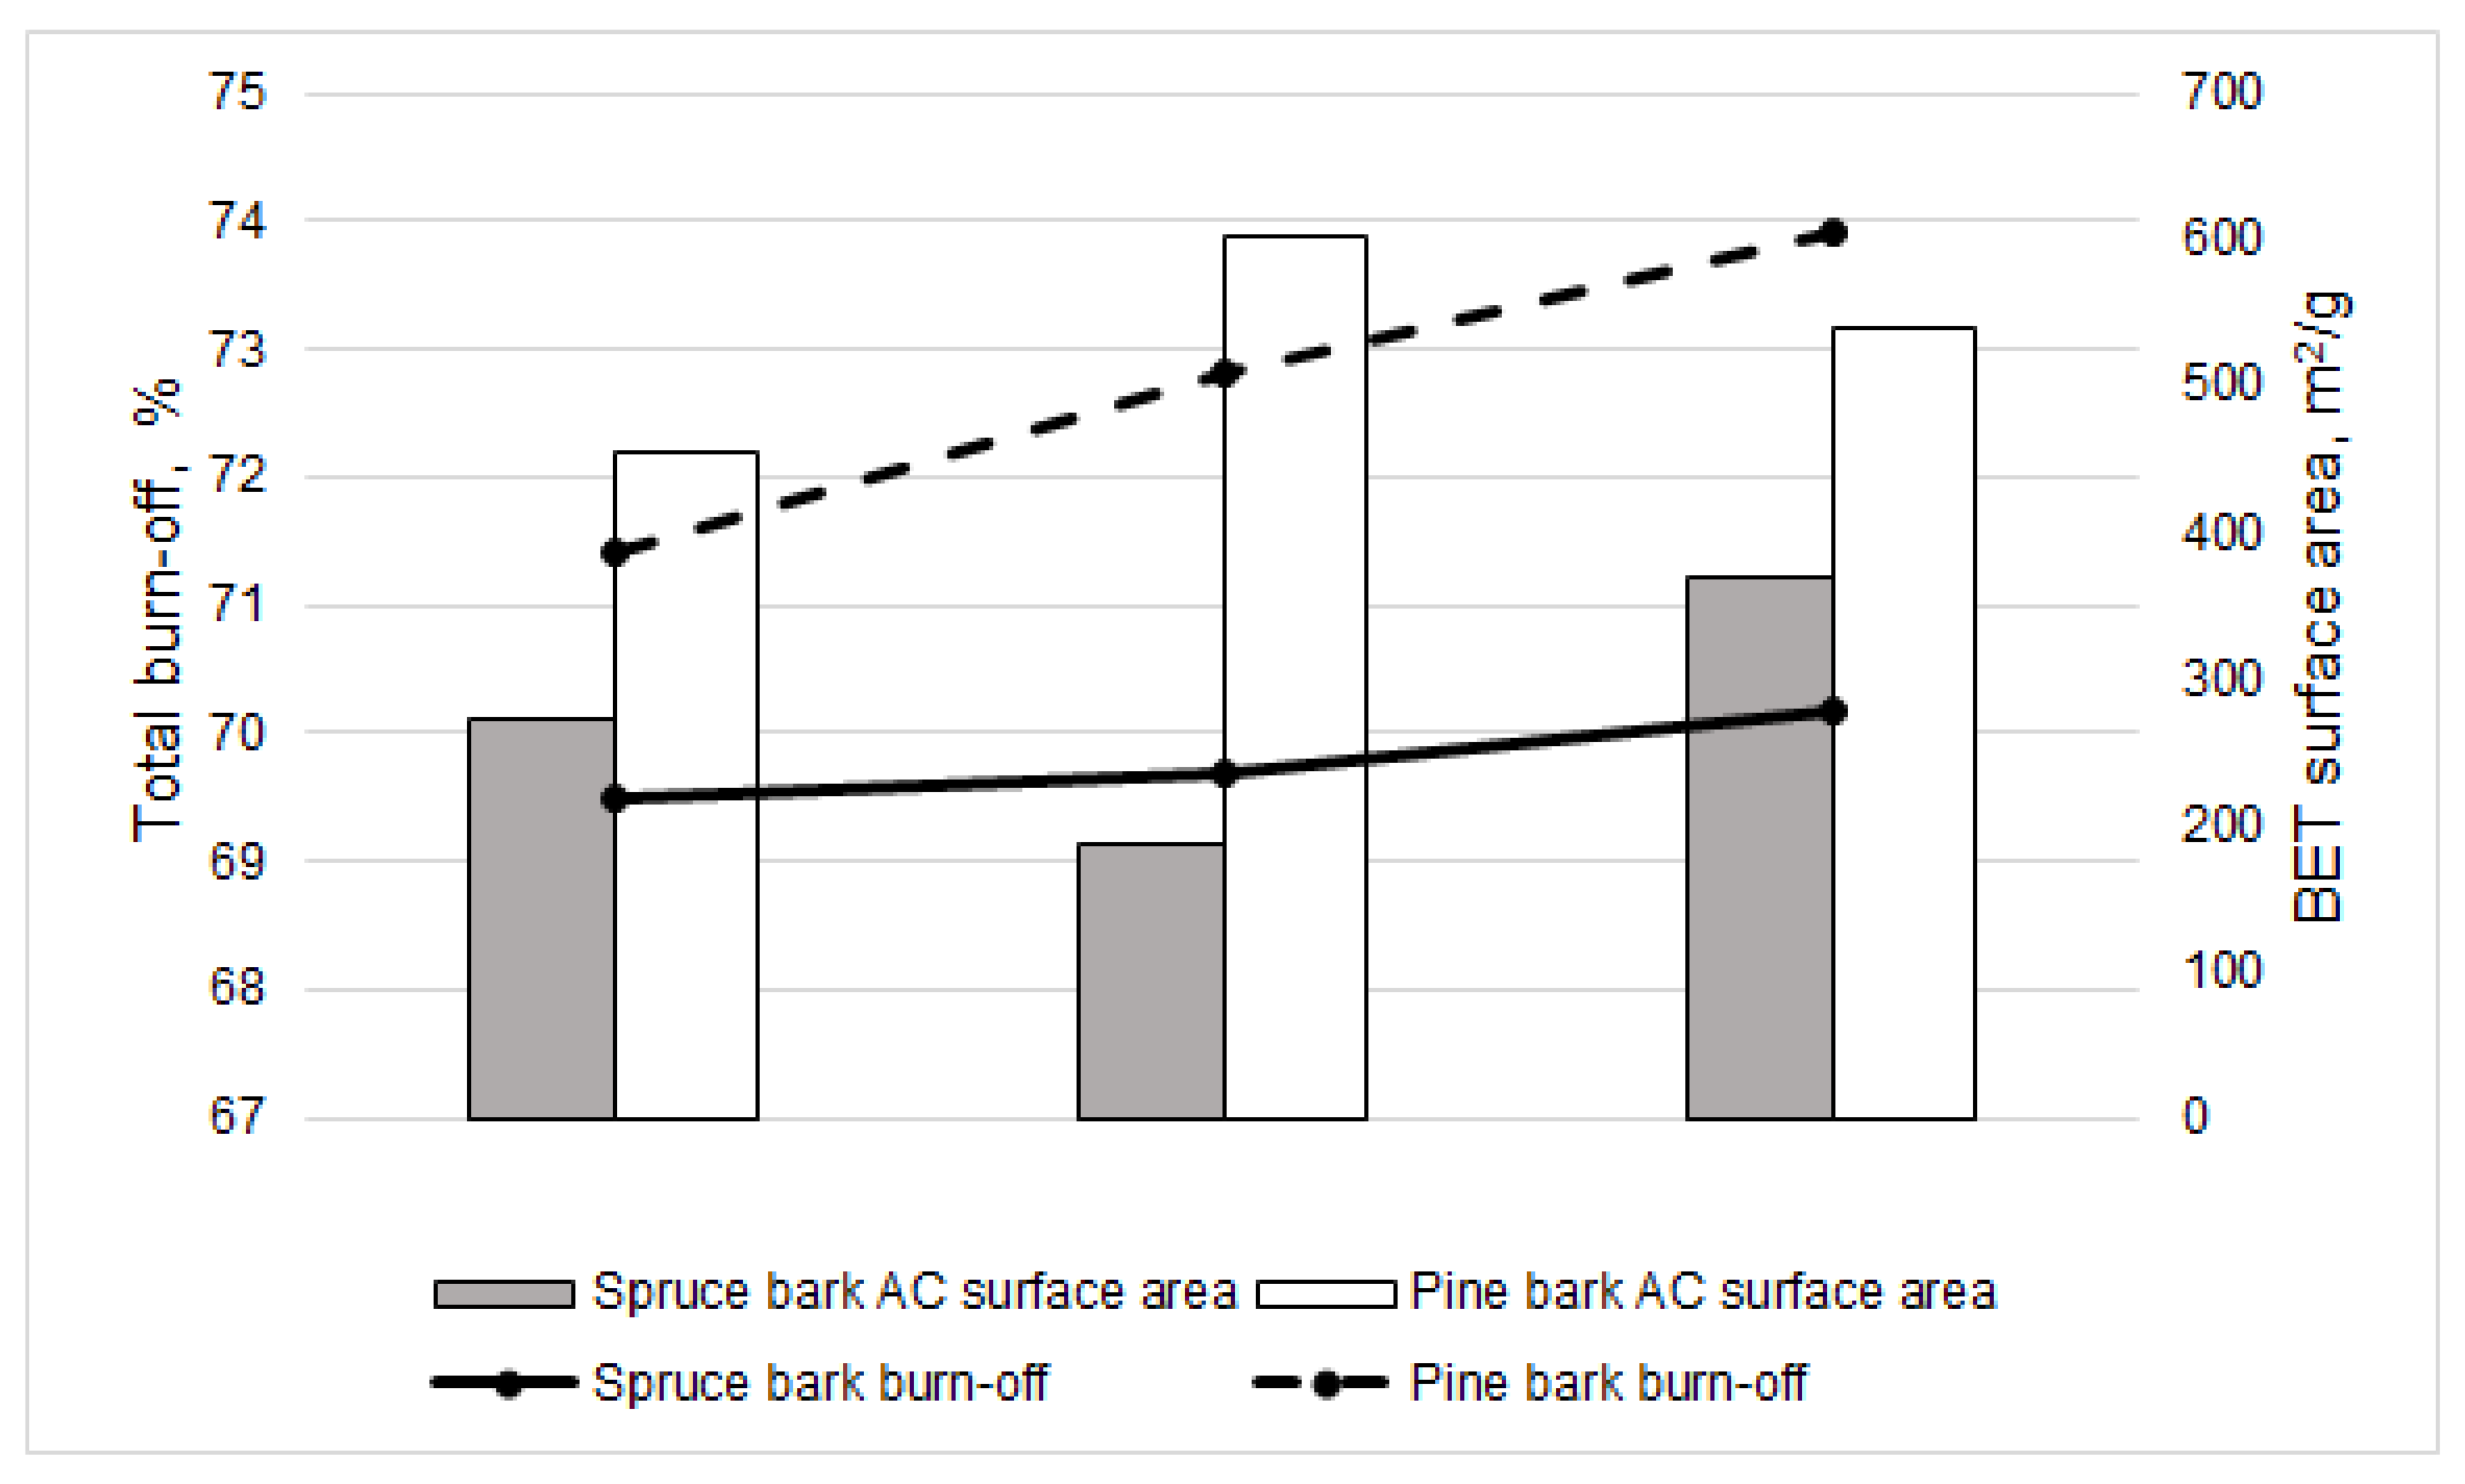
The total burn-off of pine bark biochar because of activation increased in a more linear fashion than that observed for spruce bark biochar (Figure 2). The surface areas of the spruce bark ACs were considerably lesser than those of pine bark ACs. This result may have been due to the high quantity of ash in the spruce bark (Table 4), which can cause pore blockage. The pore size distributions of pine and spruce bark ACs remained similar, consisting of primarily micropores. Increasing the activation time and temperature may have resulted in an increase in the quantity of larger pores.
Some of the observed differences between pine and spruce bark biochars and ACs may be an artefact of the non-homogenous nature of the biomasses. The bark residues may contain some amounts of stem wood, for example, that has a different pore structure than the bark.
3.2. Elemental Composition and Ash
Both raw materials were analyzed for their elemental and ash composition throughout the treatment chain (Table 4). In the untreated biomass, pine bark had higher carbon content than spruce, whereas nitrogen and oxygen were higher in the spruce bark. No differences in hydrogen content were observed and neither bark biomass contained sulphur.
Comparison of the elemental compositions of biochars and ACs revealed that spruce biochars contained a lesser quantity of carbon compared with the pine biochars. This result may indicate insufficient activation time for spruce biochar, resulting in incomplete carbonization and the inferior surface areas as compared with the pine biochar. Spruce bark ACs contained relatively greater quantities of oxygen and nitrogen than the pine bark ACs. The heteroatom contents of biochars are also biomass dependent. The ash content of spruce biochars and ACs were much greater than ash contents of pine bark carbons. The biochars were analyzed using X-ray fluorescence (XRF) for selected alkali metals (Mg, Ca, K), to determine the cause of the high ash content of the spruce biochar (data not shown). The XRF results showed that spruce biochar contained approximately 16 g/kg of calcium compared to 9 g/kg in the pine biochar. There were no other readily apparent differences between the alkali metal concentrations of the two biochars. The particle size effect was primarily observed in the carbon content, which was higher for the biochars of larger particle size.
3.3. Sorption Experiments
3.3.1. Removal of Organic Contaminants
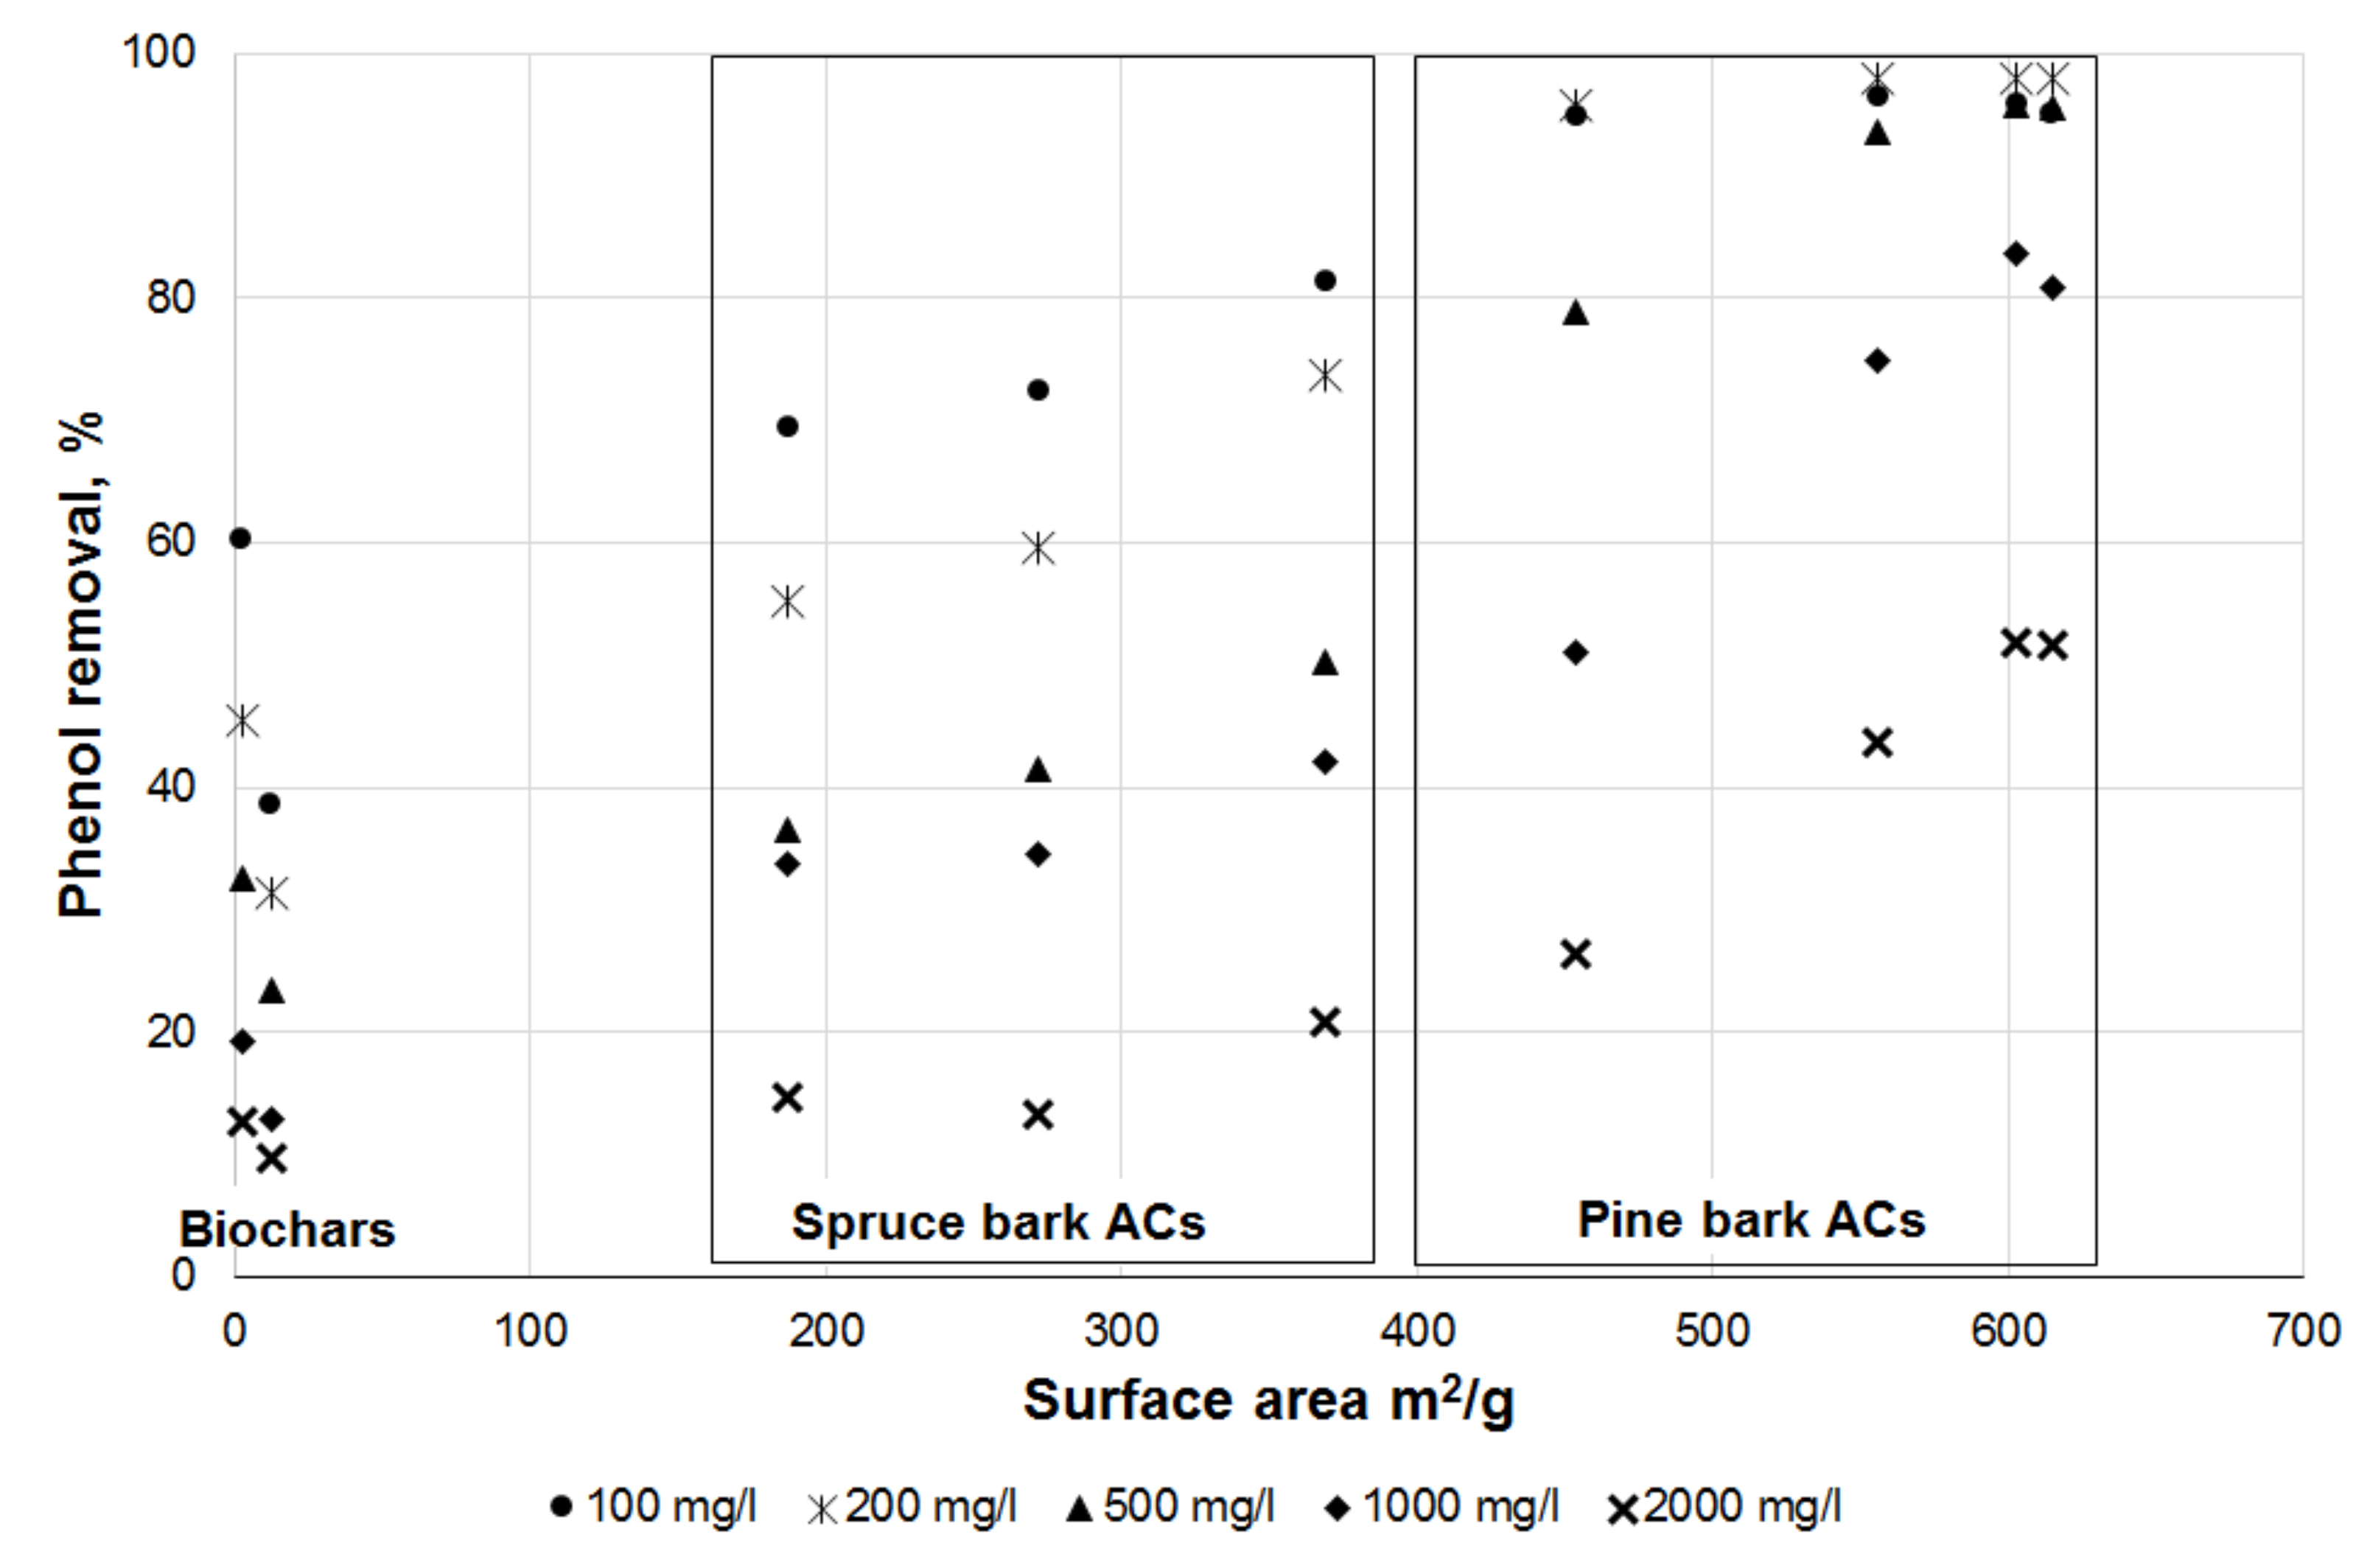
The capacity of the activated biochars for attenuation of organic contaminants was examined using phenol. The experiments were conducted using biochars and small particle size ACs as there were no distinct differences between the particle sizes. The adsorption capacity increased with both raw materials as a function of surface area (Figure 3). As the material surface area increased to ca. 350 m2/g the measured adsorption capacity increased in a more linear fashion. Phenol sorption by the biochars with low surface area was nearly equal to that of the higher surface area spruce bark ACs.
The higher surface area of pine bark ACs was associated with greater capacity for phenol removal from solution relative to the spruce bark AC. Nearly 100% phenol attenuation was observed at low solution concentrations (100 and 200 mg/L) and material surface areas ≥540 m2/g. Phenol was efficiently removed from solutions of concentration 500 mg/L. The quantity of adsorbed phenol increased with solution concentration for both bark ACs, and the maximum removal using 2000 mg/L phenol concentration was approximately 50% for pine bark. The most efficient spruce bark AC removed about 20% of the phenol at the highest concentration tested (2000 mg/L) and 80% at the lowest concentration tested (100 mg/L).
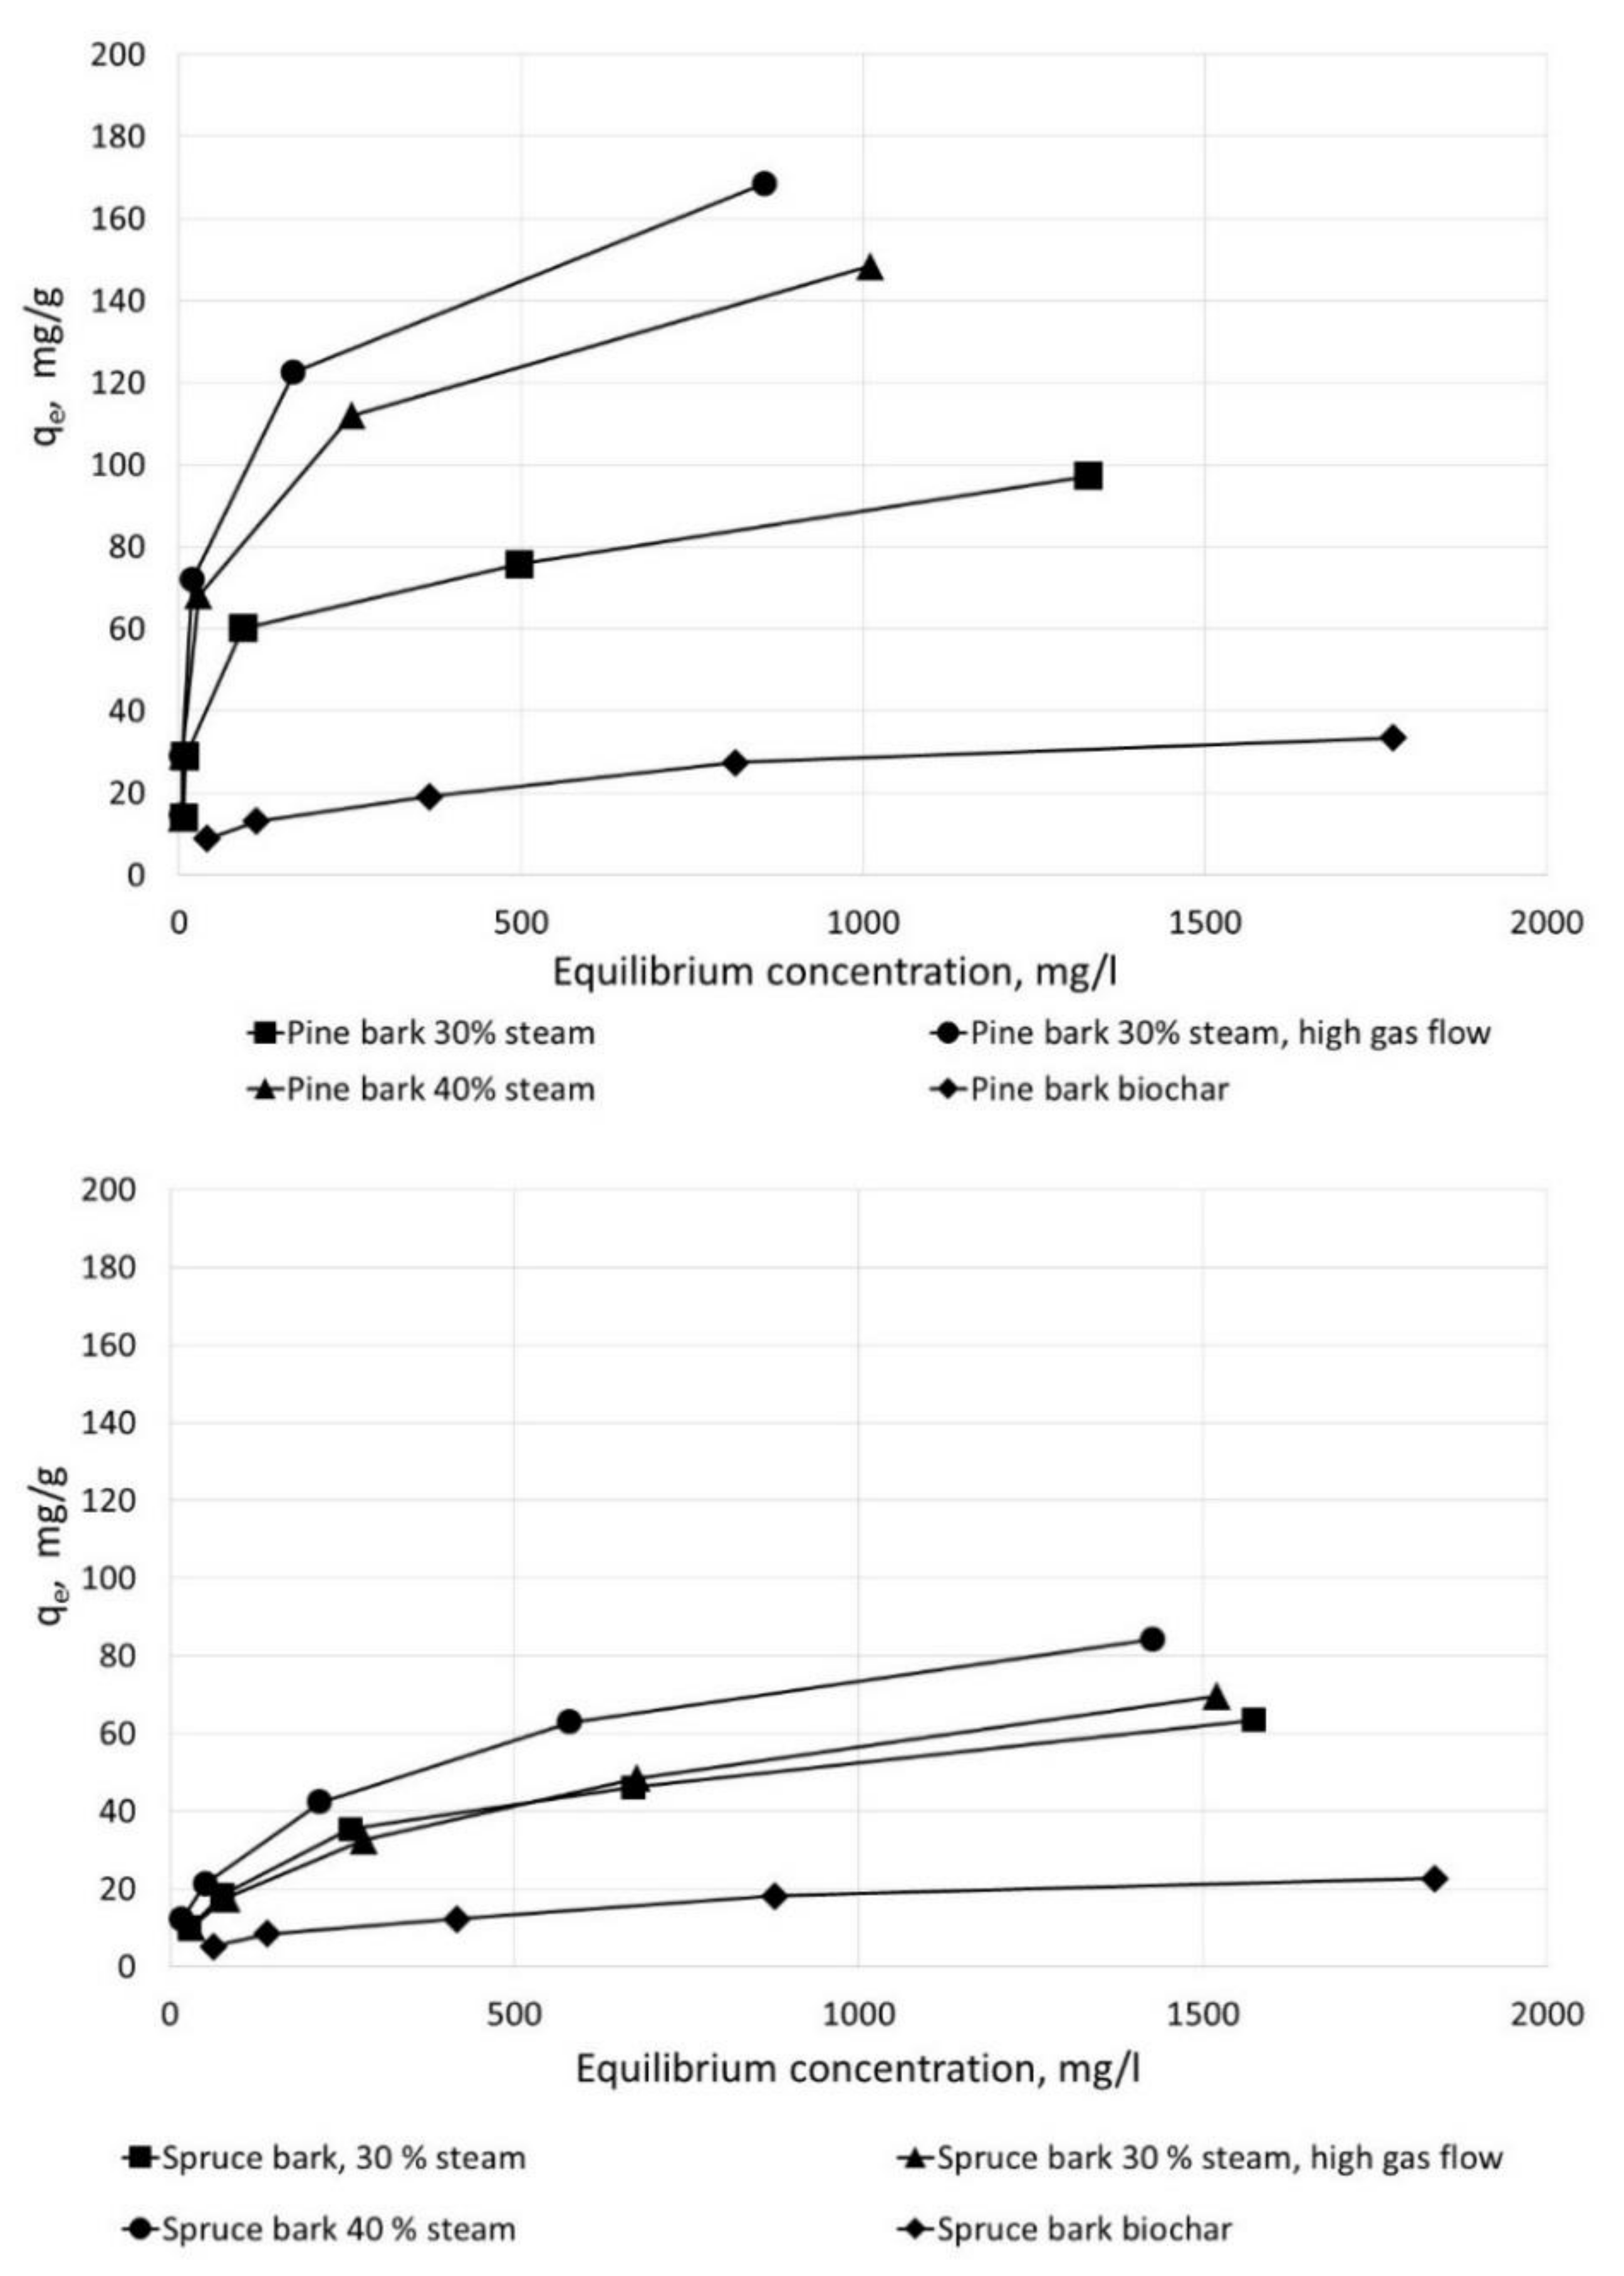
The maximum phenol adsorption capacity obtained at the highest initial solution concentration was observed for pine bark activated with 30% steam and high gas flow, which also had the greatest surface area of the tested carbons (Figure 4, Table 5). The isothermal curves in Figure 4 show increasing adsorption with increasing phenol concentration. Pine bark ACs were efficient adsorbents at all phenol concentrations tested. Phenol adsorption with increasing aqueous concentration did not increase as sharply for spruce bark ACs as for pine bark ACs. The sharp rise of the pine bark curves (Figure 4) indicates a lesser quantity of competing ions for the adsorption sites [30], which is supported by the lower ash concentration of the pine bark ACs. Lower ash content delivers fewer dissolving (alkaline) ions to the solution.
3.3.2. Cation Exchange Capacity (CEC)
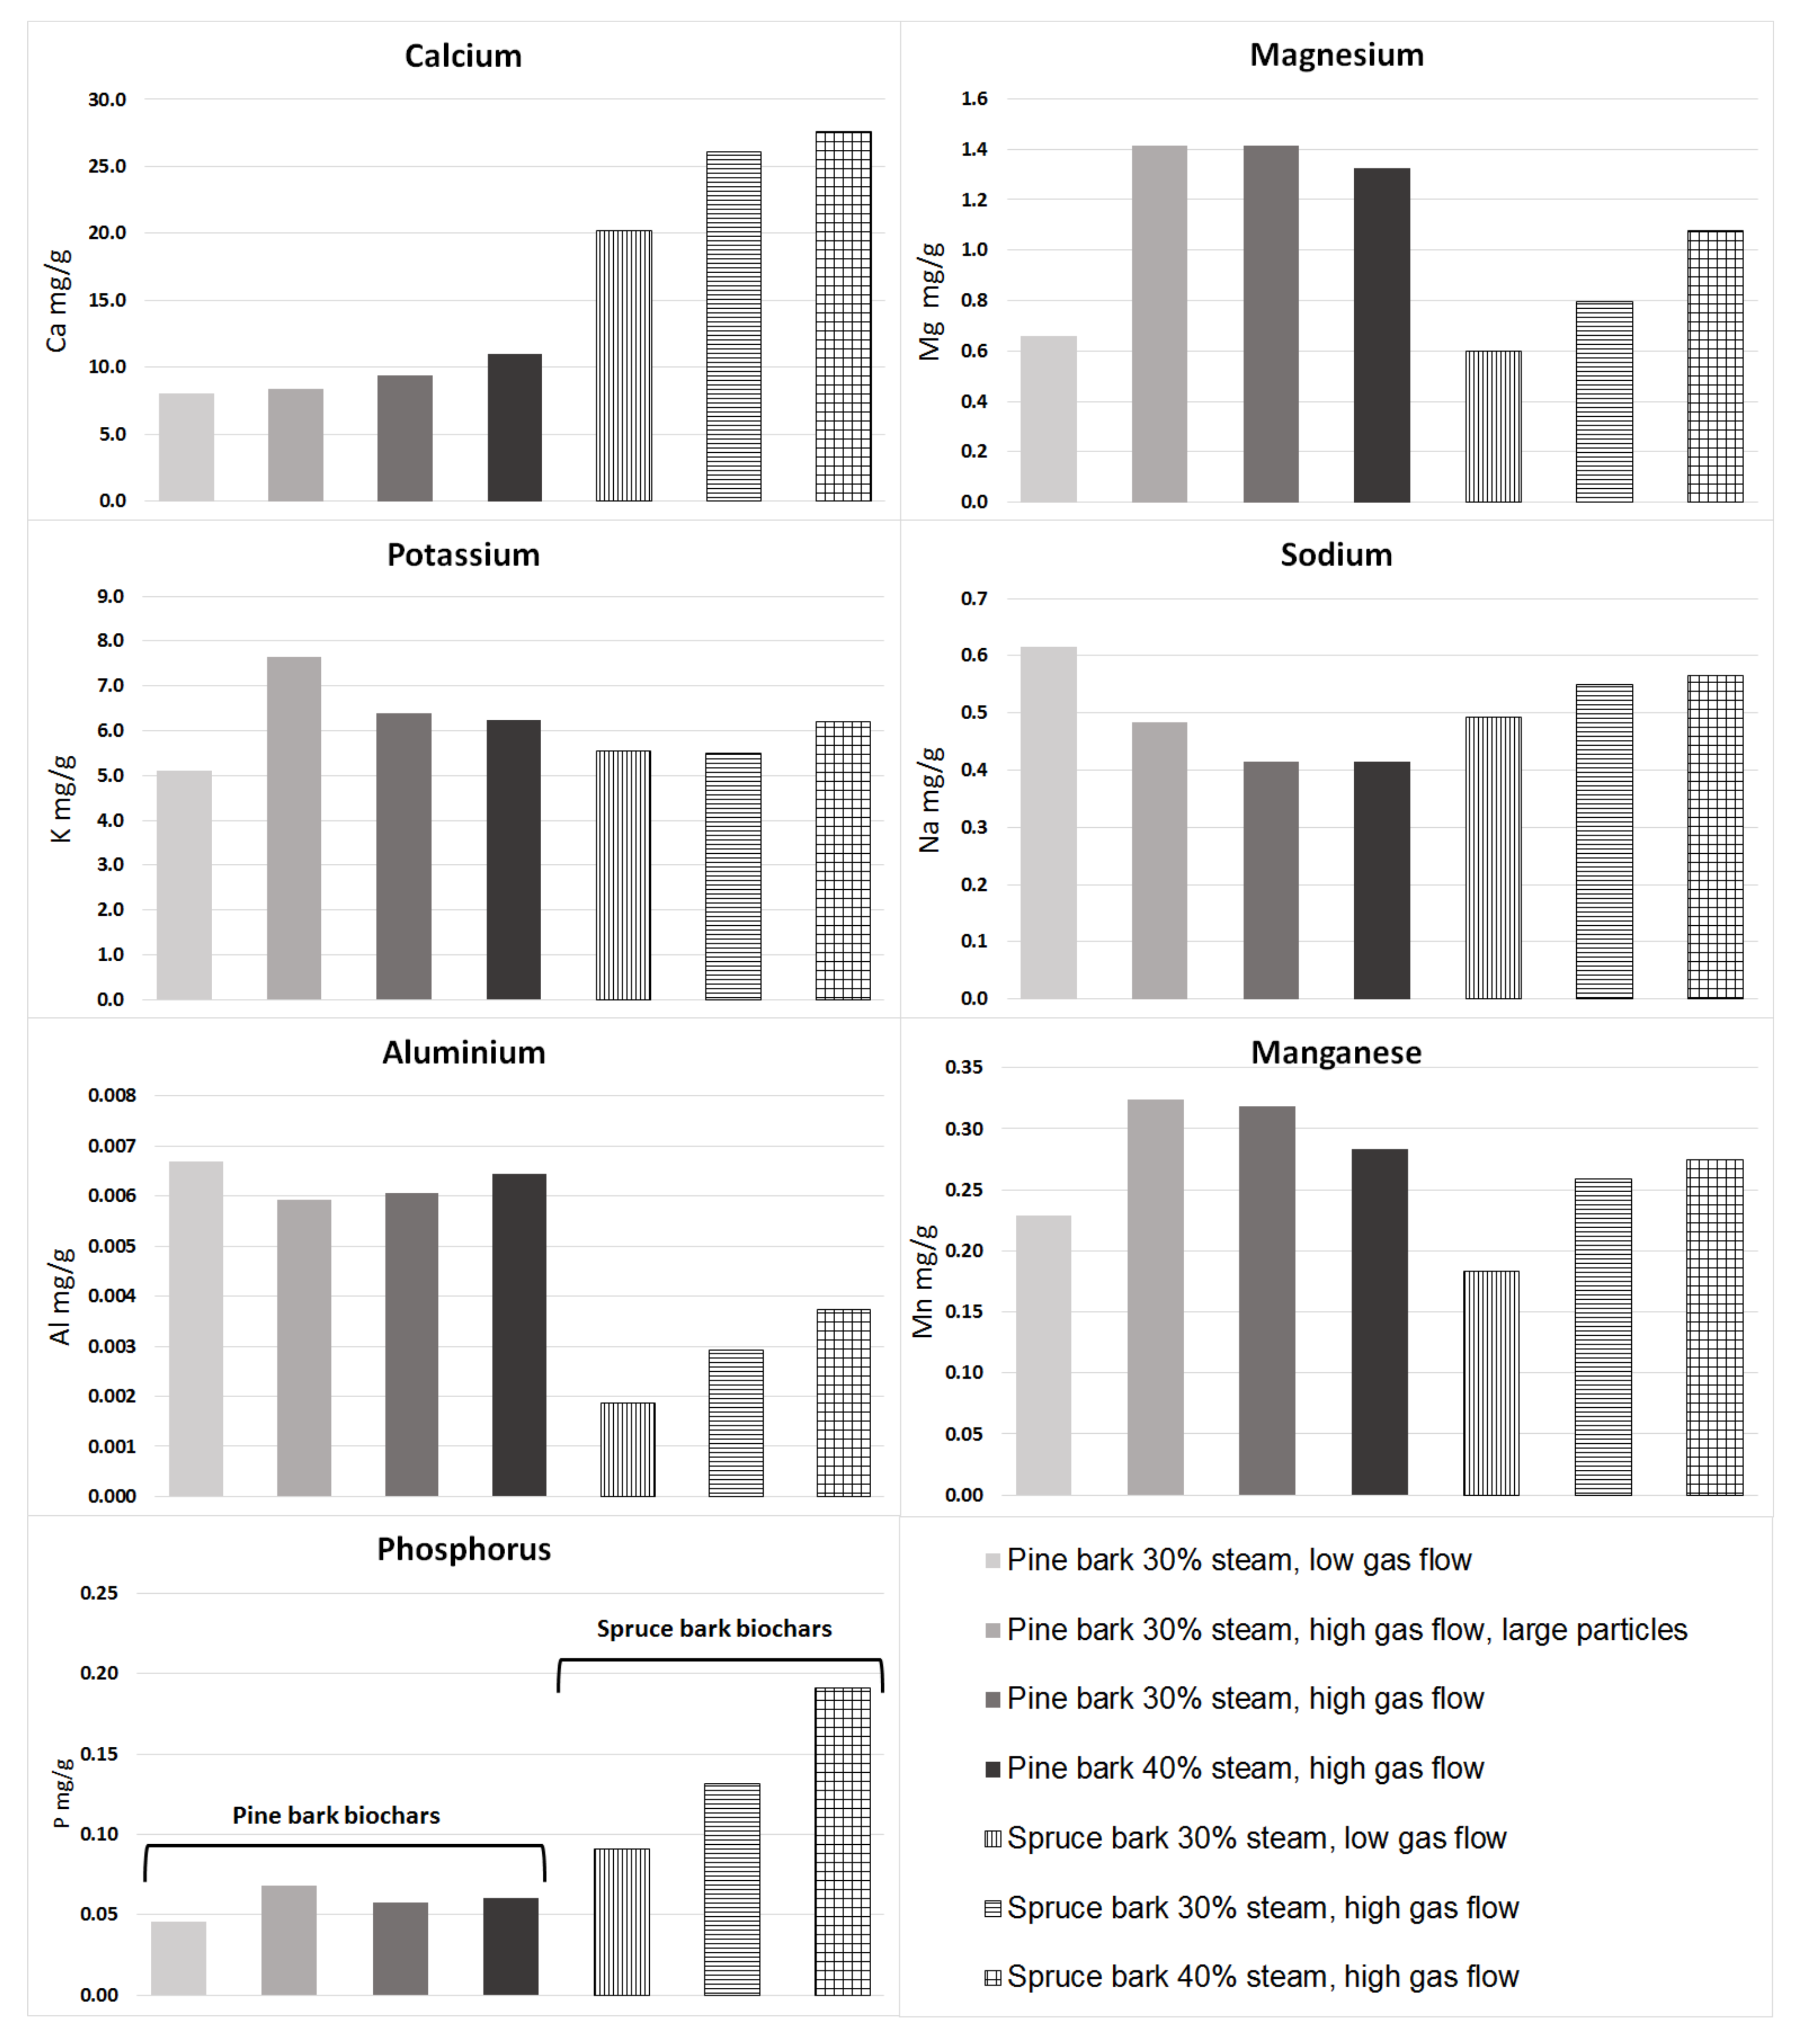
The cation exchange capacity (CEC) was determined using six cations, but the quantity of released phosphorus was also measured as it is one of the leading causes of eutrophication in natural waters. The quantities of extracted cations in mg/g are presented in Figure 5. The total quantity of exchangeable cations on spruce bark is approximately twice that of the pine bark. Still, of the exchangeable cations, only the amount of exchangeable calcium is substantially greater for spruce. The exchangeable Ca2+ result correlates with the much higher ash content of the spruce (12–15 wt-% spruce AC vs. 5–6 wt-% pine AC), as calcium oxides form a significant fraction of the ash components present in wood-based biochar [31]. XRF measurements also confirmed a clear difference between Ca2+ contents of the biomasses (data not shown). The CECs, corresponding to the relative quantities of charged surface sites, are greater for pine bark ACs (16–24 mmol/kg for pine, 9–11 mmol/kg for spruce) as these ACs had a relatively larger surface area compared with spruce ACs and, therefore, more surface groups for cations adsorption. The greater CEC of pine bark is due to the higher surface areas of the ACs.
A comparison of the individual cations showed K and Na concentrations in the same range for both biomasses. The levels of Mg, Al, and Mn were slightly higher with pine bark, whereas P concentration was higher for spruce. All Fe concentrations were below the detection limit of 0.015 mg/L. These results are consistent with other CEC studies performed for different biochar adsorbents (e.g., [32]).
3.3.3. Microplastics Retention
The selected ACs for MP retention possessed different surface areas and porosities. Pine bark ACs treated with 30 and 40% steam had surface areas of 603 and 556 m2/g, respectively, and a moderate amount of mesoporosity. The third AC tested for microplastics retention was spruce bark AC with low surface area (187 m2/g) but broader pore size distribution compared to the pine bark ACs (Table 3). All tested ACs had excellent retention performance for the larger MPs tested. The retention was 100% for the PE particles and nearly 100% for the fleece fibers, with only 1–4 fibers detected after elution. There were no differences between the tested ACs.
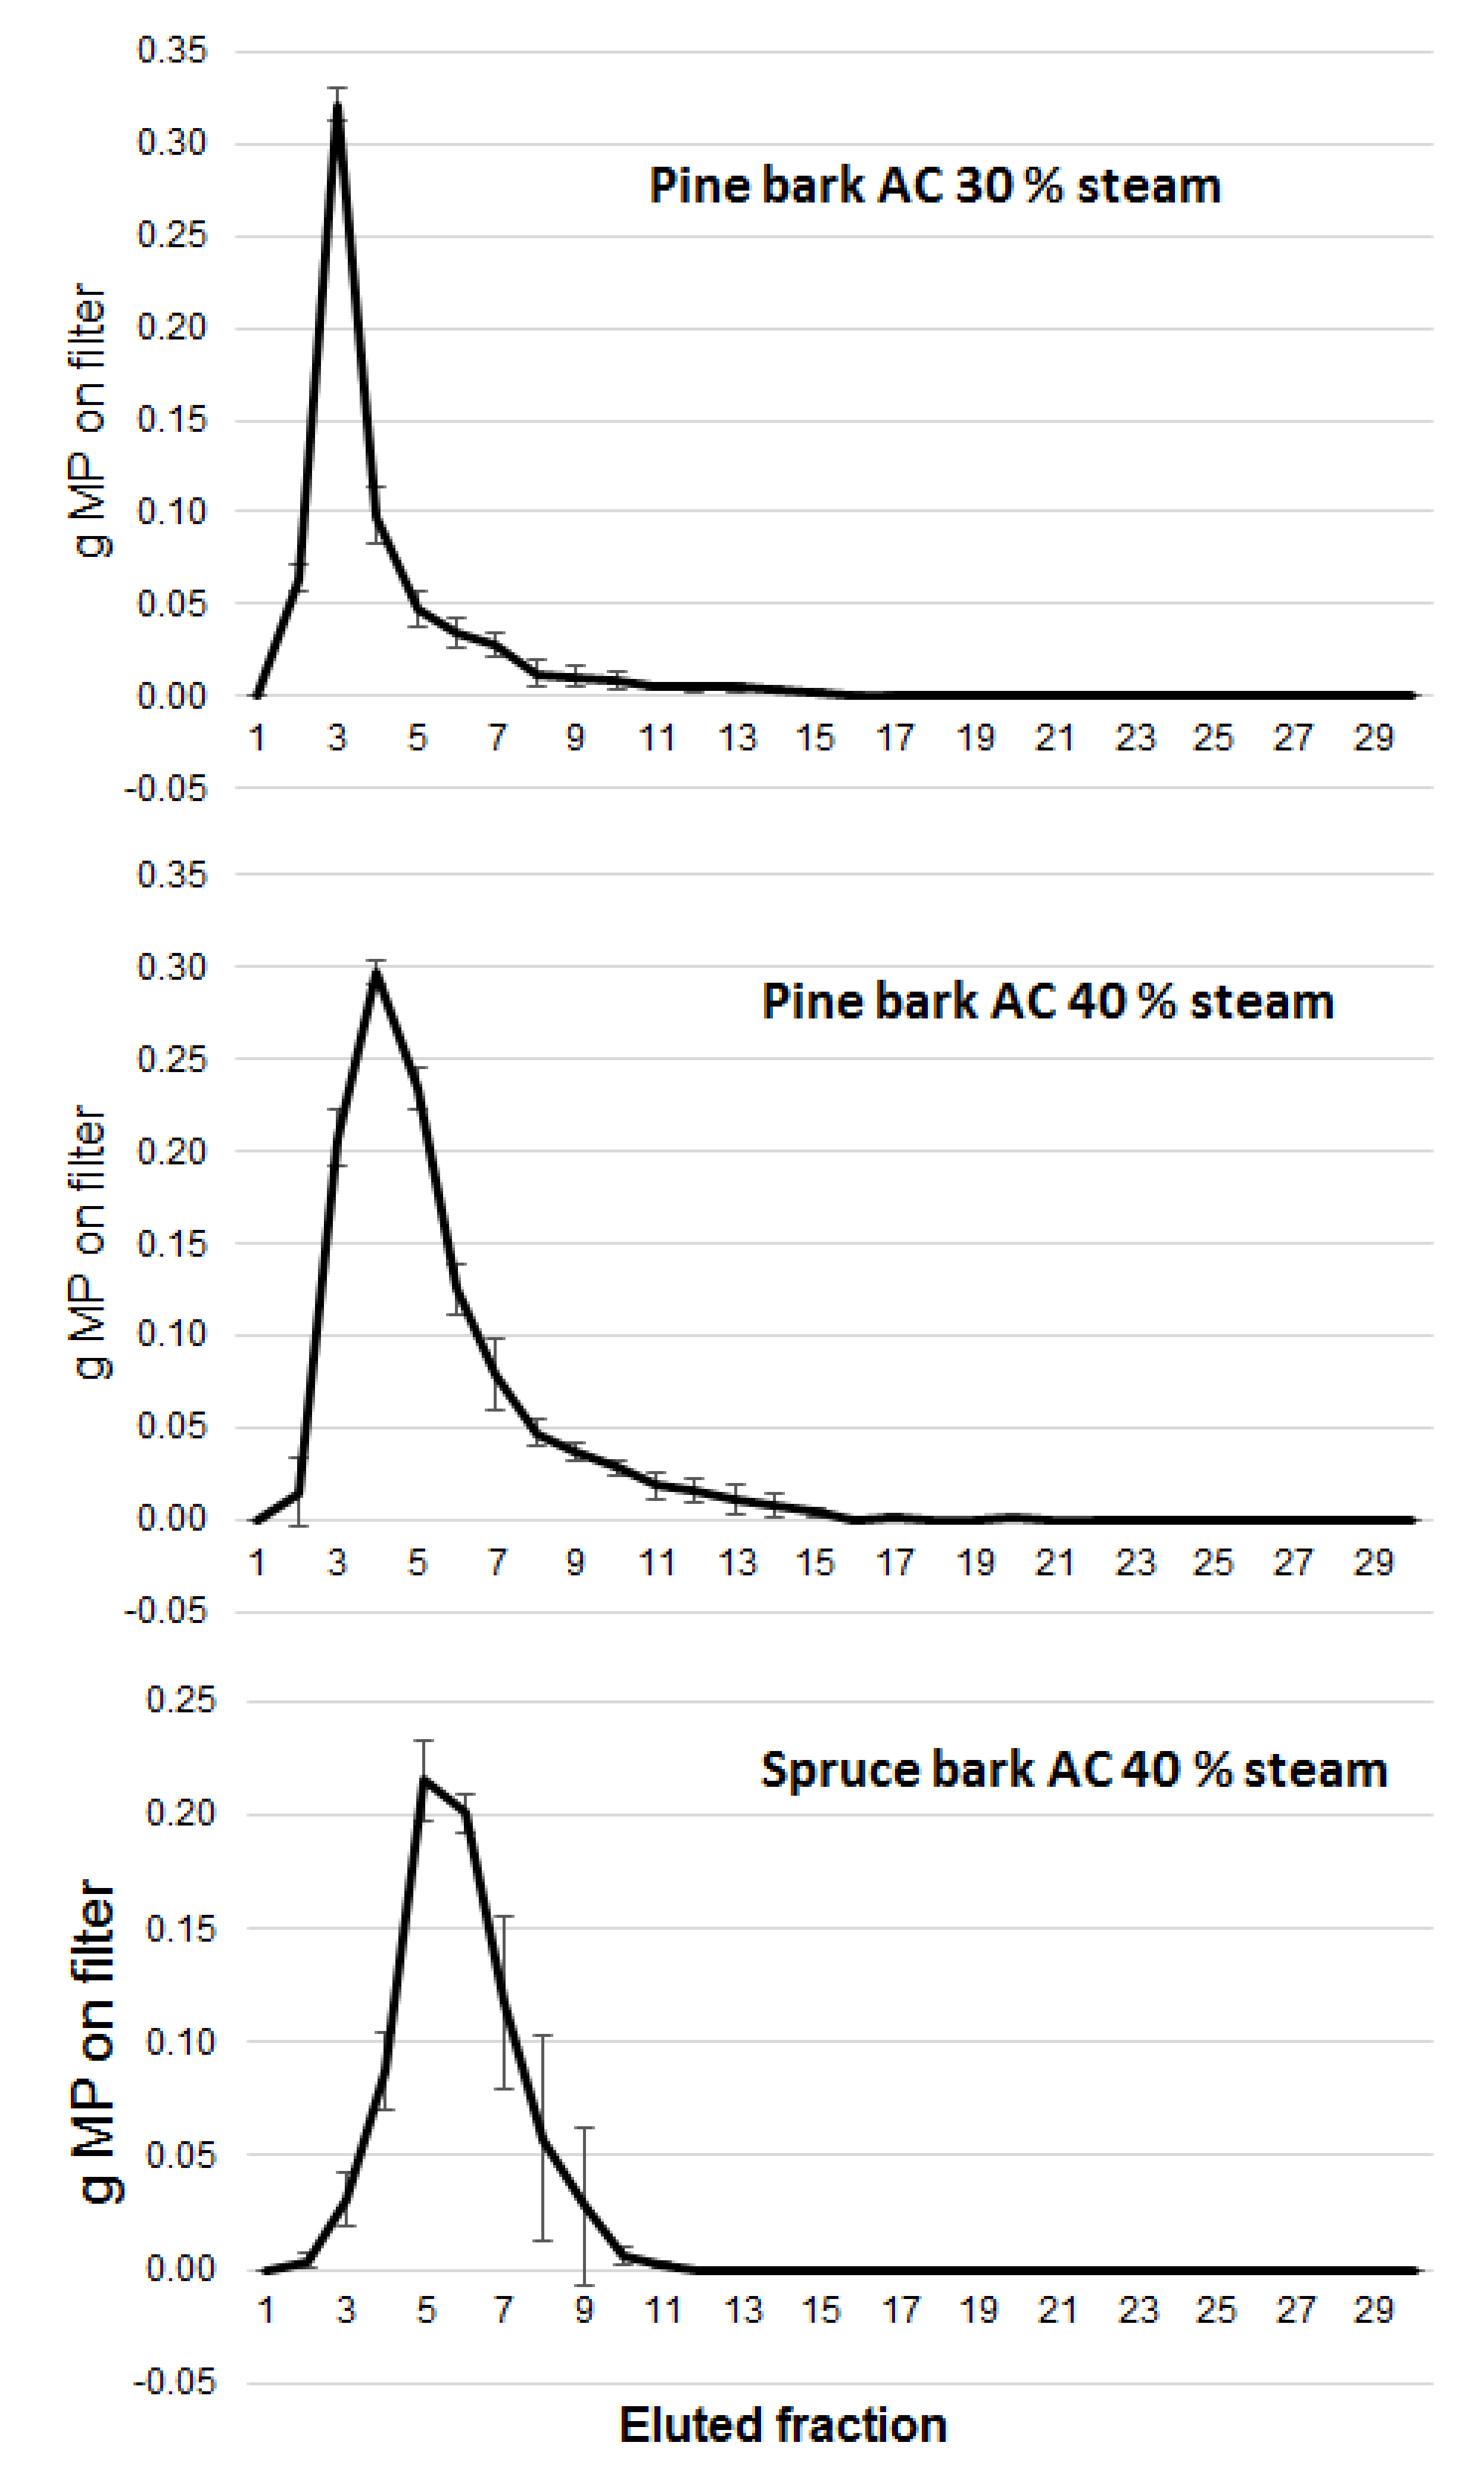
The 10-µm spherical microbead retention was not as efficient as for the larger particles, and some differences between the ACs could be detected (Figure 6). The 30 and 40% steam-activated pine biochars exhibited weaker retention of spherical microbead MPs compared to the spruce bark AC and the majority of the spherical microbead MPs eluted rapidly within the first 2–14 fractions. The 40% steam activated spruce biochar exhibited rapid elution of the spherical microbead MP particles, but slightly higher retention as compared with the pine bark AC. The experiments were performed in triplicate and the used biochars were washed and ultrasonicated between the tests. The MPs that could not be removed from the ACs by washing represent retained MP materials (Table 6). These results also support the superior performance of the spruce bark AC despite its lesser surface area.
4. Discussion
The objective of the research was to evaluate the suitability of two low-cost forest sidestreams, pine and spruce bark, for the production of biochar and activated carbons. Slow pyrolysis at 475 °C was used to generate the biochars. The activation method selected was steam activation (800 °C), which complemented the low-cost perspective of the work. Factors affecting the economic feasibility of biochar production were analyzed, including yield, particle size and key chemical, and physical characteristics. The produced biochars were also examined for selected water purification applications, including organic and inorganic pollutant removal and microplastics retention.
4.1. Raw Material Selection and Particle Size
The raw materials selected for these experiments were two soft-wood bark materials, which were not entirely homogeneous as some stem wood was also mixed in the samples. The effect of the stem wood was, however, likely minimal as the quantities of entrained stem wood were small. The main differences between stem wood and bark are different porosities and amounts of ash. The porosity of the biomass affects the porosity of the biochar and activated biochar [4]. Bark material also has higher ash content than stem wood [33,34]. Mineral impurities could have caused the high ash content of spruce, but the freshness and storage method of the material also affect the ash content [33]. The spruce bark biomass was more fresh and moist compared to the pine bark, which had been stored in dry conditions for a longer time period.
Both bark materials produced microporous ACs, but differences were found in the larger pore sizes. Spruce bark biochar had a higher amount of mesopores before activation, and the pores were enlarged during the activation into macropores. Pine bark biochar did not increase in macropore volume due to activation, but mesoporosity increased by ten-fold. It has been shown that steam activation produces more mesoporous carbons than CO2 activation [35,36]. Steam reacts more readily with the carbon pore walls and begins to expand the existing pores, whereas CO2 creates microporosity by reacting primarily with the active sites at the pore centers [35]. Longer activation times are needed with CO2 if larger pores are required. The results reported herein are supported by those of Zhang et al. (2014) who used poplar wood bark and Cao et al. (2002), who detailed the outcomes of steam activation of poplar wood bark and a mixture of soft wood bark, respectively [19,37]. Both materials produced microporous ACs with similar surface areas (e.g., 555 m2/g for poplar bark at 800 °C and 60 min). The observed differences in the results are due to the different raw material porosity, activation times, and activation temperatures. The development of mesoscale porosity is important to take into account when selecting raw material and activation method for water purification purposes. The adsorption occurs mainly in the micropores, but larger pores work as channels into the micropores. Bark materials are therefore suitable for AC production as they possess mesoporosity and the required microporosity can be generated by activation.
The biochar particle size before activation did not significantly affect the surface area and porosity. Although small particle size generally favors porosity development because of the larger reactive surface area for the activation reagent, crushing is an extra step in the manufacturing process. Surface area as high as 1361 m2/g has been achieved for crushed walnut shells (particle size 1–2 mm), for example, using steam activation at 850 °C and 60 min [35]. When aiming to produce ACs with moderate surface areas, however, sufficient results can be achieved with larger biochar particles.
4.2. Adsorption Capacities of Chemical Compounds
The pine bark ACs showed excellent adsorption capacities for phenol. The obtained maximum adsorption capacity for pine bark AC (169 mg/g, Table 5) is comparable to capacities found in the literature for much higher surface area ACs (Table 7). These results along with selected previous work show that efficient phenol removal is not solely dependent on an ultrahigh surface area (Table 7). Phenol adsorption occurs in the micropores, but sufficient mesoporosity is also needed to create channels into the micropores. Steric effects inhibit diffusion of the phenol molecule deeper within the carbon pores [38]. Another parameter influencing results is the solution pH. At pH less than the pKa value of phenol (9.89 at 298 K), phenol occurs in its non-dissociated form, which is the most active adsorbing form. Above pH 9, phenol dissociates into the phenolate anion and has to compete with other negatively charged ions (e.g., hydroxyl ions) for adsorption sites. Lower pH is, therefore, more favorable for phenol adsorption and respectively, in some cases removal of ash using an acid wash may be necessary [18,39]. The results of this experiment were affected as the high ash content of the ACs increased the solution pH above 9 for most of the AC samples, particularly the spruce ACs.
The CEC measures an adsorbent’s capability to sorb positively charged ions and is, therefore, directly related to adsorbents’ applicability for water treatment. The cation sorption capacity of biochars and ACs is dependent on various parameters such as surface charge density, chemical properties (atom/molecule radius, solubility, pKa), and solution ion density [42]. It has also been found that ion exchange is the dominating mode by which biochars from fast pyrolysis adsorb metal ions [43]. Higher CEC estimates for biochars can be found in literature (e.g., [44]) compared to current work. Comparison is, however, difficult because of the high variability in the used CEC and carbonization methodology and feedstock materials [45]. Both bark ACs had acceptable CECs for application in water treatment, with pine bark ACs performing slightly better because of their higher surface area. The quantities of potentially environmentally harmful elements, such as aluminum and phosphorus, were low. The alkalinity caused by the high ash contents of both bark ACs favors metal adsorption.
4.3. Microplastics
The investigations of microplastics removal showed great potential for their recovery using activated biochar. The large particles were retained completely, but the micrometer-scale MP particles did not absorb as efficiently. The sorption mechanism of microplastics in biochars remains unknown, but the existence of much larger pores may facilitate micro- and nanoplastics retention. This is supported by the superior performance of the spruce bark AC in the present experiments, which had relatively low surface area but included macro-scale porosity. The retention mechanism of large particles is most likely physical attachment between the biochar particles. Thus, biochar surface roughness may be of benefit. These experiments were performed using the activated carbons, but the results indicate that non-activated biochar may as well be suitable for removal of larger MP particles. There is a need to develop more detailed knowledge regarding the mechanisms of MP retention by biochars. Biochars present an inexpensive means of removing MPs from waters with the added benefit of the simultaneous removal of other contaminants.
5. Conclusions
Both spruce and pine bark were suitable for biochar and activated biochar production for water treatment purposes, but some differences were observed between the two materials. The surface area of spruce bark AC remained less than the surface area of pine bark AC. One of the reasons for this was likely due to the high ash content of spruce bark, causing pore-clogging through carbonate formation. The lower carbon content of spruce bark also indicated that longer activation time or greater steam proportion may have yielded a higher degree of carbonization and greater porosity development. Pine bark activated using 30% steam and the higher rate of gas flow performed best in the phenol adsorption tests and had relatively greater CEC due to its larger surface area. Spruce ACs possessed a greater quantity of exchangeable cations, largely due to a high Ca content. The activated biochars tested herein efficiently removed the larger microplastics particles. The removal of 10-µm spherical microplastics was not as sufficient. Results indicated that higher meso-and macropore contents could be beneficial for the removal of the smallest MP particles. In conclusion, steam activation is a suitable method for activated biochar production. Surface areas in the range of 400–600 m2/g are adequate for the efficient removal of contaminants from storm and wastewater. The results support the economic feasibility of steam-activated biochar for such water purification purposes. Carbonization provides an added value use for the ligno-cellulosic forest residues with environmentally benign applications. Removal of microplastics using biochar requires further research, particularly regarding the recovery of micrometer-scale MP size fractions as well as the identification of the retention mechanism. In addition, the economic feasibility of biochar production using different sidestreams or combinations thereof should be further considered in the biochar and activated biochar-related research.
Author Contributions
V.S. and P.K. conceptualized and designed the research topic; V.S. and P.K. supervised the investigation; V.S., S.P., H.R., and L.W. designed and executed the laboratory work; V.S. prepared the original manuscript draft; all authors contributed to reviewing and editing the manuscript. All authors have read and agreed to the published version of the manuscript.
Funding
This work has been funded by the Ministry of Agriculture and Forestry of Finland, agreement number: 754/03.02.06.00/2018.
Acknowledgments
The authors are grateful to Sari Tuomikoski (Oulu University, Finland) for performing the phenol adsorption tests and to Anssi Källi (VTT) for extensive support with the slow pyrolysis oven. We thank the laboratory staff at VTT for performing the analyses. We are grateful for the support by the FinnCERES Materials Bioeconomy Ecosystem.
Conflicts of Interest
The authors declare no conflict of interest.
References
- Mohanty, S.K.; Valenca, R.; Berger, A.W.; Yu, I.K.M.; Xiong, X.; Saunders, T.M.; Tsang, D.C.W. Plenty of room for carbon on the ground: Potential applications of biochar for stormwater treatment. Sci. Total Environ. 2018, 625, 1644–1658. [Google Scholar] [CrossRef] [PubMed]
- Sommer, F.; Dietze, V.; Baum, A.; Sauer, J.; Gilge, S.; Maschowski, C.; Gieré, R. Tire Abrasion as a Major Source of Microplastics in the Environment. Aerosol Air Qual. Res. 2018, 18, 2014–2028. [Google Scholar] [CrossRef]
- Mohan, D.; Sarswat, A.; Ok, Y.S.; Pittman, C.U. Organic and inorganic contaminants removal from water with biochar, a renewable, low cost and sustainable adsorbent—A critical review. Bioresour. Technol. 2014, 160, 191–202. [Google Scholar] [CrossRef] [PubMed]
- Siipola, V.; Tamminen, T.; Källi, A.; Lahti, R.; Romar, H.; Rasa, K.; Keskinen, R.; Hyväluoma, J.; Hannula, M.; Wikberg, H. Effects of biomass type, carbonization process, and activation method on the properties of bio-based activated carbons. Bioresource 2018, 13, 5976–6002. [Google Scholar]
- Ahmed, M.B.; Zhou, J.L.; Ngo, H.H.; Guo, W.; Chen, M. Progress in the preparation and application of modified biochar for improved contaminant removal from water and wastewater. Bioresour. Technol. 2016, 214, 836–851. [Google Scholar] [CrossRef] [PubMed]
- Fic, K.; Platek, A.; Piwek, J.; Frackowiak, E. Sustainable materials for electrochemical capacitors. Mater. Today 2018, 21, 437–454. [Google Scholar] [CrossRef]
- Raymundo-Piñero, E.; Leroux, F.; Béguin, F. A High-Performance Carbon for Supercapacitors Obtained by Carbonization of a Seaweed Biopolymer. Adv. Mater. 2006, 18, 1877–1882. [Google Scholar] [CrossRef]
- Bridgewater, A. Biomass fast pyrolysis. Therm. Sci. 2004, 8, 21–50. [Google Scholar] [CrossRef]
- Arriagada, R.; García, R.; Molina-Sabio, M.; Rodriguez-Reinoso, F. Effect of steam activation on the porosity and chemical nature of activated carbons from Eucalyptus globulus and peach stones. Microporous Mater. 1997, 8, 123–130. [Google Scholar] [CrossRef]
- Calisto, V.; Ferreira, C.I.A.; Oliveira, J.A.B.P.; Otero, M.; Esteves, V.I. Adsorptive removal of pharmaceuticals from water by commercial and waste-based carbons. J. Environ. Manag. 2015, 152, 83–90. [Google Scholar] [CrossRef]
- Huggins, T.M.; Haeger, A.; Biffinger, J.C.; Ren, Z.J. Granular biochar compared with activated carbon for wastewater treatment and resource recovery. Water Res. 2016, 94, 225–232. [Google Scholar] [CrossRef] [Green Version]
- Hakala, J.; Kangas, P.; Penttilä, K.; Alarotu, M.; Björnström, M.; Koukkari, P. Replacing Coal Used in Steelmaking with Biocarbon from Forest Industry Side Streams; VTT Technical Research Centre of Finland: Espoo, Finland, 2019. [Google Scholar]
- Farrokh, N.T.; Suopajärvi, H.; Mattila, O.; Umeki, K.; Phounglamcheik, A.; Romar, H.; Sulasalmi, P.; Fabritius, T. Slow pyrolysis of by-product lignin from wood-based ethanol production—A detailed analysis of the produced chars. Energy 2018, 164, 112–123. [Google Scholar] [CrossRef]
- Kwak, J.-H.; Islam, M.S.; Wang, S.; Messele, S.A.; Naeth, M.A.; El-Din, M.G.; Chang, S.X. Biochar properties and lead(II) adsorption capacity depend on feedstock type, pyrolysis temperature, and steam activation. Chemosphere 2019, 231, 393–404. [Google Scholar] [CrossRef]
- Han, Y.; Boateng, A.A.; Qi, P.X.; Lima, I.M.; Chang, J. Heavy metal and phenol adsorptive properties of biochars from pyrolyzed switchgrass and woody biomass in correlation with surface properties. J. Environ. Manag. 2013, 118, 196–204. [Google Scholar] [CrossRef]
- Lua, A.C.; Guo, J. Activated carbon prepared from oil palm stone by one-step CO2 activation for gaseous pollutant removal. Carbon N. Y. 2000, 38, 1089–1097. [Google Scholar] [CrossRef]
- Jia, Q.; Lua, A.C. Effects of pyrolysis conditions on the physical characteristics of oil-palm-shell activated carbons used in aqueous phase phenol adsorption. J. Anal. Appl. Pyrolysis 2008, 83, 175–179. [Google Scholar] [CrossRef]
- Smets, K.; De Jong, M.; Lupul, I.; Gryglewicz, G.; Schreurs, S.; Carleer, R.; Yperman, J. Rapeseed and raspberry seed cakes as inexpensive raw materials in the production of activated carbon by physical activation: Effect of activation conditions on textural and phenol adsorption characteristics. Materials (Basel) 2016, 9, 565. [Google Scholar] [CrossRef] [Green Version]
- Cao, N.; Darmstadt, H.; Soutric, F.; Roy, C. Thermogravimetric study on the steam activation of charcoals obtained by vacuum and atmospheric pyrolysis of softwood bark residues. Carbon N. Y. 2002, 40, 471–479. [Google Scholar] [CrossRef]
- Zhang, T.; Walawender, W.; Fan, L.; Fan, M.; Daugaard, D.; Brown, R. Preparation of activated carbon from forest and agricultural residues through CO activation. Chem. Eng. J. 2004, 105, 53–59. [Google Scholar] [CrossRef]
- Andrady, A.L. Microplastics in the marine environment. Mar. Pollut. Bull. 2011, 62, 1596–1605. [Google Scholar] [CrossRef]
- Herbort, A.F.; Sturm, M.T.; Fiedler, S.; Abkai, G.; Schuhen, K. Alkoxy-silyl Induced Agglomeration: A New Approach for the Sustainable Removal of Microplastic from Aquatic Systems. J. Polym. Environ. 2018, 26, 4258–4270. [Google Scholar] [CrossRef]
- Ivar do Sul, J.A.; Costa, M.F. The present and future of microplastic pollution in the marine environment. Environ. Pollut. 2014, 185, 352–364. [Google Scholar] [CrossRef] [PubMed]
- Li, J.; Liu, H.; Paul Chen, J. Microplastics in freshwater systems: A review on occurrence, environmental effects, and methods for microplastics detection. Water Res. 2018, 137, 362–374. [Google Scholar] [CrossRef] [PubMed]
- Herbort, A.F.; Sturm, M.T.; Schuhen, K. A new approach for the agglomeration and subsequent removal of polyethylene, polypropylene, and mixtures of both from freshwater systems—A case study. Environ. Sci. Pollut. Res. 2018, 25, 15226–15234. [Google Scholar] [CrossRef] [PubMed]
- Lares, M.; Ncibi, M.C.; Sillanpää, M.; Sillanpää, M. Occurrence, identification and removal of microplastic particles and fibers in conventional activated sludge process and advanced MBR technology. Water Res. 2018, 133, 236–246. [Google Scholar] [CrossRef]
- Brunauer, S.; Emmett, P.H.; Teller, E. Adsorption of gases in multimolecular layers. J. Am. Chem. Soc. 1938, 60, 309. [Google Scholar] [CrossRef]
- Lastoskie, C.; Gubbins, K.E.; Quirke, N. Pore size heterogeneity and the carbon slit pore: A density functional theory model. Langmuir 1993, 9, 2693–2702. [Google Scholar] [CrossRef]
- Sumner, M.E.; Miller, W.P. Cation Exchange Capacity and Exchange Coefficients. In Methods of Soil Analysis Part 3: Chemical Methods; Sparks, D.L., Ed.; Soil Science Society of America: Madison, WI, USA, 1996; pp. 1201–1230. [Google Scholar]
- Medellin-Castillo, N.A.; Padilla-Ortega, E.; Regules-Martínez, M.C.; Leyva-Ramos, R.; Ocampo-Pérez, R.; Carranza-Alvarez, C. Single and competitive adsorption of Cd(II) and Pb(II) ions from aqueous solutions onto industrial chili seeds (Capsicum annuum) waste. Sustain. Environ. Res. 2017, 27, 61–69. [Google Scholar] [CrossRef]
- Tortosa Masiá, A.A.; Buhre, B.J.P.; Gupta, R.P.; Wall, T.F. Characterising ash of biomass and waste. Fuel Process. Technol. 2007, 88, 1071–1081. [Google Scholar] [CrossRef]
- Heikkinen, J.; Keskinen, R.; Soinne, H.; Hyväluoma, J.; Nikama, J.; Wikberg, H.; Källi, A.; Siipola, V.; Melkior, T.; Dupont, C.; et al. Possibilities to improve soil aggregate stability using biochars derived from various biomasses through slow pyrolysis, hydrothermal carbonization, or torrefaction. Geoderma 2019, 344, 40–49. [Google Scholar] [CrossRef]
- Lehtikangas, P. Quality properties of pelletised sawdust, logging residues and bark. Biomass Bioenergy 2001, 20, 351–360. [Google Scholar] [CrossRef]
- Wang, L.; Barta-Rajnai, E.; Skreiberg, Ø.; Khalil, R.; Czégény, Z.; Jakab, E.; Barta, Z.; Grønli, M. Effect of torrefaction on physiochemical characteristics and grindability of stem wood, stump and bark. Appl. Energy 2018, 227, 137–148. [Google Scholar] [CrossRef]
- González, J.F.; Román, S.; González-García, C.M.; Nabais, J.M.V.; Ortiz, A.L. Porosity Development in Activated Carbons Prepared from Walnut Shells by Carbon Dioxide or Steam Activation. Ind. Eng. Chem. Res. 2009, 48, 7474–7481. [Google Scholar] [CrossRef]
- Molina-Sabio, M.; Gonzalez, M.T.; Rodriguez-Reinoso, F.; Sepúlveda-Escribano, A. Effect of steam and carbon dioxide activation in the micropore size distribution of activated carbon. Carbon N. Y. 1996, 34, 505–509. [Google Scholar] [CrossRef]
- Zhang, J.; Zhang, W. Preparation and Characteristics of Activated Carbon from Wood Bark and Its Use for Adsorption of Cu (II). Mater. Sci. 2014, 20, 474–478. [Google Scholar] [CrossRef] [Green Version]
- Rincón-Silva, N.G.; Moreno-Piraján, J.C.; Giraldo, L. Equilibrium, kinetics and thermodynamics study of phenols adsorption onto activated carbon obtained from lignocellulosic material (Eucalyptus Globulus labill seed). Adsorption 2016, 22, 33–48. [Google Scholar] [CrossRef]
- Beker, U.; Ganbold, B.; Dertli, H.; Gülbayir, D.D. Adsorption of phenol by activated carbon: Influence of activation methods and solution pH. Energy Convers. Manag. 2010, 51, 235–240. [Google Scholar] [CrossRef]
- Hameed, B.H.; Rahman, A.A. Removal of phenol from aqueous solutions by adsorption onto activated carbon prepared from biomass material. J. Hazard. Mater. 2008, 160, 576–581. [Google Scholar] [CrossRef]
- Wu, F.-C.; Tseng, R.-L.; Juang, R.-S. Comparisons of porous and adsorption properties of carbons activated by steam and KOH. J. Colloid Interface Sci. 2005, 283, 49–56. [Google Scholar] [CrossRef]
- Dias, J.M.; Alvim-Ferraz, M.C.M.; Almeida, M.F.; Rivera-Utrilla, J.; Sánchez-Polo, M. Waste materials for activated carbon preparation and its use in aqueous-phase treatment: A review. J. Environ. Manag. 2007, 85, 833–846. [Google Scholar] [CrossRef]
- Mohan, D.; Pittman, C.U.; Bricka, M.; Smith, F.; Yancey, B.; Mohammad, J.; Steele, P.H.; Alexandre-Franco, M.F.; Gómez-Serrano, V.; Gong, H. Sorption of arsenic, cadmium, and lead by chars produced from fast pyrolysis of wood and bark during bio-oil production. J. Colloid Interface Sci. 2007, 310, 57–73. [Google Scholar] [CrossRef] [PubMed]
- Yuan, J.H.; Xu, R.K.; Zhang, H. The forms of alkalis in the biochar produced from crop residues at different temperatures. Bioresour. Technol. 2011, 102, 3488–3497. [Google Scholar] [CrossRef] [PubMed]
- Munera-Echeverri, J.L.; Martinsen, V.; Strand, L.T.; Zivanovic, V.; Cornelissen, G.; Mulder, J. Cation exchange capacity of biochar: An urgent method modification. Sci. Total Environ. 2018, 642, 190–197. [Google Scholar] [CrossRef] [PubMed] [Green Version]
Figure 1.
The sample grid of the slow pyrolysis/activation reactor.

Figure 2.
Total burn-off of small particle size activated carbons (ACs) and their surface areas.

Figure 3.
Phenol removal using biochars and activated biochars as a function of surface area. The rectangles are for clarity, presenting the locations of samples in this work, not general separation between spruce and pine bark activated carbons.
Figure 3.
Phenol removal using biochars and activated biochars as a function of surface area. The rectangles are for clarity, presenting the locations of samples in this work, not general separation between spruce and pine bark activated carbons.

Figure 4.
Phenol adsorption capacities of small particle size-activated biochars at equilibrium concentration.
Figure 4.
Phenol adsorption capacities of small particle size-activated biochars at equilibrium concentration.

Figure 5.
The amounts of exchangeable cations in the activated bark biochars.

Figure 6.
Retention of 10 µm microplastics particles on activated biochar.


Table 1.
Summary of different pyrolysis processes with product distributions.
| Pyrolysis | |||||
|---|---|---|---|---|---|
| Fast | Intermediate | Slow | Torrefaction | Gasification | |
| Temperature | 500 | 400 | 400 | 300 | 800–900 |
| Residence time | <1 s | 10–30 s | 1–5 h | Hours-days | s-min |
| Liquid % | 75 | 40 (2 phases) | 35 | 1–5 | |
| Char % | 12 | 40 | 35 | 85 | <1 |
| Gas % | 13 | 20 | 30 | 15 | 95–99 |
Table 2.
Slow pyrolysis and steam activation conditions.
| Treatment | Water, mL/min | N2, L/h | Temperature, °C | Time, h |
|---|---|---|---|---|
| Slow pyrolysis | - | 300 | 475 | 3.0 |
| 30% steam, low gas flow | 0.28 | 66 | 800 | 3.5 |
| 30% steam, high gas flow | 1.40 | 300 | 800 | 3.5 |
| 40% steam, low gas flow | 1.97 | 300 | 800 | 3.5 |
Table 3.
The surface areas, porosities and activation burn-offs of the produced activated biochars.
| Biochar | |||||||||
| Starting Material | Steam Amount | Particle Size | N2 Gas Flow | Burn-off | Surface Area | Total Pore Volume | Micropores <2 nm | Mesopores 2–50 nm | Macropores >50 nm |
| % | L/h | % | m2/g | cm3/g | % | % | % | ||
| Pine bark | - | large | 300 | 61.1 | 2.2 | 0.005 | 8.9 | 68.9 | 22.2 |
| Spruce bark | - | large | 300 | 63.1 | 12 | 0.016 | 18.8 | 81.3 | 0.0 |
| Activated Biochar | |||||||||
| Steam Amount | Particle Size | N2 Gas Flow | Activation Burn-off | Surface Area | Total Pore Volume | Micropores <2 nm | Mesopores 2–50 nm | Macropores >50 nm | |
| % | L/h | % | m2/g | cm3/g | % | % | % | ||
| Pine bark biochar | 30 | small | 66 | 25 | 454 | 0.165 | 92.7 | 6.7 | 0.6 |
| 30 | small | 300 | 28.7 | 603 | 0.240 | 79.6 | 20.4 | 0.0 | |
| large | 300 | 24.5 | 615 | 0.230 | 86.1 | 13.9 | 0.0 | ||
| 40 | small | 300 | 31.6 | 539 | 0.200 | 86.5 | 13.5 | 0.0 | |
| large | 300 | 27.4 | 556 | 0.206 | 86.9 | 13.1 | 0.0 | ||
| Spruce bark biochar | 30 | small | 66 | 21.5 | 272 | 0.098 | 91.3 | 5.8 | 2.9 |
| large | 66 | 22.3 | 233 | 0.084 | 89.3 | 8.9 | 2.4 | ||
| 30 | small | 300 | 22 | 187 | 0.071 | 85.4 | 10.4 | 4.2 | |
| large | 300 | 20 | 185 | 0.072 | 84.5 | 9.9 | 5.6 | ||
| 40 | small | 300 | 23.3 | 369 | 0.132 | 90.0 | 7.7 | 2.3 | |
| large | 300 | 21.6 | 222 | 0.084 | 86.5 | 9.9 | 3.6 | ||
Table 4.
Elemental composition of the studied biomasses, biochars, and activated biochars.
| Parameter | Pine Bark Biomass | Pine Bark Biochar | Pine Bark AC 30% Steam | Pine Bark AC 30% Steam | Pine Bark AC 40% Steam | |||
| N2 gas flow, L/h | - | - | 66 | 300 | 300 | |||
| Particle size | large | large | small | small | large | small | large | |
| Carbon, wt-% | 53 ± 3 | 77 ± 2 | 81 ± 3 | 84 ± 2 | 90 ± 7 | 85 ± 2 | 91 ± 2 | |
| Nitrogen, wt-% | 0.13 ± 0.02 | 0.43 ± 0.02 | 0.14 ± 0.01 | 0.11 ± 0.00 | 0.21 ± 0.06 | 0.17 ± 0.03 | 0.11 ± 0.02 | |
| Hydrogen, wt-% | 5.8 ± 0.03 | 3.1 ± 0.1 | 0.69 ± 0.08 | 0.67 ± 0.01 | 0.70 ± 0.05 | 0.67 ± 0.03 | 0.74 ± 0.01 | |
| Sulfur, wt-% | 0 ± 0 | 0 ± 0 | 0 ± 0 | 0 ± 0 | 0 ± 0 | 0 ± 0 | 0 ± 0 | |
| Oxygen, wt-% | 41 ± 0 | 13 ± 0 | 2.4 ± 0.2 | 3.6 ± 0.4 | 3.5 ± 0.4 | 3.0 ± 0.2 | 2.8 ± 0.1 | |
| Ash, wt-% | 1.4 ± 0.0 | 4.7 ± 0.7 | 5.8 ± 0.1 | 5.7 ± 0.3 | 5.6 ± 0.1 | 6.2 ± 0.1 | 6.1 ± 0.1 | |
| Parameter | Spruce Bark Biomass | Spruce Bark Biochar | Spruce Bark AC 30% Steam | Spruce Bark AC 30% Steam | Spruce Bark AC 40% Steam | |||
| N2 gas flow, L/h | - | - | 66 | 300 | 300 | |||
| Particle size | large | large | small | small | large | small | large | large |
| Carbon, wt-% | 47 ± 0.1 | 68 ± 3 | 65 ± 1 | 68 ± 3 | 63 ± 2 | 65 ± 4 | 57 ± 4 | 69 ± 8 |
| Nitrogen, wt-% | 0.42 ± 0.02 | 0.62 ± 0.05 | 0.53 ± 0.04 | 0.45 ± 0.03 | 0.40 ± 0.01 | 0.42 ± 0.04 | 0.46 ± 0.02 | 0.43 ± 0.08 |
| Hydrogen, wt-% | 5.7 ± 0.07 | 2.5 ± 0.1 | 0.70 ± 0.03 | 0.60 ± 0.01 | 0.60 ± 0.04 | 0.65 ± 0.03 | 0.61 ± 0.03 | 0.60 ± 0.08 |
| Sulfur, wt-% | 0 ± 0 | 0 ± 0 | 0 ± 0 | 0 ± 0 | 0 ± 0 | 0 ± 0 | 0 ± 0 | 0 ± 0 |
| Oxygen, wt-% | 42 ± 0 | 12 ± 0 | 4.7 ± 0.1 | 3.9 ± 0.3 | 5.3 ± 0.2 | 5.1 ± 0.5 | 5.2 ± 0.1 | 4.9 ± 0.6 |
| Ash, wt-% | 5.4 ± 0.1 | 11 ± 1 | 15 ± 0 | 24 ± 1 | 13 ± 1 | 15 ± 0 | 12 ± 0 | 18 ± 0 |
Table 5.
The maximum phenol adsorption capacities of the produced activated carbons.
| Raw Material | Steam | N2 Gas Flow | Particle Size | Surface Area | Maximum Adsorption Capacity |
|---|---|---|---|---|---|
| % | L/h | m2/g | mg/g | ||
| Biochars | |||||
| Pine Bark | - | 300 | large | 2.3 | 33 |
| Spruce bark | - | 300 | large | 12 | 23 |
| Activated biochars | |||||
| Pine Bark | 30 | 66 | small | 454 | 97 |
| 30 | 300 | small | 603 | 169 | |
| 40 | 300 | small | 539 | 149 | |
| Spruce bark | 30 | 66 | small | 272 | 64 |
| 30 | 300 | small | 187 | 70 | |
| 40 | 300 | small | 369 | 84 | |
Table 6.
MP material that could not be removed from the activated biochars by washing.
| Sample | Retention |
|---|---|
| Pine bark AC, 30% steam activation | 0.165 ± 0.096 g |
| Pine bark AC, 40% steam activation | 0.130 ± 0.040 g |
| Spruce bark AC, 40% steam activation | 0.293 ± 0.046 g |
Table 7.
Comparison of phenol adsorption results of current work to literature.
| Raw Material | Activation Condition | Surface Area m2/g | Phenol Adsorption Capacity | Reference |
|---|---|---|---|---|
| Spruce and pine bark | Steam | 185–615 | 64–169 mg/g (=0.7–1.8 mmol/g) | Current work |
| Cherrystone | KOH and ZnCl2 | 170–465 | Max ~70 mg/g for KOH and ZnCl2 | [39] |
| Eucalyptus seed | ZnCl2 | 250–300 | 200 mg/g | [38] |
| Switchgrass (SG), hardwood (HW) and softwood (SW) | Steam | 167–383 | 1.0–1.6 mmol/g | [15] |
| Rattan sawdust | KOH | 1083 | 149 mg/g | [40] |
| Oil palm shells | Steam | 988 | 166 mg/g | [17] |
| Rapeseed and raspberry seed cakes | Steam, CO2 | 141–1179 | Max ~250 mg/g steam, ~170 mg/g CO2 | [18] |
| Fir woods and pistachio shells | Steam, KOH | 1009–1096 | 2.58 and 2.72 mol/kg steam, 2.74 and 3.03 mol/kg KOH | [41] |
© 2020 by the authors. Licensee MDPI, Basel, Switzerland. This article is an open access article distributed under the terms and conditions of the Creative Commons Attribution (CC BY) license (http://creativecommons.org/licenses/by/4.0/).
Share and Cite
MDPI and ACS Style
Siipola, V.; Pflugmacher, S.; Romar, H.; Wendling, L.; Koukkari, P. Low-Cost Biochar Adsorbents for Water Purification Including Microplastics Removal. Appl. Sci. 2020, 10, 788. https://0-doi-org.brum.beds.ac.uk/10.3390/app10030788
AMA Style
Siipola V, Pflugmacher S, Romar H, Wendling L, Koukkari P. Low-Cost Biochar Adsorbents for Water Purification Including Microplastics Removal. Applied Sciences. 2020; 10(3):788. https://0-doi-org.brum.beds.ac.uk/10.3390/app10030788
Chicago/Turabian StyleSiipola, Virpi, Stephan Pflugmacher, Henrik Romar, Laura Wendling, and Pertti Koukkari. 2020. "Low-Cost Biochar Adsorbents for Water Purification Including Microplastics Removal" Applied Sciences 10, no. 3: 788. https://0-doi-org.brum.beds.ac.uk/10.3390/app10030788
Note that from the first issue of 2016, this journal uses article numbers instead of page numbers. See further details here.