1. Introduction
Augmented Reality (AR) technology provides a new way of information visualization and interaction with physical/virtual objects [
1,
2,
3]. It has been used in various application domains such as retailing [
4,
5,
6], manufacturing [
7,
8], tourism [
9,
10], education [
11], and entertainment [
12,
13]. In particular, it has high potential to change the paradigm of consumer behaviors in the retail and marketing fields because it can enable real-time interactive communication with consumers. In the case of fast-moving consumer goods (FMCGs), such as fashion, food, and cosmetics, which have fast consumption cycles, real-time communication with consumers can be a key factor in sales. Accordingly, the importance of interaction marketing based on AR technology will increase [
14]. Recently, keywords, such as healthy foods and home meal replacement (HMR), have been leading the food market [
15]. In such a circumstance, AR technology can have a significant impact on consumers’ food choice behavior. For example, at a grocery store, consumers can use an AR application on their smartphones that helps them buy food for a healthier diet, allowing them to intuitively check nutritional information or ingredients.
A number of mobile AR frameworks are now available and used to support the development of diverse mobile AR applications, including Google’s ARCore, Apple’s ARKit, PTC’s Vuforia, and so on. These AR frameworks commonly provide a set of APIs (Application Programming Interfaces) that developers can use to create AR applications. They also provide key functionalities to recognize 2D/3D physical objects and render virtual content over the objects on the mobile screen. However, there are differences in the details of their features and performance. Such differences may cause differences in the function or performance of the applications developed using the AR frameworks. To provide users with a useful and easy-to-use application, it is important to choose an appropriate AR framework that can meet the purpose of the application. Although previous studies have compared the functions of diverse AR frameworks [
16,
17,
18,
19], no research has been conducted to actually measure and compare their performance. Moreover, there has been little attention paid to whether commercial AR frameworks can provide sufficient support in the aforementioned AR-based food marketing domain or whether they have potential technical issues that we need to address for the application domain.
In this paper, we measure and compare the performance of commercial AR frameworks to provide helpful information for the development of mobile AR applications. Because the performance measurement should be performed under different workload conditions depending on the type of application to be used, we select one application domain and prepare an appropriate setup for our experiment. As an application domain for the experiment, we assume a situation in which a consumer purchases food products at a place, such as a grocery store, and we consider an application scenario in which AR content related to the products is displayed on a smartphone screen by recognizing the products.
For comparison, we use three well-known commercial AR frameworks (i.e., Vuforia, ARCore, and MAXST) that support the development of mobile AR applications. Vuforia and ARCore are the world’s well-known AR frameworks that are widely used, while MAXST is the AR framework provided by a leading AR software vendor in Korea. There are many aspects of the performance, but the most important is recognizing target products correctly. In this paper, we conduct experiments to measure and compare the target recognition performance from four different dimensions: distance, viewing angle, occlusion, and simultaneous recognition.
2. Related Works
We summarize two categories of previous works related to this study. First, we discuss previous research that utilizes AR to support users in the grocery stores. Second, we introduce previous research comparing multiple AR frameworks and discuss the differences of this study.
2.1. Application of AR in Grocery Stores
Similar to the target application scenario of this study, some works have aimed at providing users with useful information to help with their purchase decisions by using mobile AR technology in a grocery store [
4,
5,
6]. In Reference [
4], an AR-assisted mobile grocery-shopping application was presented to provide customized recommendations for healthy products to users. The application recognizes products on the shelves of grocery stores and shows AR overlay tags with different colors to allow users to quickly identify healthy food items or products to avoid. A similar mobile AR application was proposed in Reference [
5]. Its goal is to help users make food choices for a healthier diet considering factors, such as calories or sugar. It also utilizes a coloring scheme to differentiate foods using red and green colors. In Reference [
6], the authors studied the design of a mobile AR application and conducted a preliminary user study. The application was designed to display AR-based information about products and recommends healthy and similar products to people. In this paper, our goal is to assess the target recognition and tracking performance of commercial AR frameworks that are widely used to develop mobile AR applications so as to provide lessons that might be useful when ones use the AR frameworks in a grocery store environment.
2.2. Comparison of AR Frameworks
There have been studies comparing the functionalities and features of diverse AR frameworks [
16,
17,
18,
19]. However, there is no research that actually measures and compares their performance under specific application scenarios. The main comparative criteria of the previous studies were similar, including license type, supporting platform, and features related to object recognition and tracking (e.g., text, image, markerless, marker-based, 2D/3D recognition and tracking). The AR frameworks used for comparison differed slightly between studies. In Reference [
16], six frameworks, such as Vuforia, Metaio, Wikitude, and ARToolKit, were compared for marker generation, recognition target types, tracking feature, and supported content overlay. In Reference [
17], seven AR frameworks were compared to develop an AR application to provide geospatial information, such as housing addresses. Thus, their main interest was location-based AR, unlike other studies. Accordingly, they used some comparison criteria specific to their application requirements, including the display radius of AR content and whether it supports integration with other GIS applications. Some studies aimed to compare AR frameworks for the purpose of developing AR-based educational applications. In Reference [
18], 11 AR frameworks were compared, and one of the main comparison criteria was whether to provide AR content creation and editing features for application development. According to the results, Wikitude and Vuforia have been reported to meet their requirements best. The latest study [
19] compared three AR frameworks (ARKit, ARCore, and Vuforia) to assess recognition and tracking features similarly to the previous studies. They also introduced an example of chemistry education application. To our knowledge, this study is the first work to examine and compare multiple commercial AR frameworks in terms of target recognition and tracking performance in a grocery store environment.
3. Experimental Setup
3.1. AR Frameworks Used for Comparison
For performance comparison, we selected three well-known commercial AR frameworks (Vuforia, ARCore, and MAXST) to support the Android platform. Vuforia is the industry’s most advanced and widely adopted AR framework. ARCore is the AR framework by Google. MAXST is the AR framework provided by a leading AR software vendor in Korea.
3.2. Performance Metrics
In this paper, we target the recognition performance of mobile AR frameworks since recognizing objects is the most essential feature of the AR frameworks. The recognition performance can be affected by multiple factors, such as distance, viewing direction, and occlusion. Thus, we use the following four performance metrics to compare the performance of the selected AR frameworks: the maximum recognizable distance, the minimum recognizable viewing angle, the maximum recognizable occlusion, and the maximum number of targets for simultaneous recognition and tracking. First, the maximum recognizable distance refers to from how far the target object is recognized. The longer the distance, the better the performance. Second, the minimum recognizable viewing angle is used to assess the recognition performance when looking at the object obliquely from an angle other than the front of the object (90 degrees). The closer the minimum recognizable viewing angle is to 0 degrees, the better the recognition performance. Third, the maximum recognizable occlusion is the ratio of occluded area acceptable to recognize the object while some part of the object is not visible. The greater the ratio, the better the performance. Fourth, the maximum number of targets for simultaneous recognition and tracking refers to how many objects can be recognized and tracked at the same time. The larger the number, the better the performance.
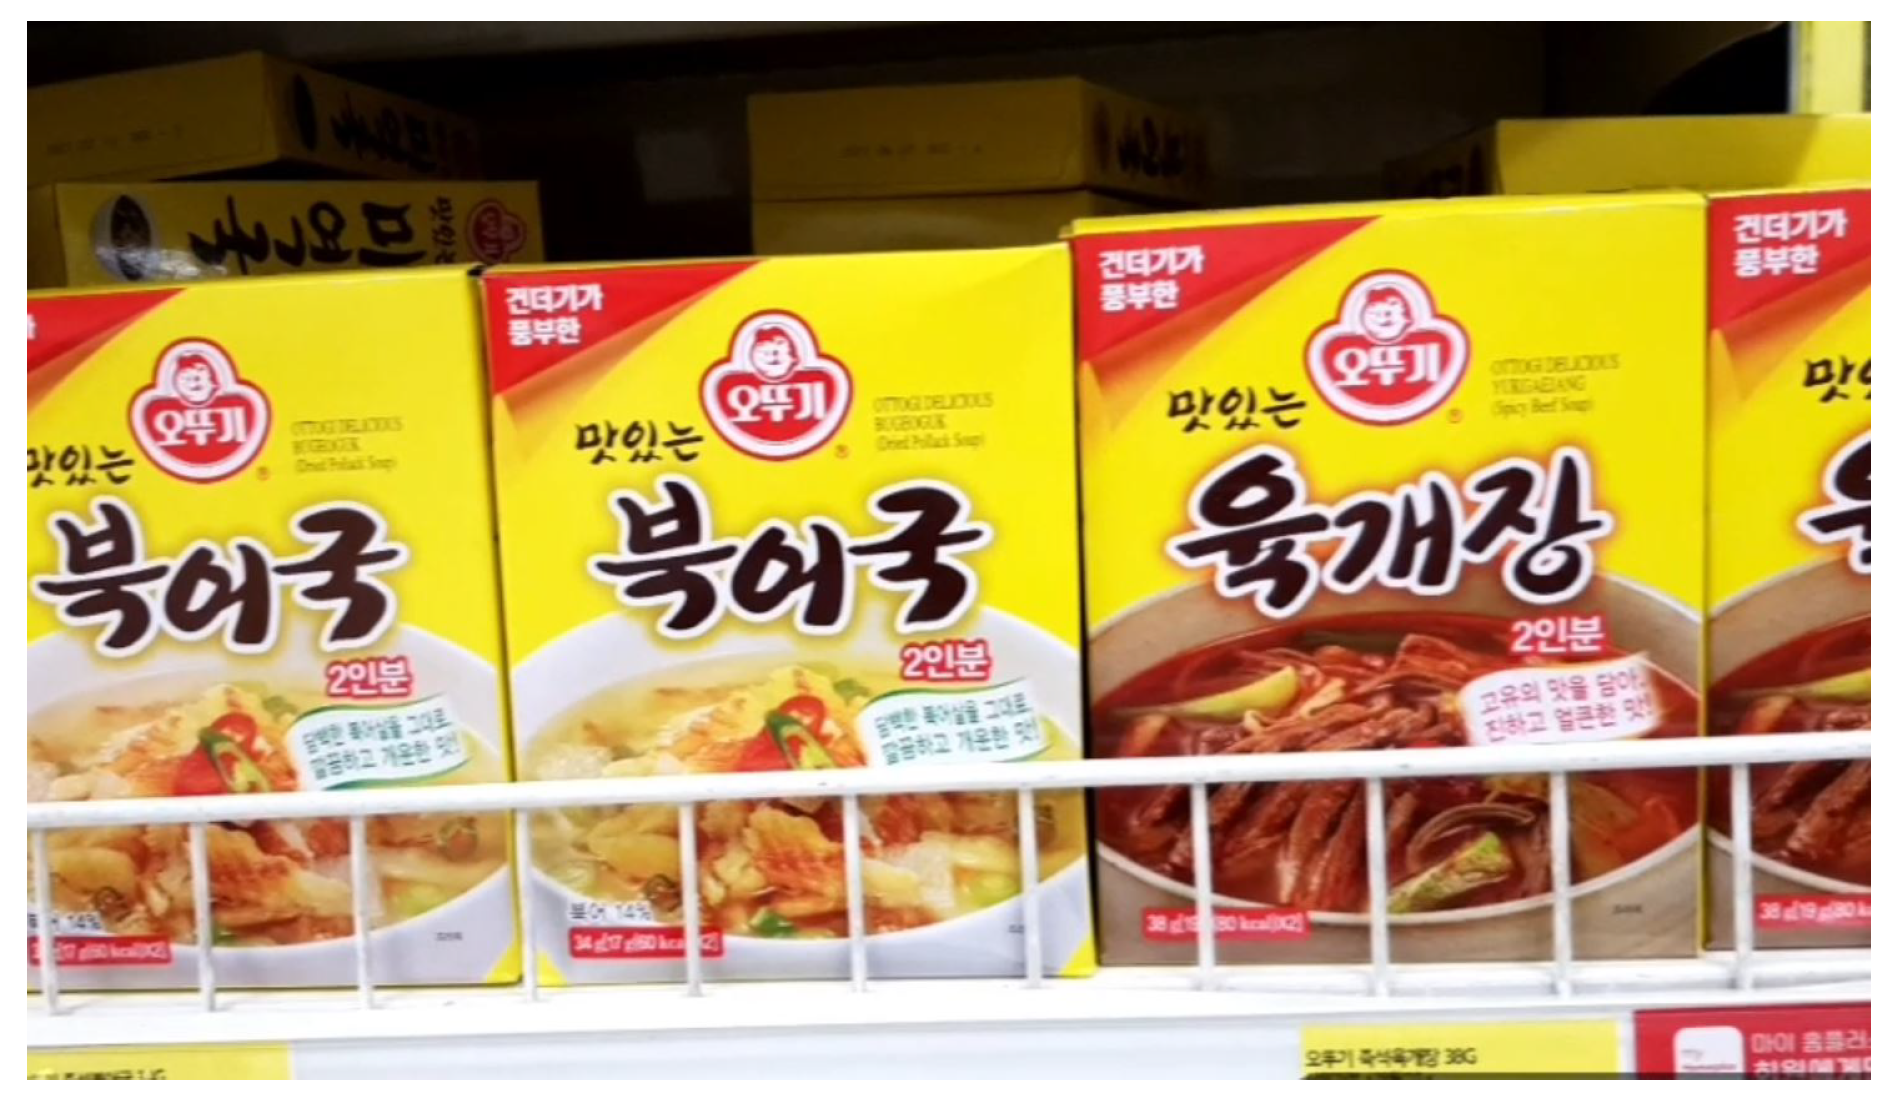
3.3. Target Products
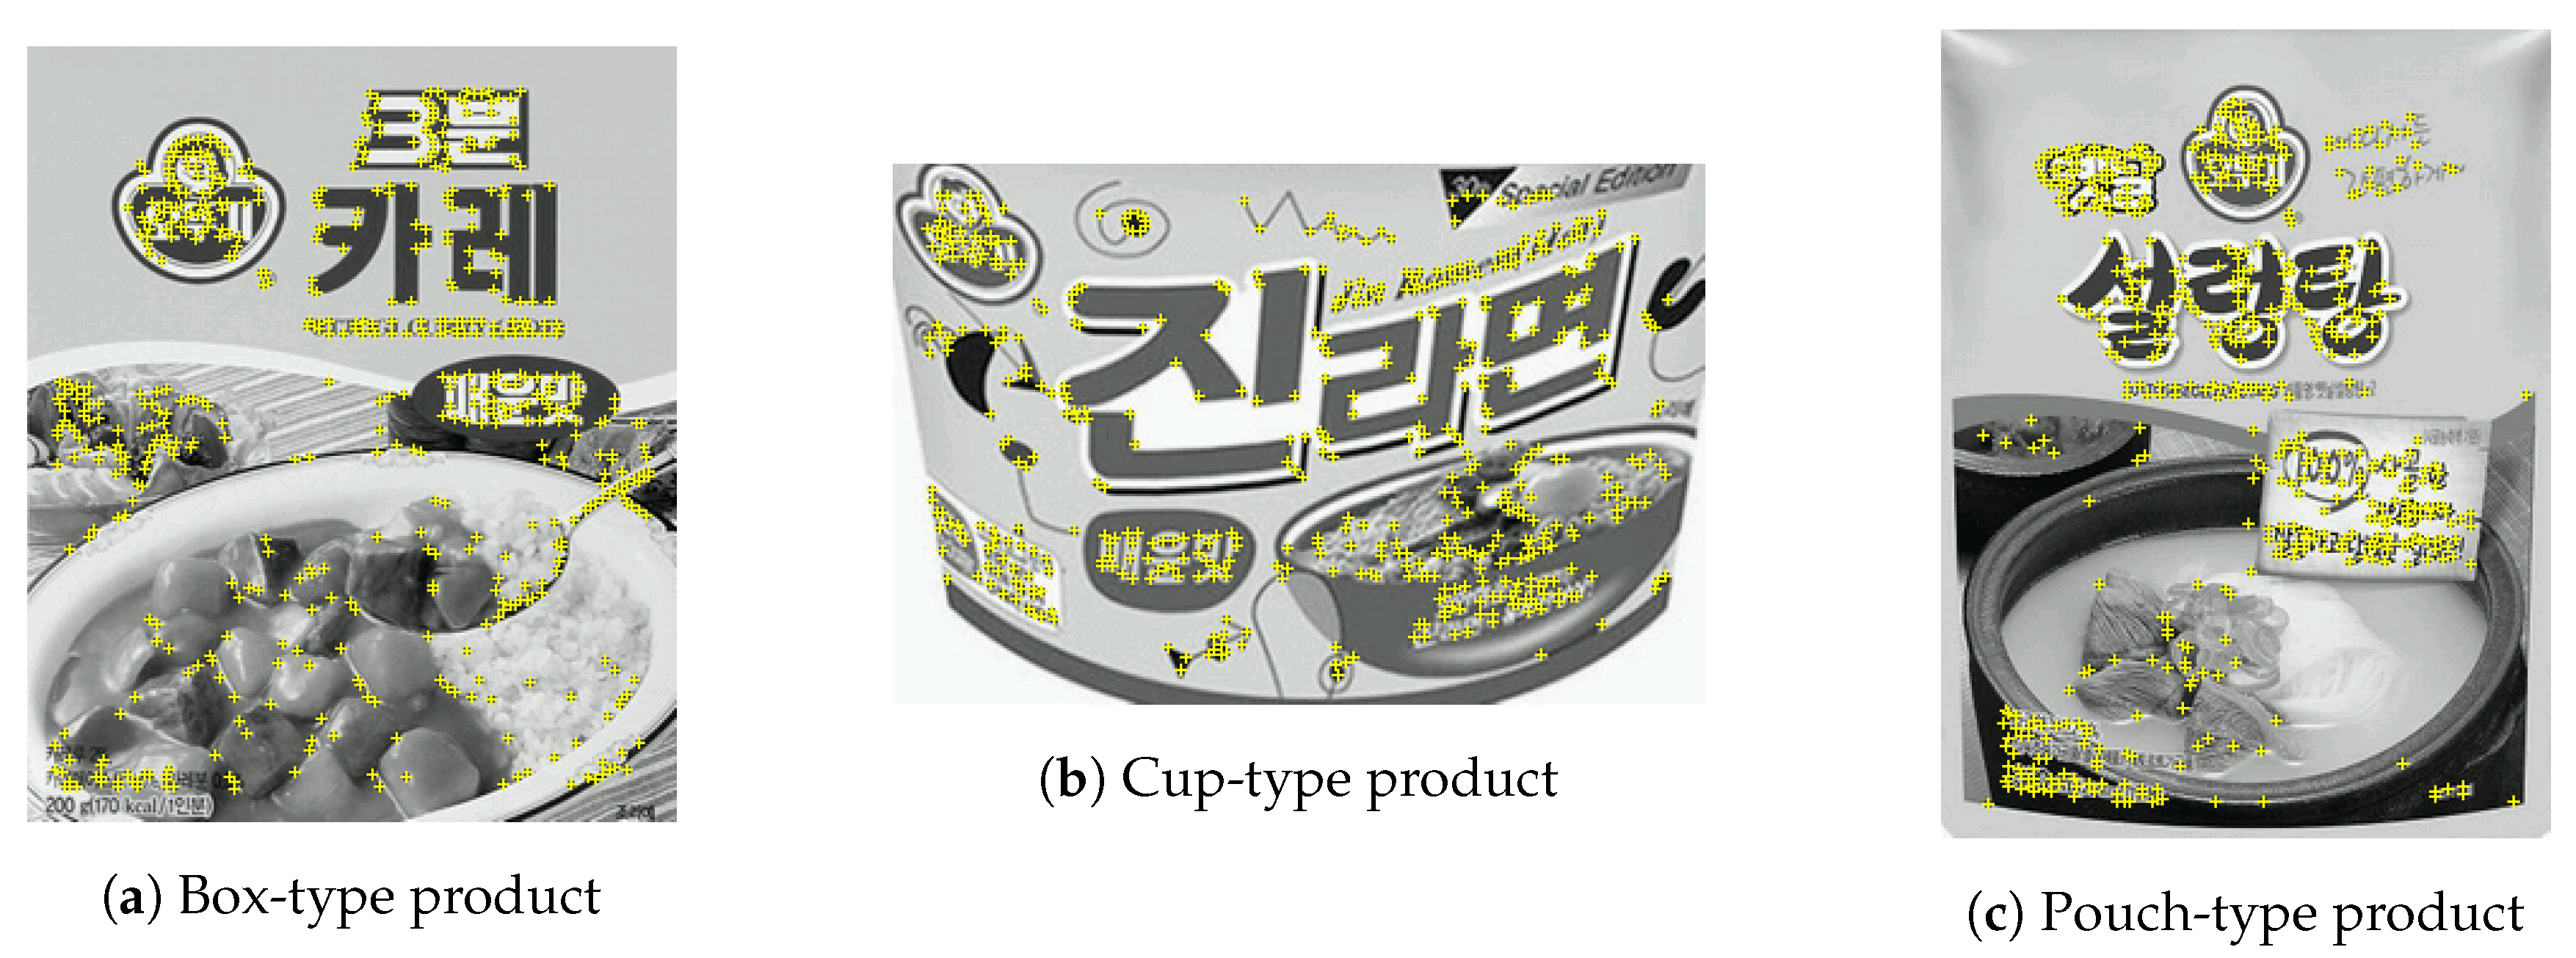
To measure the recognition performance of AR frameworks, we consider an application scenario that displays AR information related to a product when consumers purchase food items, such as HMR products at a grocery store. For our experiment, the target products should be selected first. Because there are many food brands and a large number of products in the market, it is necessary to limit the number of products. To eliminate the bias caused by the design of products during the experiment, we chose to use the uniform brand identity design and select one food product company in Korea, OTTOGI CO., LTD. We select HMR products of OTTOGI for target items used for our experiment.
To select target products, we consider the fact that the package, shape, and size of the product can affect the recognition performance. We first classify the representative product package types into three and select one product for each type. The three product groups used in the experiment and their products are listed in
Table 1. To allow the AR frameworks to recognize the product, we register the front image of the target product package as the target image in the AR framework used. The feature quality of the target image of each product used in the experiment is 100%; it is measured using the tool provided by Google ARCore.
Figure 1 shows an example of the feature points of the target image.
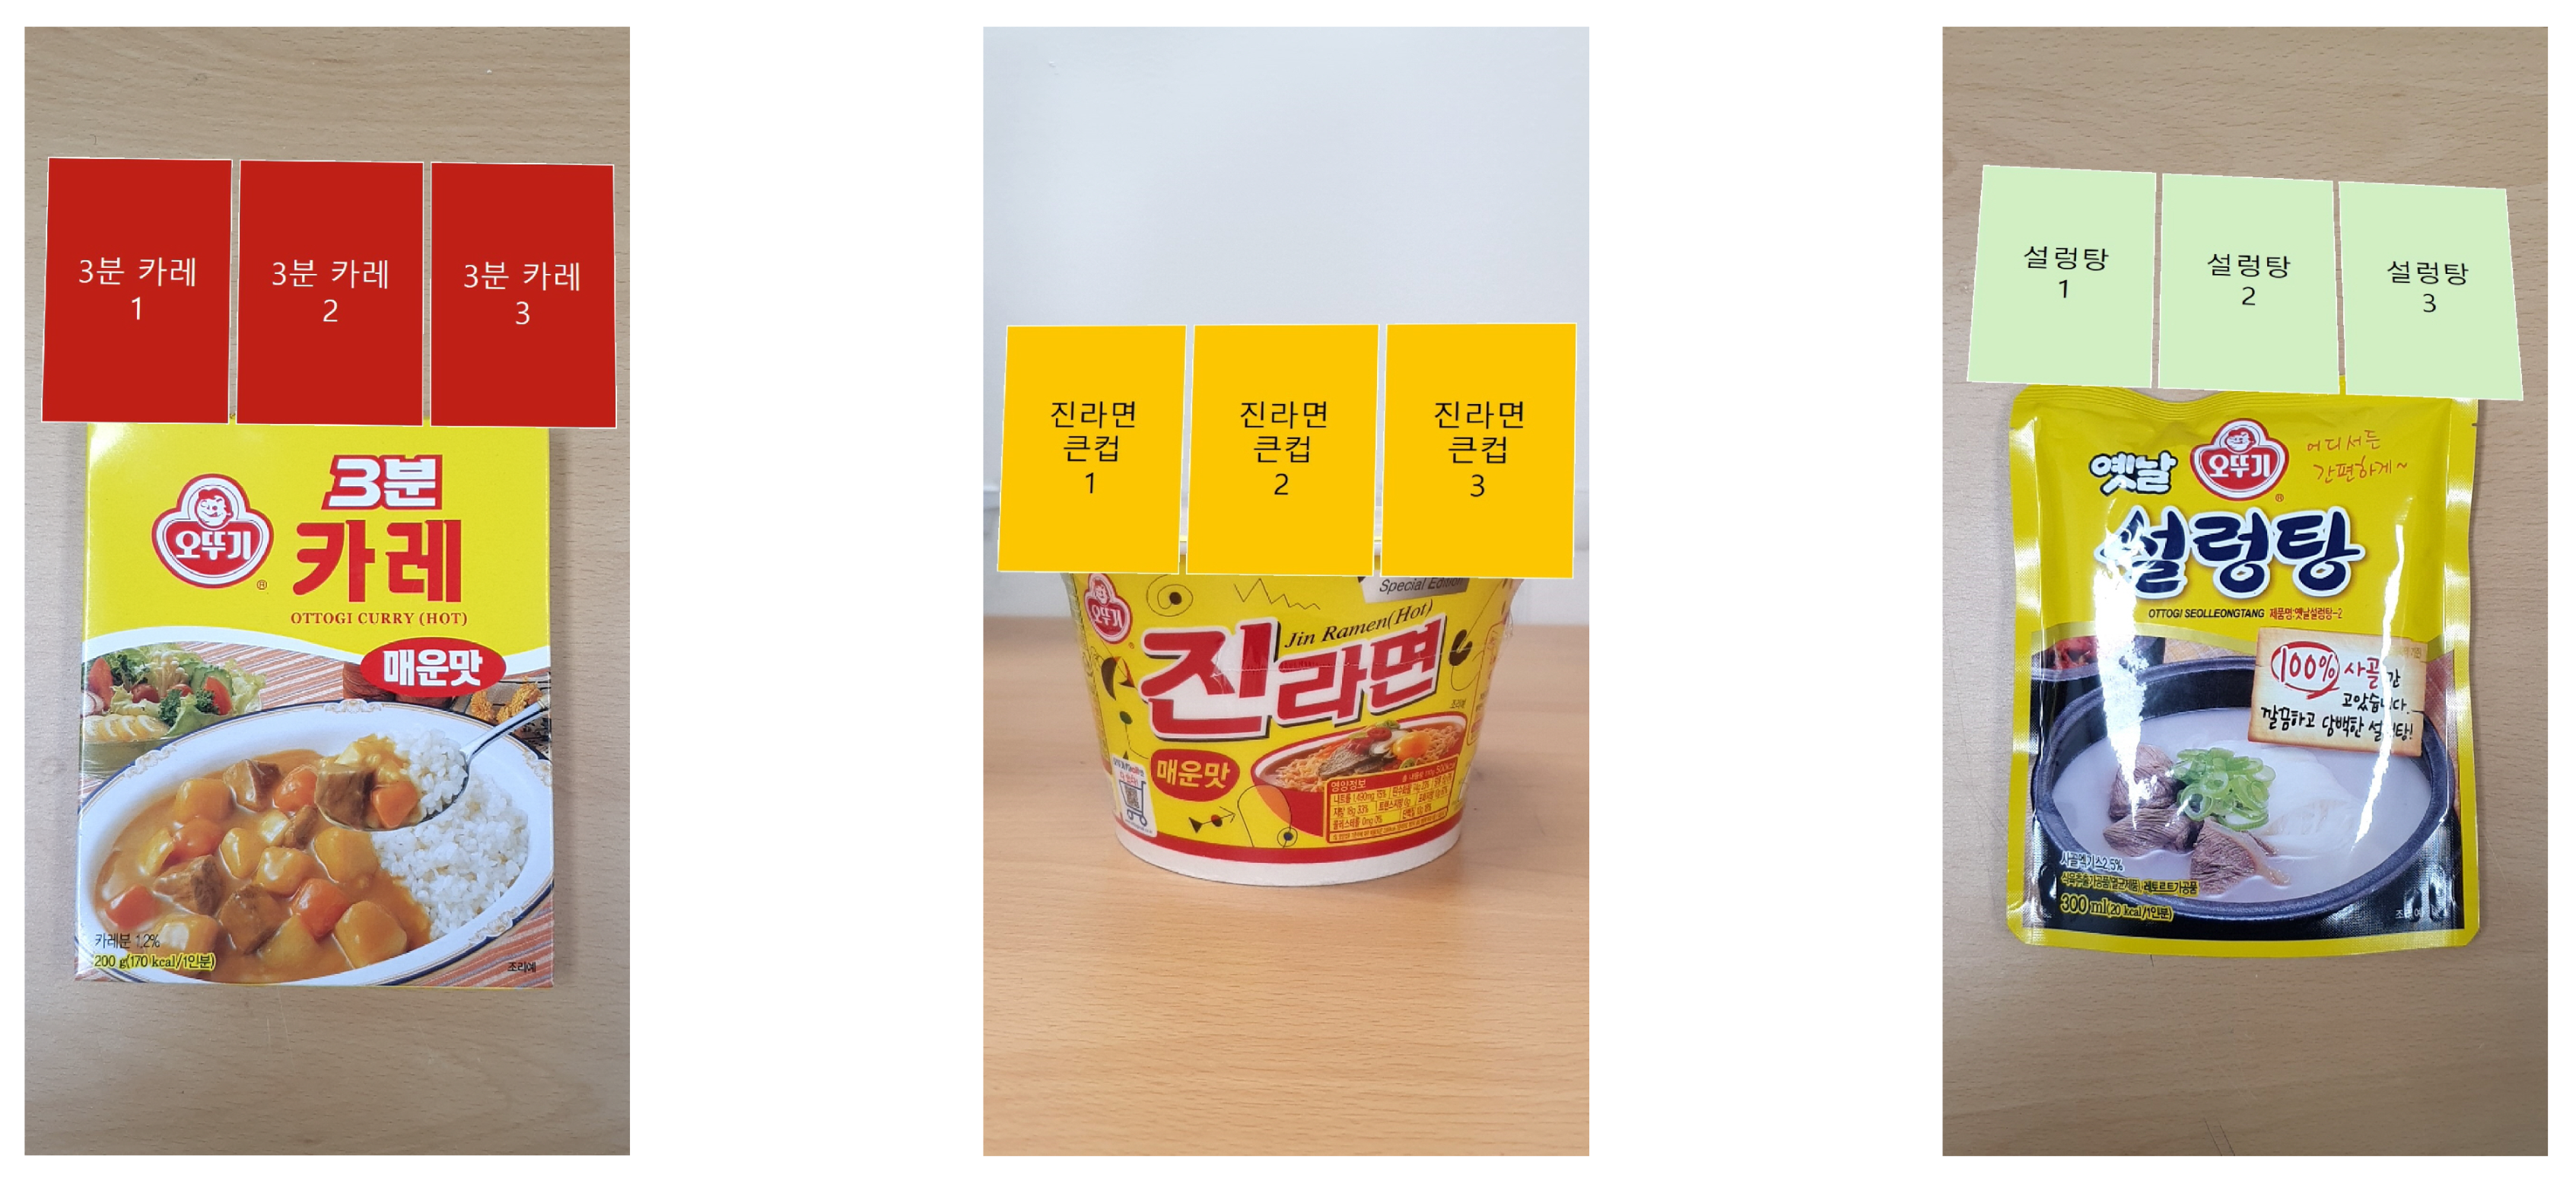
3.4. AR Content and Application
To check if the target products are well recognized by the AR frameworks, we use mobile AR applications developed with the frameworks. We assume that the product is recognized if AR content corresponding to the product is displayed on the applications. Because our goal is to measure the recognition performance, we make the AR content 2D images for ease of creation. We put the product names on 2D card images with different colors so that they are clearly distinguished, as shown in
Figure 2. The applications are developed based on Unity. All three AR frameworks used in the experiment support Unity-based application development. Accordingly, the AR content can be consistently displayed even if the AR frameworks used are different. The applications are run on Android smartphones. We use Samsung’s Galaxy S8 Plus for the experiment.
3.5. Experiment Environment
We conduct two experiments for performance comparison: a lab setting experiment and a real store experiment. The former is to examine and compare the three AR frameworks in terms of the aforementioned four performance metrics in a controlled lab environment. The latter aims to examine the performance in a real store environment and investigate potential issues that can arise in the real environment. In real stores, a large number of products are placed on shelves so that multiple targets can be simultaneously seen by a smartphone camera. In addition, a number of conditions might be different from those in the lab setting, such as the structure and size of shelves, as well as lighting conditions. In the next section, we present the experimental procedure and results for the lab setting experiment. In
Section 5, we discuss the real store experiment.
4. Lab Experiment
4.1. Experimental Method and Procedure
4.1.1. Maximum Recognizable Distance
We measure the farthest distance at which a target product is able to be recognized and the relevant AR content is shown. First, we position the smartphone running the aforementioned AR application in such a way that its back camera faces the front of the product at a far distance (i.e., 2 m) at which none of the three AR frameworks can recognize the product. Second, we move the smartphone gradually toward the product until the AR content for the product appears. Third, we record the distance between the smartphone and the product as the maximum recognizable distance of the used AR framework for that product. The distance measurement is performed five times under the same conditions, and we report their average value.
4.1.2. Minimum Recognizable Viewing Angle
We measure the smallest angle between the smartphone and a target product from which the AR content for the product can be shown (see
Figure 3). We assume that the angle from which the smartphone’s back camera faces the front of the product is 90 degrees and that from which the side of the product is seen is 0 degrees. For the measurement, we use a digital protractor. First, we fix the smartphone on the protractor so that the angle becomes 0 degrees. Second, we move the smartphone gradually toward 90 degrees until the AR content for the product appears. Third, we record the angle between the smartphone and the product as the minimum recognizable viewing angle of the used AR framework for that product. To examine the effect of the angle only, the distance between the product and the smartphone is fixed. The distance is set as the minimum average distance (about 30 cm) obtained from the previous experiment. The angle measurement is performed in two ways: one from the right side to the front and the other from the left side to the front. Similarly to the distance measurement, the angle measurement is performed five times under the same conditions and their average value is reported.
4.1.3. Maximum Recognizable Occlusion
This experiment is to investigate the recognition performance in the situation in which a target product is occluded by obstacles. First, we position the smartphone in such a way that its back camera faces the front of the product while a target product is completely covered with a paper sheet. Second, we move the sheet gradually so that the target product is revealed little by little until the AR content appears on the smartphone screen. Third, we measure the ratio of the product package area occluded by the sheet. Because the target product is not fully symmetrical, there may be a difference in the recognition performance depending on the visible part of the product. Thus, we perform the measurement in two ways: one moving the paper covering the target product from the bottom to the top and the other moving it from the left to the right. To examine the effect of occlusion only, the angle between the smartphone and the product is fixed to 90 degrees and the in-between distance is fixed as the same value as in the previous experiment. Similarly to the previous experiments, the measurement is repeated five times under each condition and their average value is reported.
4.1.4. Maximum Number of Simultaneous Recognition and Tracking
This experiment investigates how many target products can be simultaneously recognized. For this purpose, we use five different kinds of box-type products, including four other products in addition to the 3-min curry product used in the previous experiments. We include two items for each kind of box-type product and use a total of 10 items.
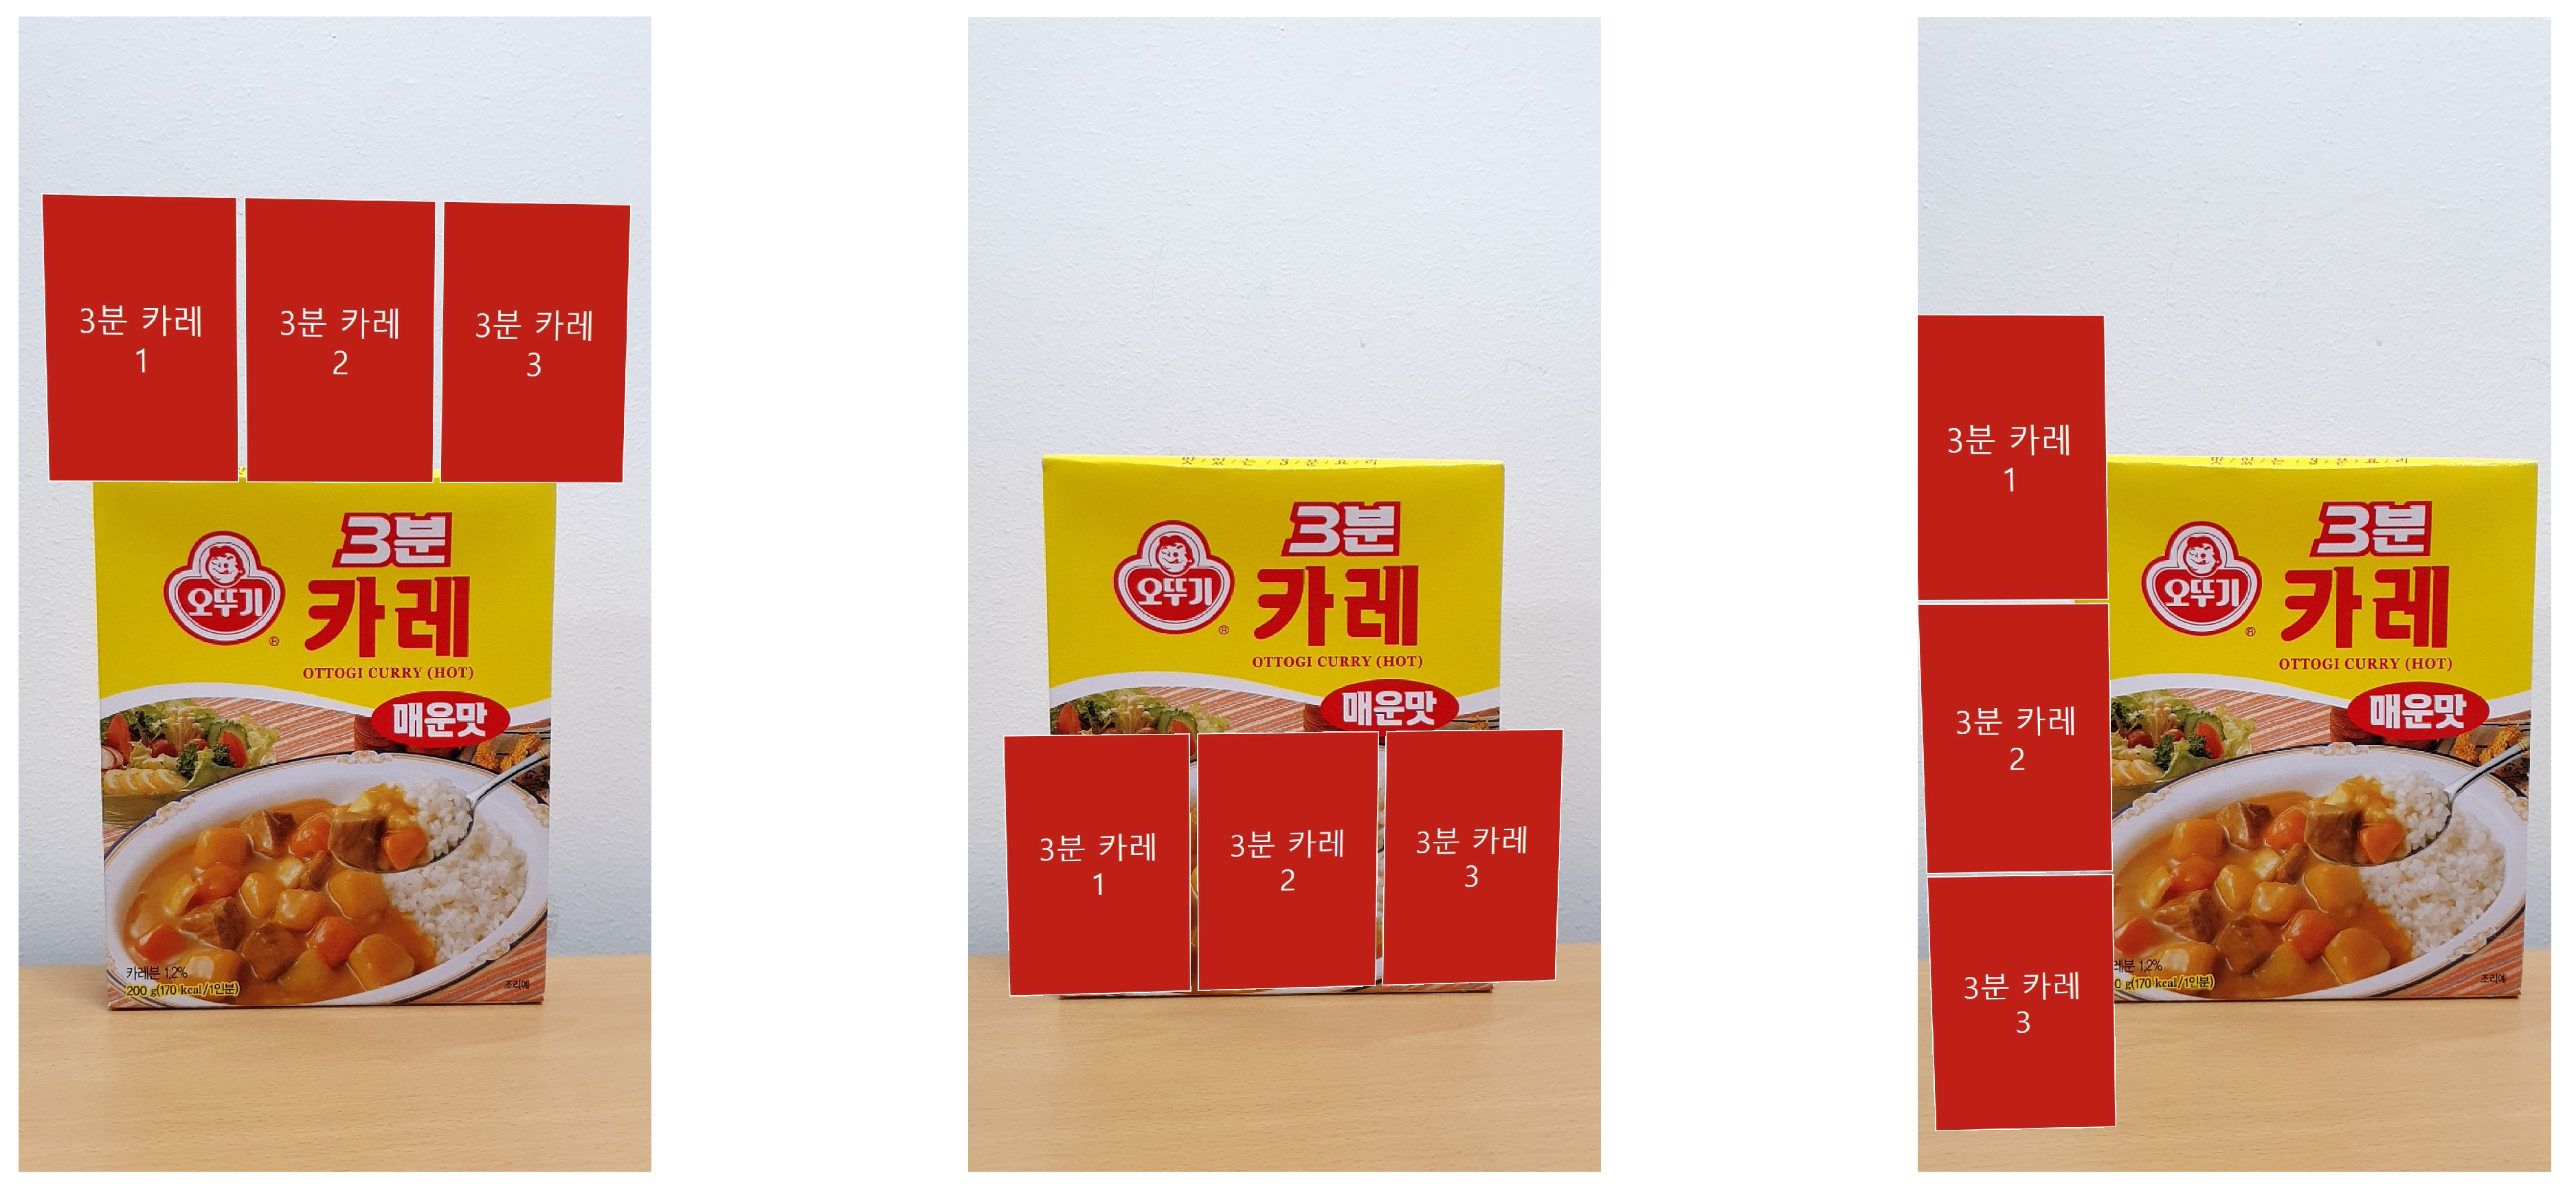
The number of products seen by the smartphone camera can vary depending on the distance between the smartphone and the product, the orientation of the smartphone, and the arrangement of the product. In this experiment, we focus on examining the effect of the orientation and the product arrangement while the distance is fixed. Accordingly, we consider four experimental conditions: two product arrangements and two smartphone orientations. The product arrangement includes the horizontal arrangement condition, where the 10 items are arranged in two rows, and the vertical arrangement condition, where nine of them are arranged in three rows and one is on the top of them. The smartphone orientation includes the vertical and horizontal orientations. In addition, we test the different positions of AR content displayed in the application to identify issues that may occur in the condition that multiple products are recognized and many AR contents are displayed simultaneously. For this purpose, we make three versions of applications. As shown in
Figure 4, the AR card images are shown in each of three positions: the top, bottom, and left side of the product.
The procedure is as follows. First, we put the ten items on a table and the smartphone at a distance of 70 cm from the items, which is the smallest average distance among the maximum recognizable distances for the box-type product. Second, we execute the AR application for 10 s so that the items can be seen by the camera and the AR content can be displayed. Third, we count the number of AR card images shown over the items. We repeat this measurement three times under the same condition for the product arrangement, the smartphone orientation, and the AR content position. Thus, in each case of the same product arrangement and smartphone orientation, the measurement is performed nine times.
4.2. Results
4.2.1. Maximum Recognizable Distance
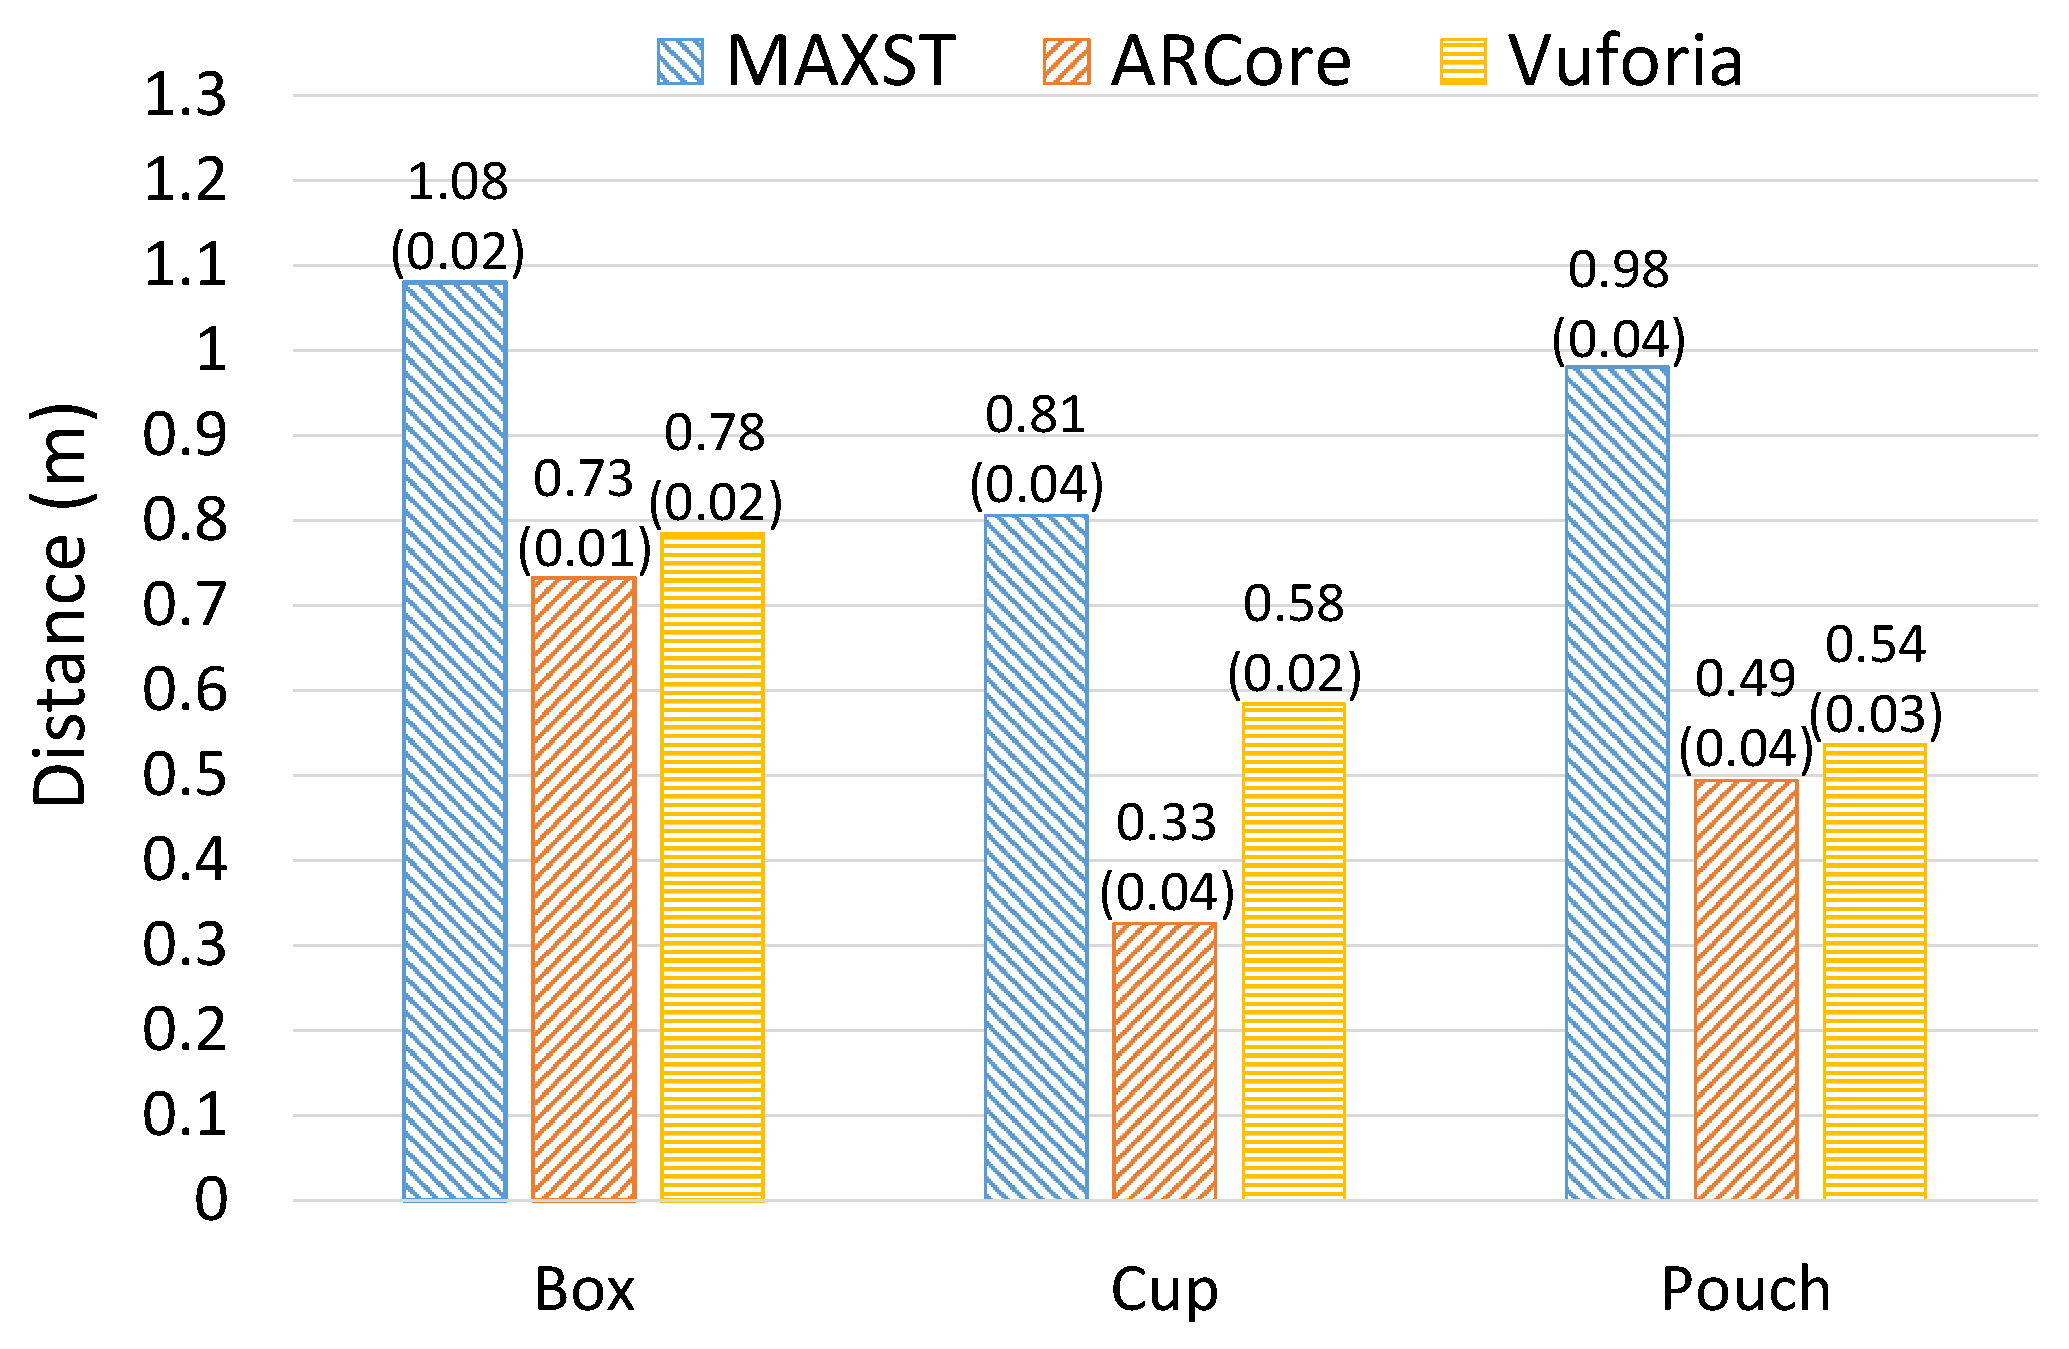
As shown in
Figure 5, MAXST achieves the longest average distance while ARCore shows the shortest average distance for the maximum recognizable distance. In addition, we can see the difference among the product types. In the case of MAXST, the distance varies from 0.806 m to 1.08 m on average. Vuforia shows a distance from 0.536 m to 0.784 m on average, while that of ARCore is from 0.326 m to 0.732 m. The box-type product with MAXST shows the longest distance of 1.08 m and the cup-type product shows the shortest distance of 0.326 m with ARCore. The package of the cup-type product is curved and its target image size is relatively small, so the distance is shorter than that of other products.
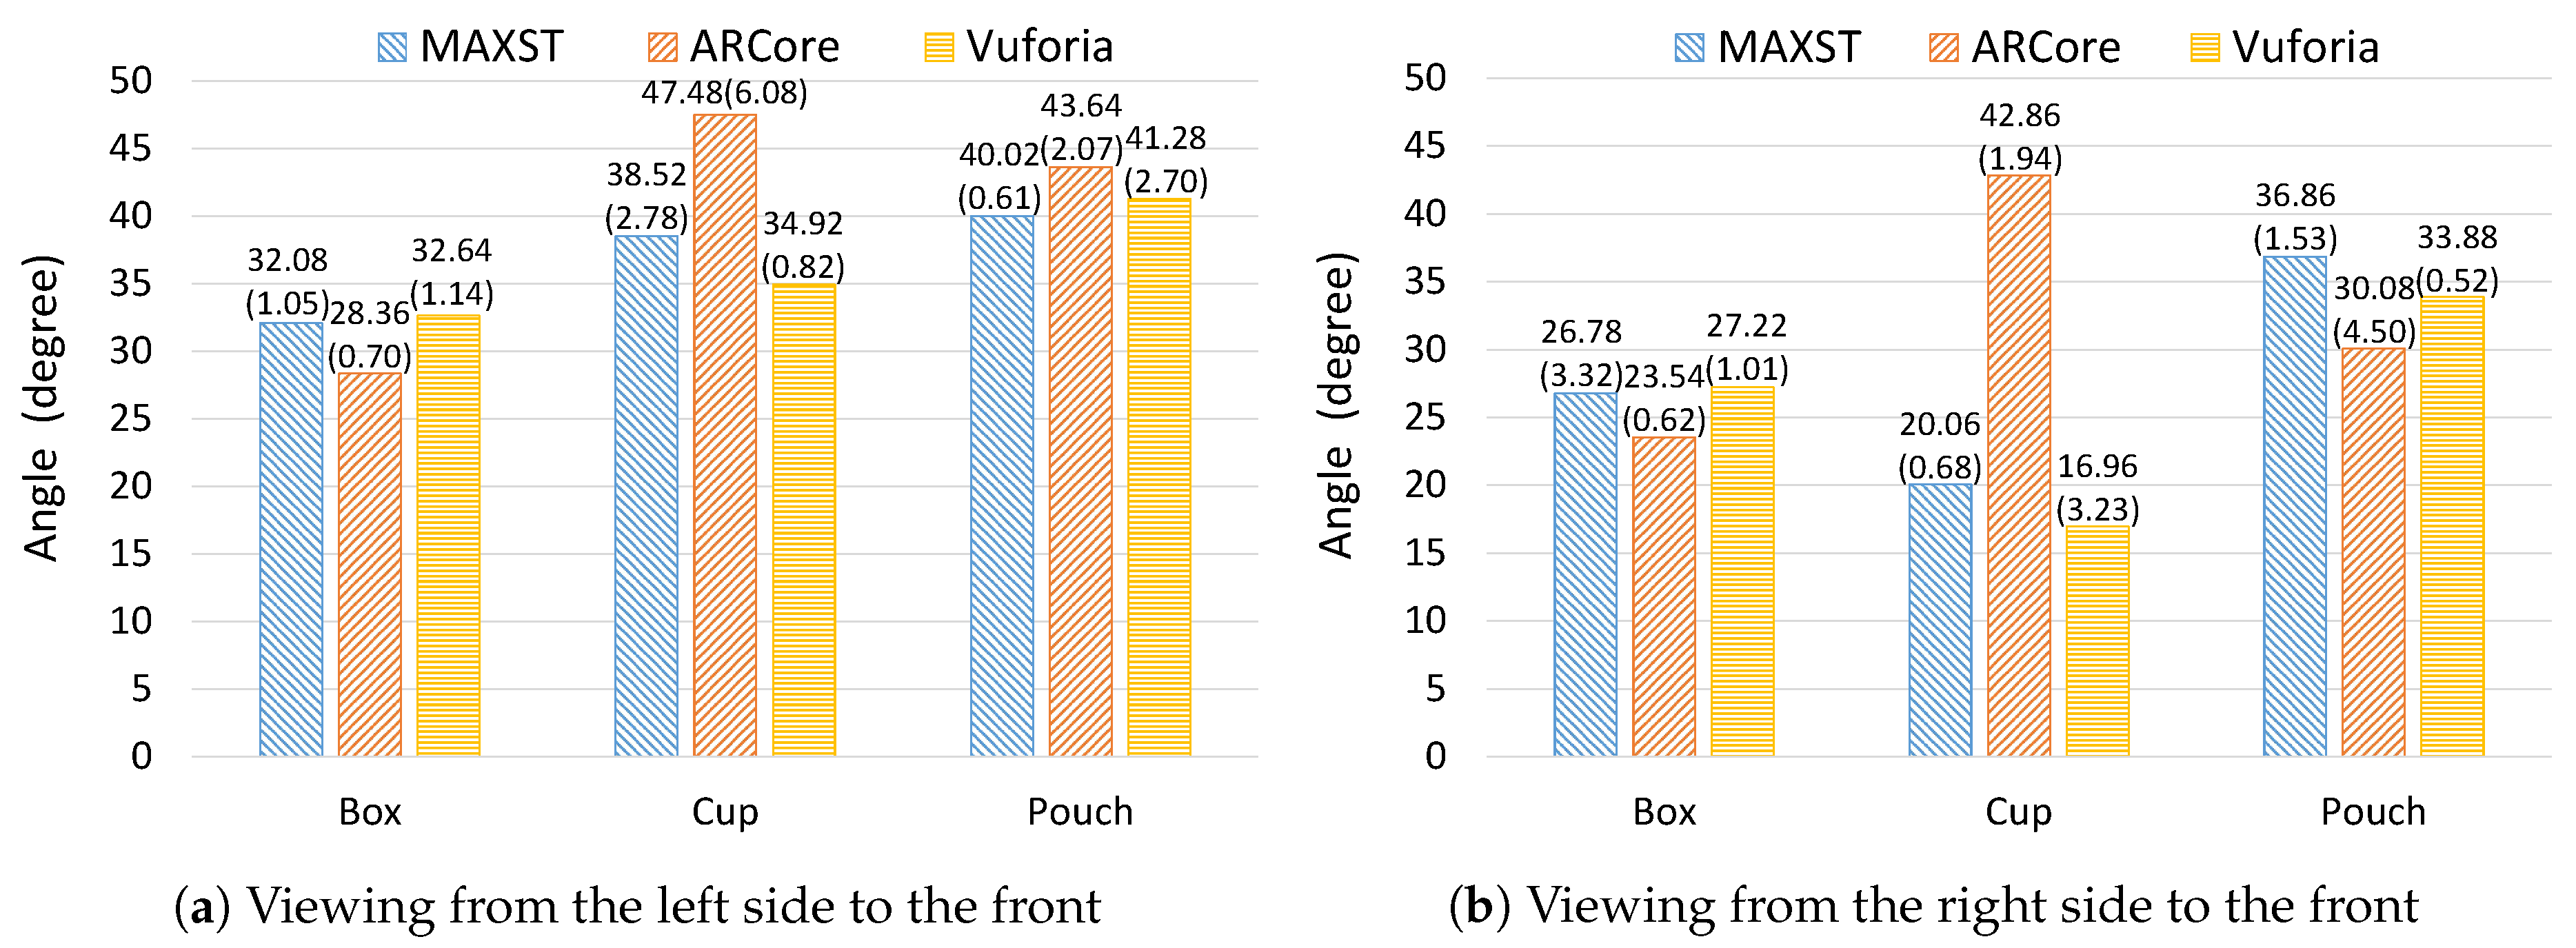
4.2.2. Minimum Recognizable Viewing Angle
For the minimum recognizable viewing angle, there are no noticeable differences among the three AR frameworks, except for the cup-type product. The average minimum angle is 31.2 degrees (SD: 7.8 degrees) with Vuforia, which is the smallest. That of MAXST is 32.4 degrees (SD: 7.3 degrees), while ARCore shows 36 degrees (SD: 9.6 degrees). As shown in
Figure 6, there are differences depending on the products. On average, the box-type product shows a relatively small angle, which means it can be recognized well even from the oblique angle. The cup-type product has a relatively large difference depending on the AR framework used.
The viewing direction also impacts the recognition performance. Overall, the angle decreases in case of viewing from the right side to the front of the product; the largest decrease, which is almost 20 degrees, is seen for the cup-type product when MAXST is used. We conjecture that the distribution of feature points affects the recognition performance. The right side of the cup-type product package contains an image and text where relatively many feature points are located compared to the left side. Therefore, even if the angle is small, the possibility of recognizing the product is higher than on the left side. In the case of box- or pouch-type products, the angle from the right to the front direction is smaller than that of the left to the front direction, but the difference is not large compared to the cup-type product. This is mainly because the feature points of the product images are not located on either the left or right side but relatively evenly distributed.
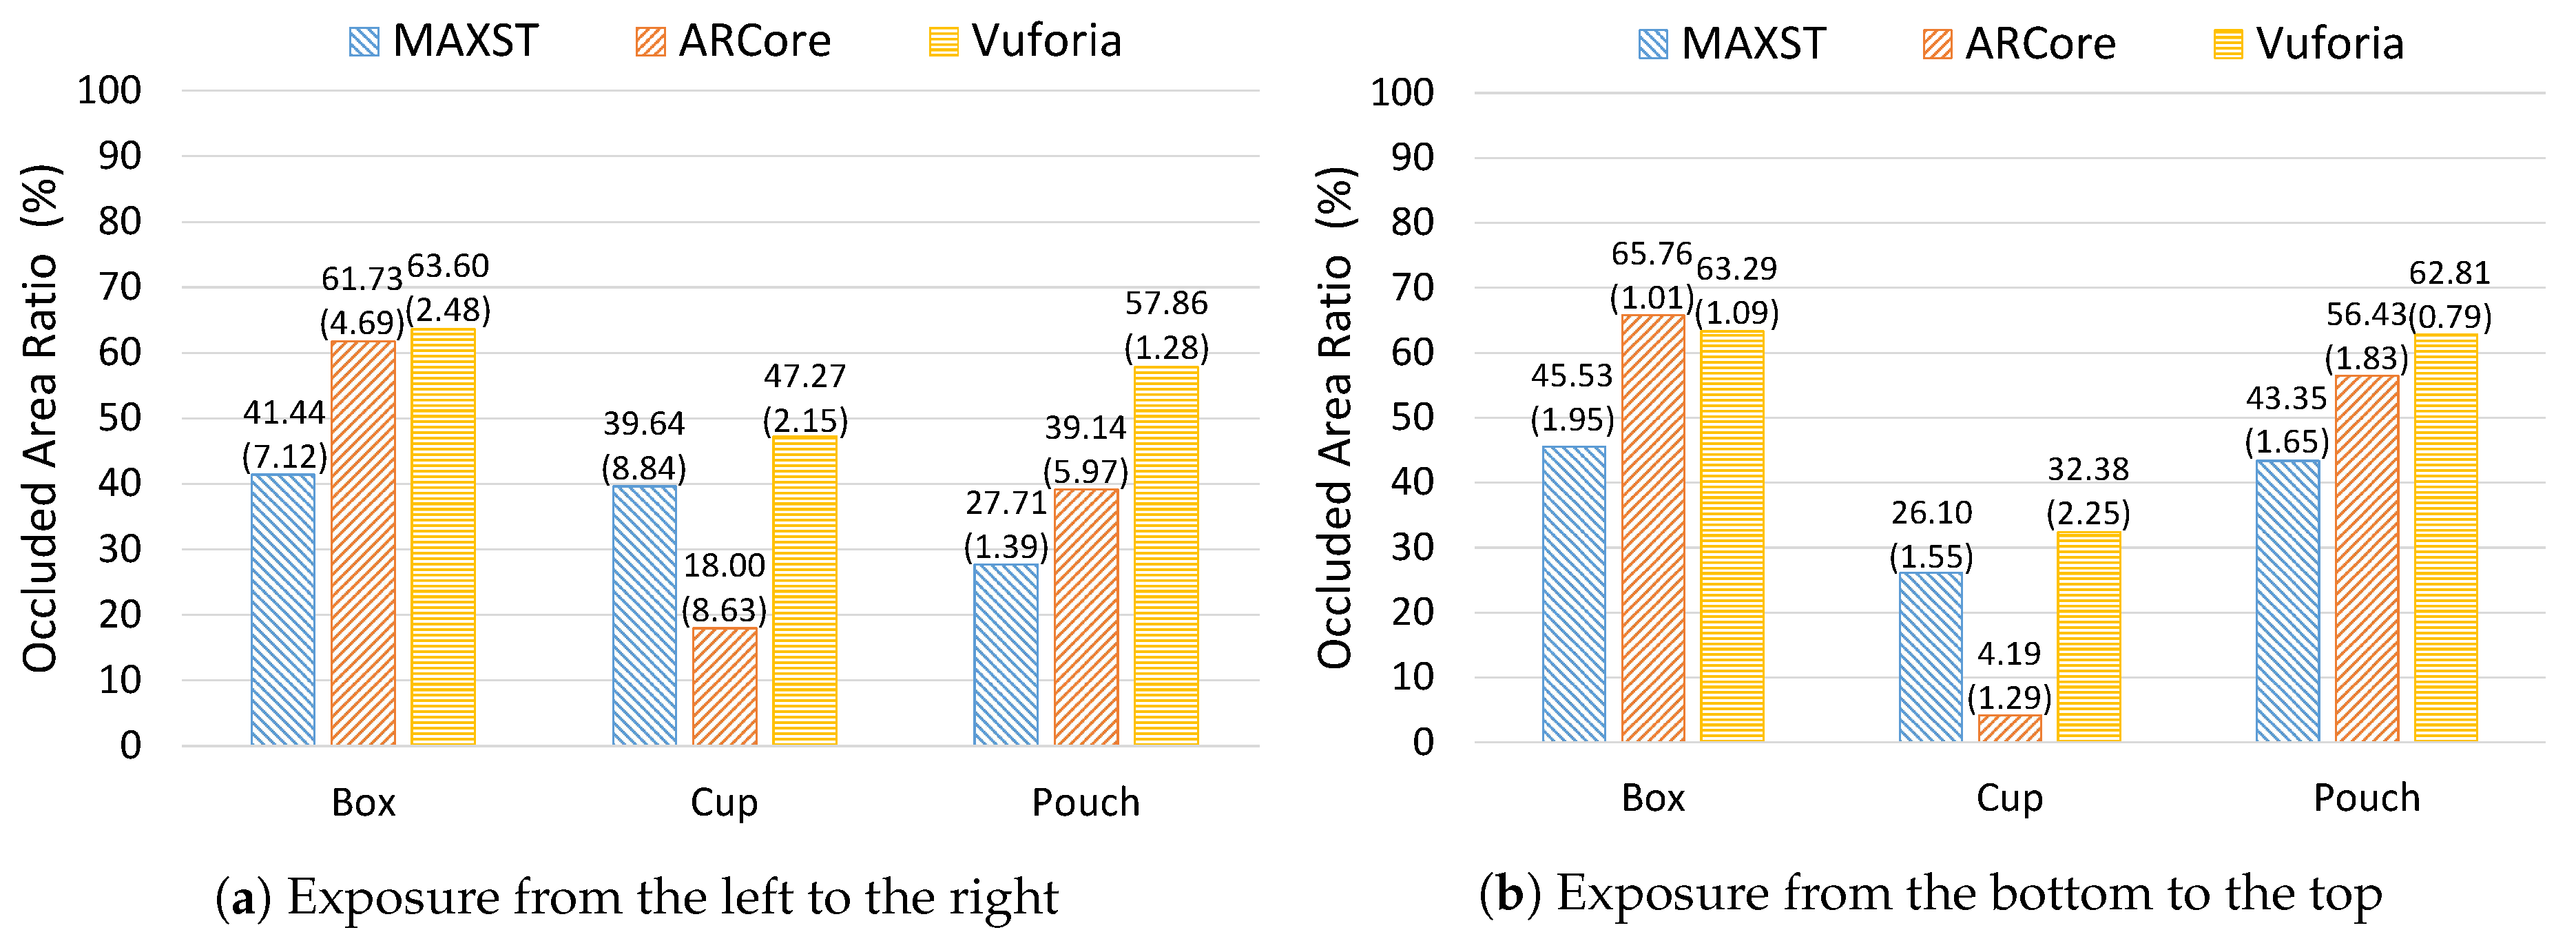
4.2.3. Maximum Recognizable Occlusion
Overall, Vuforia is more robust to the occlusion compared to the others (see
Figure 7). It is able to recognize the product even when the hidden target image area is 54.5% on average (SD: 11.6%). The average ratio of ARCore is 40.9% (SD: 23.5%), while that of MAXST is 37.3% (SD: 9%). Similar to the previous results, the cup-type product shows low performance compared to other products.
In addition, the result is affected by the direction in which the product begins to be exposed. The cup-type product shows the largest difference. It is recognized after more of the product is seen when the paper sheet is moved from the bottom to the top than when it is moved from the left to the right. In contrast, the pouch-type product shows noticeable increases for all the frameworks in the case of moving from the bottom to the top. The box-type product shows marginal increases or similar ratios. We conjecture that this is mainly because of the distribution of feature points of target images and the shape of the product packages.
4.2.4. Maximum Number of Simultaneous Recognition and Tracking
Table 2 shows the results of the maximum number of simultaneous recognition and tracking experiment. Vuforia’s overall performance is better than the others, while ARCore shows the worst performance. Vuforia and MAXST simultaneously recognize multiple products and display the AR content. In contrast, ARCore does not support simultaneous recognition, so it recognizes at most one target and shows the relevant AR content. Although Vuforia and MAXST support simultaneous recognition, both of them do not simultaneously display AR content for the same targets. Even if two of the same product are seen by the camera, AR content relevant to them is shown over only one of them. In the case of Vuforia, when five distinct products out of ten are seen by the camera, all of them are recognized. However, MAXST has the limitation that at most three targets are simultaneously recognized.
The number of products simultaneously seen by the camera and the number of products simultaneously recognized are different depending on the product arrangement and smartphone orientation. In the case of horizontal arrangement and horizontal orientation, MAXST recognizes three products, which is the maximum number of simultaneous recognition in many trials. However, it recognizes only one target three times out of 9 trials. When the phone’s orientation is vertical, MAXST tends to recognize products in the middle, and only one or two are recognized. Vuforia well recognizes all of the distinct products seen by the camera at the same time. ARCore does not always successfully recognize a product, even though several distinct products are seen. It recognizes one target product only 2–5 times out of 9 trials. When the distance between the smartphone and the products is reduced to 50 cm, it is able to recognize a product better.
We examine potential issues that may occur when multiple products are simultaneously recognized and their relevant AR content is shown at the same time. Usually, the products on a shelf in a store are densely placed without much space between adjacent products. In such a condition, AR contents for different products are likely to overlap with each other, and thus some of them are not visible, as shown in
Figure 8. When the content is placed on the left or upper side of a product, adjacent products can be covered by the content. Thus, it may be difficult for users to check the products directly on the smartphone screen; users may have to move the smartphone to see the products. These issues can degrade the user experience of AR applications.
5. Real Store Experiment
To examine the performance in a real environment and problems that may occur when multiple targets are simultaneously recognized, we conduct experiments with actual products displayed for sale in a grocery store. In the store experiment, we use MAXST and Vuforia, which showed similar performance in the previous experiment; we exclude ARCore because we find it difficult to use in the real store environment due to its low performance.
5.1. Experimental Method and Procedure
5.1.1. Measurement with Different Distances
We conduct an experiment to measure the recognition performance at different distances to check whether the products are well recognized at the proper distance when a user uses the application developed with the AR frameworks in a real store. The products used in the experiments include all three types of products; the box-type products and the pouch-type products show relatively good performance in the lab setting experiment, while the cup-type products show relatively poor performance. The number of products used in the experiment is 16 cup-type products, 10 box-type products, and 14 pouch-type products. As in the lab setting experiment, the experimental AR application is implemented; we register product package images as targets in advance and create AR contents for each product.
The experiment is carried out in three distance conditions. While 1 m and 60 cm distances are commonly tested for all the products, the cup-type products with short recognizable distance are tested for the distance of 35 cm, and the box-type and pouch-type products with longer recognizable distance are further tested for the distance of 50 cm. The measurement is performed nine times in total, three times each using three versions of the application with different AR content layouts, similarly to the previous lab setting experiment. In this experiment, we assume that the user moves a smartphone running the AR application while scanning the product with the application in the store. Thus, an experimenter scans the product while keeping the same distance and moving to the side rather than recognizing the product in a fixed position.
5.1.2. Measurement with Different Levels of the Shelf
When a user scans products placed on a shelf using a smartphone, the products placed on the bottom of the shelf may not be recognized well because they are viewed obliquely. To examine the effect of the position of products, we conduct an experiment to examine the recognition performance depending on the shelf level. We use a box-type product for this experiment. We check whether a target product is recognized when placed on each level of the shelf. The shelf has seven levels at heights of 20 cm, 40 cm, 70 cm, 90 cm, 120 cm, 140 cm, and 162 cm, respectively. The smartphone is fixed at a height of 130 cm and a distance of 50 cm from the shelf. We angle the smartphone so that the product on each shelf is centered in the field of view of the camera, and we check whether the product is recognized or not.
5.2. Results
5.2.1. Performance Depending on the Distances
In the case of box-type products, both MAXST and Vuforia show similar performance, except at a distance of 1 m, as shown in
Table 3. At a distance of 1 m, a total of 16 products are caught on the camera, but there are about 6 different target products among them. This is because many of the same products are arranged in succession. The application using MAXST recognizes up to three products, while one with Vuforia does not recognize any products because the distance is beyond its maximum recognizable distance. In contrast, at 60 cm and 50 cm distance, MAXST and Vuforia recognize one or two different target products when about 5 products are viewed by the camera. We find that sometimes the AR content that does not match the product is shown when scanning products while moving a smartphone. This happens when the images of product packages are similar. Such a wrong recognition occurs relatively more when using MAXST than Vuforia.
In the case of pouch-type products, MAXST and Vuforia show similar trends (see
Table 4). At 1 m distance, a total of eight different target products are viewed. In most cases, they are not well recognized by MAXST, and sometimes only one product is recognized. At 60 cm and 50 cm, two or three different target products are visible and all of them are recognized. On the other hand, Vuforia does not recognize products at a distance of 1 m, but it does recognize two or three different target products at 60 cm and 50 cm. Similar to the box-type product, there are some cases in which both AR frameworks sometimes misidentify the products and display the AR content of other products.
Both AR frameworks also show similar performance for the cup-type products, but the performance is relatively low compared to other products, as shown in
Table 5. This is mainly because the package of the cup-type products has a curved surface, and the target images are relatively small in size. At 1 m distance, neither framework recognizes any of the products. At 60 cm distance, a total of three different target products are viewed by the camera, but only one product is recognized by both frameworks. At 35 cm distance, two different target products are visible and both of them are recognized by the two frameworks. Similarly to the other products, the problem of misrecognizing similar products occasionally occurs.
5.2.2. Performance Depending on the Shelf Levels
The recognition performance of the two AR frameworks varies depending on the position of the product. Products above the fourth shelf level are well recognized by both of the frameworks. However, products below the fourth level fail to be recognized in some cases. The application using MAXST recognizes all products except for those on the first level, while the application using Vuforia does not recognize products on the first level to the third level. We conjecture that MAXST is able to recognize products on the lower levels because its maximum recognizable distance is longer. In the lab setting experiment, MAXST showed a maximum recognizable distance of 110 cm on average for the box-type product, while that of Vuforia was less than 80 cm. In this experiment, the distance between the smartphone and the product on the third level is about 80 cm and the viewing direction of the smartphone camera is also oblique. Thus, we consider that Vuforia does not well recognize the product on the third level or below.
6. Discussion
Experimental results show that Vuforia and MAXST outperform ARCore. MAXST shows the best performance in terms of the recognizable distance, while Vuforia is the second best. In terms of the recognizable viewing angle, they all show similar performance. For the robustness to occlusion, Vuforia is better than others, while MAXST and ARCore are similar. MAXST and ARCore are limited in terms of the number of targets that can be recognized simultaneously; only three and one can be recognized by MAXST and ARcore, respectively. Vuforia can recognize and track more targets simultaneously without such a limitation. Overall, we consider that Vuforia is relatively superior to the others.
In addition, we find issues that should be considered to realize the target application scenario in a real store environment. First, products that are similar or identical in product packaging but differ in size might not be correctly recognized. Second, due to the nature of the environment in which many products are displayed closely, the AR contents of the products next to each other may overlap with each other, or the content of one product may hide the other products. Third, the structure of the shelves can affect the recognition performance. We below discuss those issues in more detail.
Incorrect Recognition Cases. While the AR frameworks recognized the target products correctly in most cases, there were some cases in which products with similar packaging images and text were not recognized correctly, and they were recognized as other products. As mentioned earlier, the front images of product packages are used as target images to be recognized by the AR frameworks. If the feature points extracted from the images are similar, the products might not be correctly identified. In the case of the cup-type product, there is a problem that the same product with different cup sizes cannot be distinguished. There are cup-type products available in two sizes: large and small. In this case, the image of the cup package is the same regardless of the cup size. These issues may harm the user experience when a user uses a mobile AR application in a real environment, such as a grocery store. Thus, a solution to the incorrect recognition problem is needed to distinguish a number of similar products and display AR content correctly.
Overlap between AR contents or between AR contents and products. As discussed above, there is an issue that the AR contents shown over the adjacent products may overlap with each other when multiple neighboring products are recognized at the same time. Accordingly, some contents can be occluded by others and cannot be seen by users. In addition, there may be a situation in which the AR content over one product hides another adjacent product, making it difficult for a user to identify the product on the display. Usually, a large number of products are displayed closely in the grocery store environment. It is likely that multiple AR contents are displayed at the same time, and a user may be confused about which content corresponds to which product. To solve this problem, the AR content can be made smaller so that it is displayed only over the corresponding product area, not covering other products. In this case, however, the content might be too small for a user to see. Thus, it is necessary to appropriately design the AR content and application UI in consideration of the amount and characteristics of information to be provided so that the user experience is not compromised.
Shortened recognizable distance. Compared with the lab setting experiment result, the maximum recognizable distance is a bit shortened in the grocery store experiment. In the grocery store, there is a guardrail that prevents products from falling off the shelves, as shown in
Figure 9. To examine its effect, we make a guardrail-like object and measure the maximum recognizable distance of the box-type product again in a lab environment while placing the object in front of the product. We test two AR frameworks, MAXST and Vuforia, and find that the maximum recognizable distance is reduced by about 30% compared to the previous lab setting measurement. This is a similar result to that of the grocery store experiment. We conjecture that some feature points of the product image are covered by the guardrail so that it is not recognized well at the same distance, although it can be recognized at a shorter distance. In a real store environment, various conditions, such as the way products are displayed and the shape of shelves, may vary. Thus, careful consideration of such varying conditions should be taken into account during the process of application development and testing.
7. Conclusions
Many AR frameworks are now available and used to support mobile AR application development, such as ARCore and Vuforia. This paper measured and compared the object recognition performance of the commercial AR frameworks (i.e., MAXST, Vuforia, and ARCore) and identified issues that may occur in the actual application environment. For experiments, we assumed a situation in which a consumer purchases food products at a place, such as a grocery store, and we considered an application scenario in which AR content related to the products was displayed on a smartphone screen by recognizing such products.
We used four performance metrics to compare the performance of the selected AR frameworks. Experimental results show that Vuforia is relatively superior to MAXST and ARCore. MAXST shows the best performance in terms of the recognizable distance, while Vuforia is the second best. In terms of the recognizable viewing angle, they all show similar performance. For the robustness to occlusion, Vuforia is better than others, while MAXST and ARCore are similar. MAXST and ARCore are limited in terms of the number of targets that can be recognized simultaneously; only three and one can be recognized by MAXST and ARCore, respectively. Vuforia can recognize and track more targets simultaneously without such a limitation.
The limitation of the AR frameworks is also identified when they are used in the real grocery store environment. Products that are similar or identical in packaging but differ in size may not be correctly recognized. To develop applications to be used in a real environment, we need to consider such an issue carefully. In addition, due to the nature of the environment in which many products are displayed closely, the AR contents of the products next to each other may overlap with each other, or the content of one product may hide the other products. To address this problem, careful design of AR content and application UI will be required.


