Article

A Contemporary Novel Classification of Voltage Stability Indices

1
Department of Energy Engineering, Kabul University, Jamal Mina, Kabul 1006, Afghanistan
2
Strategic Research Projects Center, University of the Ryukyus, 1 Senbaru, Okinawa 903-0213, Japan
3
Department of Electrical & Electronics Engineering, University of the Ryukyus, 1 Senbaru, Okinawa 903-0213, Japan
4
Department of Electrical & Electronics Engineering, Kabul University, Jamal Mina, Kabul 1006, Afghanistan
5
Department of Electrical and Computer Engineering, University of Texas at El Paso, El Paso, TX 79968, USA
*
Author to whom correspondence should be addressed.
Submission received: 14 January 2020 / Revised: 18 February 2020 / Accepted: 21 February 2020 / Published: 29 February 2020
(This article belongs to the Special Issue Voltage Stability)

Abstract

:
Within the framework of this study, the inductive analysis of voltage stability indices’ theoretical formulation, functionality, and overall performances are introduced. The prominence is given to investigate and compare the original indices from three main dimensions (formulation, assessment, and application) standpoints, which have been frequently used and recently attracted. The generalizability of an exhaustive investigation on comparison of voltage stability indices seems problematic due to the multiplicity of the indices, and more importantly, their variety in theoretical foundation and performances. This study purports the first-ever framework for voltage stability indices classification for power system analysis. The test results found that indices in the same category are coherent to their theoretical foundation. The paper highlights the fact that each category of the indices is functional for a particular application irrespective of the drawback ranking, and negated the application of the Jacobian matrix-based indices for online application. Finally, the research efforts put forward a novel classification of voltage stability indices within the main three aspects of formulation, assessment, and behavior analysis in a synergistic manner as an exhaustive reference for students, researchers, scholars, and practitioners related to voltage stability analysis. The simulation tools used were MATLAB® and PowerWorld®.

1. Introduction

Day-by-day, increase in electricity demand and liberalization policy of the electricity markets persuade the power systems to operate close to their stability limits. Despite, voltage instability in a system can swiftly lead the power system to the voltage collapse. A blackout can take place in the entire power system or a part of a system due to voltage collapse that can appear abruptly. Instability prediction and continuous monitoring of power system performance are therefore known as exigent. Voltage stability involves both static and dynamic behaviors of a power system [1]. Regardless of the differences, both types of voltage stability are correlative to analyze the system stability mechanism. Investigation of steady-state operation is a prerequisite for initiating transient stability analysis. Therefore, the steady-state equilibrium is a necessary condition for stable transient operation [2,3,4]. The static voltage stability indices employ a measure of the distance from the current operating point to the voltage collapse point [5]. The static indices can either contribute to identifying the critical bus and stability of connected lines in the system along with evaluating the stability margin concerning the system loadability. Power system operation and voltage stability assessment are correlative to each other to ensure reliable and cost-effective operation. It is impelling to employ voltage stability indices to cognize the system performance behavior that show how close the system is to voltage collapse, loadability and security limits, and overall performance of the system.
Over recent decades, valuable researches have been conducted with the concept of the comparative analysis and classification of voltage stability indices. From different standpoints, Masahiro Furukakoi et al. [6] proposed a new voltage stability index (critical boundary index-CBI) based on active and reactive power deviations. The effectiveness of the proposed index is compared with the most worldwide accepted indices. However, the proposed index is time consuming. Still, it counted a novel index due to its high accuracy of prediction. Ratra et al. [7] examined some line voltage stability indices using IEEE 30-bus and 118-bus test systems under various operating conditions. This study pointed out a systematic methodology of applying parameters for the appropriate use of indices. Chuang et al. [8] proposed a new integrated transmission line transfer index (ITLTI) based on the radial topology that is known as suitable for power transferring situations including leading, lagging, or unity power factor. In [9], the authors introduced an improved voltage stability index using linear algebra techniques to predict a power system operating condition beyond the collapse point. The effectiveness of the proposed algorithm and the index performances are verified by comparing the existing indices in the literature. In other related studies [10,11,12], authors compared customary indices and recognized the most appropriate indices in terms of load shedding and optimum storage allocation in a critical situation. Massucco et al. [13] compared three voltage stability indices by testing on a real power system of the Italian HV transmission grid with a focus on the functionality of the indices. Sinha and Hazarika [14] proposed an index (Ii) based on active and reactive power deviation at the operating point and no-load values. The authors have compared the effectiveness of the proposed index by changing the line parameters and load power factor. To have an effectiveness comparison amongst the indices, Reis and Barbosa [15] investigated some original static voltage stability indices. Despite the promising works in the literature, still, there is a lack of a broad precise classification and comparison analysis of the voltage stability indices. However, Suganyadevia and Babulalb [15] performed a wrathful comparative analysis of line and nodal indices. Sun et al. [16] inexact static indices based on the load flow model, applied the small signal and dynamic analysis to evaluate the accuracy of the indices based on the power law model. Cupelli et al. [17] investigated four original voltage stability indices, which include various categories based on different formulation and techniques. This study is performed in light of the indices’ performance with respect to the load factor change under different operating situations. The RTDS® a (Real-Time Digital Simulator) is used to estimate the real-time behavior of the indices. Finally, the authors found that the voltage collapse point indicators (VCPIs) have the best performance of the studied indices. In [18], the authors compared the suitability of the two indices (Lmn and VCPI) to find the most suitable index for the control application. In [19], the mathematical terminologies and application are reviewed, which mostly relies on quasi-steady state and dynamic analysis such as voltage sensitivity factor (VSF), singular values, eigenvalue decomposition, second-order, voltage instability proximity index (VIPI), loading margin, direct methods, P and Q angles, test functions, etc. Nizam et al. [20] compared the power transfer stability index (PTSI) derived by considering the two-bus Thevenin equivalent system with line index (L index is known as a traditional index for voltage stability) and VCPI. In [21], a quantitative measure based on the operating point of load flow for an online application is proposed with a range of 0 (no load) and 1.0 (voltage collapse point). This index is formulated by using two-bus system power flow equations. Then, the index is generalized for a multi-bus system in the view of PQ and PV categories. In [22], the L index is denoted as a nonabsolute indicator of voltage stability in the system. In 2013, Wang et al. [23] extended this index based on an alternative generator equivalent model (GEM) instead of an ideal constant voltage source. The generalizability of previous research efforts in this context implies that the efforts do not cover all aspects or have been limited. Most studies in voltage stability indices comparison and classification have only been carried out in a small domain or focused on dynamic analysis.
It is manifested that the adequate picture of voltage stability indices’ classification is still ambiguous due to behavioral similarity and intervention of their behavior in the system, as well as the variety in an application. Nevertheless, this study aims to define comprehensively and compare the performance of the original indices, which are proposed and applied globally. With the embrace of literature, a detailed classification of these indices (mainly based on the formulation) is transpired.
Meanwhile, we take the distinguish between merit and demerit of the proposed indices as an essence, because these indices scale the power system behavior with respect to the system parameters changes, in the form of voltage variations. This study reveals an extensive-unified perspective from various classes as the most outstanding indices from each category.
The rest of the paper is organized as follows; in Section 2, the proposed classification method and classification of the voltage stability indices are presented. Section 3 describes a broad classification of voltage stability indices along with proposing a novel method. The theoretical analysis of indices of different categories is defined in Section 4. In Section 5, the simulation results and verifications are discussed. Finally, Section 6 concludes the preference of the study through originality, significance, and practical value of the topic by summarizing the advantages and disadvantages of the indices in each category.

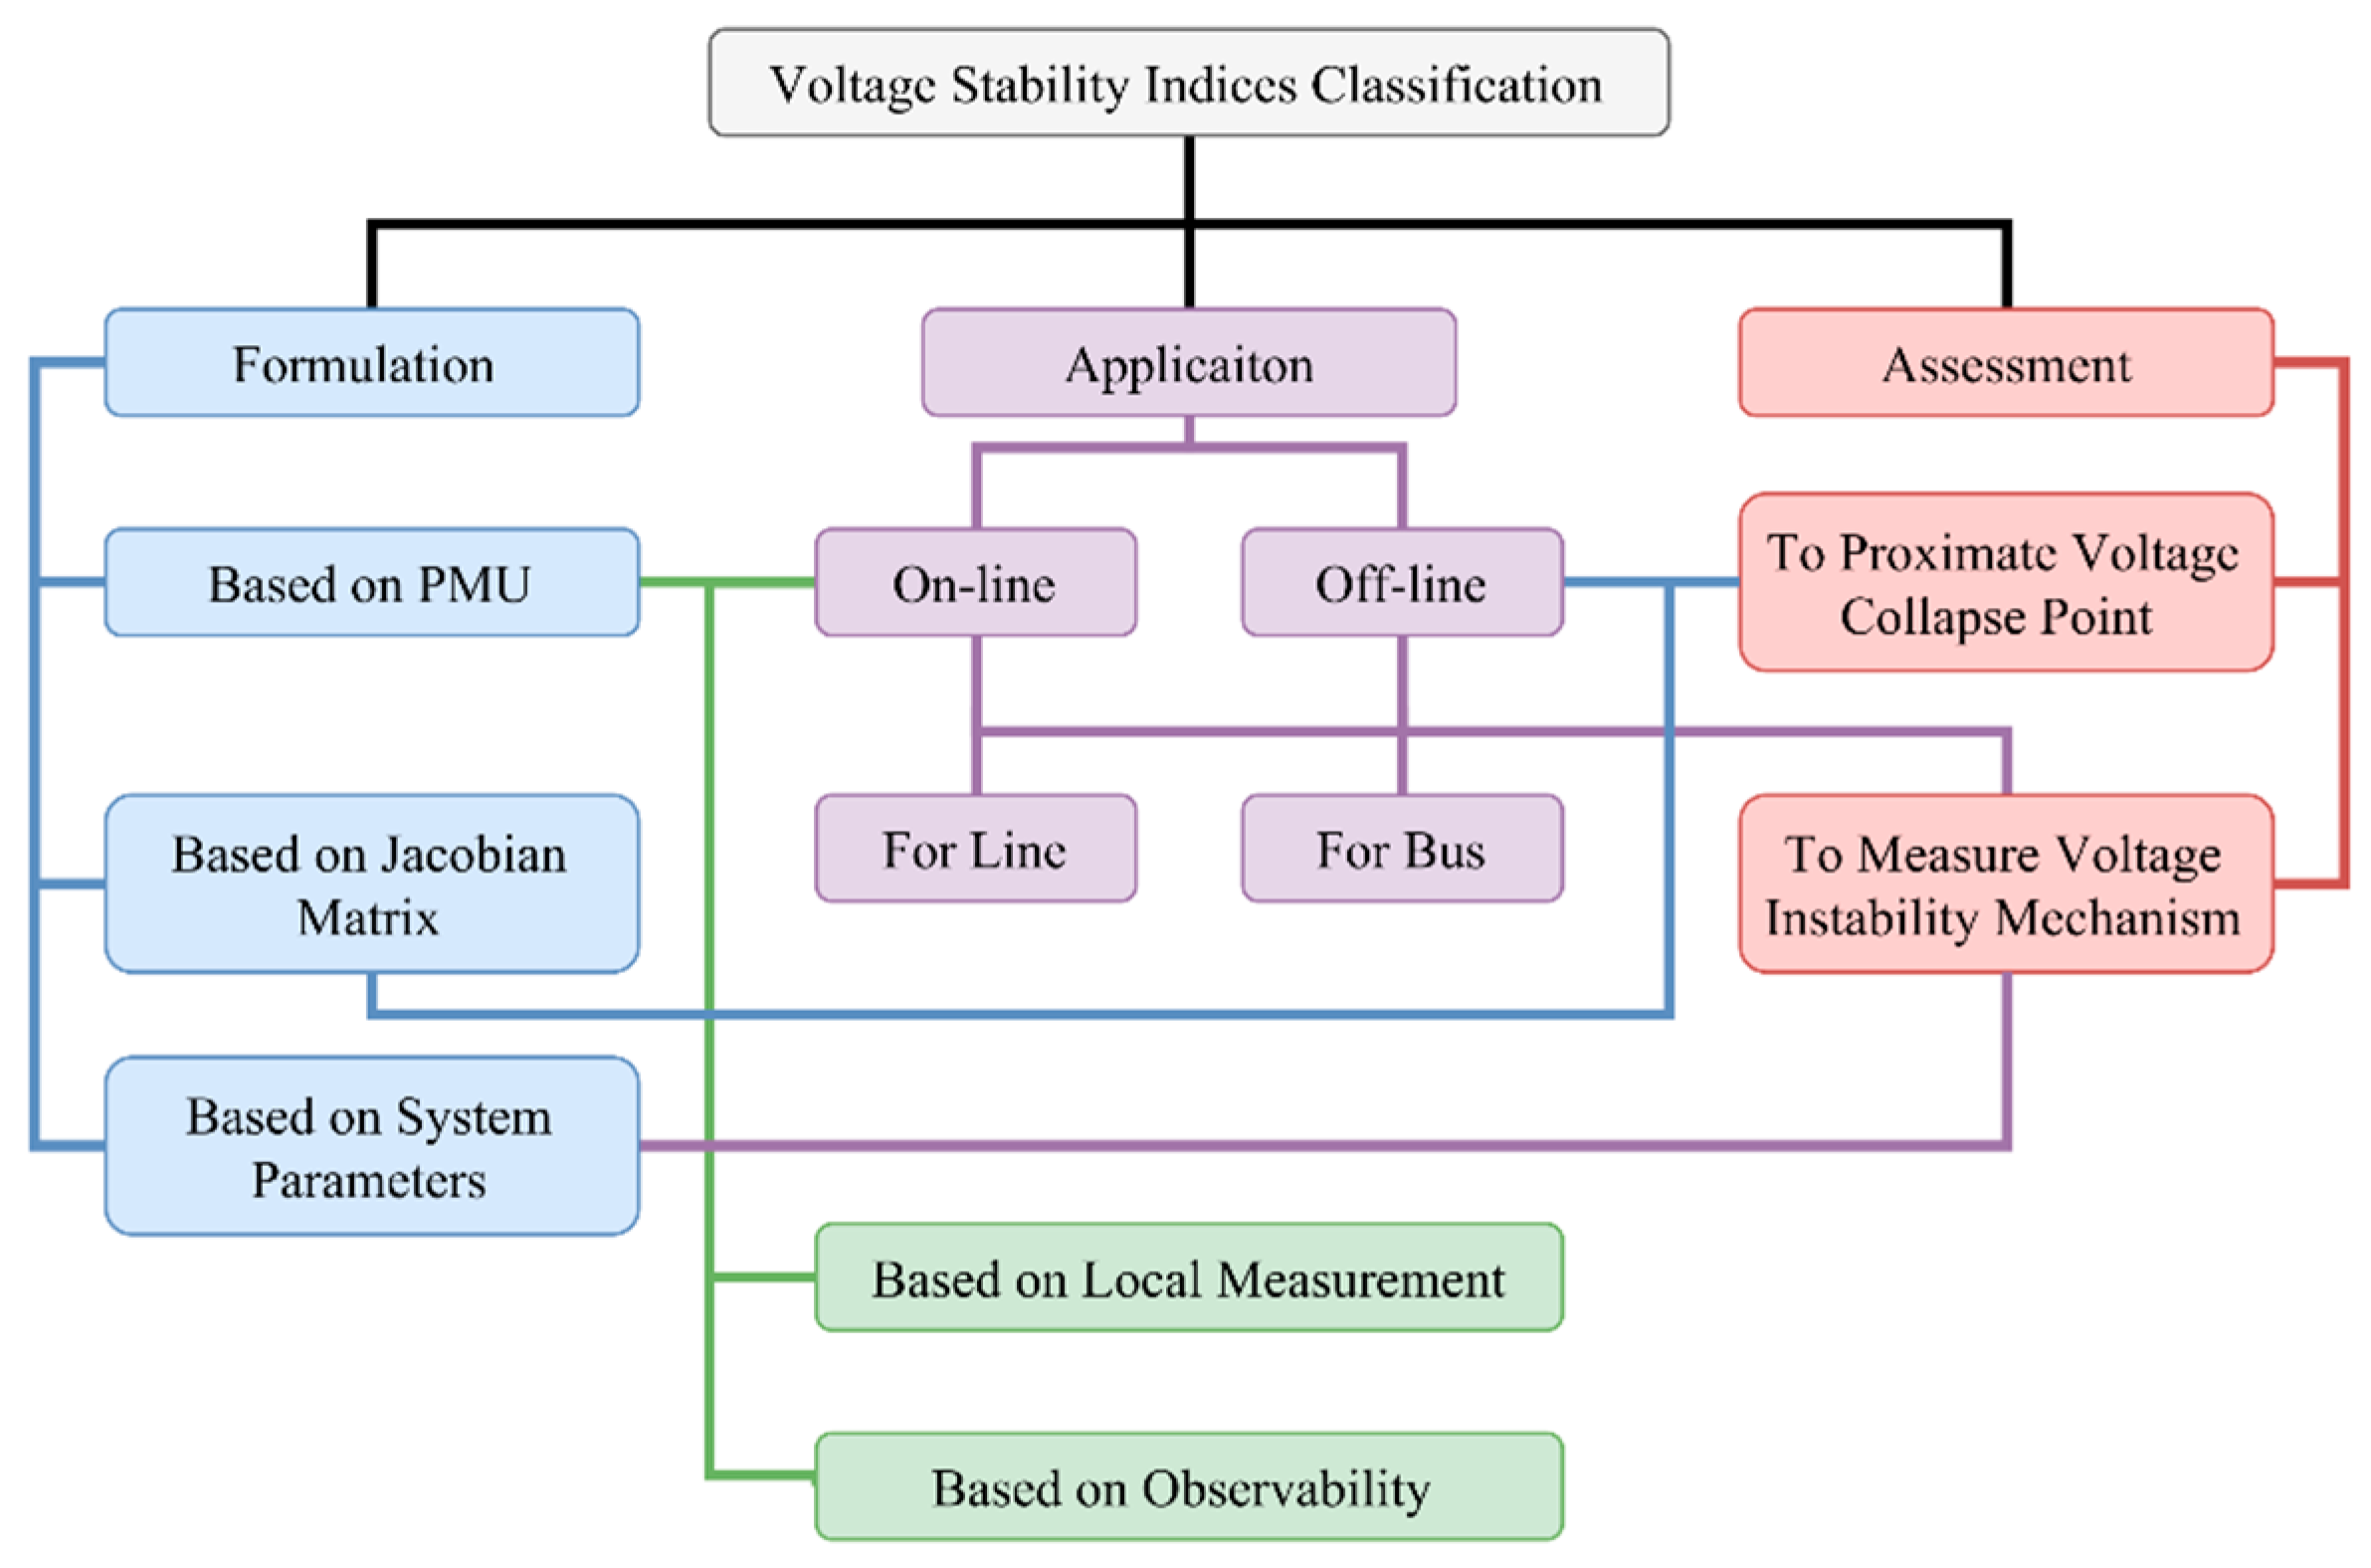
2. The Proposed Classification Scheme

Since the 1920s, the voltage stability phenomenon has been known as an essential factor for a secure and reliable system [24]. Some recent attracted techniques for voltage stability indices are introduced, namely modal analysis [25,26], singular value decomposition [4], energy function [27], continues power flow [28], sensitivity analysis methods [29], bifurcations theory [30], minimum eigenvalue [26], integrated transmission line transfer index (ITLTI) [8], etc. With the embrace of the literature research on voltage stability indices, this study aims to present an exhaustive framework for voltage stability indices classification and their behavior as follows:

2.1. From Formulation Perspective

The system variable and the Jacobian matrix basis voltage stability indices are often derived from the two-bus system, which is based on power flow analysis and Jacobian matrix [18,31]. These indices are classified into two classes; bus and line indices. Jacobian matrix-based voltage stability indices can be used to determine the voltage collapse point; in other words, Jacobian matrix-based voltage stability indices demonstrate maximum loadability and determine voltage stability margin. An interconnected power system’s Jacobian matrix in an online operation seems complicated. Jacobian matrix computation is more time consuming. Therefore, it is not viable for a voltage stability online assessment.
The system variable-based voltage stability indices deal with power system elements such as weak bus or area assessment, line loadability limit considering admittance matrix. It can be demonstrated with inefficiency of application to estimate roughly the voltage stability margin. Usually, these indices apply for online assessment of the crucial element of a power system [32]. PMU technology is another category that has been used for monitoring the voltage stability indices rather than instability prediction. Nowadays, the PMU hardware technology is known as an accurate and advanced time-synchronized technology for voltage instability monitoring for tracking system dynamics in real time [33]. The PMU-based voltage monitoring techniques are classified into two major classes, which are based on local measurements and relied on Thevenin impedance calculations, and wide-area monitoring (global) measurements [33]. However, the Thevenin method has its deficiency due to the parameter’s variation during the two measurements.

2.2. From Assessment Perspective

Fundamentally, most of the voltage stability indices are distinguished into two categories. Based on the measurement objectives such as proximity to voltage collapse point that predicts how a system operates close to voltage instability. Additionally, the voltage instability mechanism identifies the most sensitive and voltage-weak areas [31,34,35]. In addition to the categories mentioned above, the third category is PMU technology. However, the PMU indices apply voltage stability monitoring for online application.

2.3. From Application Perspective

From an application standpoint, some indices are used to measure proximity to voltage collapse point in offline and online applications [36]. The bus indices constitute a lion’s share of this category. Irrespective of some specially indicated indices which are formulated based on both Jacobian and system parameter variables, the classification tends to introduce all the proposed indices into three categories: Jacobian matrix-based, system variable-based, and PMU indices [37].
Due to the increasing application of voltage stability indices, as well as day-by-day increase in the number of these indices, this study establishes a relationship among these indices from different aspects such as formulation, assessment, and application that is exigence. Figure 1 introduces the voltage stability indices relationship based on the indices formulation methodology that has not been discussed in the literature before.

3. Theoretical Analysis of Voltage Stability Indices

Based on the original voltage stability indices as they are proposed, the merit and demerit of several indices are discussed from a high degree of accuracy in identification of the critical bus, and line stability in the power system perspectives. Meanwhile, cursorily has glanced at application, model complexity, and perception explicitly of the proposed indices as discussed in the next sections. Considering the breadth of the subject (41 indices), it can be seen that the theoretical analysis of each index is missed as shown in Table 1 [38].

4. Classification of Voltage Stability Indices

Due to the importance of voltage stability as a prediction and preventing tool in power systems, the indicators of instability phenomenon become more prominent in power system operation and analysis. A literature survey of voltage stability indices indicated a lack of an organized, detailed, and complete classification of voltage stability indices. This persuaded the authors to perform an in-depth investigation of these indices. The exact classification of voltage stability indices seems perplexing. From the foundation and performance analysis viewpoints, some proposed indices have typical proximity, but vice versa, their performance behaviors and accuracies are different. As the first-ever effort, more than 40 voltage stability indices are categorized and evaluated in Table 1. A few numbers of the indices may not exactly fit the classified categories because they are considered from the standpoint of their most characteristics tendency to each category.
Some scholars and researchers have argued that the voltage stability indices in use are quite different and for convenience, they classified these indices into two categories: Given state-based, and large deviation-based indices [37,43,54]. Despite the existing variety of indices in view of various aspects, there are two common characteristics among all these classes [29,34]:
  • Proximity to the collapse point.
  • Instability mechanism and the key contributing factor.

5. Simulation and Verification

Simulation is carried out on WSCC 9 and IEEE 14, and 30-bus test systems [10,55] to expose the merit and demerit of the voltage stability indices, which are mostly proposed and applied globally because of their simplicity in the formulation and broad application. Since the simulation of all 36 indices are not viable in a single study due to the requirement of specific hardware and software simulation tools (for real-time online application), the theoretical formulation of the rest of the indices is reviewed, and based on the indices formulation methodology, a precise classification is proposed.
As a result, an exhaustive-coherent framework is proposed to qualify the merit and demerit of the indices. Moreover, it establishes a consistent relationship among indices in view of the index performance to identify the critical bus and line stability (or proximate the tended buses to collapse) in a power system.
The idea of this study is to assess the indices theoretical formulation, functionality, applicability, and overall performances in each category through addressing the indices shortcomings. The study methodology is carried out in a systematic approach as follows: (a) The indices are studied in two categories, node and line indices, (b) such that, each simulated test system in a category is assessed separately with respect to the ranking of the three top sensitive critical lines, and three top critical buses identification in the system by means of each index, (c) then, the overall test systems results are concluded. All the analyzed indices in this section depend on two categories (from two classes, variable-based and Jacobian matrix-based), nodal and line indices. The critical buses and lines are sorted in descending order in Table 2 and Table 3; that are named 1 to 3.
From Table 2, it is noticed that the proposed line indices are comparatively agreed on the identification of the top three critical branches in the system. However, the WSCC 9-bus system results indicate that the L index appears different in ranking of the second and third critical feeders compared to the rest of indices. At the 14-bus system, almost all indices are in agreement at the first and second ranking orders; except, Vcr and LVSI. Whereas, the indices are varied in the third critical branch identification. Altogether, the 30-bus systems ranking results imply that except for the first three indices, all are enormously diverse. So far, a quick conclusion can be drawn that line indices are affected by the system configuration in an interconnected system. Table 3 illustrates the response for ranking of the three top critical weak buses by each index. Excluding from VSF and PSI, almost all the proposed bus indices have the same recognition ranking with dissimilarity in identification of the third critical bus at the 14-bus system and first and second weak buses recognition at the 30-bus system.
In order to facilitate the calculation and preserve accuracy, the following are assumed: The angles ratio of the V and Vo in the V/Vo index calculation are neglected, due to their close prices and negligible impact on the index magnitude. To avoid ambiguity in the indices calculation, for some cases the magnitude of line parameters such as resistance (r), and reactance (x) are supposed as 0.000001, instead of the given zero values. The critical buses ranking by VSF, PSI, and V/Vo node indices at the 30-bus system are chosen by an analogy of the other indices, since many of the buses had a stability index of zero. The obtained numerical consequences were the result of using power systems simulation tools such as PowerWorld® Simulator, and MATPOWER a package of MATLAB®.

6. Result and Discussion

The generalizability of an exhaustive investigation on a comparison of voltage stability indices seems problematic due to the multiplicity of indices, and more importantly their variety in theoretical foundations and performances. However, this study discussed all the first two categories indices in Table 1. One of the main drawbacks of the remained indices in Table 1 is their high computation cost due to indices complexity and dedicated tools and system parameters requirement (the PMU-based indices simulation are relinquished). Since the investigation of all indices under this study is not applicable; therefore, a few world-wide accepted indices from each category are simulated. Whereas, those indices, which contain individual, different behavior with the rest of the indices in a class, are well detailed in Section 4.
The comparison study shows that virtually the performance of the proposed indices has a high degree of accuracy for assessing the critical node and line as the results are almost close to an agreement. By relying on the theoretical formulation of both line and node indices, considering the simulation results and performances in Table 2 and Table 3, as well the merits and demerits in Table 4, some findings can be noted as follows:
  • Almost all indices in a category are in agreement with identifying the weak buses and critical lines in the system. Generally, indices in a category pursue the same manner.
  • Despite the indices in the same category having the same theoretical foundation mechanism, the performance of some indices is in disagreement with the rest of the indices. For instance, the Vcr index in the line indices category, and VSF and PSI in the node indices category do not draw the same result as other indices. The Vcr from the formulation point view implies that the model analysis-based indices formulation with respect to the Jacobian matrix singularity assumption is not wholly accurate, especially at the collapse point. On the other hand, some studies without considering the generalization directly applied the quantitative results of the customary two-bus model. While for a complex system with multiple generators and control elements, it is not an adequate solution. These indices are L index, novel line stability index (NLSI), stability index (SI), voltage collapse index (VCI), voltage stability factor (VSF), line index (L), fast voltage stability index (FVSI), critical voltage (Vcr), and power transfer stability index (PTSI).
  • There are some indices, which are fundamentally the same, but from the driven point of view, they are different. In other works, their results are the complement of each other in a common concord.
  • All indices in a class are coherent to their typical theoretical bases and pursue the same performance. The range of stability for most of the indices is between 0 and 1.0. Someway, it indicates that the indices discernment characteristics of performances are in accord.
  • Reis and Barbosa [44] have argued that the line indices can also determine the weakest bus in the system. While, the comparison of the line and node indices in Table 2 and Table 3 have negated this argument. Since mostly the line indices are driven without taking into account that the reactive power generation limits can cause misidentification.
  • An index with a bad ranking in compliance with other indices does not imply that the index is useless, whereas, each index is functional for a specific application. In the literature, the demerit of the sensitivity indices are pointed out as these indices alone will not be sufficient to identify a critical node, especially in an interconnected system. However, when the system is suffering from a heavy load in a stressed situation, the Δ V i / Δ Q i and Δ V i / Δ P i sensitivities indicators play a significant role in voltage collapse prediction [53].
  • Those indices which are initiated from the load flow Jacobian matrix, are not suitable for online application due to their prediction insufficiency of voltage collapse, nonlinearity properties at the collapse point, and a high computation requirement.
  • Sensitivity analysis applies to weak bus identification. The sensitivity index alone will not be sufficient to identify weak buses especially in an interconnected system [56].
Beyond the other methods, sensitivity analysis plays an important role in prediction of critical nodes in the system. It is important to investigate how this critical point is affected by changing system conditions [54].
  • From the literature, it is found that for solving the instability phenomenon, there are dynamic factors involved that cause a high dimensional and multi-parameter system [57]. Therefore, it may be wise to consider the static or semi-dynamic behavior. Most indices that measure the stable margin from operating point to the voltage instability are based on static analysis using the power flow model [16].
  • As in the indices’ classification section mentioned, there is a partial argument between the scholars, and the terms of the static and dynamic indices are customarily used in the literature. While partially for the purpose of voltage stability indices formulation, the dynamic model was considered by the steady state operation based on the stable equilibrium operating point of the power system [32] that from reference [57] is called semi-dynamic analysis. Therefore, it is arduous to refer to static or dynamic classes.
This study embraces the most used indices in the literature in order to identify the critical bus and line stability in a power system. However, in order to avoid the bulk of the work under the framework of the study, the following aspects of indices are required for further researches; the loadability margin estimation when the system is loaded up from the base case to reach the collapse experiences different operation behaviors along this path, the assessment for different x/r ratios of the transmission system, with keeping the power factor constant, especially for line indices; and finally, classification of voltage stability indices based on the application and assessment.
The merit and demerit distinguish of the proposed indices is another aspect of this study. Since they play a role in estimating the power system state with respect to the system parameters changes, in the form of voltage variation. The aformentioned analysis results are given in Table 4, as a comparison between Jacobian matrix-based and system variable-based on VSIs [18,19]. The PMU-based indices are not comparable with the variable-based and Jacobian-based indices, due to different applications (used for voltage stability monitoring vs. state or margin estimation). It is enough to consider the general characteristics of the Jacobian matrix-based and system variable-based categories, regardless of attending the trivial points related to each index separately. The general details have been described in Table 4.
The study also reveals that the indices ranking with respect to the worst node or area identification does not imply that an index drawback or bad ranking is in compliance with other indices, and it is useless. It is worth saying that each index is functional for a specific application. The simulation results negate the application of line indices for recognition of the critical bus in a power system.
Deploying the Jacobian matrix-based indices are not recommended for online application. Due to their nonlinearity properties at the collapse point, as well as high computation time requirement. Comparative analysis of the voltage stability indices in a manifestation study can pave the ground for utilizing the indices in various applications of power systems such as optimal placement of distributed generators, reactive power dispatch, and power management. Subsequently, the classification section is addressed as it is difficult to categorize the voltage stability indices to static or dynamic classes.

7. Conclusions

An overall objective of this study is to shape a novel framework for voltage stability indices considering analysis of multi-dimensions as formulation, assessment, and application. The obtained finding makes the consistency of the studied indices evident with the distinction in their consistency in voltage stability analysis. The results show that all indices in a category are coherent to their ideal theoretical bases, and pursue the same performance. Moreover, results indicate that indices from one category can be applied alternatively. Meanwhile, this concept is not applicable to all indices in the same category. Some voltage stability indices do not pursue the same behavior, likewise, the rest of the same category indices. The voltage stability assessment range is between 0 and 1 for most indices. Therefore, most of voltage stability indices formulation are in accord, as well as their behaviors are almost aligned.
The article explores 36 voltage stability indices in terms of multidimensional analysis (formulation, assessment, application) in a systematic manner that can be counted as a practical reference for students, researchers, scholars, and practitioners in the field of power system analysis.
The authors are willing to put forward a series of related research efforts in detail within different approaches in the future from various aspects such as frequency, computational time, and accuracy at the collapse point.

Author Contributions

Conceptualization, M.S.S.D. and T.S.; methodology, H.Z. and M.A.; software, A.M.N.; validation, M.W. and H.Z.; formal analysis, H.Z.; investigation, H.Z.; resources, M.S.S.D., P.M., and M.A.; data curation, M.S.S.D.; writing—original draft preparation, M.S.S.D.; writing—review and editing, T.S. and M.K.; visualization, P.M.; supervision, T.S.; project administration, M.W. and M.K. All authors have read and agreed to the published version of the manuscript.

Funding

This research received no external funding.

Conflicts of Interest

The authors declare no conflict of interest.

References

  1. Chebbo, A.M.; Irving, M.R.; Sterling, M.J.H. Voltage collapse proximity indicator: Behaviour and implications. In IEE Proceedings C (Generation, Transmission and Distribution); The Institution of Electrical Engineers (IET): London, UK, 1992; Volume 139, pp. 241–252. [Google Scholar]
  2. Eremia, M.; Shahidehpour, M. Power System Stability and Protection. In Handbook of Electrical Power System Dynamics; John Wiley & Sons, Ltd.: Chichester, UK, 2013; pp. 451–452. ISBN 978-1-118-51607-2. [Google Scholar]
  3. Chiang, H.D. Direct Methods for Stability Analysis: An Introduction. In Direct Methods for Stability Analysis of Electric Power Systems; John Wiley & Sons, Ltd.: Chichester, UK, 2010; pp. 119–128. ISBN 978-0-470-87213-0. [Google Scholar]
  4. Andersson, G.; Hill, J. Voltage stability indices for stressed power systems. IEEE Trans. Power Syst. 1993, 8, 326–335. [Google Scholar]
  5. Esmaili, M.; Firozjaee, E.C.; Shayanfar, H.A. Optimal placement of distributed generations considering voltage stability and power losses with observing voltage-related constraints. Appl. Energy 2014, 113, 1252–1260. [Google Scholar] [CrossRef]
  6. Furukakoi, M.; Adewuyi, O.B.; Danish, M.S.S.; Howlader, A.M.; Senjyu, T.; Funabashi, T. Critical Boundary Index (CBI) based on active and reactive power deviations. Int. J. Electr. Power Energy Syst. 2018, 100, 50–57. [Google Scholar] [CrossRef]
  7. Ratra, S.; Tiwari, R.; Niazi, K.R. Voltage stability assessment in power systems using line voltage stability index. Comput. Electr. Eng. 2018, 1, 1–13. [Google Scholar] [CrossRef]
  8. Chuang, S.J.; Hong, C.M.; Chen, C.H. Improvement of integrated transmission line transfer index for power system voltage stability. Int. J. Electr. Power Energy Syst. 2016, 78, 830–836. [Google Scholar] [CrossRef]
  9. Danish, M.S.S.; Yona, A.; Senjyu, T. A Review of Voltage Stability Assessment Techniques with an Improved Voltage Stability Indicator. Int. J. Emerg. Electr. Power Syst. 2015, 16, 107–115. [Google Scholar] [CrossRef]
  10. Danish, M.S.S.; Yona, A.; Senjyu, T. Voltage stability assessment index for recognition of proper bus for load shedding. In Proceedings of the 2014 International Conference on Information Science, Electronics and Electrical Engineering (ISEEE 2014), Sapporo, Japan, 26–28 April 2014; IEEE: Piscataway, NJ, USA, 2014; Volume 1, pp. 636–639. [Google Scholar]
  11. Sagara, M.; Furukakoi, M.; Senjyu, T.; Danish, M.S.S.; Funabashi, T. Voltage stability improvement to power systems with energy storage systems. In Proceedings of the 17th International Conference on Harmonics and Quality of Power (ICHQP 2016), Belo Horizonte, Brazil, 16–19 October 2016; IEEE: Piscataway, NJ, USA, 2016; pp. 7–10. [Google Scholar]
  12. Danish, M.S.S. Voltage Stability in Electric Power System: A Practical Introduction, 1st ed.; Logos Verlag Berlin GmbH: Berlin, Germany, 2015; ISBN 978-3-8325-3878-1. [Google Scholar]
  13. Massucco, S.; Grillo, S.; Pitto, A.; Silvestro, F. Evaluation of some indices for voltage stability assessment. In 2009 IEEE Bucharest PowerTech; IEEE: Piscataway, NJ, USA, 2009; pp. 1–8. [Google Scholar]
  14. Sinha, A.K.; Hazarika, D. A comparative study of voltage stability indices in a power system. Int. J. Emerg. Electr. Power Syst. 2000, 22, 589–596. [Google Scholar]
  15. Suganyadevia, M.V.; Babulalb, C.K. Estimating of loadability margin of a power system by comparing Voltage Stability Indices. In Proceedings of the 2009 International Conference on Control, Automation, Communication and Energy Conservation, Perundurai, India, 4–6 June 2009; pp. 1–4. [Google Scholar]
  16. Sun, H.; Zhou, X.; Li, R. Accuracy analysis of static voltage stability indices based on power flow model. In Proceedings of the 2005 IEEE/PES Transmission and Distribution Conference and Exposition: Asia and Pacific, Dalian, China, 18 August 2005; IEEE: Piscataway, NJ, USA, 2005; pp. 1–7. [Google Scholar]
  17. Cupelli, M.; Cardet, C.D.; Monti, A. Comparison of line voltage stability indices using dynamic real time simulation. In Proceedings of the 2012 3rd IEEE PES Innovative Smart Grid Technologies Europe (ISGT Europe), Berlin, Germany, 14–17 October 2012; pp. 1–8. [Google Scholar]
  18. Cupelli, M.; Doig Cardet, C.; Monti, A. Voltage stability indices comparison on the IEEE-39 bus system using RTDS. In Proceedings of the 2012 IEEE International Conference on Power System Technology (POWERCON), Auckland, New Zealand, 30 October–2 November 2012; IEEE: Piscataway, NJ, USA, 2012; pp. 1–6. [Google Scholar]
  19. Chiang, H. Quasi-Stability Regions: Analysis and Characterization. In Direct Methods for Stability Analysis of Electric Power Systems; John Wiley & Sons, Ltd.: Chichester, UK, 2010; pp. 51–59. ISBN 978-0-470-87213-0. [Google Scholar]
  20. Nizam, M.; Mohamed, A.; Hussain, A. Performance evaluation of voltage stability indices for dynamic voltage collapse prediction. J. Appl. Sci. 2006, 6, 1104–1113. [Google Scholar]
  21. Kessel, P.; Glavitsch, H. Estimating the Voltage Stability of a Power System. IEEE Trans. Power Deliv. 1986, 1, 346–354. [Google Scholar] [CrossRef]
  22. Acharya, N.V.; Rao, P.S.N. A new voltage stability index based on the tangent vector of the power flow jacobian. In Proceedings of the 2013 IEEE Innovative Smart Grid Technologies-Asia (ISGT Asia), Bangalore, India, 10–13 November 2013; pp. 1–6. [Google Scholar]
  23. Wang, Y.; Wang, C.; Lin, F.; Li, W.; Wang, L.Y.; Zhao, J. Incorporating Generator Equivalent Model Into Voltage Stability Analysis. IEEE Trans. Power Syst. 2013, 28, 4857–4866. [Google Scholar] [CrossRef]
  24. Pérez-londoño, S.; Rodríguez, L.F.; Olivar, G. A simplified voltage stability index ( SVSI ). Electr. Power Energy Syst. 2014, 63, 806–813. [Google Scholar] [CrossRef]
  25. Kayal, P.; Chanda, C.K. Placement of wind and solar based DGs in distribution system for power loss minimization and voltage stability improvement. Int. J. Electr. Power Energy Syst. 2013, 53, 795–809. [Google Scholar] [CrossRef]
  26. Kundur, P.; Paserba, J.; Ajjarapu, V.; Andersson, G.; Bose, A.; Canizares, C.; Hatziargyriou, N.; Hill, D.; Stankovic, A.; Carson, T.; et al. Definition and classification of power system stability IEEE/CIGRE joint task force on stability terms and definitions. IEEE Trans. Power Syst. 2004, 19, 1387–1401. [Google Scholar]
  27. Dessaint, L.-A.; Kamwa, I.; Zabaiou, T. Preventive control approach for voltage stability improvement using voltage stability constrained optimal power flow based on static line voltage stability indices. IET Gener. Transm. Distrib. 2014, 8, 924–934. [Google Scholar]
  28. Gao, B.; Morison, G.K.; Kundur, P. Voltage stability evaluation using modal analysis. IEEE Trans. Power Syst. 1992, 7, 1529–1542. [Google Scholar] [CrossRef]
  29. Overbye, T.J.; Demarco, C.L. Improved techniques for power system voltage stability assessment using energy methods. IEEE Trans. Power Syst. 1991, 6, 1446–1452. [Google Scholar] [CrossRef]
  30. Eady, S.I.; Christy, C. The continuation power flow: A tool for steady state voltage stability analysis. IEEE Trans. Power Syst. 1992, 7, 416–423. [Google Scholar]
  31. Karbalaei, F.; Soleymani, H.; Afsharnia, S. A comparison of voltage collapse proximity indicators. In Proceedings of the 2010 Conference Proceedings IPEC, Singapore, 27–29 October 2010; pp. 429–432. [Google Scholar]
  32. Sauer, P.W.; Pai, M.A. Power system steady-state stability and the load-flow Jacobian. IEEE Trans. Power Syst. 1990, 5, 1374–1383. [Google Scholar] [CrossRef]
  33. Kwatny, H.; Pasrija, A.; Bahar, L. Static bifurcations in electric power networks: Loss of steady-state stability and voltage collapse. IEEE Trans. Circuits Syst. 1986, 33, 981–991. [Google Scholar] [CrossRef] [Green Version]
  34. Danish, M.S.S.; Yona, A.; Senjyu, T. Optimum Loadability Improvement of Weak Buses using Shunt Capacitors to Enhance Voltage Stability Margin. In Proceedings of the International Conference on Engineering and Applied Science (ICEAS), Tokyo, Japan, 15–17 March 2013; Higher Education Forum (HEF): Osaka, Japan, 2013; Volume 1, pp. 1063–1069. [Google Scholar]
  35. Gong, Y.; Schulz, N.; Guzmán, A. Synchrophasor-based real-time voltage stability index. In Proceedings of the 2006 IEEE PES Power Systems Conference and Exposition, Atlanta, GA, USA, 29 October–1 November 2006; IEEE: Piscataway, NJ, USA, 2006; pp. 1029–1036. [Google Scholar]
  36. Hossain, J.; Pota, H.R. Power System Voltage Stability and Models of Devices. In Robust Control for Grid Voltage Stability: High Penetration of Renewable Energy: Interfacing Conventional and Renewable Power Generation Resources; Hossain, J., Pota, H.R., Eds.; Power Systems; Springer: Singapore, 2014; pp. 19–59. ISBN 978-981-287-116-9. [Google Scholar]
  37. Glavic, M.; Cutsem, T.V. Wide-area detection of voltage instability from synchronized measurements. Part 1: Principle. IEEE Trans. Power Syst. 2009, 24, 1408–1416. [Google Scholar] [CrossRef] [Green Version]
  38. Danish, M.S.S.; Senjyu, T.; Danish, S.M.S.; Sabory, N.R.; K, N.; Mandal, P. A Recap of Voltage Stability Indices in the Past Three Decades. Energies 2019, 12, 1544. [Google Scholar] [CrossRef] [Green Version]
  39. Yazdanpanah-Goharrizi, A.; Asghari, R. A novel line stability index (NLSI) for voltage stability assessment of power systems. In Proceedings of the 7th WSEAS International Conference on Power Systems, Beijing, China, 15–17 September 2007; pp. 164–167. [Google Scholar]
  40. Musirin, I.; Rahman, T.K.A. On-line voltage stability based contingency ranking using fast voltage stability index (FVSI). In Proceedings of the IEEE/PES Transmission and Distribution Conference and Exhibition, Yokohama, Japan, 6–10 October 2002; IEEE: Yokohama, Japan, 2002; Volume 2, pp. 1118–1123. [Google Scholar]
  41. Nai-shan, H.; Xu, T.; Liao, Q.; Lu, Z. The analysis of abundance index of voltage stability based circuit theory. Guangxi Electr. Power 2006, 2, 12–14. [Google Scholar]
  42. Hatziargyriou, N.D.; Van Cutsem, T. Indices for Predicting Voltage Collapse Including Dynamic Phenomena; CIGRE: Paris, France, 1994; pp. 1–18. [Google Scholar]
  43. Ajjarapu, V. Computational Techniques for Voltage Stability Assessment and Control, 1st ed.; Springer International Publishing: New York, NY, USA, 2007; ISBN 978-0-387-26080-8. [Google Scholar]
  44. Reis, C.; Barbosa, F.P.M. A comparison of voltage stability indices. In Proceedings of the 2006 IEEE Mediterranean Electrotechnical Conference (MELECON 2006), Malaga, Spain, 16–19 May 2006; IEEE: Piscataway, NJ, USA, 2006; pp. 1007–1010. [Google Scholar]
  45. Chiang, H.D.; Jean-Jumeau, R. Toward a practical performance index for predicting voltage collapse in electric power systems. IEEE Trans. Power Syst. 1995, 10, 584–592. [Google Scholar] [CrossRef]
  46. De Souza, A.C.Z.; Caiiizares, C.A.; Quintana, V.H. New techniques to speed up voltage collations using tangent vectors. IEEE Trans. Power Syst. 1997, 12, 1380–1387. [Google Scholar] [CrossRef] [Green Version]
  47. Van Hecke, J.; Hatziargyriou, N.D.; Van Cutsem, T. Indices Predicting Voltage Collapse Including Dynamic Phenomena; CIGRE: Paris, France, 1994; pp. 1–94. [Google Scholar]
  48. Berizzi, A.; Finazzi, P. First and second order methods for voltage collapse assessment and security enhancement. IEEE Trans. Power Syst. 1998, 13, 543–551. [Google Scholar] [CrossRef]
  49. Sultana, U.; Khairuddin, A.B.; Aman, M.M.; Mokhtar, A.S.; Zareen, N. A review of optimum DG placement based on minimization of power losses and voltage stability enhancement of distribution system. Renew. Sustain. Energy Rev. 2016, 63, 363–378. [Google Scholar] [CrossRef]
  50. Julian, D.E.; Schulz, R.P.; Vu, K.T.; Quaintance, W.H.; Bhatt, N.B.; Novosel, D. Quantifying proximity to voltage collapse using the Voltage Instability Predictor (VIP). In Proceedings of the 2000 Power Engineering Society Summer Meeting (Cat. No.00CH37134), Seattle, WA, USA, 16–20 July 2000; IEEE: Piscataway, NJ, USA, 2000; Volume 2, pp. 931–936. [Google Scholar]
  51. Milǒsević, B.; Begović, M. Voltage-stability protection and control using a wide-area network of phasor measurements. IEEE Trans. Power Syst. 2003, 18, 121–127. [Google Scholar] [CrossRef]
  52. Li, W.; Wang, Y.; Chen, T. Investigation on the Thevenin equivalent parameters for online estimation of maximum power transfer limits. IET Gener. Transm. Distrib. 2010, 4, 1180–1187. [Google Scholar] [CrossRef]
  53. Balamourougan, V.; Sidhu, T.S.; Sachdev, M.S. Technique for online prediction of voltage collapse. IEE Proc. Gener. Transm. Distrib. 2009, 151, 453–460. [Google Scholar]
  54. Kundur, P.; Balu, N.J.; Lauby, M.G. Power System Stability and Control; McGraw-Hill: New York, NY, USA, 1994; Volume 7. [Google Scholar]
  55. Christie, R. Power Systems Test Case Archive. Electrical Engineering. 2000. Available online: https://www2.ee.washington.edu/research/pstca (accessed on 26 February 2020).
  56. Rahman, A. Estimating maximum loadability for weak bus identification using FVSI. IEEE Power Eng. Rev. 2002, 22, 50–52. [Google Scholar]
  57. Tamura, Y.; Mori, H.; Iwamoto, S. Relationship between voltage instability and multiple load flow solutions in electric power systems. IEEE Trans. Power Appar. Syst. 1983, PAS-102, 1115–1125. [Google Scholar] [CrossRef]
Figure 1. Voltage stability indices classification and relationships based on indices formulation.
Applsci 10 01639 g001
Table 1. An exhaustive representation and classification of voltage stability indices [38].
TypeIndexAbbreviationCalculationStability ThresholdReference
System parameters (variables)-basedFor BusL Index L L = M A X j α L | 1 i α G F ¯ j i V ¯ i V ¯ j | L < 1 [21]
Power Stability Index P S I P S I = 4 r i j ( P L P G ) [ | V i | cos ( θ δ ) ] 2 P S I 1 [39]
Voltage Deviation Index V D I V D I j = | 1 V j | Details are given in the reference[40]
Stability Index S I S I ( m 2 ) = { | V ( m 1 ) | 4 4.0 { P ( m 2 ) x ( j j ) Q ( m 2 ) r ( j j ) } } 2 4.0 { P ( m 2 ) r ( j j ) + Q ( m 2 ) x ( j j ) } | V ( m 1 ) | 2 The smallest magnitude is the most sensitive to voltage collapse[41]
Voltage Collapse Prediction Index V C P I k t h   b u s V C P I k t h   b u s = 1 m = 1 m k N | V m | V k V C P I k t h   b u s < 1 [42]
Sensitivity Analysis S A Δ V i / Δ Q i
Δ V i / Δ P i
Details are given in the reference[43]
Bus Participation Factor B P F Details are given in [44]Using a power system simulation tool[44]
Voltage Stability Index V S I V S I i = [ 1 + ( I i V i ) ( Δ V i Δ I i ) ] α V S I i 0 [45]
Equivalent Node Voltage Collapse Index E N V C I E N V C I = 2 ( e k e n + f k f n ) ( e k 2 + e k 2 ) E N V C I > 0 [46]
Voltage Collapse Index V C I V C I i = [ 1 + ( I i Δ V i V i Δ I i ) ] α V C I i 0 [45]
Improved Voltage Stability Index I V S I 4 j = 0 n ( G i j B i j ) ( P i + Q i ) ( I V S I 1 ) [ j = 1 n | V j | [ G i j ( cos δ i j + sin δ i j ) B i j ( cos δ i j + sin δ i j ) ] ] 2 [40]
Voltage Stability Factor V S F V S F t o t a l = m = 1 k 1 ( 2 V m + 1 V m ) The greatest magnitude is more stable[25]
Voltage Instability Proximity IndexVIPI V I P I = θ = c o s 1 Y s T     Y ( a ) Y s   Y ( a ) Value is between the operating and critical load conditions[47]
For LineLmn Index L m n L m n = 4 Q r x [ | V s | sin ( θ δ ) ] 2 L m n < 1 [48]
Line Voltage Factor L Q P L Q P = 4 ( X V i 2 ) ( X V i 2 P i 2 + Q j ) L Q P < 1 [49]
Line Index L L = 4 [ ( x e g P l e g r e g Q l e g ) 2 + x e g Q L + r e g P l e g ] L < 1 [50]
Voltage Collapse Proximity Indicator V C P I V C P I ( 1 ) = P r P r ( max )
V C P I ( 2 ) = Q r Q r ( max )
V C P I ( 3 ) = P l P l ( max )
V C P I ( 4 ) = Q l Q l ( max )
V C P I < 1 [51]
Novel Line Stability Index N L S I N L S I i j = R i j P j + X i j Q j 0.25 V i 2 N L S I i j < 1 [52]
Fast Voltage Stability Index F V S I F V S I i j = 4 Z 2 Q j V i 2 x F V S I i j < 1 [35]
Critical Voltage V c r V c r = E 2 cos θ The critical voltage value[16]
Power Transfer Stability Index P T S I P T S I = 2 S L Z T h e v ( 1 + cos ( β α ) ) E T h e v 2 P T S I < 1 [20]
Line Voltage Stability Index L V S I L V S I = 4 r P r V s cos ( θ δ ) 2 L V S I 1 [1]
Critical Boundary Index C B I C B I i k = Δ P i k 2 + Δ Q i k 2 C B I > 1 [6]
Line Voltage Stability Index L V S I L V S I = m a x ( L V S I j )   j = 1 ,   2 ,   3 ,   l L V S I > 1 [7]
Integrated Transmission Line Transfer Index I T L T I P R = A V R 2 B cos ( β α ) + V S V R B cos ( β α ) Details are given in the reference[8]
Jacobian matrix-basedImpedance Ratio Indicator Z i i Z i Z i i Z i 1 [1]
Minimum Eigenvalue and Right eigenvector methodRE Δ V = i ξ i   η i λ i Δ Q All eigenvalues should be positive[28]
Minimum Singular value [ Δ θ Δ V ] = V 1 U T [ Δ F Δ G ] Details are given in the reference[4]
Predicting Voltage Collapse V V 0 The smallest index value[1]
Test Function t c c = | e c T J J c c 1 e c | Details are given in the reference[45]
Tangent Vector Index T V I T V I i = | d V i d λ | 1 Depends on load increase[46]
Second-Order Index i i = 1 i 0   σ m a x d σ m a x / d λ t o t a l i > 0 [48]
Integral Steady-State MarginISSM I S S M = | J c J o | Between 0 and 1[47]
Phasor Measurement Units (PMU)-basedLocal Measurement-basedRecursive Least Square R L S x k = x k 1 + G k ( y k H k T x k 1 )
G k = P k 1 H k ( λ I + H k T P k 1 H k ) 1
P k = 1 λ ( I G k H k T ) P k 1
Details are given in the reference[51]
Voltage Instability Predictor V I P Δ S = ( V k Z T h I k ) 2 4 Z T h Details are given in the reference[50]
Voltage Stability Load Bus Index V S L B I V S L B I k = | V i ( k ) | | Δ V i ( k ) | Details are given in the reference[9]
Approximate Approach V L i = E e q , i Z e q I L i
Z e q = Z L L i i
Details are given in the reference[52]
Simplified Voltage Stability Index S V S I S V S I i = Δ V i β V i S V S I i < 1 [24]
Observability-basedVoltage Collapse Proximity Indicator V C P I V C P I k t h   b u s = | 1 m = 1 m k N V m V k | V C P I k t h   b u s < 1 [53]
Margin Voltage Stability Index M V S I V S I = m i n
( P m a r g i n e P m a x Q m a r g i n e Q m a x S m a r g i n e S m a x )
Details are given in the reference[35]
Sensitivity Related Eigenvalue S Q g q = g q T ( g x T ) 1 Δ x Q g Details are given in the reference[41]
Table 2. The obtained three top critical branch ranking by each index.
Test SystemFeederIndex
NLSIVCPIFVSILmnLQPLVcrLVSI
FromToPQ
WSCC 9-bus system751111111-1
962222223-2
783333332-3
54-------1-
64-------2-
89-------3-
IEEE 14-bus system4911111111-
232222222-1
34-33-----2
1213---33----
56-----3-2-
15--------3
47-------3-
13143--------
IEEE 30-bus system251111312-1
2730222---3-2
2930333----33
412---3-2---
68------1--
610----1--1-
910----2--2-
2324---2-3---
Table 3. The obtained weak bus ranking by each index.
Test SystemBusFeederIndex
FromToVSFPSIVj/VoBPFRES
IEEE 14-bus system14914--1111
1314--
10910--2222
94933-33-
79-2
74721---3
13613--3---
4341-----
IEEE 30-bus system262526212333
292729323222
302930131111
Table 4. Comparative analysis of Jacobian matrix-based and system variable-based indices.
CharacteristicVoltage Stability Indices
Jacobian Matrix-BasedSystem Variable-Based
TimeMore time consuming.Less time consuming.
ApplicationPower system voltage stability margin estimation.Power system elements’ crucial state recognition (weak bus or stressed area and line identification).
Measure of the distance from current operating point to the voltage collapse point.Constraints that caused voltage instability phenomenon.
MeritIt is very sensitive near the steady state boundary.Response to the overall system load change.
Assess the whole system and could count a centralized measurement.
Better performance in radial systems than interconnected systems.
Variety in application in power systems such as recognition of the optimum placement of FACTS (flexible AC transmission system) and distributed generator in the system.
DemeritMostly reactive power limits on generators are not considered during index formulation.Often extracted based on two-bus system model.
Due to the nonlinearity of the system, this method is not an accurate close vicinity of the actual voltage.
Some indices are based on the computation of path matrix or RED (related electrical distance) method, which are computationally expensive.
Some indices under this category show a nonlinear profile due to change in loading parameters.
It does not accurately predict the collapse point because of its nonlinear behavior when it nears the collapse point.
Formulation ConceptCollapse point.Stability margin.
Eigenvalue approach.Maximum power capability.
Stability margin.Reactive power margin.
PV-PQ voltage.

