Rainfall Induced Landslide Studies in Indian Himalayan Region: A Critical Review
by
 , , and
Abhirup Dikshit
1 ,
,
Raju Sarkar
2,
Biswajeet Pradhan
1,3,* ,
,
Samuele Segoni
4 and
Abdullah M. Alamri
5 1
Centre for Advanced Modeling and Geospatial Information Systems (CAMGIS), University of Technology, Sydney, NSW 2007, Australia
2
Department of Civil Engineering, Delhi Technological University, Shahbad Daulatpur, Delhi 110042, India
3
Department of Energy and Mineral Resources Engineering, Sejong University, Choongmu-gwan, 209 Neungdong-ro, Gwangjin-gu, Seoul 05006, Korea
4
Department of Earth Sciences, University of Firenze, Via Giorgio La Pira, 4, 50121 Florence, Italy
5
Department of Geology & Geophysics, College of Science, King Saud University, Riyadh 11451, Saudi Arabia
*
Author to whom correspondence should be addressed.
Appl. Sci. 2020, 10(7), 2466; https://0-doi-org.brum.beds.ac.uk/10.3390/app10072466
Submission received: 25 February 2020
/
Revised: 31 March 2020
/
Accepted: 31 March 2020
/
Published: 3 April 2020
(This article belongs to the Special Issue Recent Advances in Geographic Information System for Earth Sciences)
Abstract
:Landslides are one of the most devastating and recurring natural disasters and have affected several mountainous regions across the globe. The Indian Himalayan region is no exception to landslide incidences affecting key economic sectors such as transportation and agriculture and often leading to loss of lives. As reflected in the global landslide dataset, most of the landslides in this region are rainfall triggered. The region is prone to 15% of the global rainfall-induced landslides, and thereby a review of the studies in the region is inevitable. The high exposure to landslide risk has made the Indian Himalayas receive growing attention by the landslides community. A review of landslides studies conducted in this region is therefore important to provide a general picture of the state-of-the-art, a reference point for researchers and practitioners working in this region for the first time, and a summary of the improvements most urgently needed to better address landslide hazard research and management. This article focuses on various studies ranging from forecasting and monitoring to hazard and susceptibility analysis. The various factors used to analyze landslide are also studied for various landslide zones in the region. The analysis reveals that there are several avenues where significant research work is needed such as the inclusion of climate change factors or the acquisition of basic data of highest quality to be used as input data for computational models. In addition, the review reveals that, despite the entire region being highly landslide prone, most of the studies have focused on few regions and large areas have been neglected. The aim of the review is to provide a reference for stakeholders and researchers who are currently or looking to work in the Indian Himalayas, to highlight the shortcomings and the points of strength of the research being conducted, and to provide a contribution in addressing the future developments most urgently needed to obtain a consistent advance in landslide risk reduction of the area.
1. Introduction
Landslides are the most frequent naturally occurring hazards that affect people and their livelihood worldwide. The frequency of occurrence in the Himalayan context is very large when compared with global events [1]. This review paper is an attempt to understand the research being undertaken to understand, assess, and mitigate landslide scenarios in the Indian Himalayan region. The need for such a review was raised from the compilation of the global landslide disaster database by Froude and Petley, [1]. In their database, a total of 5318 non-seismic landslides occurred from 2004 to 2017, of which 3285 landslides were triggered by rainfall. In the context of the Indian Himalayas, during the same period, 580 landslides occurred with 477 triggered by rainfall, thereby contributing 14.52% of the global landslides. These number could be even higher; for instance, based on NASA GLC data, the number of landslides in the Indian Himalaya during 2007–2015 is 691 with 6306 casualties (https://data.nasa.gov/Earth-Science/Global-Landslide-Catalog/h9d8-neg4).
This region covers more than 12% of India’s landmass and is very prone to landslides due to the fragile lithology, the complex geological setting, the high energy of the relief with steep slopes, and the high topographic roughness. Moreover, most of the area is seismically active and subject to extreme precipitations, and the situation has been further worsened with the increase in anthropogenic activities and the advent of climate change. Since it is a well-established fact that most of the landslides in this area have been primarily triggered by rainfall [2,3,4], the focus of the present review is only on the studies considering rainfall triggered landslides. Moreover, one of the main practical purposes of this review is to serve as a starting point for future projects which consider implementing territorial landslide early warning systems, and rainfall triggering landslides are the only ones that at present can be forecasted with a certain confidence. Studies on earthquake-induced landslides, snow avalanches, and Glacier Lake Outburst Flood (GLOF) were not considered in this review. This work also covers the various methodologies being adopted for landslide monitoring and analysis, as well as reports on various mitigation measures being undertaken along with the role of Geographic Information Systems (GIS), remote sensing, and the recent use of computational techniques.
2. Materials and Methods
2.1. Study Region
The Indian Himalayan region is one of the most diverse and heterogeneous area in terms of geology, lithology, rainfall distribution, land use/land cover, soil properties, and road and stream networks, which makes it highly prone to landslides. The region covers 16.2% (~500,000 km2) of India’s landmass as well as 10 of its states (Ministry of Environment, Forest and Climate Change, Government of India). The region extends 26°20′–35°40′ N and 74°50′–95°40′ E and covers the states Jammu and Kashmir, Himachal Pradesh, Uttarakhand, Sikkim, Arunachal Pradesh, Meghalaya, Nagaland, Manipur, and Mizoram, as well as the hill stations of Assam and West Bengal.
The region has been divided both horizontally and vertically into four and three divisions, respectively. In horizontal context, it has been categorized as Jammu and Kashmir Himalaya, Himachal Himalaya, Uttarakhand Himalaya, and Eastern Himalaya (Figure 1). Uttarakhand Himalaya is further divided into the Garhwal and Kumaon Himalayas. In terms of vertical divisions, it has been divided into Great Himalaya, Middle Himalaya, and Lesser Himalaya or Shivalik Ranges [5]. Geologically, the Himalayas are broadly divided into four areas across its length: (i) Foothill or Outer Himalaya; (ii) Lesser Himalaya; (iii) Higher Himalaya; and (iv) Tethyan or Trans-Himalaya [6]. The major rivers that originate from the great Himalayan Mountain Ranges are the Indus, Ganges, and their various tributaries. The region exposes diverse geology with different rock types representing the complete spectrum ranging in age from Archaean metamorphites/granitoids to the youngest Quaternary alluvium.
The region is tectonically and physiographically divided into three broad domains: the Peninsular India, the Extra-Peninsular India, and the Indo-Gangetic Plain [7]. The Indo-Gangetic plain is sandwiched between the shield area of the Peninsular India and the highly deformed suites of the Himalaya of Extra-Peninsular India, comprising essentially the younger meta-sediments. The tectonic trough (foreland basin) sandwiched between peninsular shield in the south and Himalayan Mountains in the north formed due to upliftment of the latter has been filled up by sediments derived from both sides, especially from the Himalayas. Structurally, the Himalayan Mountain chain occurring all along northern part of India can be divided into four contrasting longitudinal litho-cum-morphotectonic belts from south to north: (i) foothill belt; (ii) Main Himalayan belt; (iii) Indus-Shyok belt; and (iv) Karakoram belt.
The foothill Himalaya is a 10–50 km wide Miocene to Lower Pleistocene Molasse sequence represented by Siwalik, Murree, and Subathu Group of rocks. The belt is a domain of active tectonics, having participated in the terminal phase of the Himalayan Orogeny. This is followed to the north by the Lesser and Higher Himalayas, represented by geological sequences of Proterozoic age with a Phanerozoic cover of varying thicknesses in different parts. The foothill Himalaya is overlain by alluvium and separated from the Lesser Himalaya by the north-dipping fault commonly known as the Main Boundary Fault (MBF) or the Main Boundary Thrust (MBT) in Garhwal, Kumaon, Darjeeling, and Arunachal Pradesh Himalaya. The Main Frontal Thrust (MFT) limits the margins of the Siwalik Zone against the Ganga Plains [8].
The Lesser Himalaya is 60–80 km wide and is a discontinuous belt stretching between the MBT in the south and the Main Central Thrust (MCT) in the north [9]. It consists of autochthonous Late Proterozoic sediments, thrust over by three vast nappes that are built up successively of Palaeozoic sediments, Precambrian epimetamorphics, and mesograde metasediments [10]. The epi-metamorphic and meso-metamorphic nappes throughout their extent are characterized by Early Proterozoic (= 1900 Ma) and Early Palaeozoic granitic bodies of large dimension. The MCT separates the Lesser Himalaya from the Higher Himalaya to its north. The Higher Himalaya marks the region of the highest peaks of the Himalaya (Nunkun, Leopargial, Kedarnath, Badrinath, Nanda Devi, Api, Dhaulagiri, Mt. Everest, and Kanchanjunga), made up of 10–15 km thick Precambrian crystallines exhumed up and intruded by granites, some of which are Tertiary in age. The Indus Shyok belt/the Tethys Himalaya extend to the south of the Trans-Himalayan Karakoram belt and comprise ophiolite melange (Indus ophiolite and associated formation) and plutonic rocks (Ladakh Granitoid Complex) of the Indus Shyok belt [11]. These predominantly fossiliferous sediments range in age from Late Proterozoic to Eocene. Sporadic occurrences of chromite have been reported from the ultrabasic rocks associated with Dras volcanics from Ophiolite-Melange zone. Karakoram belt, the northernmost zone, comprises Palaeozoic and Mesozoic sedimentary sequence in a metamorphic basement of an unknown age. This Trans-Himalayan belt lies to the north of the Indus suture Zonein Ladakh region and extends eastward into Tibet. No important mineral occurrence is known from this belt. Figure 2 represents the geological map of the Indian Himalayan region.
2.2. Data Collection
The review was undertaken by carrying out a bibliographic search on “Web of Science” Database (1990–October 2019) for a combination of keywords: “Landslide*”, “Himalaya*”, and “India”. For the current analysis, only peer-reviewed journal articles written in English were considered, as peer-reviewed journals are considered as having the best quality articles and because the English language ensures that these contributions could be fully understandable for the whole international scientific community. The filtering of the articles was carried out by the number of citations (a) articles published before 2008 with 10 or more citations; (b) articles from 2008 to 2010 with 5 or more citations; and (c) all articles thereafter independent of the number of citations received (following the approach adopted from Reichenbach et al. [12]. After performing a screening of the relevant studies, the number of selected articles was narrowed down to 226 (Figure 3).
The articles were published across 75 different journals, with nearly 60% of the works published in 11 journals (Figure 4). The articles were initially majorly published in Engineering Geology and Geomorphology. The focus has shifted towards other journals such as Natural Hazards, Landslides, and Geomatics, Natural Hazards and Risk. Generally, after a major landslide event, the preliminary report is published in Current Science. However, extensive analysis of landslide study misses in such journals and is mostly focused on post-landslide studies.
3. Results
The analysis reveals that the landslide studies in the region are quite biased towards Uttarakhand region, while there are few to no studies in the northeast Indian region (Figure 5).
This bias can be attributed to the high population density in the western sector of the Indian Himalaya, leading to a larger number of casualties and a generally higher level of landslide risk. Pham et al. [13] calculated the number of casualties due to landslide incidences during 2007–2015, which came out to be 5228, a staggering 82.9% of all disaster casualties in the region. To understand the type of studies being conducted, we divided them into seven broad categories: description of main events; identification; forecasting; monitoring and investigation; river damming; extreme events and climate change; and susceptibility mapping.
3.1. Main Landslide Events
The Himalayan region has been affected by several landslides, and a few of the most researched and damaging landslides are mentioned here. Most studies have been carried out in the Uttarakhand region. Some major landslide events in the Uttarakhand region occurred in the Okhimath area in Mandakini Valley, which was significantly damaged by the August 1998 landslide event, triggered by heavy rainfall. In total, 466 landslides were triggered, leading to 103 deaths and damaging 47 villages. Thereafter, cloudburst on July 2001 in a part of Mandakini valley led to more than 200 landslides causing 27 fatalities and affecting almost 4000 people [14]. The region also suffered from a heavy rainfall of more than 200 mm during 13–14 September 2012, which led to the death of 51 people and caused 473 landslides [15]. June 2013 witnessed another heavy rainfall of 350 mm within a period of five days in the Chamoli and Rudraprayag districts of Uttarakhand [16]. Other major landslides in the Uttarakhand region were the 2009 landslide in Pittorgarh region with a loss of 43 people.
Another major landslide affected region is Himachal Pradesh, of which the area of Katropi has often been studied [17,18]. The area has a history of recurring landslides since 1977 and recently it suffered from major landside in August 2017 claiming 46 lives [17]. The Pawari landslide zone has also been an active landslide zone located in the southeastern part of the state, which expanded 7% during 2005–2014 [19]. The Luggarbhati landslide in 1995 and Dharla landslide event in 2007 claimed 65 and 62 lives, respectively. The Jammu and Kashmir region has suffered from major cloudbursts such as the Leh Nalla cloudburst (2005, 2006), Leh cloudburst (2010), and Baggar cloudburst (2011) [20].
In the northeast part of the region, most reported landslides have been in the Darjeeling area of West Bengal and Sikkim. The Darjeeling region has a history of several landslides with the first major recorded occurrence in 1899, which led to the death of 72 people. Thereafter, landslides happened in 1950 (127 people died) and 1968 (667 people died) [21]. The region has also suffered significant landslides in the late 20th and 21st century (1991, 1993, 2004, 2005, 2006, 2009, and 2015) [22]. Similarly, the Sikkim region faced numerous landslides such as the Lanta Khola landslide [23], south Sikkim area [24]. The prominent unstable sections in the northeast region of the Indian Himalaya are National Highway (NH)-40 [25] and NH-44 [26] in Meghalaya. In Mizoram, NH-44A has suffered several landslides, in 2011, 2013 and 2017 [27].
3.2. Landslide Identification
The identification, visualization and standardized classification is an important step for pre- and post-hazard landslide analysis, which could assist in assessing rescue and relief operations [28]. Historically, landslide damage assessment was carried out using field visits and categorizing it according to the block diagrams depicted in [29]. However, understanding landslide scenario using such simplistic illustrations fails to consider the surrounding morphometry and its contextual relationship. With the advancement of remote sensing technologies and availability of high spatial and temporal resolution data, researchers have attempted to map landslides using image classification techniques. In the case of Indian Himalaya, the identification of landslides after an event has been mostly carried out by scientists at National Remote Sensing Centre (NRSC). Vinod Kumar et al. [30] studied Varunawat Parbhat landslide in Uttarakhand following the September 2003 landslide event using post-landslide Stereoscopic Earth Observation data on a 1:10,000 scale. The availability of high-quality images enables researchers to identify the loss of vegetation and exposure of fresh rock and soil after the landslide event [31]. The methodologies to assess landslide damages using pre- and post-landslide event images can be categorized as pixel based (PB) (medium resolution images) and object based (OB) (high-resolution images). Pixel based method involves the use of pre- and post-event images, and landslides are identified using spectral information. The identification of the landslides is mainly based on change detection and image fusion techniques. However, the use of pixel-based identification approach has some limitations. Firstly, the availability of images (pre- and post-event) may not be available from the same sensor, including variation in the atmospheric conditions and bandwidth of spectral values. Secondly, the representations of landslides are based on pixel values. On the other hand, object-based approaches use spectral, shape, spatial, and contextual properties and the identification is carried out using an object rather than a pixel, which makes more sense for natural events such as landslides as the damages are of irregular size and shape. It has the potential to add morphometric information derived from Digital Elevation Model (DEM).
The work conducted in the Indian Himalayan region has been primarily conducted using an object-based image classification technique. The use of OB image classification is dependent on the data type and methodology being used. The methodology involves detection, segmentation, and classification of images. The detection procedure can further be categorized into: (i) direct object change detection; and (ii) classified object change detection. The first detection technique involves the comparison of two images for changes in geometrical and spectral information acquired at different times. Such approach is usually used when comparison is made between images acquired from same satellite sensors and generation of full change matrix is not an absolute requirement. In the latter approach, first segmentation and classification are performed independently using time series images, and then the change matrix is derived using classified images. The second approach is mostly used in land use/land cover change analysis as well as when time series data are acquired by different satellite sensors [32]. The studies conducted in the region have mainly used the first approach as a single feature, i.e., the landslide is analyzed and the changes are estimated from images acquired from the same sensor.
The capability of detection using object-based analysis depends on the segmentation technique being used, which has the ability to excerpt objects that accurately describe the relevant properties [32]. The most popular segmentation technique for classification of images is the multi-resolution segmentation (MRS). This segmentation approach is a bottom-up region-merging technique, wherein small objects are merged into bigger ones in subsequent steps, and involves three parameters: scale, shape, and compactness. The scale parameter handles the size of the image object size, whereas the shape parameter determines the degree to which shape influences segmentation vs. spectral homogeneity. The compactness defines the weight of the compactness criteria. The higher the value is, more compact the objects will be [33]. Several methods exist to select an optimal scale parameter, of which plateau objective function [31,32] and optimal scale parameter selector [34] have mostly been used. However, obtaining a desired scale for all the landslide types in an area is difficult, thus over-segmentation is preferred to under-segmentation [35].
The use of the OB technique has been used for landslide detection immediately after a landslide event, as well as for creating a landslide inventory database from historical images. Martha et al. [35] prepared landslide inventory data for the 1998 Uttarakhand landslides in Okhimath region, Uttarakhand and compared with the field data acquired after the landslide event. The study identified 73 landslides using Resourcesat-1 LISS-IV multispectral data (5.8 m) and a 10-m Cartosat-1 derived DEM. This semi-automatic approach resulted in achieving an accuracy of 76% for recognition and 69% for classification in terms of number of landslides. Thereafter, Martha et al. [31] used historical panchromatic image dataset (1998–2006) for the same region to prepare a landslide inventory database. The images were acquired from Cartosat-1 (2.5 m) and IRS-1D (5.8 m) and depicted the use of texture in cases of missing spectral information. Martha et al. [36] analyzed various time series images (1997–2009) for Okhimath region, Uttarakhand using Cartosat-1 (2.5 m), Resourcesat-1 (5.8 m), and IRS-1D panchromatic (5.8 m) data. For the entire period, the accuracy of landslide detection varied from 60% to 89%, whereas it varied from 71% to 97% in terms of landslide extent.
The identification and classification of landslides is available for two severe landslide events occurring in Uttarakhand in September 2012 [15] and June 2013 [16,32]. Martha and Vinod Kumar [15] used very-high resolution (VHR) satellite data (Resourcesat-2 (5.8 m), Cartosat-2 (1 m), Kompsat-2 (1 m), GeoEye-1 (0.5 m), and Cartosat-1 DEM (10 m)) covering the September 12 Uttarakhand landslide event and identified 473 landslides. Martha et al. [16] compared pre-disaster images (Resourcecat-2 and GeoEye-1) with post-disaster images (Resourcesat-2 and Cartosat-2a (1 m)) after the June 2013 Uttarakhand event. The study identified 6031 landslides and classified those as new (57.74%), old (18.92%), and reactivated (23.34%). Martha et al. [32] identified new landslides by comparing the pre- and post-landslide Resourcesat-2 images with a detection accuracy of 81%. Mohan Vamsee et al. [34] improved the scale component of MRS technique and developed the optimal scale parameter selector (OSPS) tool, which was applied to Uttarakhand region using Resourcesat-2 images.
However, the accuracy of the above-mentioned techniques largely depends on the resolution of the satellite images that are costly to be acquired. Therefore, free and high-resolution Google Earth (GE) images have also been used for landslide mapping [19,37]. The ability of such images to provide a 3D view and its free availability can serve researchers to exploit imagery for landslide detection and mapping [38]. Kumar et al. [37] utilized GE images for landslide dimension mapping along Satluj Valley in Northwest Himalaya. Further, Kumar et al. [19] conducted a study on a relatively smaller area (Pawari landslide) in the same region and analyzed the changes using GE images of 2005, 2012, and 2014.
As landslide mapping is the first key step towards conducting any landslide study or to set up recovery attempts after a landslide event, focus should be on the use of high temporal resolution dataset. The focus has primarily been on the use of semi-automatic identification approach and gradually improving the algorithms used to detect and classify landslides [16,28]. The classification and segmentation techniques need to be improved using computational techniques such as Machine Learning (ML) and Artificial Neural Networks (ANN) [39]. In addition, the studies have largely been concentrated in a single area and need to be applied to other Himalayan regions to understand their applicability and reliability.
3.3. Landslide Forecasting
Landslide forecasting is a key element for disaster risk reduction and is also the most challenging. Most of the landslides in the Indian Himalayan region are shallow in nature, of which rainfall is the primary triggering factor [3,4]. The analysis of precipitation for landslide occurrence can be performed by estimating minimum rainfall conditions, sub surface monitoring, or slope stability analysis. The minimum rainfall conditions, also known as thresholds, can be classified as empirical and physical approaches [40,41,42]. Physical models assess the relationship between rainfall conditions and hydrological conditions of the soil, which affects slope stability. The model analyzes the spatial variation of several factors such as geotechnical parameters, soil depth, volumetric water content, geology, and topography to determine the pore water pressure change and estimate the factor-of-safety. Such models need a large dataset of many parameters in spatial and temporal context, which is usually not available for the Indian Himalaya. Empirical methods analyze the rainfall conditions using statistical methods to determine threshold levels of precipitation. Such models are simpler to apply because they require only the spatial and temporal dataset of precipitation and landslide events [43,44]. The threshold values can be greatly affected by the data quantity and quality, the rain gauge density, and the methodology used. The thresholds are usually determined by drawing (usually with statistical techniques) a lower line to the precipitation conditions corresponding to landslide events in log-log, semi-log, or Cartesian coordinate system [3,41]. Segoni et al. [43] reviewed the type of thresholds, data collected, and other important information for thresholds determined in the global context for 2008–2017.
The studies on rainfall thresholds for the Indian Himalayan region have been very limited. The use of empirical approach has been explored for different Himalayan regions. Sengupta et al. [45] proposed the use of EMAP for Sikkim Himalayas, which is the ratio of cumulative event rainfall (E) to mean annual rainfall (MAP) (EMAP = E⁄MAP), instead of rainfall event-duration (ED) or rainfall intensity-duration (ID) thresholds. Kanungo and Sharma [3] determined ID thresholds for Garhwal Himalayas using best fit of the lower boundary of ID plane. Dikshit and Satyam [4] developed the ID thresholds for Kalimpong region using frequentist statistical approach. The use of probabilistic [22,46] and semi-automated algorithmic approach [47] has only been attempted for Kalimpong region. Harilal et al. [48] developed both regional (Sikkim) and local (Gangtok, Sikkim) ID thresholds using statistical approach. The main concerns with these studies are the coarse spatial distribution of rain gauges, all studies being performed using a single rain gauge, and the availability of only daily rainfall data. In this regard, Gariano et al. [49] highlighted that a coarse temporal resolution dataset of precipitation could lead to an underestimation of rainfall thresholds, which culminates in a higher number of false alarms when using thresholds for operational early warning system. In addition, the thresholds determined are rainfall intensity-duration thresholds, which should be avoided, while the determination of event rainfall-duration (ED) thresholds should be encouraged. Mathew et al. [50] established ID thresholds along the Rishikesh–Mana pilgrimage route for Garhwal Himalaya using Tropical Rainfall Measuring Mission (TRMM)-based Multi-satellite Precipitation Analysis (TMPA) data. Despite using different methods to determine various aspects of rainfall characteristics, all studies were unified in the effect of antecedent rainfall in the region. Mathew et al. [50] also suggested that antecedent rainfall ranging from 15 to 30 days plays an influential role for destabilizing slopes in the Himalayan region, which leads the subsequent rainfall of short duration (24–72 h) to trigger landslides. The studies on rainfall thresholds in the Indian Himalayan region have been very minimal and more work should be conducted on the calculation and analysis of regional and local thresholds. Kumar et al. [51] highlighted that the mean rainfall threshold intensity of NW Himalayas (excluding Sikkim Himalayas) is roughly 290 mm/day. At present, defining rainfall thresholds at regional scale or at a state administrative level would be highly desirable but is hard to accomplish. The variation in the thresholds determined also ascertains that local thresholds would perform be better than regional thresholds in setting up an operational landslide early warning system. This could be due to the heterogeneous rainfall pattern at local scales in various Himalayan pockets. Table 1 lists the various thresholds generated for different regions of the study area. Figure 6 illustrates the thresholds in ID plane.
3.4. Landslide Monitoring and Investigation
Landslide monitoring is a very significant aspect of landslide assessment, especially in the Indian Himalayan region where the slopes are generally creepy in nature, which could immediately fail during an abrupt rainfall event or seismic occurrence. Landslide monitoring is generally categorized into three types [53]:
- Observing the changes of topography and cracks on the surface during the site investigation. This is a traditional monitoring technique used by geologists at regular time periods. The major limitation of using such a technique is that it does not provide the variations for a short time interval and it is difficult to accurately determine the time and location of future landslide incidences.
- Remote sensing techniques such as satellite imagery analysis, GPS synthetic aperture radar (SAR) interferometry, and light detection and ranging (LiDAR). These methods can be helpful as they can measure slope displacement over a large area independent of the weather conditions.
- In situ ground-based observation of slope movement using various instruments (extensometers, inclinometers, and tiltmeters) and installing rain gauges to accumulate local rainfall data. For example, Dikshit et al. [54] used tilt sensors for Darjeeling Himalayas, while Falae et al. [55] used Electrical resistivity tomography (ERT) for Garhwal Himalayas.
Of the various monitoring techniques, the use of remote sensing (RS) data along with traditional monitoring instruments would prove to be very helpful especially in understanding long-term deformation and the advancement in RS technology would gradually overcome the use of traditional equipment. In the case of Indian Himalaya, monitoring studies include remote sensing techniques and ground based observation. Yhokha et al. [56] used the Persistent Scatterer Interferometry (PSI) technique using ENVISAT satellite for Lesser Himalaya, Nainital. PSI is based on InSAR technique, which utilizes several SAR images and has proved to be successful in identifying the creeping zones in Nainital. Martha et al. [57] monitored the landslide dammed lake in Zanskar Himalayas for five months (January–May 2015) using multi-temporal high-resolution satellite images after the landslide event (December 2014) and depicted the variation in the dimension of the impounded lake during the monitoring period. Dikshit et al. [54] and Dikshit and Satyam, [22] used tilt sensors at shallow depths to analyze the variation in tilting angle of the instrument, which is related to the lateral displacement of the slope. The study also validated the empirical models thereby encouraging similar studies to be conducted in other Northeast Himalayan regions, which could help in setting up a preliminary early warning system.
The investigation of unstable slopes in the Indian Himalaya has been conducted using Ground Penetrating Radar (GPR) or 2D Electrical Resistivity Tomography (ERT). Mondal et al. [58] conducted ERT investigation for Naitwar Bazar landslide in Uttarakhand for six sites, which was active after the 2004 event. Kannaujiya et al. [59] compared slide dimensions observed from satellite (IRS LISS-IV) with geophysical investigation and determined the depth and slip surface geometry using 2D ERT and GPR) for Kaliganga river valley in Uttarakhand. Falae et al. [55] used ERT to understand the subsurface movement to determine the probable failure plane of the Pakhi landslide, Uttarakhand. Sharma et al. [60] conducted a geophysical study at Lanta Khola Landslide, Sikkim using very low-frequency (VLF) electromagnetic survey to understand the subsurface structure. The results reveal the presence of a water-saturated zone at the subsurface level of the slide.
The literature review reveals that only a handful of studies have been carried out for landslide monitoring and investigation; considering the increased quantity of the available remote sensing data sources, the focus needs to shift towards the use of high spatial and temporal resolution data, which would lead to near real-time monitoring results. The framework using sub surface investigation is ideal at a local scale and would fulfill the demands of a community but would be difficult to manage in long term due to the high installation and operational costs. However, in sections where the landslide problem is immense, which is slide specific, such as Paglajhora landslide (Darjeeling), Singtam landslide (Sikkim), or Kotropi landslide (Himachal Pradesh), monitoring using instruments would still be required as the region is highly vulnerable and satellite images at currently available resolution may not be able to accurately identify failure planar sections.
3.5. Lake Damming Landslides
Landslide lakes or dams are temporary lakes in the river valleys formed after a landslide blocks the river course. Landslide dammed lakes and their outburst floods (LLOFs) are common in the Indian Himalaya. The breaching of such temporary lakes with a huge amount of accumulated water and sediments can create devastating floods in the downstream areas [61]. In the Himalayas, landslide dams commonly form in high mountains because of different mass movement types such as rock and debris avalanches, rock and soil slides, mud–debris–earth flows. The oldest recorded landslide lake was the Gohna Tal, which was formed in September 1893 as a result of heavy precipitation blocking the Birahi Ganga River situated in the Kumaon Himalaya. Gradually, the lake expanded to an approximate 4000 m length, 340 m width, and 300 m depth. On 26 August 1894, the dam collapsed, and a devastating flood hit downstream of Birahi Ganga [62].
The techniques used for assessment of damming processes are either based on geomorphic characteristics, hydraulic properties, and velocity measurement of dam material. The assessments of the damming process are dependent on the analysis of three significant factors: (a) pre-dam formation mechanism; (b) dimensional characteristics of the dam; and (c) stability analysis of dam [63]. The pre-dam formation mechanism largely depends on the slope stability analysis and landslide triggering factors, whereas dimensional characteristics are dependent on geometry of the area and landslide volume. In terms of slope stability, the techniques can be categorized as discontinuum modeling and continuum modeling [63]. Discontinuum modeling is majorly used for rock slope stability analysis, whereas continuum modeling is used for debris flows as well as rock slopes dependent on the material and geometry of the slope [19,64].
Most of the studies have focused on geomorphic analysis [15,16,57,63] using different satellite images to understand the spatiotemporal landslide changes. Gupta and Sah [65] catalogued the LLOFs developed in the Trans-Himalayan region between 2000 and 2005 and studied its impact on the stability in the region. Martha et al. [57] conducted an extensive investigation of Phutkal River landslide dammed lake for landslide occurrence on 31 December 2014 using multi-temporal Cartosat-2 images of 1 m spatial resolution and calculated slide volume using pre- and post-event datasets. Kumar et al. [63] used GE images of 1.5 m resolution and estimated landslide volume along with slope stability analysis for Urni landslide in Himachal Pradesh.
3.6. Extreme Events and Climate Change
The effect of global warming and the corresponding changes to climate and geohazards is expected to affect landslide events [66]. However, forecasting and understanding the impact of climate change on landslide activity still poses a challenge. Gariano and Guzzetti [66] in their review article on climate change studies related to landslides emphasized the need for more studies as large parts of the world suffer from a few to no studies. Although it is predicted that the Indian Himalaya region will be affected by climate change at the time of compiling this article, we could not find any article in which the effect of climate change has been considered in the Indian Himalaya for any type of rainfall-induced landslide study. However, some works exist that describe some of the most recent extreme rainfall events: Jammu and Kashmir Himalaya for the 2014 rainfall event [51], Uttarakhand Himalaya for the 2009 event [67], and Leh region for the 2010 event [68]. One of the main reasons for the lack of inclusion of climatic variation in landslide studies for the Indian Himalayan region is the unavailability of data both in spatial and temporal context, which has been highlighted by several researchers. Kumar et al. [51] estimated that the pattern of rainfall intensity along the Himalayas varies from west to east, thereby precipitation patterns being affected by western disturbances and summer monsoon. Such lack of studies in a region such as the Himalayas, which is prone to severe landslides and other geohazards, is a matter of concern. Hereon, studies should include climate aspects using remote sensing products, which could reconstruct events and provide a better understanding of climate impact.
3.7. Landslide Susceptibility
Landslide hazard is defined as the probability of landslide occurrence of a specific type (“when” or “how frequent”) and magnitude (“how large”) [12]. The spatial probability of landslide hazard is assessed by carrying out landslide susceptibility mapping or popularly known as landslide hazard zonation mapping. Landslide susceptibility assessment determines potential of landslide event considering several predisposing factors and investigating their spatial distribution [12]. The spatial occurrence of landslides is controlled by several and sometimes inter-playing factors such as geological setting, rainfall, morphology, soil, and vegetation conditions, thus landslide susceptibility assessment is not a straightforward task, and many methodologies have been developed to assist the susceptibility analysis. The classification techniques used for landslide susceptibility models has also changed over time. We categorized them into four groups: Qualitative, Semi-quantitative, Quantitative, and Deterministic (Figure 7). In this section, we explore the models, the parameters used, and the trend in susceptibility analysis.
Initially, studies were mostly based on qualitative methods wherein values are ascertained for landslide conditioning factors based on the knowledge about the study area and are quite subjective [69,70]. Semi-quantitative methods are logical tools and emphasize the significant factors by assigning weights or values. These include techniques such as Analytic Hierarchy Process (AHP), danger pixel approach, and a weighted linear combination [71].
The deterministic analysis involves an analysis of physical and mechanical soil properties and determines the susceptibility in the form of a factor of safety (FS) [72]. FS is the ratio between factors affecting landslide to factors preventing landslide incidences. This involves the utilization of several factors such as infiltration, soil cohesion, groundwater table, pore water pressure, geotechnical soil parameters, etc. Several deterministic models are available to determine slope stability such as SHALSTAB (Shallow Landsliding Stability model), SINMAP (Stability Index Mapping), SHETRAN, TRIGRS (Transient Rainfall Infiltration and Grid-based Regional Slope Stability) model, etc. In the case of the Indian Himalayas, Sarkar et al. [72] used SHALSTAB model to determine the critical steady-state rainfall for slope stability in Darjeeling Himalayas. A landslide inventory map was developed using various satellite images (Resourcesat -1, Cartosat -1, and Google Earth) and field surveys, soil parameters (depth, saturated soil density, engineering properties, and soil transmissivity), and slope parameters (angle, contour length, and upslope contributing area). Mathew et al. [73] determined FS for terrain stability for Garigaon watershed area of Uttarakhand by coupling an infinite slope stability model with a steady-state hydrological model (LIDA) using the spatial analysis in GIS environment. The landslide locations were mapped using LISS IV and Cartosat-1 PAN data and the input parameters used were soil texture, index properties, porosity, LULC, and terrain properties. The results indicate an increase in the unstable areas of more than 45% for rainfall intensity variation from 50 to 100 mm/day.
Quantitative models depend on the landslide density under each influencing factor and can be further classified as a bivariate and multivariate [74]. Both bivariate and multivariate statistical models compute weights; however, multivariate techniques depend on the collective effect of parameters [75,76]. Bivariate statistical methods include weights of evidence, frequency ratio, information value, and the combination of frequency ratio and fuzzy methods [77,78,79]. The most popular multivariate model used is logistic regression [80]. The analysis shows that most studies have used quantitative techniques, of which logistic regression has been most used [81,82,83]. Thereafter, frequency ratio and information value were used 16% and 9% of the studies, respectively [74,84,85,86,87,88]. In terms of semi-quantitative models, AHP has been the most used method (Figure 8).
After understanding the various models being used to determine susceptibility, the analysis of the parameters being used was investigated. The use of parameters for susceptibility analysis would affect the results; however, they usually depend on the local factors along with data availability. In addition, the factors depend on the type of movement, scale of study and the methodology used [89]. Based on the analysis of the articles, the factors influencing landslide susceptibility can be divided into four groups: (i) geological (lithology, geological structures); (ii) geomorphological (drainage, relative relief, slope, and slope aspect); (iii) environmental (land cover); and (iv) anthropogenic (roads). In the 81 studies, 36 factors were used, where some factors such as “gradient” and “slope” were clubbed together, and a word map of the factors is illustrated in Figure 9. The most used factors were slope angle (93.8%), land use/land cover (LULC) (92.5%), aspect (80.2%), and lithology (62.9%). Apart from these factors, another set of parameters, namely drainage density, curvature, topographic wetness index (TWI), stream power index (SPI), relative relief, lineament distance, and lineament density, was also utilized. Seismic factors, fault buffer, and road buffer have been less frequently used. The trend over the years in the number of factors to be used has increased with an average of six factors being used until 2010 and an average of eight factors thereafter. This trend can be ascertained to the increase in the availability of data and remote sensing products.
In terms of the spatial resolution of the dataset used to determine susceptibility, the most commonly used Digital Elevation Model (DEM) is the one released by USGS, with a spatial resolution of 30 m (46%). Only 28% of the studies used a spatial resolution higher than 10 m, which was obtained from Cartosat-1 images, whereas 26% of studies used the dataset with a spatial resolution of 12.5 m from ALOS-PALSAR DEM. The scale of geological maps has generally been 1:250,000 (62%) while the remaining 38% studies were conducted using 1:50,000 scale. Anbalgan [69] formulated the guidelines for landslide hazard assessment based on Landslide Hazard Evaluation factor (LHEF) using factors such as structure, relative relief, lithology, slope morphometry, land use, and groundwater conditions. The LHEF rating system was based on determining the factors and assigning values based on the understanding/knowledge about the study region. The national standard body of the country, Bureau of Indian Standards (BIS), prepared its guidelines (BIS, 1998) based on Anbalgan’s study using the same factors excluding groundwater conditions [90]. BIS recommends an indirect method for medium-scale (1:25,000–1:50,000) landslide susceptibility mapping. Such technique is a generalized method that could be applied over large regions regardless of the relationship between causative factors and landslide types, often leading to moderate to poor predictions [91].
Following this, the nodal agency, Geological Survey of India (GSI), developed its own guidelines (GSI, 2005) considering 10 factors, which is a modified version of BIS (1998). Singh et al. [90] compared the zonation maps prepared using BIS and GSI guidelines for Arunachal Pradesh and found that GSI guidelines were better than BIS guidelines. Das et al. [92] studied homogenous susceptible units (HSU)-based landslide hazard utilizing spatiotemporal data and landslide size, which could better represent homogeneous susceptible regions. The study was conducted using high-resolution data for Northern Uttarakhand region. Martha et al. [36] applied the weight of evidence model to determine the susceptibility using a semi-automatic derived landslide inventories. Sarkar et al. [93] was the first to introduce landslide intensity as a parameter for hazard determination, which was applied for Garhwal Himalayas. The intensity was determined by analyzing the volume and velocity, which depends on the landslide area, debris thickness and the types of failures.
However, lately, the rise has been in the use of computational techniques such as Machine Learning (ML), Support Vector machine (SVM), and Artificial Neural Network (ANN), which have proved to outperform traditional approaches [13,94,95,96]. However, the studies have largely focused on landsides in Uttarakhand Himalayas. Ramakrishnan et al. [97] used backpropagation neural network and showed prediction capability of 80%. Pham et al. [98] used various ML ensemble models using Multilayer Perceptron (MLP) Neural Networks and six different ensemble techniques, thereby depicting better capability using ensemble framework. Pham et al. [99] analyzed susceptibility for an area of 323 km2 in Uttarakhand using various ML models (SMO-SVM, VFI, and LR), FT, MLP-neural networks, and NB. In the first case, SMO-SVM performed best, whereas, in the latter case, MLP neural networks and FT models provided similar accuracy compared to NB. Pham et al. [13] used four hybrid machine learning models for Uttarakhand Himalayas. Pham et al. [13,95,100] extensively analyzed the Pittorgarh region (242 km2) in Uttarakhand using various hybrid ML models (Table 2).
Kanungo et al. [107] compared susceptibility map for Darjeeling Himalayas using traditional, ANN, fuzzy, and combined neural fuzzy weighing schemes and found the combined neural fuzzy model to provide more accurate results. Following this, two different models (combined neural certainty and fuzzy) were compared with the neural fuzzy model for the same region and the latter was found to be better [108]. Chawla et al. [109] used Genetic Programming (GP) and Particle Swarm Optimization (PSO) SVM model for the Darjeeling Himalayan region and found GP method to perform better. Meena et al. [110] conducted susceptibility analysis using a hybrid spatial multicriteria evaluation model for Kullu, Himachal Pradesh and found it to produce better results when compared to FR and AHP.
4. Discussion
The results of the review provide researchers a comprehensive insight to understand the studies being conducted in various avenues of the Indian Himalaya, thus providing a general picture of the state-of-the-art in this region and a reference point for those (researchers and practitioners) starting to work in this area for the first time. Moreover, the analysis of the results can be useful in identifying some existing research problem and the most important research questions to be addressed in the near future.
The first gap to be urgently filled is the lack of studies in regions such as the Northeast and Jammu and Kashmir Himalayas. Since research programs have focused mainly on Uttarakhand region, which is understandable given the high population density and risk exposure, more efforts need to be made to analyze other regions as well and to help policy makers in formulating a general guideline towards mitigation. Another issue is the urgent need for high quality data, as many of the reviewed studies suffer from the coarse dataset being employed. As an instance, rainfall thresholds have been conducted using a very sparse rain gauge network that measures rainfall only at daily time steps; and most of the susceptibility studies make use of a very coarse geological map at the 1:250,000 scale. It is well established that the poor quality of input data has a negative impact on the quality of the results of any scientific model; therefore, priority should be given to the acquisition of high-resolution basic data for further research.
In the Indian Himalaya, many studies have been conducted that explore different disciplines of landslide research in various regions, and a precise framework is not evident. One of the next steps of research in the region could be the combination of existing studies in a more comprehensive and coherent framework aimed at assessing and reducing landslide risk. For instance, susceptibility maps could be used to define the most hazardous areas, rainfall thresholds to provide temporal forecasts especially for rapid movements, regional scale remote sensing systems to get a general overview of slow-moving landslides, and ground based monitoring systems could be employed for management of the hot-spots at highest risk level. Similar programs should also consider landslide hazard evolution as influenced by climate change and human modifications to the territorial setting.
Another significant gap highlighted by the review is that, even though landslides are a well-known source of risk in the area, a quantitative risk assessment has never been carried out, thus all past and present risk reduction strategies are implemented without a comprehensive framework that could optimize the efforts made. At present, landslide hazard studies are also quite limited: examples exist that encompass temporal probability of occurrence (by means of rainfall thresholds) or spatial probability of occurrence (by landslide susceptibility maps). A spatiotemporal hazard assessment would be desirable and, to obtain it the future, two options could be explored: the application of distributed physically-based models (which, in turn, require the acquisition of many input parameters with high spatial density—see, e.g., Tofani et al. [111]) or the adoption of simpler approaches based on the dynamic combination of rainfall thresholds and susceptibility maps [112].
Several techniques have been used to understand various aspects; however, the use of computational techniques has been limited to susceptibility and hazard analysis. It is encouraging to see the use of advanced machine learning techniques (ANN, SVM, and Random Forest) for landslide mitigation. However, the use of deep learning and artificial intelligence, which shows great promise in geohazards and climatic studies, is yet to be performed for the Indian Himalayan region. The use of advanced computational techniques (deep learning) especially for landslide identification is one aspect which researchers should look to exploit.
5. Conclusions
This review paper is an attempt to understand the studies being conducted in the Indian Himalayan region, which contributes almost 15% of the global rainfall-induced landslides. The article focuses only on landslide activity which was triggered due to rainfall as it reflects a significant portion to landslides in the Indian Himalaya and it is the only typology that can be managed by early warnings and forecasting models. The review reveals that there are several avenues where significant progress is required, especially in the aspect of climate change, use of high spatial and temporal resolution data, and new methodologies such as physical methods and computational approaches. The study highlights key topics in which the research has focused: susceptibility mapping, identification, and slope stability analysis. The conclusions from each sub-section are as follows:
- Landslide assessment (including identification, threshold estimation, and monitoring of landslides). For landslide identification and mapping, focus needs to shift in three key directions:
- Use of automated approaches involving the use of computational techniques.
- Use of higher temporal resolution datasets and assessment of their reliability.
- Application of the current techniques towards other significant landslide prone Himalayan regions. In terms of rainfall threshold studies, the number of articles were less than 10 with most of the work focused on the use of statistical models to define a single threshold, and majorly the Eastern Himalayas have been covered. The thresholds developed show large differences when calculated for regional and local scale, therefore it is suggested to develop thresholds at local scale to improve the understanding of the region and help in setting up an operational landslide early warning system. In general, the thresholds are very low if compared with other literature thresholds, thus confirming the basic assumption that the India Himalaya is very susceptible to landsliding. Additional research needs to be conducted on the use of physical models, including campaigns aimed at gathering input data for more complex models; moreover, efforts need to be made on the combination of empirical and physical models for a better understanding of landslide initiation.
- Landslide monitoring has been performed using both ground instrumentation and satellite data, however a general multi-scale approach that extensively covers the whole region is missing.
- The focus needs to shift on include climatic factors for landslide assessment as climate change is unequivocal. The use of climate models needs to be conducted with caution, especially when downscale projections are considered. As the climatic conditions are quite varied from west to east, focus should also be on the use of appropriate down-scaling models.
- The studies on landslide susceptibility was found to have a regional bias and more research needs to be conducted in the Jammu and Kashmir Himalayas and the northeastern belt. Emphasis has primarily been on specific states and regions such as Uttarakhand, Darjeeling, and some areas of Himachal Pradesh. In modeling aspects, the use of computational approaches needs to be emphasized as it has proved to be better than traditional methods. The analysis should start focusing on the use of hybrid models and big data analytics for regional to site specific analysis, thereby understanding the heterogeneity and uncertainty of the region.
- There is a serious lack of ground-based rainfall data in large parts of the Himalayan region which has been highlighted by several works. A solution to this flaw is to start using remote sensing data (e.g., satellite radar rainfall estimates) to compare and find the best dataset to be used for individual sections in the Himalayan region.
Author Contributions
Conceptualization, A.D. and R.S.; formal analysis, A.D. and S.S.; data curation, R.S.; writing—original draft preparation, A.D. and S.S.; writing—review and editing, B.P. and A.M.A.; and supervision, B.P. and R.S. All authors have read and agreed to the published version of the manuscript.
Funding
This research was supported by the Centre for Advanced Modelling and Geospatial Information Systems (CAMGIS) in the University of Technology Sydney (UTS) under Grants 321740.2232335, 321740.2232357, 321740.2232424, and 321740.2232452. This research was also funded by International Science Council under Grant ISCROAP/IRDR/SG/2019/009. This research was also supported by Researchers Supporting Project number RSP-2019/14, King Saud University, Riyadh, Saudi Arabia. The research was also funded by Università degli Studi di Firenze under the Grant 58517_INTERNAZIONALIZZAZIONE.
Conflicts of Interest
The authors declare no conflict of interest.
References
- Froude, M.J.; Petley, D. Global fatal landslide occurrence from 2004 to 2016. Nat. Hazards Earth Syst. Sci. 2018, 18, 2161–2181. [Google Scholar] [CrossRef] [Green Version]
- Dubey, C.S.; Chaudhry, M.; Sharma, B.K.; Pandey, A.C.; Singh, B. Visualization of 3-D digital elevation model for landslide assessment and prediction in mountainous terrain: A case study of Chandmari landslide, Sikkim, eastern Himalayas. Geosci. J. 2005, 9, 363–373. [Google Scholar] [CrossRef]
- Kanungo, D.P.; Sharma, S. Rainfall thresholds for prediction of shallow landslides around Chamoli-Joshimath region, Garhwal Himalayas, India. Landslides 2014, 11, 629–638. [Google Scholar] [CrossRef]
- Dikshit, A.; Satyam, D.N. Estimation of rainfall thresholds for landslide occurrences in Kalimpong, India. Innov. Infrastruct. Solut. 2018, 3. [Google Scholar] [CrossRef]
- Sati, V.P. Towards Sustainable Livelihoods and Ecosystems in Mountain Regions; Springer: Berlin, Germany, 2014. [Google Scholar]
- Chakrabarti, B.K. Chapter 1—Lithotectonic Subdivisions of the Himalaya. In Geology of the Himalayan Belt; Chakrabarti, B.K., Ed.; Elsevier: Amsterdam, The Netherlands, 2016; pp. 1–9. [Google Scholar] [CrossRef]
- Roy, A.B.; Purohit, R. Chapter 2—Indian Subcontinent: Geomorphic and Geophysical Traits. In Indian Shield; Roy, A.B., Purohit, R., Eds.; Elsevier: Amsterdam, The Netherlands, 2018; pp. 13–30. [Google Scholar] [CrossRef]
- Mukhopadhyay, D.K.; Mishra, P. The Main Frontal Thrust (MFT), northwestern Himalayas: Thrust trajectory and hanging wall fold geometry from balanced cross sections. J. Geol. Soc. India 2004, 64, 739–746. [Google Scholar]
- Pradhan, B.; Singh, R.; Buchroithner, M. Estimation of stress and its use in evaluation of landslide prone regions using remote sensing data. Adv. Space Res. 2006, 37, 698–709. [Google Scholar] [CrossRef]
- DeCelles, P.G.; Carrapa, B.; Gehrels, G.E.; Chakraborty, T.; Ghosh, P. Along-strike continuity of structure, stratigraphy, and kinematic history in the Himalayan thrust belt: The view from Northeastern India. Tectonics 2016, 35, 2995–3027. [Google Scholar] [CrossRef] [Green Version]
- Thakur, V.C. Plate tectonic interpretation of the western Himalaya. Tectonophysics 1987, 134, 91–102. [Google Scholar] [CrossRef]
- Reichenbach, P.; Rossi, M.; Malamud, B.D.; Mihir, M.; Guzzetti, F. A review of statistically-based landslide susceptibility models. Earth-Sci. Rev. 2018, 180, 60–91. [Google Scholar] [CrossRef]
- Pham, B.T.; Shirzadi, A.; Shahabi, H.; Omidvar, E.; Singh, S.K.; Sahana, M.; Asl, D.T.; Bin Ahmad, B.; Quoc, N.K.; Lee, S. Landslide Susceptibility Assessment by Novel Hybrid Machine Learning Algorithms. Sustainability 2019, 4386. [Google Scholar] [CrossRef] [Green Version]
- Naithani, A.K.; Kumar, D.; Prasad, C. The catastrophic landslide of 16 July 2001 in Phata Byung area, Rudraprayag district, Garhwal Himalaya, India. Curr. Sci. 2002, 82, 921–923. [Google Scholar]
- Martha, T.R.; Vinod Kumar, K. September, 2012 landslide events in Okhimath, India—An assessment of landslide consequences using very high resolution satellite data. Landslides 2013, 10, 469–479. [Google Scholar] [CrossRef]
- Martha, T.R.; Roy, P.; Govindharaj, K.B.; Kumar, K.V.; Diwakar, P.G.; Dadhwal, V.K. Landslides triggered by the June 2013 extreme rainfall event in parts of Uttarakhand state, India. Landslides 2015, 12, 135–146. [Google Scholar] [CrossRef]
- Roy, P.; Martha, T.R.; Jain, N.; Kumar, K.V. Reactivation of minor scars to major landslides–a satellite-based analysis of Kotropi landslide (13 August 2017) in Himachal Pradesh, India. Curr. Sci. 2018, 115, 395. [Google Scholar] [CrossRef]
- Pradhan, S.P.; Panda, S.D.; Roul, A.R.; Thakur, M. Insights into the recent Kotropi landslide of August 2017, India: A geological investigation and slope stability analysis. Landslides 2019, 16, 1529–1537. [Google Scholar] [CrossRef]
- Kumar, V.; Gupta, V.; Jamir, I. Hazard evaluation of progressive Pawari landslide zone, Satluj valley, Himachal Pradesh, India. Nat. Hazards 2018, 93, 1029–1047. [Google Scholar] [CrossRef]
- Banerjee, A.; Dimri, A.P. Comparative analysis of two rainfall retrieval algorithms during extreme rainfall event: A case study on cloudburst, 2010 over Ladakh (Leh), Jammu and Kashmir. Nat. Hazards 2019, 97, 1357–1374. [Google Scholar] [CrossRef]
- Mondal, S.; Mandal, S. Landslide susceptibility mapping of Darjeeling Himalaya, India using index of entropy (IOE) model. Appl. Geomat. 2019, 11, 129–146. [Google Scholar] [CrossRef]
- Dikshit, A.; Satyam, N. Probabilistic rainfall thresholds in Chibo, India: Estimation and validation using monitoring system. J. Mt. Sci. 2019, 16, 870–883. [Google Scholar] [CrossRef]
- Anbarasu, K.; Sengupta, A.; Gupta, S.; Sharma, S.P. Mechanism of activation of the Lanta Khola landslide in Sikkim Himalayas. Landslides 2010, 7, 135–147. [Google Scholar] [CrossRef]
- Bera, A.; Mukhopadhyay, B.P.; Das, D. Landslide hazard zonation mapping using multi-criteria analysis with the help of GIS techniques: A case study from Eastern Himalayas, Namchi, South Sikkim. Nat. Hazards 2019, 96, 935–959. [Google Scholar] [CrossRef]
- Umrao, R.K.; Singh, R.; Sharma, L.; Singh, T. Soil slope instability along a strategic road corridor in Meghalaya, north-eastern India. Arab. J. Geosci. 2017, 10, 260. [Google Scholar] [CrossRef]
- Sarkar, K.; Buragohain, B.; Singh, T. Rock slope stability analysis along NH-44 in Sonapur area, Jaintia hills district, Meghalaya. J. Geol. Soc. India 2016, 87, 317–322. [Google Scholar] [CrossRef]
- Sardana, S.; Verma, A.; Singh, A. Comparative analysis of rockmass characterization techniques for the stability prediction of road cut slopes along NH-44A, Mizoram, India. Bull. Eng. Geol. Environ. 2019, 78, 5977–5989. [Google Scholar] [CrossRef]
- Martha, T.R.; Kerle, N.; Jetten, V.; van Westen, C.J.; Kumar, K.V. Landslide Volumetric Analysis Using Cartosat-1-Derived DEMs. Ieee Geosci. Remote Sens. Lett. 2010, 7, 582–586. [Google Scholar] [CrossRef]
- Cruden, D.M.; Varnes, D.J. Landslides: Investigation and mitigation. In National Research Council Transportation Research Board Special Report (Book 247); Turner, A.K., Schuster, R.L., Eds.; Transportation Research Board: Washington, DC, USA, 1996; pp. 36–75. [Google Scholar]
- Vinod kumar, K.; Lakhera, R.C.; Martha, T.R.; Chatterjee, R.S.; Bhattacharya, A. Analysis of the 2003 Varunawat Landslide, Uttarkashi, India using Earth Observation data. Environ. Geol. 2008, 55, 789–799. [Google Scholar] [CrossRef]
- Martha, T.R.; Kerle, N.; van Westen, C.J.; Jetten, V.; Kumar, K.V. Object-oriented analysis of multi-temporal panchromatic images for creation of historical landslide inventories. Isprs J. Photogramm. Remote Sens. 2012, 67, 105–119. [Google Scholar] [CrossRef]
- Martha, T.R.; Kamala, P.; Jose, J.; Kumar, K.V.; Sankar, G.J. Identification of new Landslides from High Resolution Satellite Data Covering a Large Area Using Object-Based Change Detection Methods. J. Indian Soc. Remote Sens. 2016, 44, 515–524. [Google Scholar] [CrossRef]
- Amatya, P.; Kirschbaum, D.; Stanley, T. Use of Very High-Resolution Optical Data for Landslide Mapping and Susceptibility Analysis along the Karnali Highway, Nepal. Remote Sens. 2019, 11, 2284. [Google Scholar] [CrossRef] [Green Version]
- Vamsee, A.M.; Kamala, P.; Martha, T.R.; Kumar, K.V.; Amminedu, E. A tool assessing optimal multi-scale image segmentation. J. Indian Soc. Remote Sens. 2018, 46, 31–41. [Google Scholar] [CrossRef]
- Martha, T.R.; Kerle, N.; Jetten, V.; van Westen, C.J.; Kumar, K.V. Characterising spectral, spatial and morphometric properties of landslides for semi-automatic detection using object-oriented methods. Geomorphology 2010, 116, 24–36. [Google Scholar] [CrossRef]
- Martha, T.R.; van Westen, C.J.; Kerle, N.; Jetten, V.; Kumar, K.V. Landslide hazard and risk assessment using semi-automatically created landslide inventories. Geomorphology 2013, 184, 139–150. [Google Scholar] [CrossRef]
- Kumar, V.; Gupta, V.; Sundriyal, Y.P. Spatial interrelationship of landslides, litho-tectonics, and climate regime, Satluj valley, Northwest Himalaya. Geol. J. 2019, 54, 537–551. [Google Scholar] [CrossRef] [Green Version]
- Guzzetti, F.; Mondini, A.C.; Cardinali, M.; Fiorucci, F.; Santangelo, M.; Chang, K.-T. Landslide inventory maps: New tools for an old problem. Earth-Sci. Rev. 2012, 112, 42–66. [Google Scholar] [CrossRef] [Green Version]
- Ghorbanzadeh, O.; Blaschke, T.; Gholamnia, K.; Meena, S.R.; Tiede, D.; Aryal, J. Evaluation of different machine learning methods and deep-learning convolutional neural networks for landslide detection. Remote Sens. 2019, 11, 196. [Google Scholar] [CrossRef] [Green Version]
- Guzzetti, F.; Peruccacci, S.; Rossi, M.; Stark, C.P. Rainfall thresholds for the initiation of landslides in central and southern Europe. Meteorol. Atmos. Phys. 2007, 98, 239–267. [Google Scholar] [CrossRef]
- Dikshit, A.; Sarkar, R.; Pradhan, B.; Acharya, S.; Dorji, K. Estimating rainfall thresholds for landslide occurrence in the Bhutan Himalayas. Water 2019, 11, 1616. [Google Scholar] [CrossRef] [Green Version]
- Dikshit, A.; Sarkar, R.; Pradhan, B.; Jena, R.; Drukpa, D.; Alamri, A.M. Temporal Probability Assessment and Its Use in Landslide Susceptibility Mapping for Eastern Bhutan. Water 2020, 12, 267. [Google Scholar] [CrossRef] [Green Version]
- Segoni, S.; Piciullo, L.; Gariano, S.L. A review of the recent literature on rainfall thresholds for landslide occurrence. Landslides 2018, 15, 1483–1501. [Google Scholar] [CrossRef]
- Gariano, S.L.; Sarkar, R.; Dikshit, A.; Dorji, K.; Brunetti, M.T.; Peruccacci, S.; Melillo, M. Automatic calculation of rainfall thresholds for landslide occurrence in Chukha Dzongkhag, Bhutan. Bull. Eng. Geol. Environ. 2019, 78, 4325–4332. [Google Scholar] [CrossRef]
- Sengupta, A.; Gupta, S.; Anbarasu, K. Rainfall thresholds for the initiation of landslide at Lanta Khola in north Sikkim, India. Nat. Hazards 2010, 52, 31–42. [Google Scholar] [CrossRef]
- Dikshit, A.; Sarkar, R.; Satyam, N. Probabilistic approach toward Darjeeling Himalayas landslides-A case study. Cogent Eng. 2018, 5. [Google Scholar] [CrossRef]
- Teja, T.S.; Dikshit, A.; Satyam, N. Determination of Rainfall Thresholds for Landslide Prediction Using an Algorithm-Based Approach: Case Study in the Darjeeling Himalayas, India. Geosciences 2019, 302. [Google Scholar] [CrossRef] [Green Version]
- Harilal, G.T.; Madhu, D.; Ramesh, M.V.; Pullarkatt, D. Towards establishing rainfall thresholds for a real-time landslide early warning system in Sikkim, India. Landslides 2019, 16, 2395–2408. [Google Scholar] [CrossRef]
- Gariano, S.L.; Melillo, M.; Peruccacci, S.; Brunetti, M.T. How much does the rainfall temporal resolution affect rainfall thresholds for landslide triggering? Nat. Hazards 2019, 1–16. [Google Scholar] [CrossRef] [Green Version]
- Mathew, J.; Babu, D.G.; Kundu, S.; Kumar, K.V.; Pant, C.C. Integrating intensity-duration-based rainfall threshold and antecedent rainfall-based probability estimate towards generating early warning for rainfall-induced landslides in parts of the Garhwal Himalaya, India. Landslides 2014, 11, 575–588. [Google Scholar] [CrossRef]
- Kumar, A.; Asthana, A.L.; Priyanka, R.S.; Jayangondaperumal, R.; Gupta, A.K.; Bhakuni, S.S. Assessment of landslide hazards induced by extreme rainfall event in Jammu and Kashmir Himalaya, northwest India. Geomorphology 2017, 284, 72–87. [Google Scholar] [CrossRef] [Green Version]
- Caine, N. The rainfall intensity-duration control of shallow landslides and debris flows. Geogr. Ann. Ser. APhys. Geogr. 1980, 62, 23–27. [Google Scholar]
- Chae, B.-G.; Park, H.-J.; Catani, F.; Simoni, A.; Berti, M. Landslide prediction, monitoring and early warning: A concise review of state-of-the-art. Geosci. J. 2017, 21, 1033–1070. [Google Scholar] [CrossRef]
- Dikshit, A.; Satyam, D.N.; Towhata, I. Early warning system using tilt sensors in Chibo, Kalimpong, Darjeeling Himalayas, India. Nat. Hazards 2018, 94, 727–741. [Google Scholar] [CrossRef]
- Falae, P.O.; Kanungo, D.P.; Chauhan, P.K.S.; Dash, R.K. Electrical resistivity tomography (ERT) based subsurface characterisation of Pakhi Landslide, Garhwal Himalayas, India. Environ. Earth Sci. 2019, 78. [Google Scholar] [CrossRef]
- Yhokha, A.; Goswami, P.K.; Chang, C.P.; Yen, J.Y.; Ching, K.E.; Aruche, K.M. Application of Persistent Scatterer Interferometry (PSI) in monitoring slope movements in Nainital, Uttarakhand Lesser Himalaya, India. J. Earth Syst. Sci. 2018, 127. [Google Scholar] [CrossRef] [Green Version]
- Martha, T.R.; Reddy, P.S.; Bhatt, C.M.; Raj, K.B.G.; Nalini, J.; Padmanabha, E.A.; Narender, B.; Kumar, K.V.; Muralikrishnan, S.; Rao, G.S.; et al. Debris volume estimation and monitoring of Phuktal river landslide-dammed lake in the Zanskar Himalayas, India using Cartosat-2 images. Landslides 2017, 14, 373–383. [Google Scholar] [CrossRef]
- Mondal, S.K.; Sastry, R.G.; Pachauri, A.K.; Gautam, P.K. High resolution 2D electrical resistivity tomography to characterize active Naitwar Bazar landslide, Garhwal Himalaya, India. Curr. Sci. 2008, 94, 871–875. [Google Scholar]
- Kannaujiya, S.; Chattoraj, S.L.; Jayalath, D.; Ray, P.K.C.; Bajaj, K.; Podali, S.; Bisht, M.P.S. Integration of satellite remote sensing and geophysical techniques (electrical resistivity tomography and ground penetrating radar) for landslide characterization at Kunjethi (Kalimath), Garhwal Himalaya, India. Nat. Hazards 2019, 97, 1191–1208. [Google Scholar] [CrossRef]
- Sharma, S.P.; Anbarasu, K.; Gupta, S.; Sengupta, A. Integrated very low-frequency EM, electrical resistivity, and geological studies on the Lanta Khola landslide, North Sikkim, India. Landslides 2010, 7, 43–53. [Google Scholar] [CrossRef]
- Raj, K.; Govindha, B.; Martha, T.R.; Kumar, K.V. A bird’s-eye view of landslide dammed lakes in Zanskar Himalaya, India. Curr. Sci. 2017, 112, 1109–1112. [Google Scholar]
- Weidinger, J.T. Case history and hazard analysis of two lake-damming landslides in the Himalayas. J. Asian Earth Sci. 1998, 16, 323–331. [Google Scholar] [CrossRef]
- Kumar, V.; Gupta, V.; Jamir, I.; Chattoraj, S.L. Evaluation of potential landslide damming: Case study of Urni landslide, Kinnaur, Satluj valley, India. Geosci. Front. 2019, 10, 753–767. [Google Scholar] [CrossRef]
- Gupta, V.; Bhasin, R.K.; Kaynia, A.M.; Kumar, V.; Saini, A.S.; Tandon, R.S.; Pabst, T. Finite element analysis of failed slope by shear strength reduction technique: A case study for Surabhi Resort Landslide, Mussoorie township, Garhwal Himalaya. Geomat. Nat. Hazards Risk 2016, 7, 1677–1690. [Google Scholar] [CrossRef] [Green Version]
- Gupta, V.; Sah, M. Impact of the trans-Himalayan landslide lake outburst flood (LLOF) in the Satluj catchment, Himachal Pradesh, India. Nat. Hazards 2008, 45, 379–390. [Google Scholar] [CrossRef]
- Gariano, S.L.; Guzzetti, F. Landslides in a changing climate. Earth-Sci. Rev. 2016, 162, 227–252. [Google Scholar] [CrossRef] [Green Version]
- Sarkar, S.; Kanungo, D. Landslide Disaster on Berinag-Munsiyari Road, Pithoragarh District, Uttarakhand. Curr. Sci. 2010, 98, 2. [Google Scholar]
- Bhan, S.; Devrani, A.; Sinha, V. An analysis of monthly rainfall and the meteorological conditions associated with cloudburst over the dry region of Leh (Ladakh), India. Mausam 2015, 66, 107–122. [Google Scholar]
- Anbalagan, R. Landslide hazard evaluation and zonation mapping in mountainous terrain. Eng. Geol. 1992, 32, 269–277. [Google Scholar] [CrossRef]
- Gupta, P.; Anbalagan, R. Slope stability of Tehri Dam Reservoir Area, India, using landslide hazard zonation (LHZ) mapping. Q. J. Eng. Geol. 1997, 30, 27–36. [Google Scholar] [CrossRef]
- Kanungo, D.; Arora, M.; Gupta, R.; Sarkar, S. Landslide risk assessment using concepts of danger pixels and fuzzy set theory in Darjeeling Himalayas. Landslides 2008, 5, 407–416. [Google Scholar] [CrossRef]
- Sarkar, S.; Roy, A.K.; Raha, P. Deterministic approach for susceptibility assessment of shallow debris slide in the Darjeeling Himalayas, India. Catena 2016, 142, 36–46. [Google Scholar] [CrossRef]
- Mathew, J.; Kundu, S.; Kumar, K.V.; Pant, C.C. Hydrologically complemented deterministic slope stability analysis in part of Indian Lesser Himalaya. Geomat. Nat. Hazards Risk 2016, 7, 1557–1576. [Google Scholar] [CrossRef] [Green Version]
- Kumar, R.; Anbalagan, R. Landslide susceptibility zonation in part of Tehri reservoir region using frequency ratio, fuzzy logic and GIS. J. Earth Syst. Sci. 2015, 124, 431–448. [Google Scholar] [CrossRef]
- Ghosh, S.; Carranza, E.J.M.; van Westen, C.J.; Jetten, V.G.; Bhattacharya, D.N. Selecting and weighting spatial predictors for empirical modeling of landslide susceptibility in the Darjeeling Himalayas (India). Geomorphology 2011, 131, 35–56. [Google Scholar] [CrossRef]
- Mandal, S.; Mandal, K. Modeling and mapping landslide susceptibility zones using GIS based multivariate binary logistic regression (LR) model in the Rorachu river basin of eastern Sikkim Himalaya, India. Modeling Earth Syst. Environ. 2018, 4, 69–88. [Google Scholar] [CrossRef]
- Mathew, J.; Jha, V.K.; Rawat, G.S. Application of binary logistic regression analysis and its validation for landslide susceptibility mapping in part of Garhwal Himalaya, India. Int. J. Remote Sens. 2007, 28, 2257–2275. [Google Scholar] [CrossRef]
- Pourghasemi, H.R.; Yansari, Z.T.; Panagos, P.; Pradhan, B. Analysis and evaluation of landslide susceptibility: A review on articles published during 2005–2016 (periods of 2005–2012 and 2013–2016). Arab. J. Geosci. 2018, 11, 193. [Google Scholar] [CrossRef]
- Sharma, S.; Mahajan, A.K. A comparative assessment of information value, frequency ratio and analytical hierarchy process models for landslide susceptibility mapping of a Himalayan watershed, India. Bull. Eng. Geol. Environ. 2019, 78, 2431–2448. [Google Scholar] [CrossRef]
- Das, I.; Stein, A.; Kerle, N.; Dadhwal, V.K. Landslide susceptibility mapping along road corridors in the Indian Himalayas using Bayesian logistic regression models. Geomorphology 2012, 179, 116–125. [Google Scholar] [CrossRef]
- Mathew, J.; Jha, V.K.; Rawat, G.S. Landslide susceptibility zonation mapping and its validation in part of Garhwal Lesser Himalaya, India, using binary logistic regression analysis and receiver operating characteristic curve method. Landslides 2009, 6, 17–26. [Google Scholar] [CrossRef]
- Chauhan, S.; Mukta, S.; Arora, M.K. Landslide susceptibility zonation of the Chamoli region, Garhwal Himalayas, using logistic regression model. Landslides 2010, 7, 411–423. [Google Scholar] [CrossRef]
- Sahana, M.; Sajjad, H. Evaluating effectiveness of frequency ratio, fuzzy logic and logistic regression models in assessing landslide susceptibility: A case from Rudraprayag district, India. J. Mt. Sci. 2017, 14, 2150–2167. [Google Scholar] [CrossRef]
- Saha, A.K.; Gupta, R.P.; Sarkar, I.; Arora, M.K.; Csaplovics, E. An approach for GIS-based statistical landslide susceptibility zonation - with a case study in the Himalayas. Landslides 2005, 2, 61–69. [Google Scholar] [CrossRef]
- Sarkar, S.; Anbalagan, R. Landslide hazard zonation mapping and comparative analysis of hazard zonation maps. J. Mt. Sci. 2008, 5, 232–240. [Google Scholar] [CrossRef]
- Mondal, S.; Maiti, R. Integrating the Analytical Hierarchy Process (AHP) and the Frequency Ratio (FR) Model in Landslide Susceptibility Mapping of Shiv-khola Watershed, Darjeeling Himalaya. Int. J. Disaster Risk Sci. 2013, 4, 200–212. [Google Scholar] [CrossRef] [Green Version]
- Sharma, L.P.; Patel, N.; Ghose, M.K.; Debnath, P. Application of frequency ratio and likelihood ratio model for geo-spatial modelling of landslide hazard vulnerability assessment and zonation: A case study from the Sikkim Himalayas in India. Geocarto Int. 2014, 29, 128–146. [Google Scholar] [CrossRef]
- Balamurugan, G.; Ramesh, V.; Touthang, M. Landslide susceptibility zonation mapping using frequency ratio and fuzzy gamma operator models in part of NH-39, Manipur, India. Nat. Hazards 2016, 84, 465–488. [Google Scholar] [CrossRef]
- Manzo, G.; Tofani, V.; Segoni, S.; Battistini, A.; Catani, F. GIS techniques for regional-scale landslide susceptibility assessment: The Sicily (Italy) case study. Int. J. Geogr. Inf. Sci. 2013, 27, 1433–1452. [Google Scholar] [CrossRef]
- Singh, C.; Kohli, A.; Kumar, P. Comparison of results of BIS and GSI guidelines on macrolevel landslide hazard zonation—A case study along highway from Bhalukpong to Bomdila, West Kameng district, Arunachal Pradesh. J. Geol. Soc. India 2014, 83, 688–696. [Google Scholar] [CrossRef]
- Ghosh, S.; van Westen, C.J.; Carranza, E.J.M.; Ghoshal, T.B.; Sarkar, N.K.; Surendranath, M. A quantitative approach for improving the BIS (Indian) method of medium-scale landslide susceptibility. J. Geol. Soc. India 2009, 74, 625–638. [Google Scholar] [CrossRef]
- Das, I.; Stein, A.; Kerle, N.; Dadhwal, V.K. Probabilistic landslide hazard assessment using homogeneous susceptible units (HSU) along a national highway corridor in the northern Himalayas, India. Landslides 2011, 8, 293–308. [Google Scholar] [CrossRef] [Green Version]
- Sarkar, S.; Kanungo, D.P.; Sharma, S. Landslide hazard assessment in the upper Alaknanda valley of Indian Himalayas. Geomat. Nat. Hazards Risk 2015, 6, 308–325. [Google Scholar] [CrossRef] [Green Version]
- Pham, B.T.; Bui, D.T.; Prakash, I.; Dholakia, M.B. Hybrid integration of Multilayer Perceptron Neural Networks and machine learning ensembles for landslide susceptibility assessment at Himalayan area (India) using GIS. Catena 2017, 149, 52–63. [Google Scholar] [CrossRef]
- Pham, B.T.; Prakash, I.; Dou, J.; Singh, S.K.; Trinh, P.T.; Tran, H.T.; Le, T.M.; Phong, T.V.; Khoi, D.K.; Shirzadi, A.; et al. A novel hybrid approach of landslide susceptibility modelling using rotation forest ensemble and different base classifiers. Geocarto Int. 2019. [Google Scholar] [CrossRef]
- Peethambaran, B.; Anbalagan, R.; Shihabudheen, K.V.; Goswami, A. Robustness evaluation of fuzzy expert system and extreme learning machine for geographic information system-based landslide susceptibility zonation: A case study from Indian Himalaya. Environ. Earth Sci. 2019, 78. [Google Scholar] [CrossRef]
- Ramakrishnan, D.; Singh, T.N.; Verma, A.K.; Gulati, A.; Tiwari, K.C. Soft computing and GIS for landslide susceptibility assessment in Tawaghat area, Kumaon Himalaya, India. Nat. Hazards 2013, 65, 315–330. [Google Scholar] [CrossRef]
- Pham, B.T.; Bui, D.T.; Prakash, I.; Nguyen, L.H.; Dholakia, M.B. A comparative study of sequential minimal optimization-based support vector machines, vote feature intervals, and logistic regression in landslide susceptibility assessment using GIS. Environ. Earth Sci. 2017, 76. [Google Scholar] [CrossRef]
- Pham, B.T.; Bui, D.T.; Pourghasemi, H.R.; Indra, P.; Dholakia, M. Landslide susceptibility assesssment in the Uttarakhand area (India) using GIS: A comparison study of prediction capability of naïve bayes, multilayer perceptron neural networks, and functional trees methods. Theor. Appl. Climatol. 2017, 128, 255–273. [Google Scholar] [CrossRef]
- Pham, B.T.; Prakash, I.; Singh, S.K.; Shirzadi, A.; Shahabi, H.; Tran, T.T.G.; Buig, D.T. Landslide susceptibility modeling using Reduced Error Pruning Trees and different ensemble techniques: Hybrid machine learning approaches. Catena 2019, 175, 203–218. [Google Scholar] [CrossRef]
- Chauhan, S.; Sharma, M.; Arora, M.K.; Gupta, N.K. Landslide Susceptibility Zonation through ratings derived from Artificial Neural Network. Int. J. Appl. Earth Obs. Geoinf. 2010, 12, 340–350. [Google Scholar] [CrossRef]
- Kumar, D.; Thakur, M.; Dubey, C.S.; Shukla, D.P. Landslide susceptibility mapping & prediction using Support Vector Machine for Mandakini River Basin, Garhwal Himalaya, India. Geomorphology 2017, 295, 115–125. [Google Scholar] [CrossRef]
- Pham, B.T.; Shirzadi, A.; Bui, D.T.; Prakash, I.; Dholakia, M. A hybrid machine learning ensemble approach based on a radial basis function neural network and rotation forest for landslide susceptibility modeling: A case study in the Himalayan area, India. Int. J. Sediment Res. 2018, 33, 157–170. [Google Scholar] [CrossRef]
- Pham, B.T.; Prakash, I.; Jaafari, A.; Bui, D.T. Spatial prediction of rainfall-induced landslides using aggregating one-dependence estimators classifier. J. Indian Soc. Remote Sens. 2018, 46, 1457–1470. [Google Scholar] [CrossRef]
- Pham, B.T.; Jaafari, A.; Prakash, I.; Bui, D.T. A novel hybrid intelligent model of support vector machines and the MultiBoost ensemble for landslide susceptibility modeling. Bull. Eng. Geol. Environ. 2019, 78, 2865–2886. [Google Scholar] [CrossRef]
- Jaafari, A.; Panahi, M.; Pham, B.T.; Shahabi, H.; Bui, D.T.; Rezaie, F.; Lee, S. Meta optimization of an adaptive neuro-fuzzy inference system with grey wolf optimizer and biogeography-based optimization algorithms for spatial prediction of landslide susceptibility. Catena 2019, 175, 430–445. [Google Scholar] [CrossRef]
- Kanungo, D.P.; Arora, M.K.; Sarkar, S.; Gupta, R.P. A comparative study of conventional, ANN black box, fuzzy and combined neural and fuzzy weighting procedures for landslide susceptibility zonation in Darjeeling Himalayas. Eng. Geol. 2006, 85, 347–366. [Google Scholar] [CrossRef]
- Kanungo, D.P.; Sarkar, S.; Sharma, S. Combining neural network with fuzzy, certainty factor and likelihood ratio concepts for spatial prediction of landslides. Nat. Hazards 2011, 59, 1491–1512. [Google Scholar] [CrossRef]
- Chawla, A.; Chawla, S.; Pasupuleti, S.; Rao, A.C.S.; Sarkar, K.; Dwivedi, R. Landslide Susceptibility Mapping in Darjeeling Himalayas, India. Adv. Civ. Eng. 2018. [Google Scholar] [CrossRef]
- Meena, S.R.; Mishra, B.K.; Piralilou, S.T. A Hybrid Spatial Multi-Criteria Evaluation Method for Mapping Landslide Susceptible Areas in Kullu Valley, Himalayas. Geosciences 2019, 156. [Google Scholar] [CrossRef] [Green Version]
- Tofani, V.; Bicocchi, G.; Rossi, G.; Segoni, S.; D’Ambrosio, M.; Casagli, N.; Catani, F. Soil characterization for shallow landslides modeling: A case study in the Northern Apennines (Central Italy). Landslides 2017, 14, 755–770. [Google Scholar] [CrossRef] [Green Version]
- Segoni, S.; Tofani, V.; Rosi, A.; Catani, F.; Casagli, N. Combination of rainfall thresholds and susceptibility maps for dynamic landslide hazard assessment at regional scale. Front. Earth Sci. 2018, 6, 85. [Google Scholar] [CrossRef] [Green Version]
Figure 1.
(a) Southeast Asia highlighting India; (b) geographical boundaries of India highlighting the Indian Himalayan region; and (c) location of rainfall-induced landslides in the Indian Himalayan region [1] (DEM Source: SRTM, resolution 30 m).
Figure 1.
(a) Southeast Asia highlighting India; (b) geographical boundaries of India highlighting the Indian Himalayan region; and (c) location of rainfall-induced landslides in the Indian Himalayan region [1] (DEM Source: SRTM, resolution 30 m).

Figure 2.
Geology of: (a) South Asia highlighting the Indian Himalayan region; and (b) the study region (Source: USGS World Geologic Map).
Figure 2.
Geology of: (a) South Asia highlighting the Indian Himalayan region; and (b) the study region (Source: USGS World Geologic Map).

Figure 3.
Analysis of the literature database during 1990–October 2019 from Web of Science. The left ordinate axis represents the number of articles per year and the right ordinate axis depicts the cumulative number of articles during the entire analysis period.
Figure 3.
Analysis of the literature database during 1990–October 2019 from Web of Science. The left ordinate axis represents the number of articles per year and the right ordinate axis depicts the cumulative number of articles during the entire analysis period.

Figure 4.
Distribution of the number of articles across the top 11 journals (out of 75). Horizontal bars depict the number of articles and its thickness denotes the average number of citations per article.
Figure 4.
Distribution of the number of articles across the top 11 journals (out of 75). Horizontal bars depict the number of articles and its thickness denotes the average number of citations per article.

Figure 5.
Distribution of landslide studies across the states in Indian Himalayan region.

Figure 6.
Comparison of various ID thresholds developed for various Himalayan regions with global thresholds defined by Caine [52].
Figure 6.
Comparison of various ID thresholds developed for various Himalayan regions with global thresholds defined by Caine [52].

Figure 7.
Types of modeling techniques used in landslide susceptibility studies.

Figure 8.
Model types and the techniques used in hazard and susceptibility studies.

Figure 9.
Tree map of the factors used for determining landslide hazard and susceptibility.


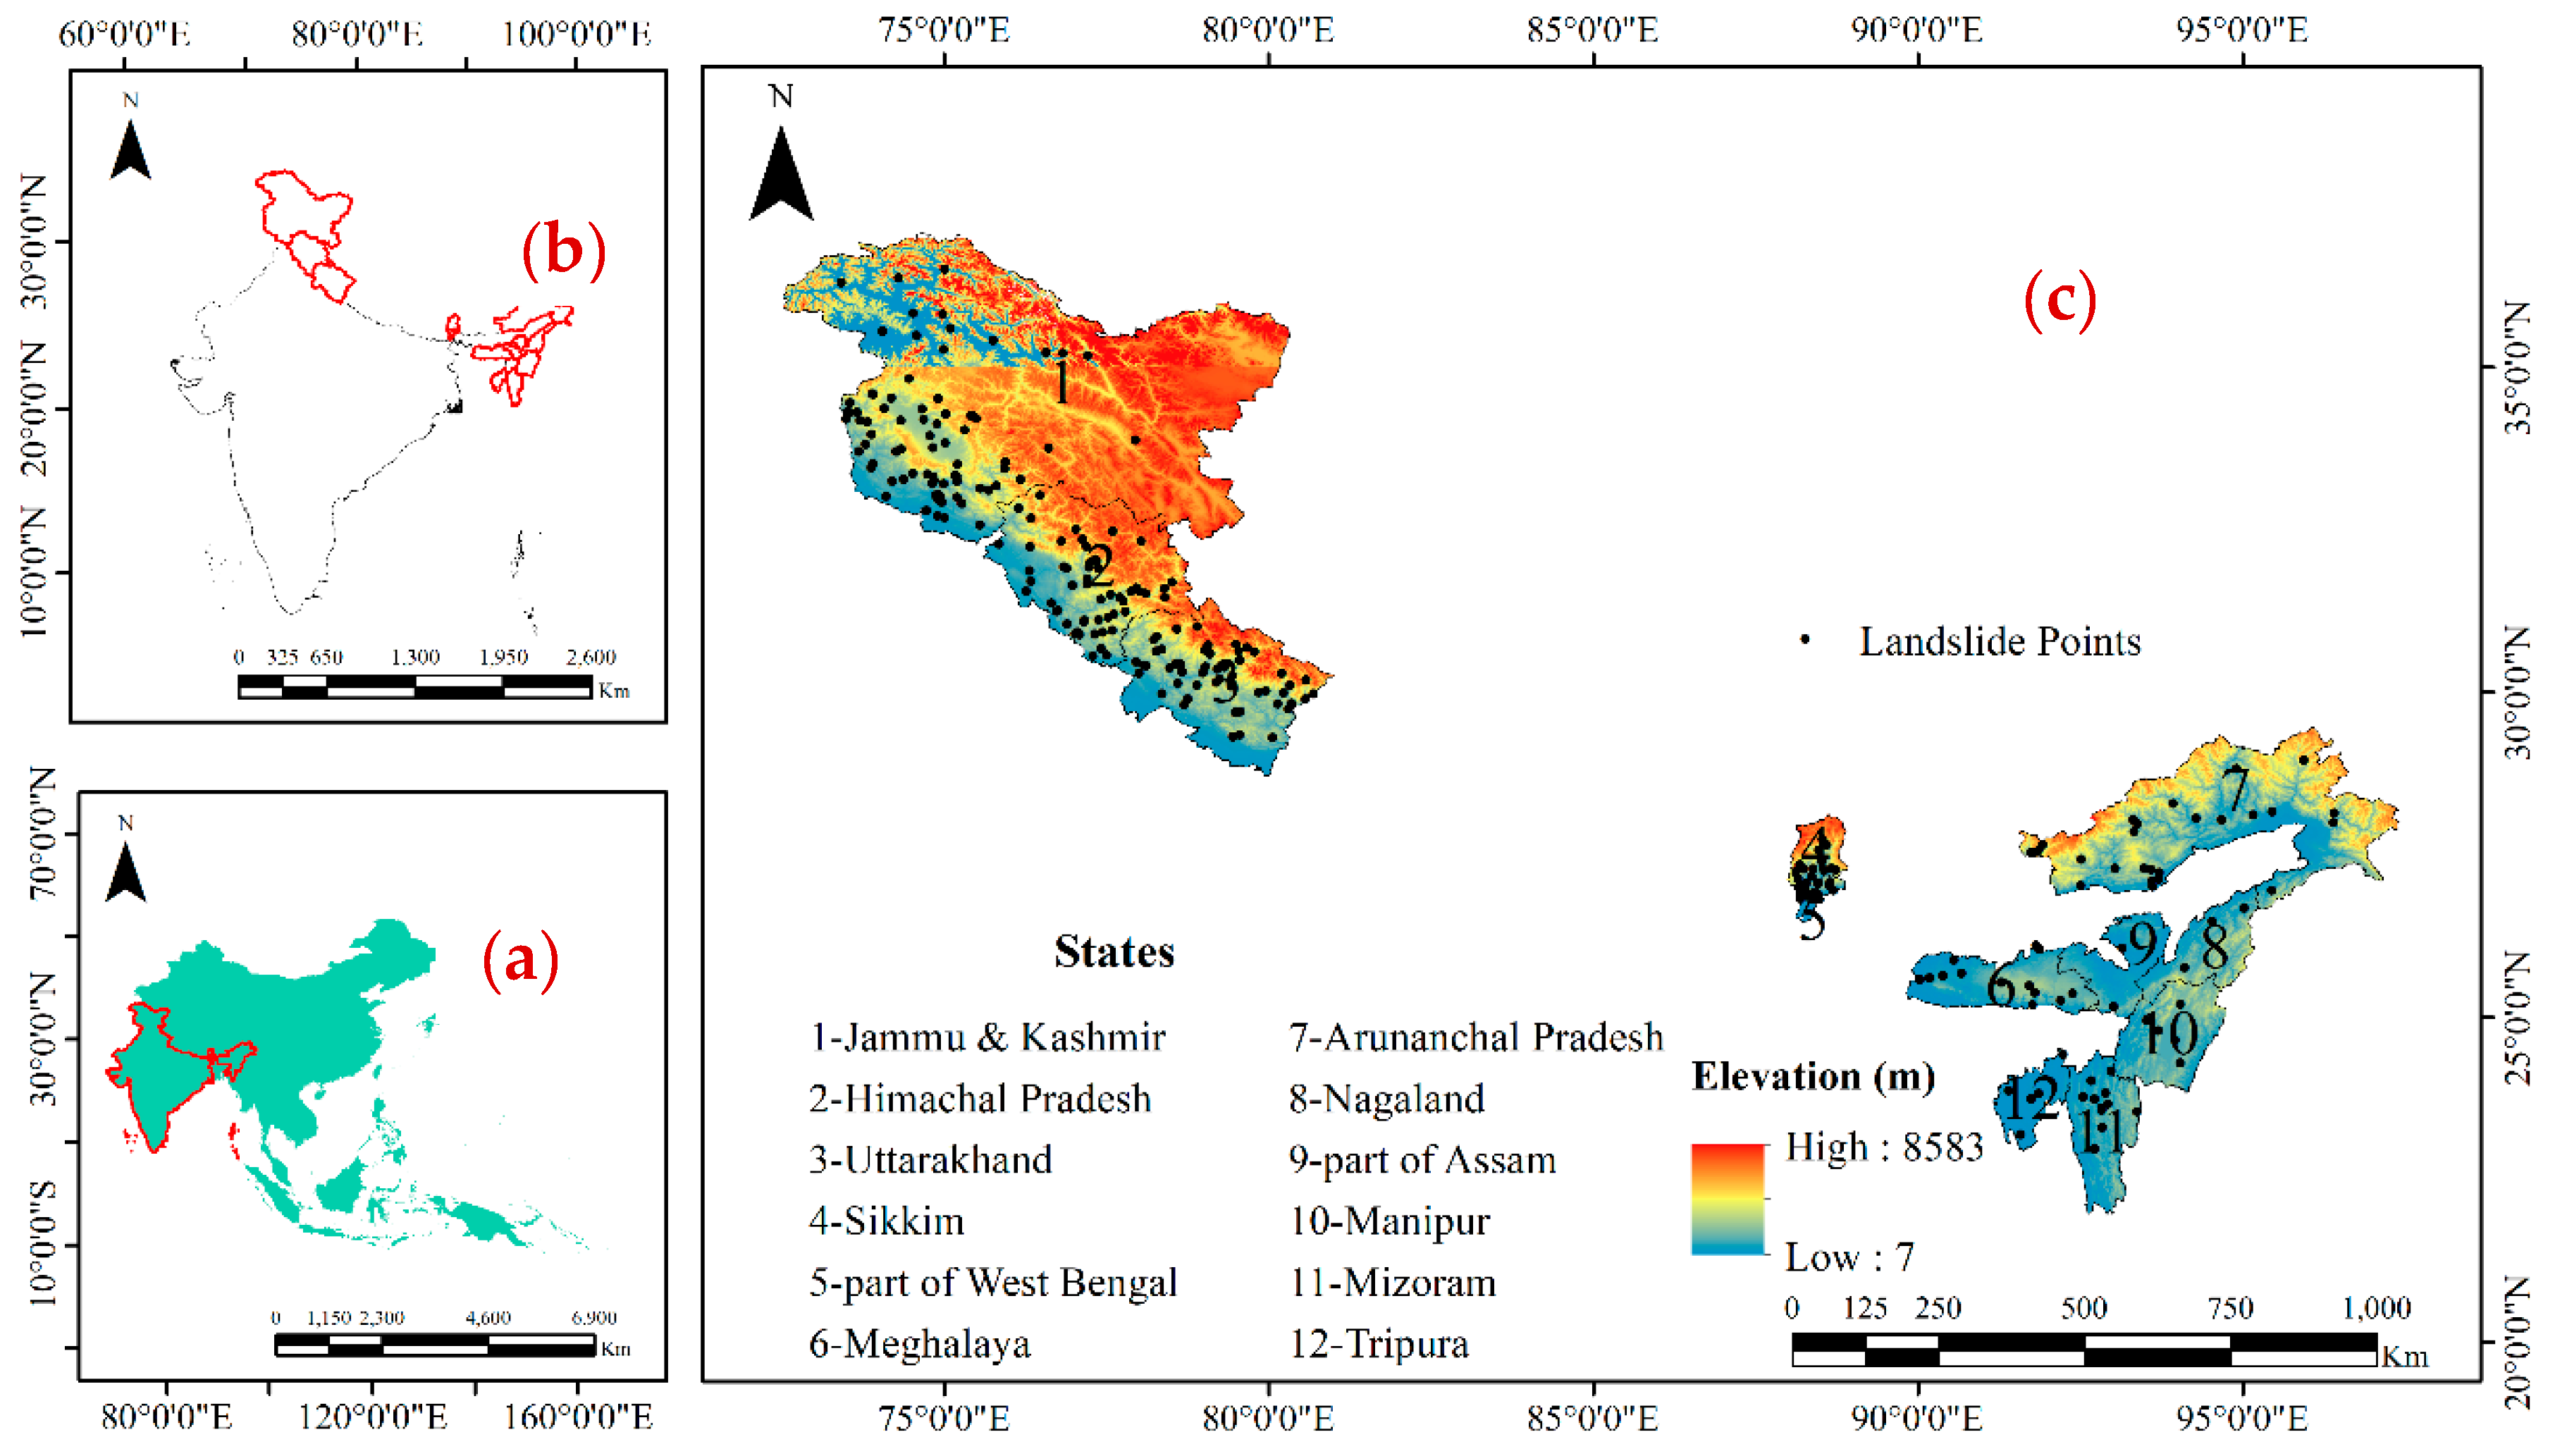
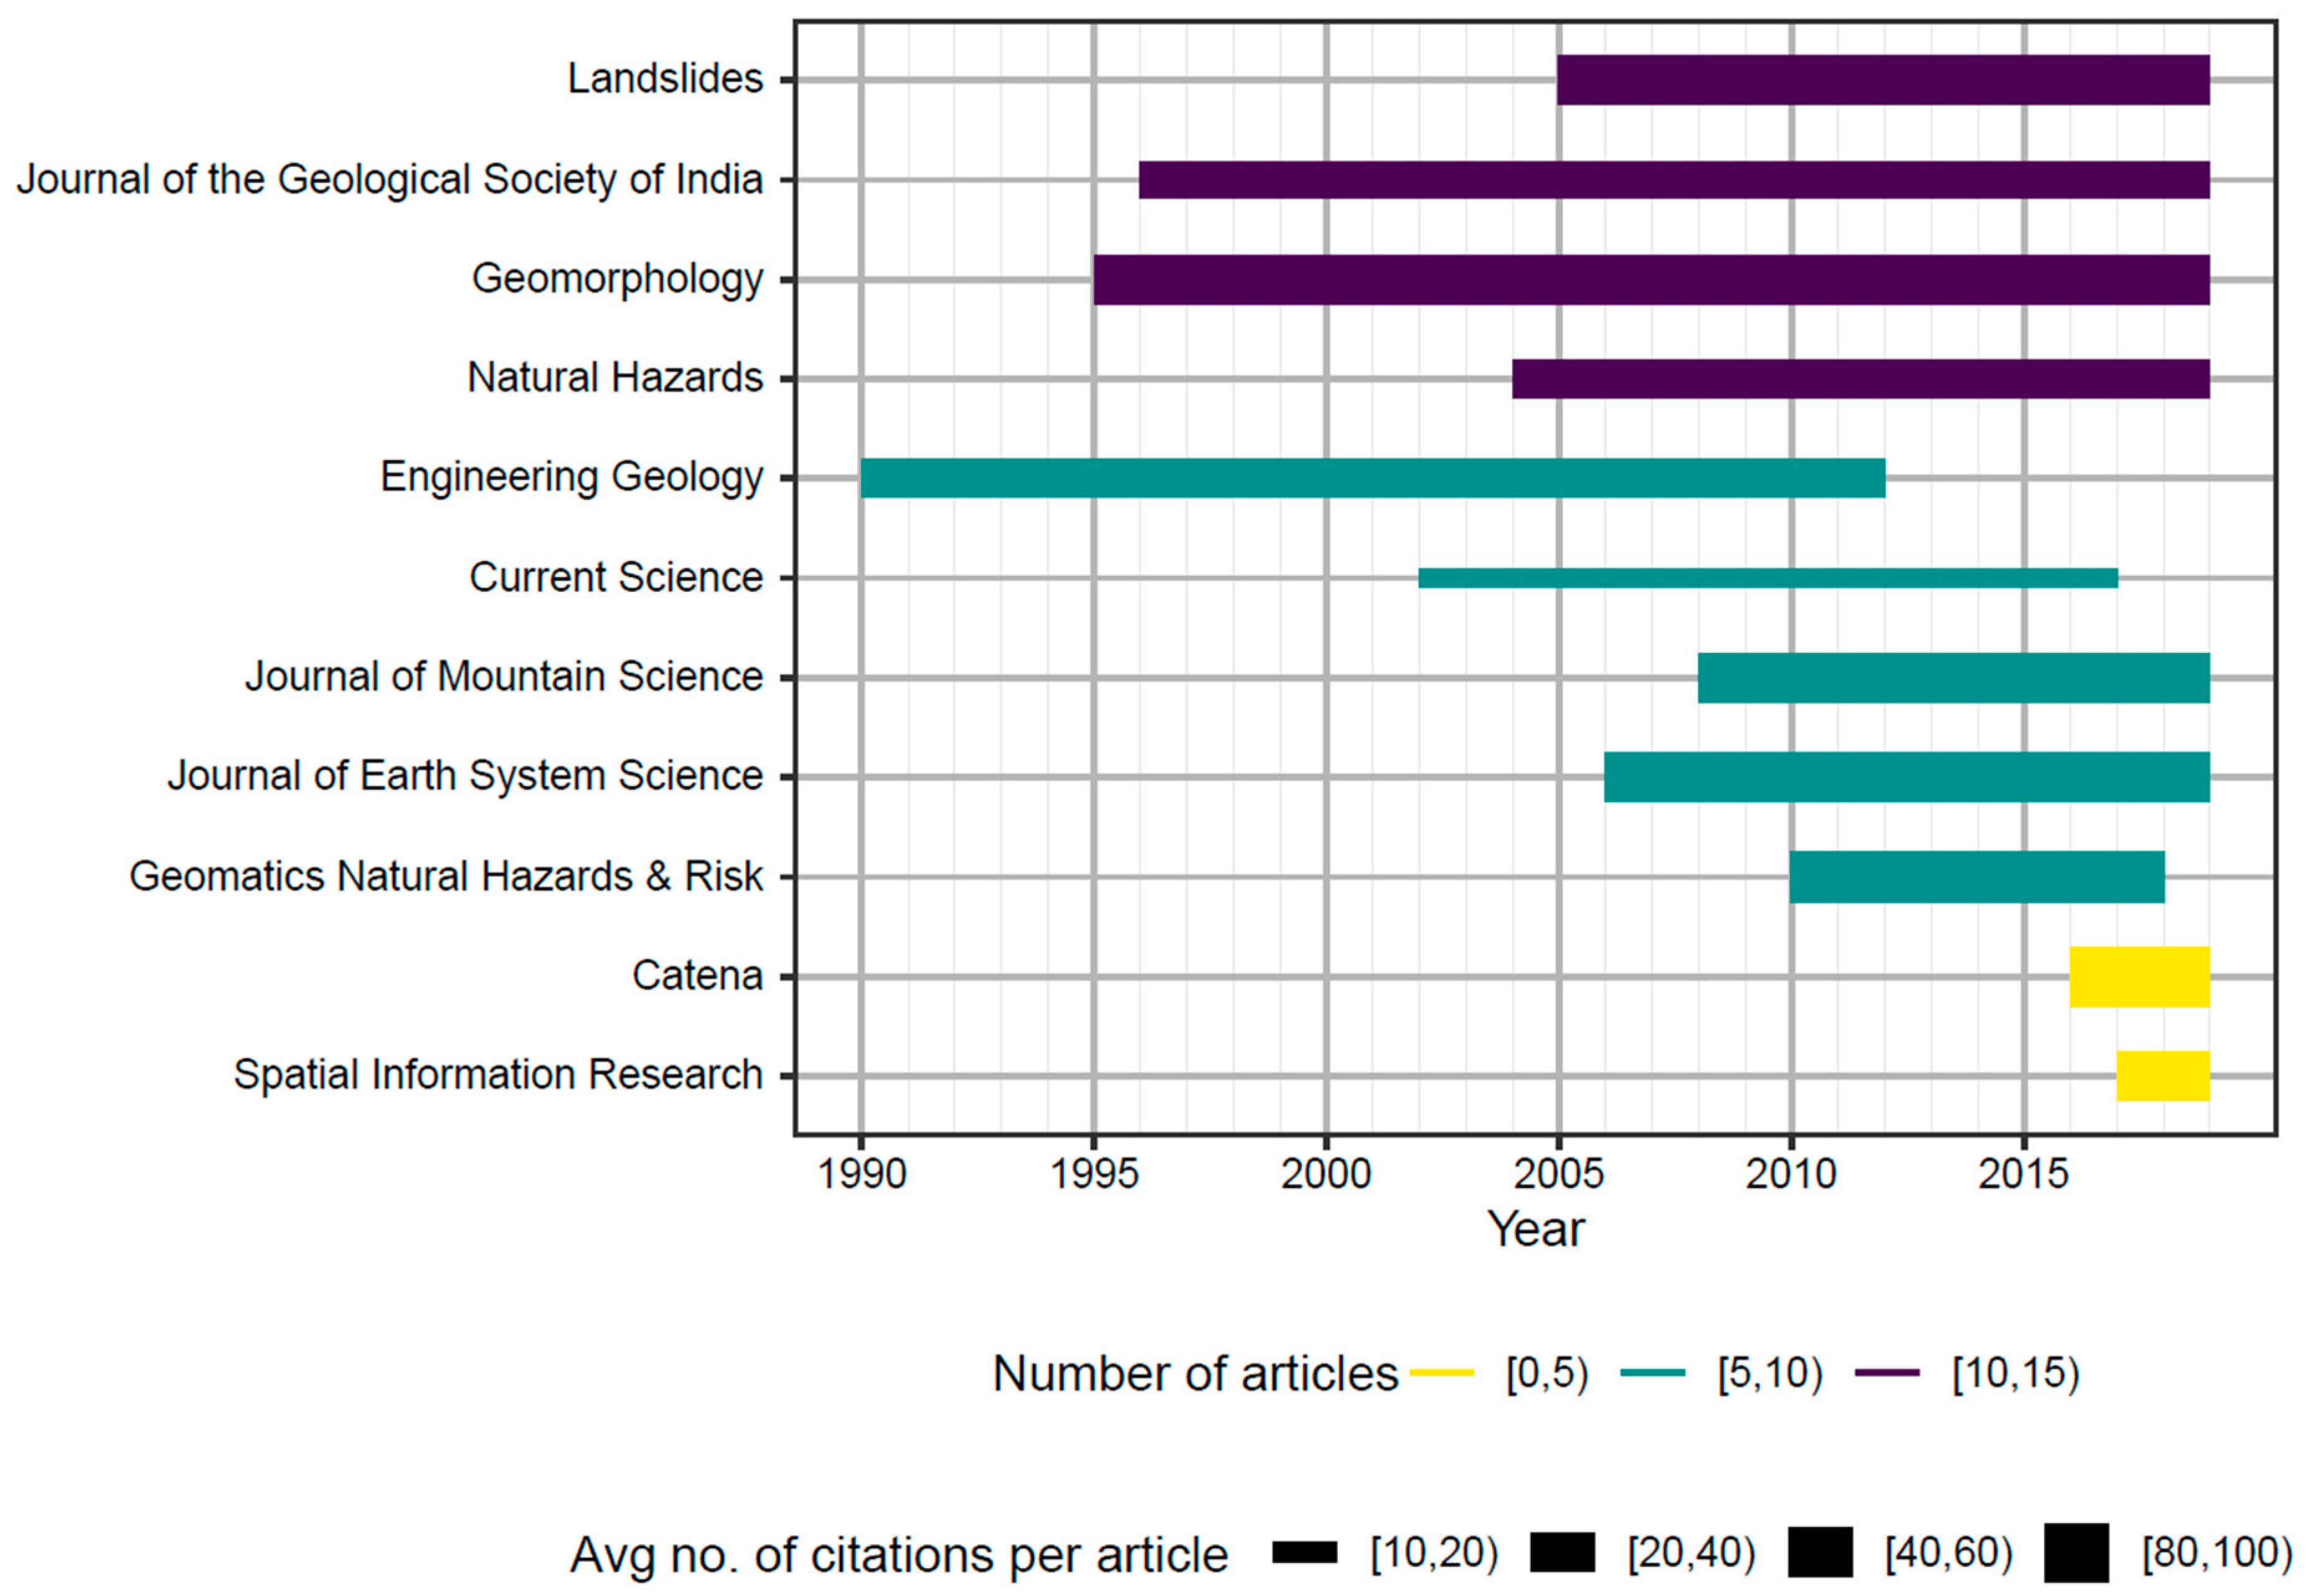
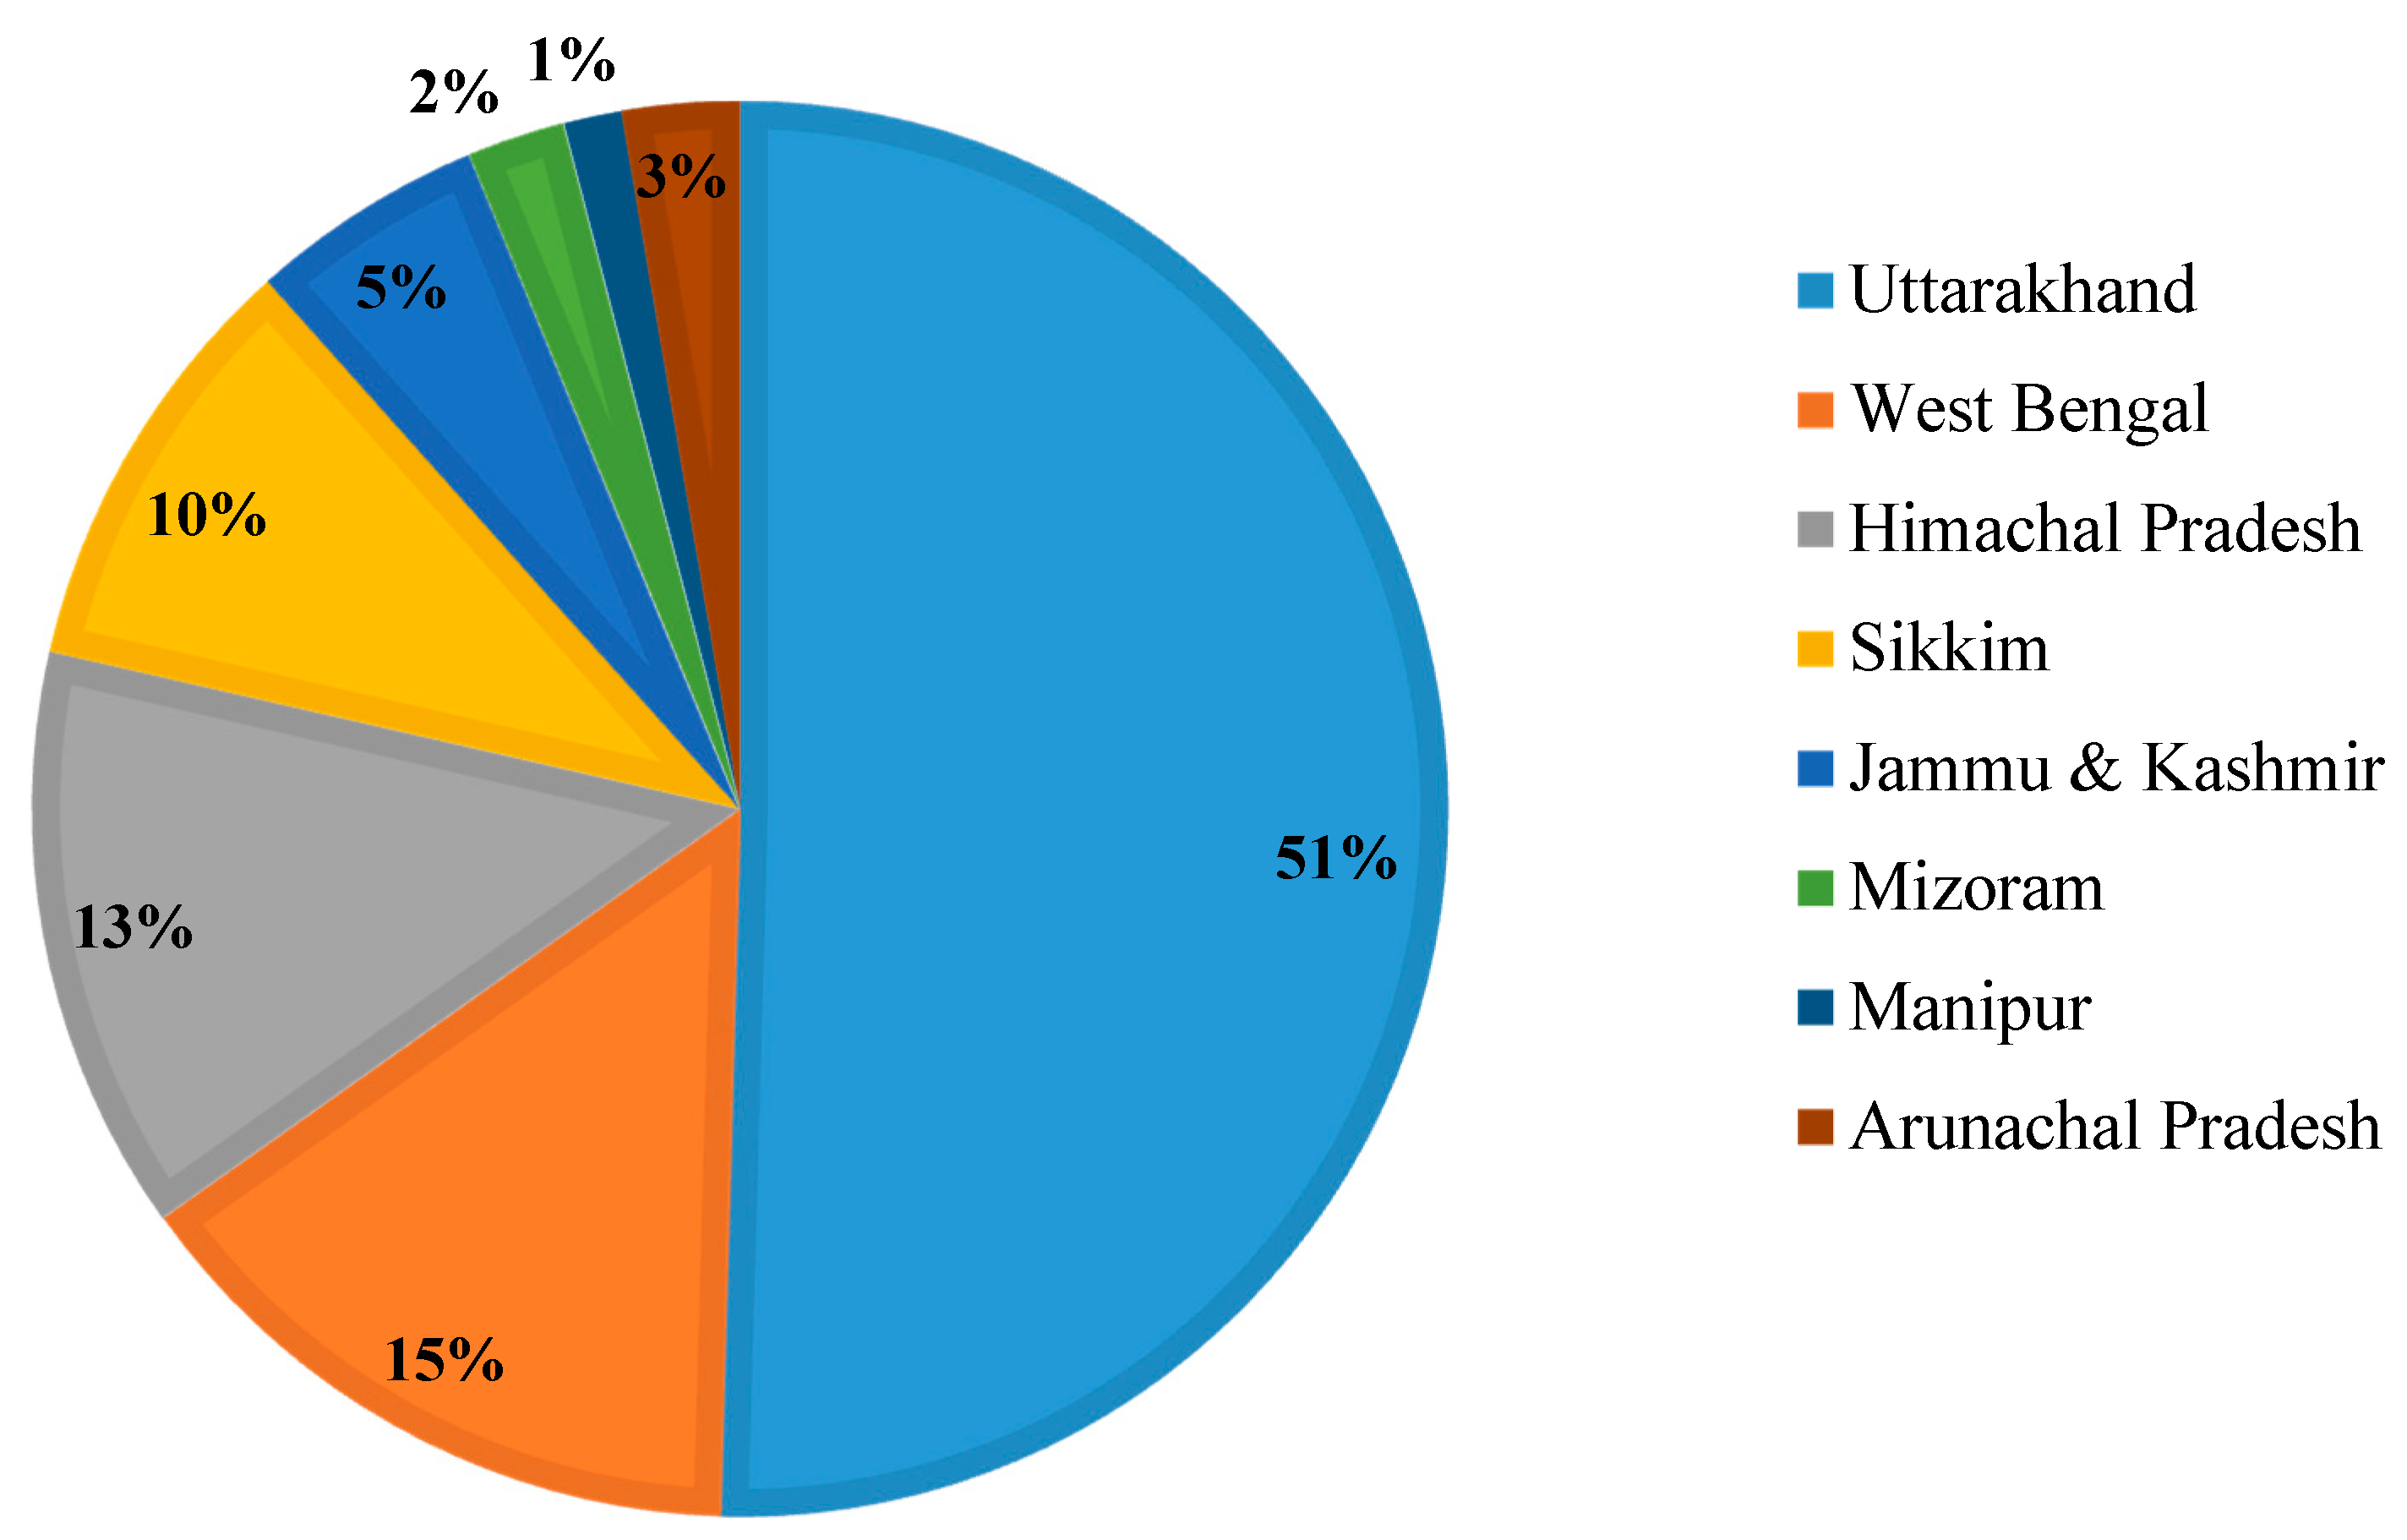
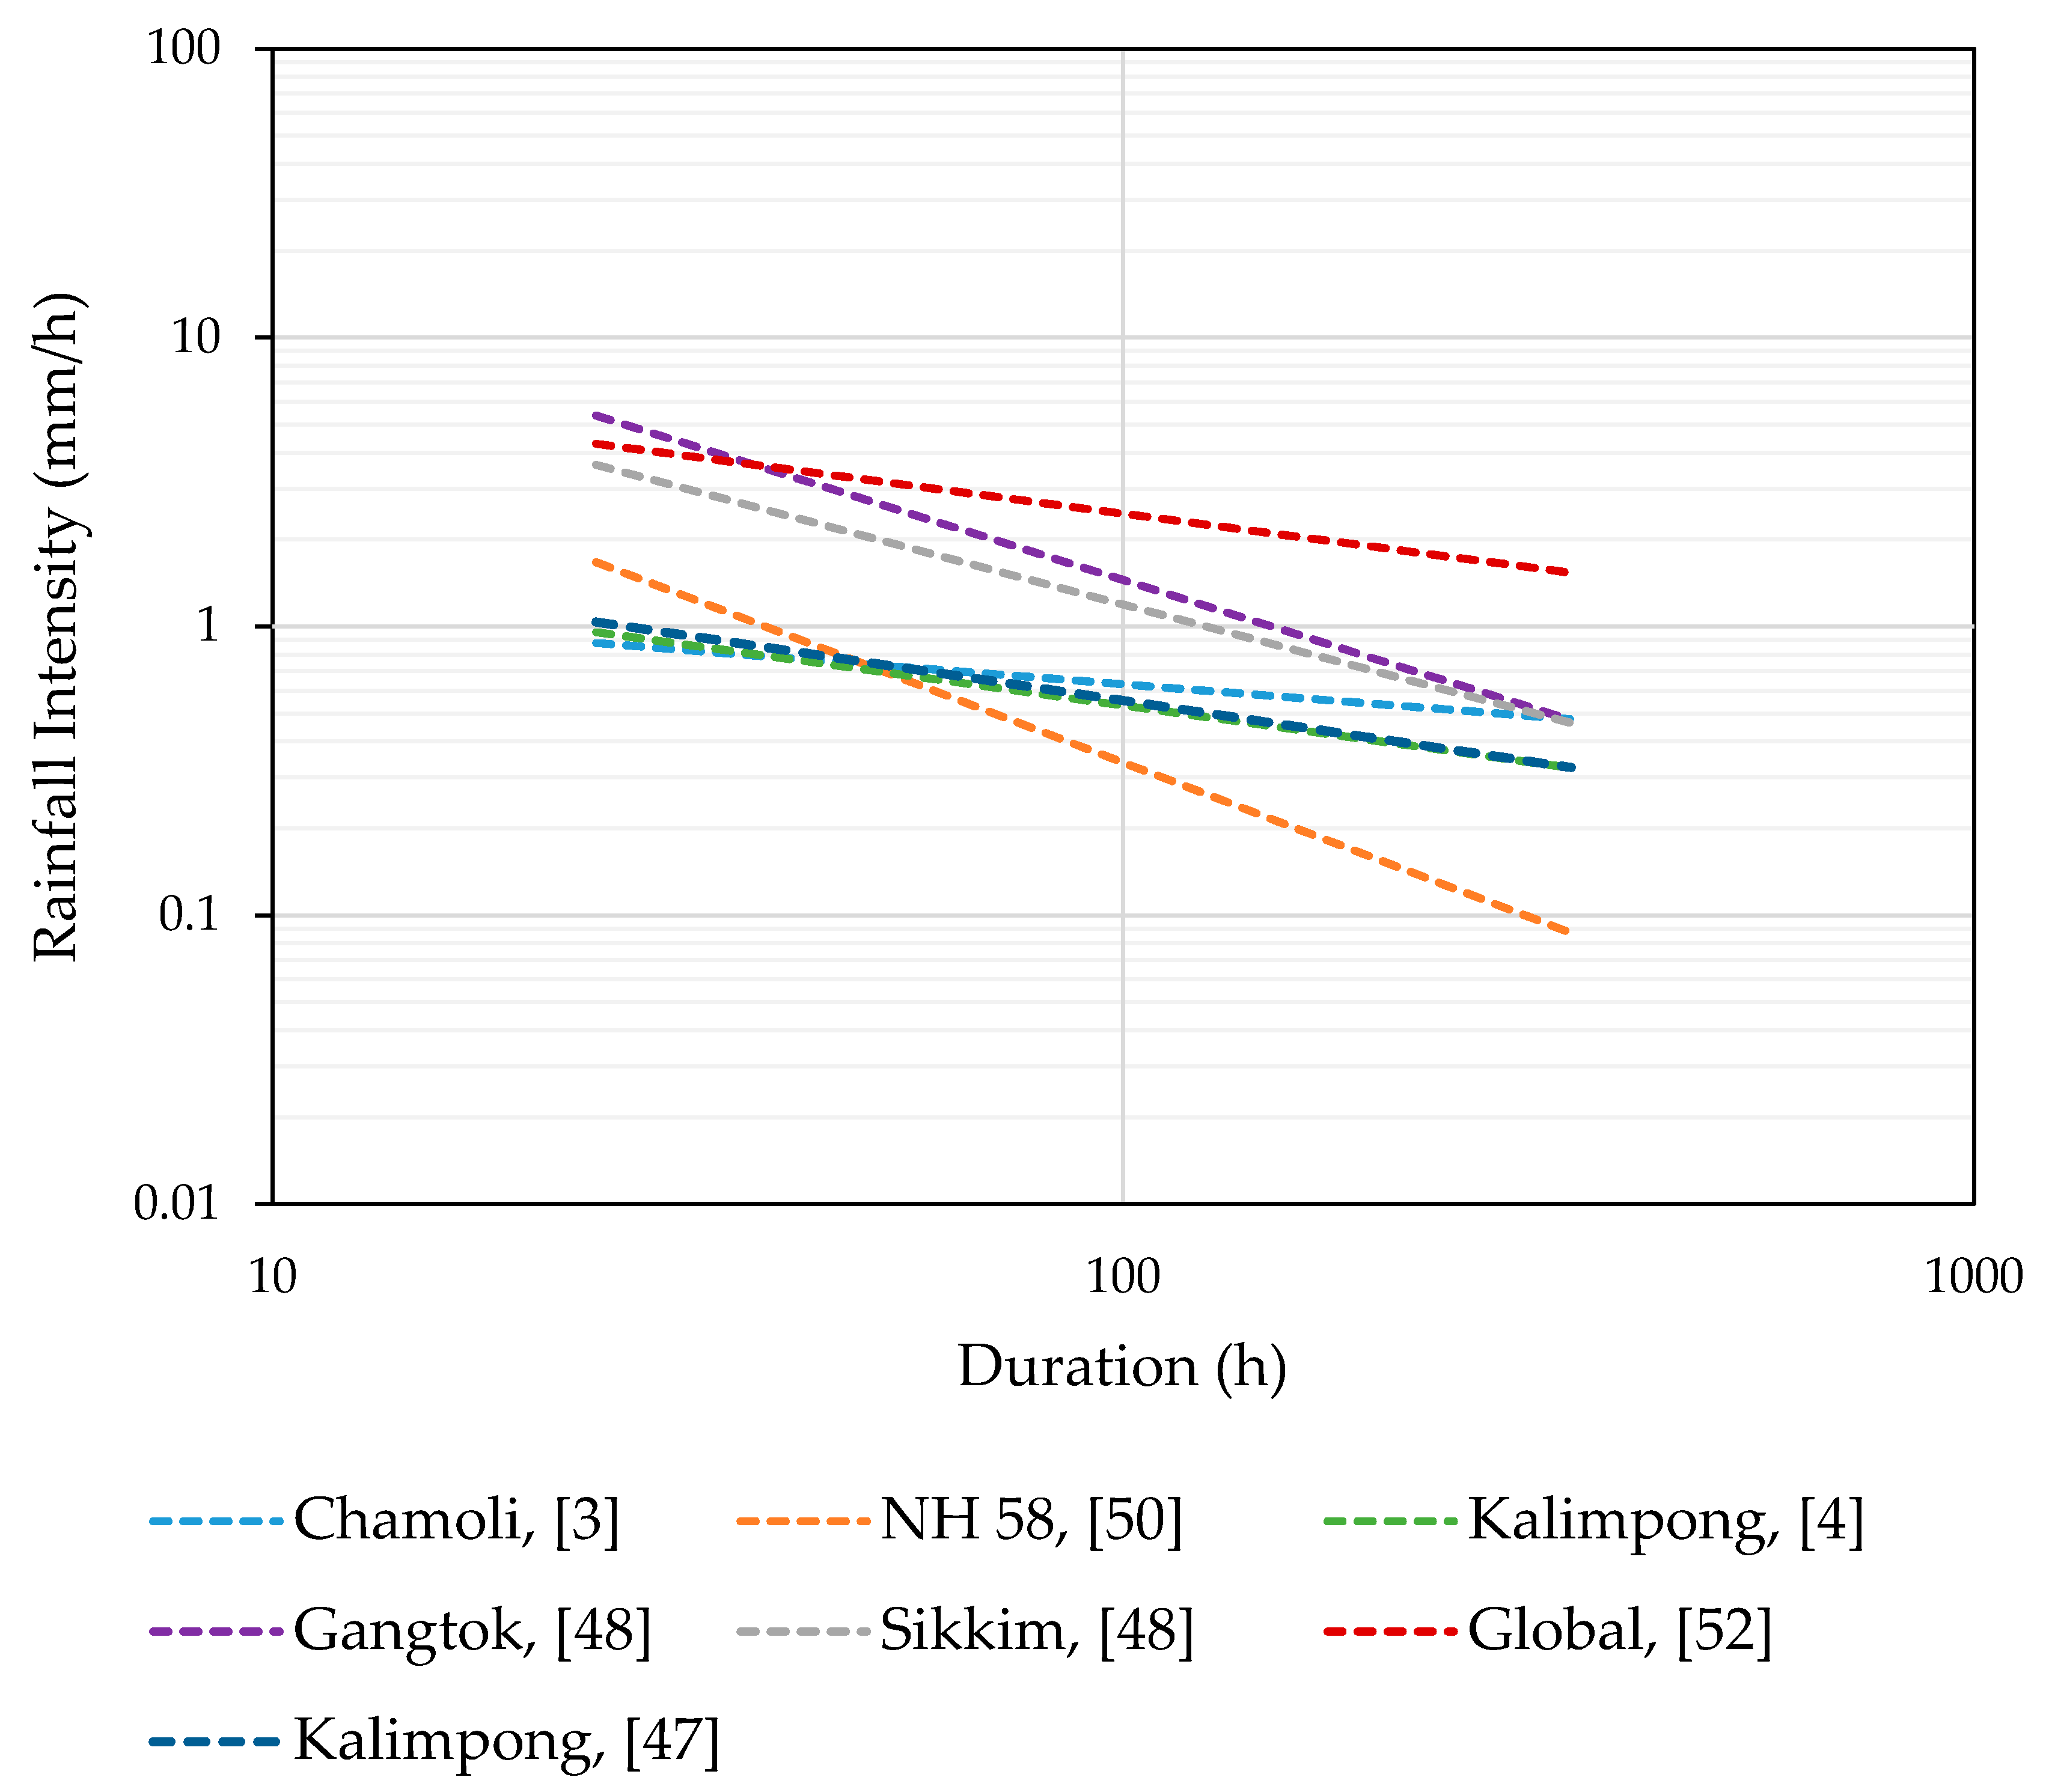
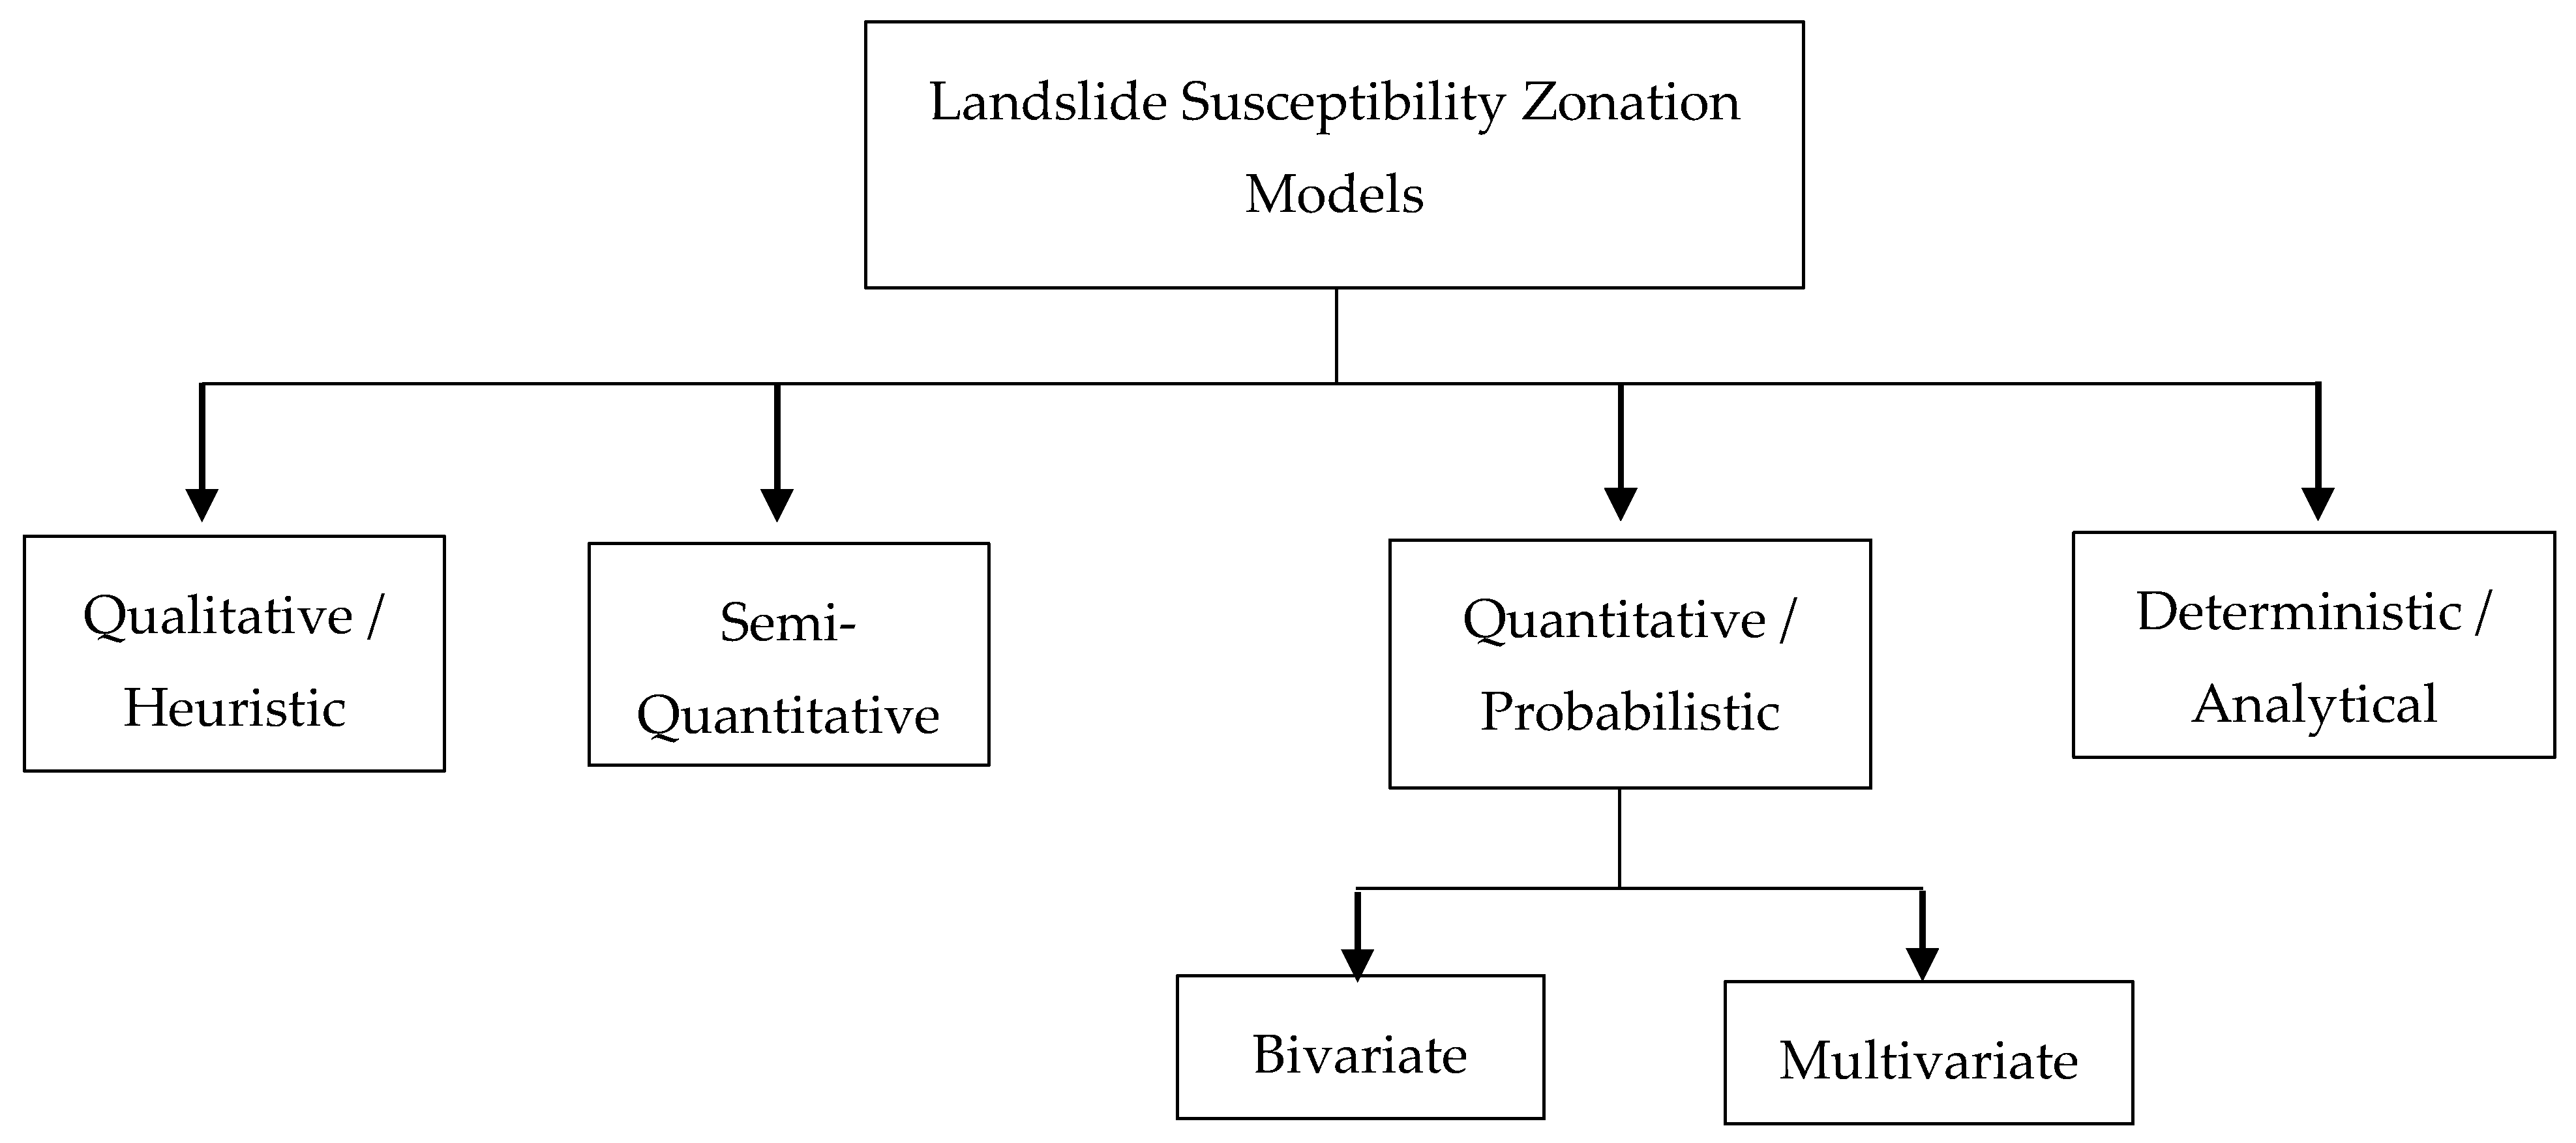
Table 1.
Threshold equations generated for various Himalayan regions using several methods (I is Rainfall Intensity (mm/h), while D is Duration (h)).
Table 1.
Threshold equations generated for various Himalayan regions using several methods (I is Rainfall Intensity (mm/h), while D is Duration (h)).
| Threshold Equation | Region | Methodologies |
|---|---|---|
| Chamoli, Uttarakhand | Empirical thresholds | |
| NH 58, Uttarakhand | Empirical thresholds | |
| Kalimpong, West Bengal | Empirical thresholds | |
| Kalimpong, West Bengal | Semi-automated algorithm approach | |
| Gangtok, Sikkim | Empirical thresholds | |
| Sikkim | Empirical thresholds |
Table 2.
Various computational models used for landslide susceptibility in Uttarakhand Himalayas.
| Models | No of landslides | No of Factors | Test Site Area/Pixel Size | AUC/Accuracy | Articles |
|---|---|---|---|---|---|
| ANN | 154 | 7 | 600 km2/5 m × 5 m | 0.84 | Chauhan et al. [101] |
| Back propagation neural network | 63 | 6 | ~116 km2/30 m × 30 m | 0.8 | Ramakrishna et al. [97] |
| SVM, Proximal SVM, L2-SVM-Modified Finite Newton | 2009 pixels | 8 | 1625 km2/30 m × 30 m | 0.807 | Kumar et al. [102] |
| Multilayer Perceptron (MLP) Neural Networks | 930 | 15 | 1325.47 km2/20 m × 20 m | 0.886 | Pham et al. [94] |
| sequential minimal optimization (SMO) SVM, vote feature interval (VFI), Logistic Regression (LR) | 430 | 11 | 323.82 km2/20 m × 20 m | 0.891 | Pham et al. [98] |
| Functional Trees (FT), Multilayer Perceptron (MLP) Neural Networks, Naïve Bayes (NB) | 430 | 11 | 0.32 km2/20 m × 20 m | 0.850 | Pham et al. [99] |
| Rotation Forest based Radial Basis Function (RFRBF) neural network | 930 | 15 | 0.13 km2/20 m × 20 m | 0.891 | Pham et al. [103] |
| Aggregating One-Dependence Estimators, SVM, ANN-RBF, LR, NB | 1295 | 16 | 561 km2/30 m × 30 m | 0.968 | Pham et al. [104] |
| Ensemble decision tree | 103 | 10 | 242 km2/20 m × 20 m | 0.883 | Pham et al. [13] |
| Rotation Forest Ensemble Model | 103 | 10 | 242 km2/30 m × 30 m | 0.741 | Pham et al. [95] |
| Hybrid Reduced Error Pruning Trees | 103 | 10 | 242 km2/30 m × 30 m | 0.989 | Pham et al. [100] |
| Hybrid model of Multi Boost ensemble and SVM | 391 | 16 | 270 km2/10 m × 10 m | 0.972 | Pham et al. [105] |
| Neuro-fuzzy inference system | 391 | 16 | 270 km2/30 m × 30 m | 0.95 | Jaafari et al. [106] |
| Fuzzy Expert System, Extreme Learning Machine | 49 | 8 | 43 km2/15 m × 15 m | 0.844 | Peethambaran et al. [96] |
© 2020 by the authors. Licensee MDPI, Basel, Switzerland. This article is an open access article distributed under the terms and conditions of the Creative Commons Attribution (CC BY) license (http://creativecommons.org/licenses/by/4.0/).
Share and Cite
MDPI and ACS Style
Dikshit, A.; Sarkar, R.; Pradhan, B.; Segoni, S.; Alamri, A.M. Rainfall Induced Landslide Studies in Indian Himalayan Region: A Critical Review. Appl. Sci. 2020, 10, 2466. https://0-doi-org.brum.beds.ac.uk/10.3390/app10072466
AMA Style
Dikshit A, Sarkar R, Pradhan B, Segoni S, Alamri AM. Rainfall Induced Landslide Studies in Indian Himalayan Region: A Critical Review. Applied Sciences. 2020; 10(7):2466. https://0-doi-org.brum.beds.ac.uk/10.3390/app10072466
Chicago/Turabian StyleDikshit, Abhirup, Raju Sarkar, Biswajeet Pradhan, Samuele Segoni, and Abdullah M. Alamri. 2020. "Rainfall Induced Landslide Studies in Indian Himalayan Region: A Critical Review" Applied Sciences 10, no. 7: 2466. https://0-doi-org.brum.beds.ac.uk/10.3390/app10072466
Note that from the first issue of 2016, this journal uses article numbers instead of page numbers. See further details here.