Soft Computing Ensemble Models Based on Logistic Regression for Groundwater Potential Mapping


 ,
, 
 , , and
Abstract
:1. Introduction
2. Methods Used
2.1. Logistic Regression (LR)
2.2. Bagging
2.3. Dagging
2.4. Cascade Generalization (CG)
2.5. Random Subspace (RSS)
2.6. Validation Methods
2.6.1. Receiver Operating Characteristic (ROC) Curve
2.6.2. Statistical Indices
2.7. OneR Feature Selection Method
3. Study Area and Data Used
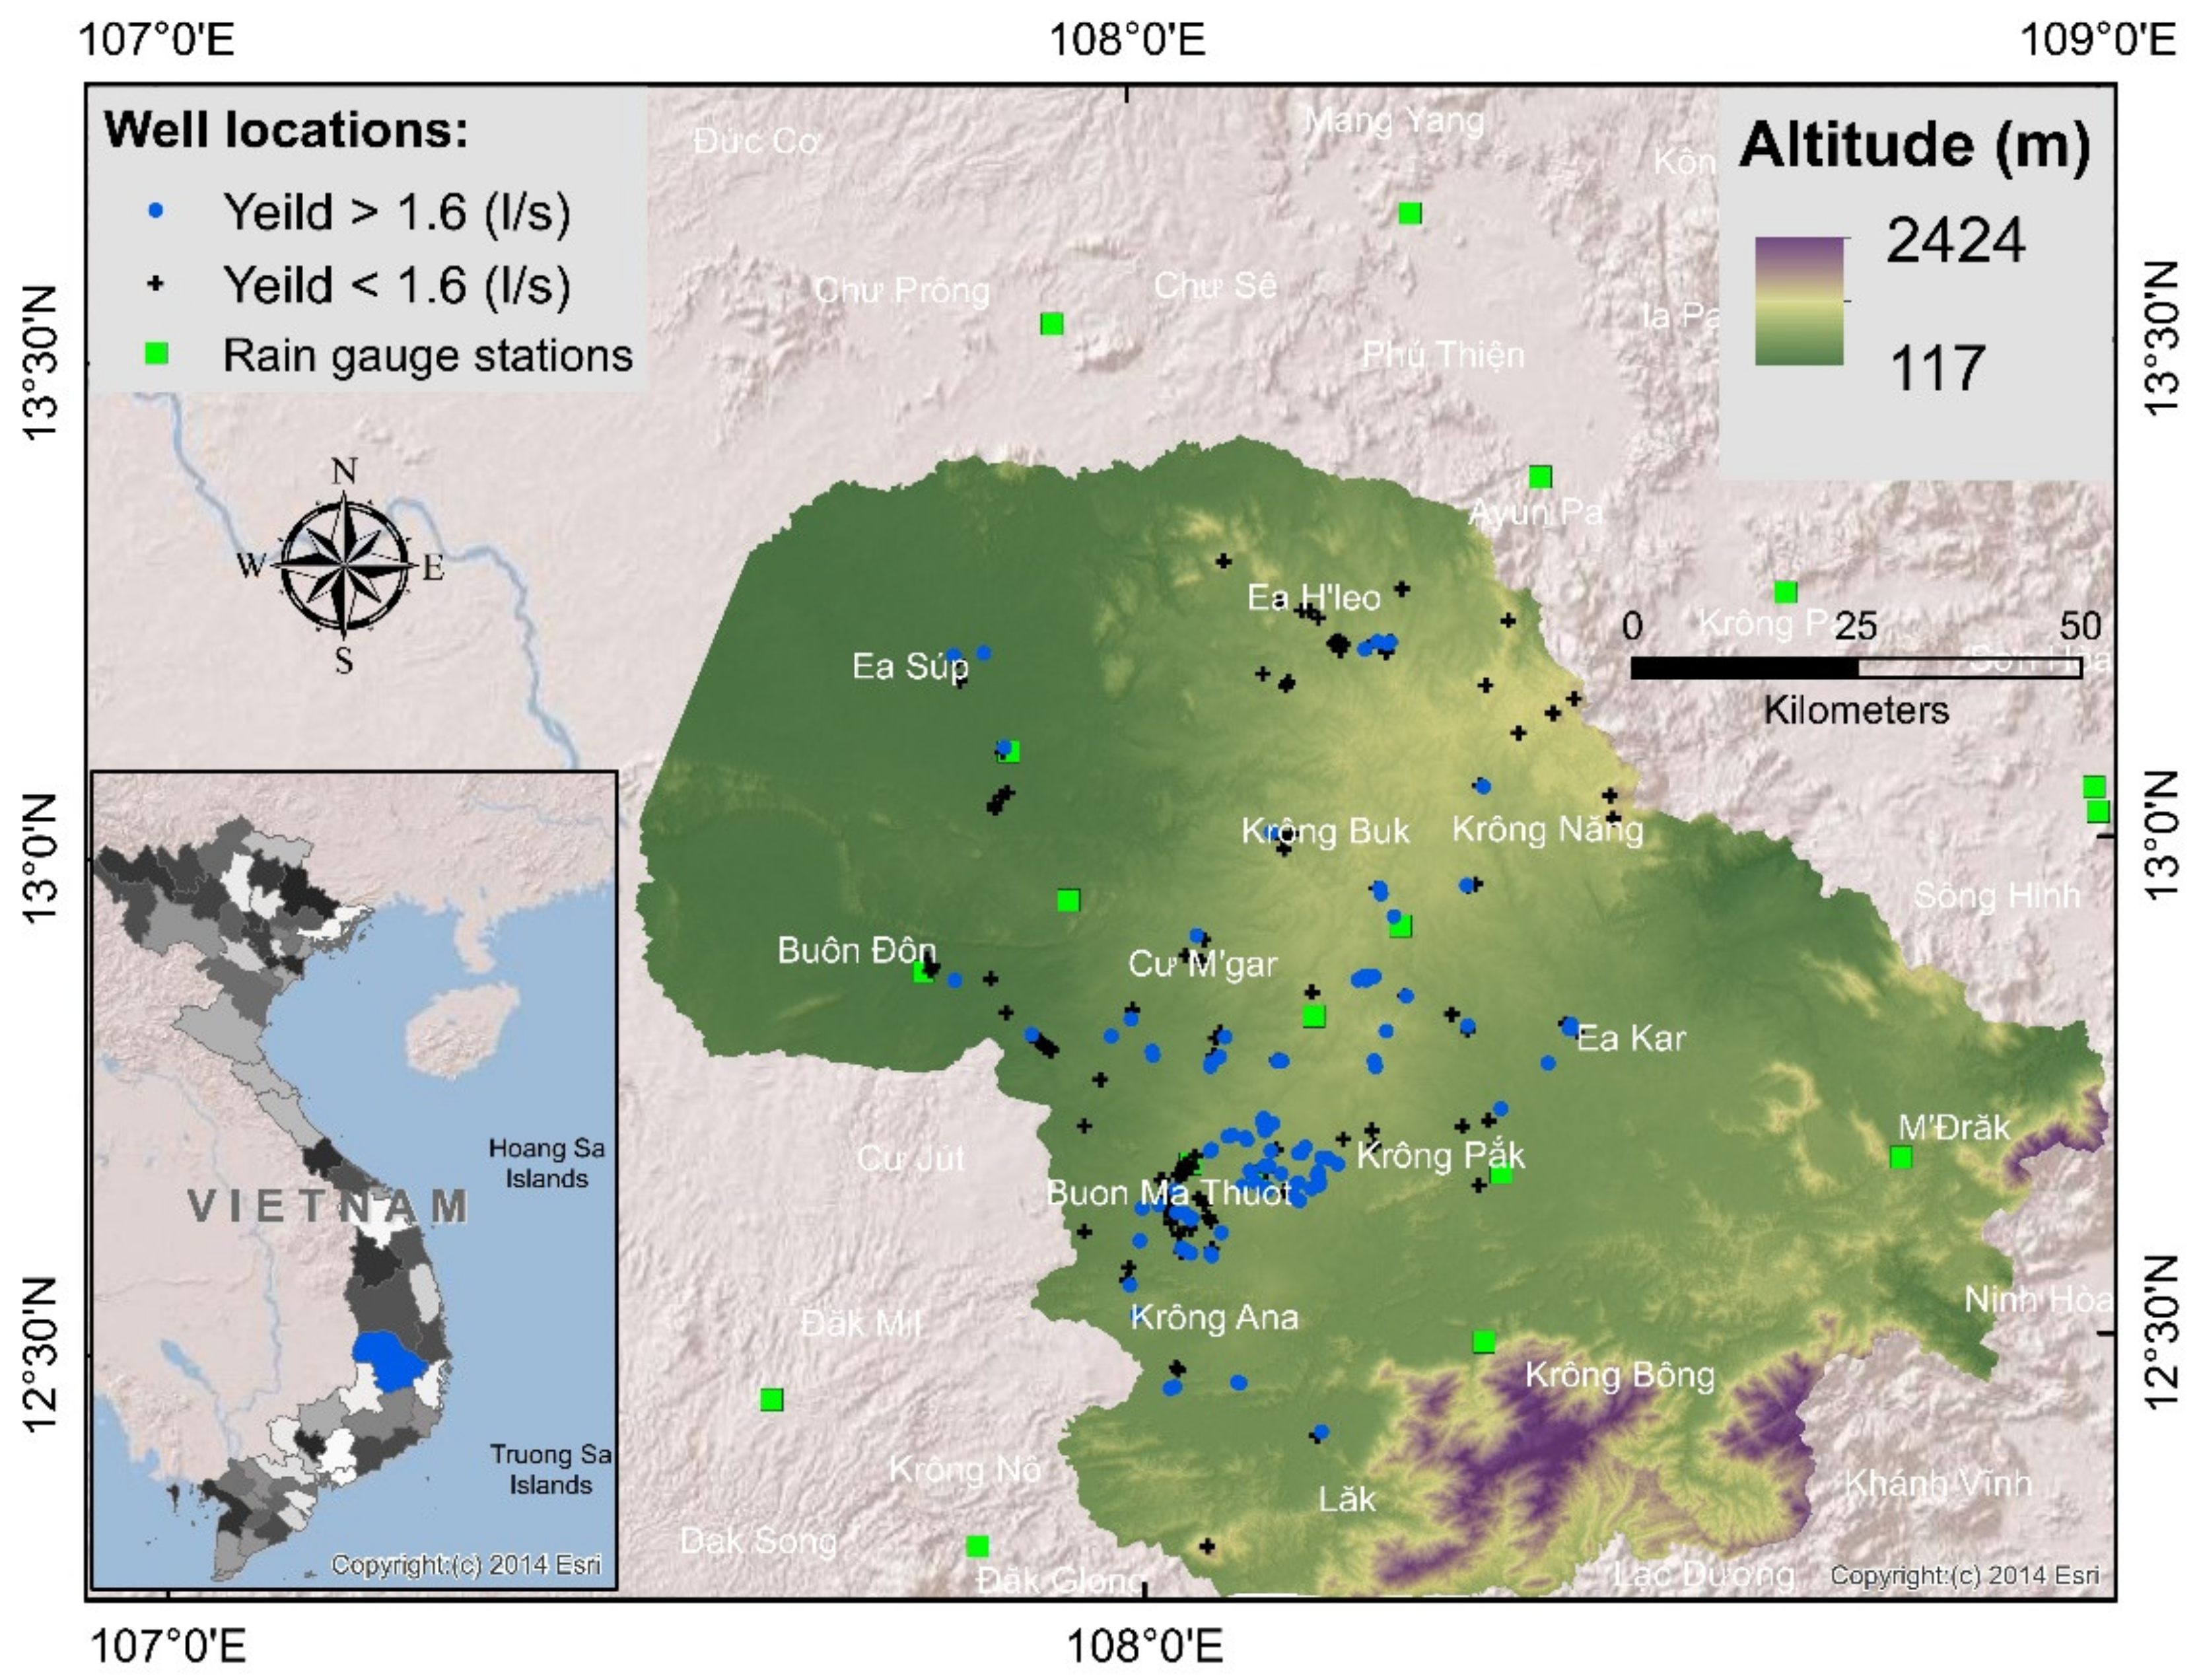
3.1. Study Area
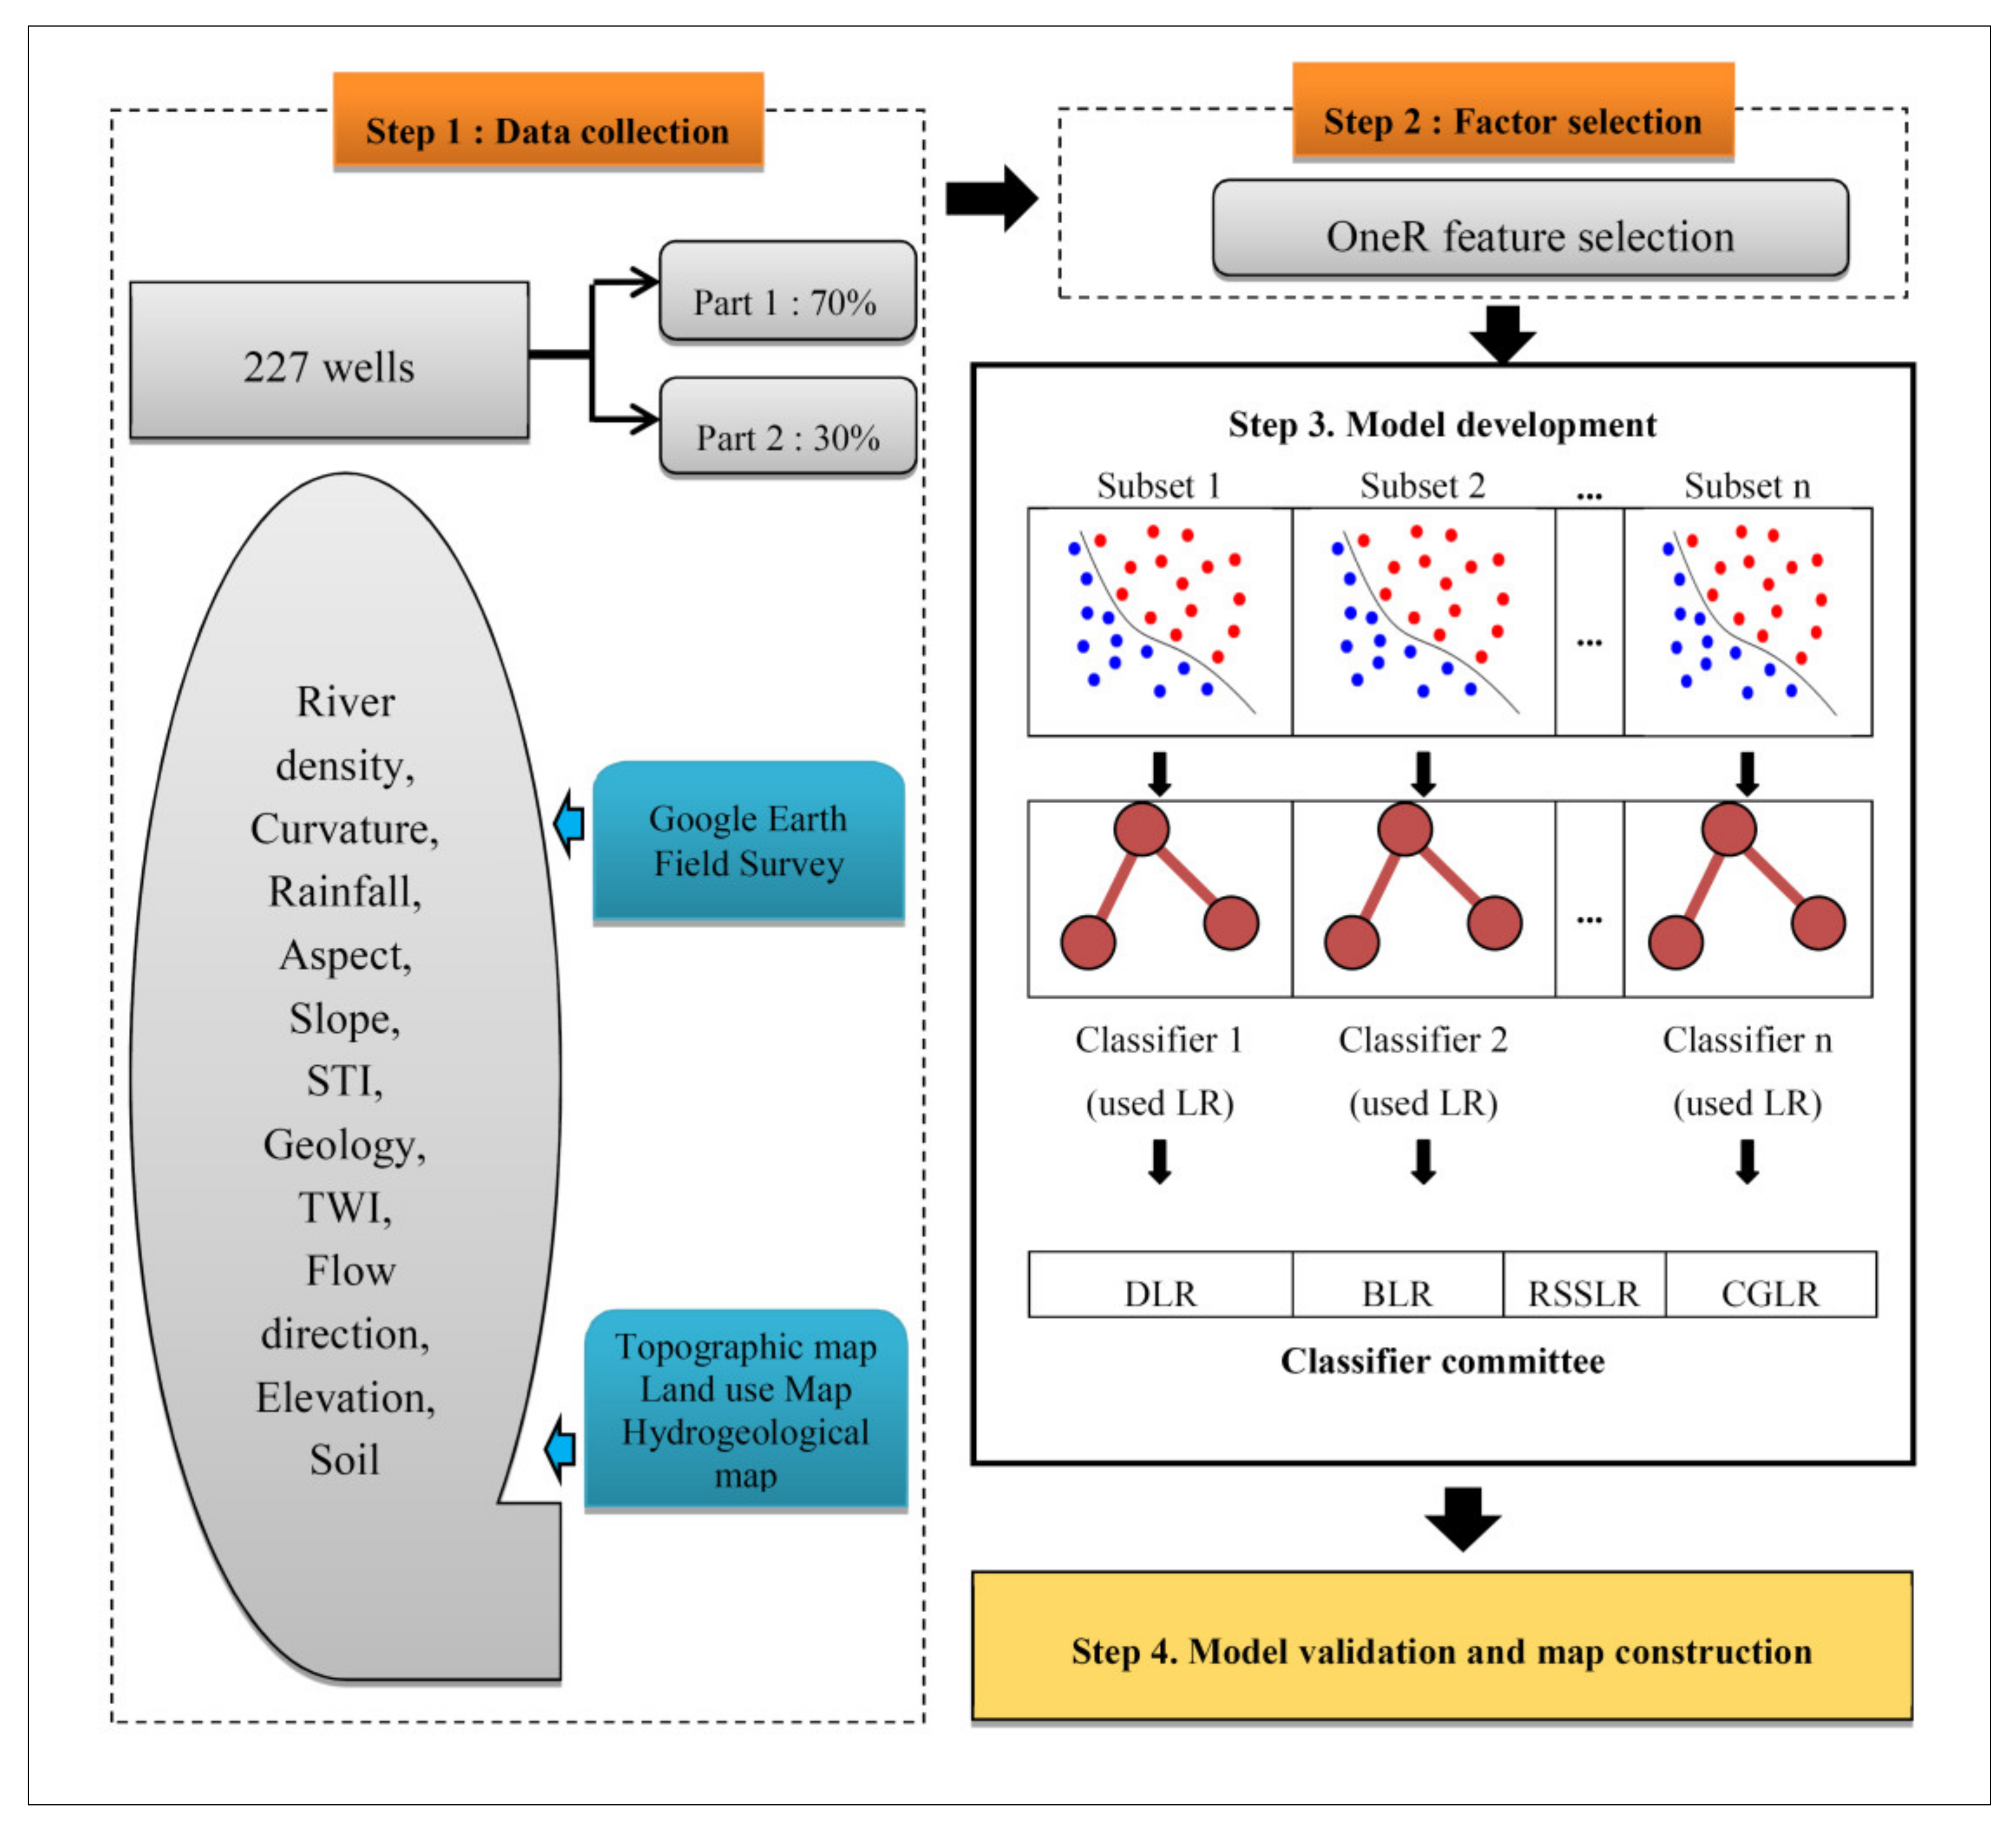
3.2. Data Used
3.2.1. Well Yields
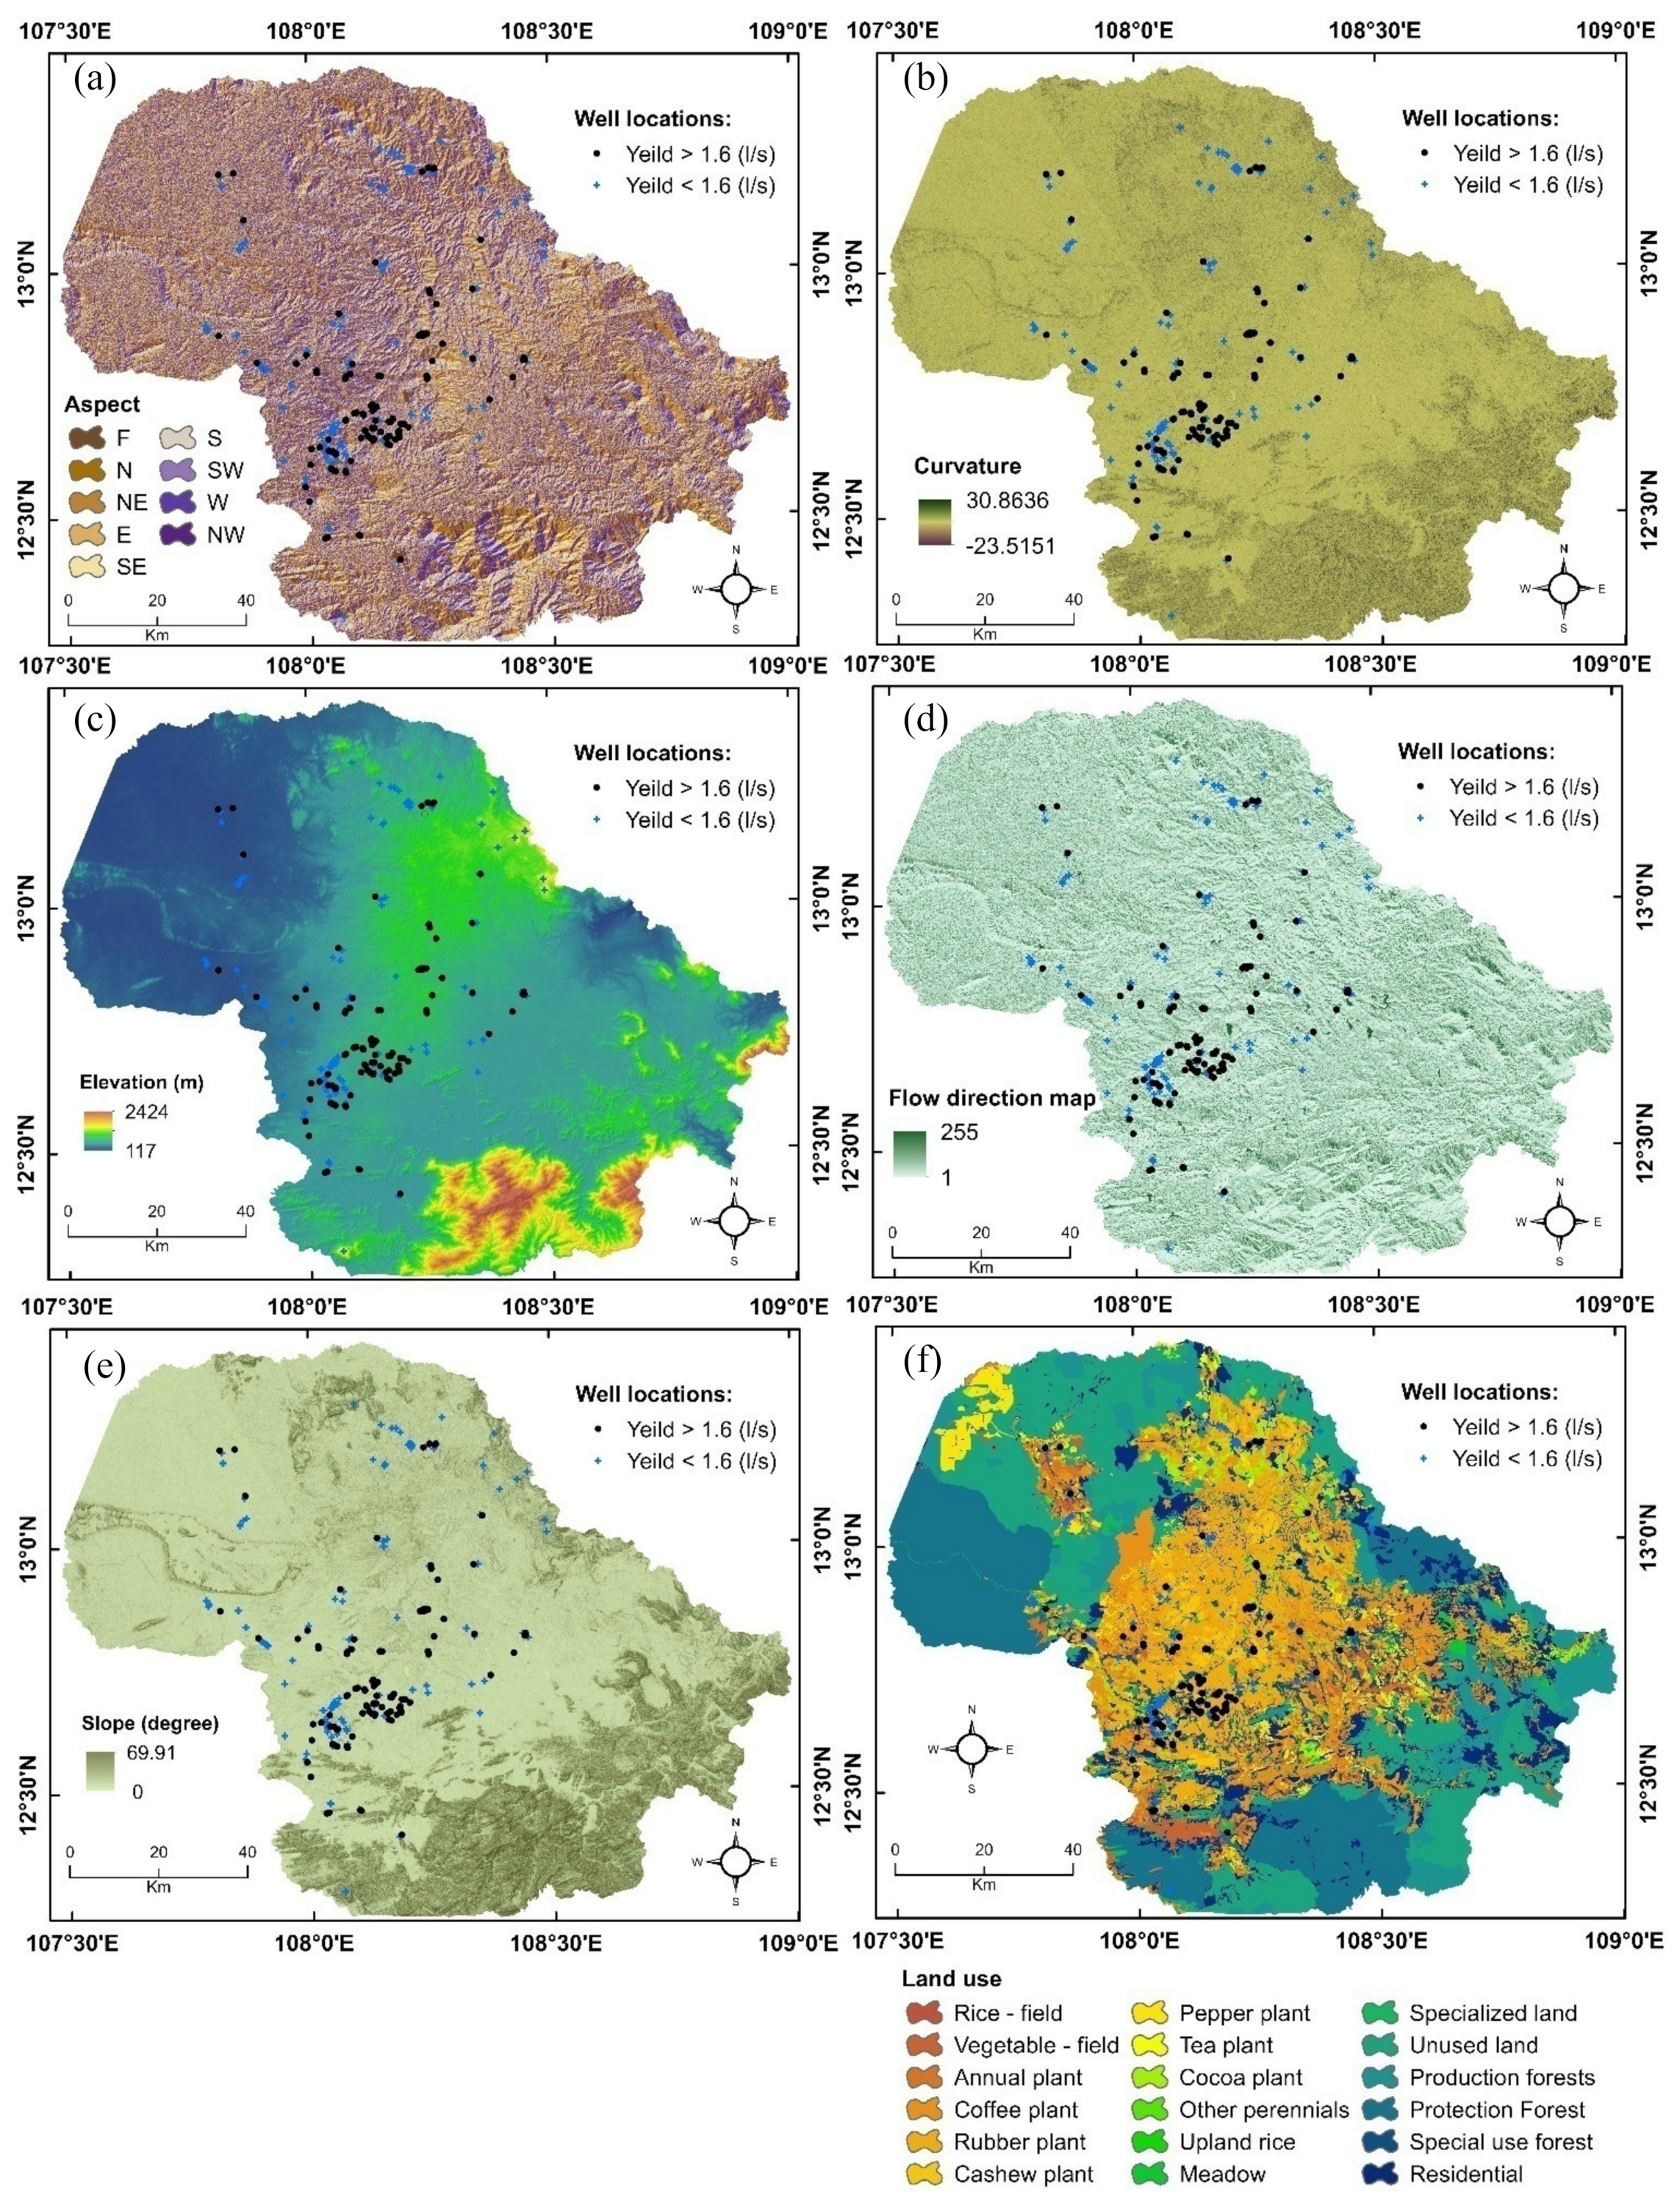
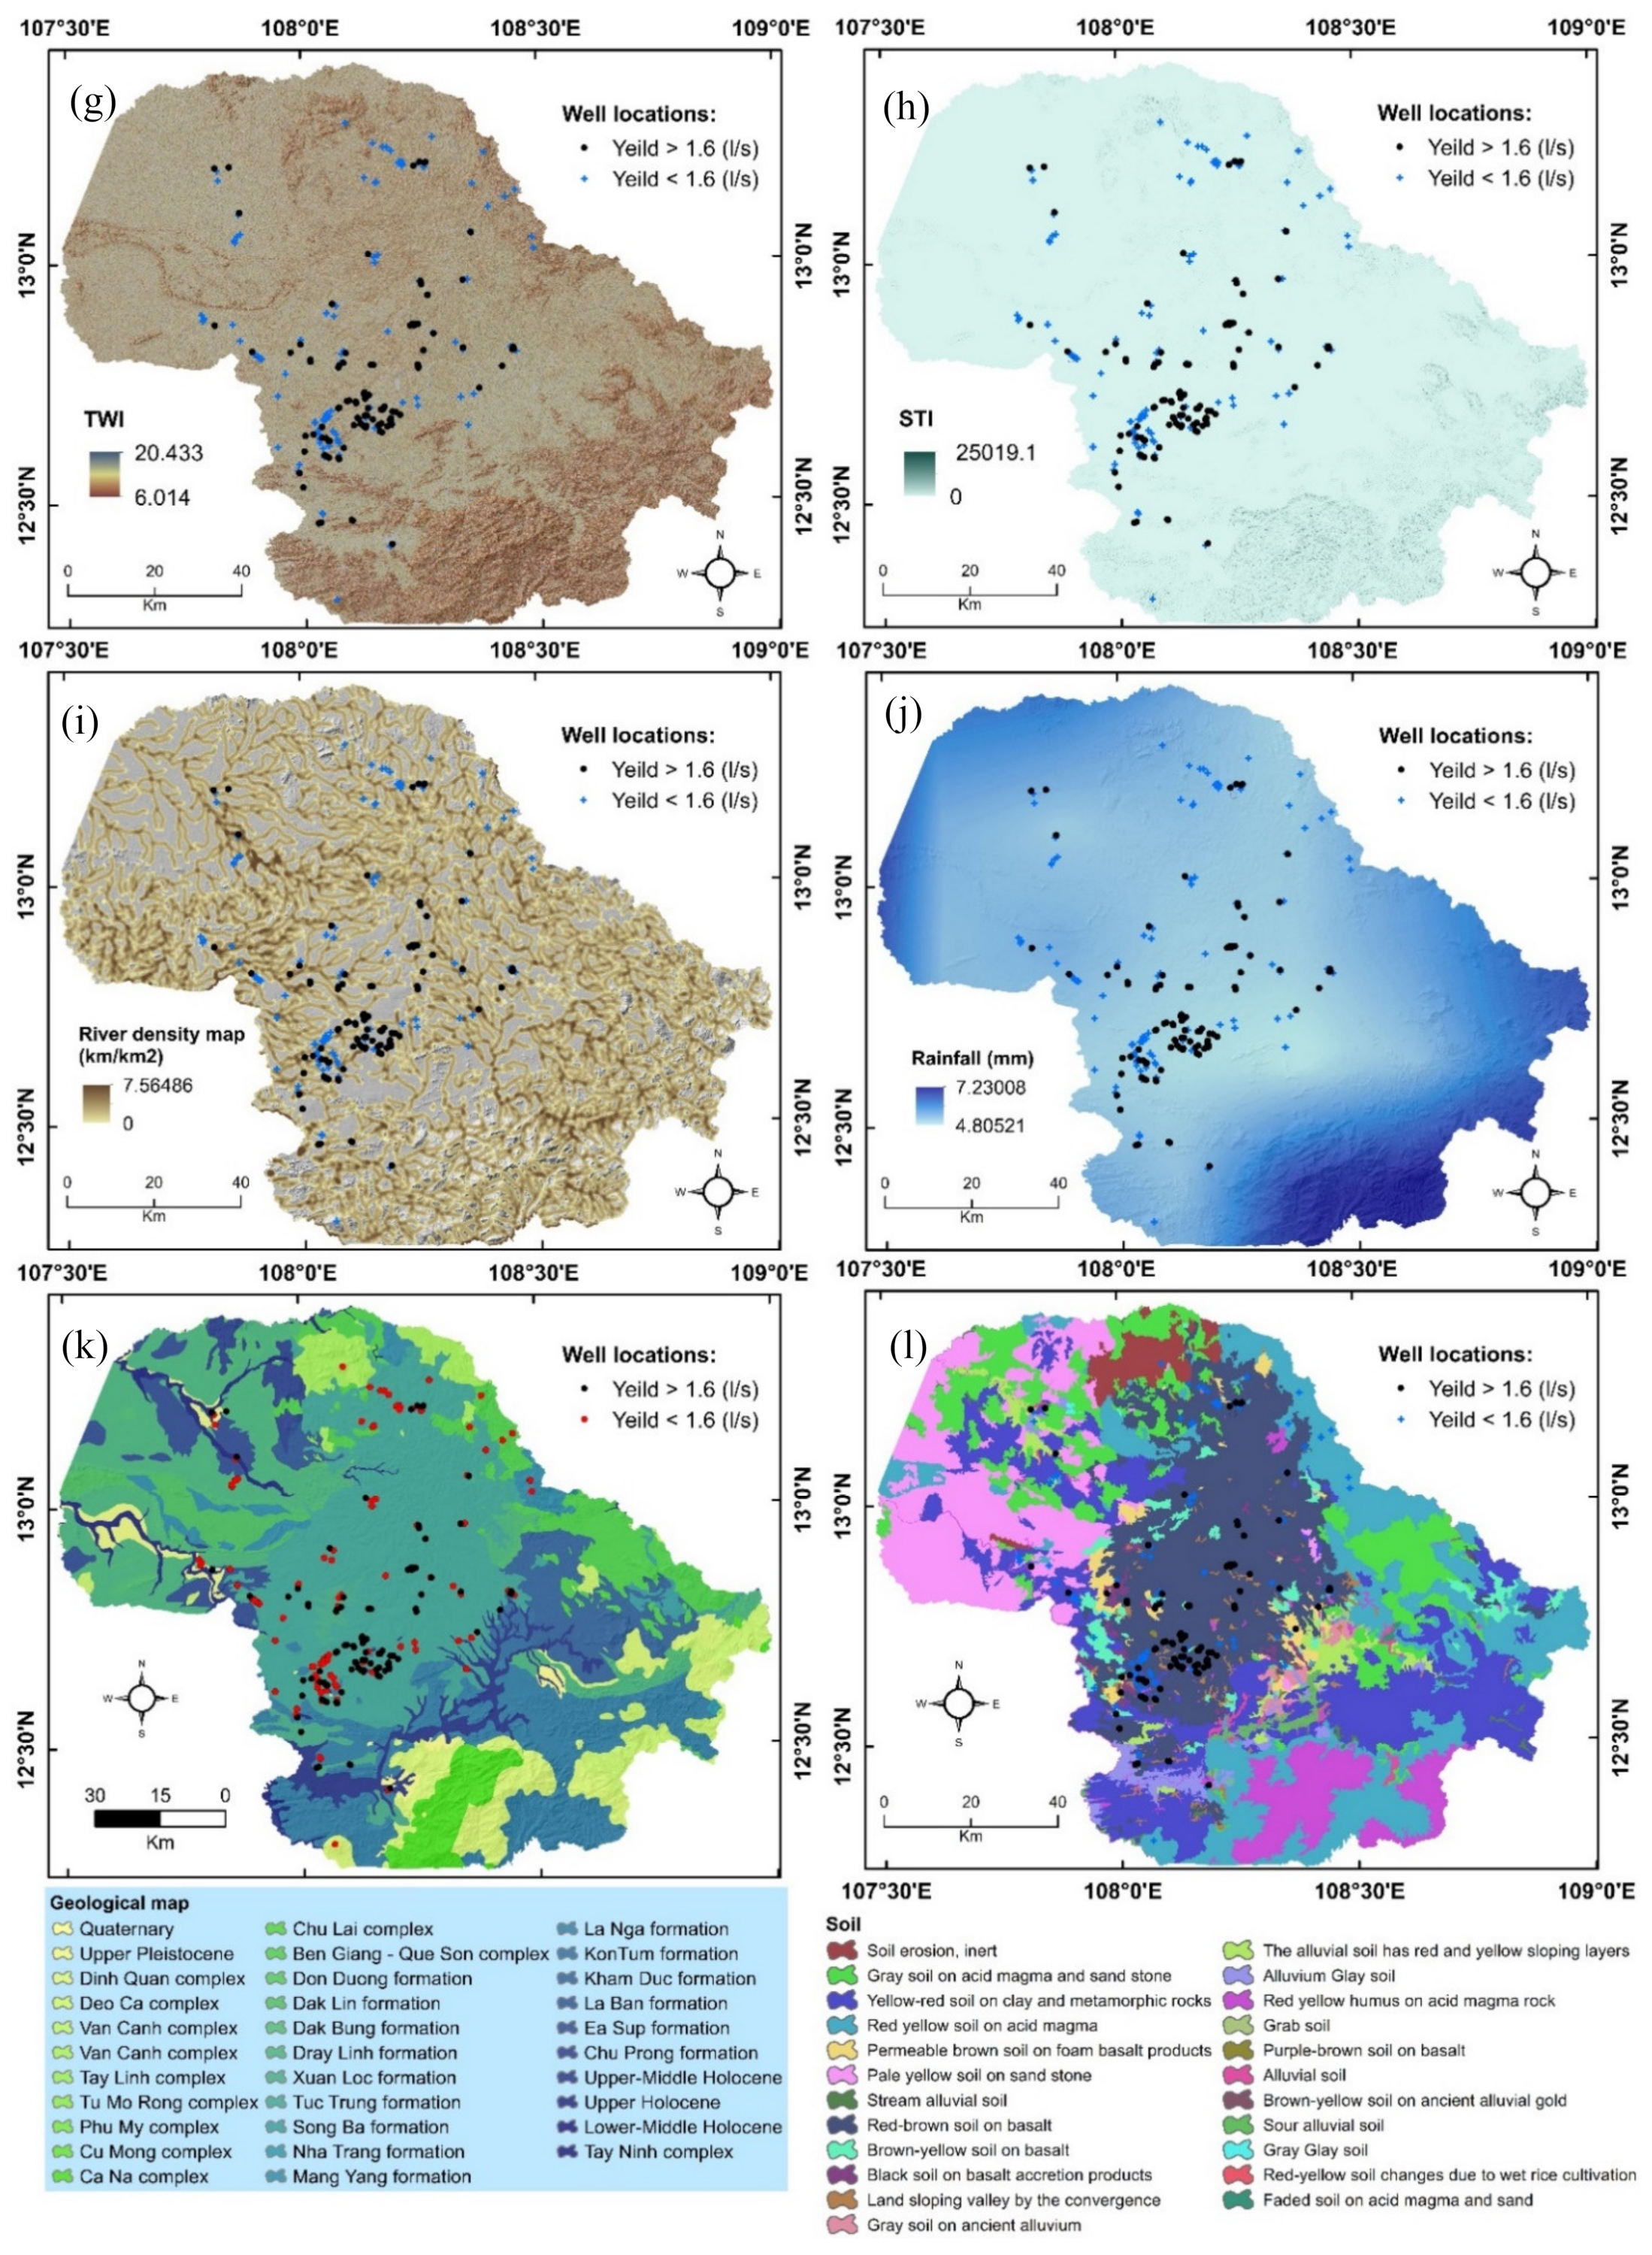
3.2.2. Groundwater Influencing Factors
4. Modeling Methodology
5. Results and Analysis
5.1. Factor Importance
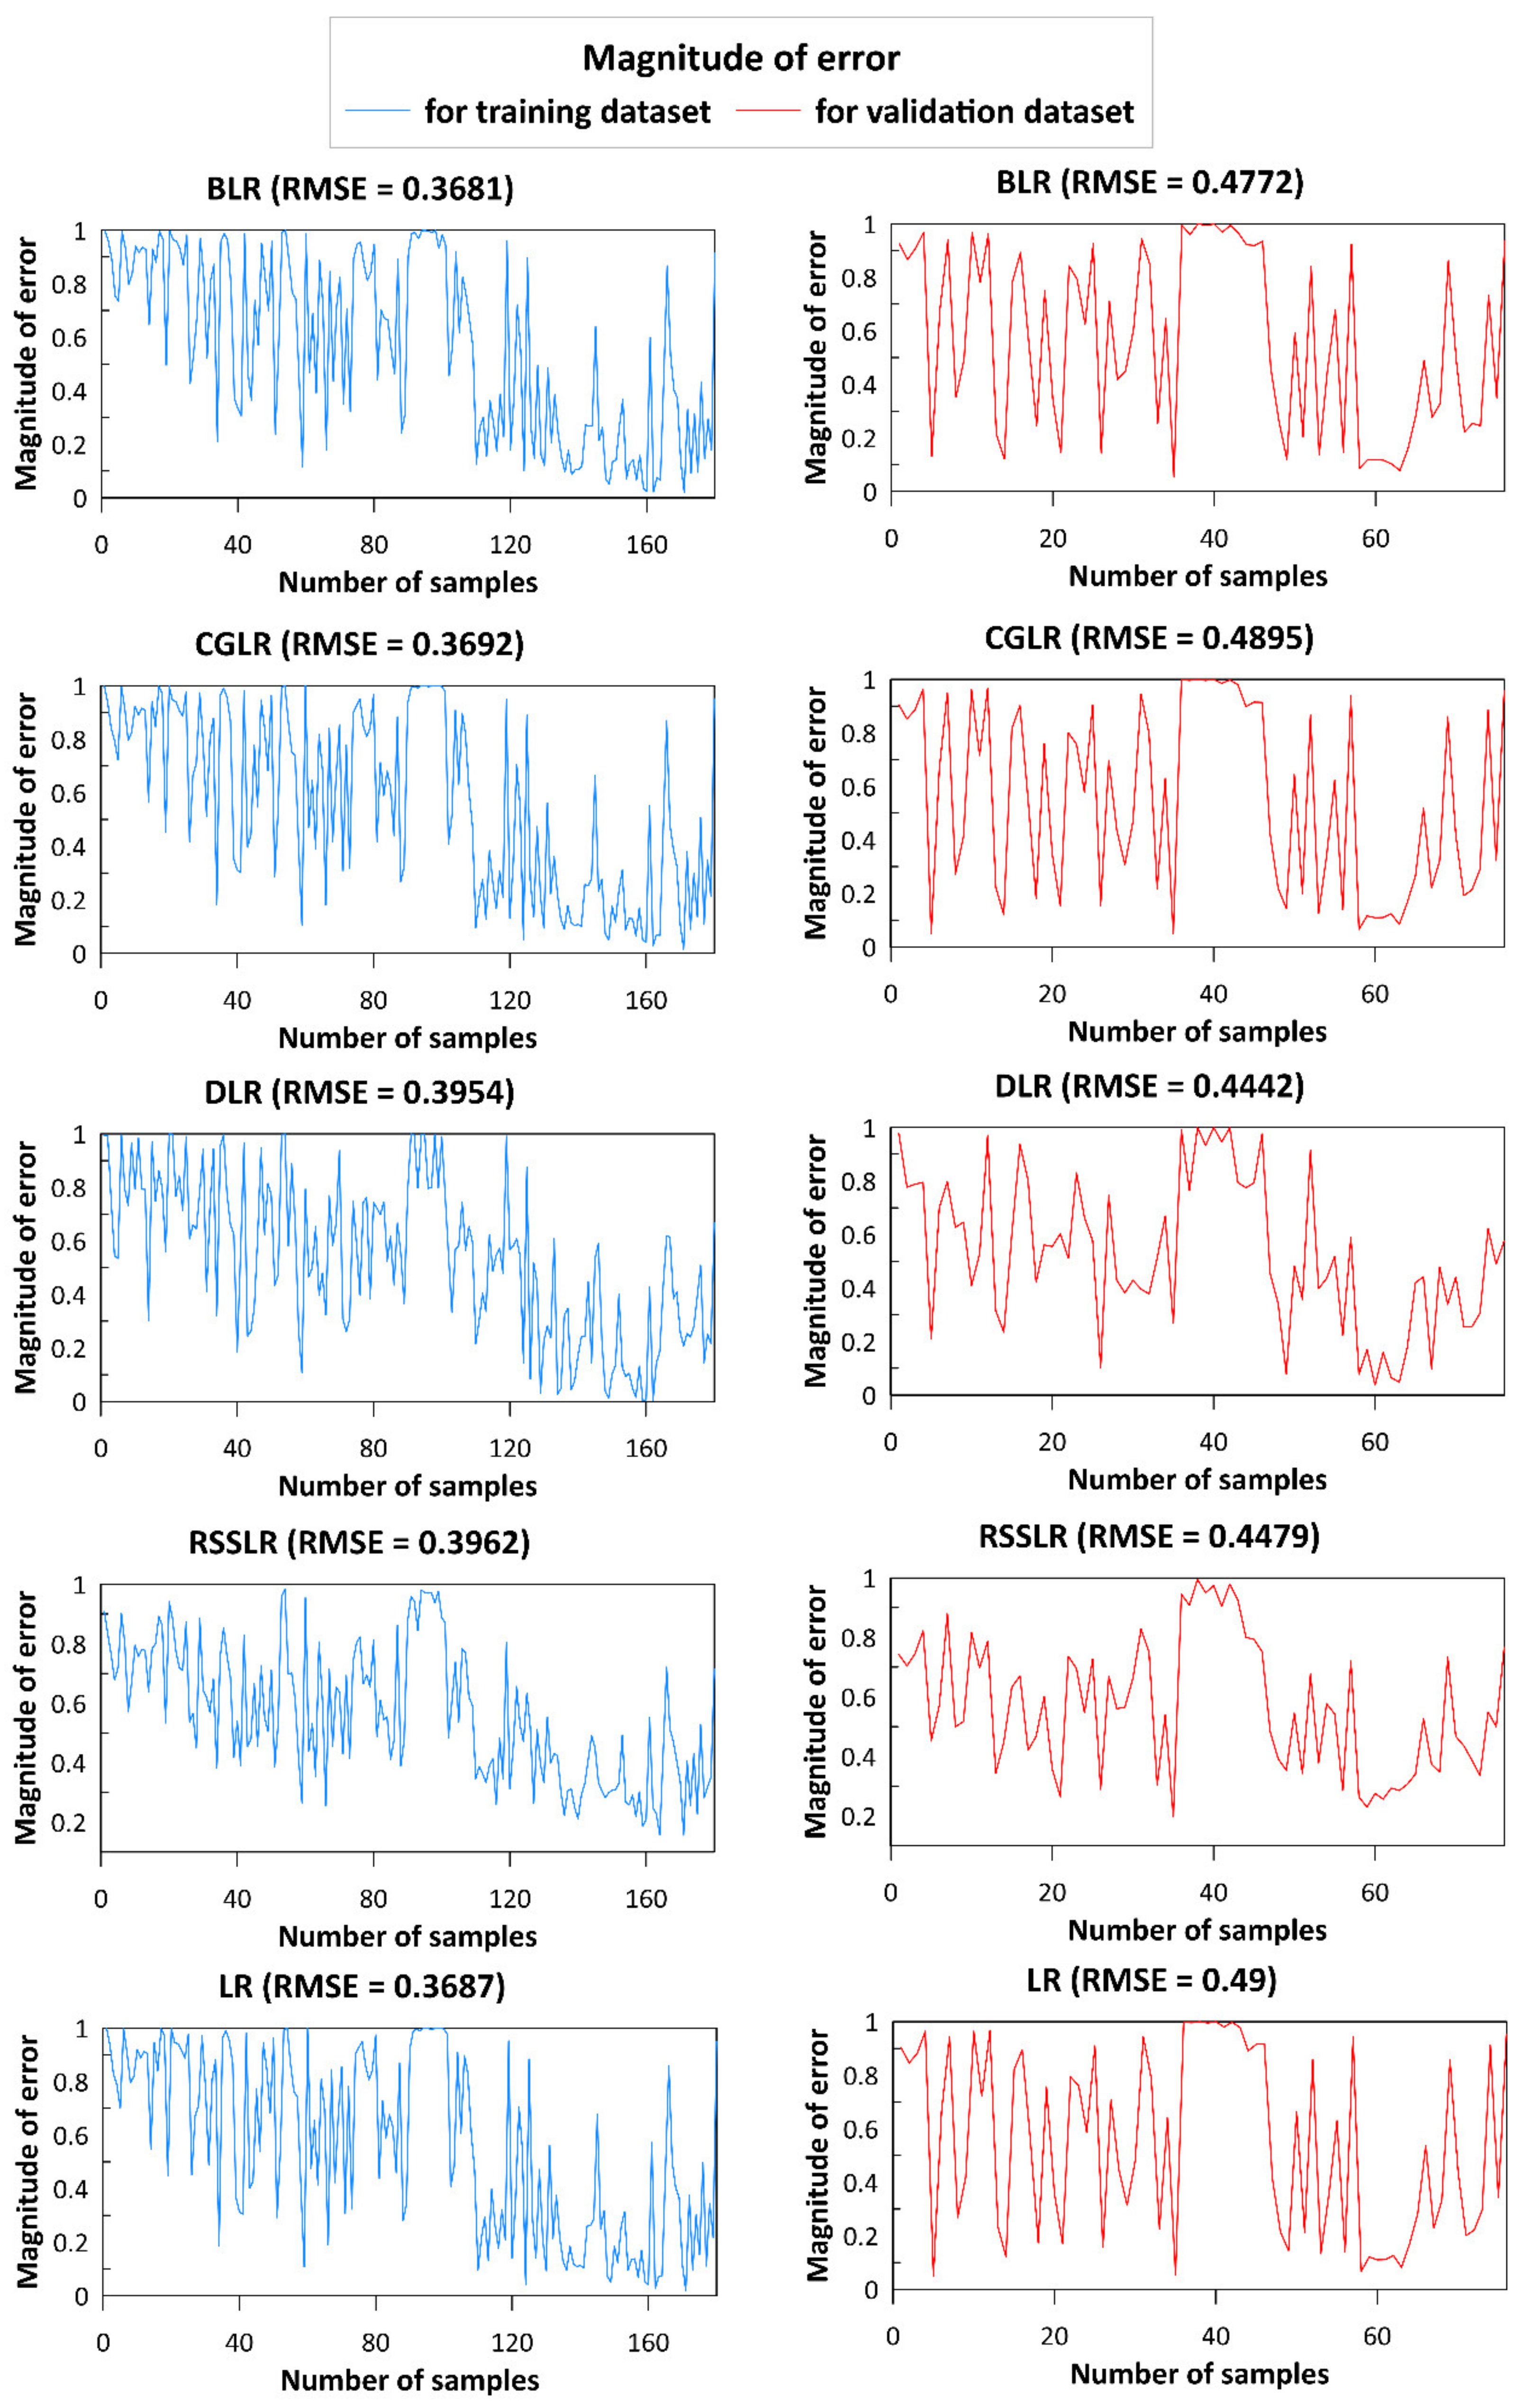
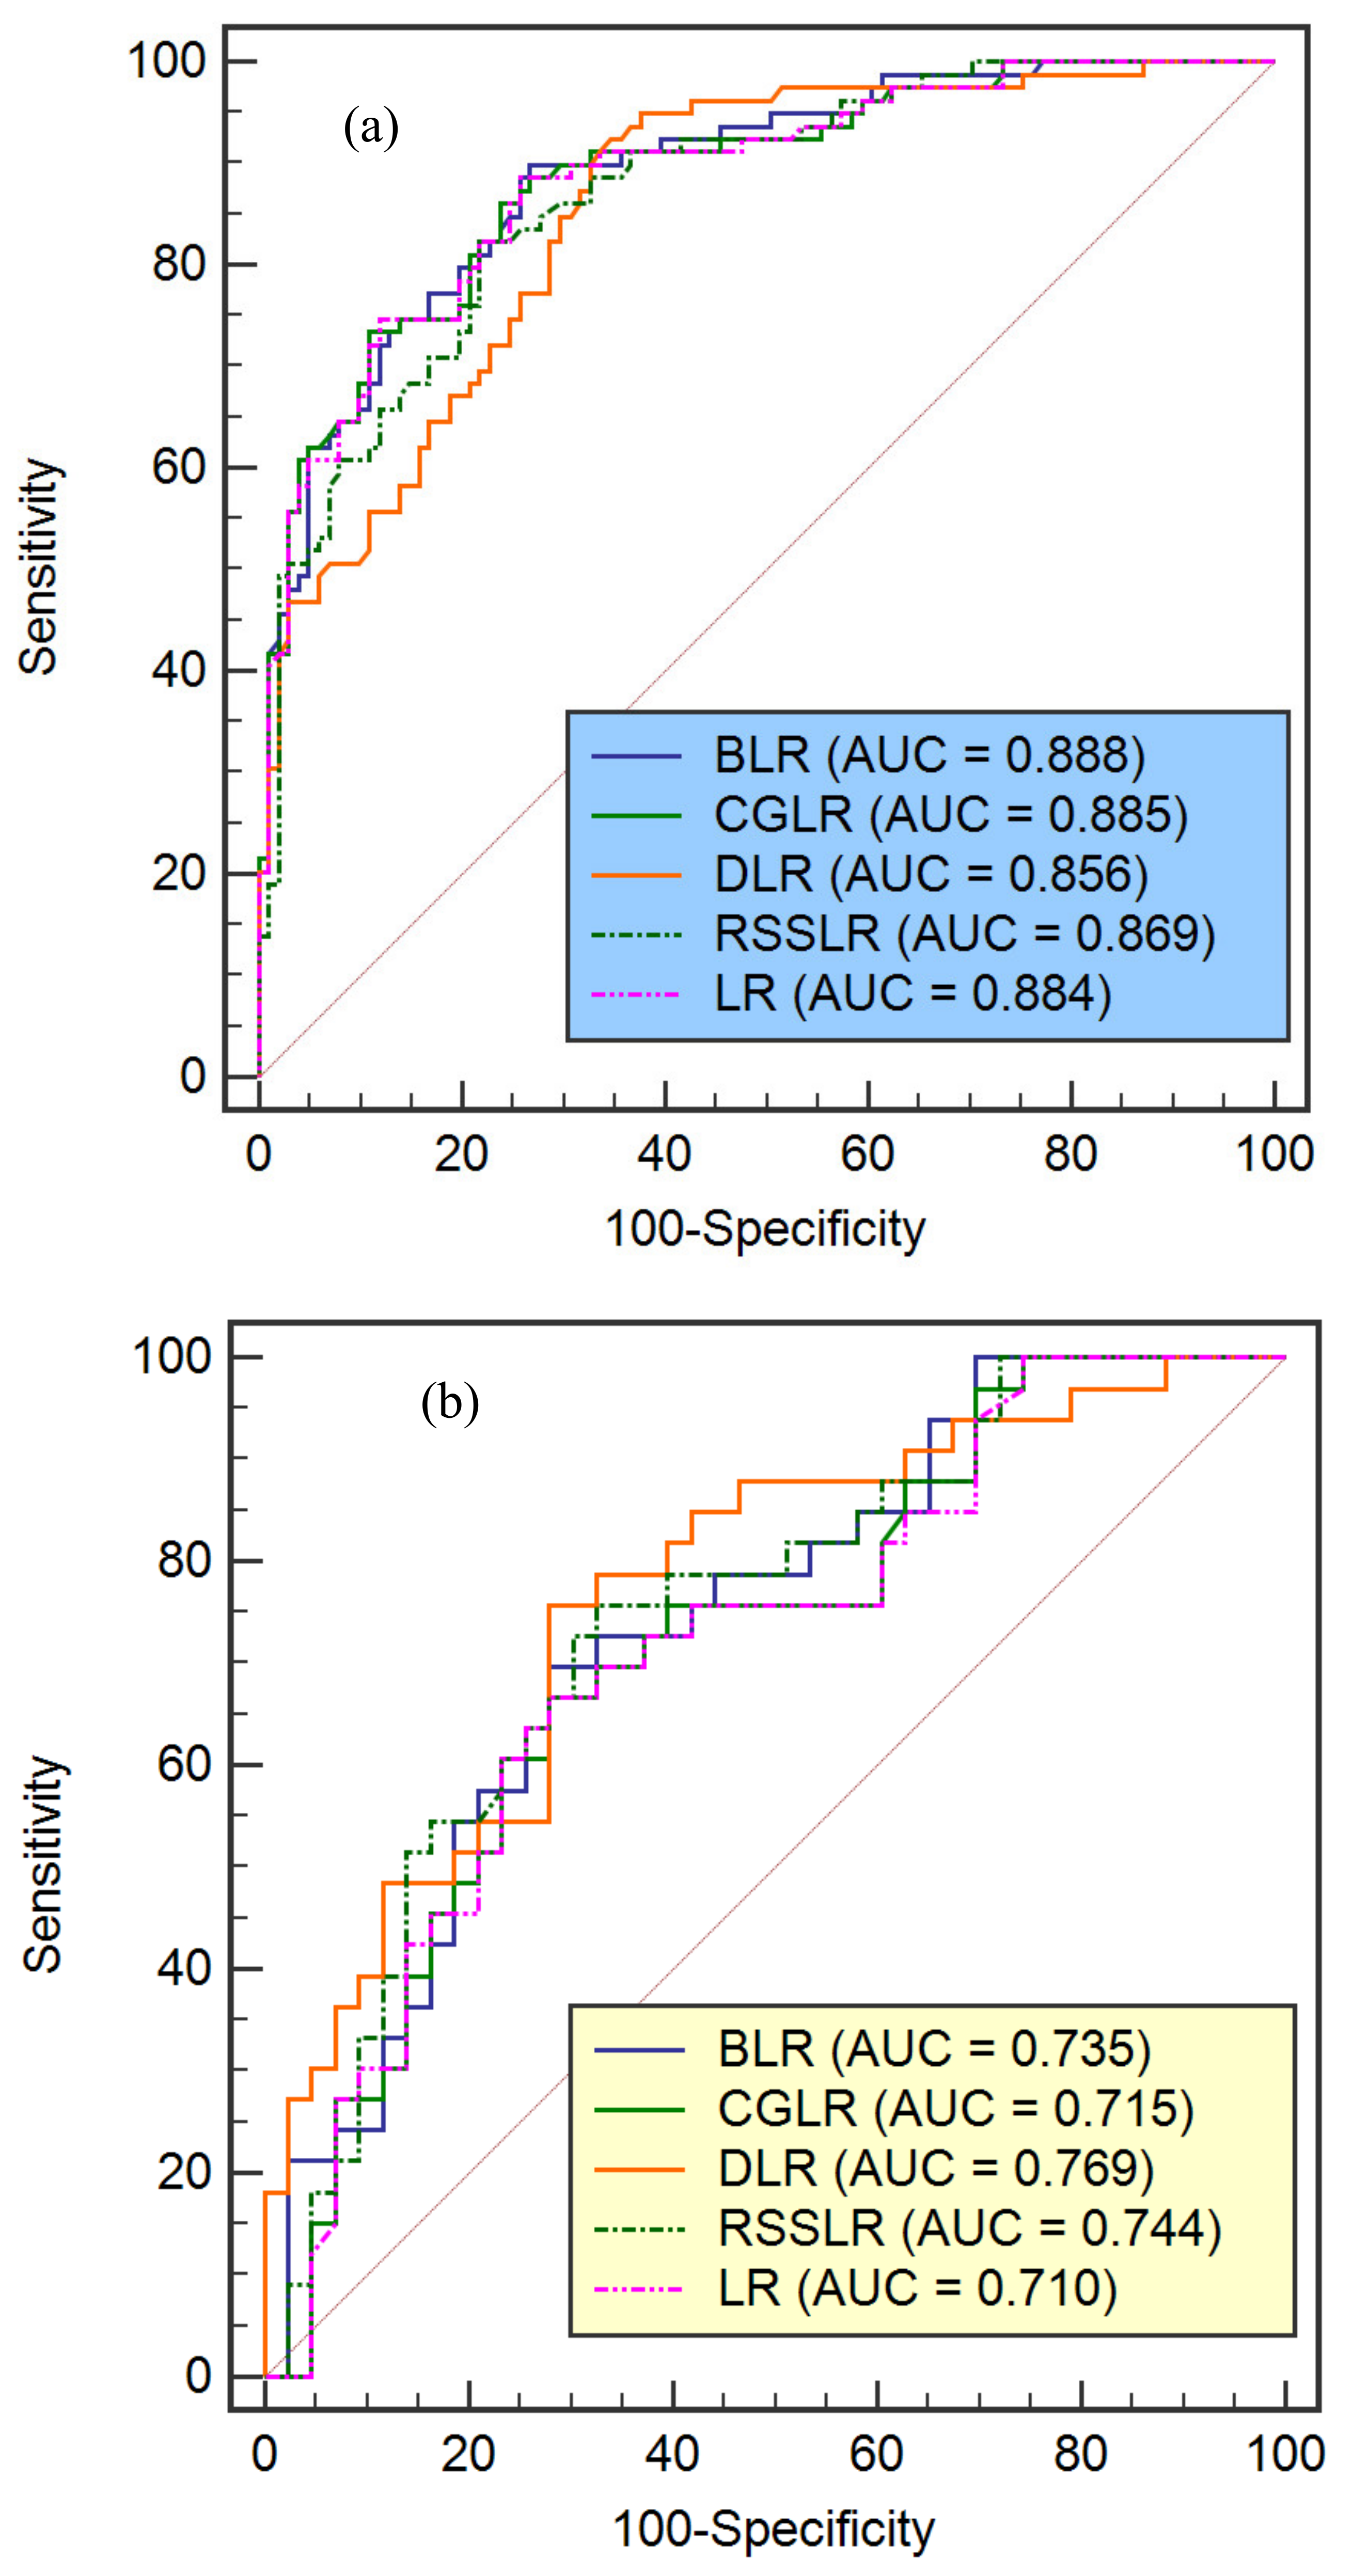
5.2. Model Validation and Comparision
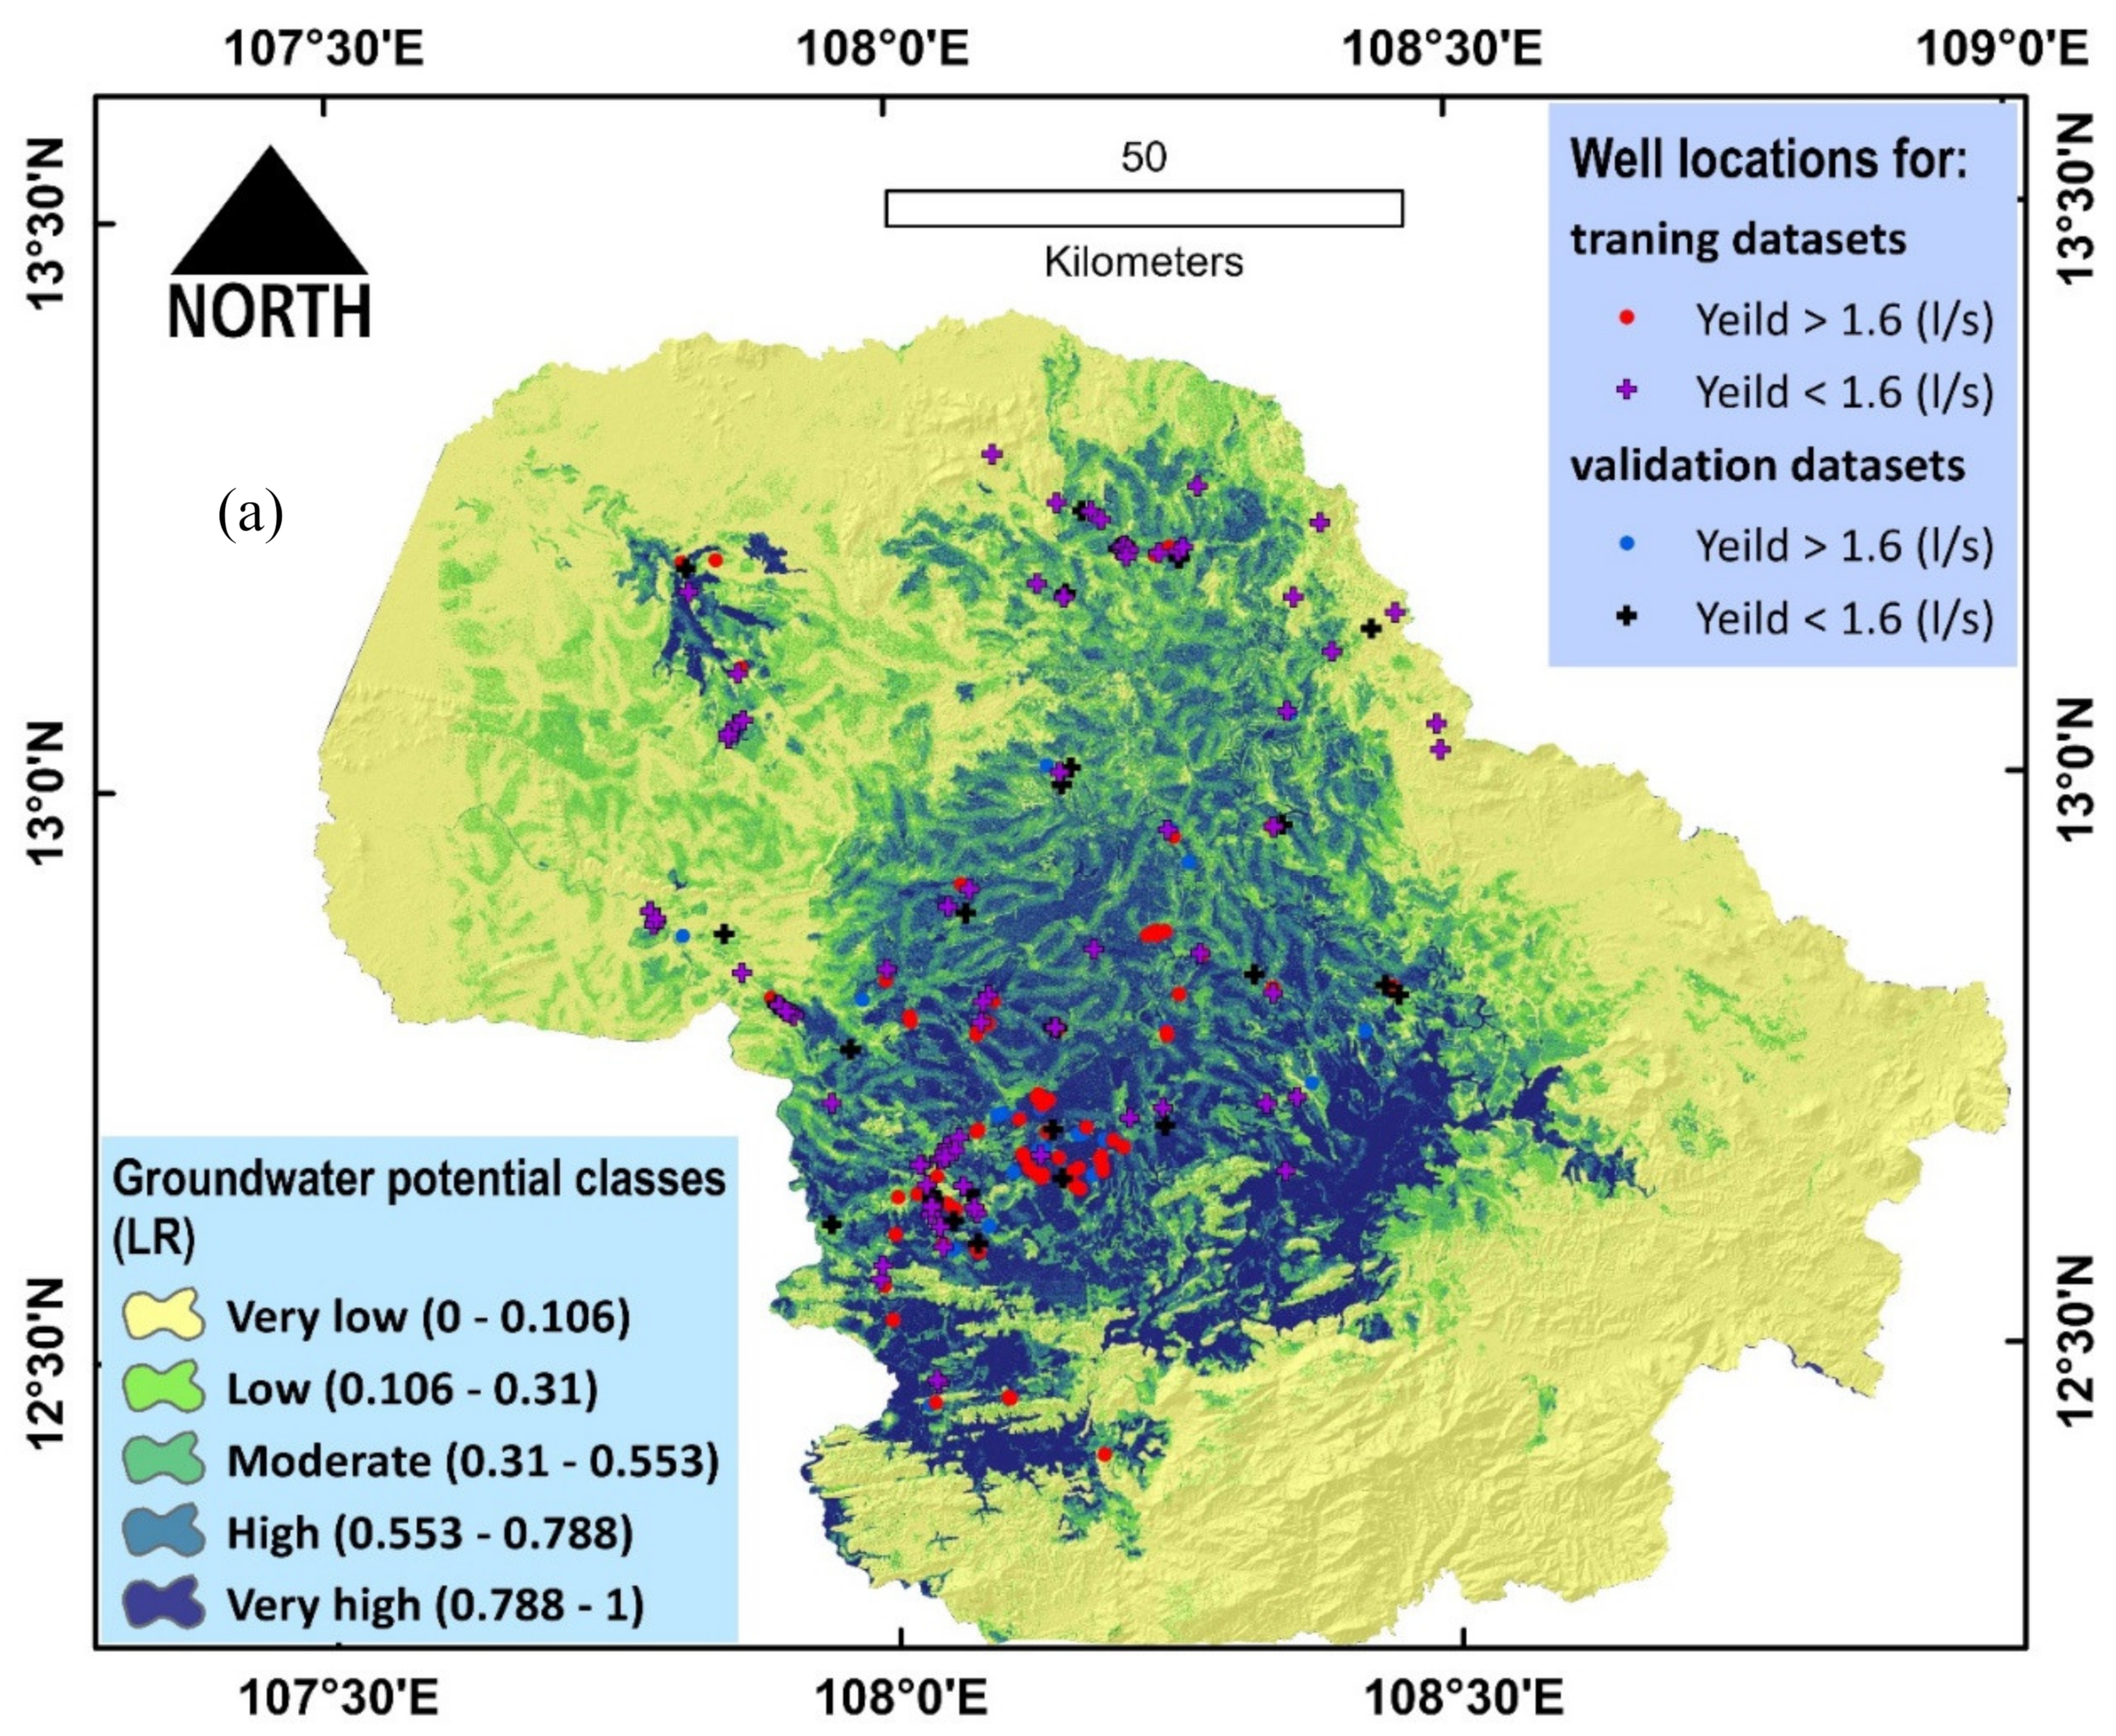
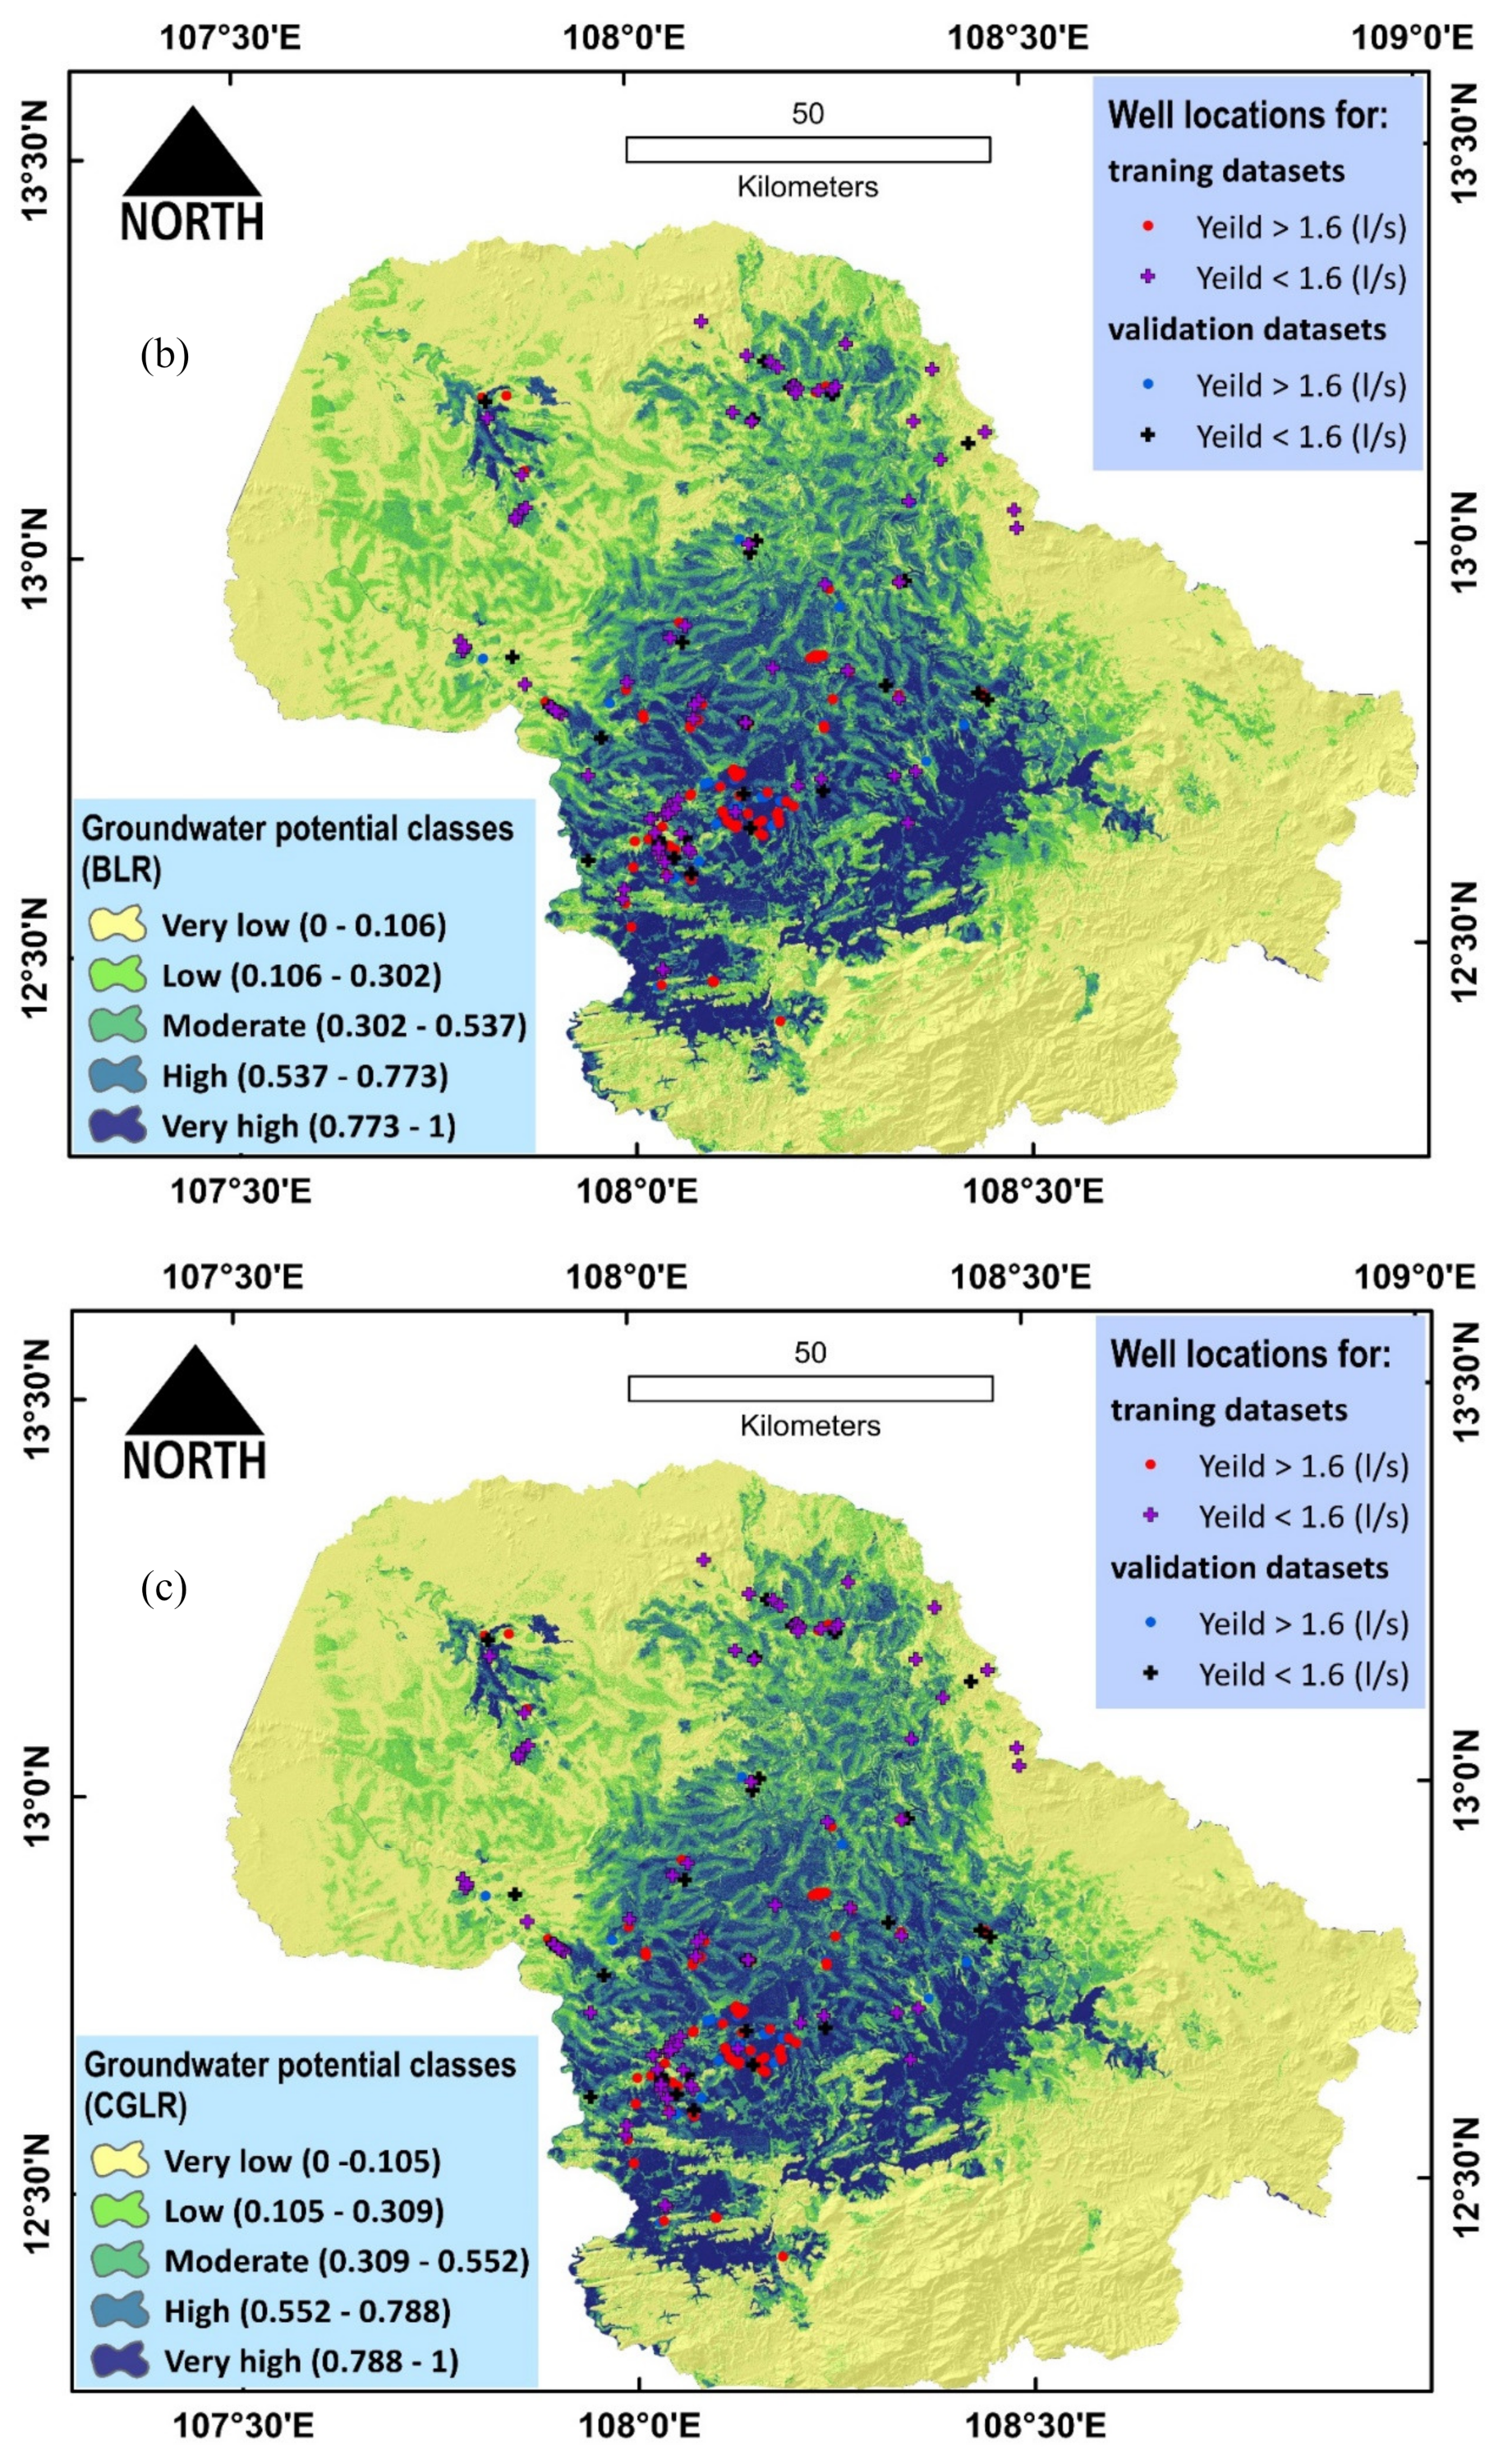
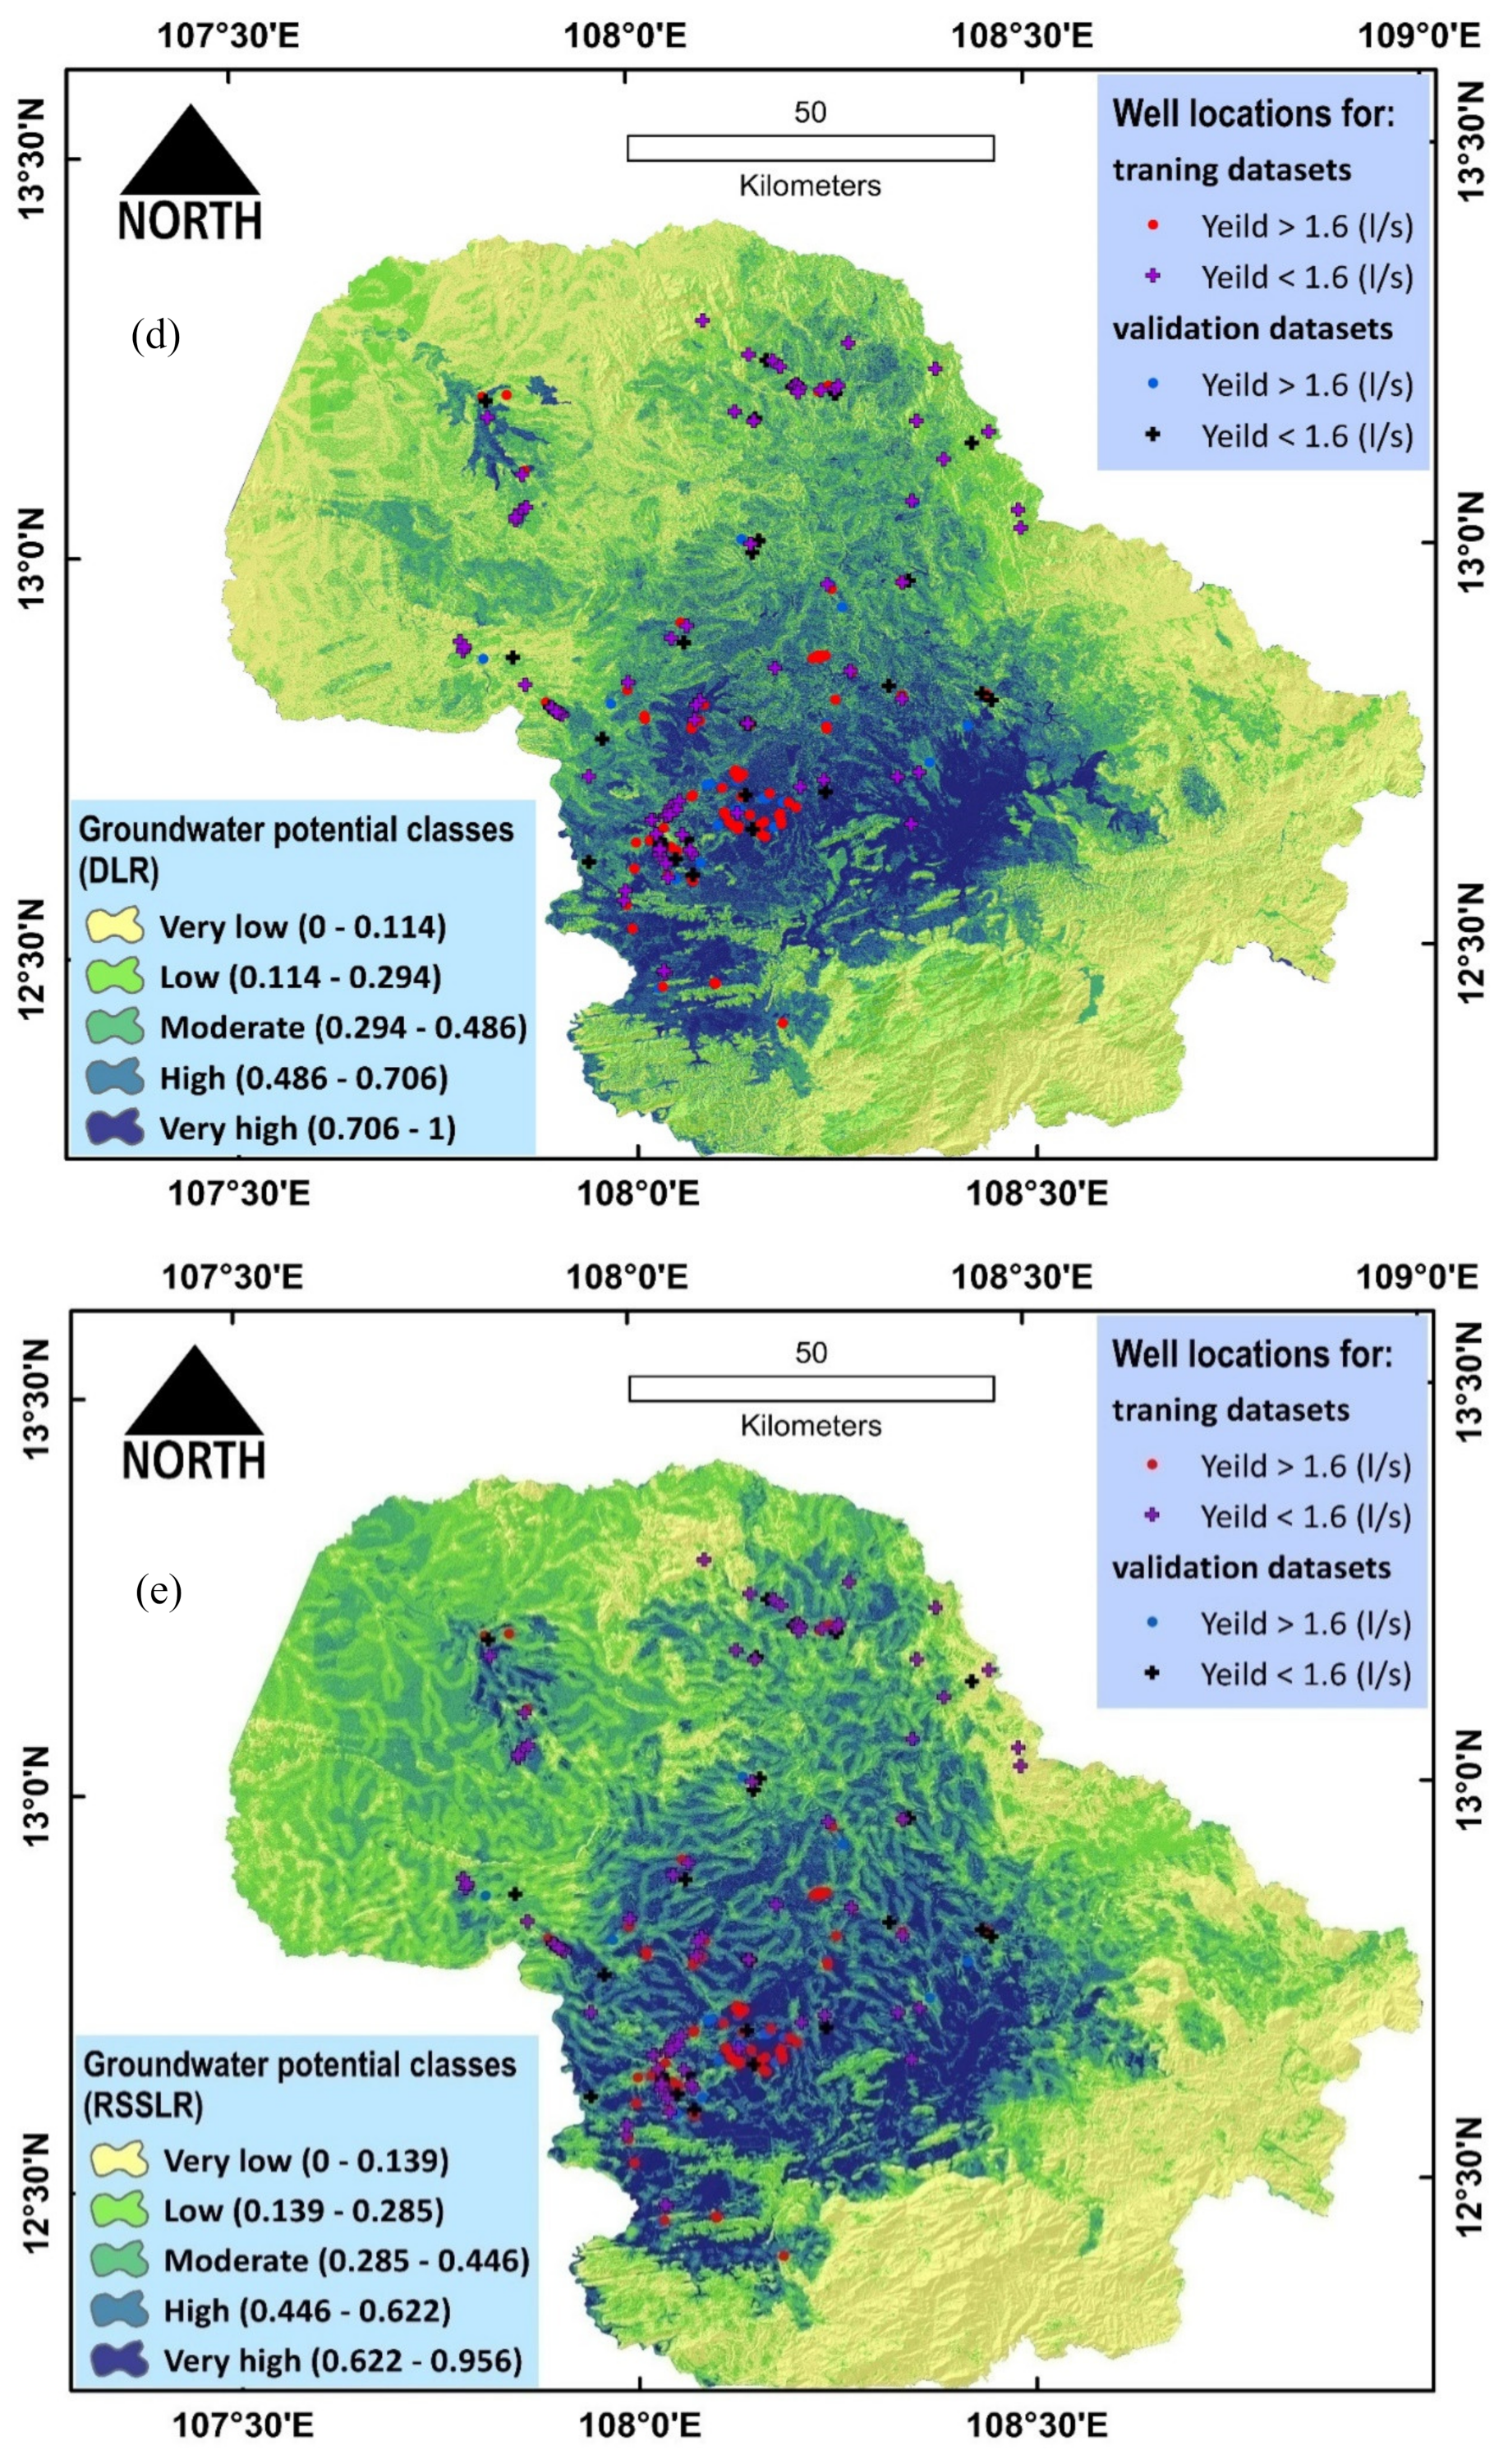
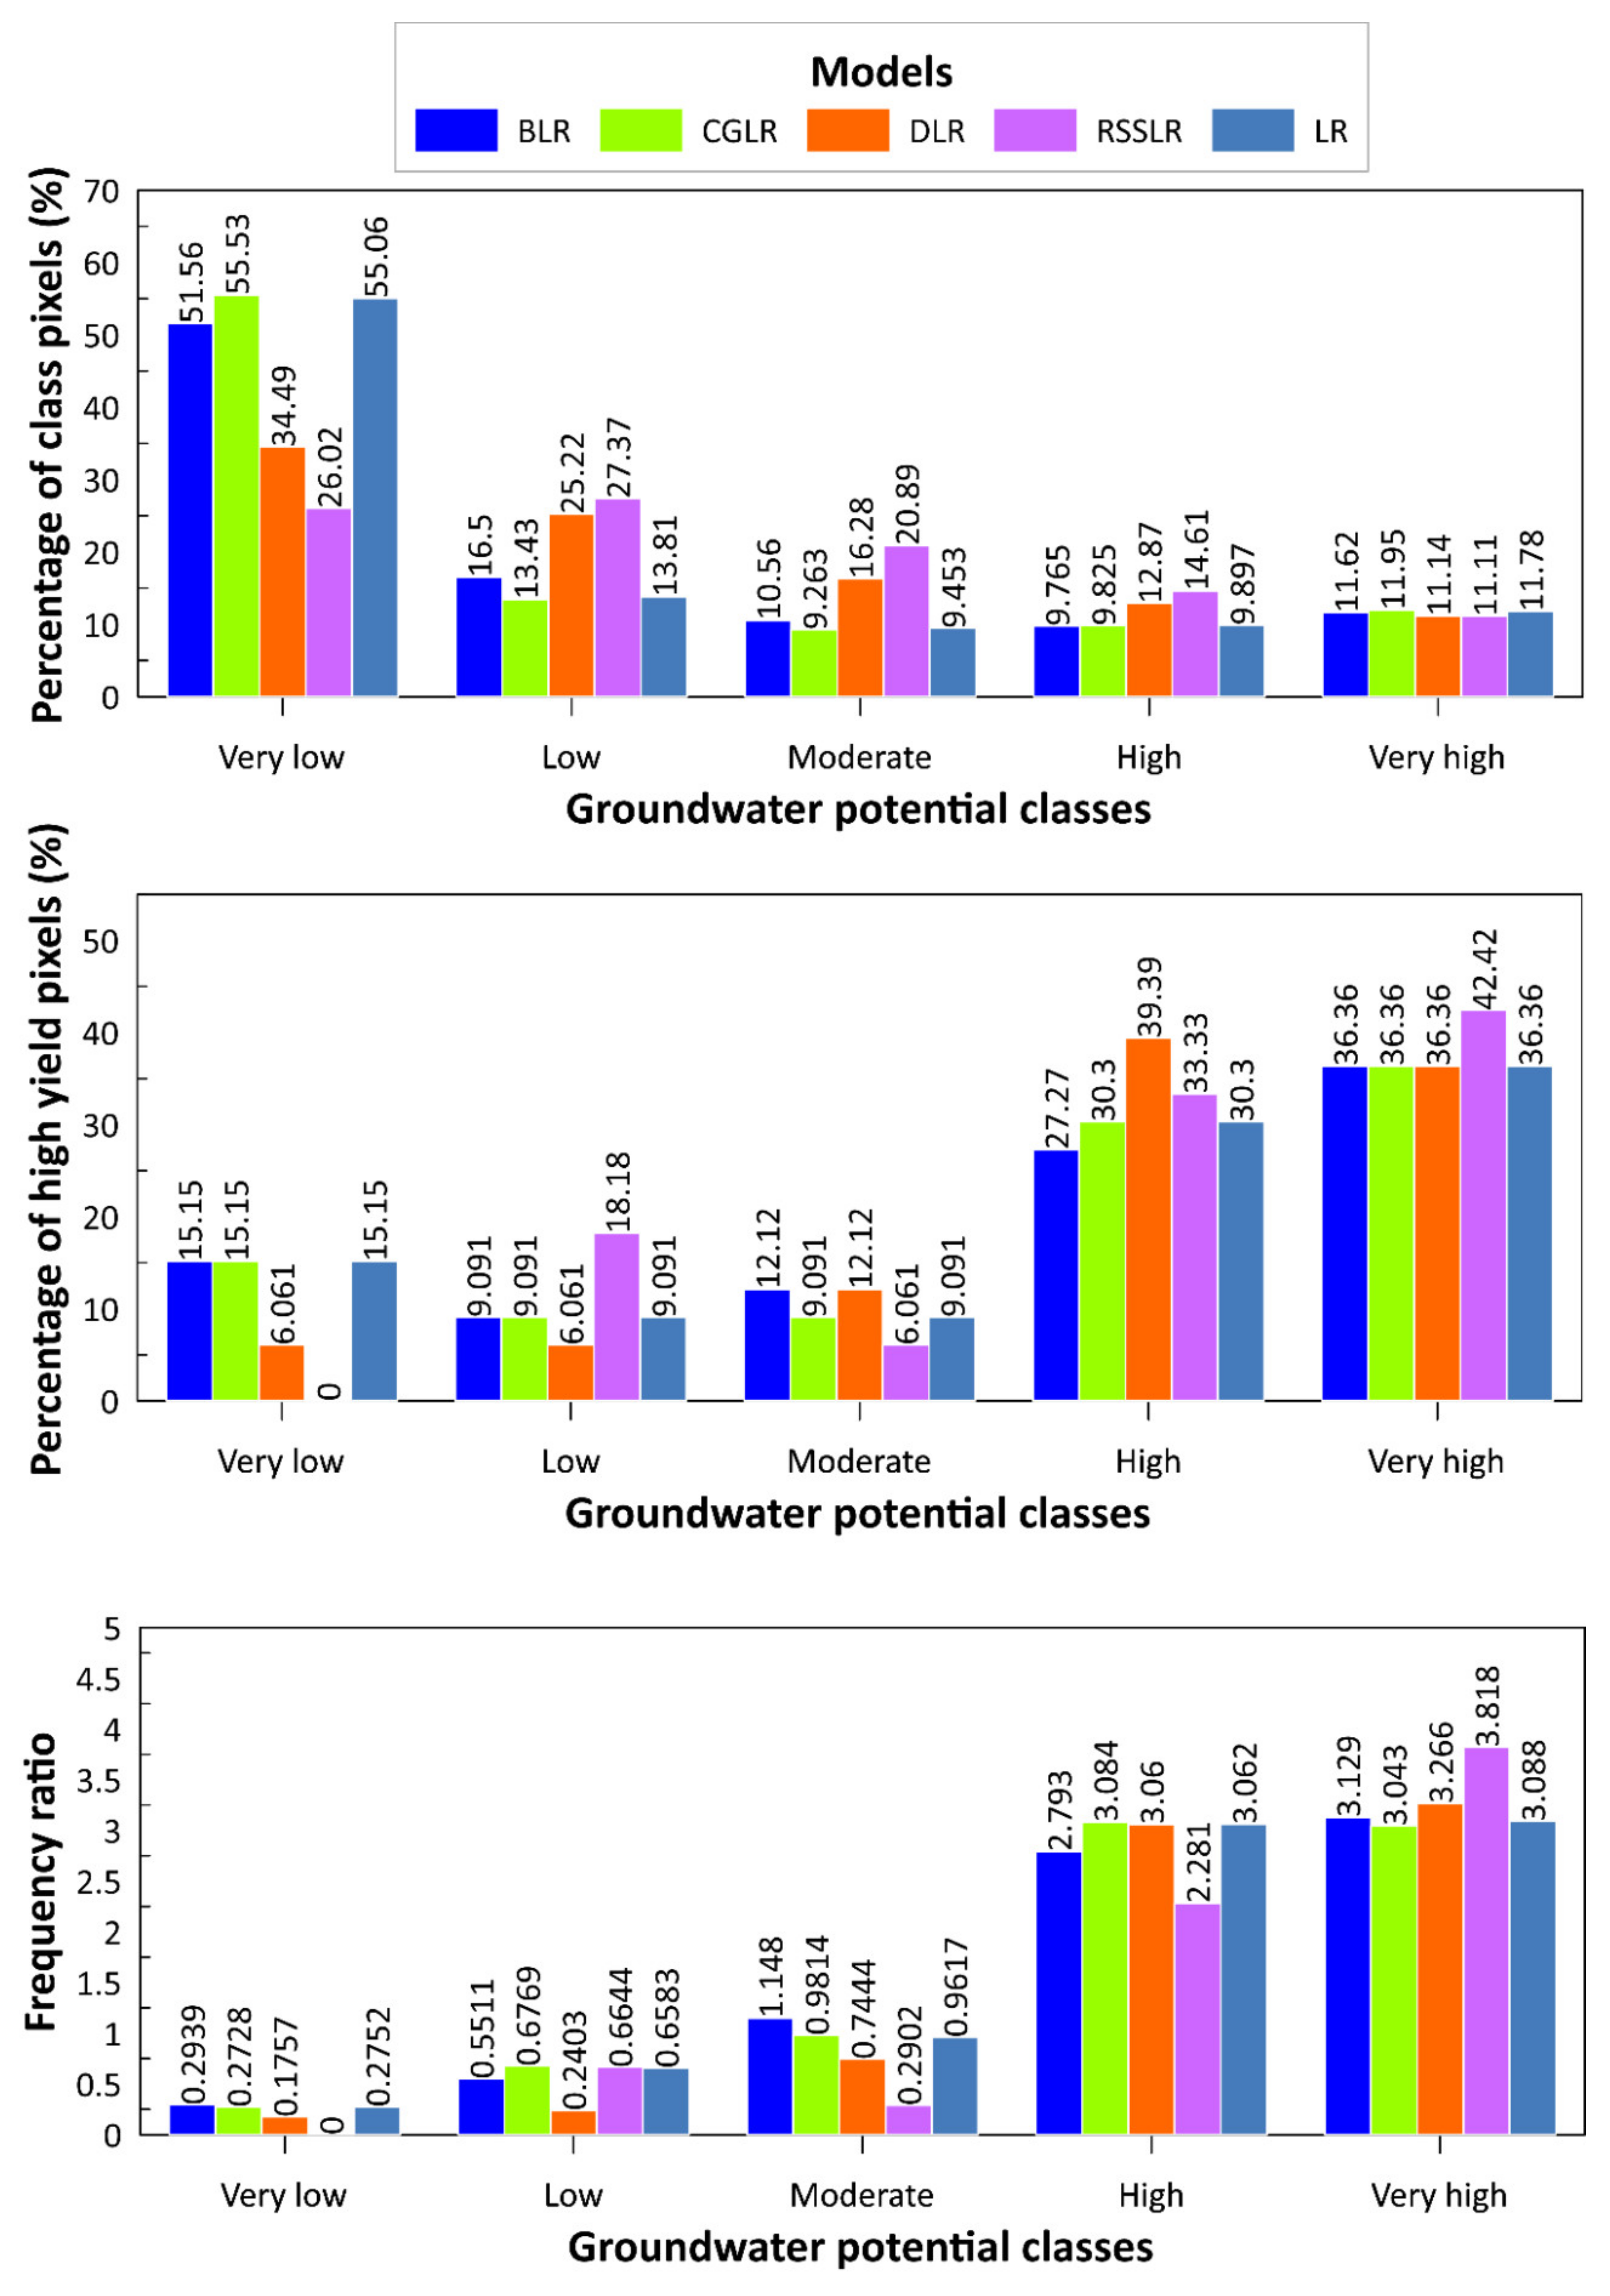
5.3. Groundwater Potential Maps
6. Discussion
7. Concluding Remarks
Author Contributions
Funding
Acknowledgments
Conflicts of Interest
References
- Khosravi, K.; Sartaj, M.; Tsai, F.T.-C.; Singh, V.P.; Kazakis, N.; Melesse, A.M.; Prakash, I.; Bui, D.T.; Pham, B.T. A comparison study of DRASTIC methods with various objective methods for groundwater vulnerability assessment. Sci. Total Environ. 2018, 642, 1032–1049. [Google Scholar] [CrossRef] [PubMed]
- Nobre, R.; Rotunno Filho, O.; Mansur, W.; Nobre, M.; Cosenza, C. Groundwater vulnerability and risk mapping using GIS, modeling and a fuzzy logic tool. J. Contam. Hydrol. 2007, 94, 277–292. [Google Scholar] [CrossRef] [PubMed]
- Mafi-Gholami, D.; Zenner, E.K.; Jaafari, A. Mangrove regional feedback to sea level rise and drought intensity at the end of the 21st century. Ecol. Indic. 2020, 110, 105972. [Google Scholar] [CrossRef]
- Mafi-Gholami, D.; Zenner, E.K.; Jaafari, A.; Ward, R.D. Modeling multi-decadal mangrove leaf area index in response to drought along the semi-arid southern coasts of Iran. Sci. Total Environ. 2019, 656, 1326–1336. [Google Scholar] [CrossRef]
- Mafi-Gholami, D.; Zenner, E.K.; Jaafari, A.; Bakhtiari, H.R.; Tien Bui, D. Multi-hazards vulnerability assessment of southern coasts of Iran. J. Environ. Manag. 2019, 252, 109628. [Google Scholar] [CrossRef]
- Mafi-Gholami, D.; Zenner, E.K.; Jaafari, A.; Bui, D.T. Spatially explicit predictions of changes in the extent of mangroves of Iran at the end of the 21st century. Estuar. Coast. Shelf Sci. 2020, 237, 106644. [Google Scholar] [CrossRef]
- Choubin, B.; Rahmati, O.; Soleimani, F.; Alilou, H.; Moradi, E.; Alamdari, N. Regional groundwater potential analysis using classification and regression trees. In Spatial Modeling in GIS and R for Earth and Environmental Sciences; Elsevier: Amsterdam, The Netherlands, 2019; pp. 485–498. [Google Scholar]
- Rahmati, O.; Melesse, A.M. Application of Dempster–Shafer theory, spatial analysis and remote sensing for groundwater potentiality and nitrate pollution analysis in the semi-arid region of Khuzestan, Iran. Sci. Total Environ. 2016, 568, 1110–1123. [Google Scholar] [CrossRef]
- Rahmati, O.; Moghaddam, D.D.; Moosavi, V.; Kalantari, Z.; Samadi, M.; Lee, S.; Bui, D.T. An automated Python language-based tool for creating absence samples in groundwater potential mapping. Remote Sens. 2019, 11. [Google Scholar] [CrossRef] [Green Version]
- Moghaddam, D.D.; Rahmati, O.; Panahi, M.; Tiefenbacher, J.; Darabi, H.; Haghizadeh, A.; Haghighi, A.T.; Nalivan, O.A.; Tien Bui, D. The effect of sample size on different machine learning models for groundwater potential mapping in mountain bedrock aquifers. Catena 2020, 187, 104421. [Google Scholar] [CrossRef]
- Rahmati, O.; Naghibi, S.A.; Shahabi, H.; Bui, D.T.; Pradhan, B.; Azareh, A.; Rafiei-Sardooi, E.; Samani, A.N.; Melesse, A.M. Groundwater spring potential modelling: Comprising the capability and robustness of three different modeling approaches. J. Hydrol. 2018, 565, 248–261. [Google Scholar] [CrossRef]
- Rahmati, O.; Choubin, B.; Fathabadi, A.; Coulon, F.; Soltani, E.; Shahabi, H.; Mollaefar, E.; Tiefenbacher, J.; Cipullo, S.; Ahmad, B.B.; et al. Predicting uncertainty of machine learning models for modelling nitrate pollution of groundwater using quantile regression and UNEEC methods. Sci. Total Environ. 2019, 688, 855–866. [Google Scholar] [CrossRef] [PubMed]
- Berhanu, K.G.; Hatiye, S.D. Identification of Groundwater Potential Zones Using Proxy Data: Case study of Megech Watershed, Ethiopia. J. Hydrol. Reg. Stud. 2020, 28, 100676. [Google Scholar] [CrossRef]
- Naghibi, S.A.; Dolatkordestani, M.; Rezaei, A.; Amouzegari, P.; Heravi, M.T.; Kalantar, B.; Pradhan, B. Application of rotation forest with decision trees as base classifier and a novel ensemble model in spatial modeling of groundwater potential. Environ. Monit. Assess. 2019, 191. [Google Scholar] [CrossRef] [PubMed]
- Golkarian, A.; Naghibi, S.A.; Kalantar, B.; Pradhan, B. Groundwater potential mapping using C5.0, random forest, and multivariate adaptive regression spline models in GIS. Environ. Monit. Assess. 2018, 190. [Google Scholar] [CrossRef]
- Naghibi, S.A.; Pourghasemi, H.R.; Dixon, B. GIS-based groundwater potential mapping using boosted regression tree, classification and regression tree, and random forest machine learning models in Iran. Environ. Monit. Assess. 2016, 188, 44. [Google Scholar] [CrossRef]
- Mousavi, S.M.; Golkarian, A.; Naghibi, S.A.; Kalantar, B.; Pradhan, B. GIS-based groundwater spring potential mapping using data mining boosted regression tree and probabilistic frequency ratio models in Iran. AIMS Geosci. 2017, 3, 91–115. [Google Scholar]
- Rahmati, O.; Pourghasemi, H.R.; Melesse, A.M. Application of GIS-based data driven random forest and maximum entropy models for groundwater potential mapping: A case study at Mehran Region, Iran. Catena 2016, 137, 360–372. [Google Scholar] [CrossRef]
- Naghibi, S.A.; Ahmadi, K.; Daneshi, A. Application of Support Vector Machine, Random Forest, and Genetic Algorithm Optimized Random Forest Models in Groundwater Potential Mapping. Water Resour. Manag. 2017, 31, 2761–2775. [Google Scholar] [CrossRef]
- Lee, S.; Hong, S.-M.; Jung, H.-S. GIS-based groundwater potential mapping using artificial neural network and support vector machine models: The case of Boryeong city in Korea. Geocarto Int. 2018, 33, 847–861. [Google Scholar] [CrossRef]
- Park, S.; Hamm, S.-Y.; Jeon, H.-T.; Kim, J. Evaluation of logistic regression and multivariate adaptive regression spline models for groundwater potential mapping using R and GIS. Sustainability 2017, 9, 1157. [Google Scholar] [CrossRef] [Green Version]
- Golkarian, A.; Rahmati, O. Use of a maximum entropy model to identify the key factors that influence groundwater availability on the Gonabad Plain, Iran. Environ. Earth Sci. 2018, 77. [Google Scholar] [CrossRef]
- Chen, W.; Zhao, X.; Tsangaratos, P.; Shahabi, H.; Ilia, I.; Xue, W.; Wang, X.; Ahmad, B.B. Evaluating the usage of tree-based ensemble methods in groundwater spring potential mapping. J. Hydrol. 2020, 583, 124602. [Google Scholar] [CrossRef]
- Miraki, S.; Zanganeh, S.H.; Chapi, K.; Singh, V.P.; Shirzadi, A.; Shahabi, H.; Pham, B.T. Mapping groundwater potential using a novel hybrid intelligence approach. Water Resour. Manag. 2019, 33, 281–302. [Google Scholar] [CrossRef]
- Avand, M.; Janizadeh, S.; Tien Bui, D.; Pham, V.H.; Ngo, P.T.T.; Nhu, V.-H. A tree-based intelligence ensemble approach for spatial prediction of potential groundwater. Int. J. Digit. Earth 2020, 1–22. [Google Scholar] [CrossRef]
- Al-Fugara, A.K.; Ahmadlou, M.; Al-Shabeeb, A.R.; AlAyyash, S.; Al-Amoush, H.; Al-Adamat, R. Spatial mapping of groundwater springs potentiality using grid search-based and genetic algorithm-based support vector regression. Geocarto Int. 2020, 1–20. [Google Scholar] [CrossRef]
- Khosravi, K.; Panahi, M.; Tien Bui, D. Spatial prediction of groundwater spring potential mapping based on an adaptive neuro-fuzzy inference system and metaheuristic optimization. Hydrol. Earth Syst. Sci. 2018, 22, 4771–4792. [Google Scholar] [CrossRef] [Green Version]
- Banadkooki, F.B.; Ehteram, M.; Ahmed, A.N.; Teo, F.Y.; Fai, C.M.; Afan, H.A.; Sapitang, M.; El-Shafie, A. Enhancement of Groundwater-Level Prediction Using an Integrated Machine Learning Model Optimized by Whale Algorithm. Nat. Resour. Res. 2020, 1–20. [Google Scholar] [CrossRef]
- Arabameri, A.; Lee, S.; Tiefenbacher, J.P.; Ngo, P.T.T. Novel Ensemble of MCDM-Artificial Intelligence Techniques for Groundwater-Potential Mapping in Arid and Semi-Arid Regions (Iran). Remote Sens. 2020, 12, 490. [Google Scholar] [CrossRef] [Green Version]
- Guns, M.; Vanacker, V.; Glade, T. Logistic regression applied to natural hazards: Rare event logistic regression with replications. Nat. Hazards Earth Syst. Sci 2012, 12, 1937–1947. [Google Scholar] [CrossRef]
- Bayat, M.; Ghorbanpour, M.; Zare, R.; Jaafari, A.; Thai Pham, B. Application of artificial neural networks for predicting tree survival and mortality in the Hyrcanian forest of Iran. Comput. Electron. Agric. 2019, 164. [Google Scholar] [CrossRef]
- Hong, H.; Jaafari, A.; Zenner, E.K. Predicting spatial patterns of wildfire susceptibility in the Huichang County, China: An integrated model to analysis of landscape indicators. Ecol. Indic. 2019, 101, 878–891. [Google Scholar] [CrossRef]
- Jaafari, A.; Mafi-Gholami, D.; Pham, B.T.; Tien Bui, D. Wildfire probability mapping: Bivariate vs. multivariate statistics. Remote Sens. 2019, 11, 618. [Google Scholar] [CrossRef] [Green Version]
- Breiman, L. Bagging predictors. Mach. Learn. 1996, 24, 123–140. [Google Scholar] [CrossRef] [Green Version]
- Quinlan, J.R. Bagging, Boosting, and C4.5. 1996. Available online: http://www.cs.ecu.edu/~dingq/CSCI6905/readings/BaggingBoosting.pdf (accessed on 3 April 2020).
- Nhu, V.-H.; Janizadeh, S.; Avand, M.; Chen, W.; Farzin, M.; Omidvar, E.; Shirzadi, A.; Shahabi, H.; Clague, J.J.; Jaafari, A.; et al. GIS-Based Gully Erosion Susceptibility Mapping: A Comparison of Computational Ensemble Data Mining Models. Appl. Sci. 2020, 10, 2039. [Google Scholar] [CrossRef] [Green Version]
- Pham, B.T.; Jaafari, A.; Prakash, I.; Singh, S.K.; Quoc, N.K.; Bui, D.T. Hybrid computational intelligence models for groundwater potential mapping. Catena 2019, 182. [Google Scholar] [CrossRef]
- Bühlmann, P. Bagging, boosting and ensemble methods. In Handbook of Computational Statistics; Springer: Berlin/Heidelberg, Germany, 2012; pp. 985–1022. [Google Scholar]
- Ting, K.M.; Witten, I.H. Stacking Bagged and Dagged Models; University of Waikato, Department of Computer Science: Hamilton, New Zealand, 1997. [Google Scholar]
- Gama, J.; Brazdil, P. Cascade generalization. Mach. Learn. 2000, 41, 315–343. [Google Scholar] [CrossRef]
- Ho, T.K. The random subspace method for constructing decision forests. IEEE Trans. Pattern Anal. Mach. Intell. 1998, 20, 832–844. [Google Scholar]
- Skurichina, M.; Duin, R.P. Bagging, boosting and the random subspace method for linear classifiers. Pattern Anal. Appl. 2002, 5, 121–135. [Google Scholar] [CrossRef]
- Kuncheva, L.I.; Rodríguez, J.J.; Plumpton, C.O.; Linden, D.E.; Johnston, S.J. Random subspace ensembles for fMRI classification. IEEE Trans. Med Imaging 2010, 29, 531–542. [Google Scholar] [CrossRef]
- Wang, G.; Ma, J. Study of corporate credit risk prediction based on integrating boosting and random subspace. Expert Syst. Appl. 2011, 38, 13871–13878. [Google Scholar] [CrossRef]
- Bertoni, A.; Folgieri, R.; Valentini, G. Bio-molecular cancer prediction with random subspace ensembles of support vector machines. Neurocomputing 2005, 63, 535–539. [Google Scholar] [CrossRef] [Green Version]
- Jaafari, A.; Zenner, E.K.; Pham, B.T. Wildfire spatial pattern analysis in the Zagros Mountains, Iran: A comparative study of decision tree based classifiers. Ecol. Inform. 2018, 43, 200–211. [Google Scholar] [CrossRef]
- Pham, B.T.; Tien Bui, D.; Indra, P.; Dholakia, M. Landslide susceptibility assessment at a part of Uttarakhand Himalaya, India using GIS–based statistical approach of frequency ratio method. Int. J. Eng. Res. Technol. 2015, 4, 338–344. [Google Scholar]
- Pham, B.T.; Bui, D.T.; Pham, H.V.; Le, H.Q.; Prakash, I.; Dholakia, M. Landslide hazard assessment using random subspace fuzzy rules based classifier ensemble and probability analysis of rainfall data: A case study at Mu Cang Chai District, Yen Bai Province (Viet Nam). J. Indian Soc. Remote Sens. 2017, 45, 673–683. [Google Scholar] [CrossRef]
- Pham, B.T.; Prakash, I.; Jaafari, A.; Bui, D.T. Spatial prediction of rainfall-induced landslides using aggregating one-dependence estimators classifier. J. Indian Soc. Remote Sens. 2018, 46, 1457–1470. [Google Scholar] [CrossRef]
- Nguyen, P.T.; Ha, D.H.; Nguyen, H.D.; Van Phong, T.; Trinh, P.T.; Al-Ansari, N.; Le, H.V.; Pham, B.T.; Ho, L.S.; Prakash, I. Improvement of Credal Decision Trees Using Ensemble Frameworks for Groundwater Potential Modeling. Sustainability 2020, 12, 2622. [Google Scholar] [CrossRef] [Green Version]
- Pham, B.T.; Prakash, I.; Khosravi, K.; Chapi, K.; Trinh, P.T.; Ngo, T.Q.; Hosseini, S.V.; Bui, D.T. A comparison of Support Vector Machines and Bayesian algorithms for landslide susceptibility modelling. Geocarto Int. 2019, 34, 1385–1407. [Google Scholar] [CrossRef]
- Pham, B.T.; Khosravi, K.; Prakash, I. Application and comparison of decision tree-based machine learning methods in landside susceptibility assessment at Pauri Garhwal Area, Uttarakhand, India. Environ. Process. 2017, 4, 711–730. [Google Scholar] [CrossRef]
- Pham, B.T.; Prakash, I.; Dou, J.; Singh, S.K.; Trinh, P.T.; Tran, H.T.; Le, T.M.; Van Phong, T.; Khoi, D.K.; Shirzadi, A. A novel hybrid approach of landslide susceptibility modelling using rotation forest ensemble and different base classifiers. Geocarto Int. 2019, 1–25. [Google Scholar] [CrossRef]
- Nguyen, V.V.; Pham, B.T.; Vu, B.T.; Prakash, I.; Jha, S.; Shahabi, H.; Shirzadi, A.; Ba, D.N.; Kumar, R.; Chatterjee, J.M. Hybrid machine learning approaches for landslide susceptibility modeling. Forests 2019, 10, 157. [Google Scholar] [CrossRef] [Green Version]
- Bui, D.T.; Tsangaratos, P.; Ngo, P.-T.T.; Pham, T.D.; Pham, B.T. Flash flood susceptibility modeling using an optimized fuzzy rule based feature selection technique and tree based ensemble methods. Sci. Total Environ. 2019, 668, 1038–1054. [Google Scholar] [CrossRef] [PubMed]
- Pham, B.T. A novel classifier based on composite hyper-cubes on iterated random projections for assessment of landslide susceptibility. J. Geol. Soc. India 2018, 91, 355–362. [Google Scholar] [CrossRef]
- Thai Pham, B.; Tien Bui, D.; Prakash, I. Landslide susceptibility modelling using different advanced decision trees methods. Civ. Eng. Environ. Syst. 2018, 35, 139–157. [Google Scholar] [CrossRef]
- Pham, B.T.; Prakash, I. Machine learning methods of kernel logistic regression and classification and regression trees for landslide susceptibility assessment at part of Himalayan area, India. Indian J. Sci. Technol. 2018, 11, 1–11. [Google Scholar] [CrossRef] [Green Version]
- Nguyen, P.T.; Tuyen, T.T.; Shirzadi, A.; Pham, B.T.; Shahabi, H.; Omidvar, E.; Amini, A.; Entezami, H.; Prakash, I.; Phong, T.V. Development of a novel hybrid intelligence approach for landslide spatial prediction. Appl. Sci. 2019, 9, 2824. [Google Scholar] [CrossRef] [Green Version]
- Thai Pham, B.; Shirzadi, A.; Shahabi, H.; Omidvar, E.; Singh, S.K.; Sahana, M.; Talebpour Asl, D.; Bin Ahmad, B.; Kim Quoc, N.; Lee, S. Landslide susceptibility assessment by novel hybrid machine learning algorithms. Sustainability 2019, 11, 4386. [Google Scholar] [CrossRef] [Green Version]
- Pham, B.T.; Prakash, I. Evaluation and comparison of LogitBoost Ensemble, Fisher’s Linear Discriminant Analysis, logistic regression and support vector machines methods for landslide susceptibility mapping. Geocarto Int. 2019, 34, 316–333. [Google Scholar] [CrossRef]
- Dou, J.; Yunus, A.P.; Bui, D.T.; Merghadi, A.; Sahana, M.; Zhu, Z.; Chen, C.-W.; Han, Z.; Pham, B.T. Improved landslide assessment using support vector machine with bagging, boosting, and stacking ensemble machine learning framework in a mountainous watershed, Japan. Landslides 2019, 1–18. [Google Scholar] [CrossRef]
- Pham, B.T.; Bui, D.T.; Prakash, I. Application of classification and regression trees for spatial prediction of rainfall-induced shallow landslides in the Uttarakhand area (India) using GIS. In Climate Change, Extreme Events and Disaster Risk Reduction; Springer: Berlin/Heidelberg, Germany, 2018; pp. 159–170. [Google Scholar]
- Nguyen, V.-T.; Tran, T.H.; Ha, N.A.; Ngo, V.L.; Nadhir, A.-A.; Tran, V.P.; Duy Nguyen, H.; MA, M.; Amini, A.; Prakash, I. GIS Based Novel Hybrid Computational Intelligence Models for Mapping Landslide Susceptibility: A Case Study at Da Lat City, Vietnam. Sustainability 2019, 11, 7118. [Google Scholar] [CrossRef] [Green Version]
- Pham, B.T.; Prakash, I.; Chen, W.; Ly, H.-B.; Ho, L.S.; Omidvar, E.; Tran, V.P.; Bui, D.T. A Novel Intelligence Approach of a Sequential Minimal Optimization-Based Support Vector Machine for Landslide Susceptibility Mapping. Sustainability 2019, 11, 6323. [Google Scholar] [CrossRef] [Green Version]
- Abedini, M.; Ghasemian, B.; Shirzadi, A.; Shahabi, H.; Chapi, K.; Pham, B.T.; Bin Ahmad, B.; Tien Bui, D. A novel hybrid approach of bayesian logistic regression and its ensembles for landslide susceptibility assessment. Geocarto Int. 2019, 34, 1427–1457. [Google Scholar] [CrossRef]
- Thanh, D.Q.; Nguyen, D.H.; Prakash, I.; Jaafari, A.; Nguyen, V.-T.; Van Phong, T.; Pham, B.T. GIS based frequency ratio method for landslide susceptibility mapping at Da Lat City, Lam Dong province, Vietnam. Vietnam J. Earth Sci. 2020, 42, 55–66. [Google Scholar] [CrossRef] [Green Version]
- Dao, D.V.; Jaafari, A.; Bayat, M.; Mafi-Gholami, D.; Qi, C.; Moayedi, H.; Phong, T.V.; Ly, H.-B.; Le, T.-T.; Trinh, P.T.; et al. A spatially explicit deep learning neural network model for the prediction of landslide susceptibility. Catena 2020, 188, 104451. [Google Scholar] [CrossRef]
- Moayedi, H.; Tien Bui, D.; Gör, M.; Pradhan, B.; Jaafari, A. The feasibility of three prediction techniques of the artificial neural network, adaptive neuro-fuzzy inference system, and hybrid particle swarm optimization for assessing the safety factor of cohesive slopes. ISPRS Int. J. Geo-Inf. 2019, 8, 391. [Google Scholar] [CrossRef] [Green Version]
- Janizadeh, S.; Avand, M.; Jaafari, A.; Phong, T.V.; Bayat, M.; Ahmadisharaf, E.; Prakash, I.; Pham, B.T.; Lee, S. Prediction Success of Machine Learning Methods for Flash Flood Susceptibility Mapping in the Tafresh Watershed, Iran. Sustainability 2019, 11, 5426. [Google Scholar] [CrossRef] [Green Version]
- Jaafari, A. LiDAR-supported prediction of slope failures using an integrated ensemble weights-of-evidence and analytical hierarchy process. Environ. Earth Sci. 2018, 77. [Google Scholar] [CrossRef]
- Pham, B.T.; Phong, T.V.; Nguyen-Thoi, T.; Parial, K.K.; Singh, S.; Ly, H.-B.; Nguyen, K.T.; Ho, L.S.; Le, H.V.; Prakash, I. Ensemble modeling of landslide susceptibility using random subspace learner and different decision tree classifiers. Geocarto Int. 2020, 1–23. [Google Scholar] [CrossRef]
- Pham, B.T.; Jaafari, A.; Prakash, I.; Bui, D.T. A novel hybrid intelligent model of support vector machines and the MultiBoost ensemble for landslide susceptibility modeling. Bull. Eng. Geol. Environ. 2019, 78, 2865–2886. [Google Scholar] [CrossRef]
- Ly, H.-B.; Le, L.M.; Phi, L.V.; Phan, V.-H.; Tran, V.Q.; Pham, B.T.; Le, T.-T.; Derrible, S. Development of an AI model to measure traffic air pollution from multisensor and weather data. Sensors 2019, 19, 4941. [Google Scholar] [CrossRef] [Green Version]
- Phong, T.V.; Phan, T.T.; Prakash, I.; Singh, S.K.; Shirzadi, A.; Chapi, K.; Ly, H.-B.; Ho, L.S.; Quoc, N.K.; Pham, B.T. Landslide susceptibility modeling using different artificial intelligence methods: A case study at Muong Lay district, Vietnam. Geocarto Int. 2019, 1–24. [Google Scholar] [CrossRef]
- Pham, B.T.; Phong, T.V.; Nguyen, H.D.; Qi, C.; Al-Ansari, N.; Amini, A.; Ho, L.S.; Tuyen, T.T.; Yen, H.P.H.; Ly, H.-B. A Comparative Study of Kernel Logistic Regression, Radial Basis Function Classifier, Multinomial Naïve Bayes, and Logistic Model Tree for Flash Flood Susceptibility Mapping. Water 2020, 12, 239. [Google Scholar] [CrossRef] [Green Version]
- Pham, B.T.; Bui, D.T.; Prakash, I.; Nguyen, L.H.; Dholakia, M. A comparative study of sequential minimal optimization-based support vector machines, vote feature intervals, and logistic regression in landslide susceptibility assessment using GIS. Environ. Earth Sci. 2017, 76, 371. [Google Scholar] [CrossRef]
- Pham, B.T.; Nguyen, M.D.; Bui, K.-T.T.; Prakash, I.; Chapi, K.; Bui, D.T. A novel artificial intelligence approach based on Multi-layer Perceptron Neural Network and Biogeography-based Optimization for predicting coefficient of consolidation of soil. Catena 2019, 173, 302–311. [Google Scholar] [CrossRef]
- Pham, B.T.; Nguyen, M.D.; Van Dao, D.; Prakash, I.; Ly, H.-B.; Le, T.-T.; Ho, L.S.; Nguyen, K.T.; Ngo, T.Q.; Hoang, V. Development of artificial intelligence models for the prediction of Compression Coefficient of soil: An application of Monte Carlo sensitivity analysis. Sci. Total Environ. 2019, 679, 172–184. [Google Scholar] [CrossRef]
- Pham, B.T.; Nguyen-Thoi, T.; Ly, H.-B.; Nguyen, M.D.; Al-Ansari, N.; Tran, V.-Q.; Le, T.-T. Extreme Learning Machine Based Prediction of Soil Shear Strength: A Sensitivity Analysis Using Monte Carlo Simulations and Feature Backward Elimination. Sustainability 2020, 12, 2339. [Google Scholar] [CrossRef] [Green Version]
- Pham, B.T.; Qi, C.; Ho, L.S.; Nguyen-Thoi, T.; Al-Ansari, N.; Nguyen, M.D.; Nguyen, H.D.; Ly, H.-B.; Le, H.V.; Prakash, I. A Novel Hybrid Soft Computing Model Using Random Forest and Particle Swarm Optimization for Estimation of Undrained Shear Strength of Soil. Sustainability 2020, 12, 2218. [Google Scholar] [CrossRef] [Green Version]
- Qi, C.; Ly, H.-B.; Chen, Q.; Le, T.-T.; Le, V.M.; Pham, B.T. Flocculation-dewatering prediction of fine mineral tailings using a hybrid machine learning approach. Chemosphere 2020, 244, 125450. [Google Scholar] [CrossRef]
- Vasu, N.N.; Lee, S.-R. A hybrid feature selection algorithm integrating an extreme learning machine for landslide susceptibility modeling of Mt. Woomyeon, South Korea. Geomorphology 2016, 263, 50–70. [Google Scholar] [CrossRef]
- Naghibi, S.A.; Moghaddam, D.D.; Kalantar, B.; Pradhan, B.; Kisi, O. A comparative assessment of GIS-based data mining models and a novel ensemble model in groundwater well potential mapping. J. Hydrol. 2017, 548, 471–483. [Google Scholar] [CrossRef]
- Kordestani, M.D.; Naghibi, S.A.; Hashemi, H.; Ahmadi, K.; Kalantar, B.; Pradhan, B. Groundwater potential mapping using a novel data-mining ensemble model. Hydrogeol. J. 2019, 27, 211–224. [Google Scholar] [CrossRef] [Green Version]
- Kalantar, B.; Al-Najjar, A.H.H.; Pradhan, B.; Saeidi, V.; Halin, A.A.; Ueda, N.; Naghibi, A.S. Optimized Conditioning Factors Using Machine Learning Techniques for Groundwater Potential Mapping. Water 2019, 11. [Google Scholar] [CrossRef] [Green Version]
- Jaafari, A.; Razavi Termeh, S.V.; Bui, D.T. Genetic and firefly metaheuristic algorithms for an optimized neuro-fuzzy prediction modeling of wildfire probability. J. Environ. Manag. 2019, 243, 358–369. [Google Scholar] [CrossRef]
- Bui, D.T.; Ngo, P.T.T.; Pham, T.D.; Jaafari, A.; Minh, N.Q.; Hoa, P.V.; Samui, P. A novel hybrid approach based on a swarm intelligence optimized extreme learning machine for flash flood susceptibility mapping. Catena 2019, 179, 184–196. [Google Scholar] [CrossRef]
- Tien Bui, D.; Moayedi, H.; Gör, M.; Jaafari, A.; Foong, L.K. Predicting slope stability failure through machine learning paradigms. ISPRS Int. J. Geo-Inf. 2019, 8, 395. [Google Scholar]
- Chen, W.; Hong, H.; Panahi, M.; Shahabi, H.; Wang, Y.; Shirzadi, A.; Pirasteh, S.; Alesheikh, A.A.; Khosravi, K.; Panahi, S.; et al. Spatial Prediction of Landslide Susceptibility Using GIS-Based Data Mining Techniques of ANFIS with Whale Optimization Algorithm (WOA) and Grey Wolf Optimizer (GWO). Appl. Sci. 2019, 9, 3755. [Google Scholar] [CrossRef] [Green Version]
- Jaafari, A.; Zenner, E.K.; Panahi, M.; Shahabi, H. Hybrid artificial intelligence models based on a neuro-fuzzy system and metaheuristic optimization algorithms for spatial prediction of wildfire probability. Agric. For. Meteorol. 2019, 266–267, 198–207. [Google Scholar] [CrossRef]
- Pham, B.T.; Prakash, I.; Singh, S.K.; Shirzadi, A.; Shahabi, H.; Tran, T.T.T.; Bui, D.T. Landslide susceptibility modeling using Reduced Error Pruning Trees and different ensemble techniques: Hybrid machine learning approaches. Catena 2019, 175, 203–218. [Google Scholar] [CrossRef]
- Pham, B.T.; Avand, M.; Janizadeh, S.; Phong, T.V.; Al-Ansari, N.; Ho, L.S.; Das, S.; Le, H.V.; Amini, A.; Bozchaloei, S.K. GIS Based Hybrid Computational Approaches for Flash Flood Susceptibility Assessment. Water 2020, 12, 683. [Google Scholar] [CrossRef] [Green Version]
- Chapi, K.; Singh, V.P.; Shirzadi, A.; Shahabi, H.; Bui, D.T.; Pham, B.T.; Khosravi, K. A novel hybrid artificial intelligence approach for flood susceptibility assessment. Environ. Model. Softw. 2017, 95, 229–245. [Google Scholar] [CrossRef]
- Nasiri, V.; Darvishsefat, A.A.; Rafiee, R.; Shirvany, A.; Hemat, M.A. Land use change modeling through an integrated multi-layer perceptron neural network and Markov chain analysis (case study: Arasbaran region, Iran). J. For. Res. 2019, 30, 943–957. [Google Scholar] [CrossRef]


| Rank | Factor | Average Merit (AM) |
|---|---|---|
| 1 | Rainfall | 76.111 |
| 2 | Land use | 72.222 |
| 3 | Elevation | 68.333 |
| 4 | STI | 61.111 |
| 5 | Soil | 60 |
| 6 | Slope | 59.444 |
| 7 | TWI | 56.111 |
| 8 | Curvature | 53.889 |
| 9 | Flow direction | 53.889 |
| 10 | River density | 52.222 |
| 11 | Geology | 49.444 |
| 12 | Aspect | 44.444 |
| No | Index | Phase | |||||||||
|---|---|---|---|---|---|---|---|---|---|---|---|
| Training | Validation | ||||||||||
| BLR | CGLR | DLR | RSSLR | LR | BLR | CGLR | DLR | RSSLR | LR | ||
| 1 | TP | 80 | 80 | 78 | 79 | 80 | 30 | 29 | 31 | 32 | 29 |
| 2 | TN | 63 | 63 | 55 | 65 | 60 | 23 | 22 | 25 | 21 | 22 |
| 3 | FP | 21 | 21 | 23 | 22 | 21 | 13 | 14 | 12 | 11 | 14 |
| 4 | FN | 16 | 16 | 24 | 14 | 19 | 10 | 11 | 8 | 12 | 11 |
| 5 | PPV (%) | 79.21 | 79.21 | 77.23 | 78.22 | 79.21 | 69.77 | 67.44 | 72.09 | 74.42 | 67.44 |
| 6 | NPV (%) | 79.75 | 79.75 | 69.62 | 82.28 | 75.95 | 69.70 | 66.67 | 75.76 | 63.64 | 66.67 |
| 7 | SST (%) | 83.33 | 83.33 | 76.47 | 84.95 | 80.81 | 75.00 | 72.50 | 79.49 | 72.73 | 72.50 |
| 8 | SPF (%) | 75.00 | 75.00 | 70.51 | 74.71 | 74.07 | 63.89 | 61.11 | 67.57 | 65.63 | 61.11 |
| 9 | ACC (%) | 79.44 | 79.44 | 73.89 | 80.00 | 77.78 | 69.74 | 67.11 | 73.68 | 69.74 | 67.11 |
| 10 | Kappa | 0.586 | 0.5855 | 0.469 | 0.5984 | 0.5501 | 0.391 | 0.338 | 0.472 | 0.3819 | 0.3375 |
© 2020 by the authors. Licensee MDPI, Basel, Switzerland. This article is an open access article distributed under the terms and conditions of the Creative Commons Attribution (CC BY) license (http://creativecommons.org/licenses/by/4.0/).
Share and Cite
Nguyen, P.T.; Ha, D.H.; Avand, M.; Jaafari, A.; Nguyen, H.D.; Al-Ansari, N.; Van Phong, T.; Sharma, R.; Kumar, R.; Le, H.V.; et al. Soft Computing Ensemble Models Based on Logistic Regression for Groundwater Potential Mapping. Appl. Sci. 2020, 10, 2469. https://0-doi-org.brum.beds.ac.uk/10.3390/app10072469
Nguyen PT, Ha DH, Avand M, Jaafari A, Nguyen HD, Al-Ansari N, Van Phong T, Sharma R, Kumar R, Le HV, et al. Soft Computing Ensemble Models Based on Logistic Regression for Groundwater Potential Mapping. Applied Sciences. 2020; 10(7):2469. https://0-doi-org.brum.beds.ac.uk/10.3390/app10072469
Chicago/Turabian StyleNguyen, Phong Tung, Duong Hai Ha, Mohammadtaghi Avand, Abolfazl Jaafari, Huu Duy Nguyen, Nadhir Al-Ansari, Tran Van Phong, Rohit Sharma, Raghvendra Kumar, Hiep Van Le, and et al. 2020. "Soft Computing Ensemble Models Based on Logistic Regression for Groundwater Potential Mapping" Applied Sciences 10, no. 7: 2469. https://0-doi-org.brum.beds.ac.uk/10.3390/app10072469