Evaluation of Chloride Resistance of Early-Strength Concrete Using Blended Binder and Polycarboxylate-Based Chemical Admixture


Technology Research & Development Institute, Daelim Industrial, Jongno-Gu, Seoul 03152, Korea
*
Author to whom correspondence should be addressed.
Appl. Sci. 2020, 10(8), 2972; https://0-doi-org.brum.beds.ac.uk/10.3390/app10082972
Submission received: 30 March 2020
/
Revised: 17 April 2020
/
Accepted: 20 April 2020
/
Published: 24 April 2020
(This article belongs to the Special Issue Concrete and Mortar with Non-conventional Materials)
Abstract
:The mixing proportions of concrete were examined with regard to the durability performance and early strength in coastal areas. Research was conducted to improve the C24 mix (characteristic strength of 24 MPa). C35 concrete (characteristic strength of 35 MPa) was selected as a comparison group, as it exhibits the minimum proposed strength criterion for concrete in the marine environment. To secure the early strength of the C24 concrete, 50% of the total ordinary Portland cement (OPC) binder was replaced with early Portland cement (EPC); and to provide durability, 20% was substituted with ground granulated blast-furnace slag (GGBS). In addition, a polycarboxylate (PC)-based superplasticizer was used to reduce the unit water content. The compressive strength, chloride ion diffusion coefficient, chloride penetration depth, and pore structure were evaluated. After one day, the compressive strength improved by 40% when using EPC and GGBS, and an average increase of 20% was observed over 91 days. EPC and GGBS also reduced the overall porosity, which may increase the watertightness of concrete. The salt resistance performance was improved because the rapid early development of strength increased the watertightness of the surface and immobilization of chloride ions, decreasing the chloride diffusion coefficient by 50%.
1. Introduction
Reinforced concrete (RC) is the most economical structural material and offers excellent design freedom. Structures are constructed using the compressive strength of concrete and the tensile strength of steel. A strongly alkaline (pH 12.5–13) passive film forms on the concrete itself [1], preventing the steel from reacting with water and oxygen, thus preventing corrosion. RC is therefore known as a semi-permanent material.
However, the early degradation of concrete in harsh environments has been frequently reported, such as cold areas, heavily polluted urban areas, and tunnels, thereby raising concerns over the durability of concrete structures [2,3,4]. Particularly in coastal areas, many structures such as with bridges, apartment buildings, and public facilities have been demolished before the expected service lives or the repair/maintenance cost has been higher than the initial construction cost. Therefore, many studies have been conducted to extend the service lives of concrete structures by improving the chloride resistance [5,6,7,8,9].
Chloride is a major factor affecting the corrosion of steel reinforcements in concrete. It can mainly be divided into internal chloride, which is added during the manufacturing process, and external chloride, which penetrates through the concrete during its service period [10,11]. Concrete mixes may contain internal chloride as it is present in the mixing water, aggregate, cement, and admixture. Therefore, the initially introduced amount of internal chloride must be limited as much as possible to reduce the risk of corrosion of the steel reinforcements. To this end, each country regulates concrete materials and the internal chloride that is added during the manufacturing of concrete [12,13,14]. In general, internal chloride is periodically tested during the construction of concrete structures. This implies that external chloride is the main cause of steel corrosion.
In marine environments, there are two paths for external chloride attack, i.e., direct attack from seawater and attack by sea-salt particles. Outside marine environments, chloride attack owing to deicing agents in winter is the most important path. Therefore, to prevent chloride attack, the chloride penetration path must be accurately identified, and penetration must be inhibited using appropriate methods, such as increasing the watertightness of the concrete [15,16,17].
The durability design standards of different countries present various methods for ensuring the durability of concrete structures during their target service lives [18,19,20,21]. The durability design of concrete structures, however, is treated as part of the structural design. The service lives of concrete structures are not clearly regulated, and only general guidelines on the durability of concrete are specified.
The most typical method for improving the chloride resistance of concrete is to increase the densification of the concrete structure by using concrete with high strength. Indeed, in many studies, C35 concrete (which has a characteristic strength of 35 MPa) or higher has been proposed as the minimum concrete mixture for structures in coastal areas [12,13,20,21]. In addition, the watertightness of the concrete structure can be increased using mineral admixtures, such as ground granulated blast-furnace slag (GGBS), fly ash, and silica fume [22,23,24,25]. Among them, using GGBS is recommended in coastal areas because it improves long-term watertightness [26,27,28,29] and has an excellent ability to immobilize chloride ions. The use of these mineral admixtures, however, is recommended only to a certain level, because they do not contribute to the development of early strength [30,31,32]. Therefore, specifications on concrete strength must be improved to avoid early form removal and to shorten the construction period. In the field, various methods are required to improve economic efficiency and to reduce the construction time, which require mixing technology to secure early strength while maintaining concrete performance.
Therefore, in this study, mixing proportions that can improve the early strength and chloride resistance of concrete were examined based on the C24 mix. Early Portland cement (EPC) was used to secure the early strength of concrete, and GGBS was substituted at a certain proportion to provide durability. In addition, a polycarboxylate (PC)-based superplasticizer was selected to minimize the unit water content, thereby compensating for the strength of concrete. For concrete fabricated through the set mixing proportions, the compressive strength, chloride ion diffusion coefficient, chloride penetration depth, and pore structure were evaluated by age to examine the improvement in the chloride resistance of the concrete. The designed concrete was compared to C35 concrete, which provides the specified concrete strength and is mainly used in the field.
2. Experimental Procedure
2.1. Materials
Table 1 shows the physical properties of the materials used. Ordinary Portland cement (OPC), EPC, and GGBS were used as concrete binders, and their chemical compositions are listed in Table 2. All three are mostly composed of CaO, SiO2, and Al2O3 but in different ratios, and GGBS has higher SiO2, Al2O3, and MgO contents than OPC and EPC.
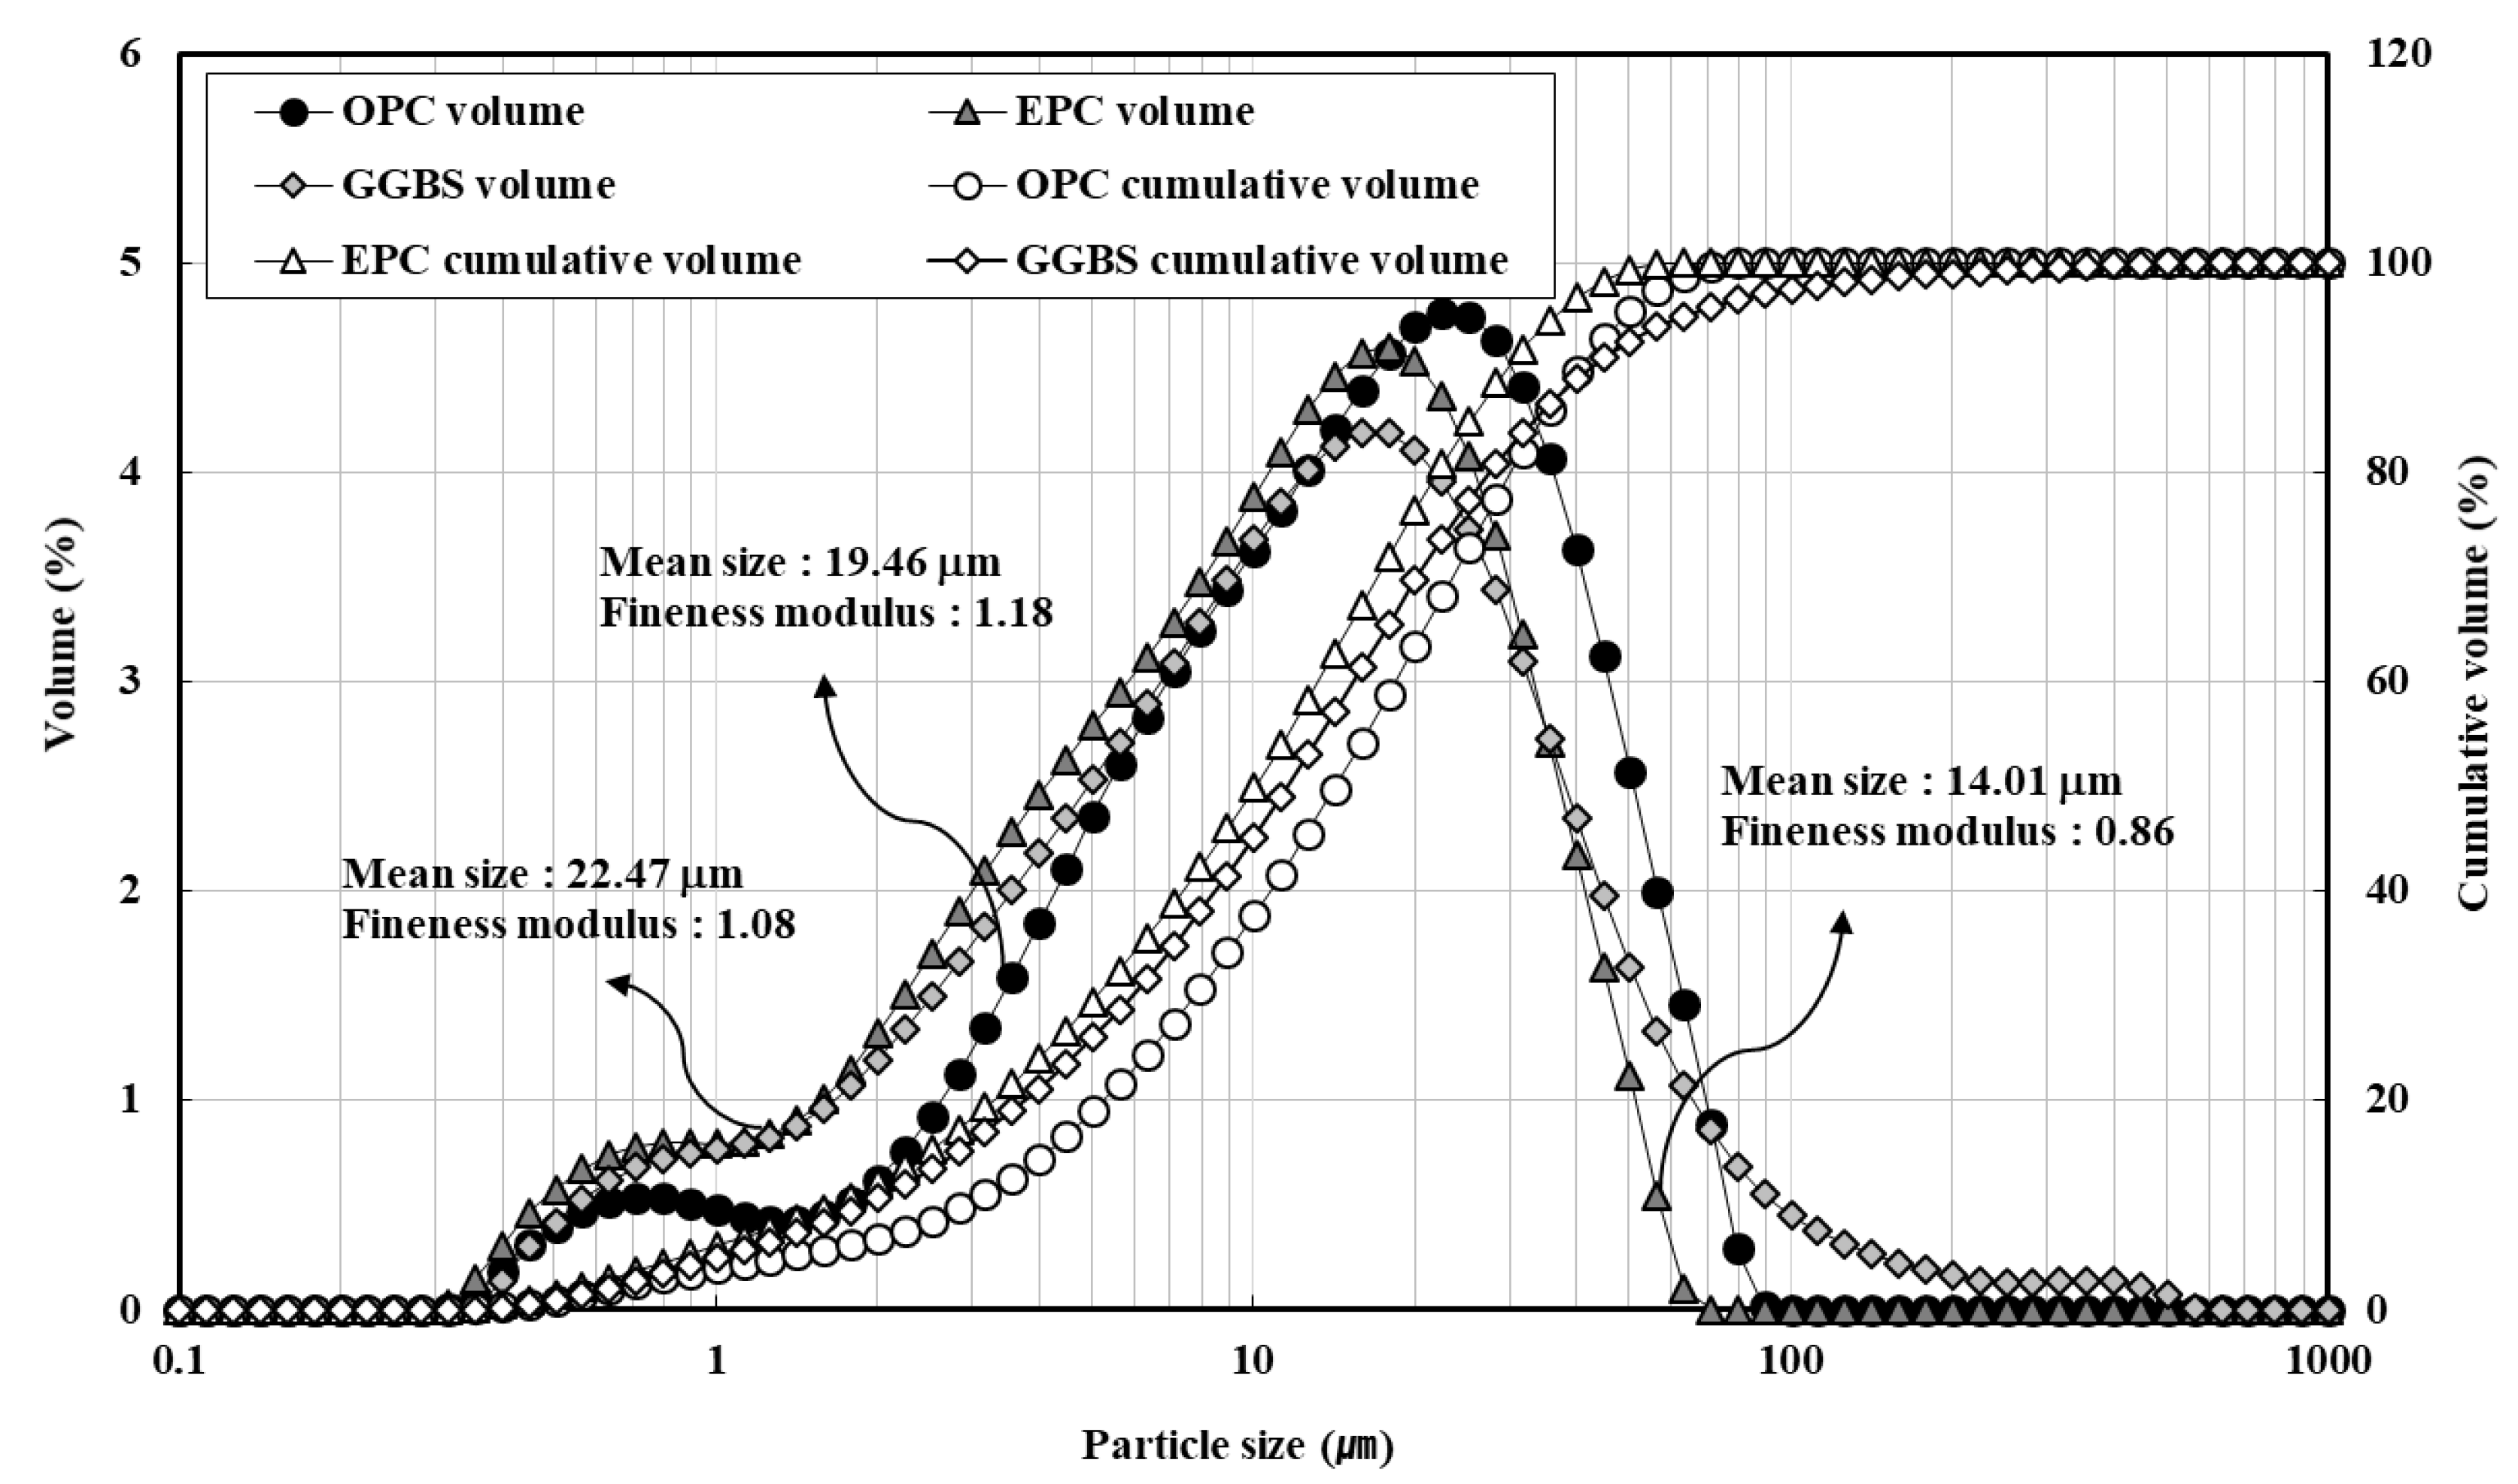
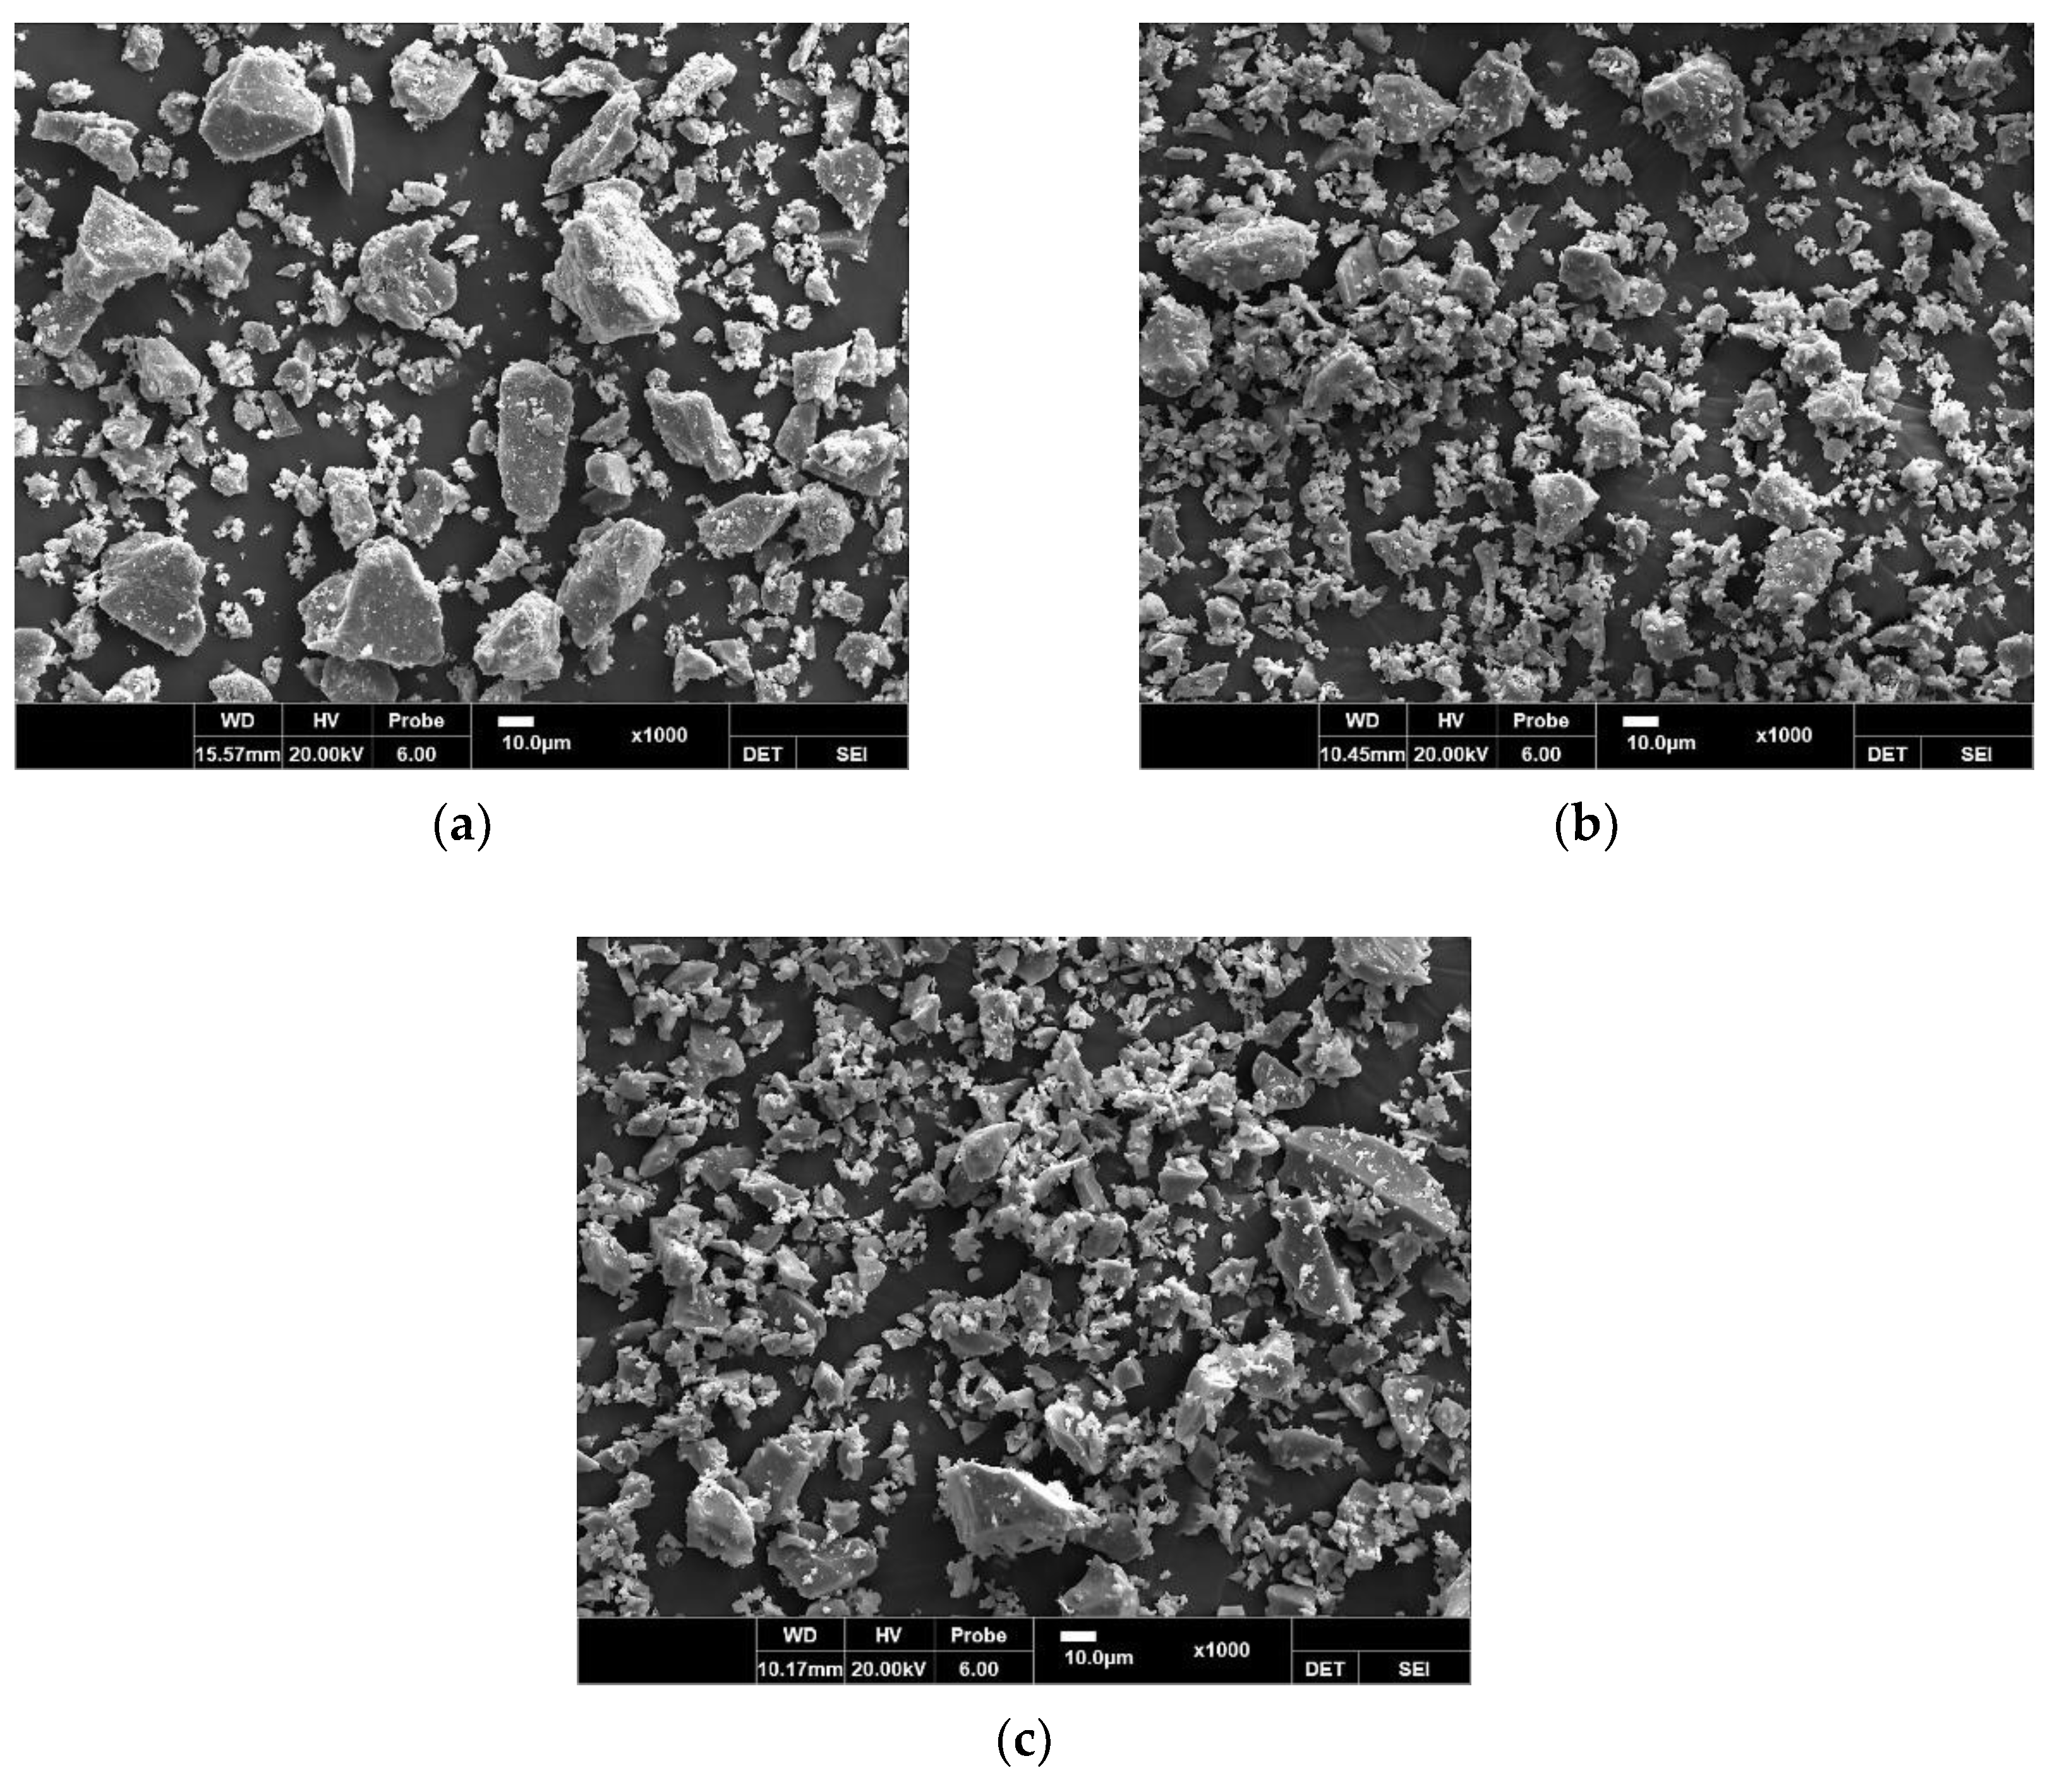
Figure 1 shows the particle size distribution of the concrete binders. The fineness and mean particle size are given in Table 1. As for the detailed grain shapes of the concrete binders, OPC and GGBS similarly exhibited elliptical polyhedral particles larger than 10 μm, whereas EPC showed fine and irregular particles, as revealed by scanning electron microscopy images in Figure 2.
For the fine aggregate, washed sea sand and crushed sand (see Table 1) were mixed and used. The coarse aggregate used was crushed granitic aggregate (see Table 1). Figure 3 shows the gradation sieve analyses of the coarse and fine aggregates used. To improve the constructability of concrete, naphthalene (NP) and PC groups were used as chemical admixtures.
2.2. Experimental Plan and Mix Proportions
Table 3 and Table 4 show the experimental plan and mixing proportions of concrete used in this study. The control concrete had a compressive strength of 35 MPa (C35), which is recommended as the minimum strength under chloride exposure conditions. The unit water content in the concrete mix was 185 kg/m3, and the amount of OPC used was 444 kg/m3 based on the mix table used in actual ready-mixed concrete factories. In addition, an experimental concrete was designed using a C24 mix (characteristic strength of 24 MPa). The unit water content was 165 kg/m3 and the total amount of binders was 330 kg/m3. A total of 50% of the OPC binder was replaced with EPC, and a PC-based superplasticizer was used to develop early strength. In accordance with previous studies, GGBS was used to replace 20% of the OPC binder to improve the chloride resistance and develop long-term strength. The target slump of concrete was set to 180 ± 25 mm considering site construction conditions to meet sufficient workability, and the target air content was set to 4.5% ± 1.5%. The compressive strength, chloride ion diffusion coefficient, chloride penetration depth, and pore structure were evaluated.
2.3. Experimental Methods
2.3.1. Fresh and Hardened Properties of Concrete
Table 5 shows the test methods for each evaluation item in this study. The slump test was conducted in accordance with ASTM C143, and the air content was measured in accordance with ASTM C231. The compressive strength of concrete was evaluated using ∅100 × 200 mm cylindrical specimens, and the average value of three specimens was used in accordance with ASTM C873.
2.3.2. Chloride Penetration Depth and Chloride Ion Diffusion Coefficient
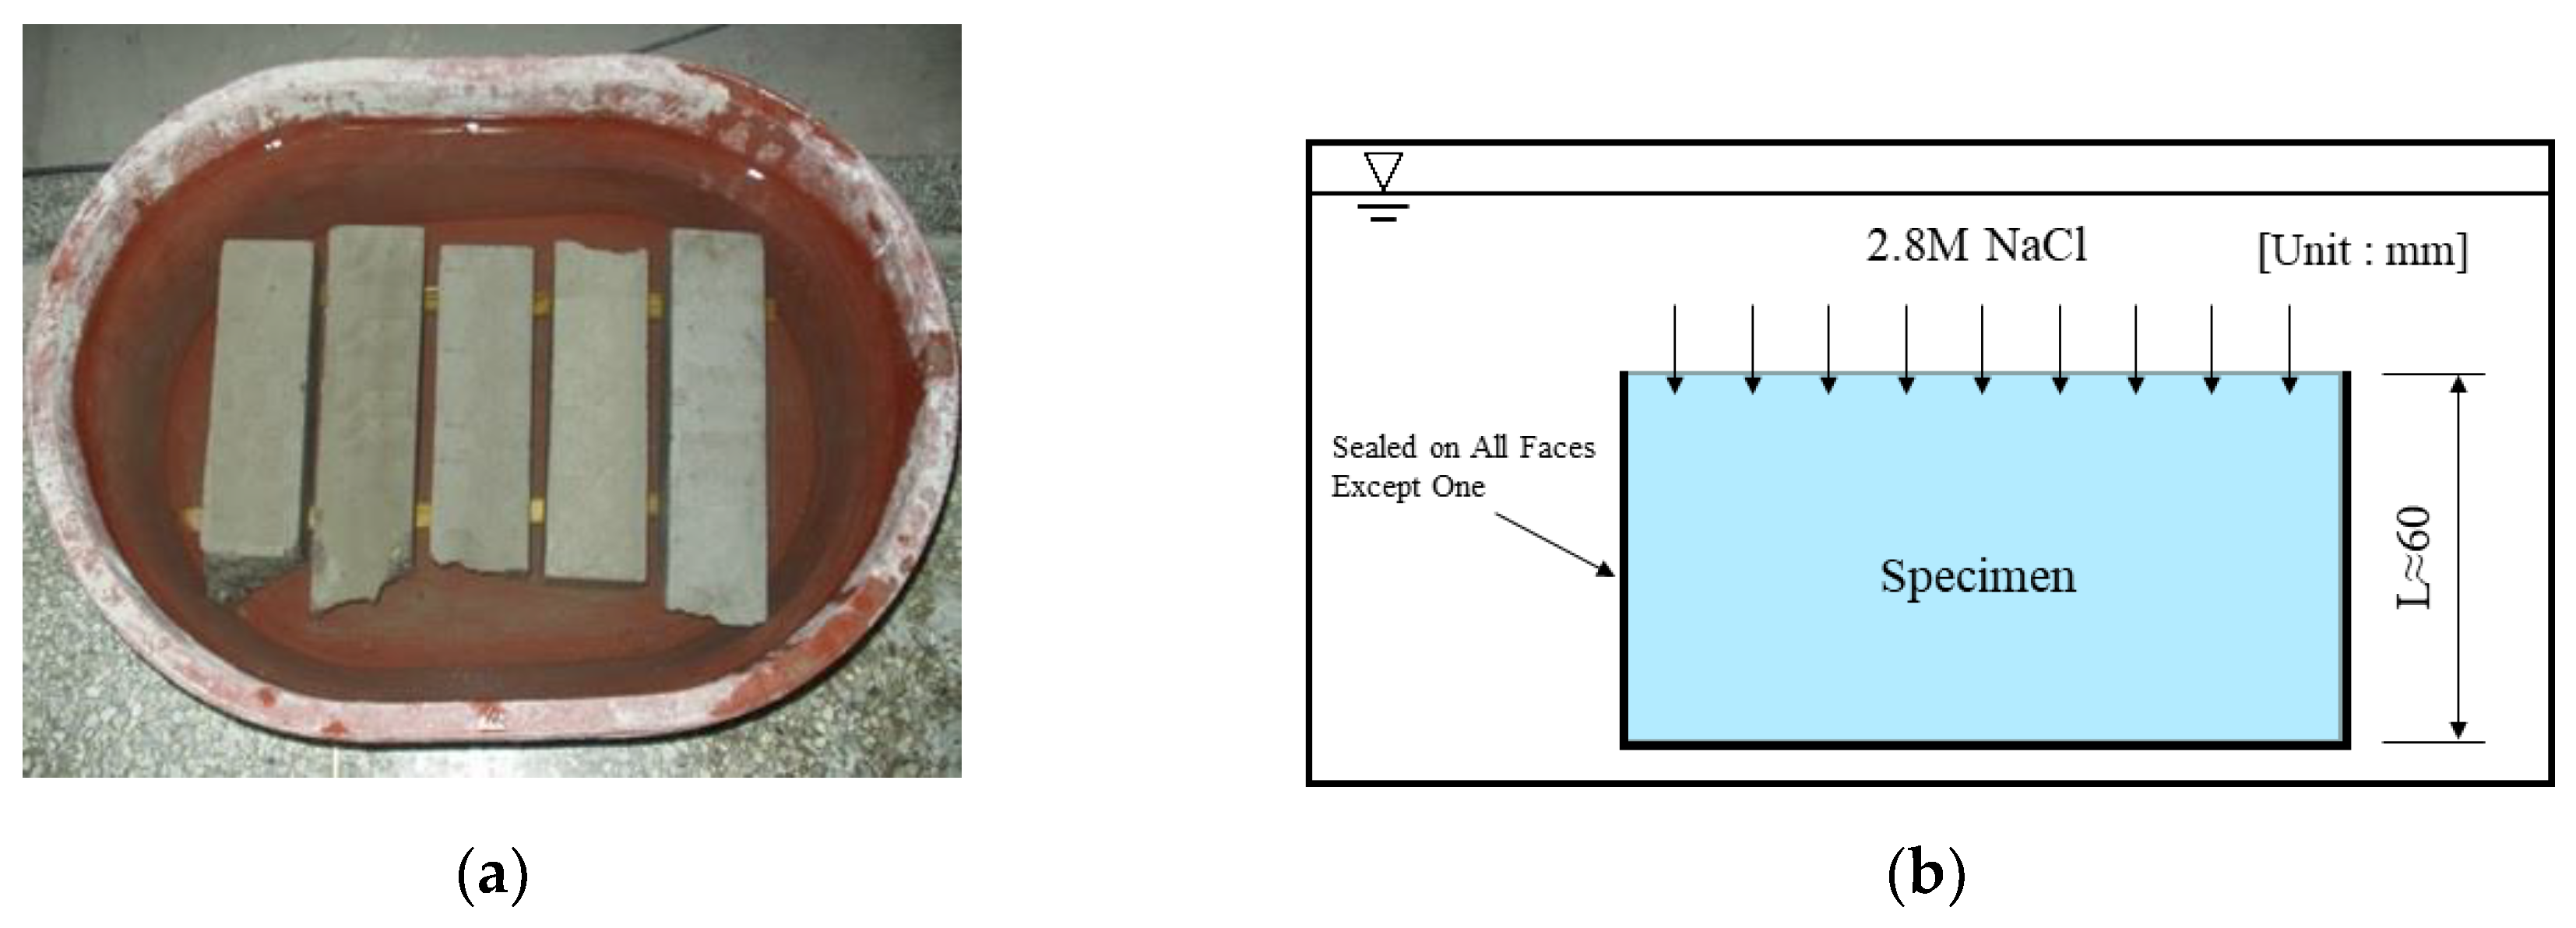
Figure 4 shows the method for testing the chloride penetration depth, which was measured in accordance with NT Build 443. Concrete specimens were fabricated with dimensions of 100 × 100 × 400 mm and immersed in a 2.8 M NaCl solution for 3, 7, 14, 28, 56, and 91 days. To ensure that chloride penetrated the concrete in only one direction, the side and bottom surfaces were coated with epoxy resin. To measure the chloride penetration depth, a 0.1 N AgNO3 solution was sprayed after the specimens were fractured at each age, and discoloration was measured.
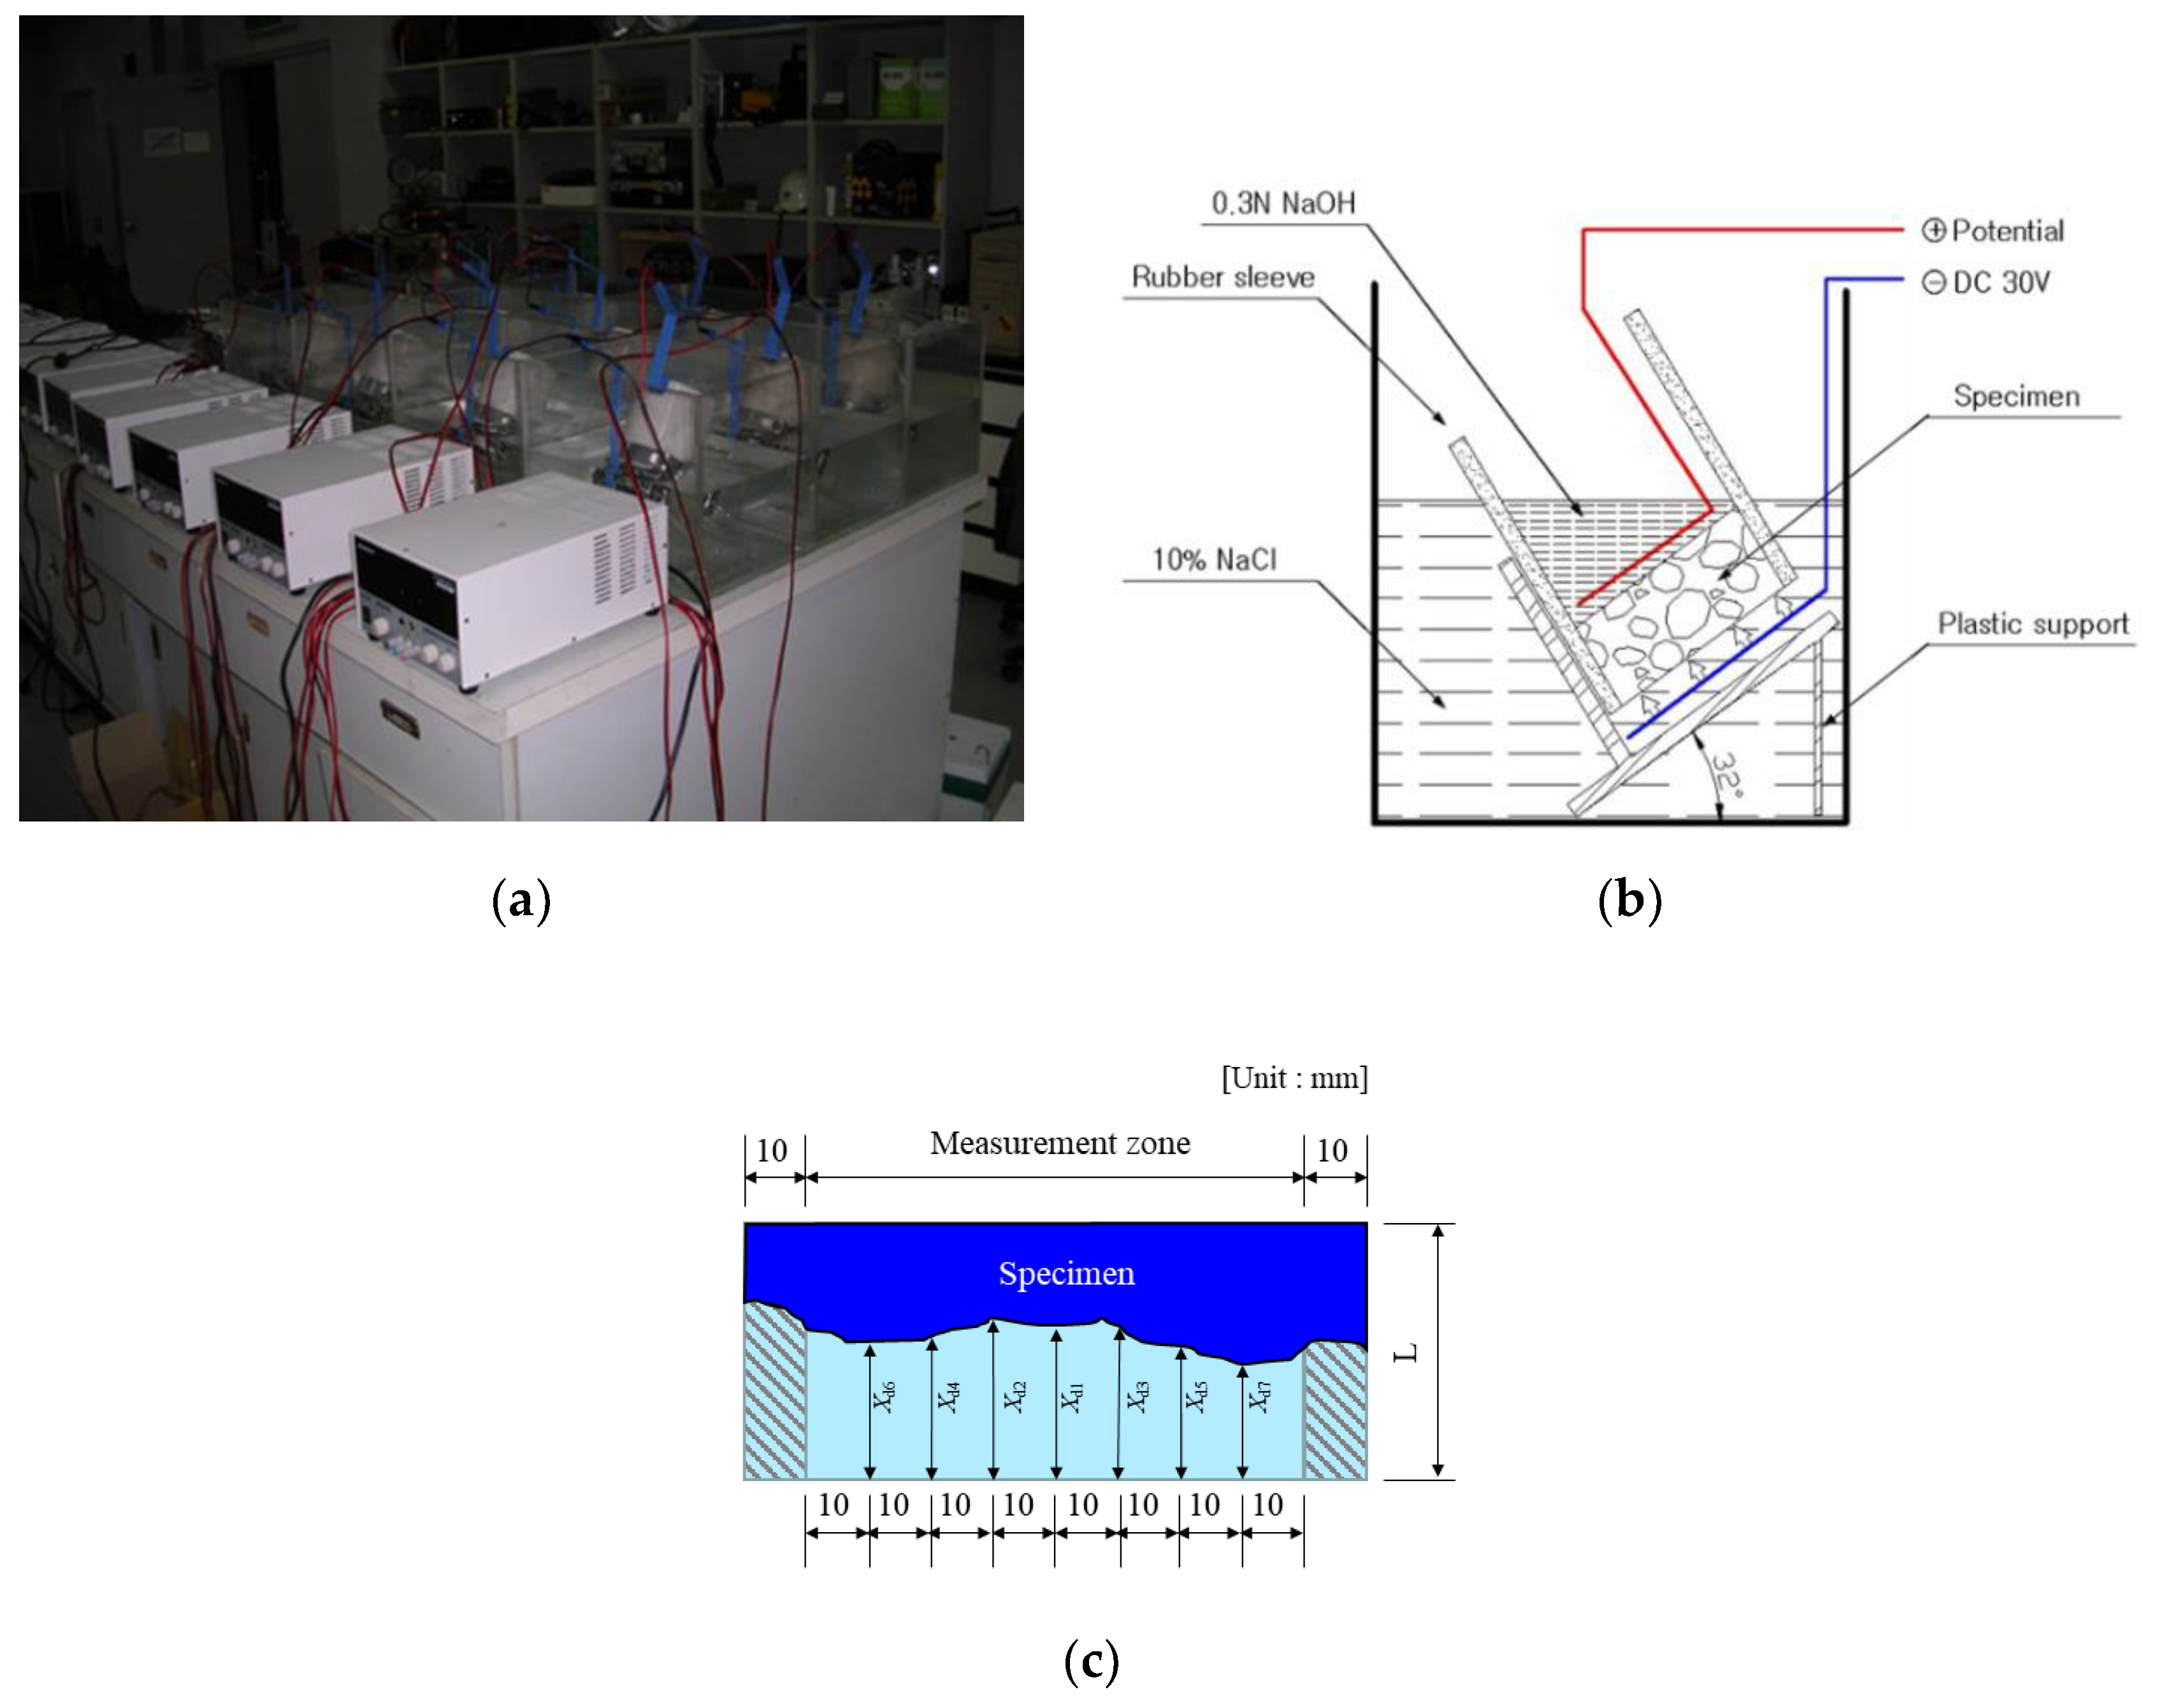
Figure 5 shows the method for testing the chloride ion diffusion coefficient. Specimens for the chloride diffusion test were fabricated by cutting a certain portion of ∅100 × 200 mm cylindrical specimens to a 50 mm thickness using a diamond cutter. In accordance with NT Build 492, a 0.3 N NaOH solution (approximately NaOH 12 g in 1 L of water) was used as the anode, and 10% NaCl solution (100 g of NaCl + 900 g of distilled water) as the cathode.
The applied voltage and test duration were selected based on the current value when a 30 V voltage was applied. The chloride ion penetration depth was measured using the same method as above, and the chloride ion diffusion coefficient was calculated using Equation (1).
where Dnssm (m2/s) is the non-steady-state migration coefficient; z is the absolute value of the ion valence, and for chloride, z = 1; F is the Faraday constant, F = 9.648 × 10⁴ J/(V·mol); U (V) is the absolute value of the applied voltage; R is the gas constant, R = 8.314 J/(K·mol); T (K) is the average value of the initial and final temperatures in the anolyte solution; L (m) is the thickness of the specimen; Xd (m) is the average value of the penetration depths; t (s) is the test duration; erf –1 is the inverse of the error function; Cd is the chloride concentration at which the color changes, Cd = 0.07 N for OPC concrete; and C0 is the chloride concentration in the catholyte solution, C0 ≈ 2 N.
2.3.3. Porosity of Inner Concrete
The porosity of the concrete was measured in accordance with ASTM D 4404 to verify the penetration resistance of the concrete by age according to the porosity. The mercury intrusion porosimetry (MIP) method uses the capillary phenomenon in which liquids penetrate into micropores. Non-wetting liquids, such as mercury, can penetrate only when pressure is applied from the outside, and higher pressure is required for smaller pores. The measurement results are expressed as a function of the cumulative penetration volume of mercury according to the pressure (or the pore size). The radius of a cylindrical pore penetrated at a certain pressure was measured using the Washburn equation.
3. Results and Discussion
3.1. Fresh and Hardened Properties of Concrete
Table 6 shows the fresh properties of the concrete. Both concrete mixes met the target slump of 180 ± 25 mm. In the case of the C35_O10 mix, the slump decreased by 35 mm after 60 min, which is a significant reduction. Immediately after discharge, the air content met the target of 4.5% ± 1.5% for all concrete mixes and only slightly decreased after 60 min.
Figure 6 shows the compressive strength of each concrete mix as a function of age. C24_O3_E5_G2 exhibited higher strength than C35_O10 from early ages, and it continuously showed higher strength even at 56 and 91 days, i.e., after long-term aging. In general, EPC is favorable for developing early strength, but it has little effect on long-term strength because of its high C3S content and high fineness [33,34]. In the scope of this study, using EPC and GGBS as binders was found to effectively develop long-term strength. The PC-based superplasticizer was also found to contribute to the development of strength, even though the total amount of binder was smaller than that in C35_O10, because it reduced the unit water content [35].
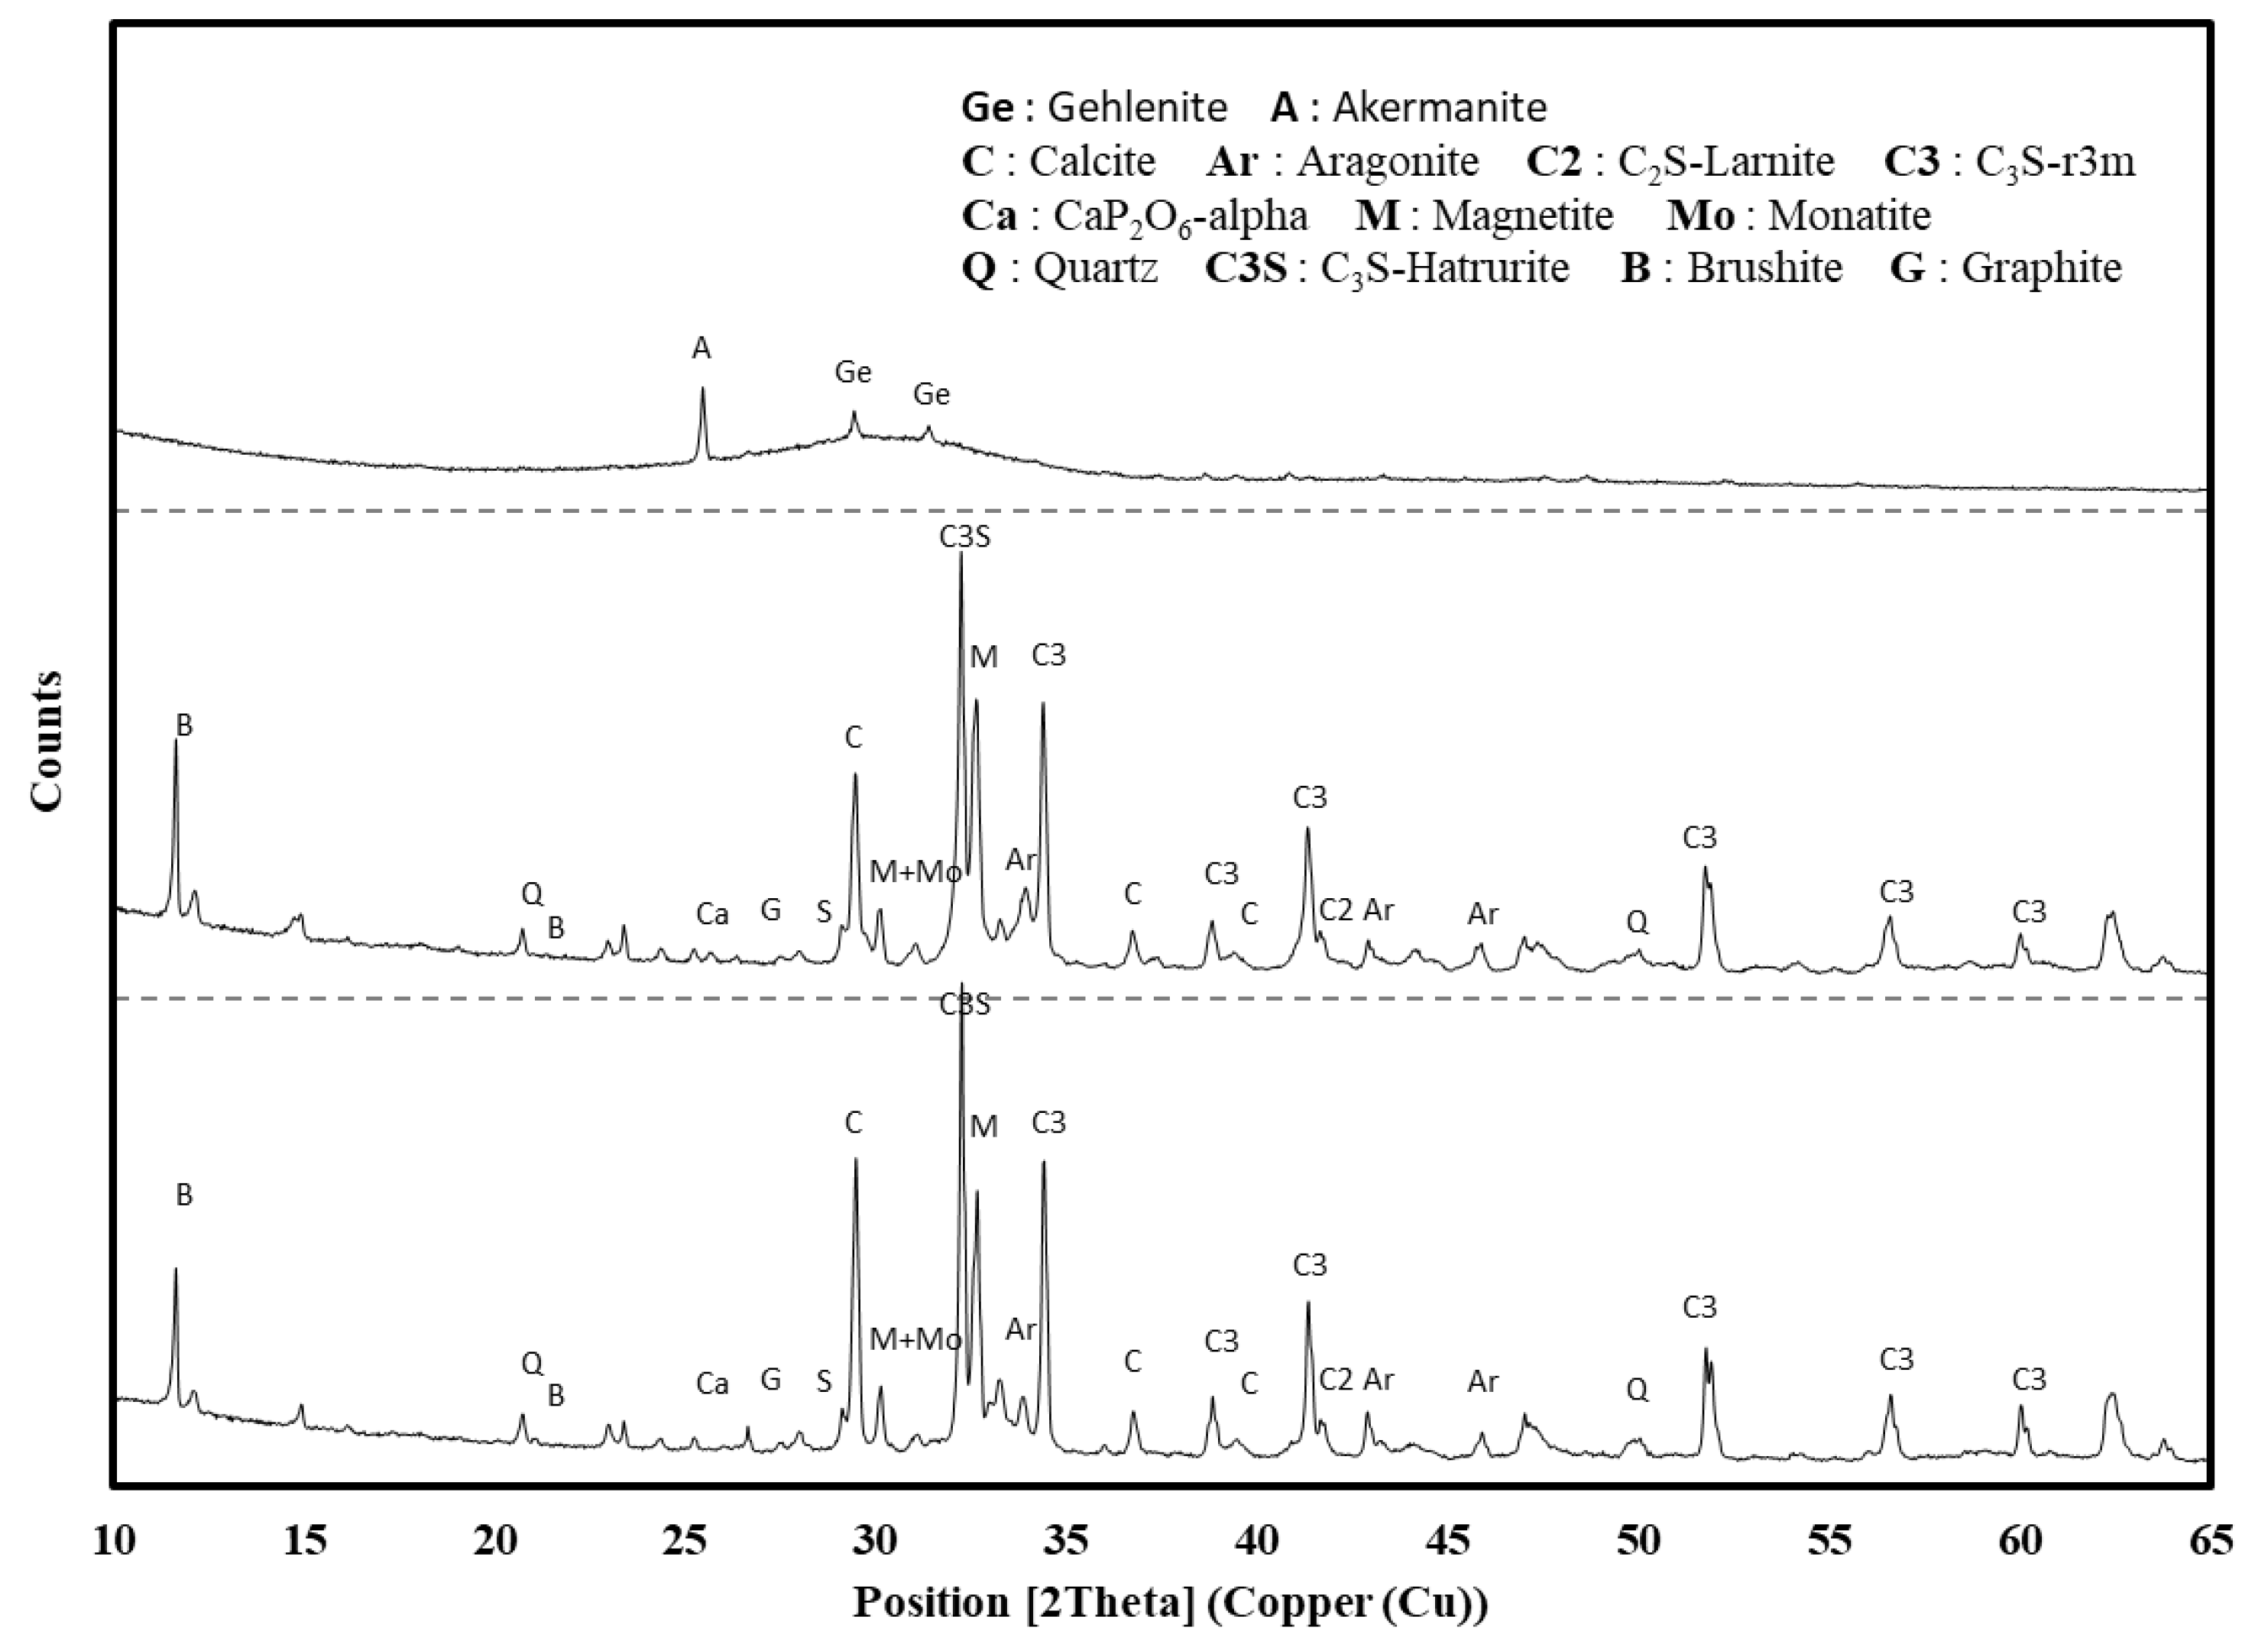
Figure 7 shows the X-ray diffraction patterns of GGBS, OPC, and EPC used in this study. The results confirmed that EPC and OPC were mainly composed of C3S(3CaO∙SiO2), C2S(2CaO∙SiO2), C3A(3CaO∙Al2O3), and C4AF(4CaO∙Al2O3∙Fe2O3), as mentioned above, and that EPC contained more C3S crystals than OPC. GGBS was found to be composed of gehlenite and åkermanite.
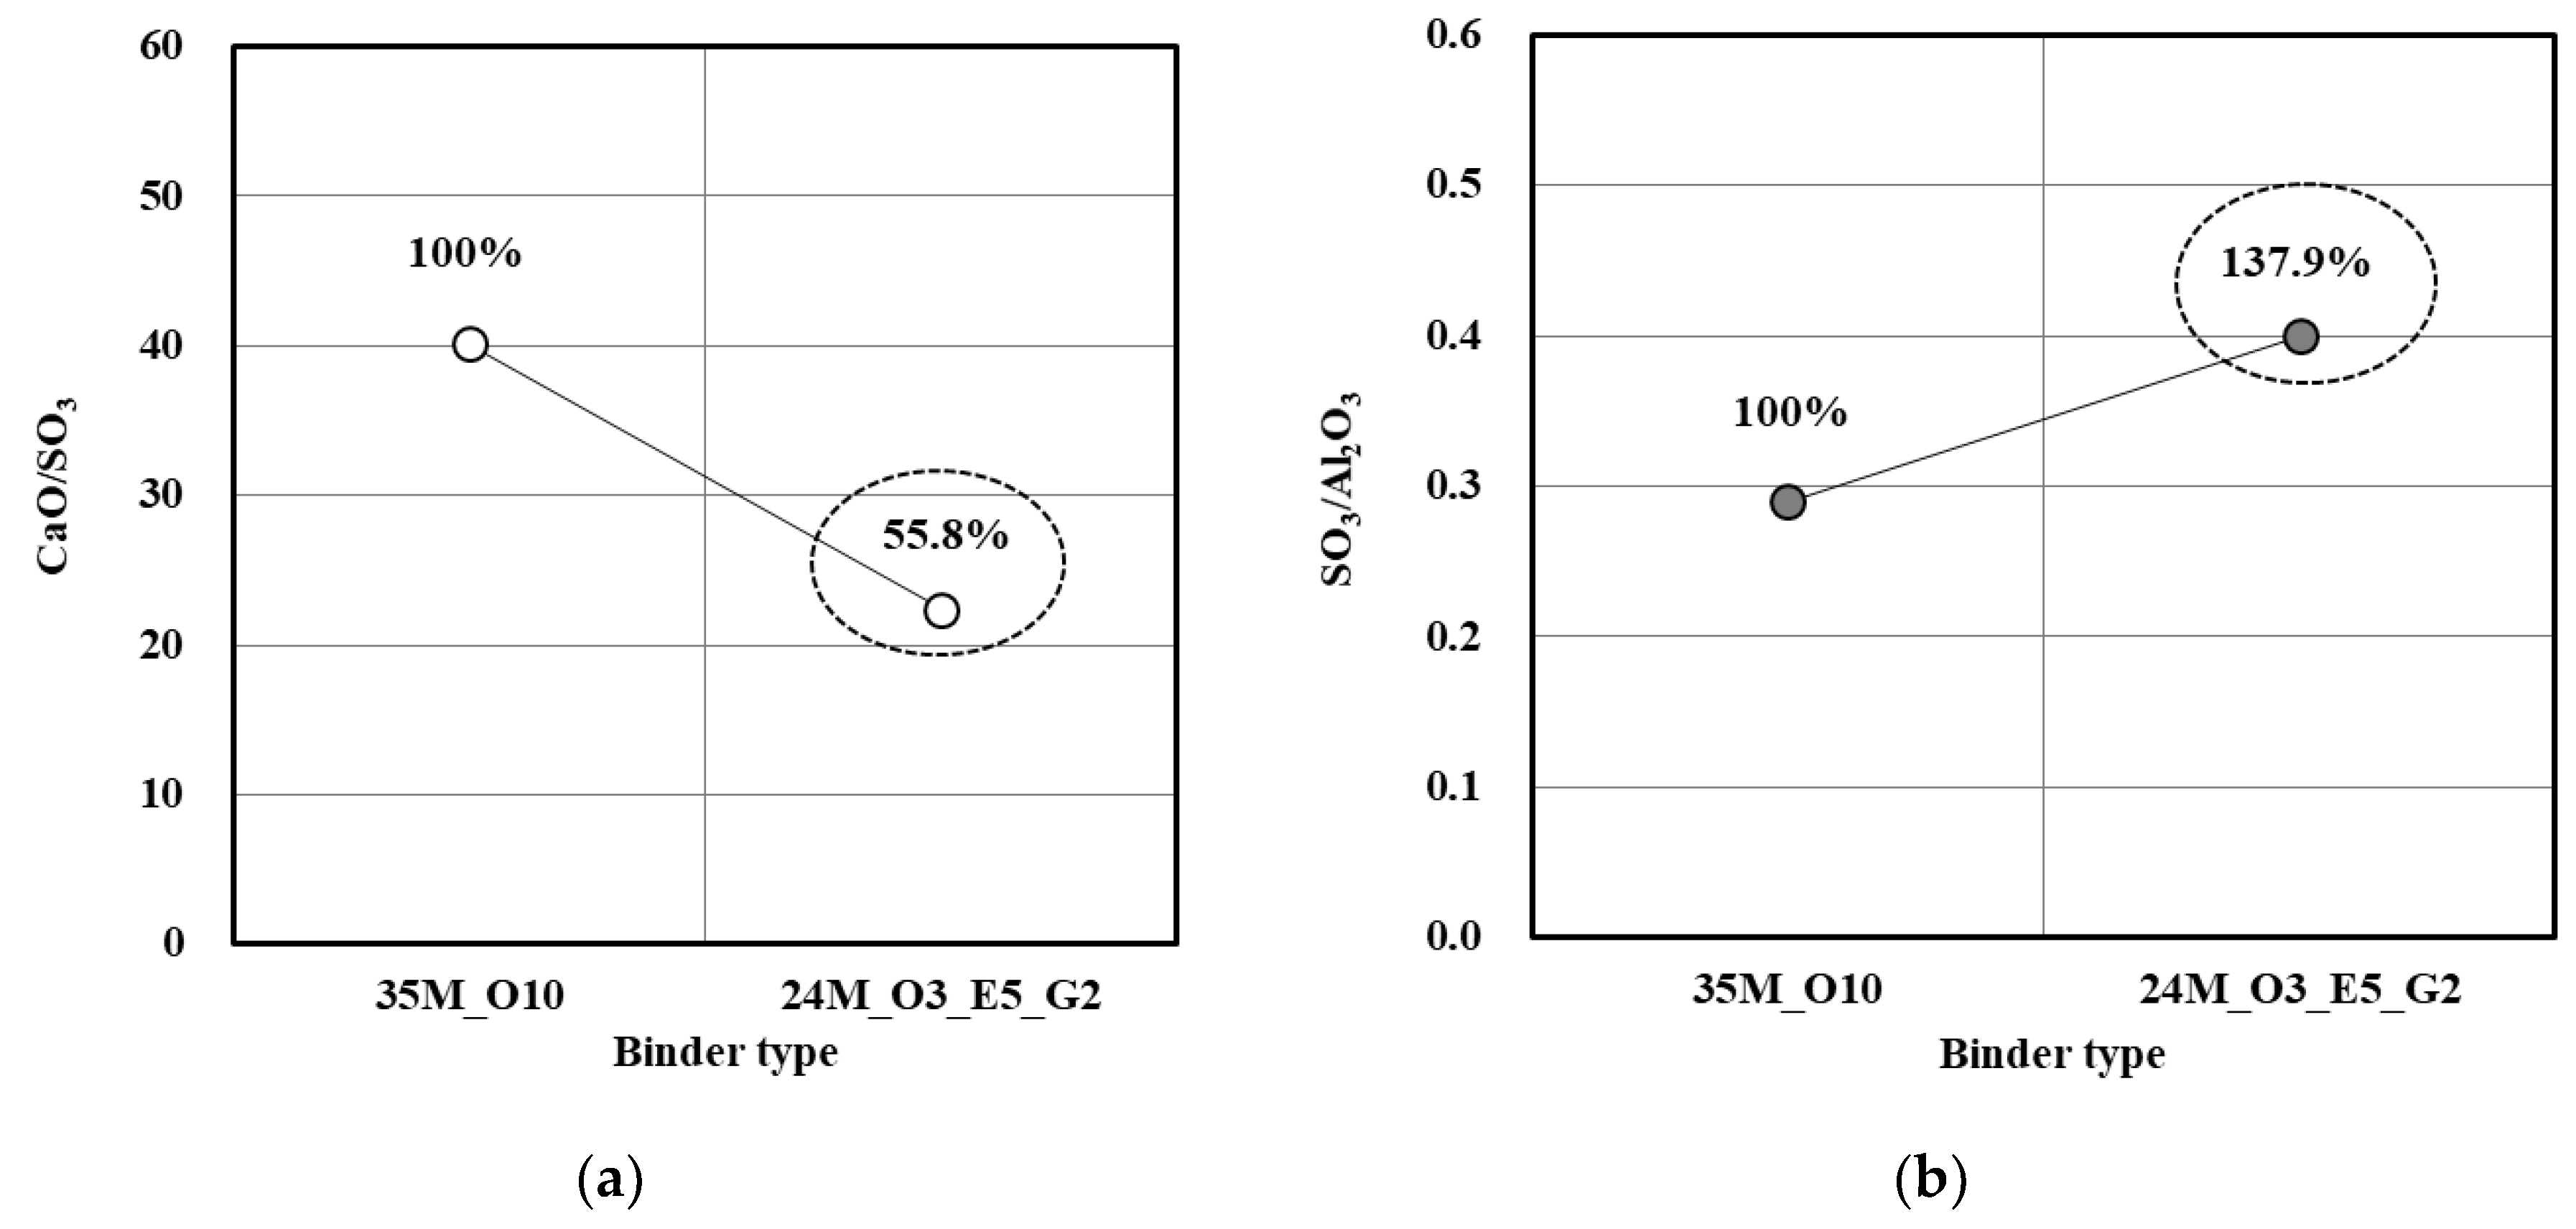
Figure 8 shows the CaO/SO3 and SO3/Al2O3 ratios according to the binder type. For C24_O3_E5_G2, the CaO/SO3 ratio was approximately 55.8% that of C35_O10, whereas the SO3/Al2O3 ratio was 137.9% that of C35_O10. These differences arose because the SO3 content was higher, while the actual CaO content was similar. Previous studies reported that the development of early strength increased as the SO3 content increased in the range of less than 5% [36,37,38].
3.2. Relation between Chloride Penetration Depth and Compressive Strength
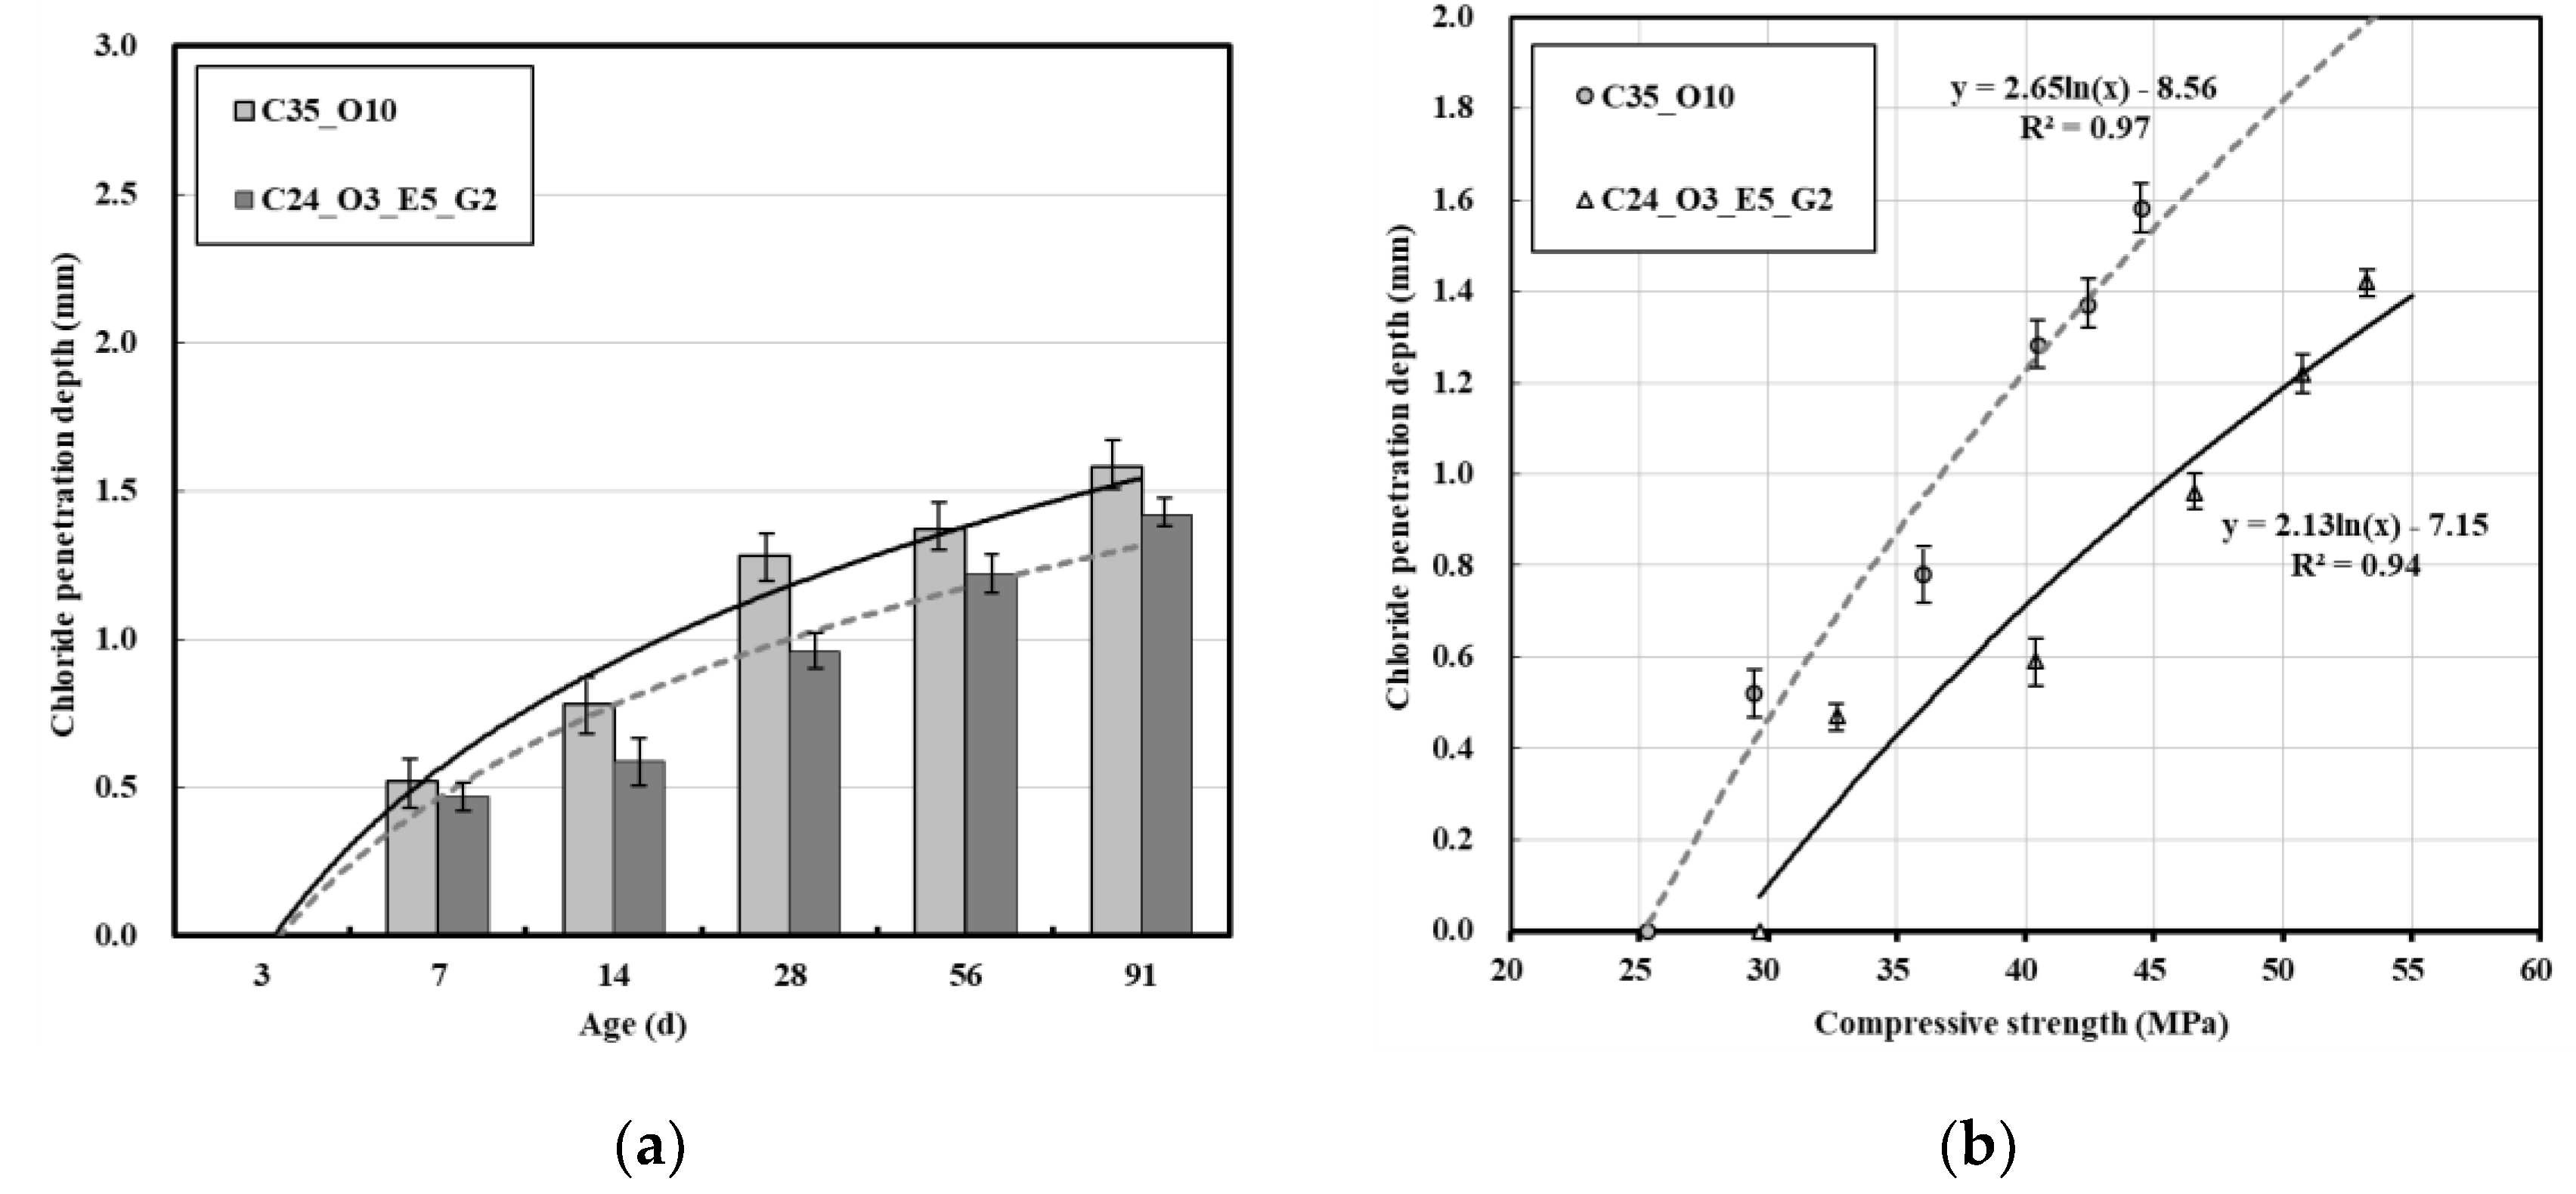
Figure 9a shows the chloride penetration depth of each concrete mix by age. The chloride penetration depth could not be measured at 3 days of age, but chloride had started penetrating the concrete at 7 days. From 7 days, C35_O10 exhibited larger chloride penetration depths than C24_O3_E5_O2. This difference reached a maximum at 28 days and then slowly decreased.
Figure 9b shows the relation between the compressive strength and chloride penetration depth. Under the same strength development conditions, C24_O3_E5_O2 exhibited smaller chloride penetration depths. In general, the concentration of airborne chloride on the structure is not high. However, the concentration of seawater with a high value of 2.8 M or more may affect the concrete while curing. The relationships between compressive strength and chloride penetration depth in Figure 9b show that the chloride penetration increases even as the compressive strength increases. Therefore, high surface watertightness is required in order to reduce the penetration depth of chlorine when the concrete is in contact with high concentrations of chloride over long periods. In the scope of this study, C24_O3_E5_O2 tends to have a lower chloride penetration depth than C35_O10 as the age increases, and a low value of about 60% after 91 days. This means that the designed durability service life of the structure can be extended beyond that of the C35_O35 formulation, while using an economical mixture design.
Chloride penetrated to significantly different depths until 28 days of age because of the development of early strength owing to the EPC and PC-based superplasticizer, and the high fineness increased the watertightness of the concrete surface. After 28 days, the increased watertightness of the concrete caused by the action of GGBS [22,23,24,25] appears to have reduced the chloride penetration depth.
3.3. Relation between Chloride Ion Diffusion Coefficient and Compressive Strength
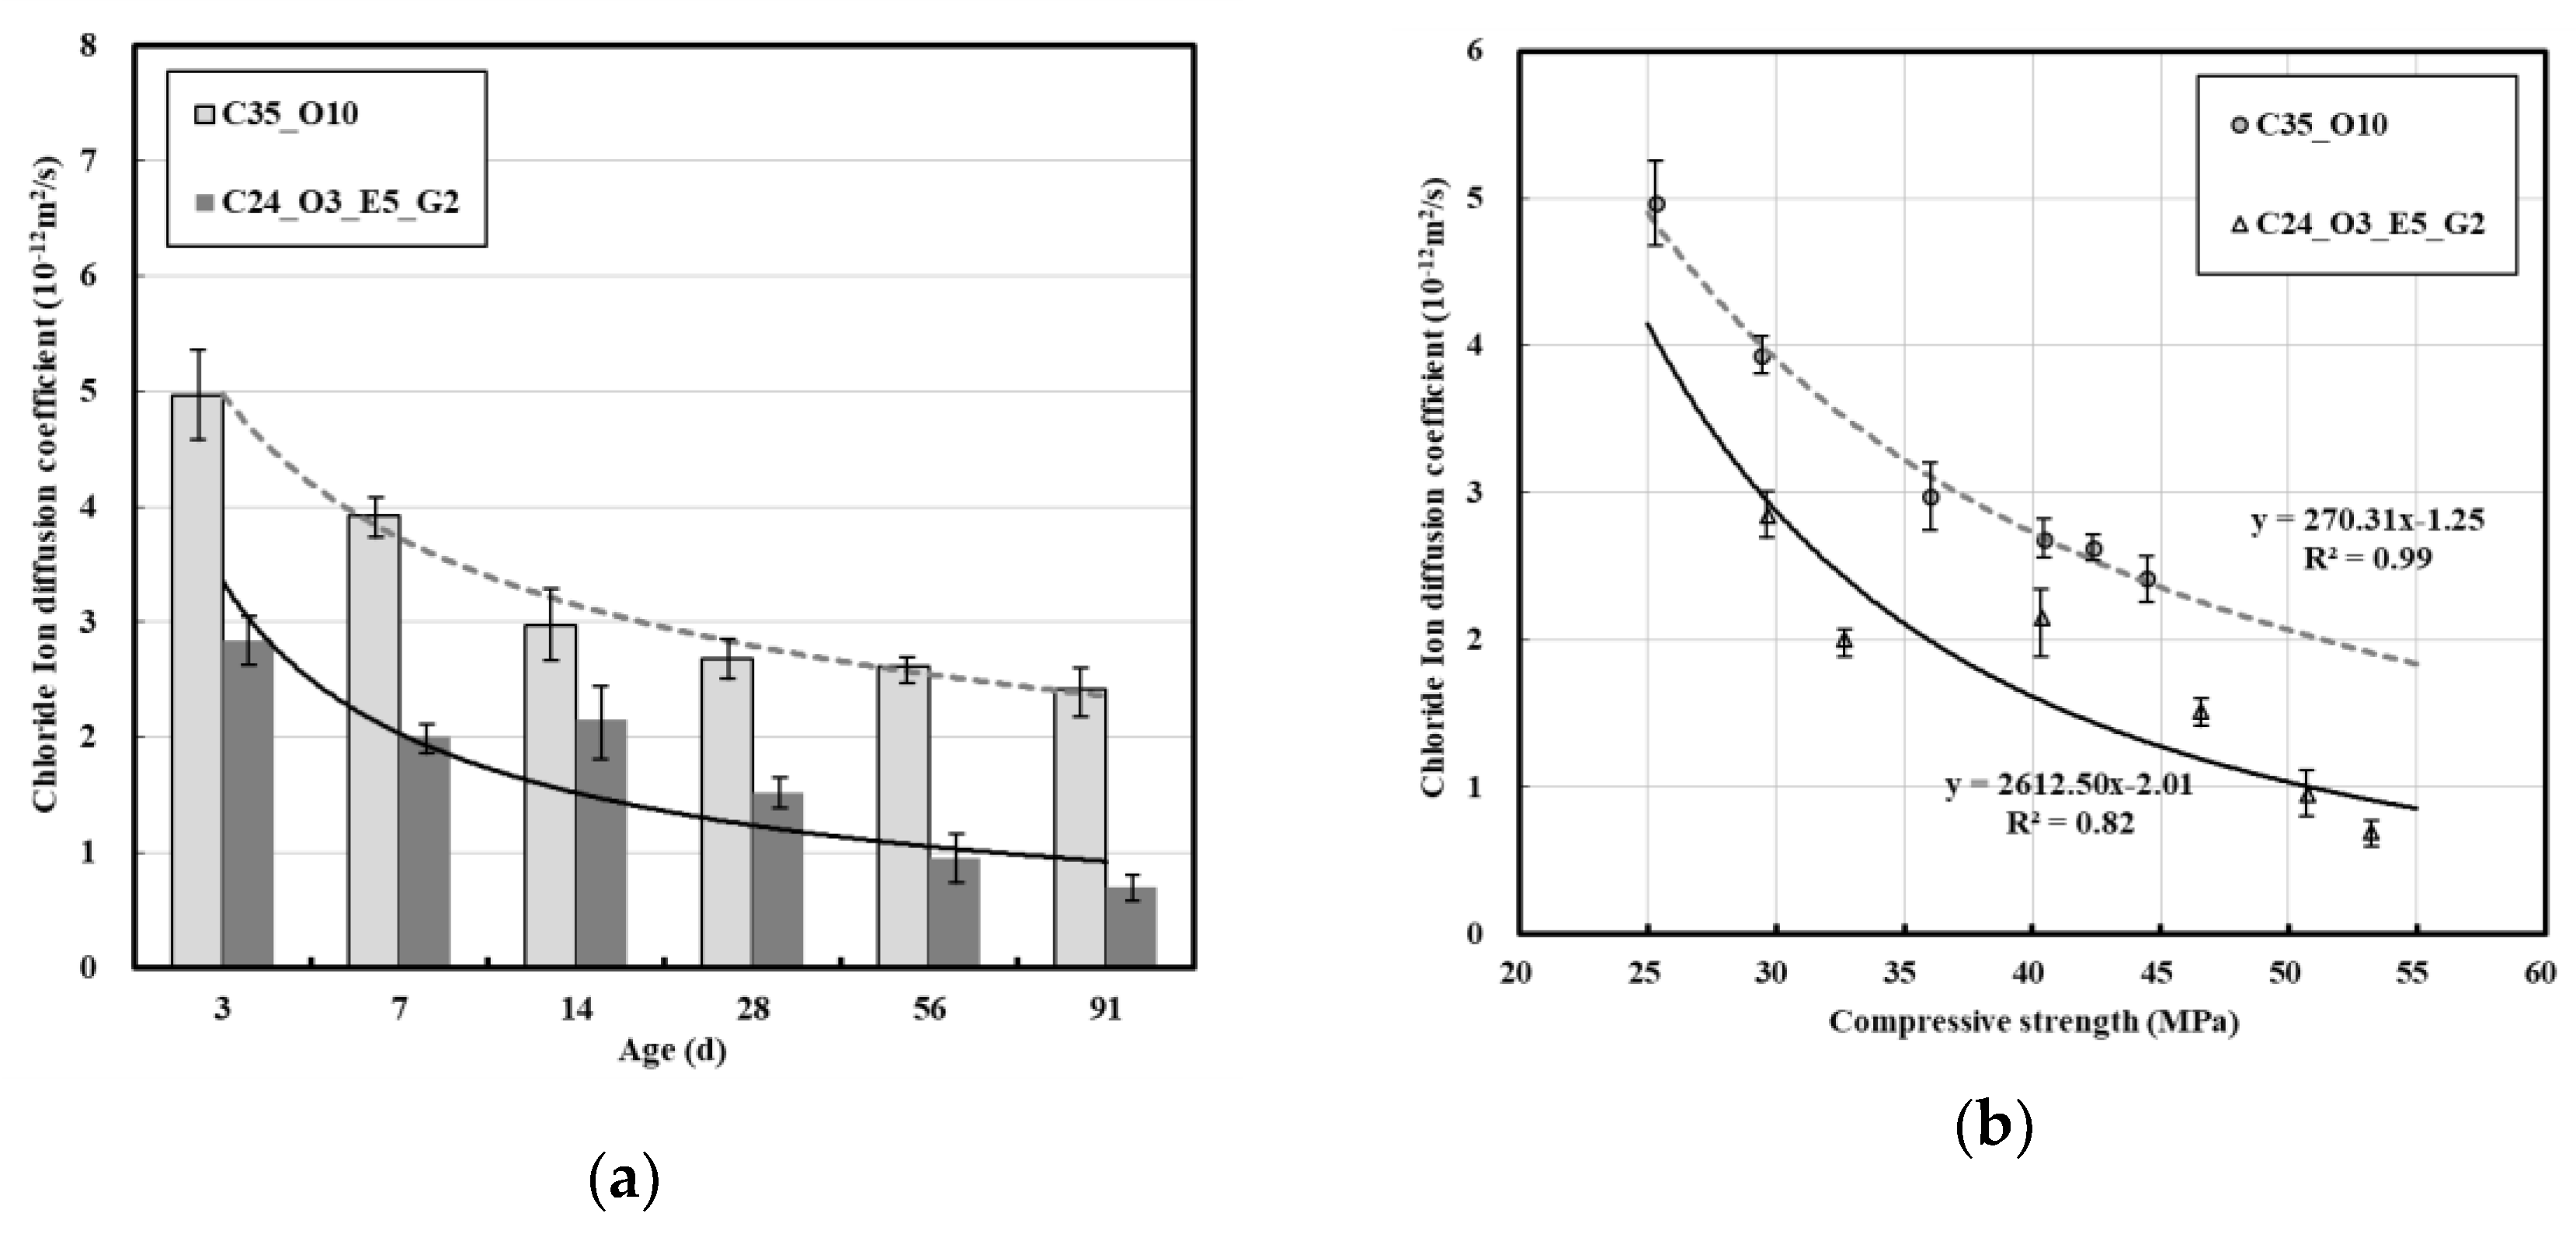
Figure 10a shows the chloride ion diffusion coefficient of each concrete mix by age. C24_O3_E5_O2 exhibited lower chloride ion diffusion than C35_O10, as with the tendency of the chloride penetration depth. A slightly different result from the chloride penetration depth is that large differences in chloride ion diffusion coefficient were observed between C24_O3_E5_O2 and C35_O10 even at early ages. Large differences were also continuously observed in the long term. This appears to be due to the difference in ion penetration mechanism.
Figure 10b shows the relation between compressive strength and chloride ion diffusion coefficient. Under the same compressive strength development, C24_O3_E5_O2 continuously exhibited 1–1.2 × 10⁻¹ m2/s lower chloride ion diffusion coefficients than C35_O10 due to the influence of the surface watertightness and chemical reactions with penetrating chloride ions. This can be explained by the internal watertightness improvement and chloride ion immobilization caused by the action of GGBS [39,40,41].
3.4. Effect of Porosity of Concrete
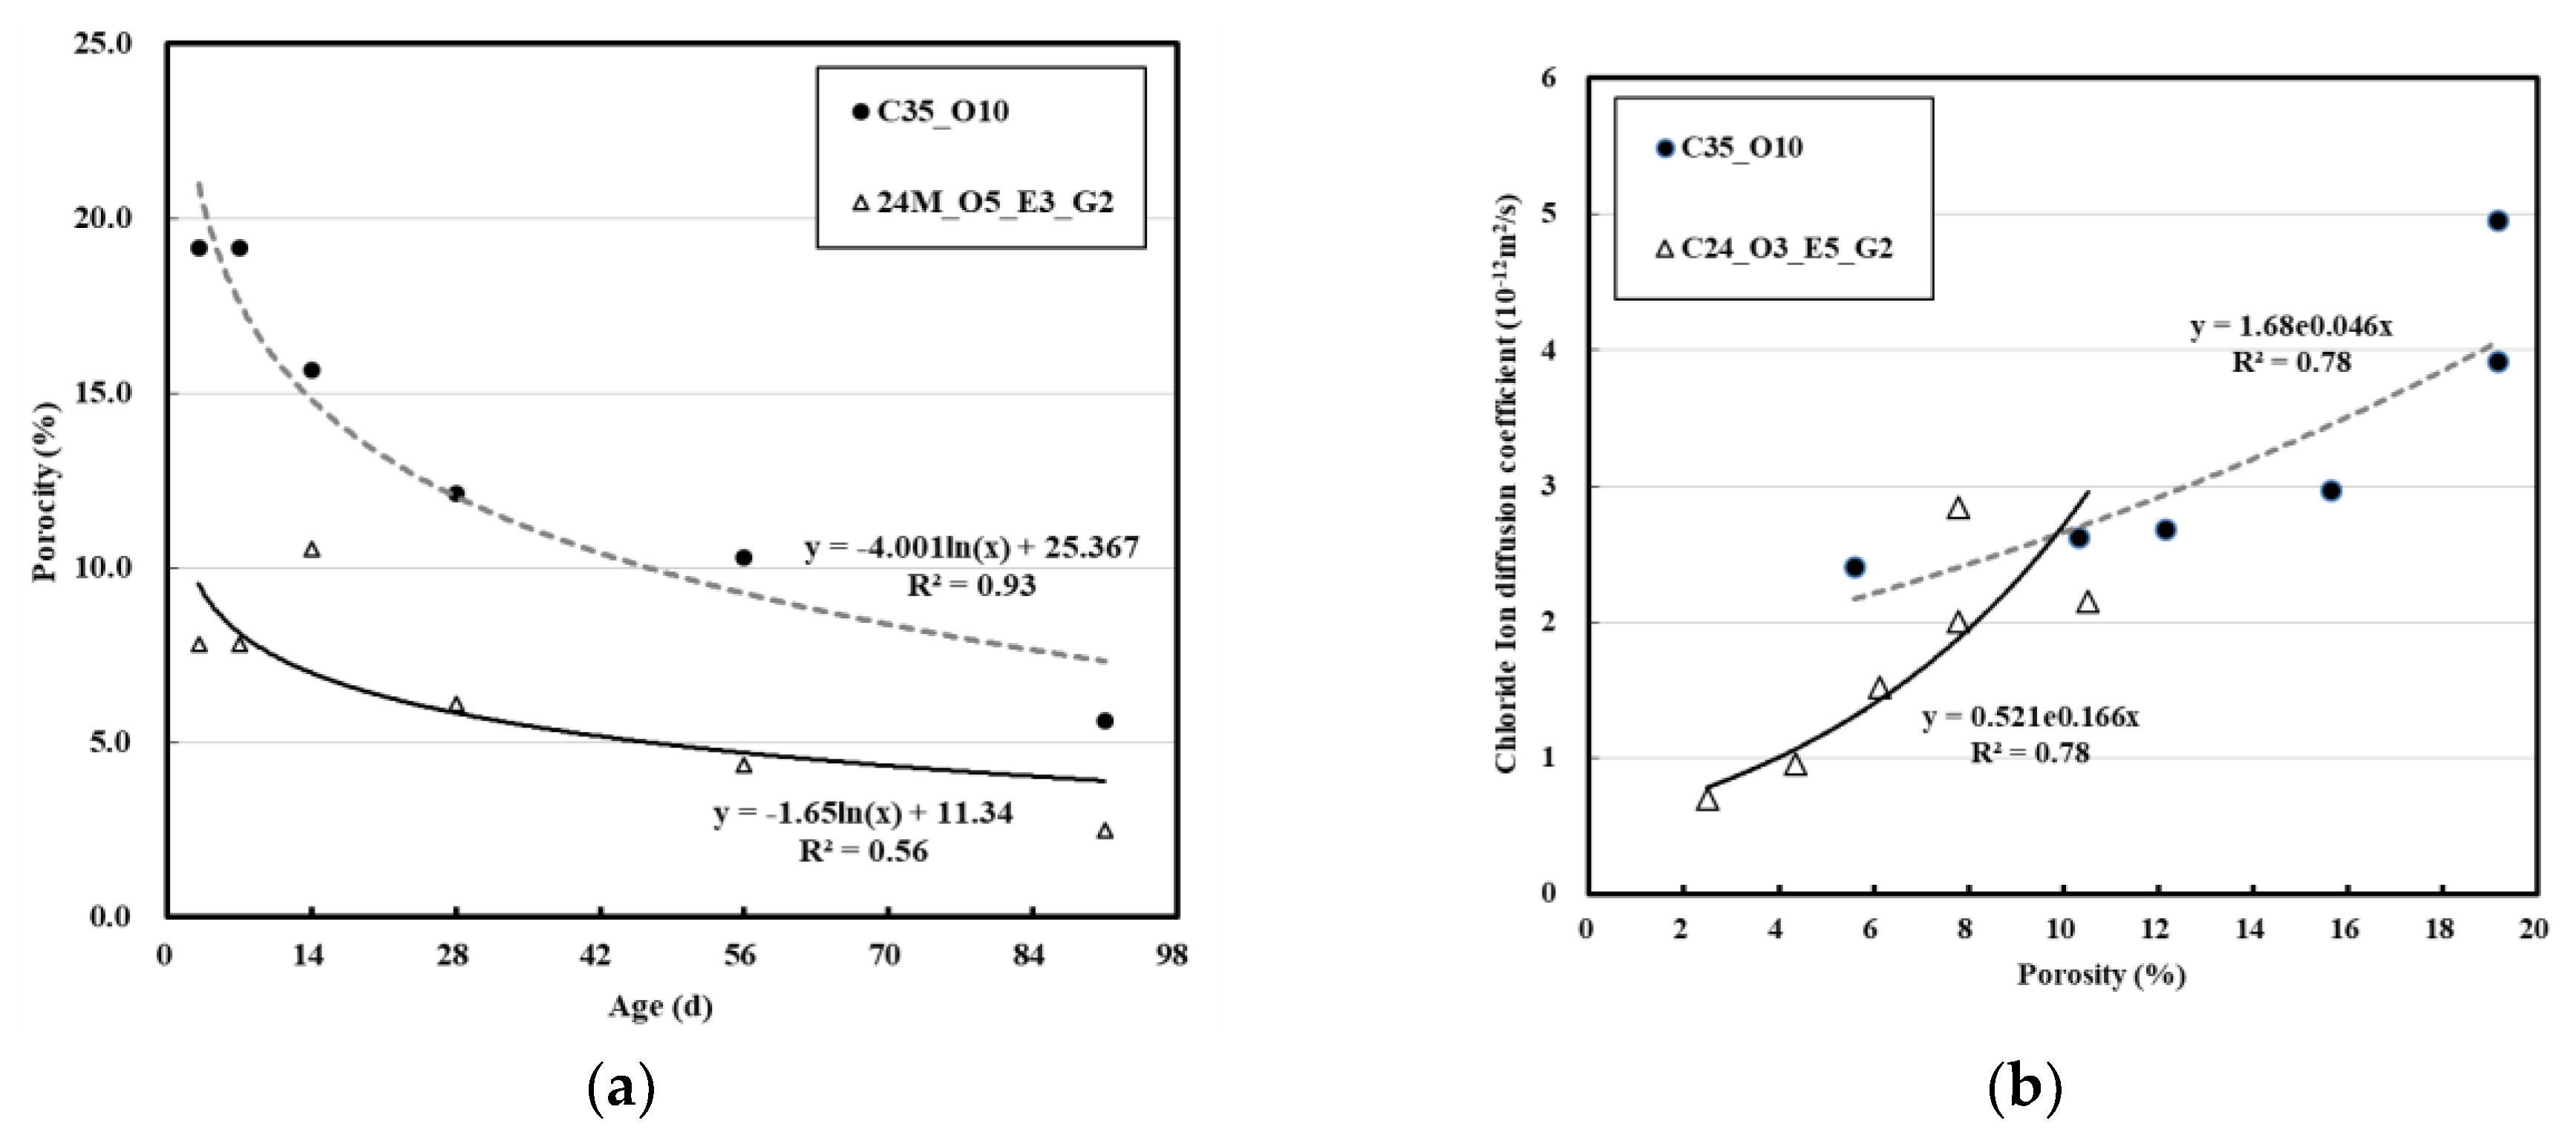
Figure 11a shows the internal porosity of concrete as a function of age. For C35_O10, the internal porosity of concrete slowly decreased from 20% of the total volume at early ages to 5.6% at 91 days. For C24_O3_E5_O2, the porosity decreased from 7.8% to 2.5%. Overall, C24_O3_E5_O2 exhibited a sharp reduction in porosity in the first 28 days, and the reduction continued even at long-term ages.
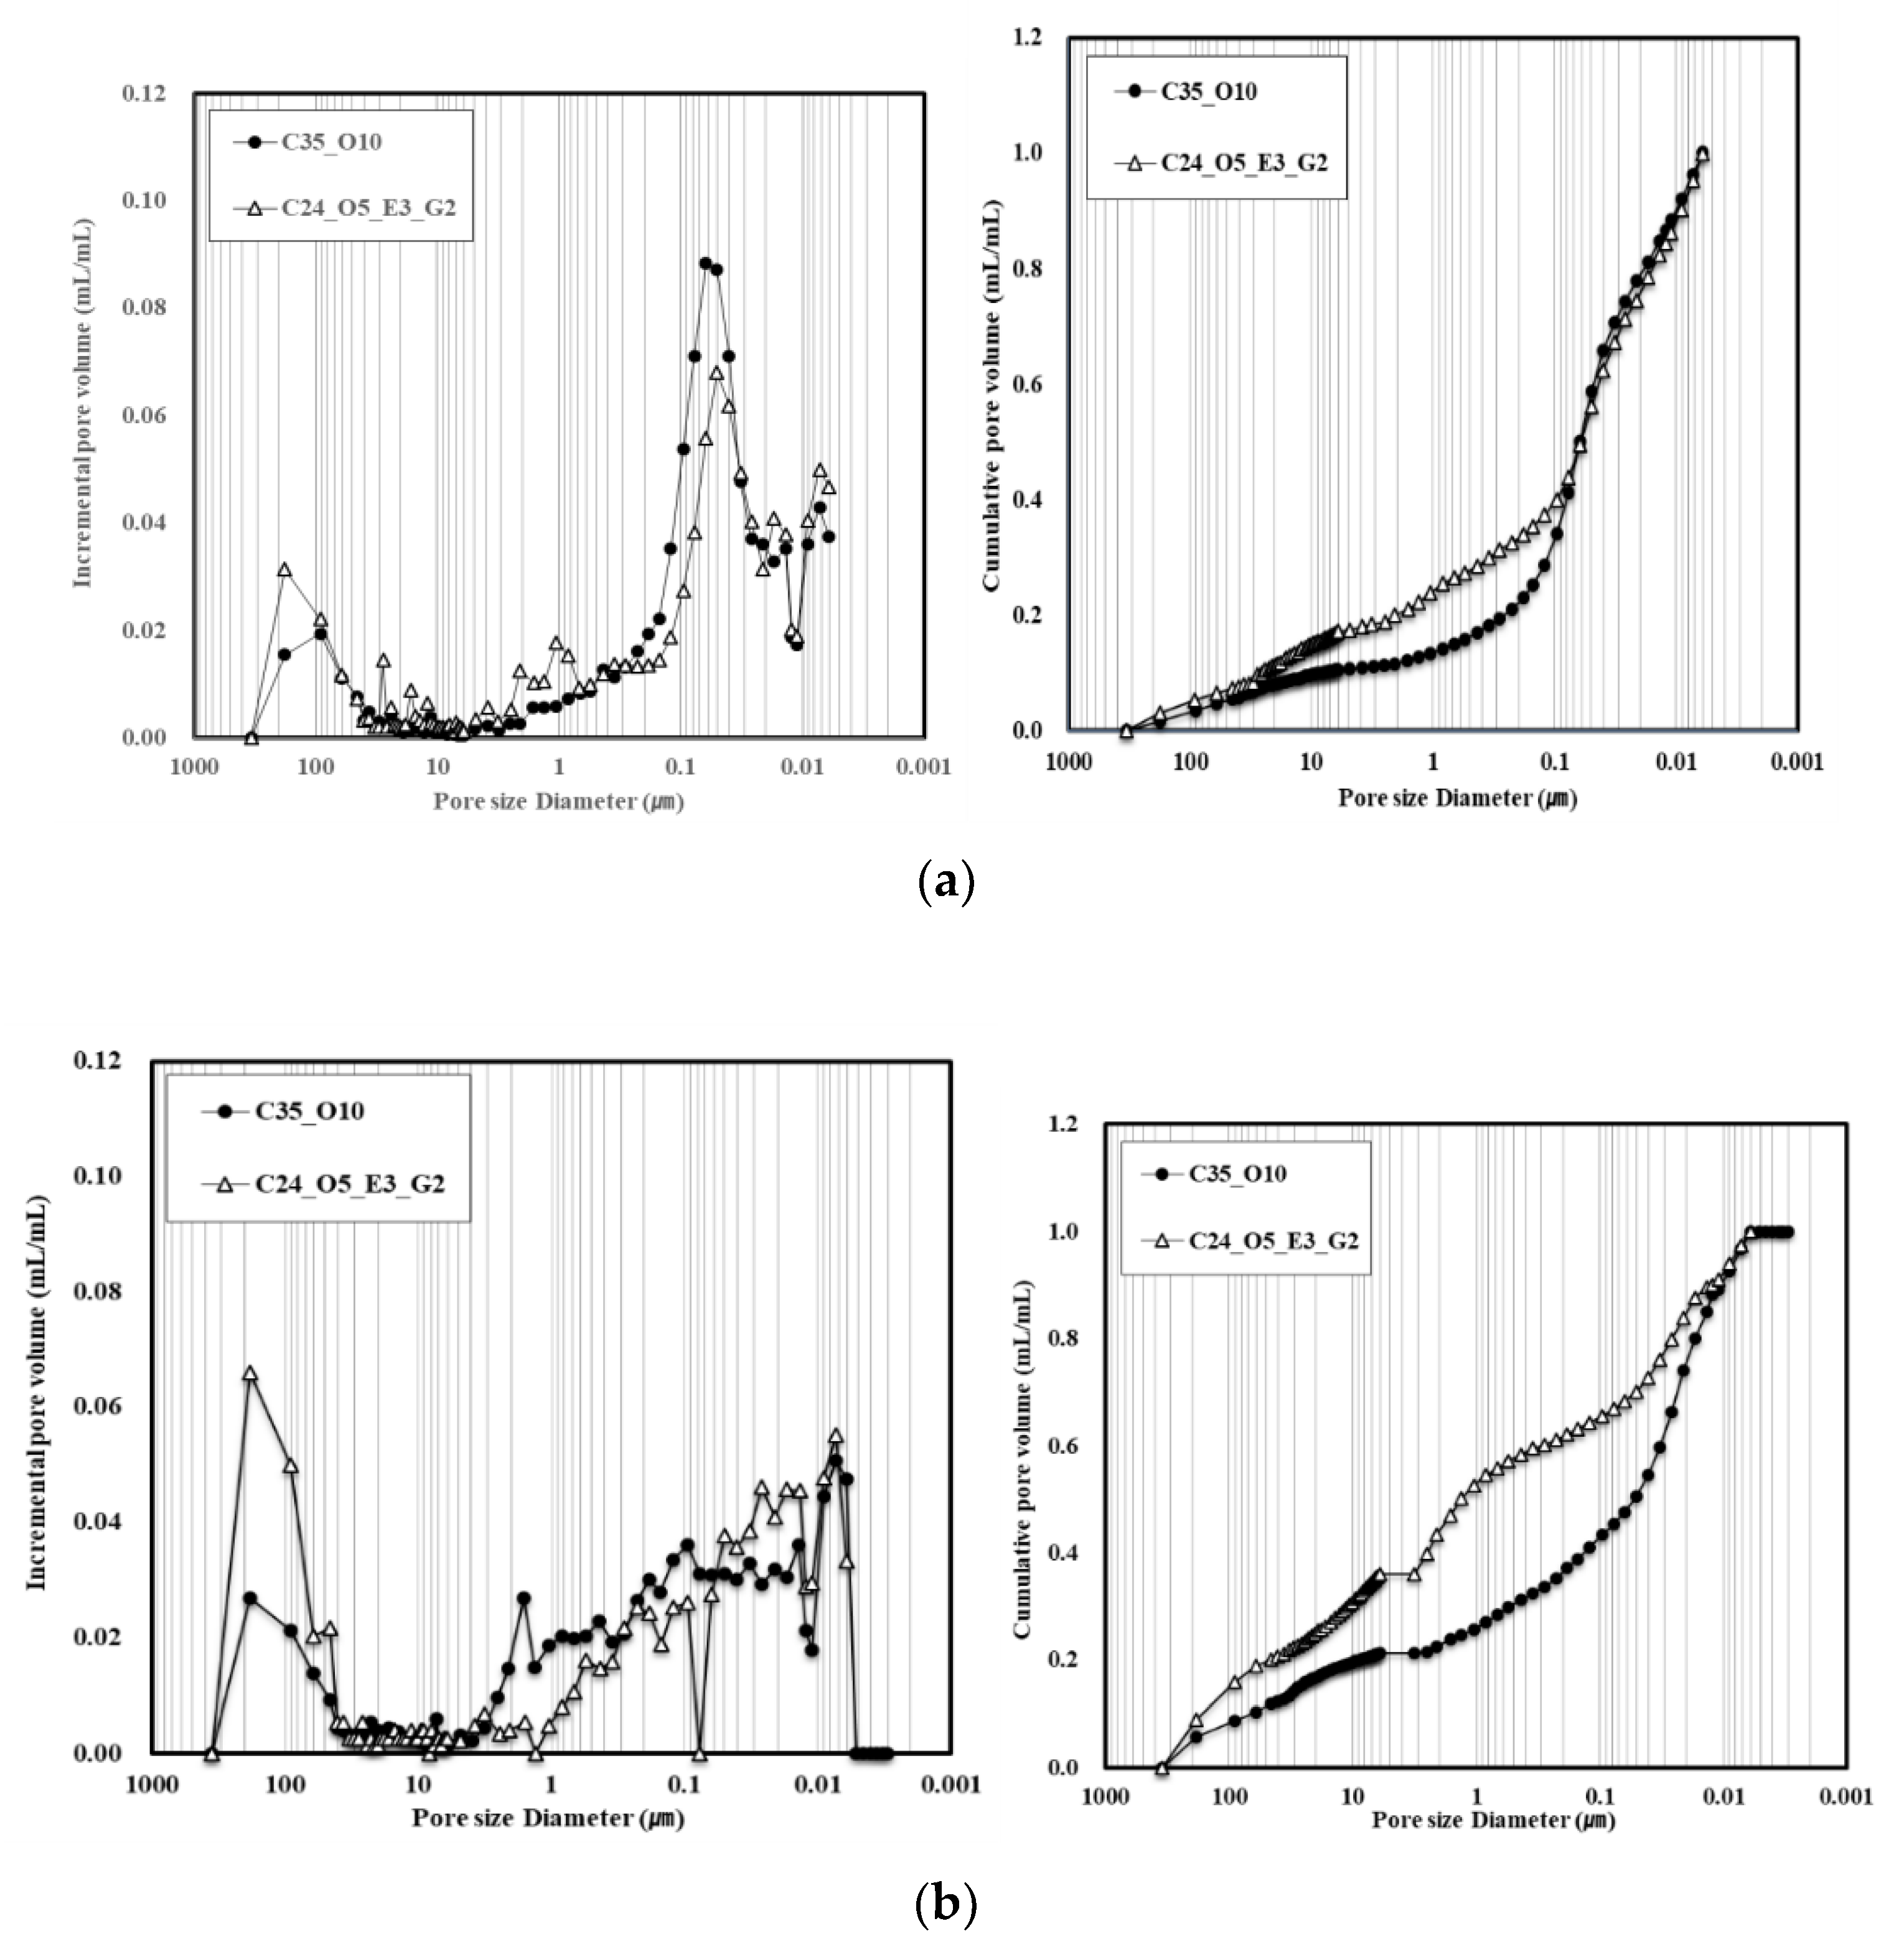
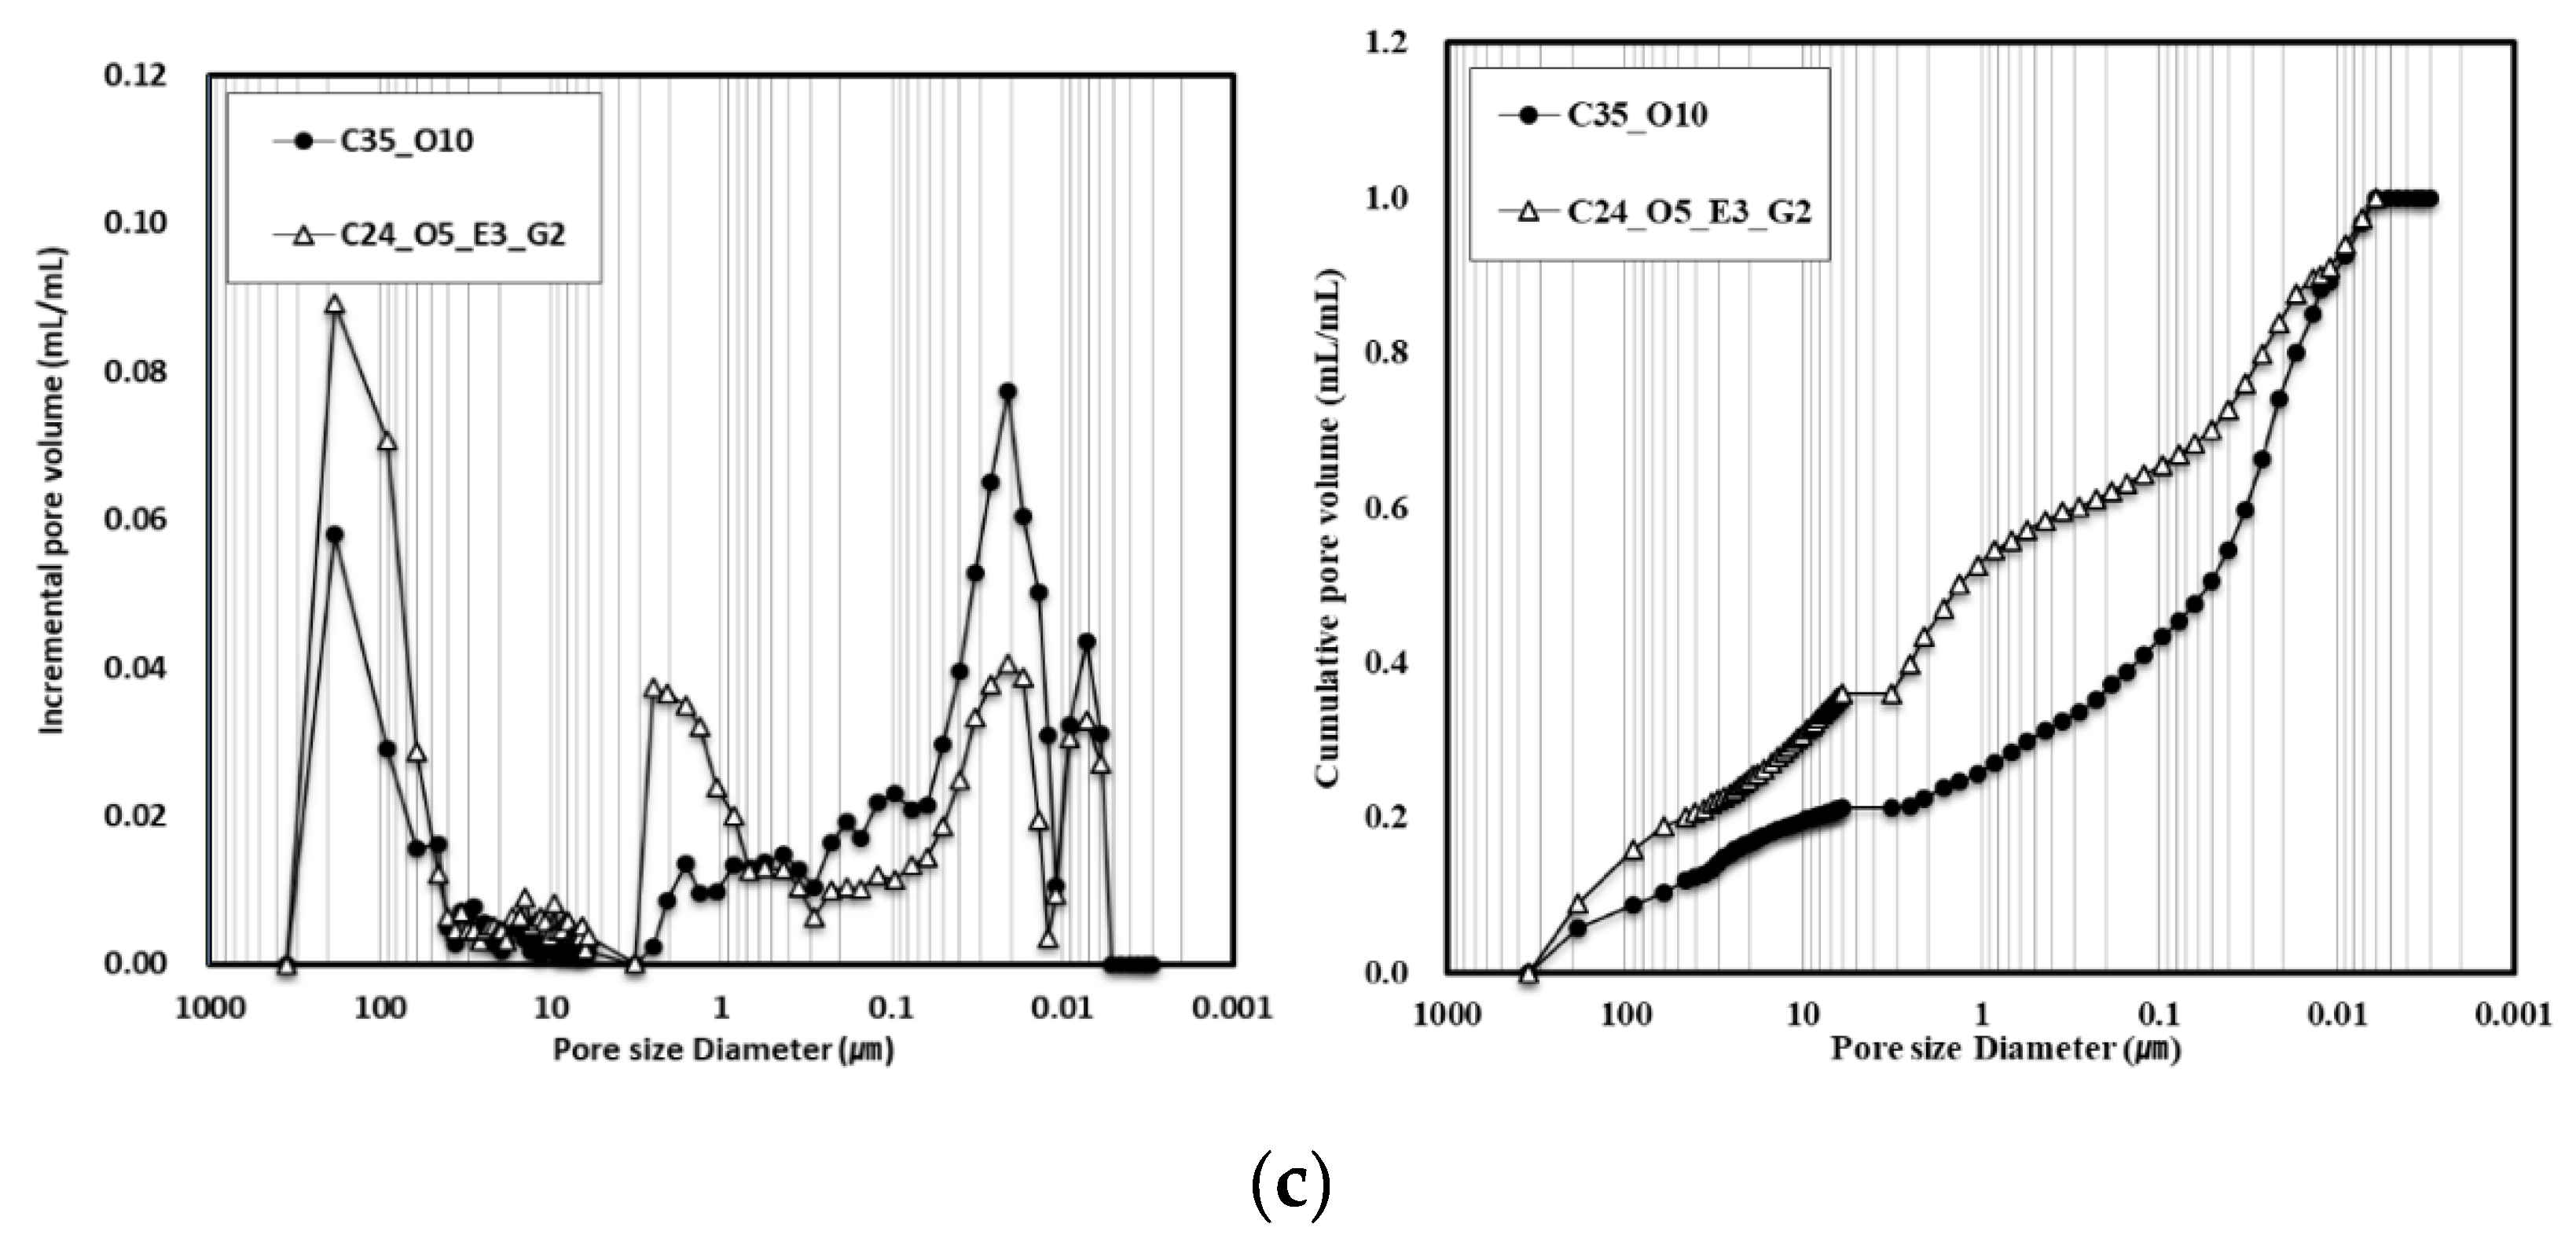
Figure 11b shows the relation between porosity and chloride ion diffusion coefficient. For C24_O3_E5_O2, the increase in watertightness due to the reduced porosity significantly reduced the chloride ion diffusion coefficient. Figure 12 shows the pore structure with age. Evidently, C35_O10 had more micropores smaller than 1 µm than C24_O3_E5_O2, indicating that the substitution with EPC and GGBS could not reduce micropores, even though it affected the reduction in overall porosity.
4. Conclusions
In this study, the chloride resistance of early-strength concrete prepared from a blended binder and PC-based chemical admixture was evaluated. The results are summarized as follows.
When EPC and GGBS were mixed and used as concrete binders and a PC-based superplasticizer was used, the early and long-term strength were found to improve, while the total amount of binders and the unit water content significantly decreased. When EPC and GGBS were used to replace part of the OPC binder, a strength increase of 40% was observed after one day, and of an average of 20% by day 91. Therefore, it is confirmed that not only the increase in early strength, but also the improvement in long-term strength is effective. These findings could be attributed to EPC having more C3S crystals and a higher SO3 content than OPC.
In addition, the chloride penetration depth and chloride ion diffusion coefficient confirmed that using EPC and GGBS rapidly developed the strength at early ages, thereby improving chloride resistance through the watertightness of the surface and the immobilization of chloride ions. The chloride ion diffusion coefficient was found to be about 50% lower than when using only OPC, and the chloride penetration depth test reduced by 40%.
The internal porosity of concrete was evaluated, revealing that EPC and GGBS could reduce the overall porosity, which could increase the watertightness of the concrete. The relationship between the overall porosity and chloride ion diffusion coefficient confirmed that using EPC and GGBS reduced the chloride ion diffusion coefficient. It appears, however, that substitution with EPC and GGBS could not reduce the number of micropores, even though they decreased the overall porosity.
The blended binder composition derived in this study and the application of the PC-based admixture are both expected to be used as basic data for the performance design of concrete mixes. They will also be useful for process control to increase the economic efficiency of concrete mixing and to avoid early form removal at actual sites. In this study, the concrete mixture using EPC, GGBS, and PC-based high-performance water reducing agent was examined as a commercialization study. Before applying this concrete on site, it is necessary to fully examine the concrete raw materials, workability in the field, and reproducibility of the early strength development according to the production in a batch plant.
Author Contributions
Conceptualization, T.L. and J.L.; investigation, T.L. and J.L.; resources, T.L.; writing—original draft, T.L.; writing—review and editing, T.L. and J.L. All authors have read and agreed to the published version of the manuscript.
Funding
This research received no external funding.
Conflicts of Interest
The authors declare no conflict of interest.
References
- Mehta, P.K.; Monteiro, P.J.M. Concrete: Microstructure, Properties, and Materials, 3rd ed.; McGraw-Hill: New York, NY, USA, 2006. [Google Scholar]
- Ismail, M.; Ohtsu, M. Corrosion rate of ordinary and high-performance concrete subjected to chloride attack by AC impedance spectroscopy. Constr. Build. Mater. 2006, 20, 458–469. [Google Scholar] [CrossRef]
- Hu, M.; Long, F.; Tang, M. The thaumasite form of sulfate attack in concrete of Yongan Dam. Concrete 2006, 36, 2006–2008. [Google Scholar]
- Ma, B.; Gao, X.; Byars, E.A.; Zhou, Q. Thaumasite formation in a tunnel of Bapanxia Dam in Western China. Cem. Concr. Res. 2006, 36, 716–722. [Google Scholar] [CrossRef]
- Neville, A.M. Properties of Concrete, 5th ed.; Trans-Atlantic, Publications, Inc.: Philadelphia, PA, USA, 2012. [Google Scholar]
- De Medeiros-Junior, R.A.; de Lima, M.G.; de Brito, P.C.; de Medeiros, M.H.F. Chloride penetration into concrete in an offshore platform-analysis of exposure conditions. Ocean. Eng. 2015, 103, 78–87. [Google Scholar] [CrossRef]
- Glass, G.K.; Buenfeld, N.R. The influence of chloride binding on the chloride induced corrosion risk in reinforced concrete. Corros. Sci. 2000, 42, 329–344. [Google Scholar] [CrossRef]
- Glass, G.K.; Stevenson, G.M.; Buenfeld, N.R. Chloride-binding isotherms from the diffusion cell test. Cem. Concr. Res. 1998, 28, 939–945. [Google Scholar] [CrossRef]
- Jensen, O.M.; Hansen, P.F.; Coats, A.M.; Glasser, F.P. Chloride ingress in cement paste and mortar. Cem. Concr. Res. 1999, 29, 1497–1504. [Google Scholar] [CrossRef]
- Li, L.Y.; Page, C.L. Modelling of electrochemical chloride extraction from concrete: Influence of ionic activity coefficients. Comput. Mater. Sci. 1998, 9, 303–308. [Google Scholar] [CrossRef]
- Li, D.W.; Li, L.Y.; Wang, X.F. Chloride diffusion model in concrete in marine environment with considering binding effect. Mar. Struct. 2019, 66, 44–51. [Google Scholar] [CrossRef] [Green Version]
- Korea Architectural Standard Specification Reinforced Concrete Work; Architectural Institute of Korea: Seoul, Korea, 2009.
- Japanese Architectural Standard Specification Reinforced Concrete Work JASS 5; Architectural Institute of Japan: Tokyo, Japan, 2009.
- ACI 318-99: Building Code Requirements for Structural Concrete; American Concrete Institute: Farmington Hills, MI, USA, 1999.
- Thomas, M.; Bremner, T. Performance of lightweight aggregate concrete containing slag after 25 years in a harsh marine environment. Cem. Concr. Res. 2012, 42, 358–364. [Google Scholar] [CrossRef]
- Song, H.-W.; Lee, C.-H.; Ann, K.Y. Factors influencing chloride transport in concrete structures exposed to marine environments. Cem. Concr. Compos. 2008, 30, 113–121. [Google Scholar] [CrossRef]
- Meira, G.R.; Andrade, C.; Padaratz, I.J.; Alonso, C.; Borba, J.C., Jr. Chloride penetration into concrete structures in the marine atmosphere zone—Relationship between deposition of chlorides on the wet candle and chlorides accumulated into concrete. Cem. Concr. Compos. 2007, 29, 667–676. [Google Scholar] [CrossRef]
- CEB-FIP Model Code 1990: Design Code; Thomas Telford Publishing: London, UK, 1993.
- BS EN 13670:2009, Execution of Concrete Structures; BSI: London, UK, 2010.
- ACI 201.2R-16: Guide to Durable Concrete; American Concrete Institute: New York, NY, USA, 2016.
- EN 1992-1-1: Eurocode 2: Design of Concrete Structures—Part 1-1: General Rules and Rules for Buildings; BSI: London, UK, 2004.
- Çakır, Ö.; Aköz, F. Effect of curing conditions on the mortars with and without GGBFS. Constr. Build. Mater. 2008, 22, 308–314. [Google Scholar] [CrossRef]
- Sojobi, A.O. Evaluation of the performance of eco-friendly lightweight interlocking concrete paving units incorporating sawdust wastes and laterite. Cogent Eng. 2016, 3, 1255168. [Google Scholar] [CrossRef]
- Rashad, A.M.; Sadek, D.M. An investigation on Portland cement replaced by high-volume GGBS pastes modified with micro-sized metakaolin subjected to elevated temperatures. Int. J. Sustain. Built Environ. 2017, 6, 91–101. [Google Scholar] [CrossRef] [Green Version]
- Özbay, E.; Erdemir, M.; Durmuş, H.İ. Utilization and efficiency of ground granulated blast furnace slag on concrete properties—A review. Constr. Build. Mater. 2016, 105, 423–434. [Google Scholar] [CrossRef]
- Uysal, M.; Sumer, M. Performance of self-compacting concrete containing different mineral admixtures. Constr. Build. Mater. 2011, 25, 4112–4120. [Google Scholar] [CrossRef]
- Mohan, A.; Mini, K.M. Strength and durability studies of SCC incorporating silica fume and ultra fine GGBS. Constr. Build. Mater. 2018, 171, 919–928. [Google Scholar] [CrossRef]
- Kavitha, S.; Kala, T.F. Evaluation of strength behavior of self-compacting concrete using alccofine and GGBS as partial replacement of cement. Indian J. Sci. Technol. 2016, 9, 1–5. [Google Scholar] [CrossRef]
- Juradin, S.; Vlajić, D. Influence of cement type and mineral additions, silica fume and metakaolin, on the properties of fresh and hardened self-compacting concrete. In Mechanical and Materials Engineering of Modern Structure and Component Design; Springer International Publishing: Cham, Switzerland, 2015; Volume 70, pp. 251–267. [Google Scholar]
- Huang, C.H.; Wu, C.H.; Lin, S.K.; Yen, T. Effect of slag particle size on fracture toughness of concrete. Appl. Sci. 2019, 9, 805. [Google Scholar] [CrossRef] [Green Version]
- Ganesh, P.; Murthy, A.R. Tensile behaviour and durability aspects of sustainable ultra-high performance concrete incorporated with GGBS as cementitious material. Constr. Build. Mater. 2019, 197, 667–680. [Google Scholar] [CrossRef]
- Reddy Suda, V.B.; Srininvasa Rao, P. Experimental investigation on optimum usage of micro silica and GGBS for the strength characteristics of concrete. Mater. Today Proc. 2020, in press. [Google Scholar]
- Bost, P.; Regnier, M.; Horgnies, M. Comparison of the accelerating effect of various additions on the early hydration of Portland cement. Constr. Build. Mater. 2016, 113, 290–296. [Google Scholar] [CrossRef]
- Kurihara, R.; Maruyama, I. Effects of heating and drying on the strength and stiffness of high-early-strength Portland cement pastes. Cem. Concr. Compos. 2020, 106, 103455. [Google Scholar] [CrossRef]
- Wen, X.-D.; Feng, L.; Hu, D.-Y.; Wang, K.; Zhang, Z. Effect of side-chain length in polycarboxylic superplasticizer on the early-age performance of cement-based materials. Constr. Build. Mater. 2019, 211, 26–32. [Google Scholar] [CrossRef]
- Li, P.; Ma, Z.; Li, X.; Lu, X.; Hou, P.; Du, P. Effect of gypsum on hydration and hardening properties of alite modified calcium sulfoaluminate cement. Materials 2019, 12, 3131. [Google Scholar] [CrossRef] [Green Version]
- Wang, Y.; Yu, L.; Wang, J.; Guan, X. Effects of aluminum sulfate and quicklime/fluorgypsum ratio on the properties of calcium sulfoaluminate (CSA) cement-based double liquid grouting materials. Materials 2019, 12, 1222. [Google Scholar] [CrossRef] [Green Version]
- Lee, J.; Lee, T. Influences of chemical composition and fineness on the development of concrete strength by curing conditions. Materials 2019, 12, 4061. [Google Scholar] [CrossRef] [Green Version]
- Pradeep Kumar, M.; Mini, K.M.; Rangarajan, M. Ultrafine GGBS and calcium nitrate as concrete admixtures for improved mechanical properties and corrosion resistance. Constr. Build. Mater. 2018, 18210, 249–257. [Google Scholar] [CrossRef]
- Luo, R.; Cai, Y.; Wang, C.; Huang, X. Study of chloride binding and diffusion in GGBS concrete. Cem. Concr. Res. 2003, 33, 1–7. [Google Scholar] [CrossRef]
- Sakai, Y. Relationship between pore structure and chloride diffusion in cementitious materials. Constr. Build. Mater. 2019, 229, 116868. [Google Scholar] [CrossRef]
Figure 1.
Particle size distribution of ordinary Portland cement (OPC), early Portland cement (EPC), and ground granulated blast-furnace slag (GGBS).
Figure 1.
Particle size distribution of ordinary Portland cement (OPC), early Portland cement (EPC), and ground granulated blast-furnace slag (GGBS).

Figure 2.
Scanning electron microscopy images: (a) OPC; (b) EPC; (c) GGBS.

Figure 3.
Gradation sieve analyses of the aggregates used: (a) coarse aggregate; (b) fine aggregate.
Figure 3.
Gradation sieve analyses of the aggregates used: (a) coarse aggregate; (b) fine aggregate.

Figure 4.
Test method of chloride penetration depth. (a) experimental setup of specimens; (b) test method.
Figure 4.
Test method of chloride penetration depth. (a) experimental setup of specimens; (b) test method.

Figure 5.
Test method of chloride ion diffusion coefficient. (a) experimental equipment; (b) test method; (c) measurement zone.
Figure 5.
Test method of chloride ion diffusion coefficient. (a) experimental equipment; (b) test method; (c) measurement zone.

Figure 6.
Compressive strength of concrete with age.

Figure 7.
X-ray diffraction patterns of GGBS, OPC, and EPC.

Figure 8.
(a) CaO/SO3 and (b) SO3/Al2O3 ratios according to binder type.

Figure 9.
(a) Chloride penetration depth by age; (b) relation between compressive strength and chloride penetration depth.
Figure 9.
(a) Chloride penetration depth by age; (b) relation between compressive strength and chloride penetration depth.

Figure 10.
(a) Chloride ion diffusion coefficient with age; (b) relation between compressive strength and chloride ion diffusion coefficient.
Figure 10.
(a) Chloride ion diffusion coefficient with age; (b) relation between compressive strength and chloride ion diffusion coefficient.

Figure 11.
(a) Internal porosity of concrete with age; (b) relation between the porosity and chloride ion diffusion coefficient.
Figure 11.
(a) Internal porosity of concrete with age; (b) relation between the porosity and chloride ion diffusion coefficient.

Figure 12.
Pore structure according to mercury intrusion porosimetry: (a) 7 days; (b) 28 days; (c) 91 days.
Figure 12.
Pore structure according to mercury intrusion porosimetry: (a) 7 days; (b) 28 days; (c) 91 days.


Table 1.
Physical properties of the used materials.
| Material | Property | |
|---|---|---|
| Cement | OPC | ASTM Type I ordinary Portland cement Density: 3150 kg/m3, fineness: 330 m2/kg, mean particle size: 19.46 µm |
| EPC | ASTM Type III early Portland cement Density: 3160 kg/m3, fineness: 488 m2/kg, mean particle size: 14.01 µm | |
| Mineral admixture | GGBS | Ground granulated blast-furnace slag Density: 2860 kg/m3, fineness: 430 m2/kg, mean particle size: 22.47 µm |
| Fine aggregate | S1 | Washed sea sand, size: 5 mm Fineness modulus: 2.01, density: 2600 kg/m3, absorption: 0.79% |
| S2 | Crushed sand, size: 5 mm Fineness modulus: 3.29, density: 2570 kg/m3, absorption: 0.87% | |
| Coarse aggregate | Crushed granitic aggregate Size: 25 mm, density: 2600 kg/m3, absorption: 0.76% | |
| Chemical admixture | NP | Naphthalene group, density: 1220 kg/m3 |
| PC | Polycarboxylic acid group, density: 1260 kg/m3 | |
Table 2.
Chemical compositions of the used binders.
| Materials | Chemical Compositions (%) | L.O.I. 4 | |||||||
|---|---|---|---|---|---|---|---|---|---|
| CaO | SiO2 | Al2O3 | Fe2O3 | MgO | K2O | SO3 | Others | ||
| OPC 1 | 60.34 | 19.82 | 4.85 | 3.30 | 3.83 | 1.08 | 2.90 | 0.86 | 3.02 |
| EPC 2 | 61.44 | 20.33 | 4.72 | 3.42 | 2.95 | 0.95 | 3.73 | 0.79 | 1.67 |
| GGBS 3 | 44.90 | 35.4 | 13.00 | 0.47 | 5.01 | 0.37 | 1.31 | - | 0.69 |
1 OPC: ordinary Portland cement; 2 EPC: early Portland cement; 3 GGBS: ground granulated blast-furnace slag; 4 L.O.I.: loss on ignition.
Table 3.
Binder type and proportions of concrete.
| Mix No. | OPC mix | W/B 1 | Total Unit Weight of Binder (kg/m3) | Proportion of Binder (%) | Chemical Admixture | ||
|---|---|---|---|---|---|---|---|
| OPC | EPC | GGBS | |||||
| C35_O10 | C35 2 | 0.42 | 444 | 100 | - | - | NP |
| C24_O3_E5_G2 | C24 3 | 0.50 | 340 | 30 | 50 | 20 | PC |
1 W/B: water/binder ratio; 2 characteristic strength: 35 MPa; 3 characteristic strength: 24 MPa.
Table 4.
Mixing proportions of concrete.
| Mix No. 1 | W/B 2 | S/A 3 (%) | Unit Weight (kg/m3) | NP (B×%) | PC (B×%) | |||||
|---|---|---|---|---|---|---|---|---|---|---|
| W 4 | OPC | EPC | GGBS | S 5 | G 6 | |||||
| C35_O10 | 0.42 | 48.5 | 185 | 444 | 908 | 919 | 0.7 | |||
| C24_O3_E5_G2 | 0.50 | 48.5 | 165 | 102 | 170 | 68 | 910 | 921 | 0.7 | |
1 See Table 3; 2 water/binder ratio; 3 sand/aggregate ratio; 4 water; 5 crushed sand; 6 gravel.
Table 5.
Test methods for each evaluation item.
| Evaluation Item | Test Method |
|---|---|
| Slump (mm) | ASTM C143 |
| Air contents (%) | ASTM C231 |
| Compressive strength (MPa) | ASTM C873; ASTM C39 |
| Chloride penetration depth (mm) | NT Build 443 |
| Chloride ion diffusion coefficient (m2/s) | NT Build 492 |
| Porosity (%) | ASTM D 4404 |
Table 6.
Fresh properties of concrete.
| Mix No. | Slump (mm) | Air Contents (%) | ||
|---|---|---|---|---|
| Initial | After 60 min | Initial | After 60 min | |
| C35_O10 | 195 | 160 | 4.6 | 4.6 |
| C24_O3_E5_G2 | 190 | 180 | 4.6 | 4.5 |
© 2020 by the authors. Licensee MDPI, Basel, Switzerland. This article is an open access article distributed under the terms and conditions of the Creative Commons Attribution (CC BY) license (http://creativecommons.org/licenses/by/4.0/).
Share and Cite
MDPI and ACS Style
Lee, T.; Lee, J. Evaluation of Chloride Resistance of Early-Strength Concrete Using Blended Binder and Polycarboxylate-Based Chemical Admixture. Appl. Sci. 2020, 10, 2972. https://0-doi-org.brum.beds.ac.uk/10.3390/app10082972
AMA Style
Lee T, Lee J. Evaluation of Chloride Resistance of Early-Strength Concrete Using Blended Binder and Polycarboxylate-Based Chemical Admixture. Applied Sciences. 2020; 10(8):2972. https://0-doi-org.brum.beds.ac.uk/10.3390/app10082972
Chicago/Turabian StyleLee, Taegyu, and Jaehyun Lee. 2020. "Evaluation of Chloride Resistance of Early-Strength Concrete Using Blended Binder and Polycarboxylate-Based Chemical Admixture" Applied Sciences 10, no. 8: 2972. https://0-doi-org.brum.beds.ac.uk/10.3390/app10082972
Note that from the first issue of 2016, this journal uses article numbers instead of page numbers. See further details here.