Transfer Learning with Deep Convolutional Neural Network (CNN) for Pneumonia Detection Using Chest X-ray

 ,
,  , , and
Abstract
:1. Introduction
2. Background of Deep Machine Learning Algorithms
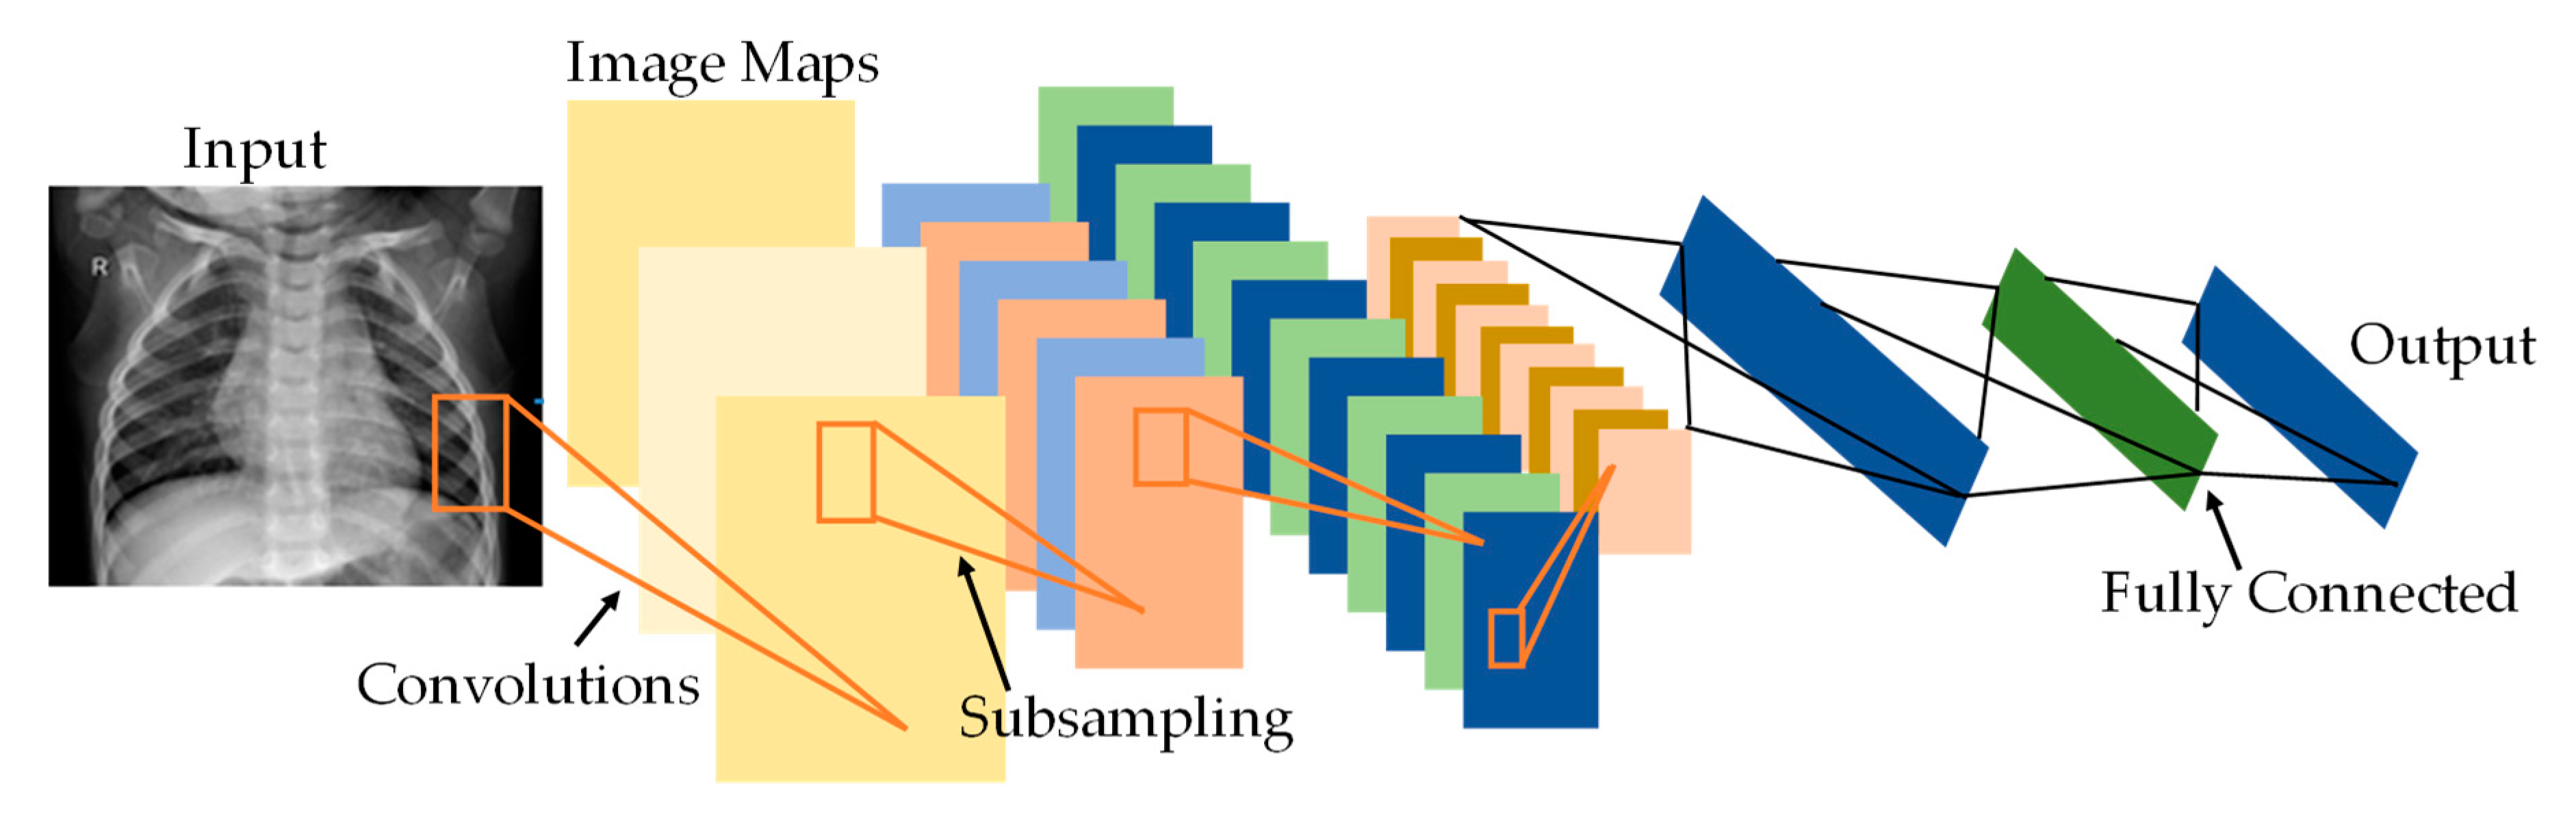
2.1. Convolutional Neural Networks (CNNs)
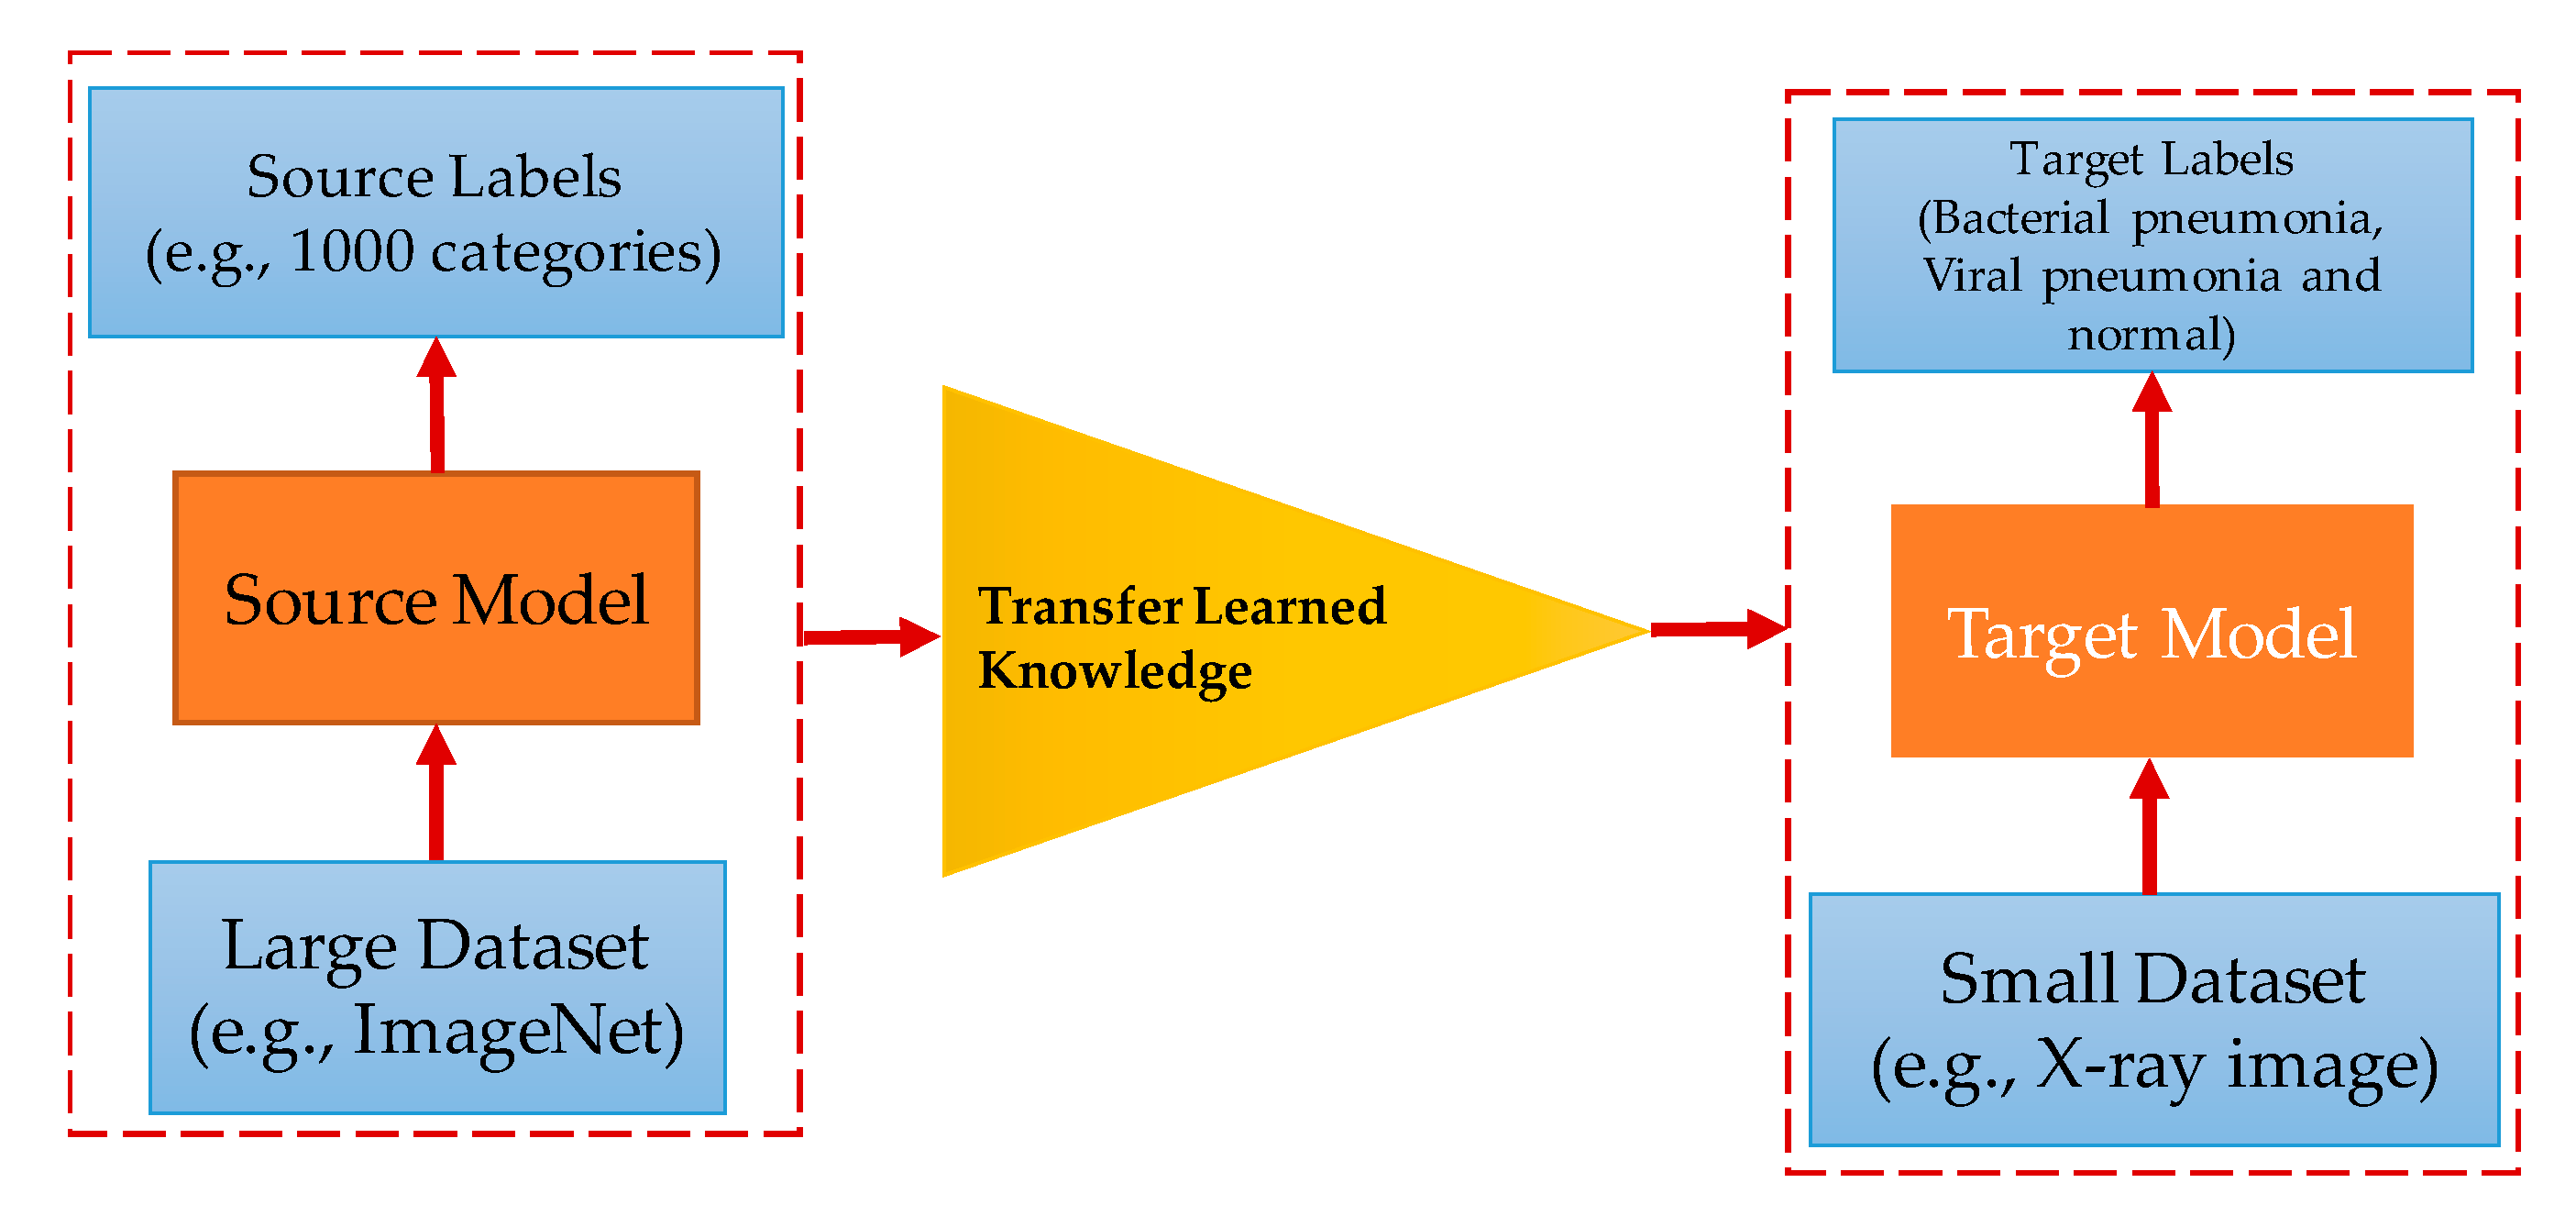
2.2. Deep Transfer Learning
2.3. Pre-Trained Convolutional Neural Networks
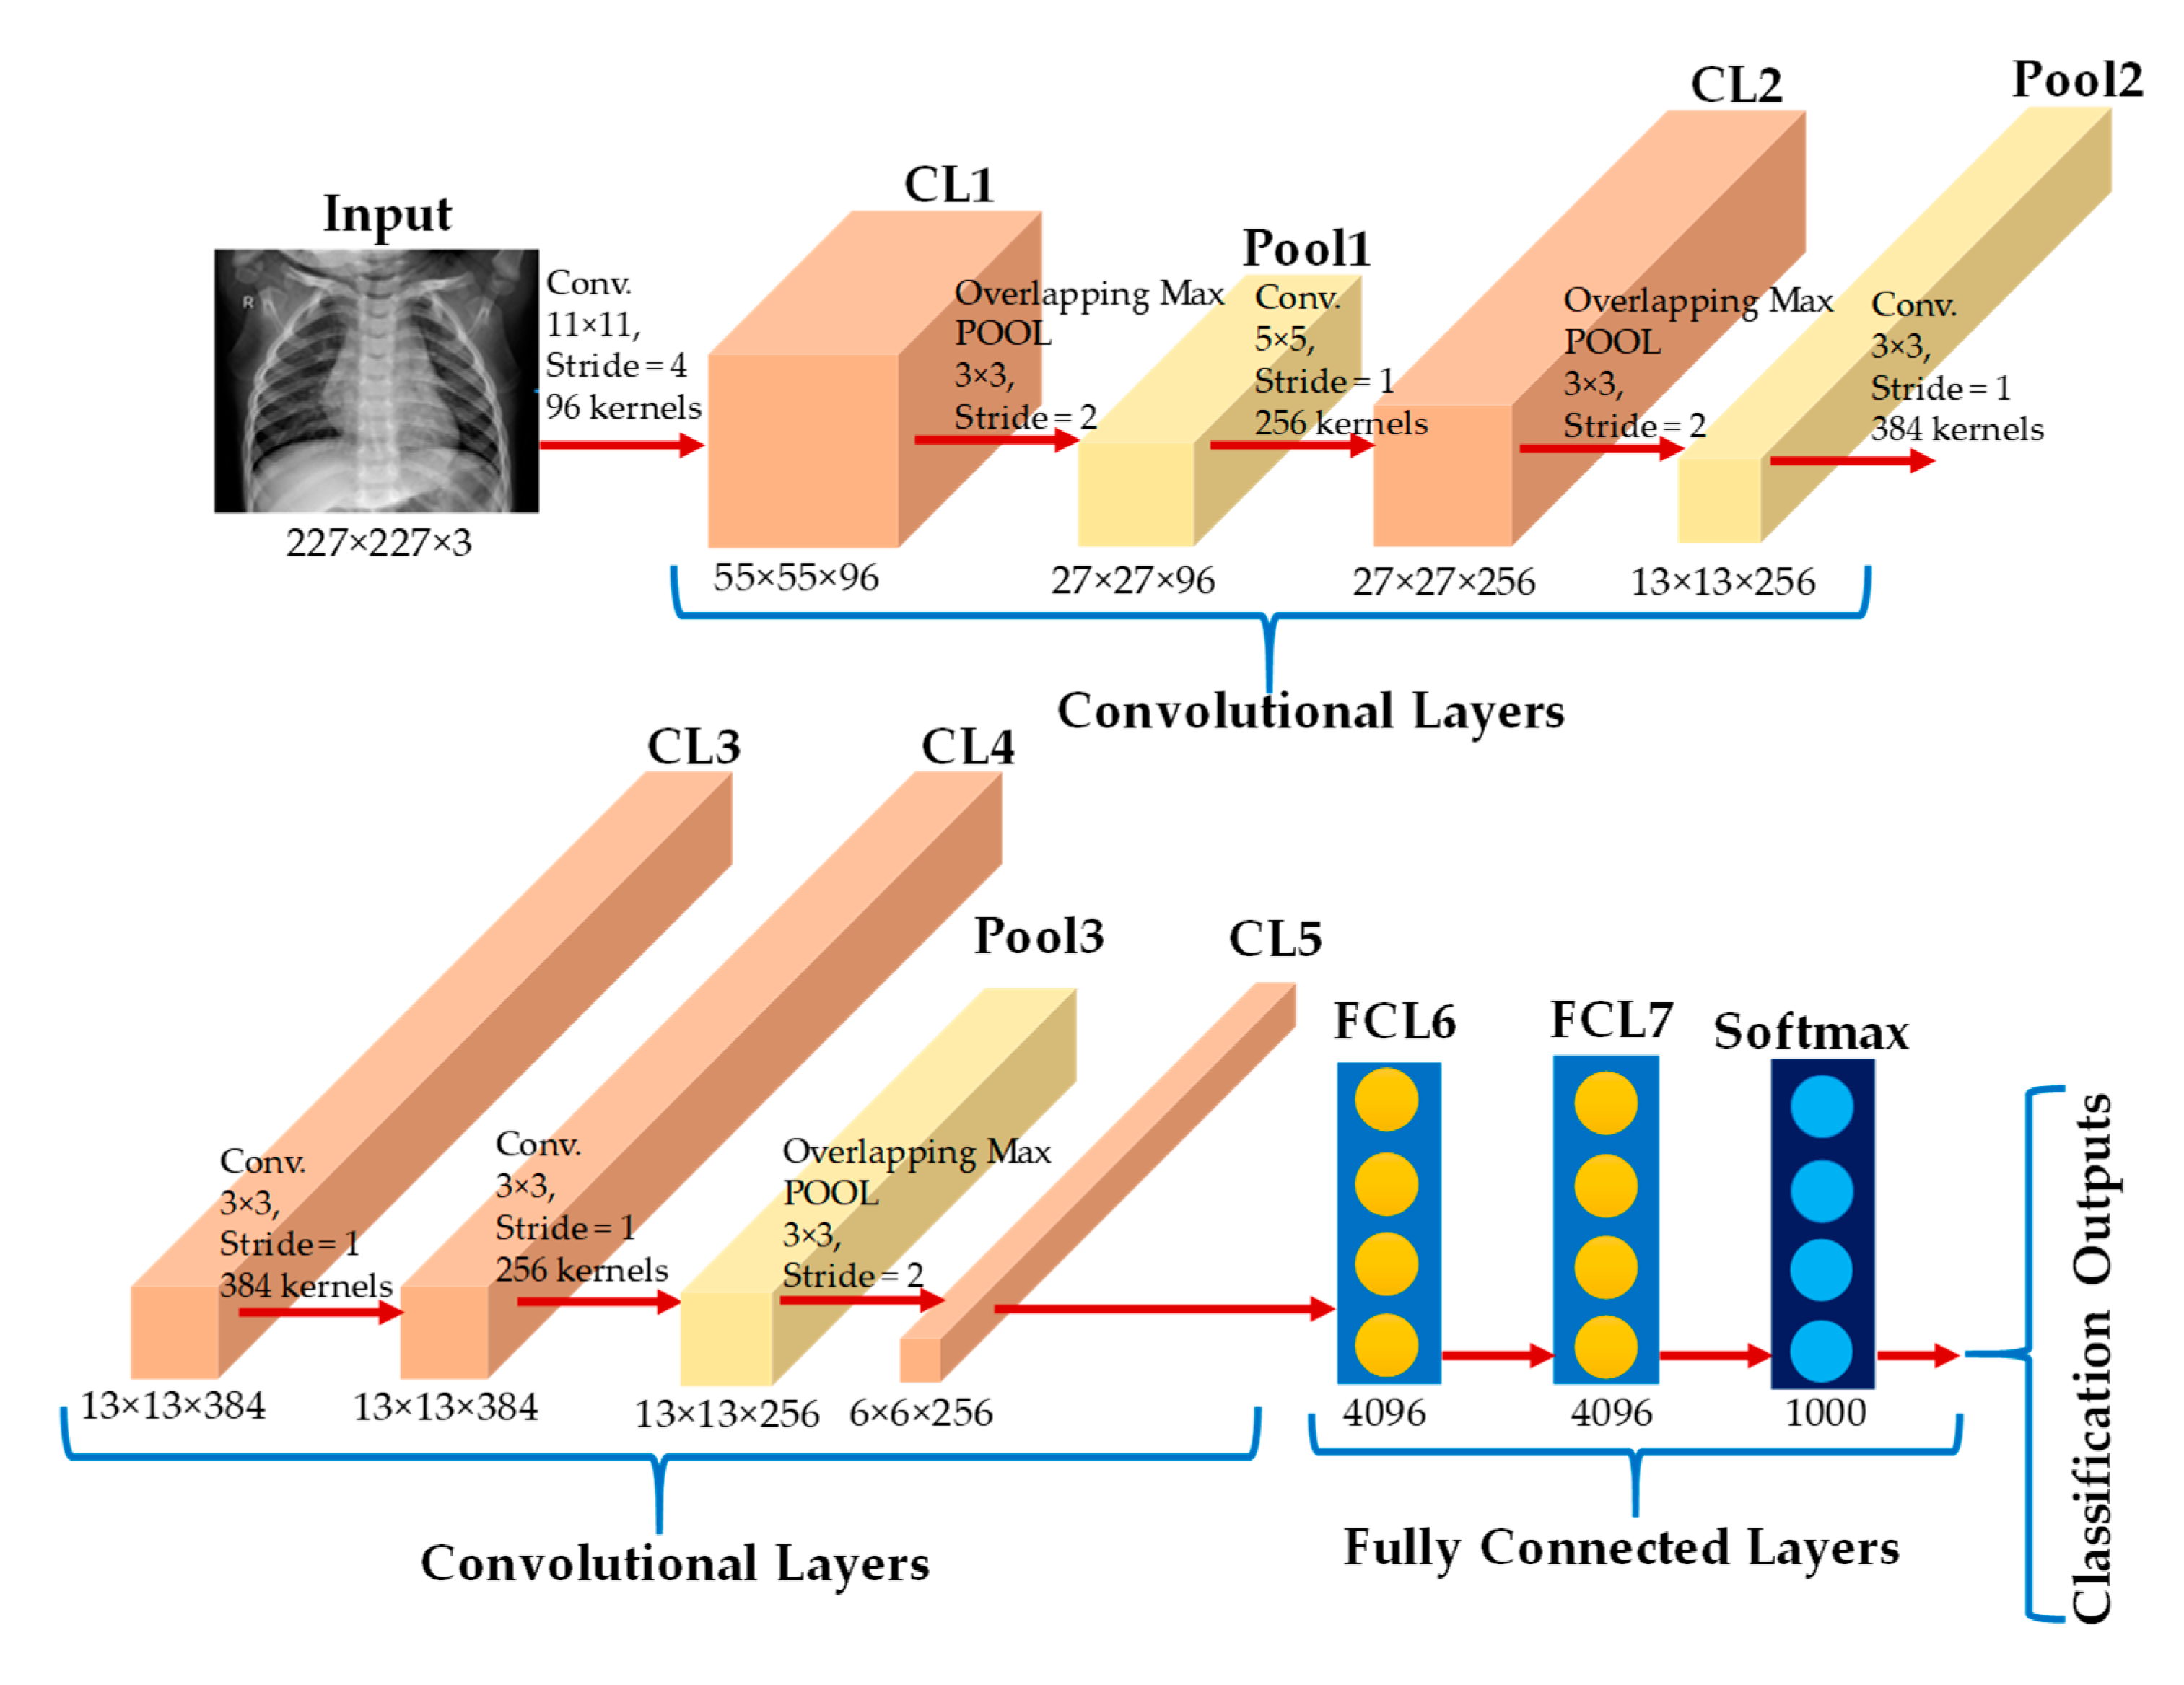
2.3.1. AlexNet
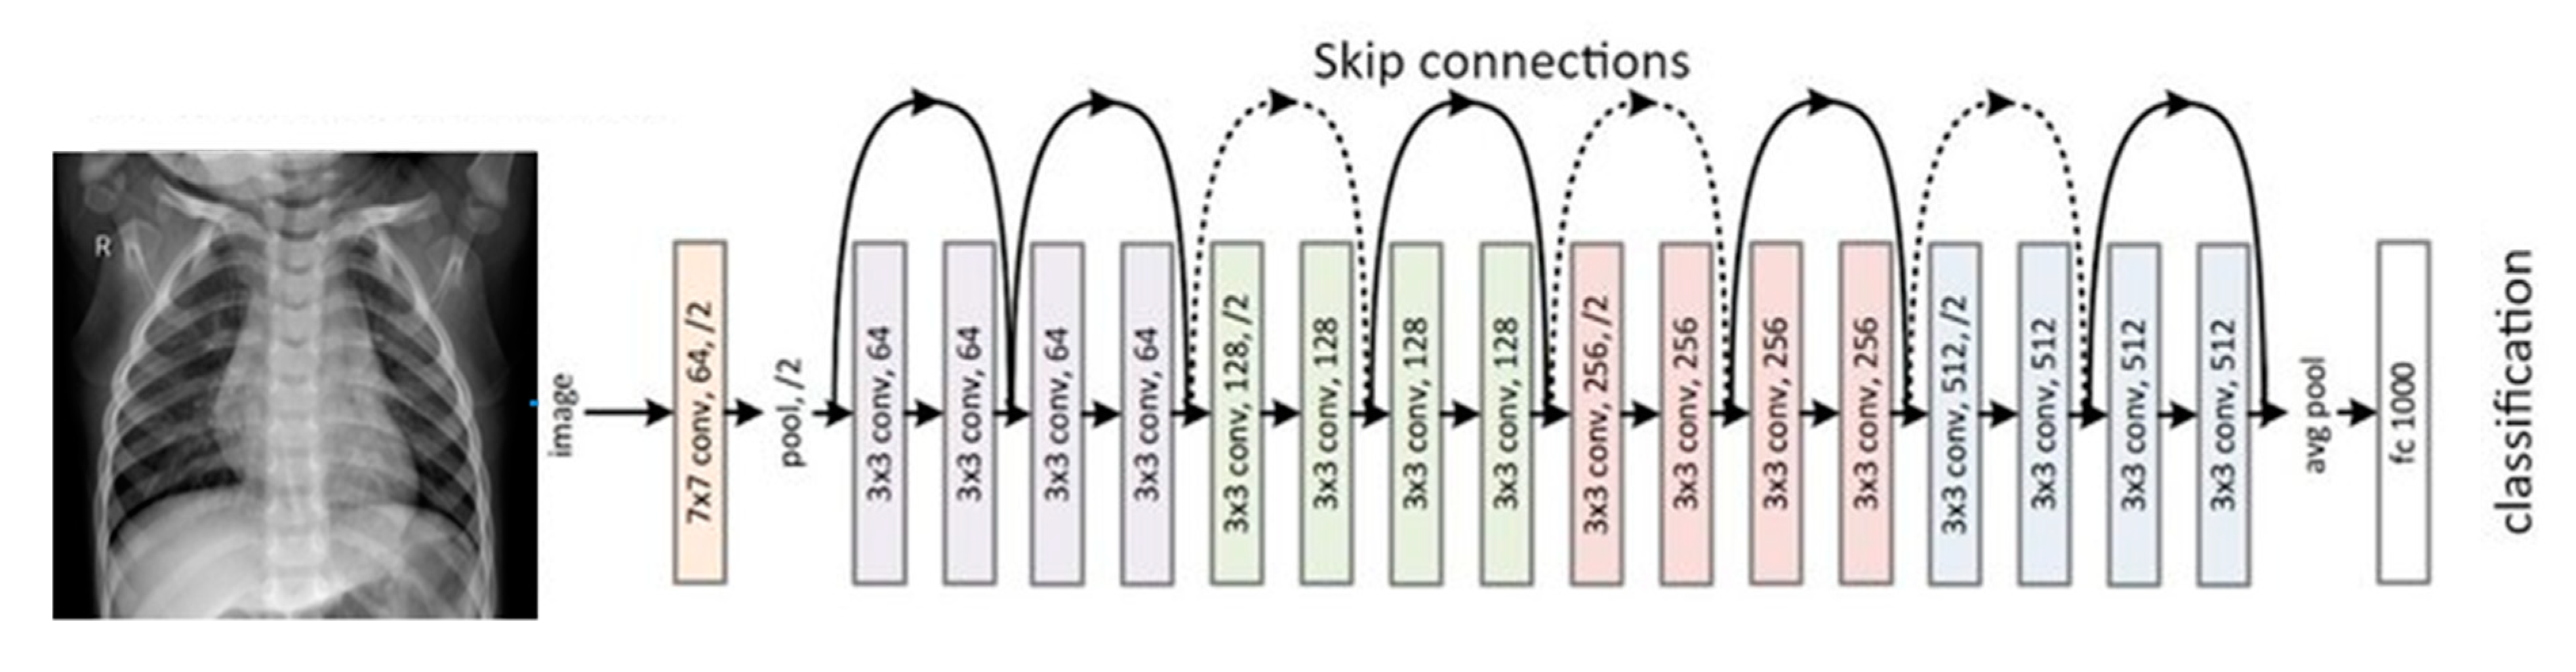
2.3.2. ResNet18
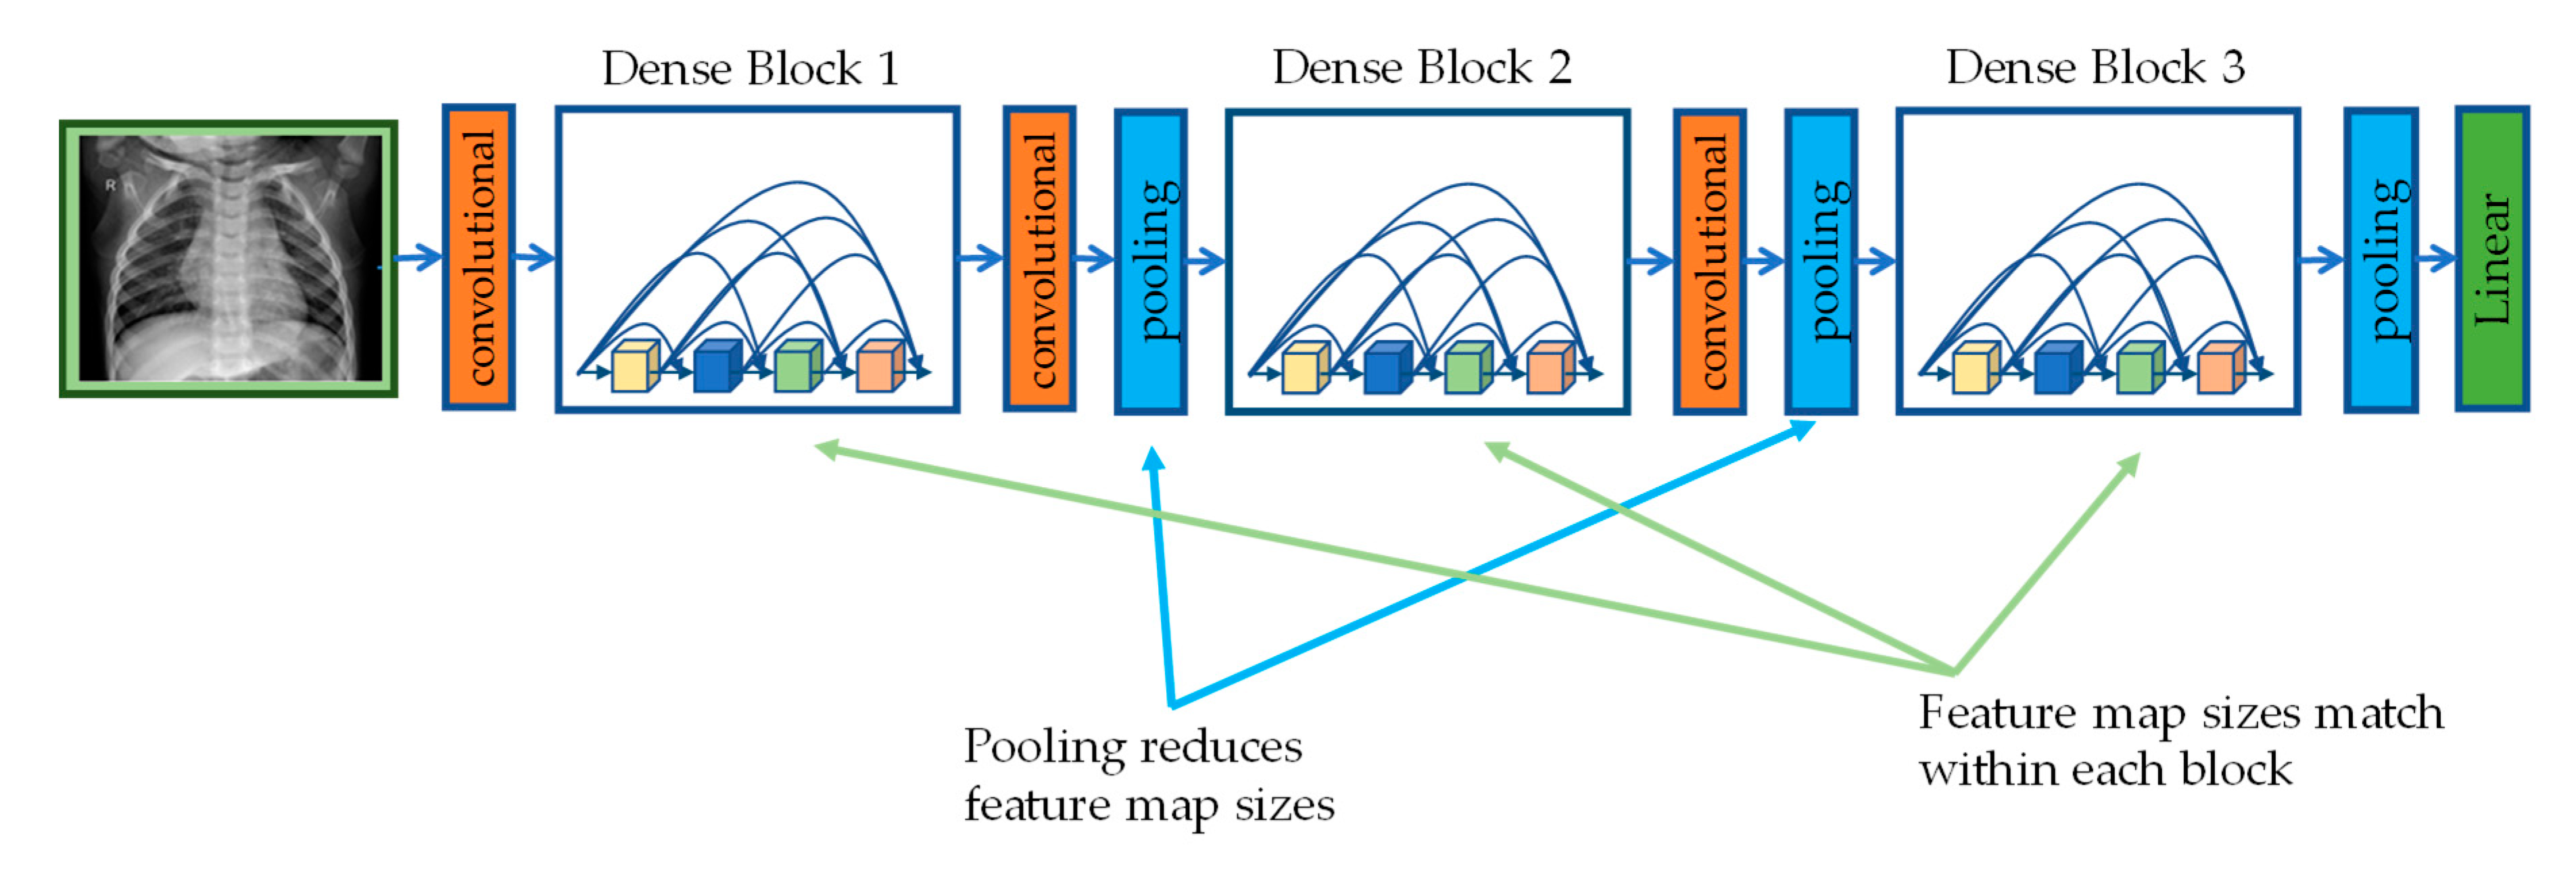
2.3.3. DenseNet201
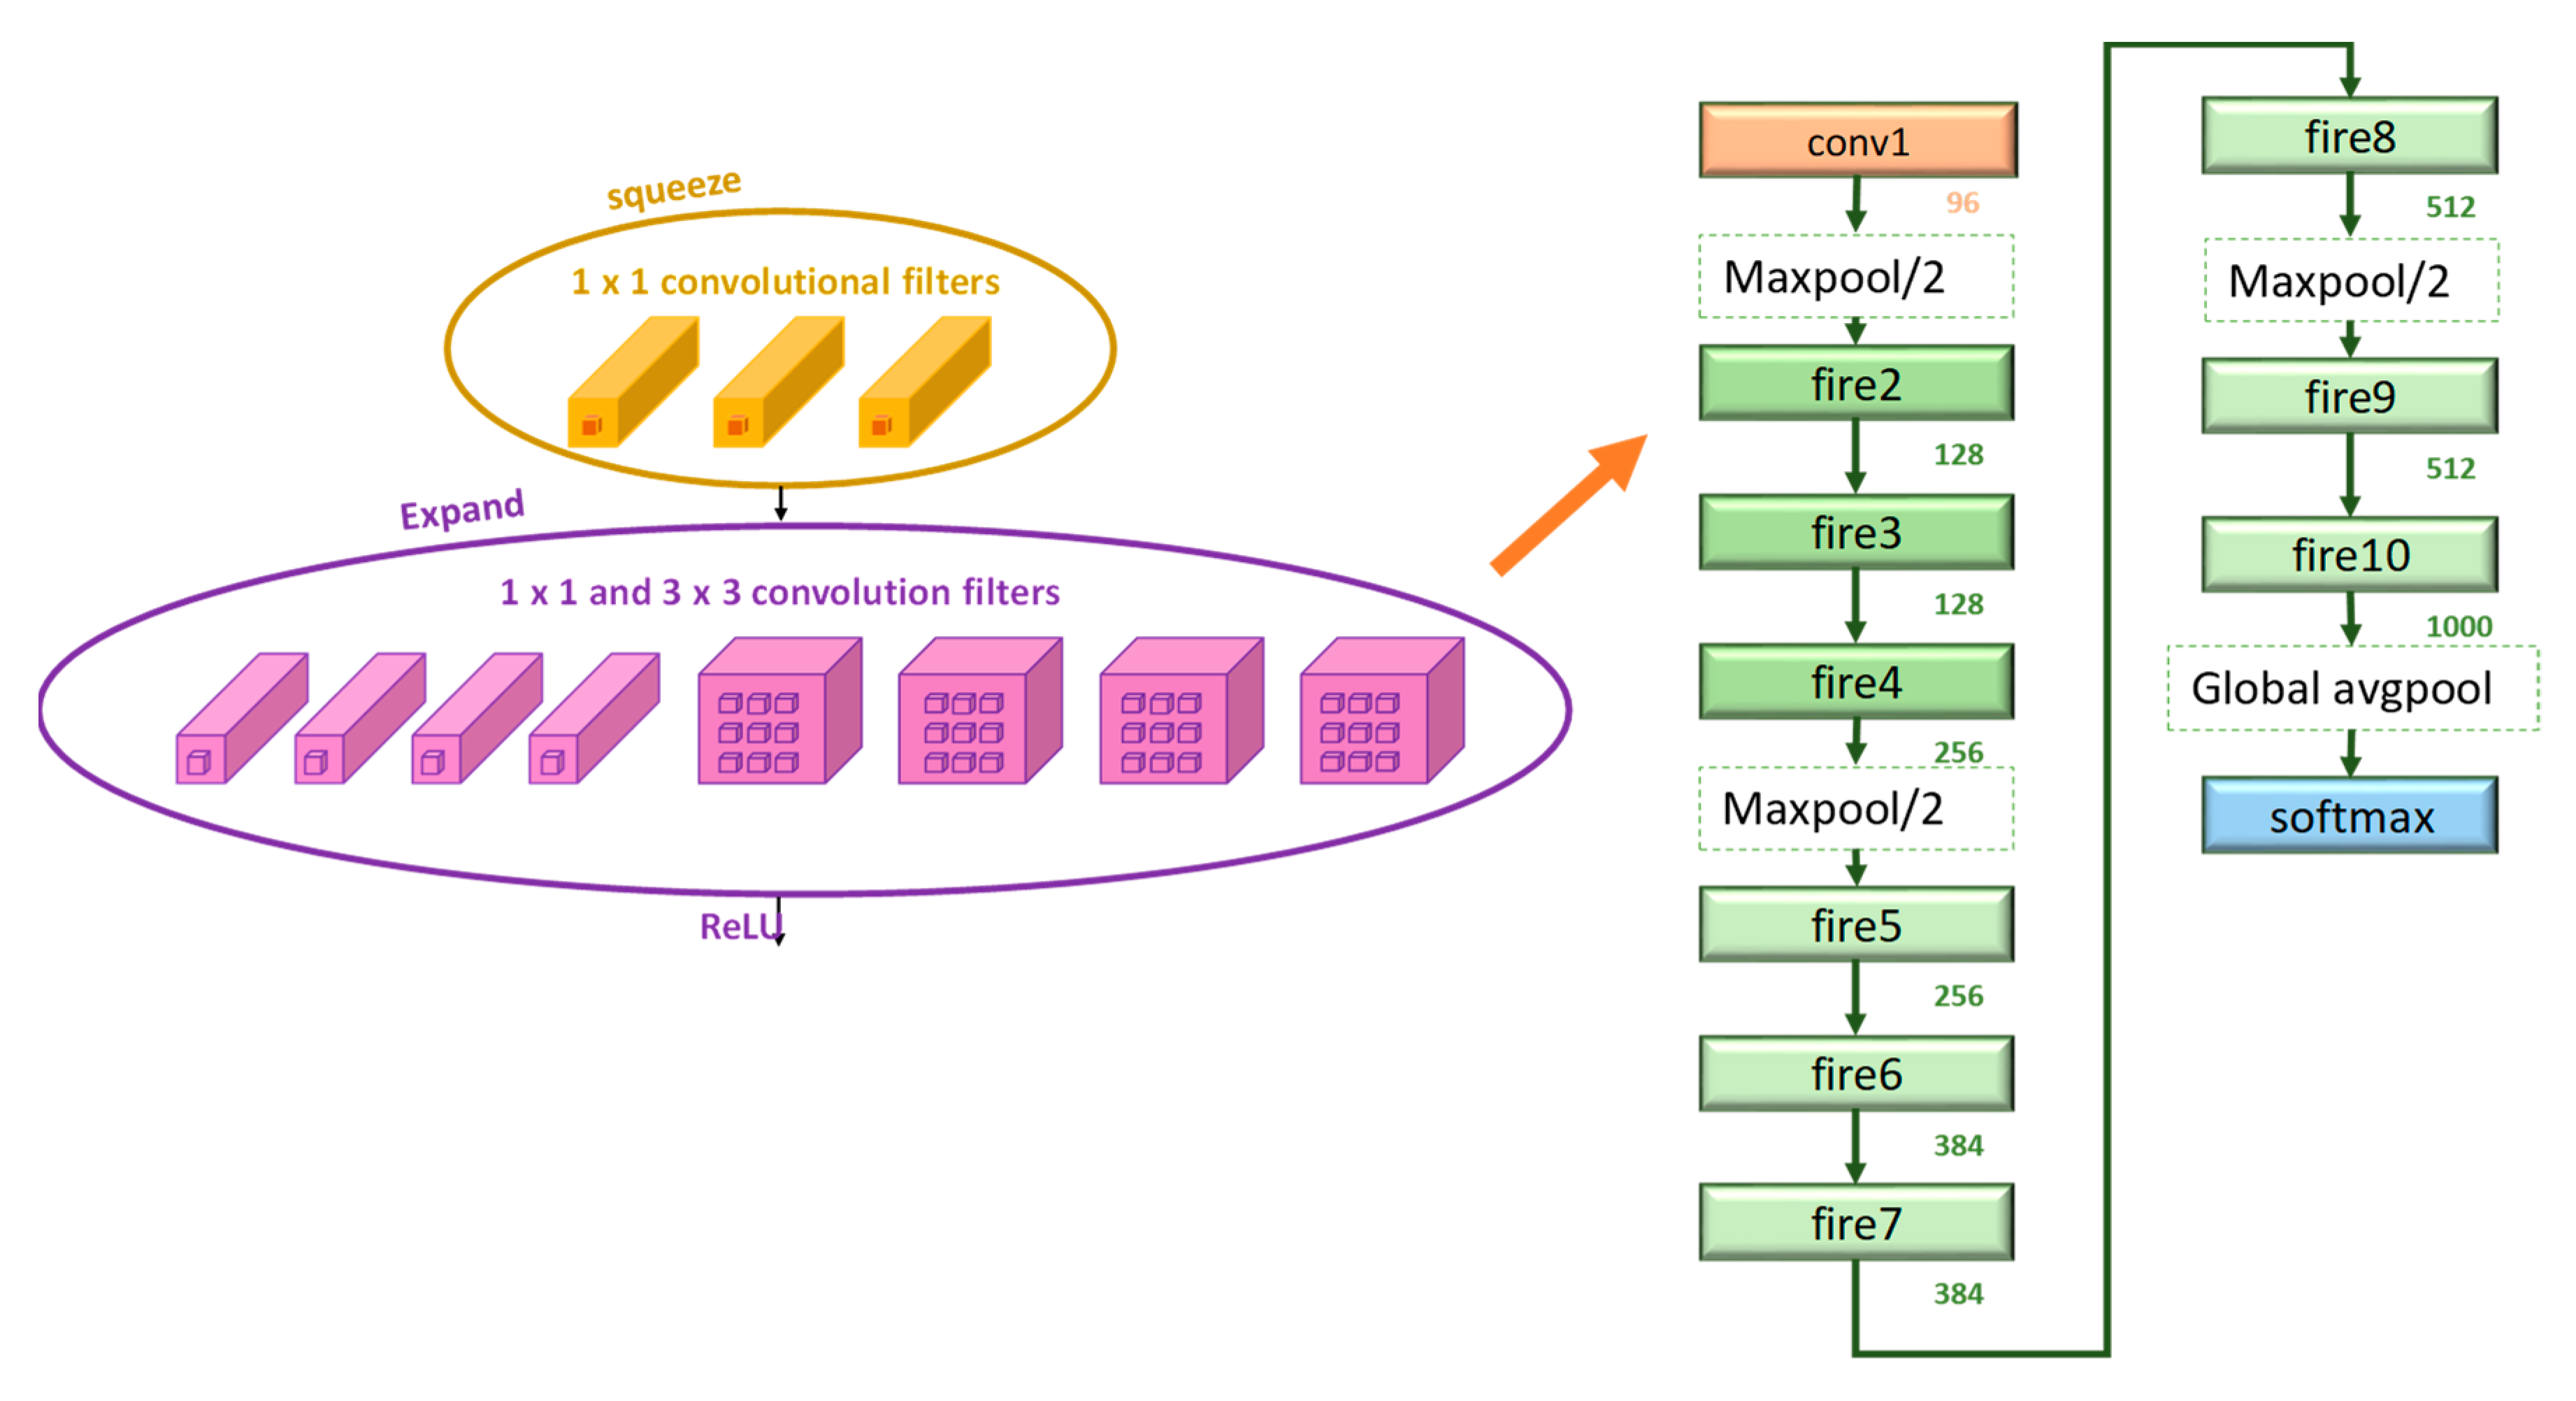
2.3.4. SqueezeNet
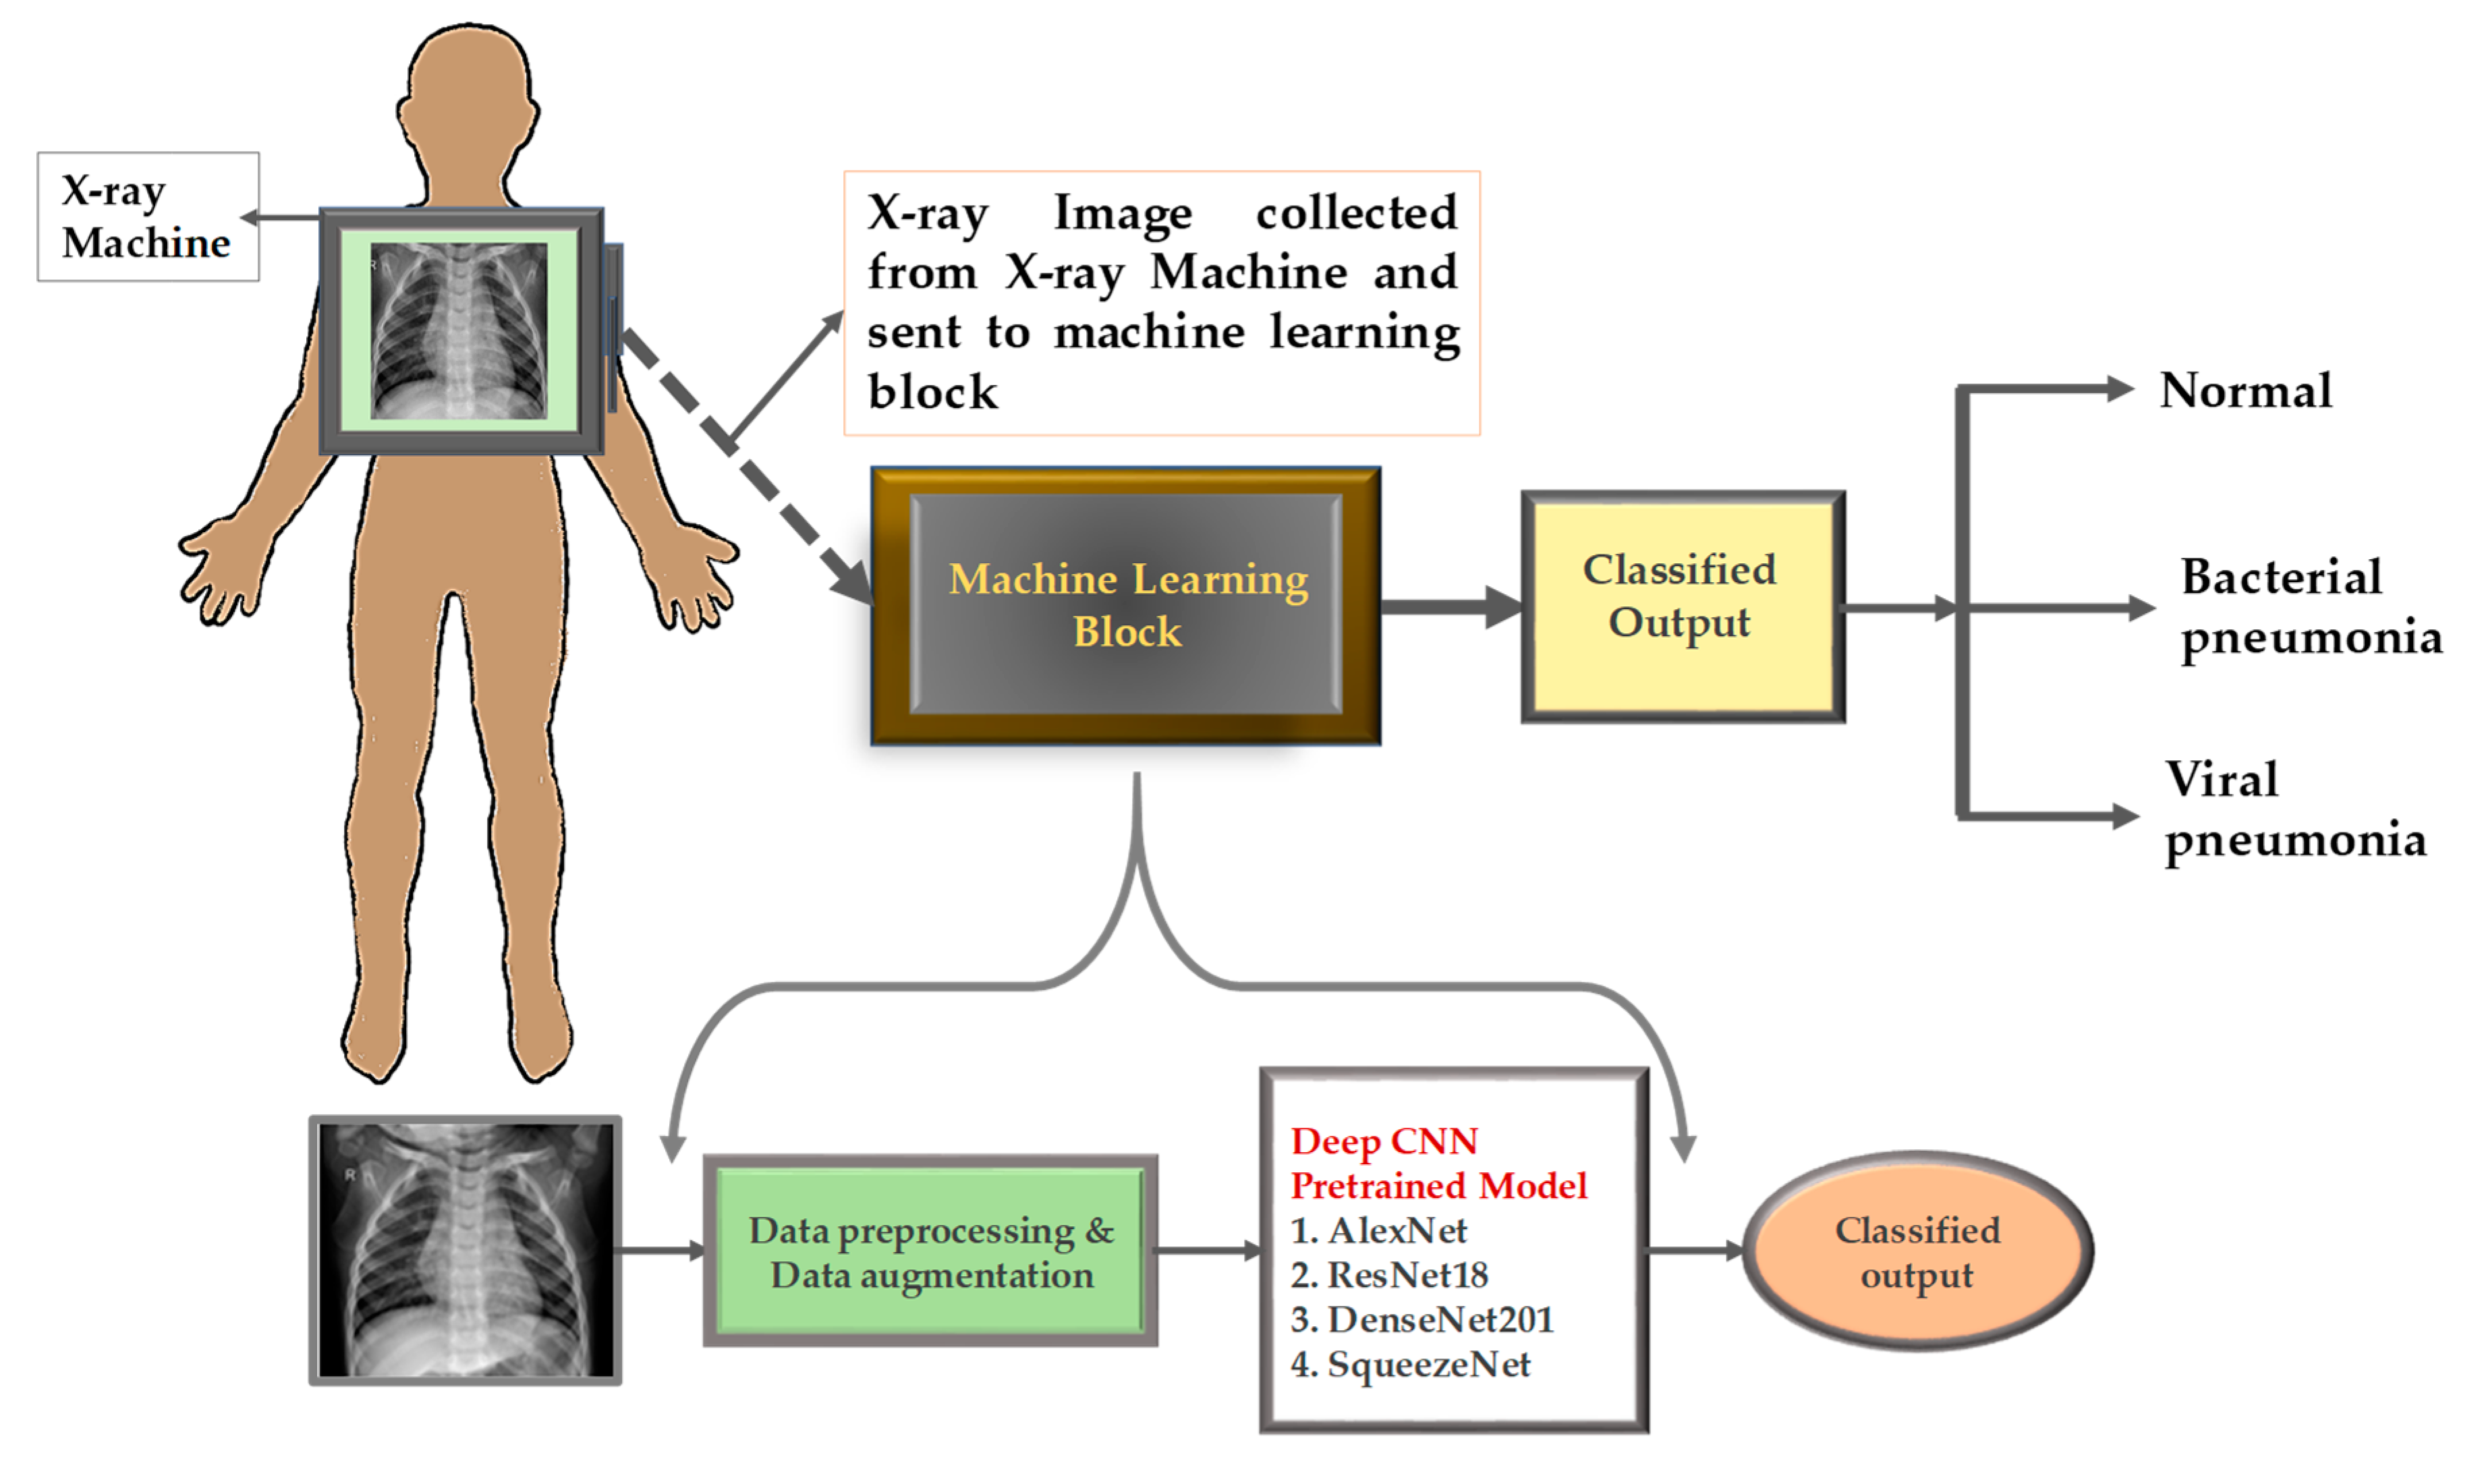
3. Methodology
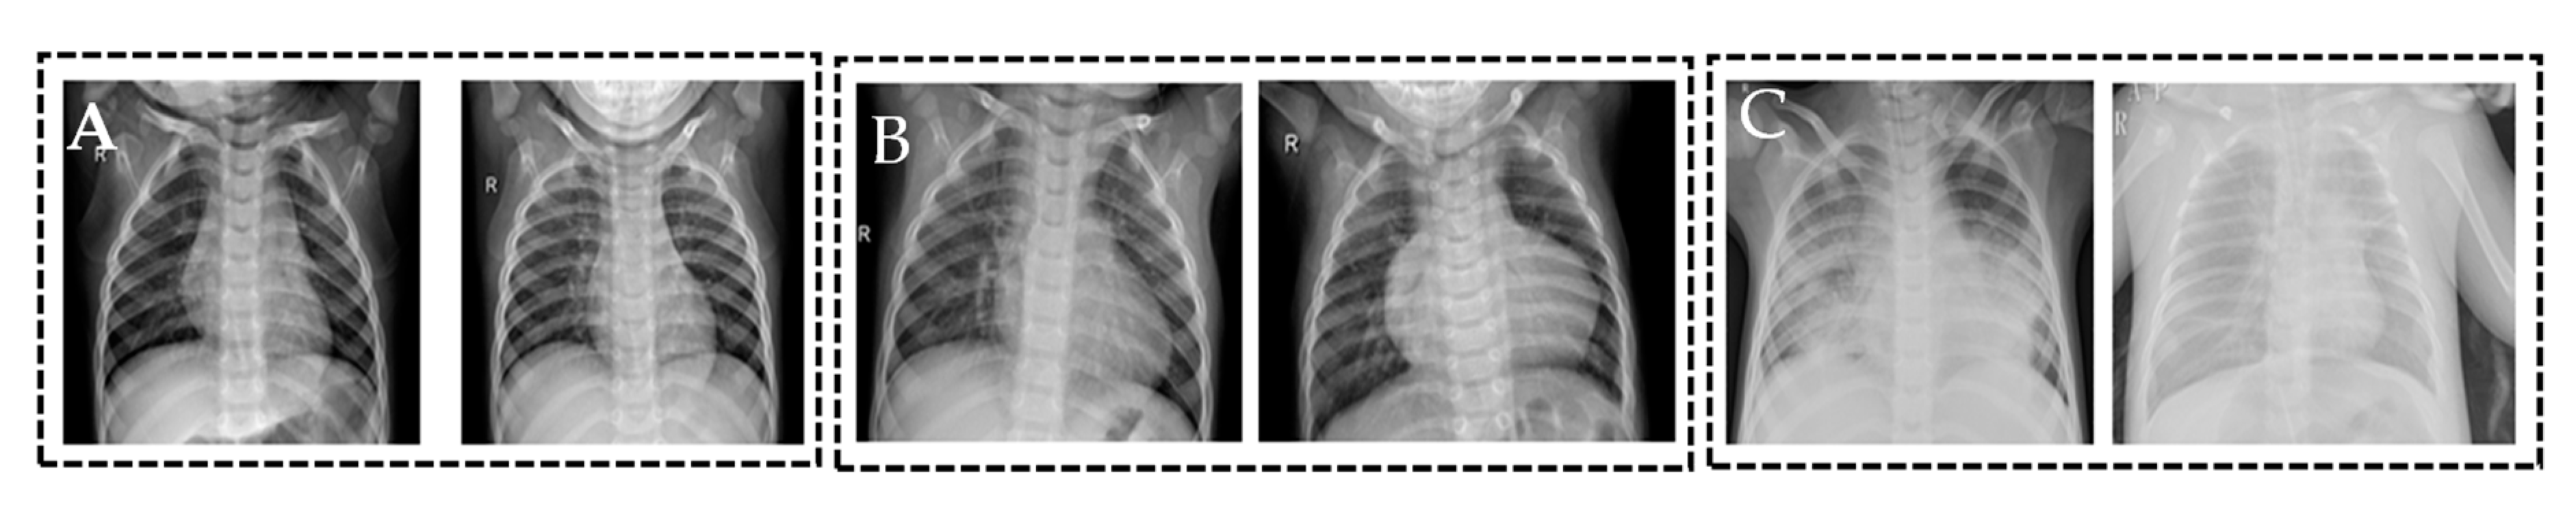
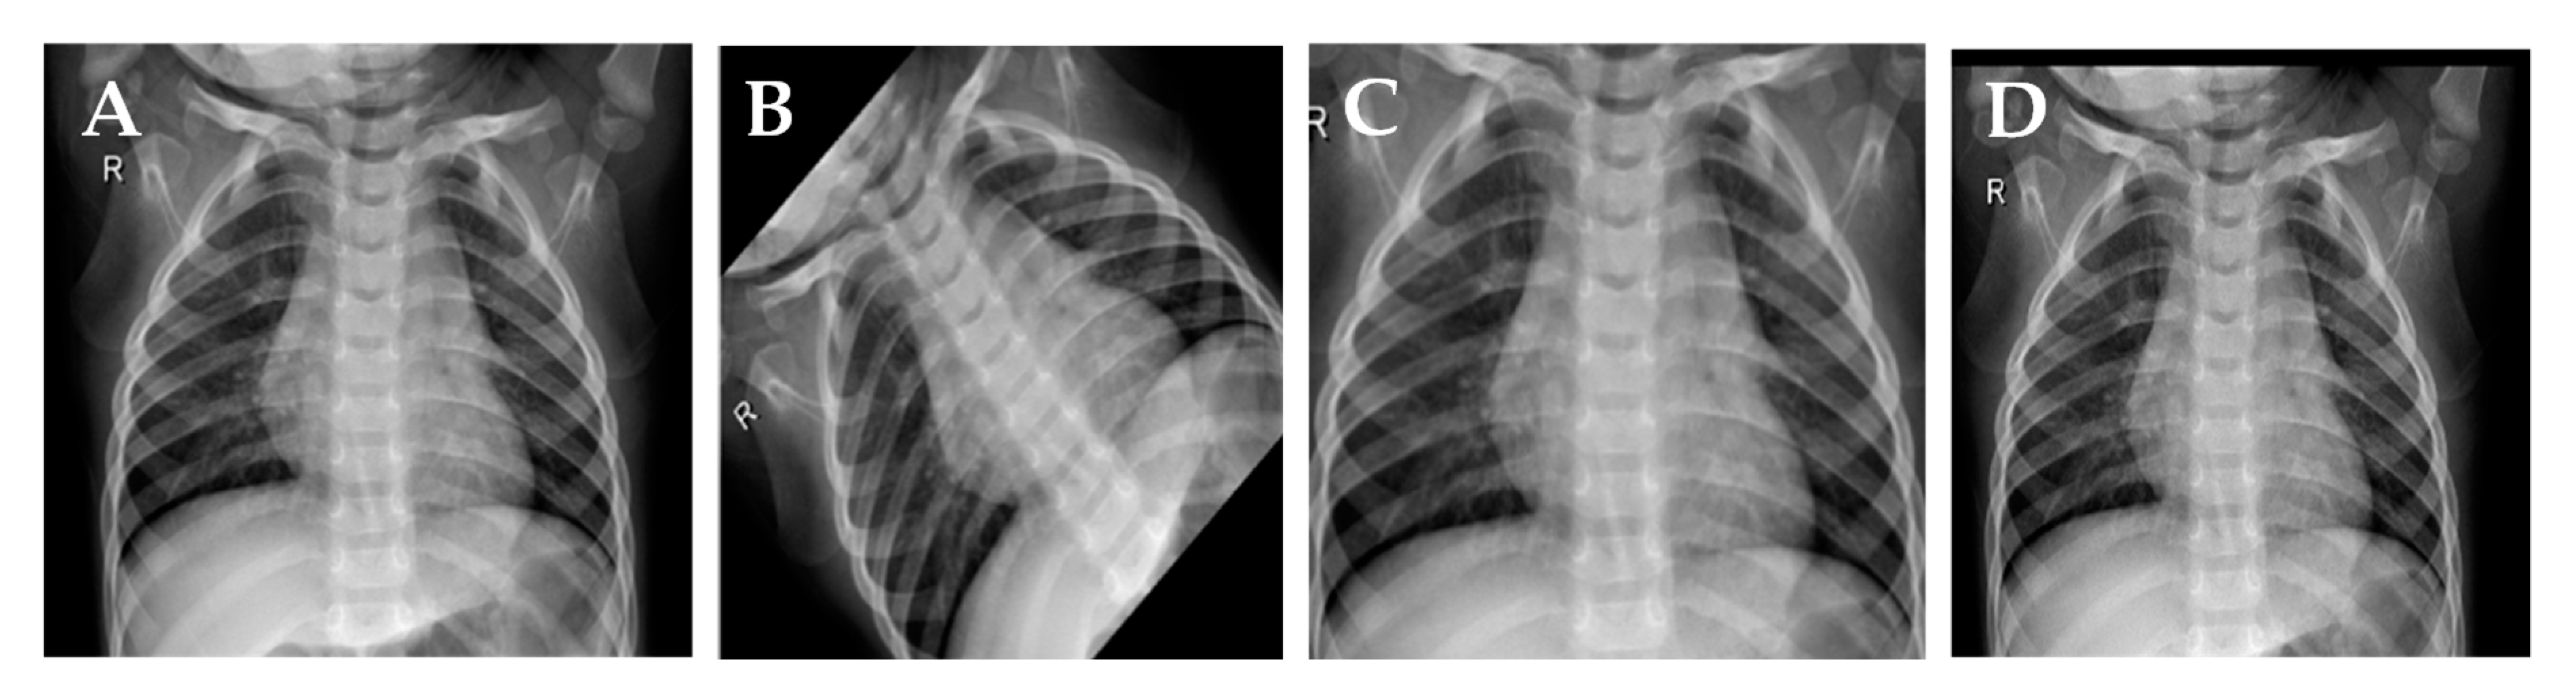
3.1. Dataset
3.2. Preprocessing
Data Augmentation
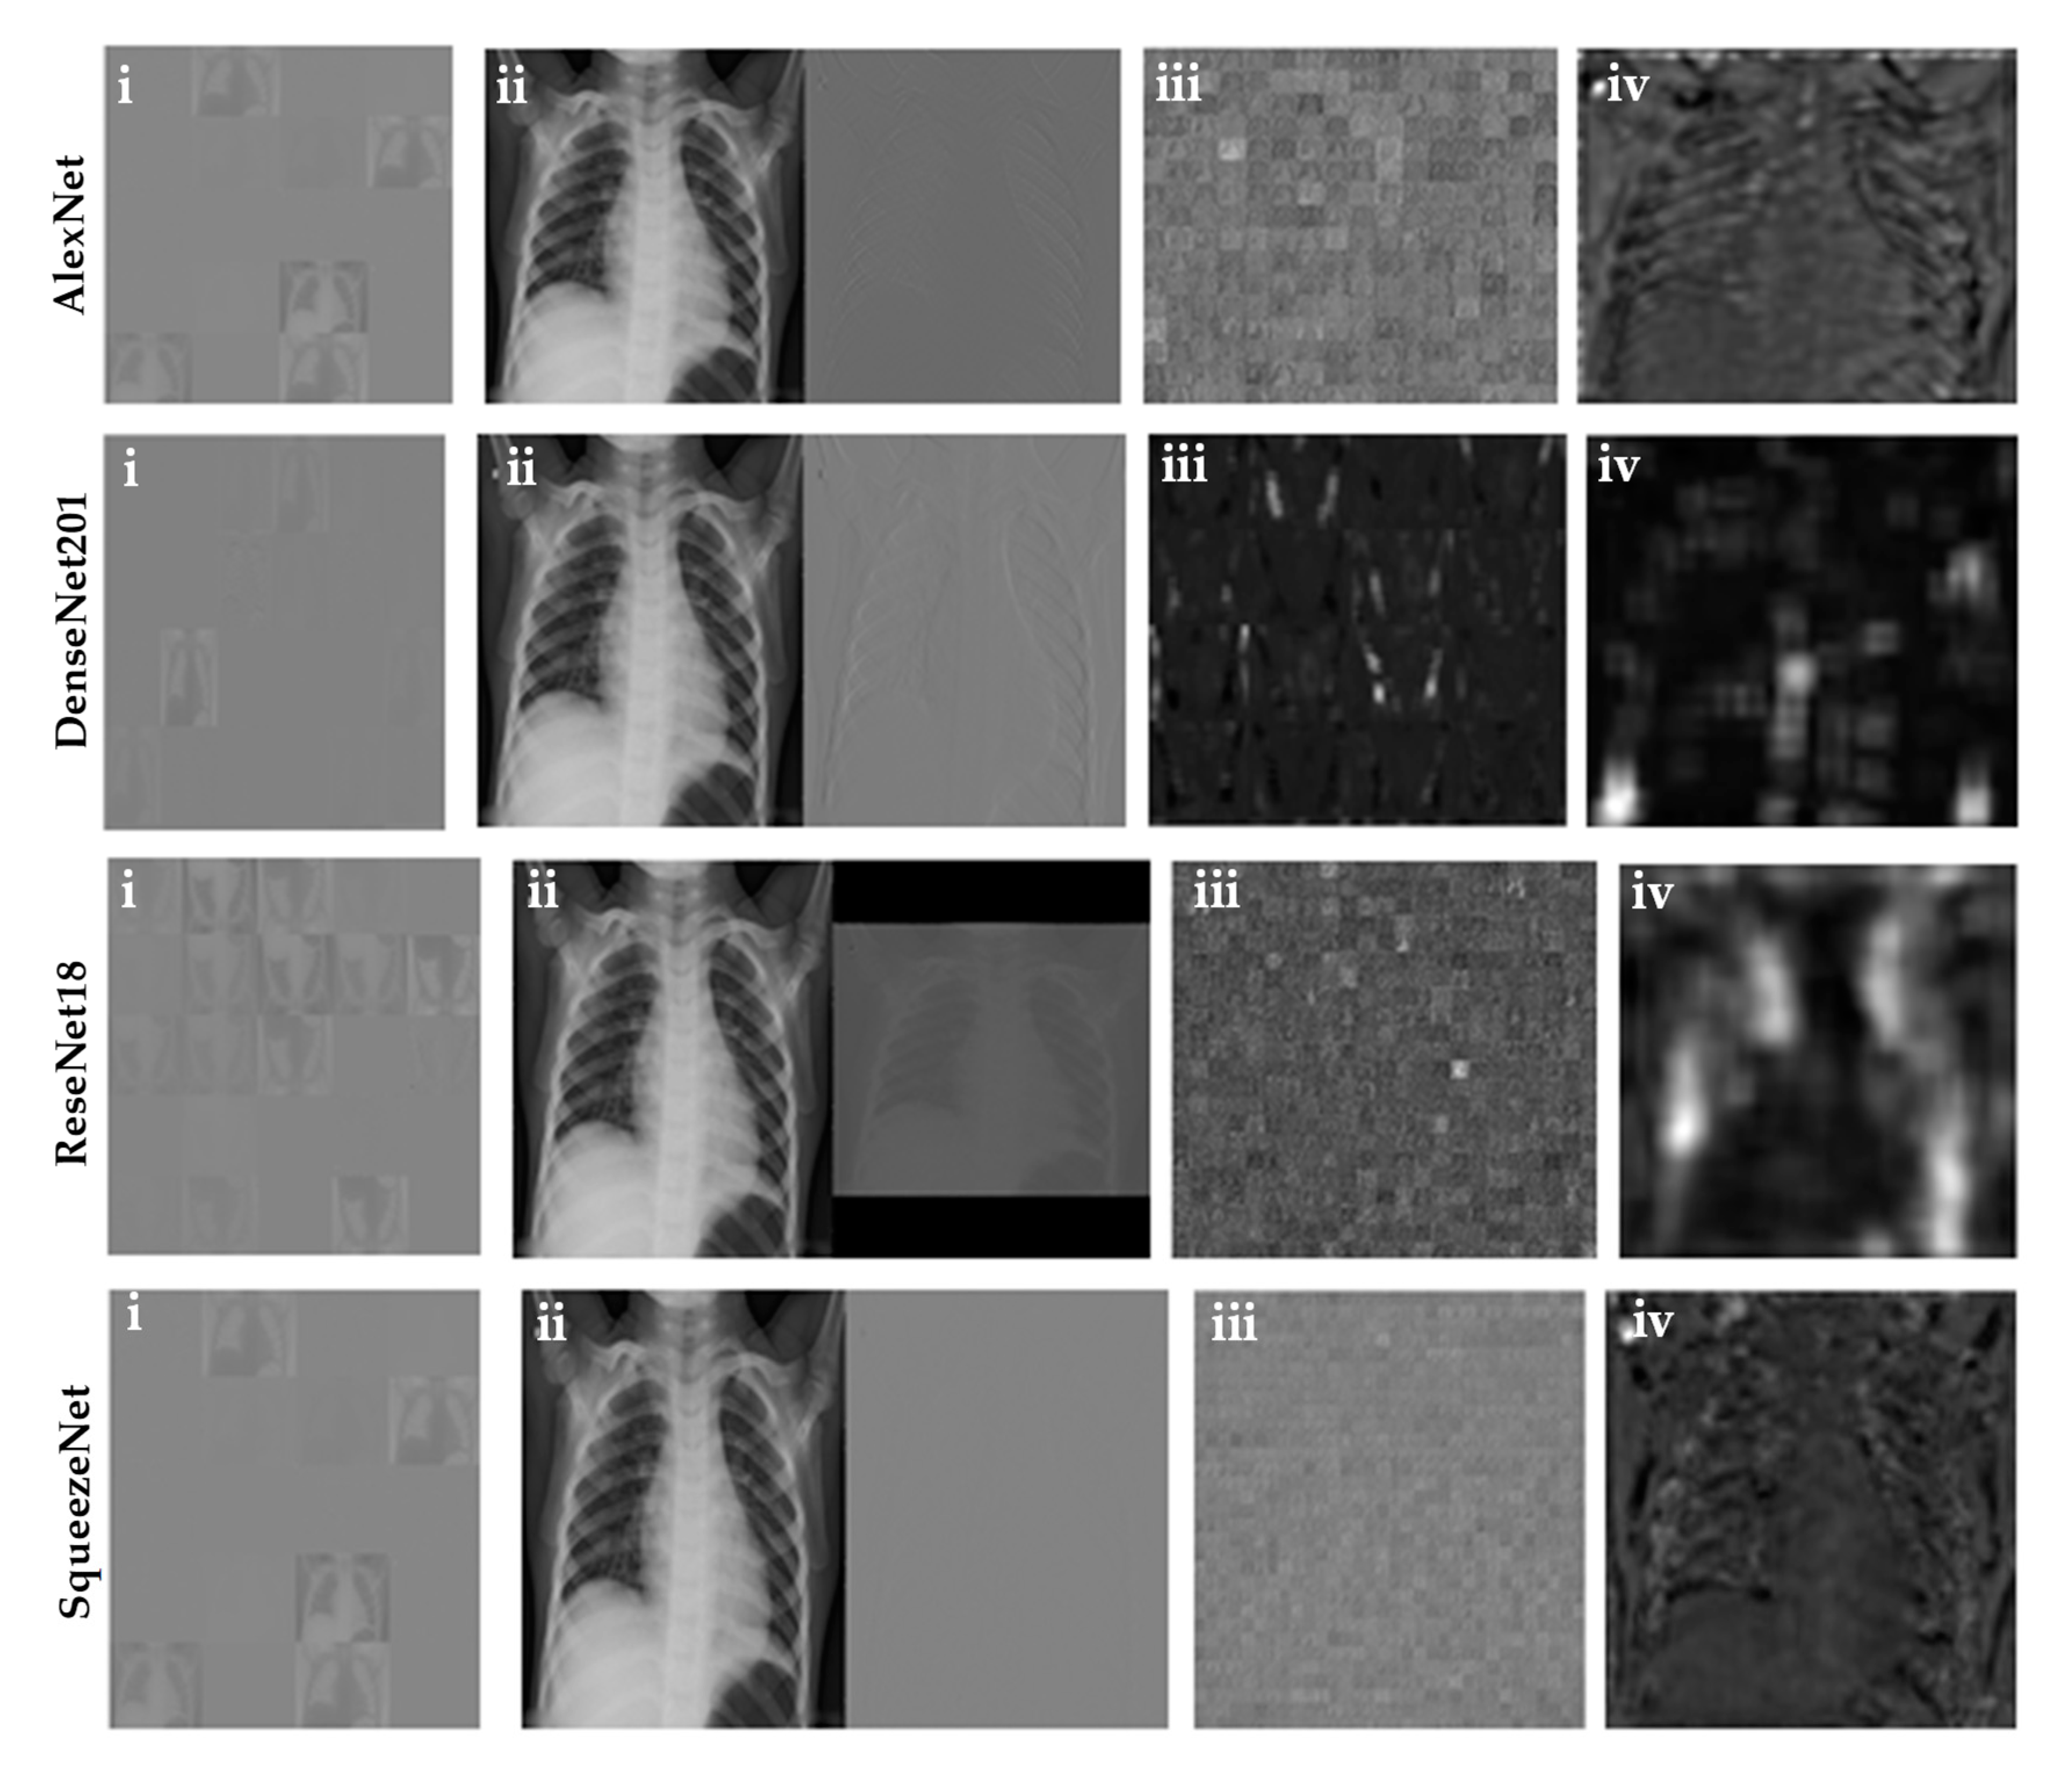
3.3. Visualization of the Activation Layer
3.4. Different Experiments
3.5. Performance Matrix for Classification
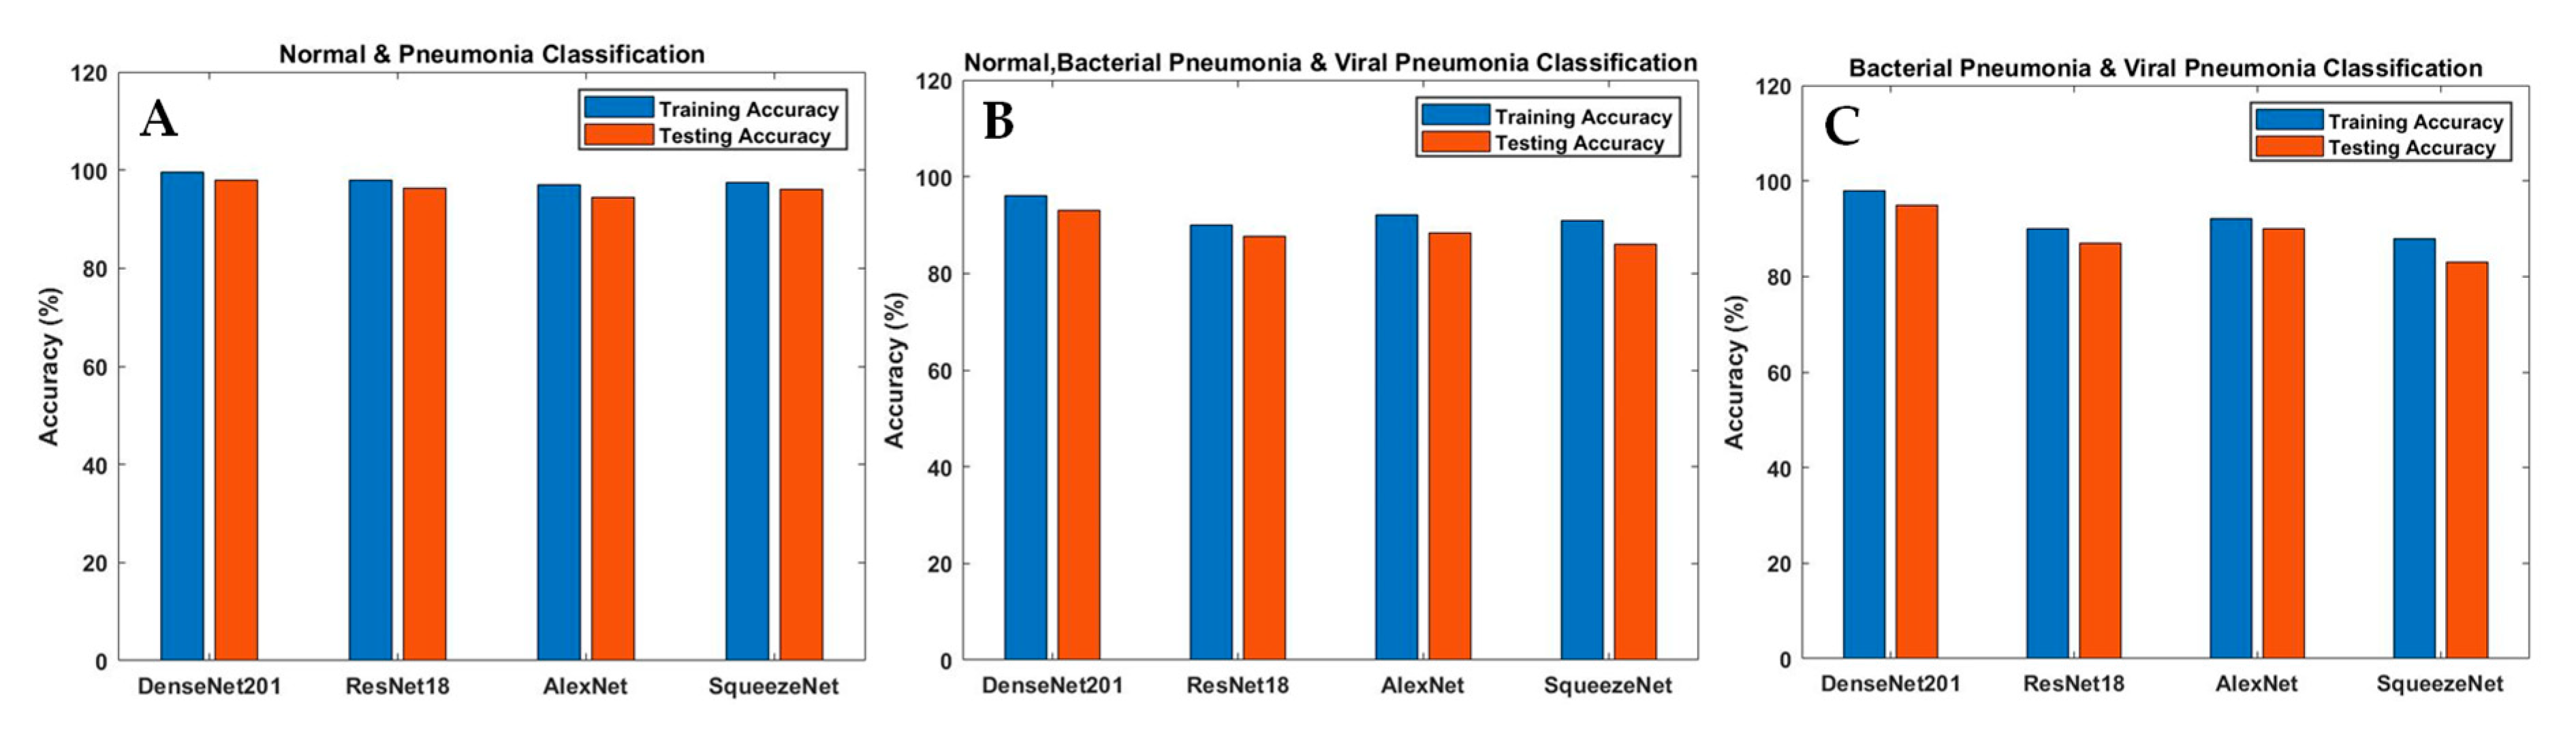
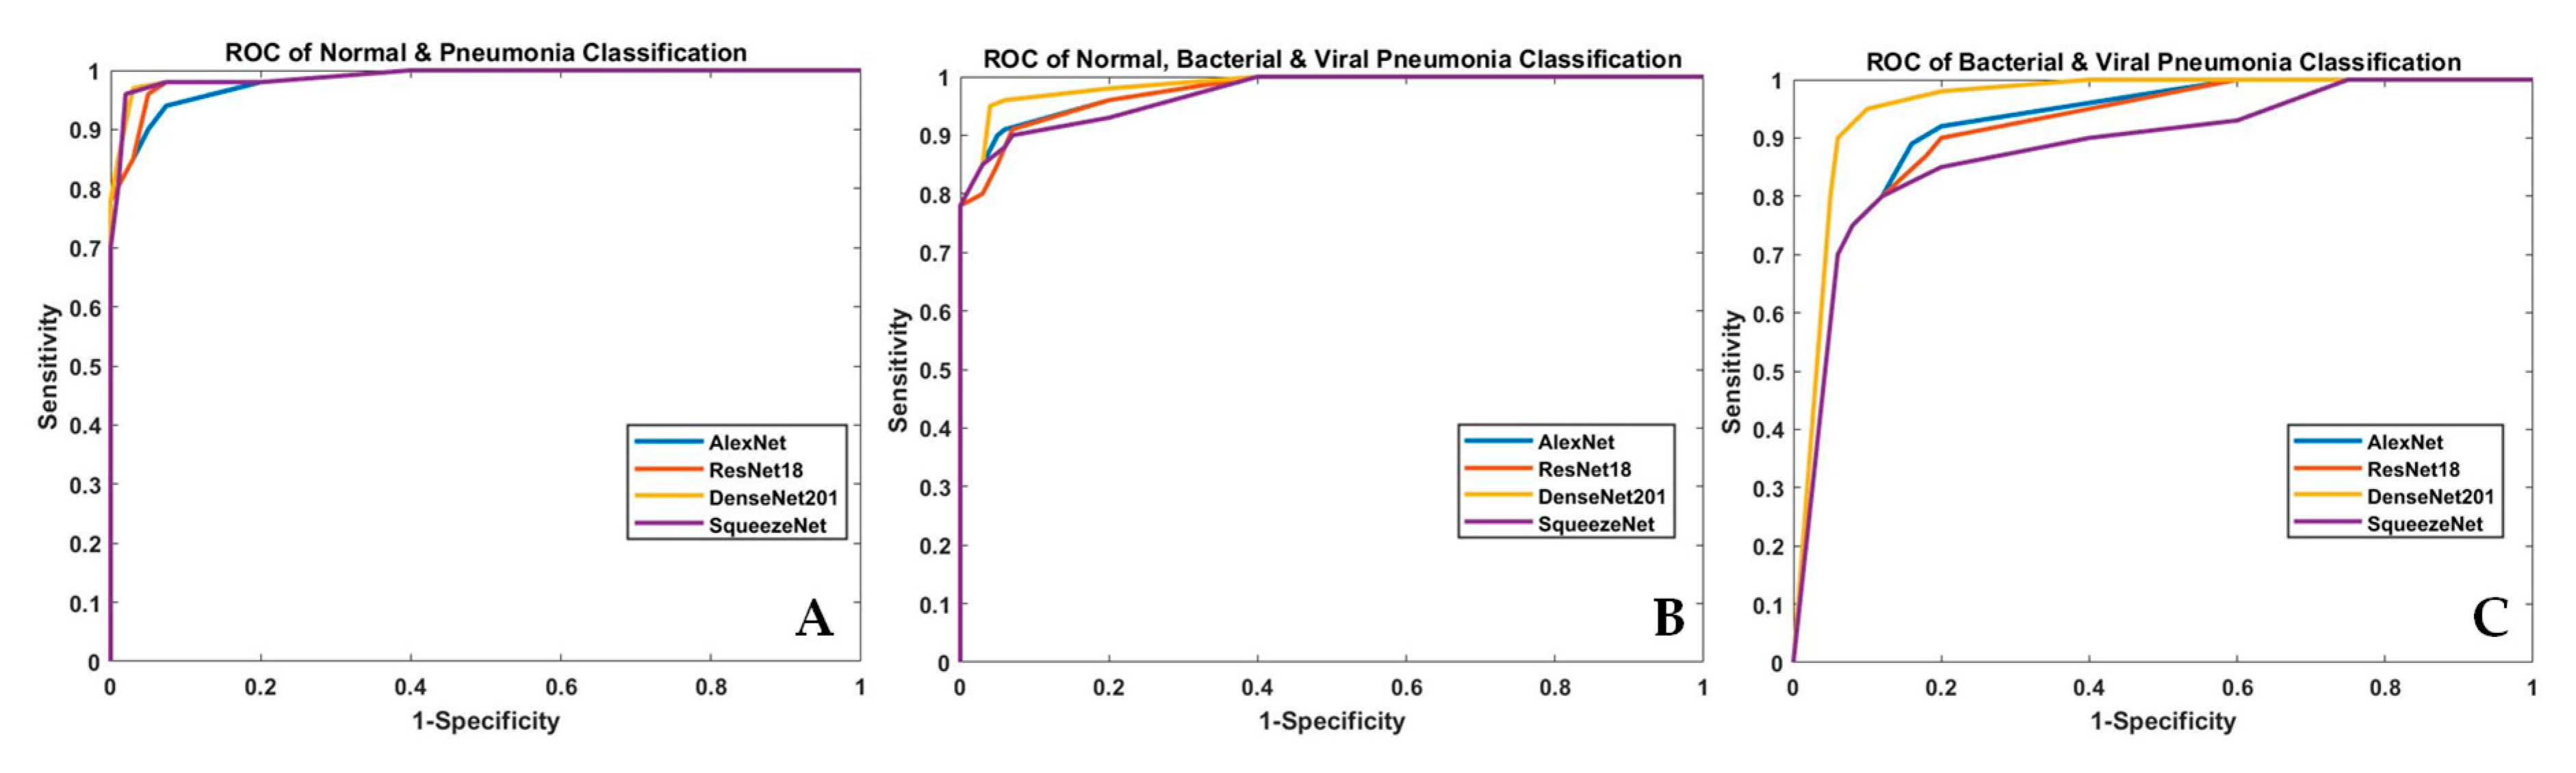
4. Results and Discussions
5. Conclusions
Author Contributions
Funding
Conflicts of Interest
References
- Imran, A. Training a CNN to detect Pneumonia. 2019. Available online: https://medium.com/datadriveninvestor/training-a-cnn-to-detect-pneumonia-c42a44101deb (accessed on 23 December 2019).
- Aydogdu, M.; Ozyilmaz, E.; Aksoy, H.; Gursel, G.; Ekim, N. Mortality prediction in community-acquired pneumonia requiring mechanical ventilation; values of pneumonia and intensive care unit severity scores. Tuberk Toraks 2010, 58, 25–34. [Google Scholar] [PubMed]
- WHO. Standardization of Interpretation of Chest Radiographs for the Diagnosis of Pneumonia in Children; World Health Organization: Geneva, Switzerland, 2001. [Google Scholar]
- Neuman, M.I.; Lee, E.Y.; Bixby, S.; DiPerna, S.; Hellinger, J.; Markowitz, R.; Servaes, S.; Monuteaux, M.C.; Shah, S. Variability in the interpretation of chest radiographs for the diagnosis of pneumonia in children. J. Hosp. Med. 2011, 7, 294–298. [Google Scholar] [CrossRef] [PubMed]
- Dele Davies, H.; Wang, E.E.-L.; Manson, D.; Babyn, P.S.; Shuckett, B. Reliability of the chest radiograph in the diagnosis of lower respiratory infections in young children. Pediatr. Infect. Dis. J. 1996, 15, 600–604. [Google Scholar] [CrossRef] [PubMed]
- Hopstaken, R.; Witbraad, T.; Van Engelshoven, J.; Dinant, G. Inter-observer variation in the interpretation of chest radiographs for pneumonia in community-acquired lower respiratory tract infections. Clin. Radiol. 2004, 59, 743–752. [Google Scholar] [CrossRef] [PubMed]
- Tahir, A.M.; Chowdhury, M.E.H.; Khandakar, A.; Al-Hamouz, S.; Abdalla, M.; Awadallah, S.; Reaz, M.B.I.; Al-Emadi, N. A Systematic Approach to the Design and Characterization of a Smart Insole for Detecting Vertical Ground Reaction Force (vGRF) in Gait Analysis. Sensors 2020, 20, 957. [Google Scholar] [CrossRef] [Green Version]
- Chowdhury, M.E.H.; Alzoubi, K.; Khandakar, A.; Khallifa, R.; Abouhasera, R.; Koubaa, S.; Ahmed, R.; Hasan, A. Wearable Real-Time Heart Attack Detection and Warning System to Reduce Road Accidents. Sensors 2019, 19, 2780. [Google Scholar] [CrossRef] [Green Version]
- Chowdhury, M.E.H.; Khandakar, A.; Alzoubi, K.; Mansoor, S.; Tahir, A.M.; Reaz, M.B.I.; Al-Emadi, N. Real-Time Smart-Digital Stethoscope System for Heart Diseases Monitoring. Sensors 2019, 19, 2781. [Google Scholar] [CrossRef] [Green Version]
- Kallianos, K.; Mongan, J.; Antani, S.; Henry, T.; Taylor, A.; Abuya, J.; Kohli, M. How far have we come? Artificial intelligence for chest radiograph interpretation. Clin. Radiol. 2019, 74, 338–345. [Google Scholar] [CrossRef]
- Krizhevsky, A.; Sutskever, I.; Hinton, G.E. Pdf ImageNet classification with deep convolutional neural networks. Commun. ACM 2017, 60, 84–90. [Google Scholar] [CrossRef]
- Wang, X.; Peng, Y.; Lu, L.; Lu, Z.; Bagheri, M.; Summers, R.M. ChestX-ray8: Hospital-Scale Chest X-ray Database and Benchmarks on Weakly-Supervised Classification and Localization of Common Thorax Diseases. In Proceedings of the 2017 IEEE Conference on Computer Vision and Pattern Recognition (CVPR), Honolulu, HI, USA, 21–26 July 2017; pp. 3462–3471. [Google Scholar]
- Ronneberger, O.; Fischer, P.; Brox, T. U-Net: Convolutional Networks for Biomedical Image Segmentation. In Proceedings of the Lecture Notes in Computer Science; Springer Science and Business Media LLC: Cham, Switzerland, 2015; Volume 9351, pp. 234–241. [Google Scholar]
- Woźniak, M.; Polap, D.; Capizzi, G.; Sciuto, G.L.; Kośmider, L.; Frankiewicz, K. Small lung nodules detection based on local variance analysis and probabilistic neural network. Comput. Methods Programs Biomed. 2018, 161, 173–180. [Google Scholar] [CrossRef]
- Gu, Y.; Lu, X.; Yang, L.; Zhang, B.; Yu, D.; Zhao, Y.; Gao, L.; Wu, L.; Zhou, T. Automatic lung nodule detection using a 3D deep convolutional neural network combined with a multi-scale prediction strategy in chest CTs. Comput. Boil. Med. 2018, 103, 220–231. [Google Scholar] [CrossRef] [PubMed]
- Ho, T.K.K.; Gwak, J. Multiple Feature Integration for Classification of Thoracic Disease in Chest Radiography. Appl. Sci. 2019, 9, 4130. [Google Scholar] [CrossRef] [Green Version]
- Jaiswal, A.K.; Tiwari, P.; Kumar, S.; Gupta, N.; Khanna, A.; Rodrigues, J.J.P.C. Identifying pneumonia in chest X-rays: A deep learning approach. Measurement 2019, 145, 511–518. [Google Scholar] [CrossRef]
- Liang, G.; Zheng, L. A transfer learning method with deep residual network for pediatric pneumonia diagnosis. Comput. Methods Programs Biomed. 2020, 187, 104964. [Google Scholar] [CrossRef]
- Souza, J.C.; Diniz, J.O.B.; Ferreira, J.L.; Da Silva, G.L.F.; Silva, A.C.; De Paiva, A.C. An automatic method for lung segmentation and reconstruction in chest X-ray using deep neural networks. Comput. Methods Programs Biomed. 2019, 177, 285–296. [Google Scholar] [CrossRef]
- Taylor, A.G.; Mielke, C.; Mongan, J. Automated detection of moderate and large pneumothorax on frontal chest X-rays using deep convolutional neural networks: A retrospective study. PLoS Med. 2018, 15, e1002697. [Google Scholar] [CrossRef]
- Xu, S.; Wu, H.; Bie, R. CXNet-m1: Anomaly Detection on Chest X-rays With Image-Based Deep Learning. IEEE Access 2018, 7, 4466–4477. [Google Scholar] [CrossRef]
- Toğaçar, M.; Ergen, B.; Cömert, Z.; Özyurt, F. A Deep Feature Learning Model for Pneumonia Detection Applying a Combination of mRMR Feature Selection and Machine Learning Models. IRBM 2019. [Google Scholar] [CrossRef]
- Saraiva, A.; Santos, D.; Costa, N.; Sousa, J.; Ferreira, N.; Valente, A.; Soares, S. Models of Learning to Classify X-ray Images for the Detection of Pneumonia using Neural Networks. In Proceedings of the 12th International Joint Conference on Biomedical Engineering Systems and Technologies, Prague, Czech, 22–24 February 2019; pp. 76–83. [Google Scholar]
- Ayan, E.; Unver, H.M. Diagnosis of Pneumonia from Chest X-ray Images Using Deep Learning. In Proceedings of the 2019 Scientific Meeting on Electrical-Electronics & Biomedical Engineering and Computer Science (EBBT), Istanbul, Turkey, 24–26 April 2019; pp. 1–5. [Google Scholar]
- Khatri, A.; Jain, R.; Vashista, H.; Mittal, N.; Ranjan, P.; Janardhanan, R. Pneumonia Identification in Chest X-ray Images Using EMD. In Internet of Things—Applications and Future; Springer Science and Business Media LLC: Singapore, 2020; pp. 87–98. [Google Scholar]
- Virkki, R.; Juvén, T.; Rikalainen, H.; Svedstrom, E.; Mertsola, J.; Ruuskanen, O. Differentiation of bacterial and viral pneumonia in children. Thorax 2002, 57, 438–441. [Google Scholar] [CrossRef] [Green Version]
- Ishiguro, T.; Kobayashi, Y.; Uozumi, R.; Takata, N.; Takaku, Y.; Kagiyama, N.; Kanauchi, T.; Shimizu, Y.; Takayanagi, N. Viral Pneumonia Requiring Differentiation from Acute and Progressive Diffuse Interstitial Lung Diseases. Intern. Med. 2019, 58, 3509–3519. [Google Scholar] [CrossRef] [Green Version]
- Chouhan, V.; Singh, S.K.; Khamparia, A.; Gupta, N.; Tiwari, P.; Moreira, C.; Damasevicius, R.; De Albuquerque, V.H.C. A Novel Transfer Learning Based Approach for Pneumonia Detection in Chest X-ray Images. Appl. Sci. 2020, 10, 559. [Google Scholar] [CrossRef] [Green Version]
- Rajaraman, S.; Candemir, S.; Kim, I.; Thoma, G.R.; Antani, S. Visualization and Interpretation of Convolutional Neural Network Predictions in Detecting Pneumonia in Pediatric Chest Radiographs. Appl. Sci. 2018, 8, 1715. [Google Scholar] [CrossRef] [Green Version]
- Gu, X.; Pan, L.; Liang, H.; Yang, R. Classification of Bacterial and Viral Childhood Pneumonia Using Deep Learning in Chest Radiography. In Proceedings of the 3rd international conference on Mobile and ubiquitous multimedia—MUM ’04; Association for Computing Machinery (ACM), Guiyang China, 16–18 March 2018; pp. 88–93. [Google Scholar]
- Gershgorn, D. The Data that Transformed AI Research—and Possibly the World. 2017. Available online: https://qz.com/1034972/the-data-that-changed-the-direction-of-ai-research-and-possibly-the-world/ (accessed on 23 December 2019).
- Rajpurkar, P.; Irvin, J.; Ball, R.L.; Zhu, K.; Yang, B.; Mehta, H.; Duan, T.; Ding, D.; Bagul, A.; Langlotz, C.P.; et al. Deep learning for chest radiograph diagnosis: A retrospective comparison of the CheXNeXt algorithm to practicing radiologists. PLoS Med. 2018, 15, e1002686. [Google Scholar] [CrossRef] [PubMed]
- Jung, H.; Kim, B.; Lee, I.; Lee, J.; Kang, J. Classification of lung nodules in CT scans using three-dimensional deep convolutional neural networks with a checkpoint ensemble method. BMC Med. Imag. 2018, 18, 48. [Google Scholar] [CrossRef] [PubMed]
- Sirazitdinov, I.; Kholiavchenko, M.; Mustafaev, T.; Yixuan, Y.; Kuleev, R.; Ibragimov, B. Deep neural network ensemble for pneumonia localization from a large-scale chest x-ray database. Comput. Electr. Eng. 2019, 78, 388–399. [Google Scholar] [CrossRef]
- Lakhani, P.; Sundaram, B. Deep Learning at Chest Radiography: Automated Classification of Pulmonary Tuberculosis by Using Convolutional Neural Networks. Radiology 2017, 284, 574–582. [Google Scholar] [CrossRef]
- Szegedy, C.; Liu, W.; Jia, Y.; Sermanet, P.; Reed, S.; Anguelov, D.; Erhan, D.; Vanhoucke, V.; Rabinovich, A. Going deeper with convolutions. In Proceedings of the 2015 IEEE Conference on Computer Vision and Pattern Recognition (CVPR), Boston, MA, USA, 7–12 June 2015; pp. 1–9. [Google Scholar]
- Albawi, S.; Mohammed, T.A.; Al-Azawi, S. Understanding of a convolutional neural network. In Proceedings of the 2017 International Conference on Engineering and Technology (ICET), Antalya, Turkey, 21–23 August 2017; pp. 1–6. [Google Scholar]
- Goyal, M.; Goyal, R.; Lall, B. Learning Activation Functions: A new paradigm of understanding Neural Networks. arXiv 2019, arXiv:1906.09529. [Google Scholar]
- Bailer, C.; Habtegebrial, T.; Varanasi, K.; Stricker, D. Fast Feature Extraction with CNNs with Pooling Layers. arXiv 2018, arXiv:1805.03096. [Google Scholar]
- Deng, J.; Dong, W.; Socher, R.; Li, L.-J.; Li, K.; Fei-Fei, L. Imagenet: A large-scale hierarchical image database. In Proceedings of the 2009 IEEE Conference on Computer Vision and Pattern Recognition, Miami, FL, USA, 20–25 June 2009; pp. 248–255. [Google Scholar]
- Wang, S.-H.; Xie, S.; Chen, X.; Guttery, D.; Tang, C.; Sun, J.; Zhang, Y.-D. Alcoholism Identification Based on an AlexNet Transfer Learning Model. Front. Psychol. 2019, 10, 205. [Google Scholar] [CrossRef] [Green Version]
- Christodoulidis, S.; Anthimopoulos, M.; Ebner, L.; Christe, A.; Mougiakakou, S.G. Multisource Transfer Learning With Convolutional Neural Networks for Lung Pattern Analysis. IEEE J. Biomed. Health Inform. 2016, 21, 76–84. [Google Scholar] [CrossRef] [Green Version]
- Yang, H.; Mei, S.; Song, K.; Tao, B.; Yin, Z. Transfer-Learning-Based Online Mura Defect Classification. IEEE Trans. Semicond. Manuf. 2017, 31, 116–123. [Google Scholar] [CrossRef]
- Akcay, S.; Kundegorski, M.E.; Devereux, M.; Breckon, T.P. Transfer learning using convolutional neural networks for object classification within X-ray baggage security imagery. In Proceedings of the 2016 IEEE International Conference on Image Processing (ICIP), Phoenix, AZ, USA, 25–28 September 2016; pp. 1057–1061. [Google Scholar]
- Tajbakhsh, N.; Shin, J.Y.; Gurudu, S.R.; Hurst, R.T.; Kendall, C.B.; Gotway, M.B.; Liang, J. Convolutional Neural Networks for Medical Image Analysis: Full Training or Fine Tuning? IEEE Trans. Med. Imag. 2016, 35, 1299–1312. [Google Scholar] [CrossRef] [PubMed] [Green Version]
- Pan, S.J.; Yang, Q. A Survey on Transfer Learning. IEEE Trans. Knowl. Data Eng. 2009, 22, 1345–1359. [Google Scholar] [CrossRef]
- ResNet, AlexNet, VGGNet, Inception: Understanding various architectures of Convolutional Networks. Available online: https://cv-tricks.com/cnn/understand-resnet-alexnet-vgg-inception/ (accessed on 23 December 2019).
- LeCun, Y.; Kavukcuoglu, K.; Farabet, C. Convolutional networks and applications in vision. In Proceedings of the 2010 IEEE International Symposium on Circuits and Systems, Paris, France, 30 May–2 June 2010; pp. 253–256. [Google Scholar]
- LeCun, Y.; Boser, B.E.; Denker, J.S.; Henderson, D.; Howard, R.E.; Hubbard, W.E.; Jackel, L.D. Handwritten digit recognition with a back-propagation network. In Advances in Neural Information Processing Systems; The MIT Press: Massachusetts, MA, USA, 1990; pp. 396–404. [Google Scholar]
- Huang, G.; Liu, Z.; Van Der Maaten, L.; Weinberger, K.Q. Densely Connected Convolutional Networks. In Proceedings of the 2017 IEEE Conference on Computer Vision and Pattern Recognition (CVPR), Honolulu, HI, USA, 21–26 July 2017; pp. 2261–2269. [Google Scholar]
- DenseNet: Better CNN Model than ResNet. Available online: http://www.programmersought.com/article/7780717554/ (accessed on 23 December 2019).
- Iandola, F.N.; Han, S.; Moskewicz, M.W.; Ashraf, K.; Dally, W.J.; Keutzer, K. SqueezeNet: AlexNet-level accuracy with 50x fewer parameters and < 0.5 MB model size. arXiv 2016, arXiv:1602.07360. [Google Scholar]
- Mooney, P. Chest X-ray Images (Pneumonia). 2018. Available online: https://www.kaggle.com/paultimothymooney/chest-xray-pneumonia (accessed on 23 December 2019).
- Cohen, J.P.; Bertin, P.; Frappier, V. Chester: A Web Delivered Locally Computed Chest X-ray Disease Prediction System. arXiv 2019, arXiv:1901.11210. [Google Scholar]


| Type | Number of X-ray Images |
|---|---|
| Normal | 1341 |
| Bacterial Pneumonia | 2561 |
| Viral Pneumonia | 1345 |
| Total | 5247 |
| Types | Training Set (Using Augmentation) | Test Set | |
|---|---|---|---|
| Normal and Pneumonia | Normal | 4500 | 205 |
| Pneumonia | 4500 | 214 | |
| Normal, Bacterial, and Viral Pneumonia | Normal | 4500 | 199 |
| Bacterial Pneumonia | 4500 | 197 | |
| Viral Pneumonia | 4500 | 201 | |
| Bacterial and Viral Pneumonia | Bacterial Pneumonia | 4500 | 197 |
| Viral Pneumonia | 4500 | 201 | |
| Software | Pre-Trained CNN Models | Image Size | Optimization | Momentum | Mini-Batch | Learning Rate |
|---|---|---|---|---|---|---|
| Matlab (2019a) | AlexNet | 227 × 227 | Gradient Descent | 0.9 | 16 | 0.0003 |
| ResNet18 | 224 × 224 | |||||
| DenseNet201 | 224 × 224 | |||||
| SqueezeNet | 227 × 227 |
| Task | Models | Accuracy | Sensitivity (Recall) | Specificity | Precision (PPV) | Area under Curve (AUC) | F1 Scores |
|---|---|---|---|---|---|---|---|
| Normal and Pneumonia | AlexNet | 0.945 | 0.953 | 0.926 | 0.931 | 0.942 | 0.943 |
| ResNet18 | 0.964 | 0.97 | 0.95 | 0.954 | 0.963 | 0.965 | |
| DenseNet201 | 0.98 | 0.99 | 0.97 | 0.97 | 0.98 | 0.981 | |
| SqueezeNet | 0.961 | 0.94 | 0.98 | 0.985 | 0.96 | 0.961 | |
| Normal, Bacterial Pneumonia and Viral Pneumonia | AlexNet | 0.884 | 0.883 | 0.941 | 0.886 | 0.911 | 0.885 |
| ResNet18 | 0.877 | 0.88 | 0.94 | 0.875 | 0.91 | 0.909 | |
| DenseNet201 | 0.933 | 0.932 | 0.967 | 0.937 | 0.95 | 0.935 | |
| SqueezeNet | 0.861 | 0.859 | 0.93 | 0.87 | 0.895 | 0.865 | |
| Bacterial and Viral Pneumonia | AlexNet | 0.90 | 0.94 | 0.845 | 0.86 | 0.89 | 0.921 |
| ResNet18 | 0.87 | 0.92 | 0.82 | 0.83 | 0.87 | 0.873 | |
| DenseNet201 | 0.95 | 0.96 | 0.94 | 0.95 | 0.952 | 0.952 | |
| SqueezeNet | 0.83 | 0.905 | 0.75 | 0.79 | 0.83 | 0.84 |
| Author | Classes | Technique | Image No. | Recall /Sensitivity(%) | Precision (%) | AUC (%) | Accuracy (%) |
|---|---|---|---|---|---|---|---|
| Vikash et al. [21] | Normal & Pneumonia | Different pre-trained CNN model | 5232 | 99.6 | 93.28 | 99.34 | 96.39 |
| Sivarama krishnan et al. [29] | Normal & Pneumonia | customized VGG16 CNN model | 5856 | 99.5 | 97.0 | 99.0 | 96.2 |
| Kermanyetal. [54] | Normal & Pneumonia | Inception V3 pretrained CNN model | 5232 | 93.2 | 90.1 | - | 92.8 |
| * M.Togacar et al. [22] | Normal & Pneumonia | Deep CNN model | 5849 | 96.83 | 96.88 | 96.80 | 96.84 |
| A. A. Saraiva et al. [23] | Normal & Pneumonia | Neural network | 5840 | 94.5 | 94.3 | 94.5 | 94.4 |
| Enes AYAN et al. [24] | Normal & Pneumonia | VGG16 deep learning model | 5856 | 89.1 | 91.3 | 87.0 | 84.5 |
| Xianghong Gu et al. [30] | Bacterial & Viral Pneumonia | Deep Convolutional neural network | 4882 | 77.55 | 88.86 | 82.3 | 80.4 |
| * Sivarama krishnan et al. [29] | Bacterial & Viral Pneumonia | customized VGG16 CNN model | 3883 | 98.4 | 92.0 | 96.2 | 93.6 |
| Archit Khatri et al. [25] | Bacterial & Viral Pneumonia | EMD approach | 144 | 89.5 | 80.0 | 88.0 | 83.30 |
| ** This work | Normal & Pneumonia | Different pre-trained CNN model | 5247 | 99.0 | 97.0 | 98.0 | 98.0 |
| ** This work | Bacterial & Viral Pneumonia | Different pre-trained CNN model | 5247 | 96.0 | 95.0 | 95.2 | 95.0 |
© 2020 by the authors. Licensee MDPI, Basel, Switzerland. This article is an open access article distributed under the terms and conditions of the Creative Commons Attribution (CC BY) license (http://creativecommons.org/licenses/by/4.0/).
Share and Cite
Rahman, T.; Chowdhury, M.E.H.; Khandakar, A.; Islam, K.R.; Islam, K.F.; Mahbub, Z.B.; Kadir, M.A.; Kashem, S. Transfer Learning with Deep Convolutional Neural Network (CNN) for Pneumonia Detection Using Chest X-ray. Appl. Sci. 2020, 10, 3233. https://0-doi-org.brum.beds.ac.uk/10.3390/app10093233
Rahman T, Chowdhury MEH, Khandakar A, Islam KR, Islam KF, Mahbub ZB, Kadir MA, Kashem S. Transfer Learning with Deep Convolutional Neural Network (CNN) for Pneumonia Detection Using Chest X-ray. Applied Sciences. 2020; 10(9):3233. https://0-doi-org.brum.beds.ac.uk/10.3390/app10093233
Chicago/Turabian StyleRahman, Tawsifur, Muhammad E. H. Chowdhury, Amith Khandakar, Khandaker R. Islam, Khandaker F. Islam, Zaid B. Mahbub, Muhammad A. Kadir, and Saad Kashem. 2020. "Transfer Learning with Deep Convolutional Neural Network (CNN) for Pneumonia Detection Using Chest X-ray" Applied Sciences 10, no. 9: 3233. https://0-doi-org.brum.beds.ac.uk/10.3390/app10093233