Eggplant Fruit (Solanum melongena L.) and Bio-Residues as a Source of Nutrients, Bioactive Compounds, and Food Colorants, Using Innovative Food Technologies


 , , , ,
  ,
, 
 and
and
Abstract
:1. Introduction
2. Materials and Methods
2.1. Samples
2.2. Determination of Color in Eggplant Epicarp
2.3. Determination of Nutritional Composition of Eggplant (Pulp and Whole Fruit)
2.4. Free Sugars, Organic Acids, and Fatty Acids Profile of Eggplant (Pulp and Whole Fruit)
2.5. Determination of Phenolic Compounds of Eggplant
2.5.1. Non-Anthocyanin Compounds
2.5.2. Anthocyanin Compounds
2.6. Evaluation of the Bioactive Properties of Solanum melongena L. Fruits: Epicarp, Pulp, and Whole Fruit, through In Vitro Tests
2.6.1. Antimicrobial Activity
2.6.2. Cytotoxic, Hepatotoxic, and Anti-Inflammatory Activity
2.6.3. Antioxidant Activity
2.7. Optimization of the Extraction Process to Obtain a Natural Colorant Rich in Anthocyanins, from the Epicarp of Solanum melongena L. Fruits
2.7.1. Experimental Design and Extraction Procedure Assisted by Ultrasound
2.7.2. Preparation of Extracts Obtained by Ultrasound-Assisted Extraction
2.7.3. Identification and Quantification of Anthocyanin Compounds by HPLC-DAD
2.7.4. Response Format Used for Analytical Processes
2.7.5. Analysis of the Mathematical Model, Procedure for Optimization of Variables and Numerical Methods, Statistical Analysis, and Graphic Illustrations
2.8. Preparation of the Optimal Extract Rich in Anthocyanins from the Epicarp of Solanum melongena L. Fruit
2.9. Statistical Analysis
3. Results and Discussions
3.1. Color Evaluation of the Epicarp, Pulp, and Whole Fruit of S. melongena
3.2. Nutritional Characterization of Eggplant (Whole Fruit and Pulp)
3.3. Chemical Composition of Whole Fruit and Pulp of S. melongena
3.3.1. Content of Sugars, Organic Acids, and Fatty Acids
3.3.2. Profile in Non-Anthocyanin and Anthocyanin Phenolic Compounds
3.4. Antioxidant, Antimicrobial, Cytotoxic, and Hepatotoxic Activity of the Hydroethanolic Extract Obtained from the S. melongena Fruit by Conventional Method
3.5. Optimization of the Process of Obtaining a Natural Colorant Extract Based on Anthocyanins from the S. melongena Epicarp
3.5.1. Effect of Solvent Concentration
3.5.2. Effect of the Solid-Liquid Ratio
3.5.3. Effect of Extraction Time
3.5.4. Statistical Analysis and Model Adjustment
3.5.5. Optimization of the Analysis of the Response Surface Methodology
4. Conclusions
Author Contributions
Funding
Acknowledgments
Conflicts of Interest
References
- Woiciechowski, A.L.; de Carvalho, J.C.; Spier, M.R.; Habu, S.; Yamaguishi, C.T.; Ghiggi, V.; Soccol, C.R. Use of Agro-Industrial Residues in Food Bioprocesses; Food Biotechnology, Science, Technology, Food Engineering and Nutrition Collection; Atheneu Publisher: Sao Paulo, Brazil; Rio de Janeiro, Brazil; Belo Horizonte, Brazil, 2013; Volume 12, pp. 143–172. [Google Scholar]
- Toop, T.A.; Ward, S.; Oldfield, T.; Hull, M.; Kirby, M.E.; Theodorou, M.K. AgroCycle—Developing a circular economy in agriculture. Energy Procedia 2017, 123, 76–78. [Google Scholar] [CrossRef]
- Gontard, N.; Sonesson, U.; Birkved, M.; Majone, M.; Bolzonella, D.; Celli, A.; Angellier-Coussy, H.; Jang, G.W.; Verniquet, A.; Broeze, J.; et al. A Research Challenge Vision Regarding Management of Agricultural Waste in a Circular Bio-Based Economy. Crit. Rev. Environ. Sci. Technol. 2018, 48, 614–654. [Google Scholar] [CrossRef] [Green Version]
- Gürbüz, N.; Uluişik, S.; Frary, A.; Frary, A.; Doğanlar, S. Health Benefits and Bioactive Compounds of Eggplant. Food Chem. 2018, 268, 602–610. [Google Scholar] [CrossRef] [PubMed]
- Radicetti, E.; Massantini, R.; Campiglia, E.; Mancinelli, R.; Ferri, S.; Moscetti, R. Yield and quality of eggplant (Solanum melongena L.) as affected bycover crop species and residue management. Sci. Hortic. 2016, 204, 161–171. [Google Scholar] [CrossRef]
- Rodriguez-Jimenez, J.R.; Amaya-Guerra, C.A.; Baez-Gonzalez, J.G.; Aguilera-Gonzalez, C.; Urias-Orona, V.; Nino-Medina, G. Physicochemical, Functional, and Nutraceutical Properties of Eggplant Flours Obtained by Different Drying Methods. Molecules 2018, 23, 3210. [Google Scholar] [CrossRef] [Green Version]
- Ferarsa, S.; Zhang, W.; Moulai-Mostefa, N.; Ding, L.; Jaffrin, M.Y.; Grimi, N. Recovery of Anthocyanins and Other Phenolic Compounds from Purple Eggplant Peels and Pulps Using Ultrasonic-Assisted Extraction. Food Bioprod. Process. 2018, 109, 19–28. [Google Scholar] [CrossRef]
- Bobbio, P.A.; Bobbio, F.O. Química do Processamento de Alimentos: Pigmentos., 2nd ed.; Livraria Varela: Sao Paulo, Brazil, 1995; pp. 105–120. ISBN 85-85519-12-6. [Google Scholar]
- Kong, J.M.; Chia, L.S.; Goh, N.K.; Chia, T.F.; Brouillard, R. Analysis and Biological Activities of Anthocyanins. Phytochemistry 2003, 64, 923–933. [Google Scholar] [CrossRef]
- Das, S.; Raychaudhuri, U.; Falchi, M.; Bertelli, A.; Braga, P.C.; Das, D.K. Cardioprotective properties of raw and cooked eggplant (Solanum melongena L). Food Funct. 2011, 2, 395–399. [Google Scholar] [CrossRef]
- Jung, E.J.; Bae, M.S.; Jo, E.K.; Jo, Y.H.; Lee, S.C. Antioxidant Activity of Different Parts of Eggplant. J. Med. Plants Res. 2011, 5, 4610–4615. [Google Scholar]
- Kaume, L.; Howard, L.R.; Devareddy, L. The Blackberry Fruit: A Review on Its Composition and Chemistry, Metabolism and Bioavailability, and Health Benefits. J. Agric. Food Chem. 2012, 60, 5716–5727. [Google Scholar] [CrossRef]
- Dranca, F.; Oroian, M. Optimization of Ultrasound-Assisted Extraction of Total Monomeric Anthocyanin (TMA) and Total Phenolic Content (TPC) from Eggplant (Solanum melongena L.) Peel. Ultrason. Sonochem. 2016, 31, 637–646. [Google Scholar] [CrossRef] [PubMed]
- Roriz, C.L.; Barros, L.; Prieto, M.A.; Morales, P.; Ferreira, I.C.F.R. Floral Parts of Gomphrena globosa L. as a Novel Alternative Source of Betacyanins: Optimization of the Extraction Using Response Surface Methodology. Food Chem. 2017, 229, 223–234. [Google Scholar] [CrossRef] [PubMed] [Green Version]
- Association of Official Analytical Chemist (AOAC). Official Methods of Analysis of AOAC International; AOAC: Washinton, DC, USA, 2016; ISBN 0935584870. [Google Scholar]
- Barros, L.; Pereira, E.; Calhelha, R.C.; Dueñas, M.; Carvalho, A.M.; Santos-Buelga, C.; Ferreira, I.C.F.R. Bioactivity and Chemical Characterization in Hydrophilic and Lipophilic Compounds of Chenopodium ambrosioides L. J. Funct. Foods 2013, 5, 1732–1740. [Google Scholar] [CrossRef]
- Bessada, S.M.F.; Barreira, J.C.M.; Barros, L.; Ferreira, I.C.F.R.; Oliveira, M.B.P.P. Phenolic Profile and Antioxidant Activity of Coleostephus myconis (L.) Rchb.f.: An Underexploited and Highly Disseminated Species. Ind. Crop. Prod. 2016, 89, 45–51. [Google Scholar] [CrossRef] [Green Version]
- Jabeur, I.; Tobaldini, F.; Martins, N.; Barros, L.; Martins, I.; Calhelha, R.C.; Henriques, M.; Silva, S.; Achour, L.; Santos-Buelga, C.; et al. Bioactive Properties and Functional Constituents of Hypericum androsaemum L.: A Focus on the Phenolic Profile. Food Res. Int. 2016, 89, 422–431. [Google Scholar] [CrossRef] [Green Version]
- Gonçalves, L.C.P.; Marcato, A.C.; Rodrigues, A.C.B.; Pagano, A.P.E.; Freitas, B.C.; de Machado, C.O.; Nakashima, K.K.; Esteves, L.C.; Lopes, N.B.; Bastos, E.L. Betalaínas: Das cores das beterrabas à fluorescência das flores. Rev. Virtual Química 2015, 7, 292–309. [Google Scholar]
- Albuquerque, B.R.; Prieto, M.A.; Barreiro, M.F.; Rodrigues, A.E.; Curran, T.P.; Barros, L.; Ferreira, I.C.F.R. Catechin-Based Extract Optimization Obtained from Arbutus unedo L. Fruits Using Maceration/Microwave/Ultrasound Extraction Techniques. Ind. Crop. Prod. 2017, 95, 404–415. [Google Scholar] [CrossRef] [Green Version]
- Carocho, M.; Barros, L.; Calhelha, R.C.; Ćirić, A.; Soković, M.; Santos-Buelga, C.; Morales, P.; Ferreira, I.C.F.R. Melissa officinalis L. decoctions as functional beverages: A bioactive approach and chemical characterization. Food Funct. 2015, 6, 2240–2248. [Google Scholar]
- Guimarães, R.; Barros, L.; Dueñas, M.; Calhelha, R.C.; Carvalho, A.M.; Santos-Buelga, C.; Queiroz, M.J.R.P.; Ferreira, I.C.F.R. Infusion and Decoction of Wild German Chamomile: Bioactivity and Characterization of Organic Acids and Phenolic Compounds. Food Chem. 2013, 136, 947–954. [Google Scholar] [CrossRef]
- Gutteridge, J.M.C. Lipid Peroxidation and Antioxidants as Biomarkers of Tissue Damage. Clin. Chem. 1995, 41, 1819–1828. [Google Scholar] [CrossRef]
- Ng, T.B.; Liu, F.; Wang, Z.T. Antioxidant activity of natural products from plants. Life Sci. 2000, 66, 709–723. [Google Scholar] [CrossRef]
- Lockowandt, L.; Pinela, J.; Roriz, C.L.; Pereira, C.; Abreu, R.M.V.; Calhelha, R.C.; Alves, M.J.; Barros, L.; Bredol, M.; Ferreira, I.C.F.R. Chemical Features and Bioactivities of Cornflower (Centaurea cyanus L.) Capitula: The Blue Flowers and the Unexplored Non-Edible Part. Ind. Crop. Prod. 2019, 128, 496–503. [Google Scholar] [CrossRef] [Green Version]
- Zhu, Z.; He, J.; Liu, G.; Barba, F.J.; Koubaa, M.; Ding, L.; Vorobiev, E. Recent insights for the green recovery of inulin from plant food materials using non-conventional extraction technologies: A review. Innov. Food Sci. Emerg. Technol. 2016, 33, 1–9. [Google Scholar] [CrossRef]
- Jiménez, L.C.; Caleja, C.; Prieto, M.A.; Barreiro, M.F.; Barros, L.; Ferreira, I.C.F.R. Optimization and comparison of heat and ultrasound assisted extraction techniques to obtain anthocyanin compounds from Arbutus unedo L. fruits. Food Chem. 2018, 264, 81–91. [Google Scholar]
- Heleno, S.A.; Prieto, M.A.; Barros, L.; Rodrigues, A.; Barreiro, M.F.; Ferreira, I.C.F.R. Optimization of microwave-assisted extraction of ergosterol from Agaricus bisporus L. byproducts using response surface methodology. Food Bioprod. Process. 2016, 100, 25–35. [Google Scholar] [CrossRef] [Green Version]
- López, C.J. Desarrollo de un Aditivo Colorante Natural a Base de Cianidina Obtenido a Partir de Frutos de Arbutus unedo L.: Optimización de la Extracción y Estudio de su Aplicación en Gofres. Master’s Thesis, Polythecnic Institute of Bragança, Bragança, Portugal, 2017. [Google Scholar]
- Pinela, J.; Prieto, M.A.; Carvalho, A.M.; Barreiro, M.F.; Oliveira, M.B.P.P.; Barros, L.; Ferreira, I.C.F.R. Microwave-Assisted Extraction of Phenolic Acids and Flavonoids and Production of Antioxidant Ingredients from Tomato: A Nutraceutical-Oriented Optimization Study. Sep. Purif. Technol. 2016, 164, 114–124. [Google Scholar] [CrossRef] [Green Version]
- Vieira, V.; Prieto, M.A.; Barros, L.; Coutinho, J.A.P.; Ferreira, O.; Ferreira, I.C.F.R. Optimization and Comparison of Maceration and Microwave Extraction Systems for the Production of Phenolic Compounds from Juglans regia L. for the Valorization of Walnut Leaves. Ind. Crop. Prod. 2017, 107, 341–352. [Google Scholar] [CrossRef] [Green Version]
- Melgar, B.; Dias, M.I.; Barros, L.; Ferreira, I.C.F.R.; Rodriguez-Lopez, A.D.; Garcia-Castello, E.M. Ultrasound and Microwave Assisted Extraction of Opuntia Fruit Peels Biocompounds: Optimization and Comparison Using RSM-CCD. Molecules 2019, 24, 3618. [Google Scholar] [CrossRef] [Green Version]
- Xu, M.; Du, C.; Zhang, N.; Shi, X.; Wu, Z.; Qiao, Y. Color Spaces of Safflower (Carthamus tinctorius L.) for Quality Assessment. J. Tradit. Chin. Med. Sci. 2016, 3, 168–175. [Google Scholar] [CrossRef]
- Russo, P.; Adiletta, G.; Di Matteo, M. The Influence of Drying Air Temperature on the Physical Properties of Dried and Rehydrated Eggplant. Food Bioprod. Process. 2013, 91, 249–256. [Google Scholar] [CrossRef]
- Jiang, T.; Mao, Y.; Sui, L.; Yang, N.; Li, S.; Zhu, Z.; Wang, C.; Yin, S.; He, J.; He, Y. Degradation of Anthocyanins and Polymeric Color Formation during Heat Treatment of Purple Sweet Potato Extract at Different PH. Food Chem. 2019, 274, 460–470. [Google Scholar] [CrossRef] [PubMed]
- Lao, F.; Giusti, M.M. The Effect of Pigment Matrix, Temperature and Amount of Carrier on the Yield and Final Color Properties of Spray Dried Purple Corn (Zea mays L.) Cob Anthocyanin Powders. Food Chem. 2017, 227, 376–382. [Google Scholar] [CrossRef] [PubMed]
- Weber, F.; Boch, K.; Schieber, A. Influence of Copigmentation on the Stability of Spray Dried Anthocyanins from Blackberry. LWT Food Sci. Technol. 2017, 75, 72–77. [Google Scholar] [CrossRef]
- Nemzer, B.; Vargas, L.; Xia, X.; Sintara, M.; Feng, H. Phytochemical and Physical Properties of Blueberries, Tart Cherries, Strawberries, and Cranberries as Affected by Different Drying Methods. Food Chem. 2018, 262, 242–250. [Google Scholar] [CrossRef]
- Lima-Corrêa, R.A.B.; Andrade, M.S.; da Silva, M.F.d.G.F.; Freire, J.T.; Ferreira, M.d.C. Thin-Layer and Vibrofluidized Drying of Basil Leaves (Ocimum basilicum L.): Analysis of Drying Homogeneity and Influence of Drying Conditions on the Composition of Essential Oil and Leaf Colour. J. Appl. Res. Med. Aromat. Plants 2017, 7, 54–63. [Google Scholar]
- Badulescu, L.; Dobrin, A.; Stan, A.; Mot, A.; Bujor, O.C. Drying treatment effects on anthocyanins of organic raspberry (cv. Heritage) fruit. In Proceedings of the Third Nordic Baltic Drying Conference, Saint Petersburg, Russia, 12–14 June 2019; pp. 48–53. [Google Scholar]
- USDA (United States Department of Agriculture Agricultural Research Service), 11209 Report, Raw Eggplant. Available online: https://ndb.nal.usda.gov/ndb/foods/show/2962 (accessed on 17 April 2019).
- Kandoliya, U.K.; Bajaniya, V.K.; Bhadja, N.K.; Bodar, N.P.; Golakiya, B.A. Antioxidant and Nutritional of Egg Plant (Solanun melongena L.) Fruit Grown in Saurastra Region. Intern. J. Curr. Microbiol. Appl. Sci. 2015, 4, 806–813. [Google Scholar]
- Agoreyo, B.O.; Obansa, E.S.; Obanor, E.O. Comparative nutritional and phytochemical analyses of two varieties of Solanum melongena. Sci. World J. 2012, 7, 5–8. [Google Scholar]
- Raigón, M.D.; Prohens, J.; Muñoz-Falcón, J.E.; Nuez, F. Comparison of Eggplant Landraces and Commercial Varieties for Fruit Content of Phenolics, Minerals, Dry Matter and Protein. J. Food Compos. Anal. 2008, 21, 370–376. [Google Scholar] [CrossRef]
- Ossamulu, I.; Akanya, H.; Jigam, A.; Egwim, E. Evaluation of Nutrient and Phytochemical Constituents of Four Eggplant Cultivars. Elixir Food Sci. 2014, 73, 26424–26428. [Google Scholar]
- Ayas, F.A.; Colak, N.; Topuz, M.; Tarkowski, P.; Jaworek, P.; Seiler, G.; Inceer, H. Comparison of Nutrient Content in Fruit of Commercial Cultivars of Eggplant (Solanum melongena L.). Pol. J. Food Nutr. Sci. 2015, 65, 251–259. [Google Scholar]
- Kayashima, T.; Katayama, T. Oxalic acid is available as a natural antioxidant in some systems. Biochim. Biophys. Acta 2002, 1573, 1–3. [Google Scholar] [CrossRef]
- Wang, Q.; Lai, T.; Qin, G.; Tian, S. Response of Jujube Fruits to Exogenous Oxalic Acid Treatment Based on Proteomic Analysis. Plant. Cell Physiol. 2009, 50, 230–242. [Google Scholar] [CrossRef] [PubMed] [Green Version]
- Barberis, A.; Cefola, M.; Pace, B.; Azara, E.; Spissu, Y.; Serra, P.A.; Logrieco, A.F.; D’hallewin, G.; Fadda, A. Postharvest Application of Oxalic Acid to Preserve Overall Appearance and Nutritional Quality of Fresh-Cut Green and Purple Asparagus during Cold Storage: A Combined Electrochemical and Mass-Spectrometry Analysis Approach. Postharvest Biol. Technol. 2019, 148, 158–167. [Google Scholar] [CrossRef]
- Cheng, C.; Zhou, Y.; Lin, M.; Wei, P.; Yang, S.T. Polymalic Acid Fermentation by Aureobasidium Pullulans for Malic Acid Production from Soybean Hull and Soy Molasses: Fermentation Kinetics and Economic Analysis. Bioresour. Technol. 2017, 223, 166–174. [Google Scholar] [CrossRef] [PubMed]
- Jang, S.A.; Park, D.W.; Kwon, J.E.; Song, H.S.; Park, B.; Jeon, H.; Sohn, E.H.; Koo, H.J.; Kang, S.C. Quinic Acid Inhibits Vascular Inflammation in TNF-α-Stimulated Vascular Smooth Muscle Cells. Biomed. Pharm. 2017, 96, 563–571. [Google Scholar] [CrossRef] [PubMed]
- Karam, J.; del Mar Bibiloni, M.; Pons, A.; Tur, J.A. Total Fat and Fatty Acid Intakes and Food Sources in Mediterranean Older Adults Requires Education to Improve Health. Nutr. Res. 2020, 73, 67–74. [Google Scholar] [CrossRef]
- Hanifah, A.; Maharijaya, A.; Putri, S.P.; Laviña, W.A.; Sobir. Untargeted Metabolomics Analysis of Eggplant (Solanum melongena L.) Fruit and Its Correlation to Fruit Morphologies. Metabolites 2018, 8, 49. [Google Scholar] [CrossRef] [PubMed] [Green Version]
- Park, S.H.; Min, T.S. Caffeic Acid Phenethyl Ester Ameliorates Changes in IGFs Secretion and Gene Expression in Streptozotocin-Induced Diabetic Rats. Life Sci. 2006, 78, 1741–1747. [Google Scholar] [CrossRef]
- Araújo, V.M. Estudo do Potencial Terapêutico do Ácido Cafeico em Protocolos de Diabetes e Dislipidemia em Camundongos. Master’s Thesis, Universidade Federal do Ceará, Fortaleza, Brazil, 2014; 99p. [Google Scholar]
- Kakkar, S.; Bais, S. A Review on Protocatechuic Acid and Its Pharmacological Potential. ISRN Pharm. 2014, 2014, 1–9. [Google Scholar] [CrossRef] [Green Version]
- Forino, M.; Tenore, G.C.; Tartaglione, L.; Carmela, D.; Novellino, E.; Ciminiello, P. (1S,3R,4S,5R)5-O-Caffeoylquinic Acid: Isolation, Stereo-Structure Characterization and Biological Activity. Food Chem. 2015, 178, 306–310. [Google Scholar] [CrossRef]
- Song, S.E.; Jo, H.J.; Kim, Y.W.; Cho, Y.J.; Kim, J.R.; Park, S.Y. Delphinidin Prevents High Glucose-Induced Cell Proliferation and Collagen Synthesis by Inhibition of NOX-1 and Mitochondrial Superoxide in Mesangial Cells. J. Pharm. Sci. 2016, 130, 235–243. [Google Scholar] [CrossRef] [PubMed] [Green Version]
- Lee, D.Y.; Park, Y.J.; Hwang, S.C.; Kim, K.D.; Moon, D.K.; Kim, D.H. Cytotoxic Effects of Delphinidin in Human Osteosarcoma Cells. Acta Orthop. Traumatol. Turc. 2018, 52, 58–64. [Google Scholar]
- Niño-Medina, G.; Urías-Orona, V.; Muy-Rangel, M.D.; Heredia, J.B. Structure and Content of Phenolics in Eggplant (Solanum melongena)-A Review. South. Afr. J. Bot. 2017, 111, 161–169. [Google Scholar] [CrossRef]
- Wu, X.; Prior, R.L. Identification and Characterization of Anthocyanins by High-Performance Liquid Chromatography-Electrospray Ionization-Tandem Mass Spectrometry in Common Foods in the United States: Vegetables, Nuts, and Grains. J. Agric. Food Chem. 2005, 53, 3101–3113. [Google Scholar] [CrossRef] [PubMed]
- García-Salas, P.; Gómez-Caravaca, A.M.; Morales-Soto, A.; Segura-Carretero, A.; Fernández Gutiérrez, A. Identification and quantification of phenolic compounds in diverse cultivars of eggplant grown in different seasons by high performance liquid chromatography coupled to diode array detector and electrospray-quadrupole-time of flight-mass spectrometry. Food Res. Int. 2014, 57, 114–122. [Google Scholar] [CrossRef]
- Salerno, L.; Modica, M.N.; Pittalà, V.; Romeo, G.; Siracusa, M.A.; Di Giacomo, C.; Sorrenti, V.; Acquaviva, R. Antioxidant Activity and Phenolic Content of Microwave-Assisted Solanum melongena Extracts. Sci. World J. 2014, 2014. [Google Scholar] [CrossRef] [PubMed] [Green Version]
- Horincar, G.; Enachi, E.; Bolea, C.; Râpeanu, G.; Aprodu, I. Value-Added Lager Beer Enriched with Eggplant (Solanum melongena L.) Peel Extract. Molecules 2020, 25, 731. [Google Scholar] [CrossRef] [Green Version]
- Bartwal, A.; Mall, R.; Lohani, P.; Guru, S.K.; Arora, S. Role of secondary metabolites and brassinosteroids in plant defense against environmental stresses. J. Plant Growth Regul. 2013, 32, 216–232. [Google Scholar] [CrossRef]
- Akanitapichat, P.; Phraibung, K.; Nuchklang, K.; Prompitakkul, S. Antioxidant and Hepatoprotective Activities of Five Eggplant Varieties. Food Chem. Toxicol. 2010, 48, 3017–3021. [Google Scholar] [CrossRef]
- Hong, H.; Lee, J.H.; Kim, S.K. Phytochemicals and Antioxidant Capacity of Some Tropical Edible Plants. Asian Australas. J. Anim. Sci. 2018, 31, 1677–1684. [Google Scholar] [CrossRef]
- Muangrat, R.; Pongsirikul, I.; Blanco, P.H. Ultrasound assisted extraction of anthocyanins and total phenolic compounds from dried cob of purple waxy corn using response surface methodology. J. Food Process. Pres. 2018, 42, 1–11. [Google Scholar] [CrossRef]
- Taofiq, O.; Corrêa, R.C.G.; Barros, L.; Prieto, M.A.; Bracht, A.; Peralta, R.M.; González-Paramás, A.M.; Barreiro, M.F.; Ferreira, I.C.F.R. A Comparative Study between Conventional and Non-Conventional Extraction Techniques for the Recovery of Ergosterol from Agaricus blazei Murrill. Food Res. Int. 2019, 125, 108541. [Google Scholar] [CrossRef] [PubMed] [Green Version]


| Extraction | Time (min) | Solvent (%) | Ratio (g/L) |
|---|---|---|---|
| 1 | −1 | −1 | −1 |
| 2 | −1 | −1 | 1 |
| 3 | −1 | 1 | −1 |
| 4 | −1 | 1 | 1 |
| 5 | 1 | −1 | −1 |
| 6 | 1 | −1 | 1 |
| 7 | 1 | 1 | −1 |
| 8 | 1 | 1 | 1 |
| 9 | −1.68 | 0 | 0 |
| 10 | 1.68 | 0 | 0 |
| 11 | 0 | −1.68 | 0 |
| 12 | 0 | 1.68 | 0 |
| 13 | 0 | 0 | −1.68 |
| 14 | 0 | 0 | 1.68 |
| 15 | 0 | 0 | 0 |
| 16 | 0 | 0 | 0 |
| 17 | 0 | 0 | 0 |
| 18 | 0 | 0 | 0 |
| 19 | 0 | 0 | 0 |
| 20 | 0 | 0 | 0 |
| Color Evaluation Parameters | Fresh Epicarp | Lyophilized Epicarp | p-Value |
|---|---|---|---|
| L* | 26.2 ± 0.5 | 34 ± 2 | <0.01 |
| a* | 5.1 ± 0.2 | 2.8 ± 0.1 | <0.01 |
| b* | 1.5 ± 0.1 | −0.17 ± 0.01 | <0.01 |
| Epicarp color |
| Nutritional Value | Whole Fruit | Pulp | p-Value |
|---|---|---|---|
| Humidity (g/100 g fw) | 91.3 ± 0.3 | 92.9 ± 0.4 | 0.944 |
| Ashes (g/100 g fw) | 0.56 ± 0.01 | 0.56 ± 0.02 | 0.862 |
| Proteins (g/100 g fw) | 0.86 ± 0.02 | 0.78 ± 0.03 | 0.729 |
| Fat (g/100 g fw) | 0.050 ± 0.002 | 0.040 ± 0.001 | <0.01 |
| Carbohydrates (g/100 g fw) | 3.0 ± 0.1 | 2.89 ± 0.01 | 0.893 |
| Energy (kcal/100 g fw) | 32.6 ± 1.1 | 27.5 ± 0.6 | 0.869 |
| Energy (KJ/100 g fw) | 137 ± 4 | 115 ± 2 | 0.869 |
| Free Sugars (g/100 g fw) | |||
|---|---|---|---|
| Whole Fruit | Pulp | p-Value | |
| Fructose | 1.26 ± 0.01 | 1.26 ± 0.1 | 0.093 |
| Glucose | 1.29 ± 0.03 | 1.25 ± 0.01 | <0.01 |
| Sucrose | 0.43 ± 0.02 | 0.260 ± 0.004 | <0.01 |
| Trehalose | 0.100 ± 0.001 | 0.080 ± 0.003 | 0.201 |
| Total sugars | 3.0 ± 0.1 | 2.89 ± 0.01 | <0.01 |
| Organic acids (g/100 g fw) | |||
| Oxalic | 0.381 ± 0.005 | 0.38 ± 0.01 | 0.966 |
| Quinic | 0.13 ± 0.02 | 0.108 ± 0.002 | <0.01 |
| Malic | 0.349 ± 0.004 | 0.33 ± 0.02 | <0.01 |
| Fumaric | tr | nd | - |
| Total organic acids | 0.86 ± 0.03 | 0.82 ± 0.2 | <0.01 |
| Fatty acids (%) | |||
| C6:0 | 0.56 ± 0.01 | 0.59 ± 0.02 | <0.01 |
| C8:0 | 0.67 ± 0.03 | 0.84 ± 0.01 | <0.01 |
| C10:0 | 1.61 ± 0.04 | 2.165 ± 0.002 | <0.01 |
| C11:0 | 1.1 ± 0.1 | 0.58 ± 0.03 | <0.01 |
| C12:0 | 1.25 ± 0.03 | 1.12 ± 0.04 | 0.516 |
| C14:0 | 2.63 ± 0.03 | 2.7 ± 0.1 | 0.017 |
| C15:0 | 0.56 ± 0.03 | 0.54 ± 0.01 | 0.077 |
| C16:0 | 40.5 ± 0.9 | 44.8 ± 0.2 | <0.01 |
| C17:0 | 1.103 ± 0.002 | 0.99 ± 0.02 | <0.01 |
| C18:0 | 24.4 ± 0.2 | 24.4 ± 0.4 | 0.443 |
| C18:1n9c | 4.5 ± 0.2 | 5.5 ± 0.3 | 0.462 |
| C18:2n6c | 8.0 ± 0.4 | 4.10 ± 0.05 | <0.01 |
| C18:3n3 | 3.8 ± 0.1 | 0.79 ± 0.01 | <0.01 |
| C20:0 | 4.6 ± 0.2 | 5.2 ± 0.1 | 0.153 |
| C22:0 | 1.60 ± 0.04 | 1.69 ± 0.03 | 0.489 |
| C23:0 | 0.91 ± 0.03 | 1.12 ± 0.02 | 0.213 |
| C24:0 | 2.3 ± 0.1 | 2.86 ± 0.04 | <0.01 |
| SFA | 83.8 ± 0.6 | 89.6 ± 0.3 | 0.082 |
| MUFA | 4.5 ± 0.2 | 5.5 ± 0.3 | 0.462 |
| PUFA | 11.8 ± 0.4 | 4.89 ± 0.04 | <0.01 |
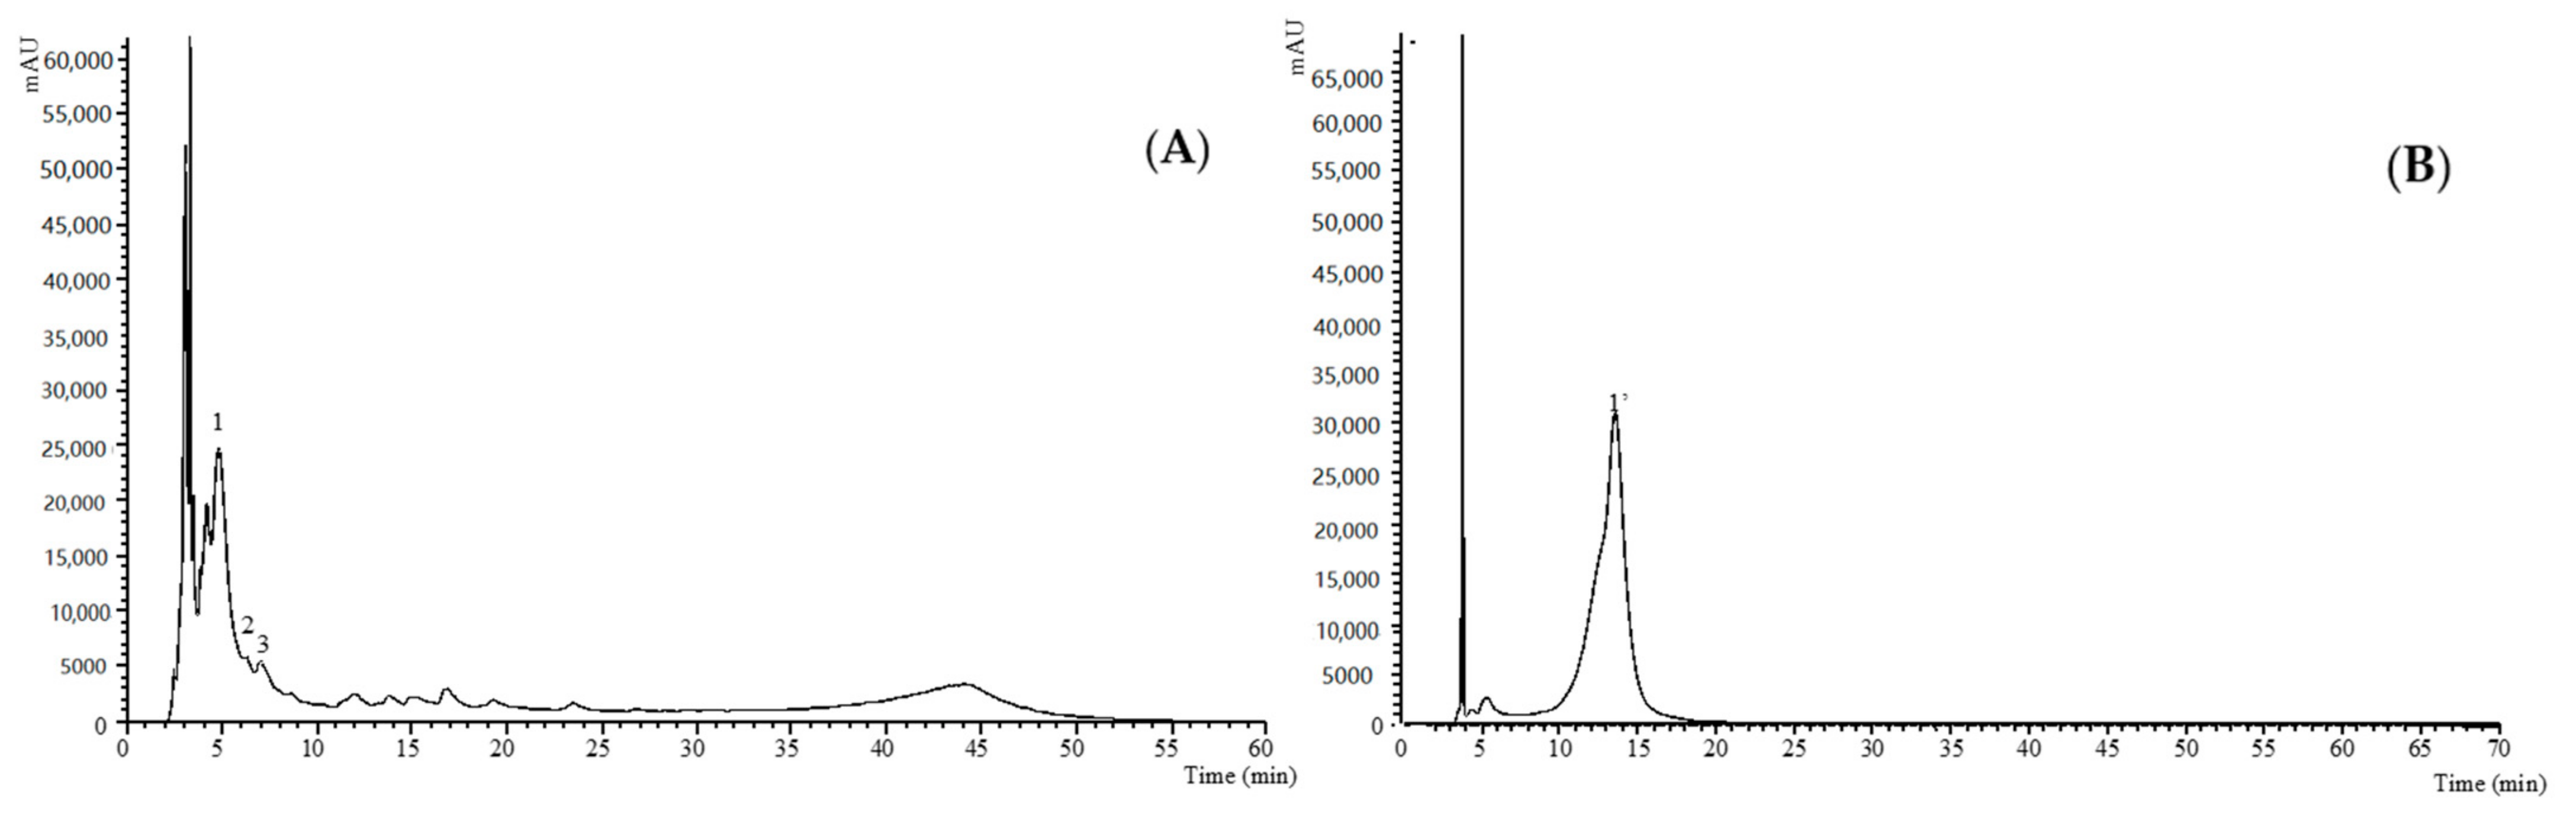
| Peak | Tr (min) | λmax (nm) | (M−H)− | ESI-MSn (Intensity (%)) | Attempted Identification | Quantification (mg/g Extract) | ||
| Whole Fruit | Pulp | Epicarp | ||||||
| 1 | 4.85 | 322 | 341 | 179(100),135(14) | Caffeic acid hexoside 1 | 0.0025 ± 0.0001 b | 0.0062 ± 0.0004 a | nd |
| 2 | 5.33 | 294 | 153 | 108(100) | Protocatechuic acid 2 | nd | nd | 0.37 ± 0.02 |
| 3 | 6.92 | 325 | 353 | 191(100),179(12),135(1) | 5-O-caffeoylquinic acid 3 | 0.0159 ± 0.0002 c | 0.0337 ± 0.0004 b | 0.96 ± 0.01 a |
| Total phenolic acids | 0.0184 ± 0.0003 c | 0.0399 ± 0.0008 b | 1.34 ± 0.03 a | |||||
| Peak | Tr (min) | λmax (nm) | (M+H)+ | ESI-MSn (Intensity (%)) | Attempted Identification | Quantification (mg/g Extract) | ||
| Whole Fruit | Pulp | Epicarp | ||||||
| 1′ | 13.56 | 523 | 611 | 303(100) | Delphinidin-O-rutinoside 4 | nd | nd | 9.2 ± 0.2 |
| Concentration | |||
|---|---|---|---|
| Antioxidant Activity | Whole Fruit | Pulp | Epicarp |
| TBARS (Values of EC50, µg/mL) | 8941 ± 284 a | 4291 ± 178 b | 135 ± 6 c |
| OxHLIA (Values of EC50, µg/mL) | 119 ± 7 a | 82 ± 3 b | 34 ± 1 c |
| Antibacterial Activity | |||||||
|---|---|---|---|---|---|---|---|
| Extracts | S.a. | L.m. | E.c. | En.cl. | S.t. | ||
| Epicarp | MIC | 4.00 | 4.00 | 2.00 | 4.00 | 4.00 | |
| MBC | 8.00 | 8.00 | 4.00 | 8.00 | 8.00 | ||
| Whole fruit | MIC | 4.00 | 4.00 | 2.00 | 4.00 | 4.00 | |
| MBC | 8.00 | 8.00 | 4.00 | 8.00 | 8.00 | ||
| Pulp | MIC | 4.00 | 4.00 | 2.00 | 8.00 | 8.00 | |
| MBC | 8.00 | 8.00 | 4.00 | 8.00 | 8.00 | ||
| Ampicillin | MIC | 0.012 | 0.40 | 0.40 | 0.006 | 0.75 | |
| MBC | 0.025 | 0.50 | 0.50 | 0.012 | 1.20 | ||
| Antifungal Activity | |||||||
| Extracts | A.fum. | A.v. | A.n. | P.f. | P.o. | T.v. | |
| Epicarp | MIC | >8.00 | >8.00 | >8.00 | >8.00 | >8.00 | >8.00 |
| MFC | >8.00 | >8.00 | >8.00 | >8.00 | >8.00 | >8.00 | |
| Whole fruit | MIC | >8.00 | >8.00 | >8.00 | >8.00 | >8.00 | >8.00 |
| MFC | >8.00 | >8.00 | >8.00 | >8.00 | >8.00 | >8.00 | |
| Pulp | MIC | >8.00 | >8.00 | >8.00 | 8.00 | 1.00 | >8.00 |
| MFC | >8.00 | >8.00 | >8.00 | 8.00 | 1.00 | >8.00 | |
| Ketoconazole | MIC | 0.20 | 0.20 | 0.20 | 0.20 | 0.20 | 0.20 |
| MFC | 0.50 | 0.50 | 0.50 | 0.50 | 0.50 | 0.30 | |
| Cytotoxic Activity | |||
|---|---|---|---|
| GI50 (µg/mL) | Whole Fruit | Pulp | Epicarp |
| HeLa | >400 | >400 | 337 ± 7 |
| NCI-H460 | >400 | >400 | 338 ± 16 |
| MCF 7 | >400 | >400 | >400 |
| HepG2 | >400 | >400 | 284 ± 10 |
| PLP2 | >400 | >400 | >400 |
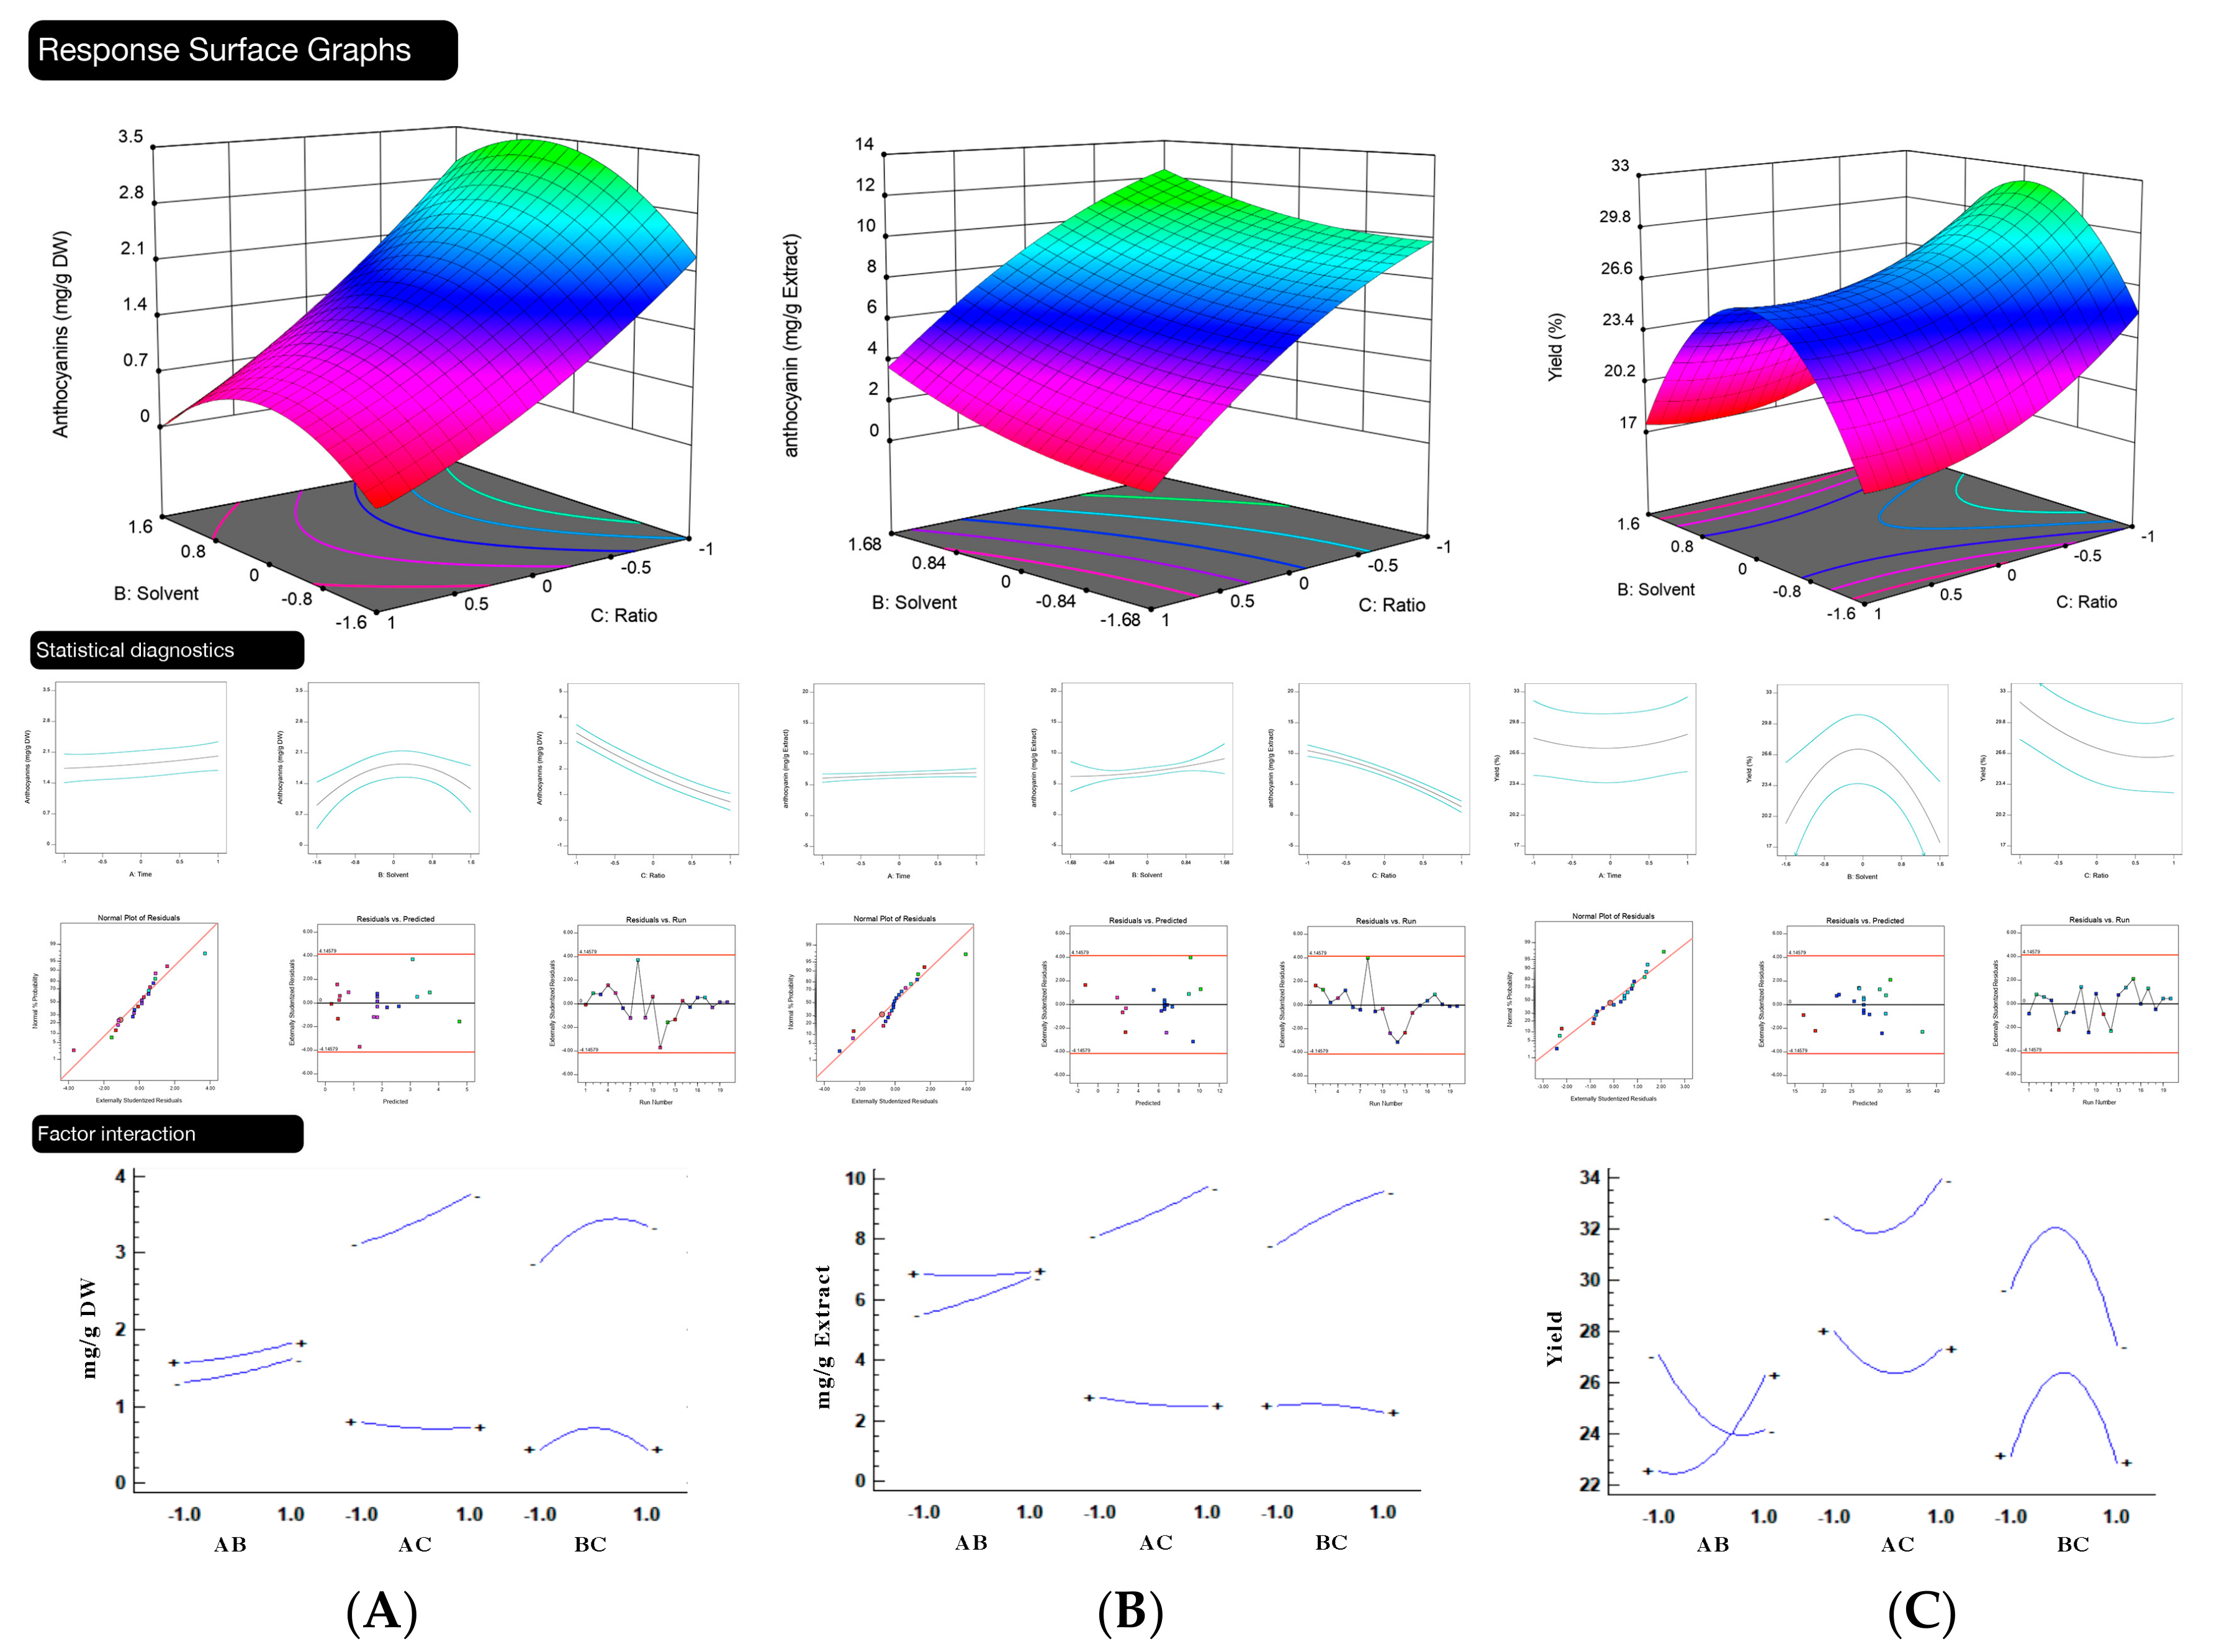
| Extraction | ||||
|---|---|---|---|---|
| Y1 | Y2 | Y3 | ||
| Model | <0.0001 | 0.00 | <0.0001 | |
| Intercept | b0 | 1.83 (***) | 6.61 (***) | 27.34 (***) |
| Linear | b1 | 0.1398 (NS) | 0.4445 (NS) | 0.1962 (NS) |
| b2 | 0.1163 (NS) | −0.7166 (*) | −0.6195 (NS) | |
| b3 | −1.34 (***) | −1.86 (***) | −5.1 (***) | |
| Interaction | b12 | −0.0113 (NS) | −0.2858 (NS) | 1.66 (NS) |
| b13 | −0.1738 (NS) | −0.4649 (*) | −0.5325 (NS) | |
| b23 | −0.1163 (NS) | −0.4955 (*) | 0.4913 (NS) | |
| Quadratic | b11 | 0.0387 (NS) | −0.0827 (NS) | 0.028 (NS) |
| b22 | −0.290 (**) | −0.3197(NS) | −4.62 (***) | |
| b33 | 0.2261 (*) | −1.05 (***) | 6.61 (***) | |
| Adaptation analysis statistical information | ||||
| Observations | 20 | 20 | 20 | |
| R2 | 0.96 | 0.94 | 0.94 | |
| R2adj | 0.93 | 0.98 | 0.88 | |
| Factorial optimization response | ||||
| max | max | max | ||
| Optimal value | 5.64 | 12.15 | 43.04 | |
| X1 | 0.54 | 0.52 | 0.55 | |
| X2 | 64.2398 | 58.4479 | 54.1773 | |
| X3 | 4.65966 | 4.65966 | 4.66865 | |
| General optimization | ||||
| max | max | max | ||
| Optimal response (Y) | 5.53 | 11.96 | 40.96 | |
| Desirability | 1 | |||
| Optimal factorial value | X1 = 0.5 | X2 = 68.2 | X3 = 5 | |
Publisher’s Note: MDPI stays neutral with regard to jurisdictional claims in published maps and institutional affiliations. |
© 2020 by the authors. Licensee MDPI, Basel, Switzerland. This article is an open access article distributed under the terms and conditions of the Creative Commons Attribution (CC BY) license (http://creativecommons.org/licenses/by/4.0/).
Share and Cite
Silva, G.F.P.; Pereira, E.; Melgar, B.; Stojković, D.; Sokovic, M.; Calhelha, R.C.; Pereira, C.; Abreu, R.M.V.; Ferreira, I.C.F.R.; Barros, L. Eggplant Fruit (Solanum melongena L.) and Bio-Residues as a Source of Nutrients, Bioactive Compounds, and Food Colorants, Using Innovative Food Technologies. Appl. Sci. 2021, 11, 151. https://0-doi-org.brum.beds.ac.uk/10.3390/app11010151
Silva GFP, Pereira E, Melgar B, Stojković D, Sokovic M, Calhelha RC, Pereira C, Abreu RMV, Ferreira ICFR, Barros L. Eggplant Fruit (Solanum melongena L.) and Bio-Residues as a Source of Nutrients, Bioactive Compounds, and Food Colorants, Using Innovative Food Technologies. Applied Sciences. 2021; 11(1):151. https://0-doi-org.brum.beds.ac.uk/10.3390/app11010151
Chicago/Turabian StyleSilva, Gabriel F. Pantuzza, Eliana Pereira, Bruno Melgar, Dejan Stojković, Marina Sokovic, Ricardo C. Calhelha, Carla Pereira, Rui M. V. Abreu, Isabel C. F. R. Ferreira, and Lillian Barros. 2021. "Eggplant Fruit (Solanum melongena L.) and Bio-Residues as a Source of Nutrients, Bioactive Compounds, and Food Colorants, Using Innovative Food Technologies" Applied Sciences 11, no. 1: 151. https://0-doi-org.brum.beds.ac.uk/10.3390/app11010151