Article

Estimating Health Impacts Due to the Reduction of Particulate Air Pollution from the Household Sector Expected under Various Scenarios

by
Łukasz Adamkiewicz
1,*,
Maciej Kryza
2,
Dominika Mucha
1,3,
Małgorzata Werner
2,
Anna Gayer
4,
Anetta Drzeniecka-Osiadacz
2 and
Tymoteusz Sawiński
2
1
European Clean Air Centre, 31-104 Cracow, Poland
2
Department of Climatology and Atmosphere Protection, University of Wroclaw, 51-621 Wroclaw, Poland
3
Department of Informatics and Environmental Quality Research, Warsaw University of Technology, 00-653 Warsaw, Poland
4
Foundation # 13 Center for Climate Change and Sustainable Development, 03-137 Warsaw, Poland
*
Author to whom correspondence should be addressed.
Submission received: 22 November 2020 / Revised: 18 December 2020 / Accepted: 24 December 2020 / Published: 30 December 2020

Abstract

:

Featured Application

This paper provides an example to support air pollution reduction policies with health effects arguments.

Abstract

Emissions from the household sector are the most significant source of air pollution in Poland, one of the most polluted countries in the EU. Estimated health impacts of the reduction of these emissions under three scenarios are presented. The EMEP4PL model and base year emission inventory were used to estimate average annual PM10 and PM2.5 concentrations with spatial resolution of 4 km × 4 km. The change in emissions under each of the scenarios was based on data from a survey on household boilers and insulation. Scenario 1 included replacement of all poor-quality coal-fired boilers with gas boilers; Scenario 2 included replacement of all poor-quality coal-fired boilers with low-emission boilers but still using solid fuels; and Scenario 3 included the thermal refurbishment of houses with the worst insulation. Impacts on the following health parameters were estimated: premature deaths (PD), Chronic Bronchitis (CB), Bronchitis in Children (BiC) and Work Days Lost (WDL). The concentration–response functions recommended by the WHO HRAPIE project were used. The analysis was conducted for two regions: Lower Silesia and Lodzkie province. The largest reduction of health impact was observed for Scenario 1. For Lower Silesia, the annual PD decreased by 1122 (34.3%), CB by 1516 (26.6%), BiC by 9602 (27.7%) and WDL by 481k (34.7%). For Lodzkie province, the largest impacts were estimated as decreases in PD by 1438 (29.9%), CB by 1502 (25.3%), BiC by 9880 (26.8%) and WDL by 669k (30.4%).

1. Introduction

Ambient air pollution is the world’s most significant environmental health risk factor, contributing to 4.2 million deaths per year [1]. This equals on average approximately 55 deaths annually per 100,000 population (per 100k a.). Epidemiological studies confirm that particulate matter (PMx) has the greatest impact on health among all pollutants [2,3]. PMx has been associated with many adverse health outcomes, for example chronic cardiovascular and respiratory disease, decreased lung function leading to increased risks of hospitalizations and premature death [4,5,6]. More than 400,000 premature deaths in the EU were found to be attributable to air quality [7]. Among the most polluted areas in Europe are Poland, Hungary, Bulgaria, the Czech Republic, Slovakia and the northern part of Italy. According to the latest research, air pollution reduces life expectancy in Poland by 2.8 years, compared to 2.2 years in the whole of Europe [8].
Estimating these impacts is possible thanks to the methods and meta-analysis provided worldwide by international organizations such as the World Health Organization [1], European Environment Agency [7] and the Institute for Health Metrics and Evaluation [9]. One of the key elements of these assessments is a relative risk that allows the calculation of the fractions of diseases attributable to air pollution [10]. Two other necessary components are a population with health indicators and air pollutants concentration [11]. The first relates to a database on an international level that presents population density with average health indicators. Data on air quality (e.g., the concentration of atmospheric pollutants) are usually provided by monitoring stations or atmospheric transport models (ATMs).
Although particulate matter (PM10 and PM2.5) concentrations have slightly decreased in recent years in many Polish cities, concentrations are still higher than those in most European countries [7]. The most important air pollution-related problem in Poland is the emission from municipal and household sources and the increased consumption of solid fuels for heating purposes in the heating season. As a result, high concentrations of pollutants occur primarily in the cold season. According to latest reports by the Chief Inspectorate for Environmental Protection, in terms in Air quality in Poland, the Polish government faces the biggest problem with meeting the PM10 daily limit standard, e.g., in 2018, this level was exceeded in 39 of the 46 air quality zones. Thus, almost all provinces in Poland should take intensive actions to achieve the necessary standards of air quality. During the last few years, some local authorities (among others, the Marshal’s Office of Lower Silesia province and Lodzkie province) have implemented ambitious measures to reduce emissions, especially from the residential sector. The local laws, the so-called “Anti-smog regulations”, have entered into force since 2017. The implementation of local law will force homeowners to modernize their heating by exchanging old furnaces for more ecological ones (e.g., using gas, electricity, or zero-emissions systems) and to fulfil thermo-modernization of private homes. Moreover, in Wroclaw, a ban on the use of coal in individual furnaces and boiler rooms is planned. Quantifying the benefits (e.g., positive health effects) of future actions, especially concerning the costs incurred, is a necessary step in evaluating the effectiveness of new regulations and programs. It allows us to compare alternative strategies and provides the information to effectively communicate to residents about the necessity of taking efforts [12].
Health Impact Assessment (HIA) allows not only to estimate the current impact of air pollution but also to calculate the expected results of various interventions. Policies may relate to a specific source of air pollution, such as residential sectors, road transport, or industrial activities [13]. For example, in China, upgrading all household heating from solid fuels to gas, electricity or district heating would reduce the number of premature deaths related to ambient air pollution by 36.7 per 100k a. (per 100k population annually). [14]. In India, removing emissions from residential energy use would avoid 19.7 premature mortalities per 100k a. [15].
Analysis of the health effect due to air pollution can also focus on all major sources of air pollution to provide recommendations for strategies at particular administration levels. The research concluded in Warsaw, Poland shows that 70.6 per 100k a. deaths are attributable to the inflow of air pollution from outside the municipality borders, and 63.6 per 100k a are caused by air pollution emitted within the administrative borders of the municipality. It has also been demonstrated that the highest contributions in the Warsaw area are households with 40 per 100k a., followed by transport with 22 per 100k a. and finally industry with 1 per 100k a. [16]. The contribution of out-border sources is important in evaluating the possibilities of administration intervention.
Shifting private road transport by 40% to public transport and cycling in Adelaide, Australia would reduce annual PM2.5 by 0.40 ug/m3 avoiding 0.93 per 100k a. deaths and saving 8.43 per 100k a. Disability Adjusted Life Years (DALYs) [17]. Intervention can also relate to the infrastructure; for instance, in Antwerp, Belgium relocating the ring road into tunnels with filters would avoid 11.5 deaths per 100k a. [18]. Investigation can also provide information on specific road transport conditions. For instance, traffic congestion in the Greater Toronto and Hamilton Area, Canada causes 3 deaths per 100k a. from air pollution; HIA can be useful to choose the best municipal transport policy [19].
In most circumstances, the large point emission sources have adopted mandatory measures to reduce emissions of air pollution and their direct impact on regional air quality would be minor. However, the area over which pollution is dispersed from point sources can be significantly larger compared to area sources or household sources. Retiring two coal-fired power plants in the Southern Front Range region of Colorado State, USA would lead to the reduction of 0.05 premature deaths per 100k a. [20] due to the lower exposition to PM2.5. Health impacts can also be estimated for future industry plants. The planned coal-fired power plant in Taiwan would cause 1.44 deaths per 100k a. in the area of the whole country [21]. Industry has smaller effects normalized per population than road transport, but, due to its impact over a larger area, it can have higher cumulative results.
The main aim of this study was to estimate the potential health benefits of strategy to reduce particulate matter emission from the household sector in two regions in Poland—Lower Silesia with a population of 2.89M and Lodzkie province with 2.46M. Three scenarios were analyzed: (1) changing all lowest quality solid-fuel boilers to gas boilers; (2) replacing those boilers with the highest class of coal-fired boilers; and (3) thermal efficiency improvement of households with the highest energy losses. Household emission is the main contributor to air pollution in Poland [22]. The regions were chosen to represent a mountain region and lowlands. Additionally, both have high PM concentration and similar population.

2. Materials and Methods

2.1. Emission Data for Scenarios

Emission reductions due to potential interventions in each scenario were based on an analysis of the Energy Efficiency in Poland Report (EE) created by the Polish Institute of Environmental Economics [23]. This report consists of various publicly available data in Poland, and, additionally, it consists of a national survey based on a representative group providing unique data on the shares of boiler types in households.
The first part of the information was about the share of heating boilers types. There is currently no obligation or system for recording the number of solid fuel-fired boilers in Poland. Therefore, data from the survey were the only available information at the time of analysis. Since the lowest quality solid-fuel boilers were analyzed in Scenarios 1 and 2, data on wood or coal boilers were used. The majority of solid-fuel boilers used in households are highly emitting, approximately 81.5%, which was the number used for Scenarios 1 and 2.
Data on the emission per boiler were used to calculate the potential reduction. Data from the national study were used to take into account the solid fuel characteristics in Poland [24]. Emission per unit of energy was used (g/GJ), as shown in Table 1.
Scenarios 1 and 2 assume that hard coal of the lowest quality was replaced. The EE provides additional information about the age of the boiler; taking this into account, boiler emission was set to 420 g/GJ, new units were assumed to be a mix of automatic and manual with 100 g/GJ, and gas was set to 0.5 g/GJ. Since particulate emission from burning gas compared to coal and biomass is negligible, we assumed that whole household PM10 and PM2.5 come from solid fuels. Therefore, for Scenario 1, 81.5% of manual boilers of low quality with emission of 420 g/GJ were upgraded to gas 0.5 g/GJ, and for Scenario 2 to new high-quality boilers with 100 g/GJ.
Scenario 3 concerned the thermal refurbishment of households. For insulation data, the age of the building was selected. The assumption was that the houses were built according to the existing standards and materials available at the time of building. The age of buildings was collected from the Polish census of 2011 [25]. Data on energy consumption were taken from the EE, which is based on the energy standards in each period. Detailed information is presented in Table 2 and Table 3.
The differences between the two regions are due to destruction during World War II. Data come from the Polish census of 2011 and are the latest available with regional distribution. The thermal refurbishment scenario used an energy consumption per household of 45 kWh/m2 annually, which represents a low-energy building. It was assumed that households in buildings dating from before 1944 and during 1945–1988 need better insulation. A limitation of this approach is that it does not consider the existing refurbishment of houses. Since this information does not exist in Poland, it could not be included.
Emission reduction results produce a flat spatial difference, due to a lack of local data. Therefore, there is a single percentage reduction value for each scenario per region. However, the contribution of household emission is different in each cell of the grid used in the air quality modeling. Therefore, the same emission percentage reduction produces different concentration percentage reductions. Detailed reductions of emission are presented in Table 4.
Emission reductions for the household sector in Scenarios 1 and 2 for both regions are identical because data to differentiate the age and type of boiler at the regional level were unavailable. However, for Scenario 3, local data on the age of the building were available. Lodzkie province has higher emission reduction since the share of older buildings was greater in this region than in Lower Silesia. These results were used to modify the emission in the household sector in the cells of the grid, while emission data for other sectors remained the same.

2.2. Air Pollution Modeling and Emission Data

The EMEP/MSC-W model version 4.10 [26] was used to calculate air pollution concentrations throughout Poland (EMEP4PL). The model was originally developed at the Norwegian Meteorological Institute as part of the Co-operative Programme for Monitoring and Evaluation of the Long-range Transmission of Air Pollutants in Europe. It is a state-of-the-art Eulerian atmospheric chemistry transport model, which is applied to calculate concentrations of PM, O3 and S and N deposition for Europe. The model was released as OpenSource code in 2008 and is under continuous development to meet new objectives within the EMEP programme and other projects. The model is fully flexible in the domain and resolution of its application. It has been successfully applied at a high resolution (5 km and 1 km) scale over the UK [27,28,29]. Details on the regional application of the EMEP/MSC-W model over Poland are given in [30].
In this study, we used two one-way nested domains—the outer domain covers Europe on a 12 km × 12 km grid (d01), and the inner domain is focused on Poland at a 4 km × 4 km resolution (d02). The parent domain has 285 and 332 points in the west–east and south–-north directions, respectively. The model is coupled offline with meteorology, and we used the Weather Research and Forecasting (WRF) model version 3.8.1 [31] to calculate meteorological conditions to EMEP4PL [27]. The TNO MACC III emission database at 1/8° × 1/16° spatial resolution [32] was applied for the outer domain and the national database (1 km × 1 km) provided by the Chief Inspectorate of Environmental Protection was used for Poland in the inner domain.
The scenarios with EMEP4PL were run four times for the entire year 2015. The first scenario was run without any changes to the emission database; for the second, third and fourth runs, we used modified emission database. The particulate matter emissions for Lower Silesia and Lodzkie province were scaled by the emission factors described in the section above.

2.3. Health and Population Data

Health data were prepared using national sources and WHO population indicators. The population database was prepared based on the Central Statistical Office Local Bank. We used the 2015 dataset to be able to relate health information with the air quality dataset. The database includes information at the municipal level on population size and age structure, and the additional number of deaths with age structure was available at the county level [25]. The second source was the Social Insurance Institution, which provided data on days of absence on a regional level. Last, the HRAPIE indicator was used. By compiling this dataset, the health status of each municipality was calculated as follows:
  • deaths caused by natural causes, older than 30;
  • days of sickness absence, older than 18;
  • bronchitis among children, aged 6–18; and
  • chronic bronchitis among adults, older than 18.
Data from the first two indicators were directly assigned from the national database, and, if this was not possible, the population ratio from the higher tier administrative level to the municipal level was used. The number of bronchitis cases among children was calculated using WHO HRAPIE that estimated that approximately 18.6% of young people aged 6–18 are ill every year. The number of chronic bronchitis cases among adults was also calculated using the same method to show an incidence rate of 0.39%.
The database created contains population and health records for age groups in five-year increments. Death data start with 30–34 years old and ends with the group of 85 and over; work absence is recorded for ages 20–24 to 85 and over; children’s bronchitis for ages 5–9 to 15–19; and adult chronic bronchitis for age groups 20–24 to 85 and over. This database is not fully compatible with the WHO HRAPIE recommendation, because children are aged 6–18, not 5–19; however, since the analysis is used to compare different scenarios, the difference caused by this assumption is negligible. These records were prepared for each municipality in the region, in total 169 for Lower Silesia and 177 for Lodzkie province.

2.4. Methodology of the Health Impact Assessment

Health Impact Assessment methodology allows calculating the share of health effects that can be attributed to air pollution. To determine the level of exposure to air pollution, a population-weighted average concentration of annual PM10 and PM2.5 was calculated from the modeling results for each scenario including a baseline. For this purpose, the population was taken from the 2011 national census with a 1 km × 1 km grid (https://geo.stat.gov.pl/aktualnosci/-/asset_publisher/jNfJiIujcyRp/content/id/45261—accessed on 3 March 2020). To calculate the share of health effects attributed to air pollution, the concentration–response function based on Relative Risk (RR) was used. WHO HRAPIE was used as the source since it provides meta-analysis results and is used in Europe by the European Environment Agency [7]. The RR used for an increase of 10 µg/m3 of annual average concertation is as follows:
  • Premature death from natural causes—1.062; pollutant metric PM2.5;
  • Bronchitis among children—1.080; pollutant metric PM10;
  • Chronic bronchitis among adults—1.117; pollutant metric PM10; and
  • Work absence—1.046; pollutant metric PM2.5.
Relative Risk, concentration of air pollution and health data were used as stated below
N H E _ p o l = N H E ( 1 e x p l n R R b c o n c )
where NHE_pol is the number of health effects caused by air pollution; NHE is the number of health effects from all causes; RR is an indicator that is determined from the relative risk function for a given health effect; b is the concentration of air pollution for which RR was derived (for this calculation, 10 µg/m3 was used); and conc is the value of the concentration of atmospheric air pollutants to which a given municipal population is exposed.
This formula was used for each health impact individually for municipalities and particular scenarios. The difference in the number of adverse health effects between the emission reduction and baseline scenarios was defined as the potential health benefit for each municipality, and their sum as a gain for the region.

3. Results

3.1. Reduction of Air Pollution

Air pollution reduction was calculated for each municipality as the difference between a particular scenario and the baseline concentration. The results with the population data were then recalculated as PM10 and PM2.5 annual concentration weighted with a population. Some results from the air quality modeling are presented in Figure 1a–d.
The spatial air pollution concentrations weighted with the population presented above are some of the results obtained for each of the four model runs (baseline and three reduction scenarios). The next step was a population-weighted concentration, and the results for whole regions are presented in Table 5.
The biggest reduction was obtained for Scenario 1 for every region and pollutant. Changing to the highest class of solid fuel boiler (Scenario 2) gave a visibly lower reduction than phasing out coal and biomass in the household sector (Scenario 1). The percentage reduction for Scenario 1 for PM2.5 for Lower Silesia equals 35.6% and for Lodzkie province 31.7%, while for PM10 it is 30.4% and 30.1%, respectively. The lower air quality in Lodzkie province compared to Lower Silesia produced a higher reduction of PM2.5, since the emission scenarios were percentage based. It is worth noting that the data in Table 5 cannot be directly related to measurements from the monitoring station since they are based on population-weighted concentration. However, the statistics fit the health impacts of air pollution the best, because they provide better information on human exposure to PM2.5 and PM10.

3.2. Reduction of Health Impacts

The highest health impacts reduction was observed for Scenario 1 for both regions, due to the greatest abatement of estimated emission from the household sector (results presented in Table 6.). The results for premature deaths and work absence in Scenario 1 were higher for Lodzkie province even though the population in Lower Silesia was higher. This is because the baseline modeled results of the concentration of PM2.5 in Lodzkie province are higher than in the other region. Therefore, Lodzkie province with a higher annual concentration of PM2.5 with a lower percentage result produced a higher health impacts abatement. However, the health effects calculated from PM10 concentration—namely bronchitis and chronic bronchitis—were similar. This is due to the fact that results of the PM10 modeling produced a lower difference between the regions than the PM2.5 results. The relation of health effects of Scenario 3 to Scenario 1 was higher in Lodzkie province than in Lower Silesia due to the fact that the data provided show a higher share of older buildings in the Lodzkie region.

4. Discussion

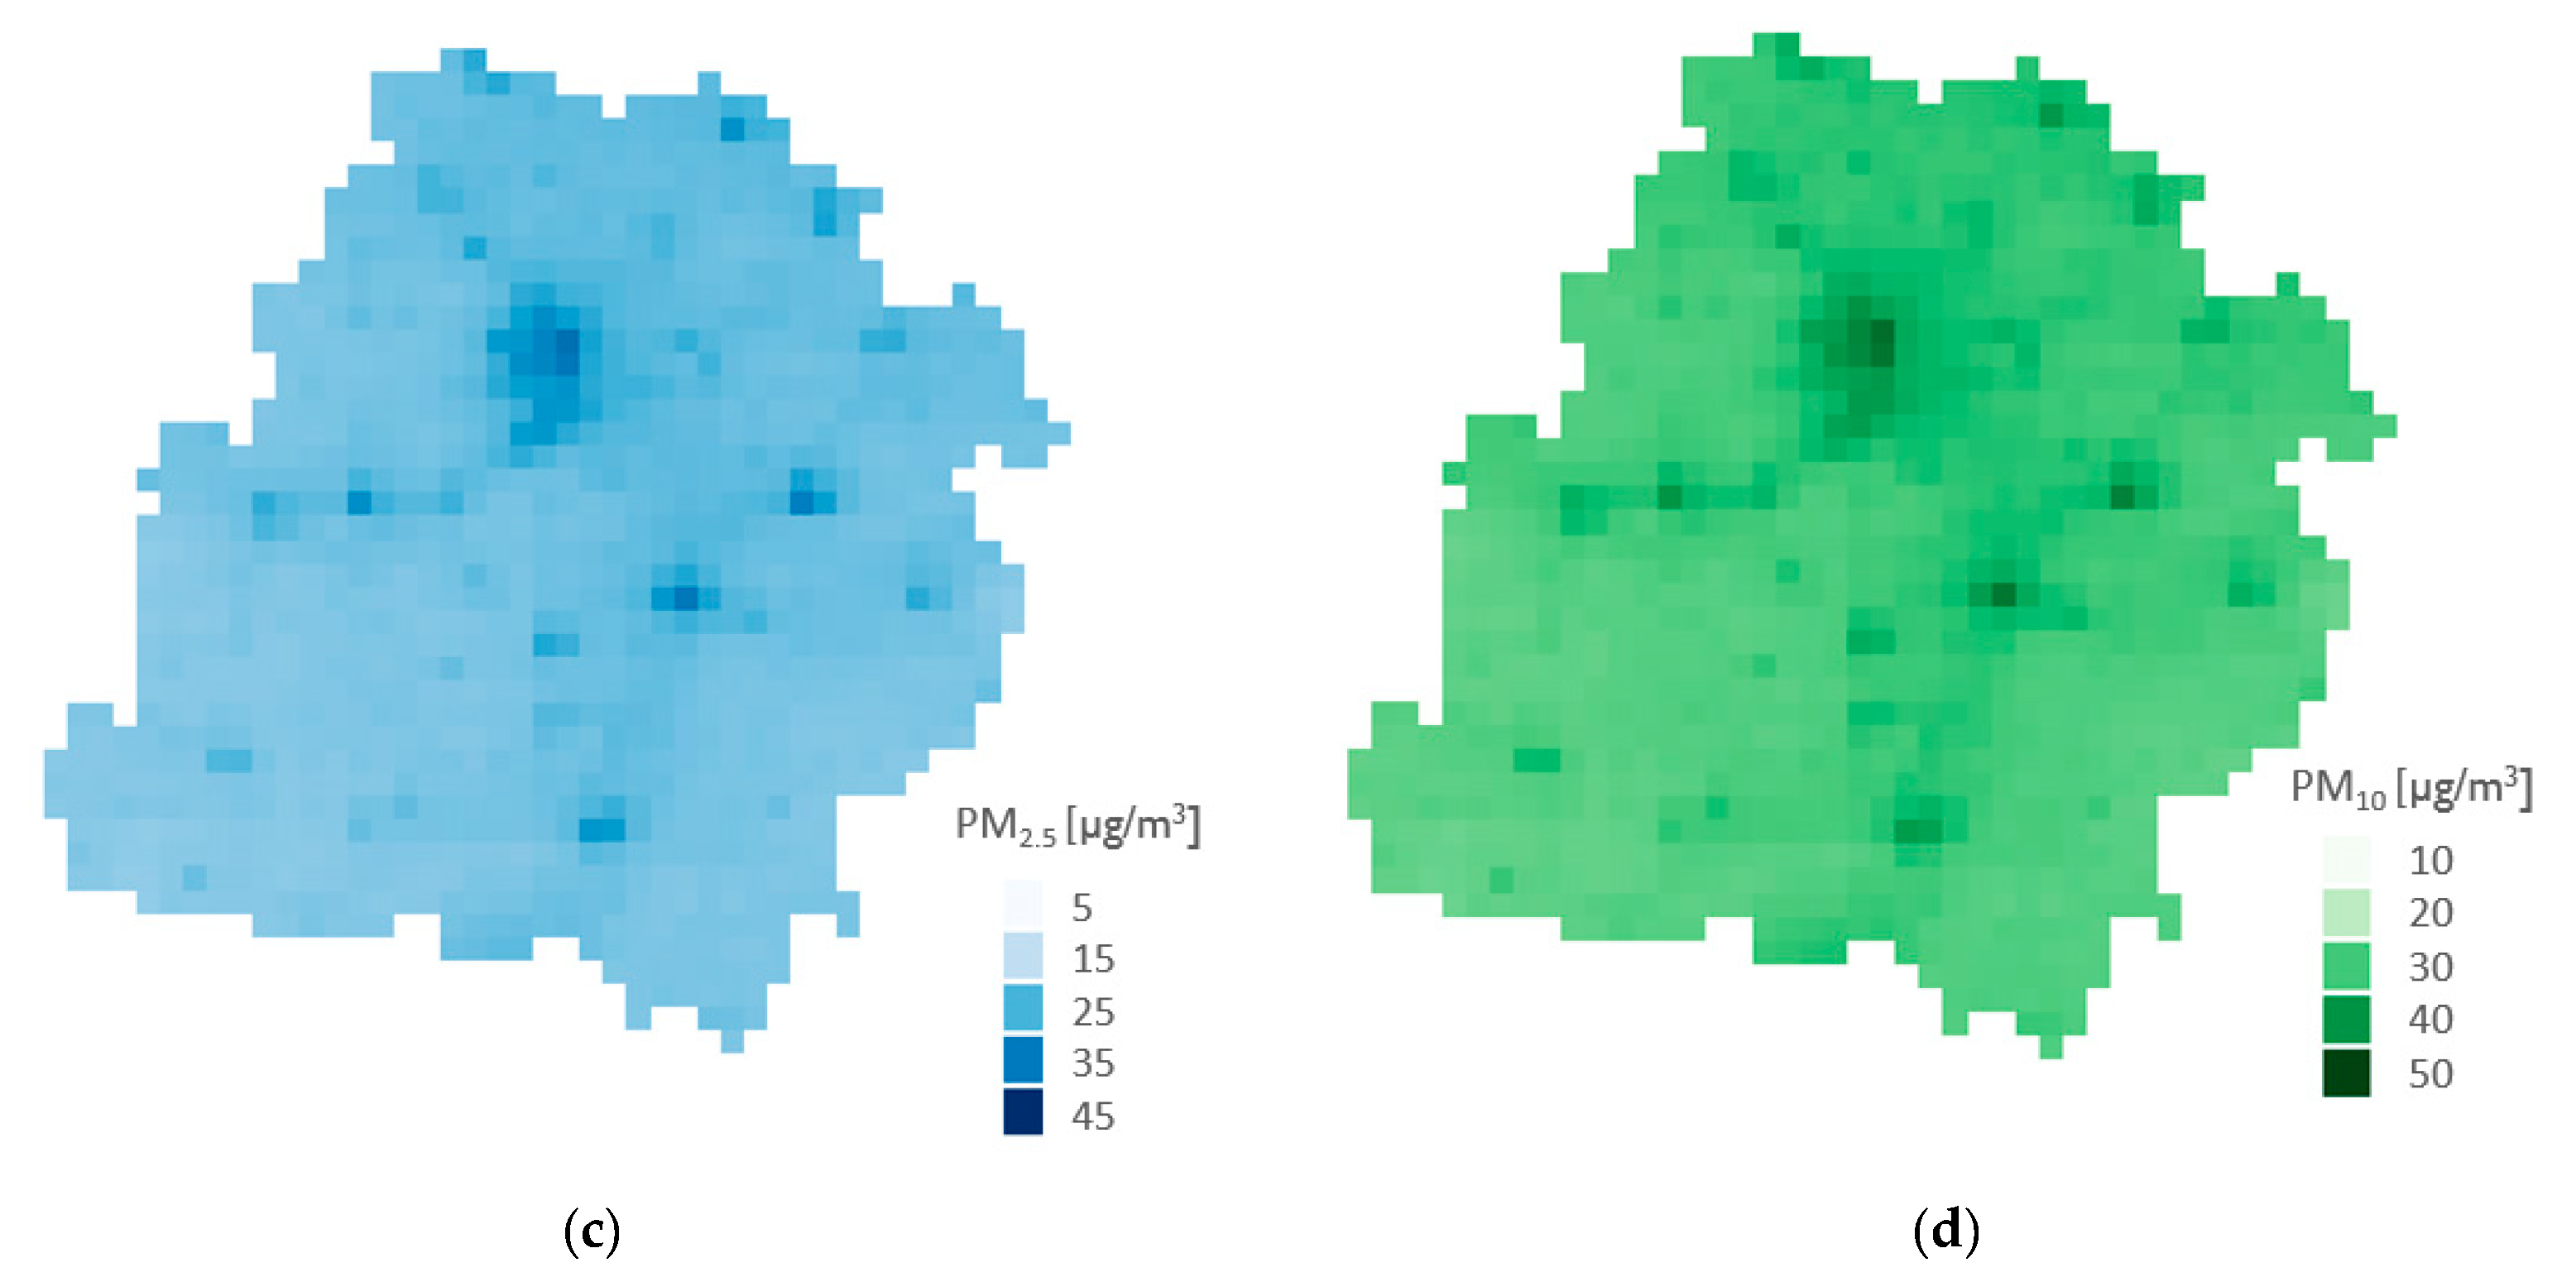
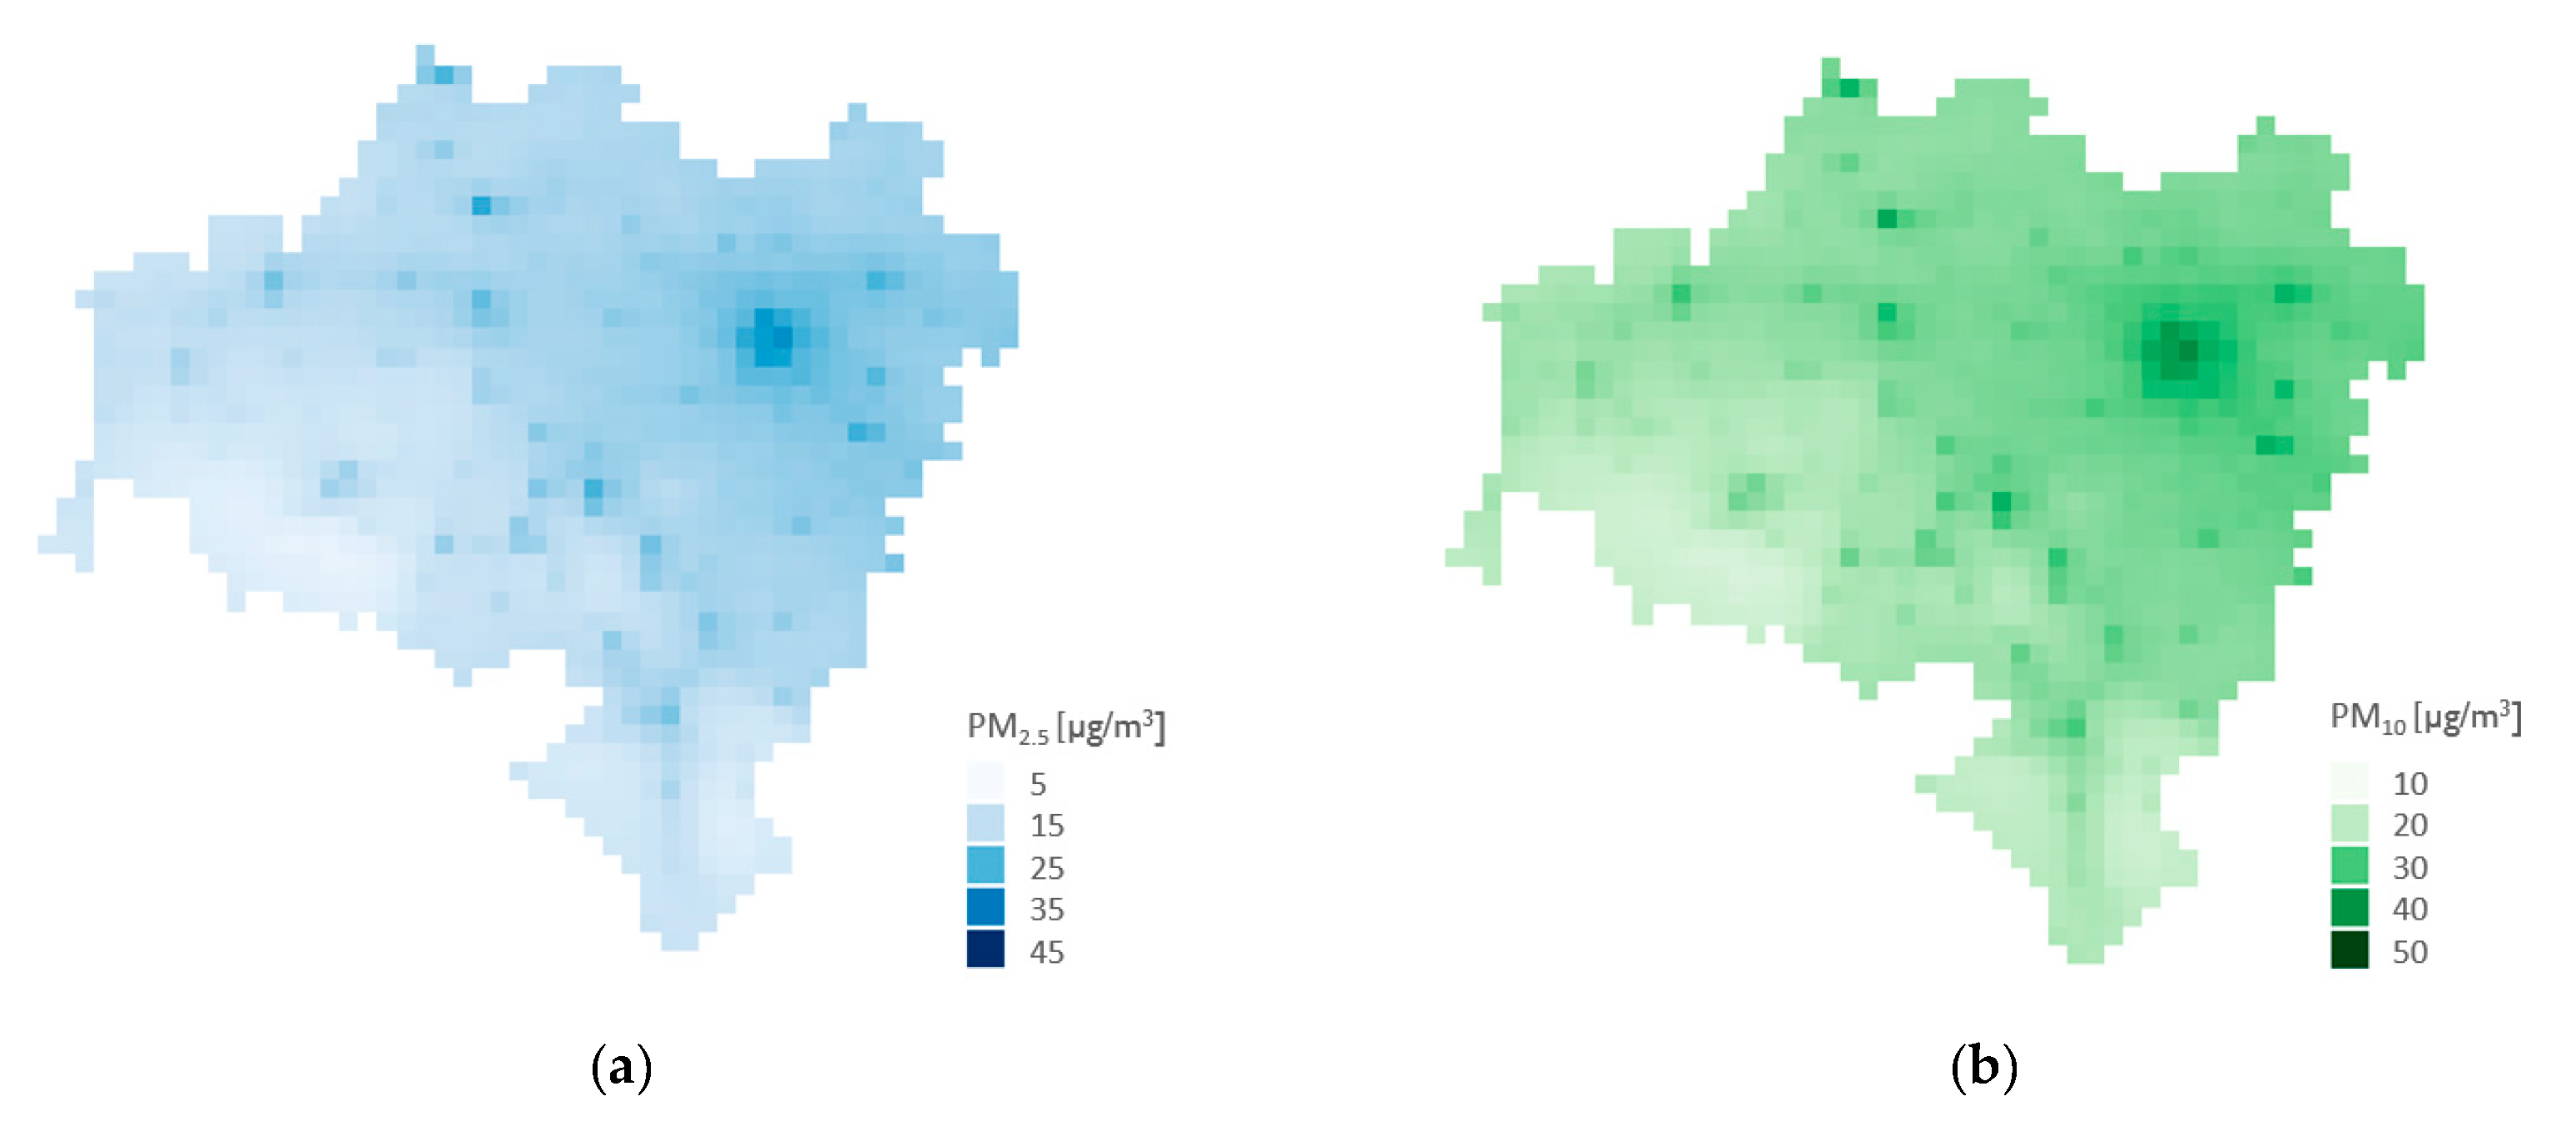
The results of the analysis show that reducing emission from the household sector will significantly improve air quality in Lower Silesia and the Lodzkie region. The concentration of PM2.5 annually is estimated to drop by 35.6% in Lower Silesia and 31.7% in Lodzkie province and for PM10 in the corresponding regions by 30.4% and 30.1%. These data are for Scenario 1, which relates to almost no emission (reduction by 94.7%) from the household sector. According to the national statistics on emissions from the National Centre for Emissions Management, the annual share of emissions of PM10 and PM2.5 from households is 46.5% as an average for the whole of Poland [33]. Additionally, an international study providing modeling of PM2.5 concentration with source apportionment shows a household share of 41% as an average for the whole country [34]. Our study results are lower than this, therefore this analysis can be treated as a conservative estimation for Poland. This is most likely caused by still not having a sufficiently comprehensive database of emissions at a local level in the country. Statistics are prepared using a top-down method that does not take into account local issues of air quality.
The total number of premature deaths may be somewhat underestimated since it did not include increased air pollution exposure in narrow urban streets. However, the analyzed scenarios did not include changes in transport, therefore it should not affect the relative difference, which was the input for the premature death calculation [35]. An additional limitation is that it only took into account the concentration of particulate matter. The meta-analysis studies on the health impact of air pollution do not focus on the composition of PMx, which, depending on their composition, have different toxicity. As an extreme example, particulate matter with a content of more than 80% NaCl (salt) has positive health properties [36], which of course is not a case for Poland characterized by high emissions from combustion processes and high contribution of BaP [37]. However, taking into account the composition of particulate matter is not a straightforward issue. For instance, to analyze changes of BaP emissions and concentration, we would need to also include socioeconomic changes, temperature and relative humidity to derive a new relative risk for concentration–response function [38]. Therefore, to tackle this limitation, a new separate study would be need to be conducted. Added value can also be found in presenting health effects other than premature deaths alone. One of the possible approaches is using a DALY indicator, which allows explaining the morbidity. However, since most of the studies concerned premature deaths, this health effect indicator was used to ensure comparison with other studies [39].
Relative risk, which allows calculating the number of premature deaths attributed to air pollution, was used from 2013 WHO report [10]. Liu et al. showed that an increase of PM2.5 concentrations by 10 µg/m3 are associated with an increase in all-cause mortality by 7.3% [40], which is 1.1% higher RR than WHO. A more extensive example is provided by the meta-analysis of Pope et al., who examined 75 peer-reviewed studies, which resulted that an increase of PM2.5 concentration per 10 µg/m3 provided RR o 1.09. Furthermore, meta-analysis only on studies conducted in Europe have a RR of 1.12 [41], which is nearly two times greater than the RR we used. This means that our study result could be underestimated. We used RR provided by (WHO), since it corresponds with the number of premature deaths in national documents, which uses information from the EEA report [8] that is based on WHO RR [10].
Potential changes in future temperature were also not included, which is important for ozone concentration. However, Poland presently does not have a problem in exceeding its thresholds [37]. A study from the United Kingdom shows that this might increase premature deaths from ozone as well as decrease the numbers attributed to PM2.5 [42,43].

5. Conclusions

Significant adverse health effects reductions are possible in Poland with policies limiting emissions from the household sector. Premature deaths caused by ambient particulate matter can be reduced by 34.3% for Lower Silesia and by 29.9% for Lodzkie province, if solid fuel (coal and biomass) is not used for the purpose of domestic heating. Improving insulation would allow a smaller reduction in premature deaths of 14.6% and 19.7% for the respective regions. Comparing the health effects with those of other health impact assessment studies provides an interesting insight. Taking into account the population size of the regions, Scenario 1 would result in a lower number of premature deaths of 38.7 per 100k a. in Lower Silesia and 57.5 per 100k a. in Lodzkie province. Compared to the results presented in the Introduction, this is the highest reduction, in some cases even being greater by two orders of magnitude. This is due to the high air pollution in the regions analyzed. There is a need to improving the emission database to better assess the health impacts of particular emission scenarios.

Author Contributions

Conceptualization, Ł.A., D.M. and A.G.; methodology, Ł.A., M.W., M.K., D.M., A.G., A.D.-O. and T.S.; validation, Ł.A.; formal analysis: D.M. and A.G.; resources, D.M. and A.G.; software, M.W. and M.K.; and writing, Ł.A., M.W., M.K., D.M., A.G., A.D.-O. and T.S. All authors have read and agreed to the published version of the manuscript.

Funding

This research was funded by KR Foundation, grant number FP-1610-01866.

Institutional Review Board Statement

Not applicable.

Informed Consent Statement

Not applicable.

Data Availability Statement

Data available on request due to restrictions eg privacy or ethical. The data presented in this study are available on request from the corresponding author. The data are not publicly available due to the fact that it comes from various sources and has been processed for the purposes of this study.

Acknowledgments

Emissions data for Poland were provided by the Chief Inspectorate of Environmental Protection (http://www.gios.gov.pl/en/, direct contact to the institution). These data were prepared within the project: “Supporting the air quality assessment system with application of modeling of PM10, PM2.5, SO2, NO2, B(a)P for the years 2015, 2016 and 2017”.

Conflicts of Interest

The authors declare no conflict of interest.

References

  1. World Health Organization. Available online: https://www.who.int/health-topics/air-pollution#tab=tab_2 (accessed on 10 March 2020).
  2. Dockery, D.W. Health effects of particulate air pollution. Anna. Epidemiol. 2009, 19, 257–263. [Google Scholar] [CrossRef] [PubMed] [Green Version]
  3. Forouzanfar, M.H.; Afshin, A.; Alexander, L.T.; Anderson, H.R.; Bhutta, Z.A.; Biryukov, S.; Brauer, M.; Burnett, R.; Cercy, K.; Charlson, F.J.; et al. Global, regional, and national comparative risk assessment of 79 behavioural, environmental and occupational, and metabolic risks or clusters of risks, 1990–2015: A systematic analysis for the Global Burden of Disease Study 2015. Lancet 2016, 388, 1659–1724. [Google Scholar] [CrossRef] [Green Version]
  4. Brook, R.D.; Rajagopalan, S.; Pope, C.A.; Brook, J.R.; Bhatnagar, A.; Diez-Roux, A.V.; Holguin, F.; Hong, Y.; Luepker, R.V.; Mittleman, M.A.; et al. Particulate Matter Air Pollution and Cardiovascular Disease. Circulation 2010, 121, 2331–2378. [Google Scholar] [CrossRef] [PubMed] [Green Version]
  5. Pope, C.A.; Burnett, R.T.; Turner, M.C.; Cohen, A.; Krewski, D.; Jerrett, M.; Gapstur, S.M.; Thun, M.J. Lung Cancer and Cardiovascular Disease Mortality Associated with Ambient Air Pollution and Cigarette Smoke: Shape of the Exposure–Response Relationships. Environ. Health Perspect. 2011, 119, 1616–1621. [Google Scholar] [CrossRef] [PubMed] [Green Version]
  6. Cohen, A.J.; Brauer, M.; Burnett, R.; Anderson, H.R.; Frostad, J.; Estep, K.; Balakrishnan, K.; Brunekreef, B.; Dandona, L.; Dandona, R.; et al. Estimates and 25-year trends of the global burden of disease attributable to ambient air pollution: An analysis of data from the Global Burden of Diseases Study 2015. Lancet 2017, 389, 1907–1918. [Google Scholar] [CrossRef] [Green Version]
  7. Lelieveld, J.; Klingmüller, K.; Pozzer, A.; Pöschl, U.; Fnais, M.; Daiber, A.; Münzel, T. Cardiovascular disease burden from ambient air pollution in Europe reassessed using novel hazard ratio functions. Eur. Heart J. 2019, 40, 1590–1596. [Google Scholar] [CrossRef] [Green Version]
  8. European Environment Agency. Air Quality in Europe—2019 Report; Publications Office of the European Union: Luxembourg, 2019. [Google Scholar]
  9. Lim, S.S.; Vos, T.; Flaxman, A.D.; Danaei, G.; Shibuya, K.; Adair-Rohani, H.; AlMazroa, M.A.; Amann, M.; Anderson, H.R.; Andrews, K.G.; et al. A comparative risk assessment of burden of disease and injury attributable to 67 risk factors and risk factor clusters in 21 regions, 1990–2010: A systematic analysis for the Global Burden of Disease Study 2010. Lancet 2012, 380, 2224–2260. [Google Scholar] [CrossRef] [Green Version]
  10. World Health Organization. Health Risks of Air Pollution in Europe—HRAPIE Project Recommendations for Concentration–Response Functions for Cost–Benefit Analysis of Particulate Matter, Ozone and Nitrogen Dioxide; WHO Regional Office for Europe: Copenhagen, Denmark, 2013. [Google Scholar]
  11. Hurley, F.; Hunt, A.; Cowie, H.; Holland, M.; Miller, B.; Pye, S.; Watkiss, P. Methodology Paper for Service Contract for Carrying Out Cost-Benefit Analysis of Air Quality Related Issues, in Particular in the Clean Air for Europe (CAFE) Programme; AEA Technology Environment: Didcot, UK, 2005; Volume 2. [Google Scholar]
  12. Liu, J.; Kiesewetter, G.; Klimont, Z.; Cofala, J.; Heyes, C.; Schöpp, W.; Zhu, T.; Cao, G.; Sanabria, A.G.; Sander, R.; et al. Mitigation pathways of air pollution from residential emissions in the Beijing-Tianjin-Hebei region in China. Environ. Int. 2019, 125, 236–244. [Google Scholar] [CrossRef]
  13. Kheirbek, I.; Haney, J.; Douglas, S.; Ito, K.; Caputo, S.; Matte, T. The Public Health Benefits of Reducing Fine Particulate Matter through Conversion to Cleaner Heating Fuels in New York City. Environ. Sci. Technol. 2014, 48, 13573–13582. [Google Scholar] [CrossRef]
  14. Zhao, B.; Zheng, H.; Wang, S.-X.; Smith, K.R.; Lu, X.; Aunan, K.; Gu, Y.; Wang, Y.; Ding, D.; Xing, J.; et al. Change in household fuels dominates the decrease in PM2.5 exposure and premature mortality in China in 2005–2015. Proc. Natl. Acad. Sci. USA 2018, 115, 12401–12406. [Google Scholar] [CrossRef] [Green Version]
  15. Conibear, L.; Butt, E.W.; Knote, C.; Arnold, S.R.; Spracklen, D.V. Residential energy use emissions dominate health impacts from exposure to ambient particulate matter in India. Nat. Commun. 2019, 9, 1–9. [Google Scholar] [CrossRef] [PubMed] [Green Version]
  16. Holnicki, P.; Tainio, M.; Kałuszko, A.; Nahorski, Z. Burden of Mortality and Disease Attributable to Multiple Air Pollutants in Warsaw, Poland. Int. J. Environ. Res. Public Health 2017, 14, 1359. [Google Scholar] [CrossRef] [PubMed] [Green Version]
  17. Xia, T.; Nitschke, M.; Zhang, Y. Traffic-related air pollution and health co-benefits of alternative transport in Adelaide, South Australia. Environ. Int. 2015, 74, 281–290. [Google Scholar] [CrossRef] [PubMed]
  18. Van Brusselen, D.; De Oñate, W.A.; Maiheu, B.; Vranckx, S.; Lefebvre, W.; Janssen, S.; Nawrot, T.S.; Nemery, B.; Avonts, D. Health Impact Assessment of a Predicted Air Quality Change by Moving Traffic from an Urban Ring Road into a Tunnel. The Case of Antwerp, Belgium. PLoS ONE 2016, 11, e0154052. [Google Scholar] [CrossRef] [Green Version]
  19. Requia, W.J.; Higgins, C.D.; Adams, M.D.; Mohamed, M.; Koutrakis, P. The health impacts of weekday traffic: A health risk assessment of PM2.5 emissions during congested periods. Environ. Int. 2018, 111, 164–176. [Google Scholar] [CrossRef]
  20. Martenies, S.E.; Akherati, A.; Jathar, S.; Magzamen, S. Health and environmental justice implications of retiring two coal-fired power plants in the southern Front Range region of Colorado. GeoHealth 2019, 3, 266–283. [Google Scholar] [CrossRef] [Green Version]
  21. Chio, C.-P.; Lo, W.-C.; Tsuang, B.-J.; Hu, C.-C.; Ku, K.-C.; Chen, Y.-J.; Lin, H.-H.; Chan, C.-C. Health impact assessment of PM2.5 from a planned coal-fired power plant in Taiwan. J. Formos. Med. Assoc. 2019, 118, 1494–1503. [Google Scholar] [CrossRef]
  22. Institute of Environmental Economics. Energy Efficiency in Poland 2015 Review. Single-Family Houses Mechanism to Support Modernisation; Institute of Environmental Economics: Kraków, Poland, 2016; pp. 13–14, 49. [Google Scholar]
  23. National Centre for Emissions Management (KOBIZE) at the Institute of Environmental Protection—National Research Institute. Poland‘s Informative Inventory Report 2019; KOBIZE: Warsaw, Poland, 2019. [Google Scholar]
  24. Hlawiczka, S.; Klis, C.; Cenowski, M. New approach to the impact assessment of dust emission from home heating processes on the air pollutant concentration of a single municipality. I. Emission sources inventory and emission modelling. Ochrona Środowiska i Zasobów Naturalnych 2011, 47, 22–46. [Google Scholar]
  25. Central Statistical Office. Available online: https://bdl.stat.gov.pl/BDL/dane/podgrup/temat/31/524 (accessed on 10 March 2020).
  26. Simpson, D.; Benedictow, A.; Berge, H.; Bergstrom, R.W.; Emberson, L.D.; Fagerli, H.; Flechard, C.R.; Hayman, G.D.; Gauss, M.; Jonson, J.E.; et al. The EMEP MSC-W chemical transport model–Technical description. Atmos. Chem. Phys. Discuss. 2012, 12, 7825–7865. [Google Scholar] [CrossRef] [Green Version]
  27. Vieno, M.; Dore, A.J.; Stevenson, D.S.; Doherty, R.; Heal, M.R.; Reis, S.; Hallsworth, S.; Tarrason, L.; Wind, P.; Fowler, D.; et al. Modelling surface ozone during the 2003 heat-wave in the UK. Atmos. Chem. Phys. Discuss. 2010, 10, 7963–7978. [Google Scholar] [CrossRef] [Green Version]
  28. Vieno, M.; Heal, M.R.; Hallsworth, S.; Famulari, D.; Doherty, R.M.; Dore, A.J.; Tang, Y.S.; Braban, C.F.; Leaver, D.; Sutton, M.A.; et al. The role of long-range transport and domestic emissions in determining atmospheric secondary inorganic particle concentrations across the UK. Atmos. Chem. Phys. Discuss. 2014, 14, 8435–8447. [Google Scholar] [CrossRef] [Green Version]
  29. Vieno, M.; Heal, M.R.; Williams, M.L.; Carnell, E.J.; Nemitz, E.; Stedman, J.R.; Reis, S. The sensitivities of emissions reductions for the mitigation of UK PM2.5. Atmos. Chem. Phys 2016, 16, 265–276. [Google Scholar] [CrossRef] [Green Version]
  30. Werner, M.; Kryza, M.; Wind, P. High resolution application of the EMEP MSC-W model over Eastern Europe—Analysis of the EMEP4PL results. Atmos. Res. 2018, 212, 6–22. [Google Scholar] [CrossRef]
  31. Skamarock, W.C.; Klemp, J.B. A time-split nonhydrostatic atmospheric model for weather research and forecasting applications. J. Comput. Phys. 2008, 227, 3465–3485. [Google Scholar] [CrossRef]
  32. Kuenen, J.J.P.; Visschedijk, A.J.H.; Jozwicka, M.; Denier van der Gon, H.A.C. TNO-MACC_II emission inventory: A multi-year (2003–2009) consistent high-resolution European emission inventory for air quality modelling. Atmos. Chem. Phys. Discuss. 2014, 14, 10963–10976. [Google Scholar] [CrossRef] [Green Version]
  33. Instytut Ochrony Środowiska—Państwowy Instytut Badawczy; Krajowy Ośrodek Bilansowania i Zarządzania Emisjami (KOBiZE). Krajowy Bilans Emisji SO2, NOx, CO, NH3, NM-LZO, Pyłów, Metali Ciężkich i TZO za Lata 2015–2017 w Układzie Klasyfikacji SNAP; Raport Syntetyczny; Krajowy Ośrodek Bilansowania i Zarządzania Emisjami (KOBiZE): Warszawa, Poland, 2019. [Google Scholar]
  34. Kiesewetter, G.; Amann, M. Urban PM2.5 Levels under the EU Clean Air Policy Package TSAP Report #12, Figure 2.16; DG-Environment of the European Commission: Brussels, Belgium, 2014. [Google Scholar]
  35. Badyda, A.J.; Dąbrowiecki, P.; Czechowski, P.O.; Majewski, G.; Doboszyńska, A. Traffic-related air pollution and respiratory tract efficiency. Adv. Exp. Med. Biol. 2015, 834, 31–38. [Google Scholar] [CrossRef]
  36. Rogula-Kozłowska, W.; Kostrzon, M.; Rogula-Kopiec, P.; Badyda, A.J. Particulate Matter in the Air of the Underground Chamber Complex of the Wieliczka Salt Mine Health Resort. Adv. Exp. Med. Biol. 2017, 955, 9–18. [Google Scholar] [CrossRef]
  37. Kobus, D.; Iwanek, J.; Skotak, K. Ocena Jakości Powietrza w Strefach w Polsce za Rok 2019; Główny Inspektorat Ochrony Środowiska: Warszawa, Poland, 2020.
  38. Liu, C.; Chen, R.; Sera, F.; Vicedo-Cabrera, A.M.; Guo, Y.; Tong, S.; Coelho, M.S.Z.S.; Saldiva, P.H.N.; Lavigne, E.; Matus, P.; et al. Ambient Particulate Air Pollution and Daily Mortality in 652 Cities. N. Engl. J. Med. 2019, 381, 705–715. [Google Scholar] [CrossRef]
  39. Adamkiewicz, Ł.; Badyda, A.J.; Gayer, A.; Mucha, D. Disability-adjusted life years in the assessment of health effects of traffic-related air pollution. Adv. Exp. Med. Biol 2015, 834, 15–20. [Google Scholar] [CrossRef]
  40. Di, Q.; Wang, Y.; Zanobetti, A.; Wang, Y.; Koutrakis, P.; Choirat, C.; Dominici, F.; Schwartz, J.D. Air Pollution and Mortality in the Medicare Population. N. Engl. J. Med. 2017, 376, 2513–2522. [Google Scholar] [CrossRef]
  41. Pope, C.A.; Coleman, N.; Pond, Z.A.; Burnett, R.T. Fine particulate air pollution and human mortality: 25+ years of cohort studies. Environ. Res. 2020, 183, 108924. [Google Scholar] [CrossRef] [PubMed]
  42. Heal, M.R.; Heaviside, C.; Doherty, R.M.; Vieno, M.; Stevenson, D.; Vardoulakis, S. Health burdens of surface ozone in the UK for a range of future scenarios. Environ. Int. 2013, 61, 36–44. [Google Scholar] [CrossRef] [PubMed] [Green Version]
  43. Carnell, E.J.; Vieno, M.; Vardoulakis, S.; Beck, R.C.; Heaviside, C.; Tomlinson, S.J.; Dragosits, U.; Heal, M.R.; Reis, S. Modelling public health improvements as a result of air pollution control policies in the UK over four decades—1970 to 2010. Environ. Res. Lett. 2019, 14, 074001. [Google Scholar] [CrossRef]
Figure 1. (a) Baseline annual concentration of PM2.5 weighted with population, Lower Silesia, Poland; (b) baseline annual concentration of PM10 weighted with population, Lower Silesia, Poland; (c) baseline annual concentration of PM2.5 weighted with population, Lodzkie province, Poland; and (d) baseline annual concentration of PM10 weighted with population, Lodzkie province, Poland.
Applsci 11 00272 g001aApplsci 11 00272 g001b
Table 1. Particulate emission factors for household boilers used for Scenarios 1 and 2.
PollutantUnitHard CoalOther Fuels
Manual Boilers, Low QualityManual Boilers, High QualityAutomatic BoilersStove
GasOil
PM10g/GJ460130704500.53
PM2.5g/GJ448121614480.52.7
Table 2. Percentage of buildings by the date of construction in Lower Silesia and Lodzkie region.
RegionBefore 19441945–19881989–20022003–2011 and under Construction
Lower Silesia [%]60.614.26.312.2
Lodzkie province [%]11.164.710.68.1
Table 3. Energy demand for heating a building depending on age.
RegionBefore 19441945–1988 1989–20022003–2011 and under Construction
Energy [kWh/m2 annual]350260180120
Table 4. Emission reduction of primary PM2.5 results in the household sector in Lower Silesia and Lodzkie region.
RegionScenario 1Scenario 2Scenario 3
Lower Silesia [%]94.8785.8463.04
Lodzkie province [%]94.8785.8471.33
Table 5. Annual air pollution with population weighted concentration reduction with baseline results in Lower Silesia and Lodzkie region.
PM2.5 [µg/m3]PM10 [µg/m3]
RegionBase.Scenario 1Scenario 2Scenario 3Base.Scenario 1Scenario 2Scenario 3
Lower Silesia 18.5−6.58−4.57−2.8233.5−10.2−7.82−5.01
Lodzkie province28.4−9.01−7.62−5.9842.5−12.8−10.6−9.12
Table 6. Annual health impact reduction per scenario and region.
Lower SilesiaLodzkie Province
Health ImpactScenario 1Scenario 2Scenario 3Scenario 1Scenario 2Scenario 3
Premature death [cases]112277647614381 211945
[% reduction]34.3%23.7%14.6%29.9%25.2%19.7%
[per 100k a.]38.726.716.457.548.537.8
Bronchitis amongst children [new cases]960273034628988080676932
[% reduction]27.7%21.1%13.4%26.8%21.9%18.8%
[per 100k a.]331252160395323277
Chronic bronchitis amongst adults [new cases]15161148724150212211047
[% reduction]26.6%20.1%12.7%25.3%20.6%17.7%
[per 100k a.]52.339.625.060.148.941.9
Work absence [days]481161333083204775688981581101454101
[% reduction]34.7%24.0%14.7%30.4%25.6%20.0%
[per 100k a.]16 59211 4867 06127 55923 24418 164
Publisher’s Note: MDPI stays neutral with regard to jurisdictional claims in published maps and institutional affiliations.

