
A New Method to Evaluate Trueness and Precision of Digital and Conventional Impression Techniques for Complete Dental Arch


1
Private Practice, Seoul 03722, Korea
2
Department of Prosthodontics, College of Dentistry Yonsei University, Seoul 03722, Korea
*
Author to whom correspondence should be addressed.
Appl. Sci. 2021, 11(10), 4612; https://0-doi-org.brum.beds.ac.uk/10.3390/app11104612
Submission received: 4 April 2021
/
Revised: 8 May 2021
/
Accepted: 11 May 2021
/
Published: 18 May 2021
(This article belongs to the Special Issue Clinical Applications for Dentistry and Oral Health)
Abstract
:Purpose: The aim of this study was to present a new method to analyze the three-dimensional accuracy of complete-arch dental impressions and verify the reliability of the method. Additionally, the accuracies of conventional and intraoral digital impressions were compared using the new method. Methods: A master model was fabricated using 14 milled polyetheretherketone cylinders and a maxillary acrylic model. Each cylinder was positioned and named according to its corresponding tooth position. Twenty-five definitive stone casts were fabricated using conventional impressions of the master model. An intraoral scanner was used to scan the master model 25 times to fabricate 25 digital models. A coordinate measuring machine was used to physically probe each cylinder in the master model and definitive casts. An inspection software was used to probe cylinders of digital models. A three-dimensional part coordinate system was defined and used to compute the centroid coordinate of each cylinder. Intraclass correlation coefficient (ICC) was evaluated to examine the reliability of the new method. Independent two sample t-test was performed to compare the trueness and precision of conventional and intraoral digital impressions (α = 0.05). Results: ICC results showed that, the new method had almost perfect reliability for the measurements of the master model, conventional and digital impression. Conventional impression showed more accurate absolute trueness and precision than intraoral digital impression for most of the tooth positions (p < 0.05). Conclusions: The new method was reliable to analyze the three-dimensional deviation of complete-arch impressions. Conventional impression was still more accurate than digital intraoral impression for complete arches.
1. Introduction
An accurate definitive cast, which replicates the intraoral environment, is one of the essential prerequisites for the long-term success of prosthodontic treatment [1,2]. Different impression materials and techniques have been used to fabricate accurate complete-arch definitive casts, and there are different methods to evaluate the accuracy of these casts [3,4,5]. Most of the previous studies have assessed the accuracy of definitive casts by measuring the linear distances between specific landmarks [6,7,8,9], however, it is difficult to evaluate the three-dimensional distortion of definitive casts due to the limitations in assessment methodology.
A computerized coordinate measuring machine (CMM) was frequently used to analyze the amount of three-dimensional displacement of implant components [10,11]. Thanks to the cylindrical shape of implant components, the centroid coordinates (x, y, z) and long axis angles of components can be computed by using a CMM. Therefore, the amount of displacement of centroids or long axis angles can be compared three-dimensionally between a patient model and definitive casts fabricated using different impression techniques.
Unlike implant impressions, coordinate measurements cannot be applied to evaluate the impression accuracy of natural dentition because teeth have free-formed configurations. Several studies used a CMM to evaluate the accuracy of complete-arch impressions, however, the study placed basic geometric configurations on several tooth positions only to measure the linear distance between the configurations even though the studies used a CMM [6].
Recent development of digital technologies opened new opportunities in clinical workflow in dentistry. Digital workflows provided more patient satisfaction, as well as efficient time management in laboratory and clinical services [12,13]. Among the digital technologies, intraoral scanners are the start of digital workflows. Currently, different intraoral scanners have been introduced and are used in clinical practice [14,15,16]. Previous studies have compared the accuracy of intraoral digital impression to those of conventional impression methods using elastic impression materials and modeling stone, and concluded that the accuracy of intraoral digital impression is comparable or even more accurate compared with conventional impression for small-unit fixed dental prostheses (FDPs) [17,18]. In addition to the accuracy of small-unit FDPs, studies were also performed to assess the accuracy of intraoral digital impression for complete arch, but the results were controversial [19,20,21,22]. Tomita and colleagues reported that an intraoral digital scan was more accurate than the conventional method for complete arch impression [23]. On the contrary, an in vivo study on complete-arch impression showed that conventional impressions using polyether were significantly more accurate than digital impression with four intraoral scanners [24]. Another laboratory study concluded that the accuracy of intraoral digital scans decreased with the increased scan length while the results of the laboratory scanner were acceptable for any scan length [25].
Most of previous studies used “best fit alignment” to evaluate the accuracy of digital models. Stone casts were digitally scanned using a desktop scanner to fabricate digital models, which were best-fit aligned over the digital models by intraoral digital scan. However, best-fit alignment inherently includes superimposition errors, therefore, best-fit alignment seems to be suitable for the evaluation of one quadrant, but for greater scan areas such as the complete arch [26]. Unlike partial arches, complete-arch impressions need a new evaluation method except for the best-fit alignment.
The primary aim of present study was to verify the reliability of the new method to evaluate the accuracy of different impression methods, including intraoral digital scanning as well as conventional impression, without best-fit alignment but with a coordinate metrology. Intraclass correlation coefficient (ICC) was calculated to verify the reliability of the new method. Additionally, the accuracies of conventional and intraoral digital impressions were compared using the new method. The null hypotheses tested were (1) the new method was not reliable (ICC = 0) to evaluate the accuracy of complete-arch impression, and (2) there is no significant difference in the accuracy between conventional impression and intraoral digital scan for complete-arch impression.
2. Material and Methods
2.1. Fabrication of the Master Model, Definitive Casts, and Digital Models
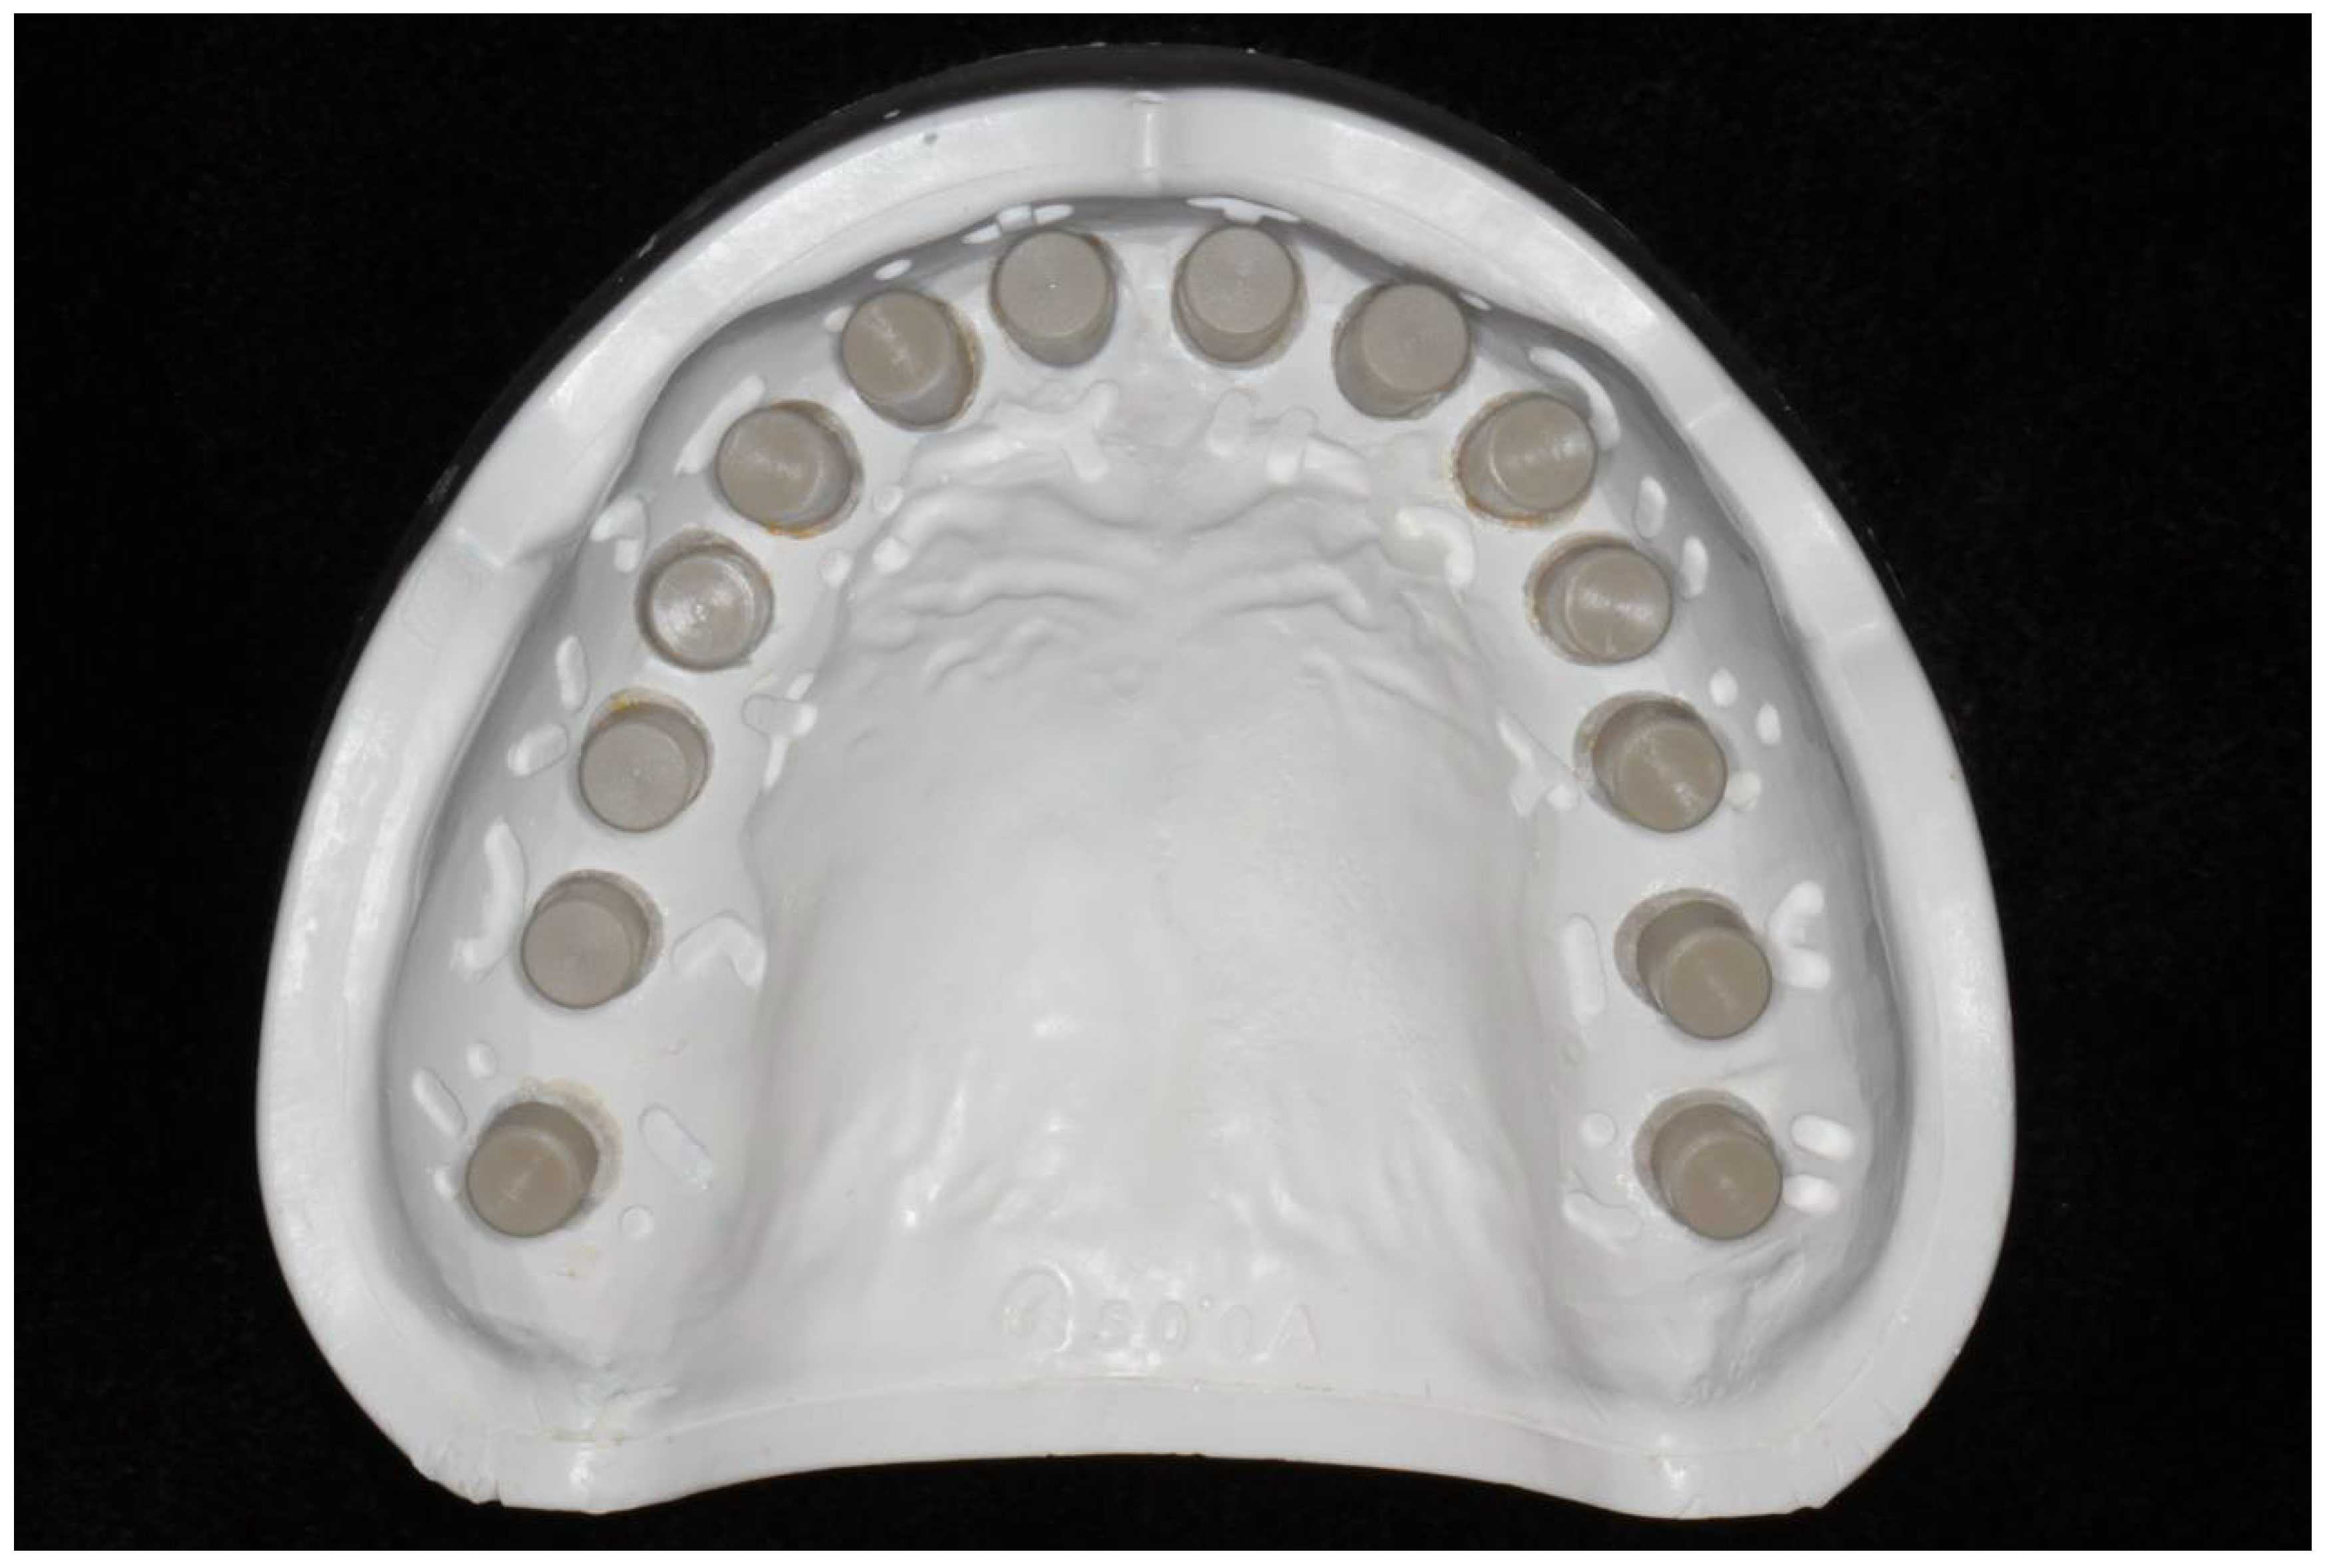
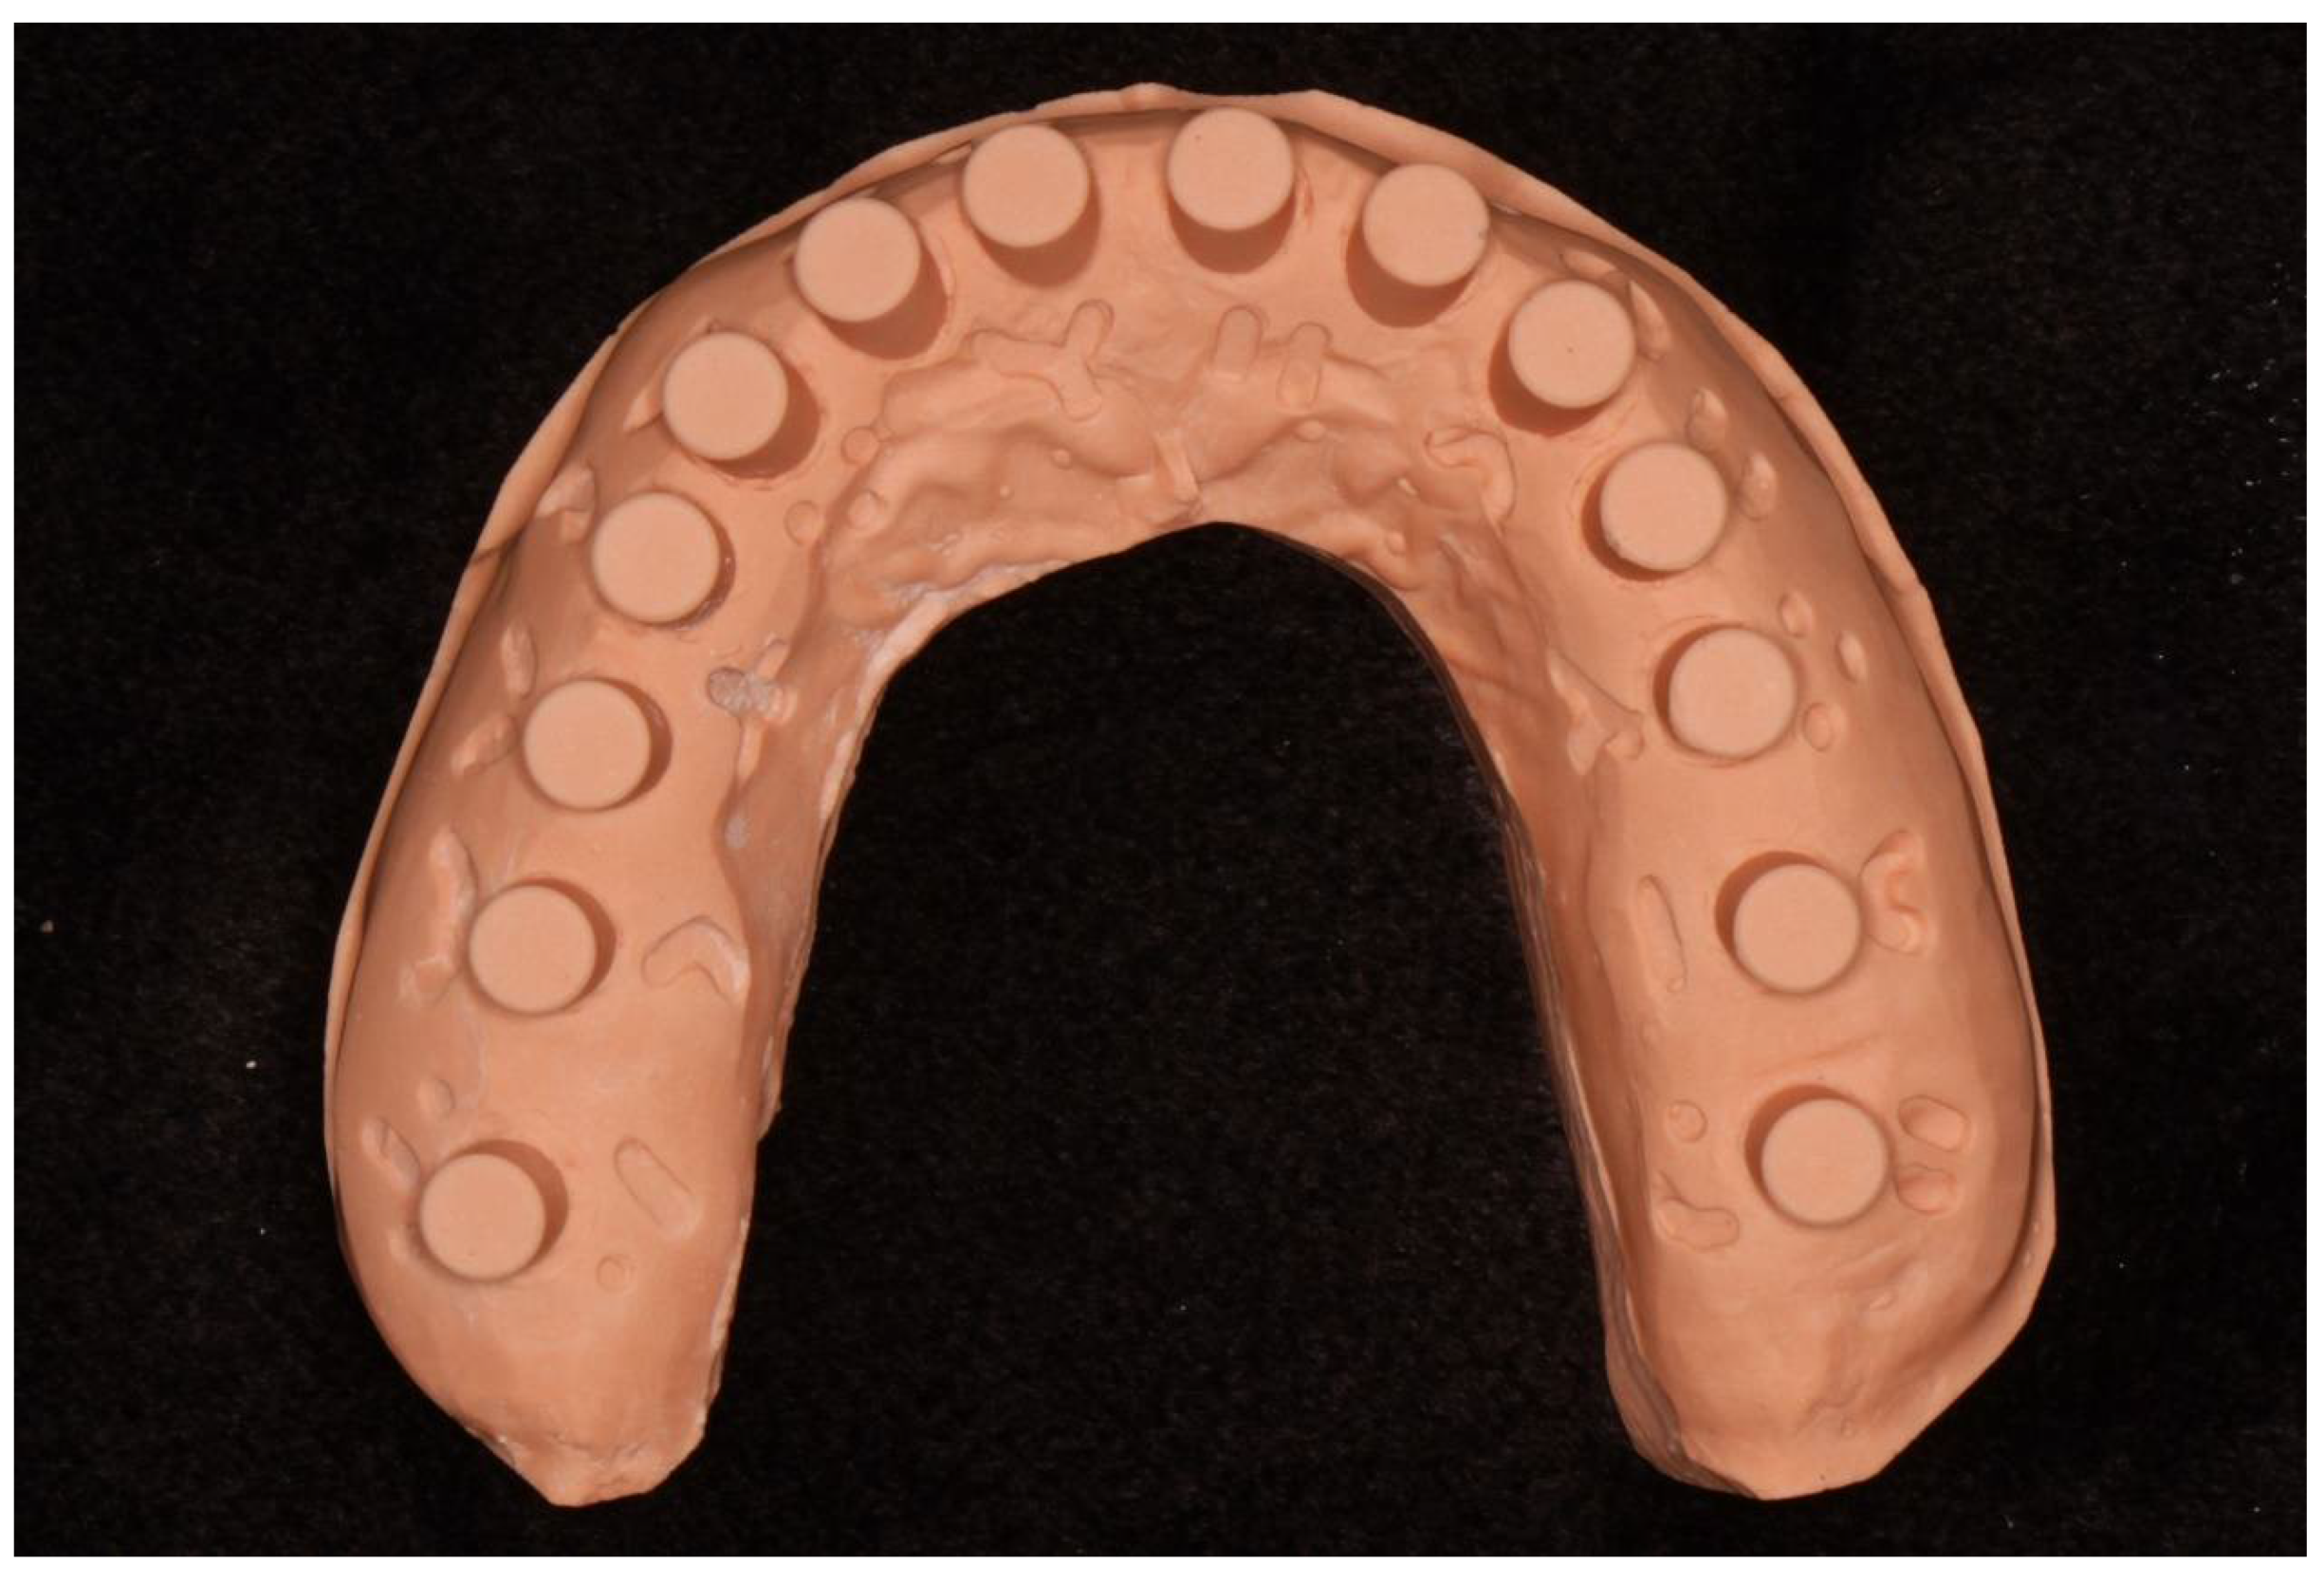
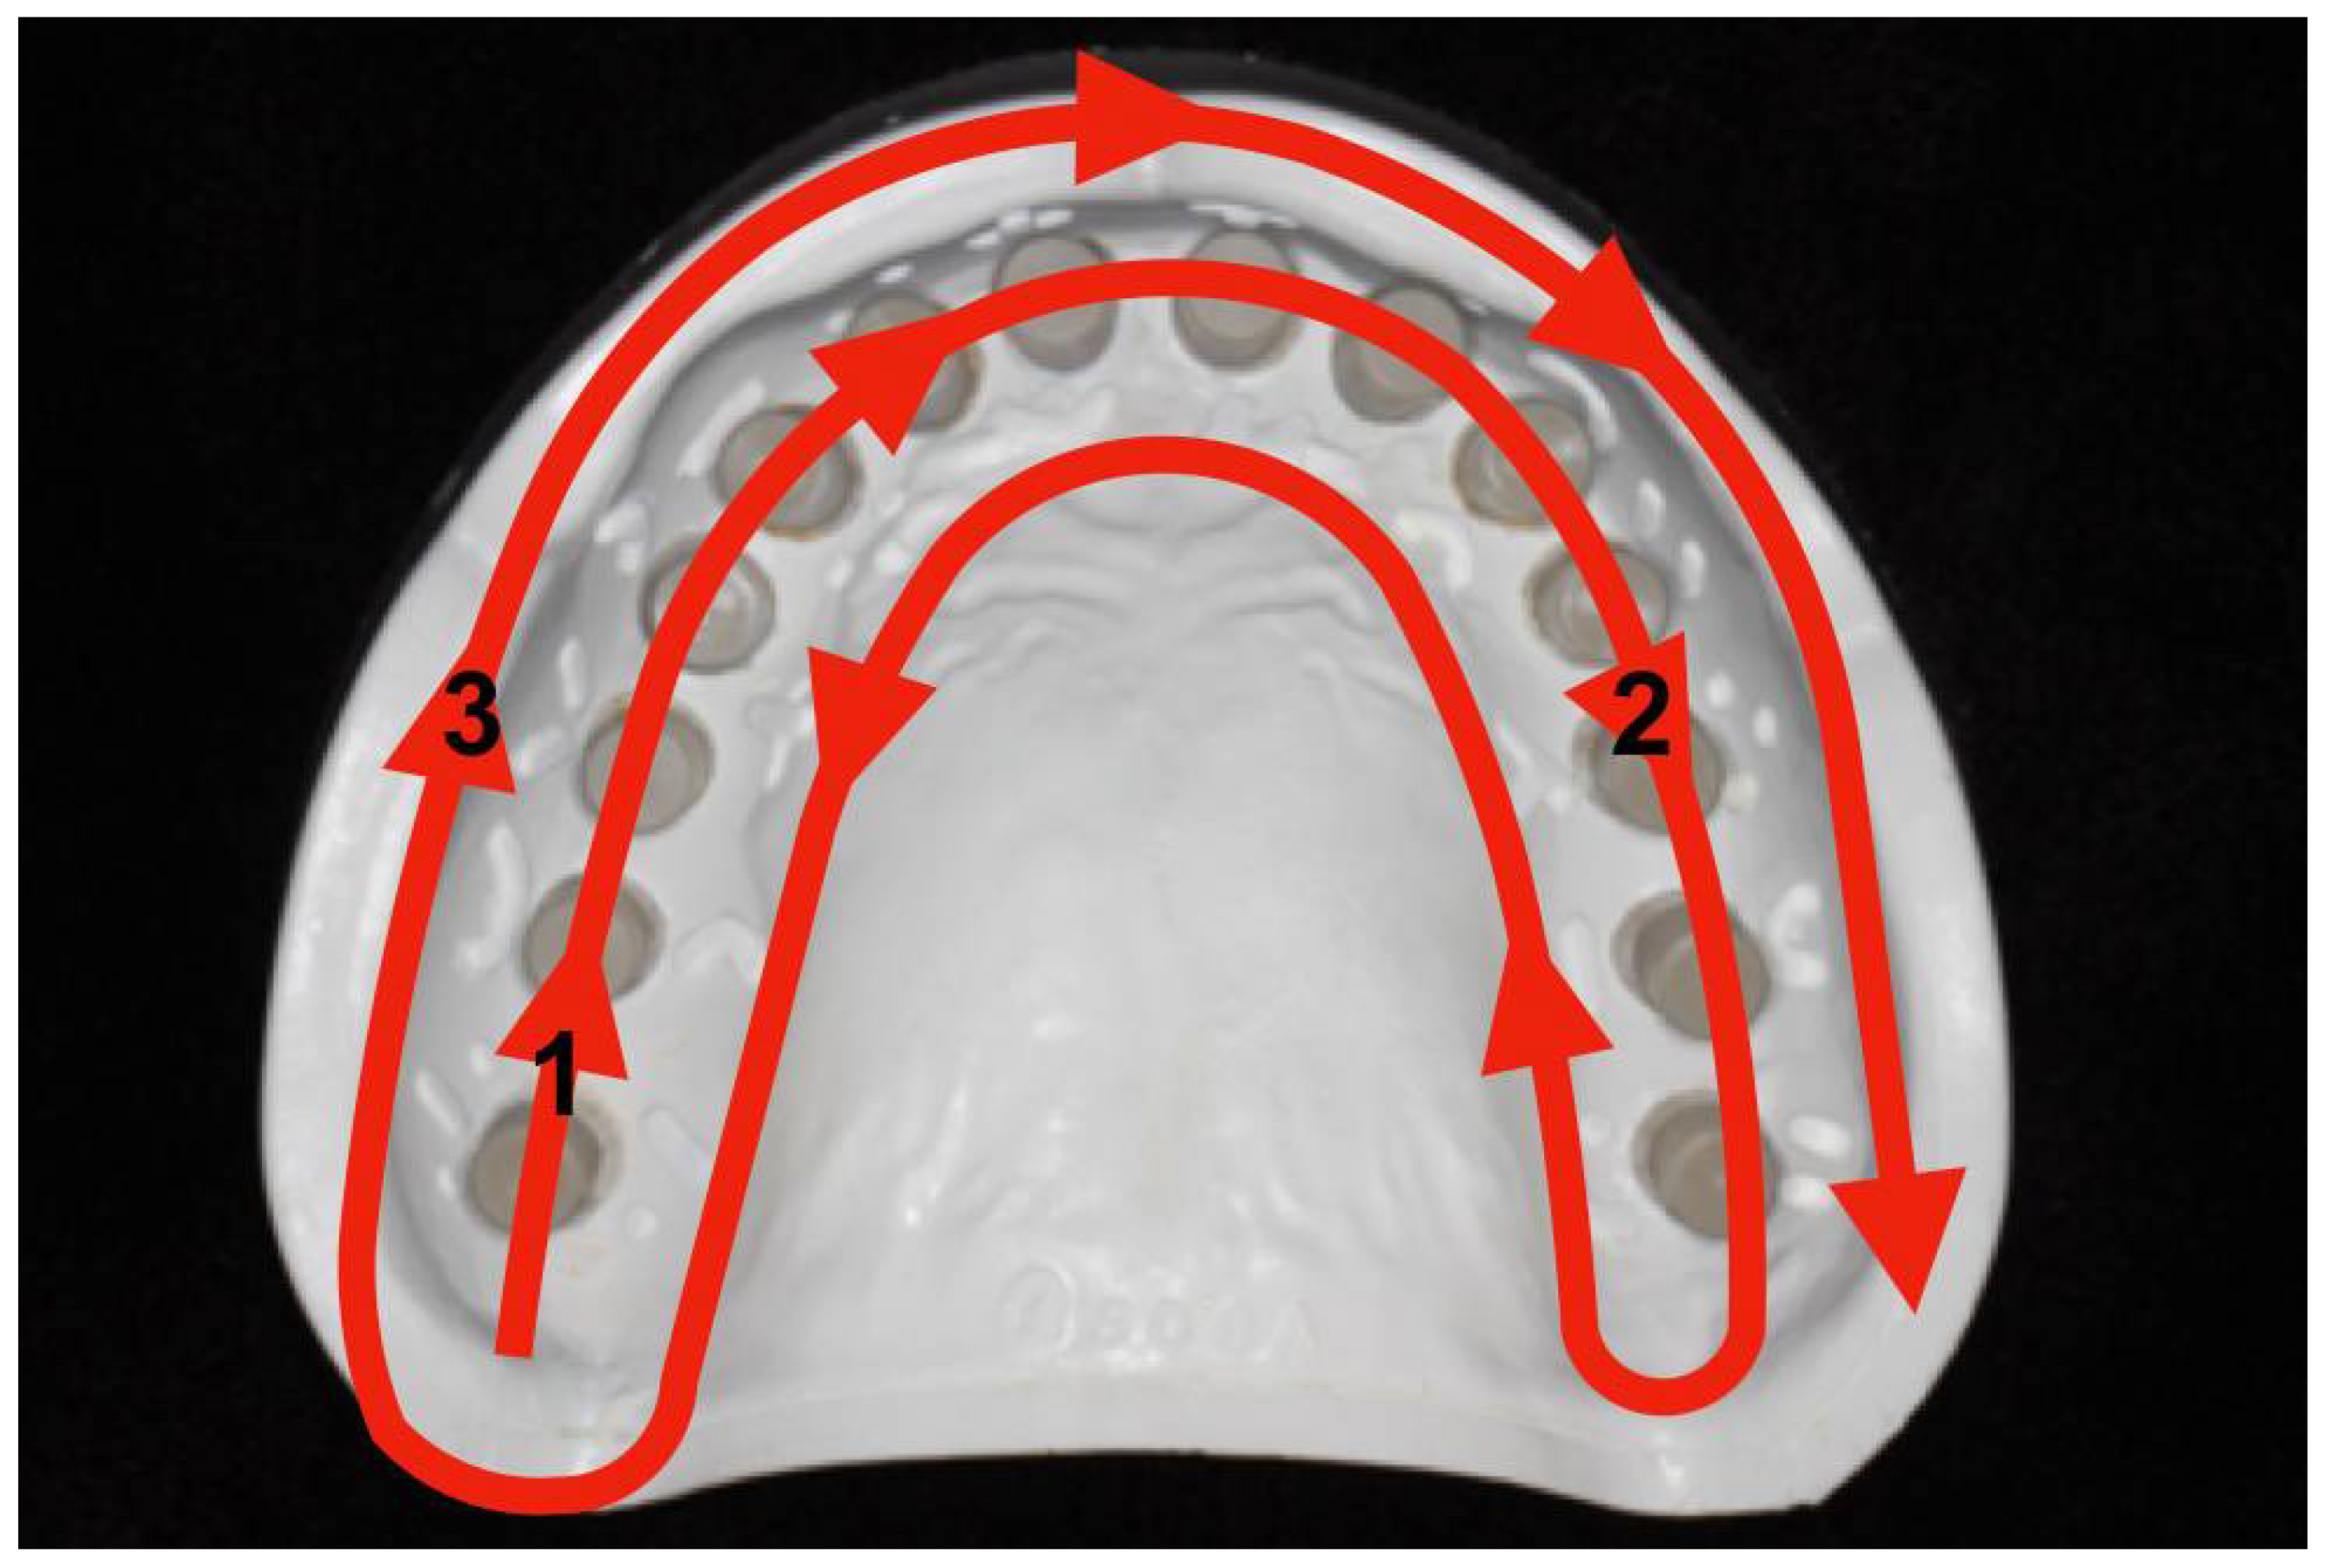
Fourteen polyetheretherketone (PEEK, US Korea, Seoul, Korea) cylinders with 5-mm diameter and 15-mm length were milled using an industrial computer numerically controlled (CNC) lathe (OC-24BR-200, Ohmiya Machinery, Saitama, Japan) with a tolerance of less than 2 μm. All the artificial teeth were removed from an acrylic maxillary model (D85DP-500B, Nissin Dental Products Inc., Kyoto, Japan), and utility wax (Dental Utility Wax Rods Round, Kerr Corporation, Orange, CA, USA) was filled into the empty spaces. An impression of the model was made using high-viscosity (Exafine putty type, GC Corp., Tokyo, Japan) and low-viscosity polyvinyl siloxane impression materials (Aquasil XLV, Dentsply Sirona, York, NY, USA) with a metal stock tray (Coe Metal Impression Tray, GC America Inc., Alsip, IL, USA). After complete polymerization of impression materials, the tray was removed from the model, and epoxy resin (Polyurock, Cendres + Métaux, Biel/Bienne, Switzerland) was mixed according to the manufacturer’s instructions, poured into the impression, and allowed to stand for 10 h to complete polymerization. The epoxy resin model was removed from the impression, and a hole of 5.5-mm diameter and 10-mm length was made at each tooth position using a carbide bur (HP701-012, Komet USA LLC, Rocky Hill, CT, USA) to receive the PEEK cylinder. The PEEK cylinders were fixed using autopolymerizing acrylic resin (Jet; Lang Dental Manufacturing Co. Inc., Wheeling, WV, USA), and roughly 5 mm of the 14 PEEK cylinders were extruded from the crest. Each cylinder was assigned the corresponding tooth number accompanied by the letter C (i.e., #17C, C means cylinders). In a pilot study, an intraoral scanner failed to differentiate each cylinder due to the identical configuration of PEEK cylinders; therefore, various irregular patterns, such as V, inverted V, and small oval circles, were engraved using a carbide bur (1.104.018, Komet USA LLC, Rocky Hill, CT, USA) around the cylinders to differentiate each cylinder (Figure 1). Conventional impressions of the master model were made using a low-viscosity polyvinylsiloxane impression material (Aquasil XLV) and a custom tray (Fastray, Bosworth Co. Evanston, IL, USA). Tray adhesive (VPS tray adhesive, Kerr, Orange, CA, USA) was applied and dried 5 min before the impression, and the tray was positioned for 10 min before removal from the master model. Type IV stone (MG Crystal Rock; Maruishi Gypsum Co. Ltd., Tokyo, Japan) was vacuum-mixed and poured into the impression following the manufacturer’s instructions, and was removed from the tray after 1 h. A pilot study showed that the estimated sample size was more than 23, with α = 0.05 and power of 95%. The procedure was repeated to fabricate 25 definitive casts, and these were assigned as Group CI (Figure 2). Digital scans of the master model were performed using an intraoral scanner (Trios 3, 3Shape, Copenhagen, Denmark) to fabricate digital models. 3D calibration procedure preceded each scan using a black cylindrical calibration object supplied by the manufacturer. The scan sequence was conducted by following the manufacturer’s instructions (Figure 3) without any scan spray application, and the acquired digital data were saved in a standard tessellation language (STL) file format. Twenty-five digital models were fabricated using the same method, and the digital models were assigned to Group ISO. A single operator (KS Seo) performed all the calibration and digital impression procedures.
2.2. Measurements
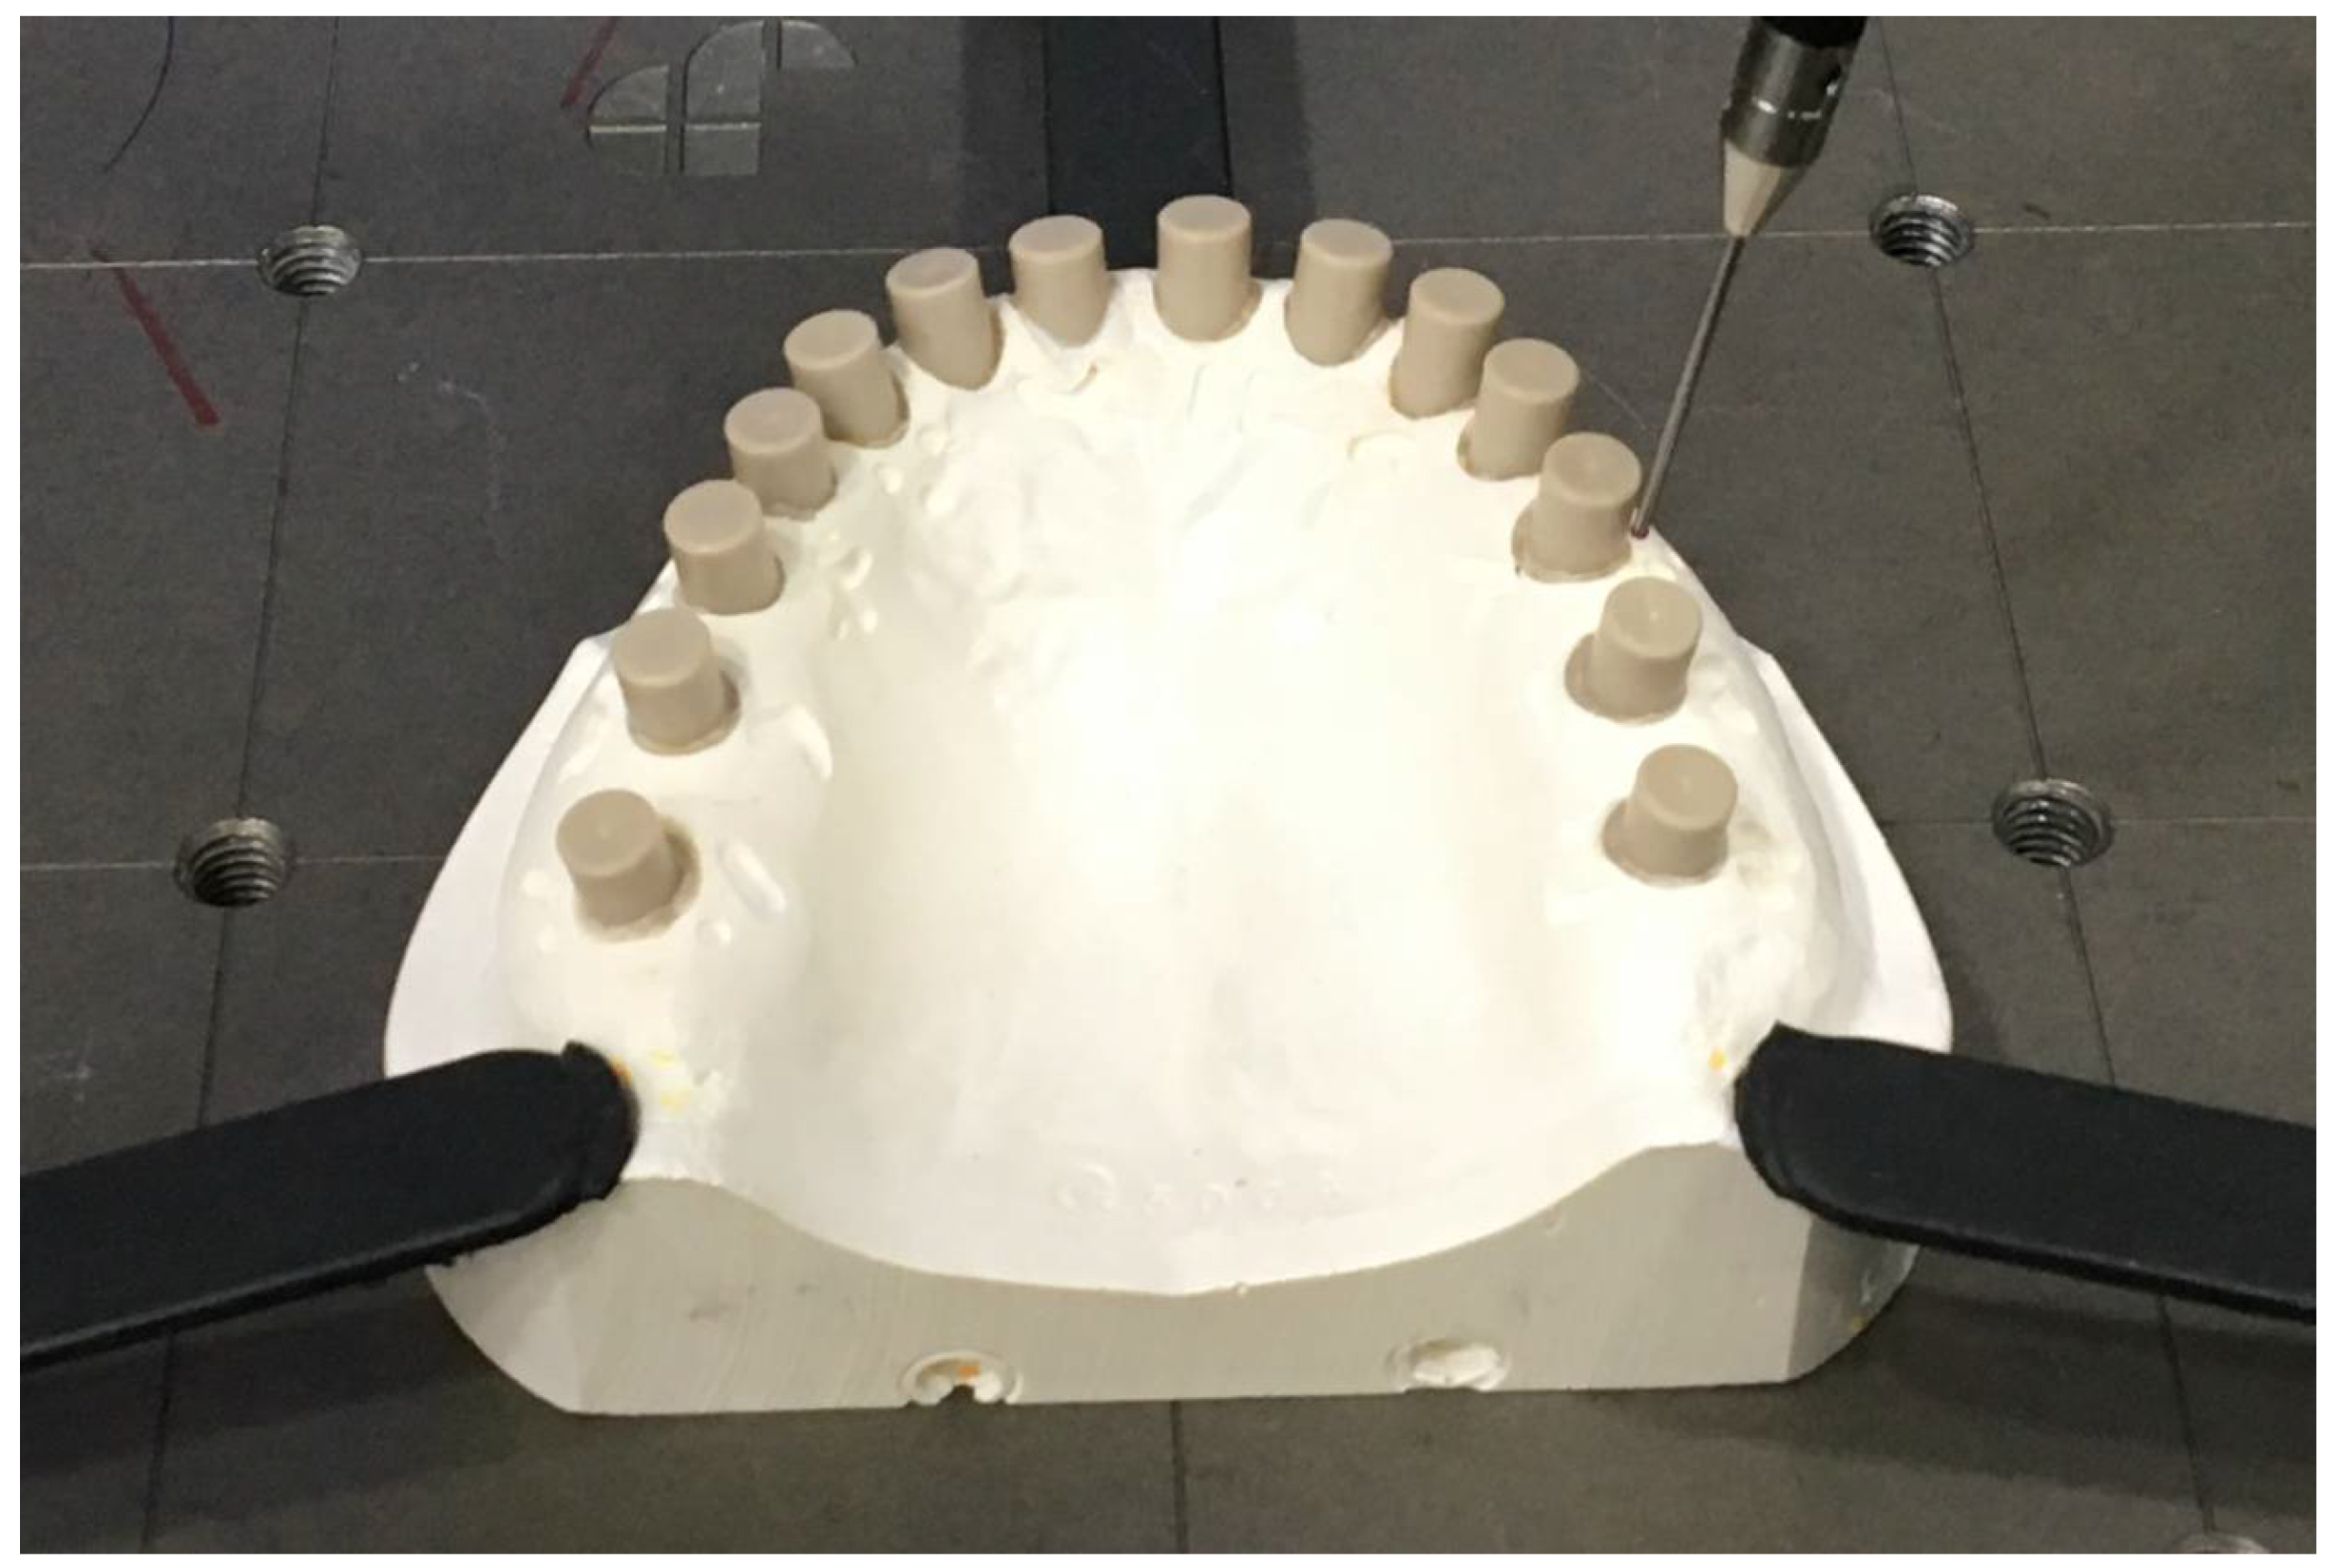
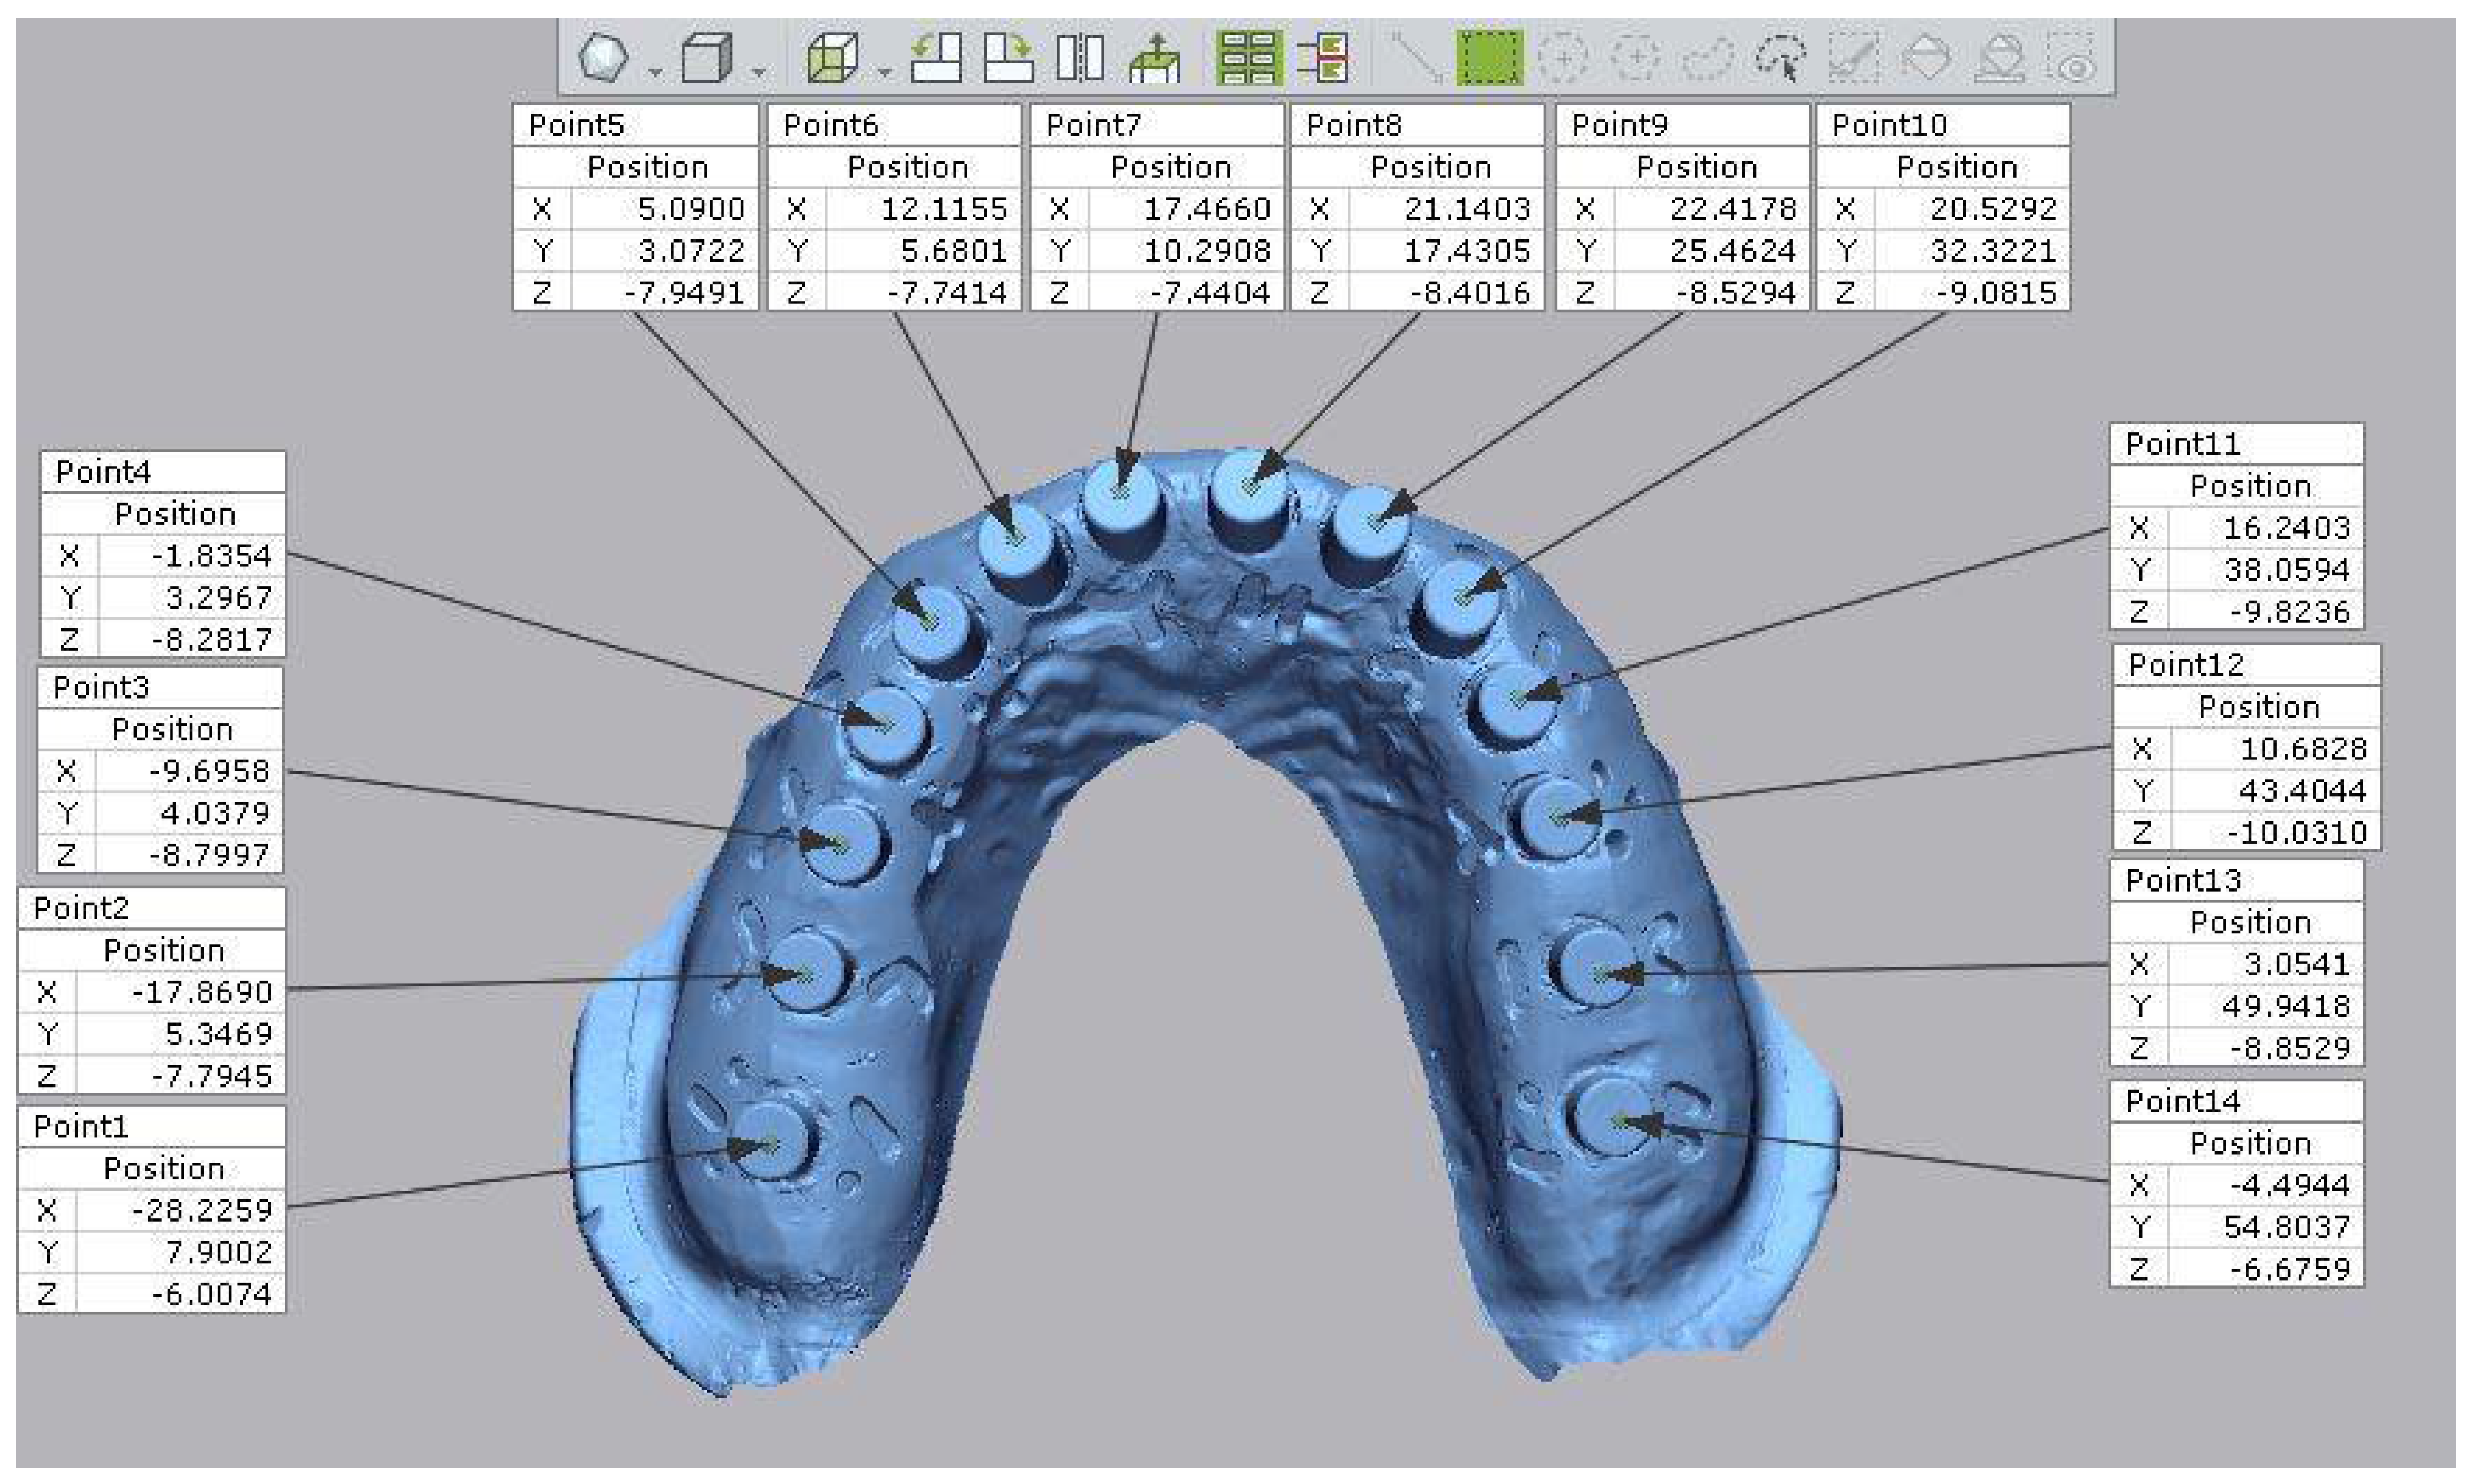
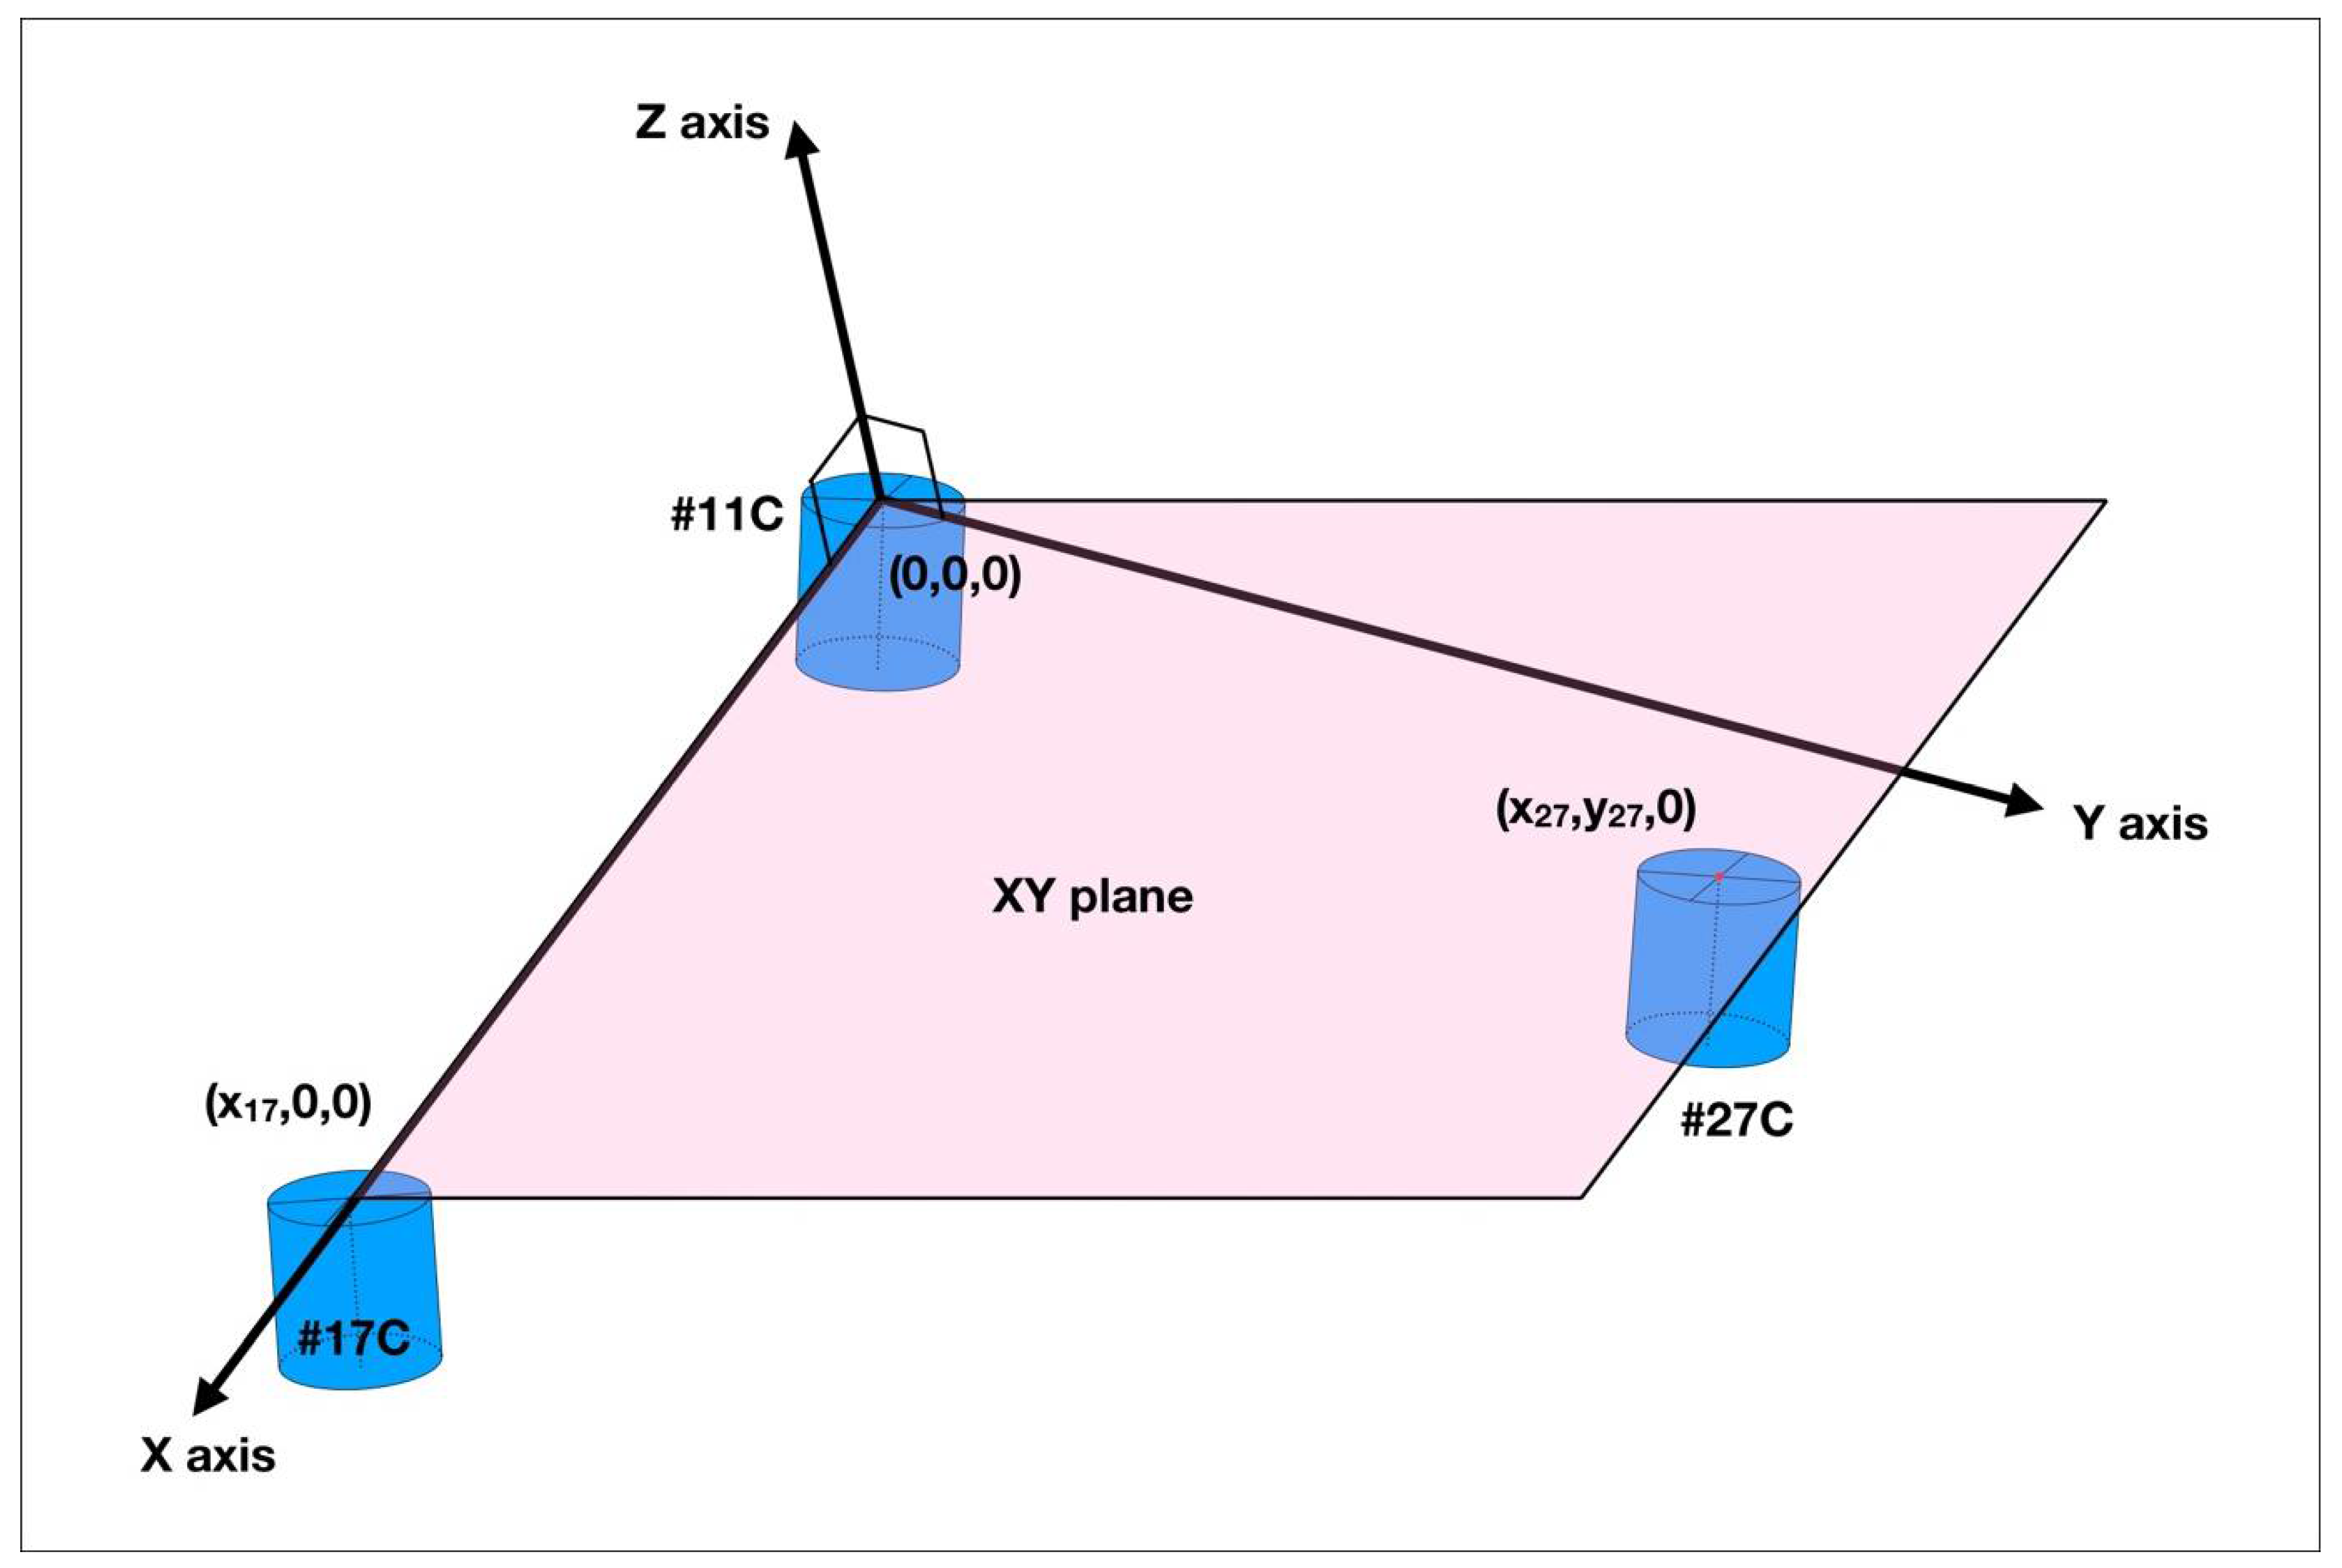
Two different measurement methods were used to calculate the 3-dimensional coordinates of each cylinder’s centroid. Physical models (master model and definitive casts) were measured using a computerized coordinate measuring machine (CMM; Micura, Zeiss, Oberkochen, Germany) with a geometric processing software (Calypso, Zeiss) (Figure 4). For the digital models, geometric inspection software (Geomagic Control X, 3D systems, Rocky Hill, CT, USA) was used to compute the centroid of each cylinder (Figure 5). Once the centroid of each cylinder was calculated using a preset coordinate system (i.e., machine coordinate of the CMM), a new part coordinate system was defined as follows. The centroids of three cylinders (#17C, #11C, and #27C) were used as the reference centroids. The centroid of #11C was defined as the origin (0, 0, 0). A line connecting the centroids of #11C and #17C was designated as the X axis. A plane consisting of three points, centroids of #17C, #11C, and #27C, was designated as the XY plane (Figure 6). The (x, y, z) coordinate of each cylinder centroid was computed based on the part coordinate system defined above. To test the inter-operator reliability, one digital model was chosen from the 25 digital models. Two additional operators (KR Kim and MY Yang) measured the digital model using the geometric analysis software to calculate each cylinder’s centroid.
Accuracy consists of trueness and precision [27]. In the current study, trueness was defined as the linear displacement of each cylinder’s centroid between the master model and the test groups (Groups CI and IOS). The linear displacement was represented by the difference in the absolute values of the centroid coordinates (Δx, Δy, Δz). In addition to absolute values, raw values were also presented in scatter graphs to visualize the amount of coordinate differences (Δx, Δy, Δz) at each cylinder position. The overall 3-dimensional displacement was represented by ΔD, and ΔD. Precision is described as the degree of closeness between repeated measurements. Precision values were calculated based on the difference in coordinates between the 25 specimens in the same group, and the absolute values were used for statistical comparison. Mean and standard deviations of the differences were calculated.
2.3. Statistical Analysis
Statistical evaluation was performed using analysis software (SPSS v. 22, IBM SPSS, Armonk, NY, USA). To test the first null hypothesis, which is that the new method was not reliable to evaluate the accuracy of complete-arch impression, the intraclass correlation coefficient was calculated using the coordinate values of the master model, definitive casts, and digital models. The intraclass correlation coefficient represented the reliability of repeated measurements of identical objects [28]. Additional intraclass correlation coefficients were calculated to test the reliability between operators using the 3 datasets measured by the 3 different operators. An independent two-sample t-test was used to compare the absolute trueness between the groups. The results of the comparison of absolute trueness could be different for each cylinder position; therefore, a linear mixed model was applied to understand the general tendency of the results. To analyze the precision, an independent two-sample t-test was performed. A significance level of 5% was used for all statistical analyses.
3. Results
Table 1 represents the results of the reliability tests. The reliability tests showed that, for all the x, y, z measurements of the master model, Groups CI and ISO showed an intraclass correlation coefficient of 1.000, which meant that the data set had almost perfect reliability. The inter-operator reliability also showed an intraclass correlation coefficient of 1.000, which meant that the three measured datasets had a near perfect reliability between three different operators. Table 2 shows a comparison of the absolute trueness between the conventional and digital impressions. An independent two-sample t-test showed that the absolute trueness was significantly different between groups in 35 out of 49 Δx, Δy, Δz, and ΔD comparisons. Even for the same cylinder position, the trueness favored different impression methods in Δx, Δy, Δz, and ΔD comparisons, group CI was more accurate in 26 comparisons while group IOS was more accurate in 9 comparisons, further, the accuracy between the groups was different according to the position of the cylinder.
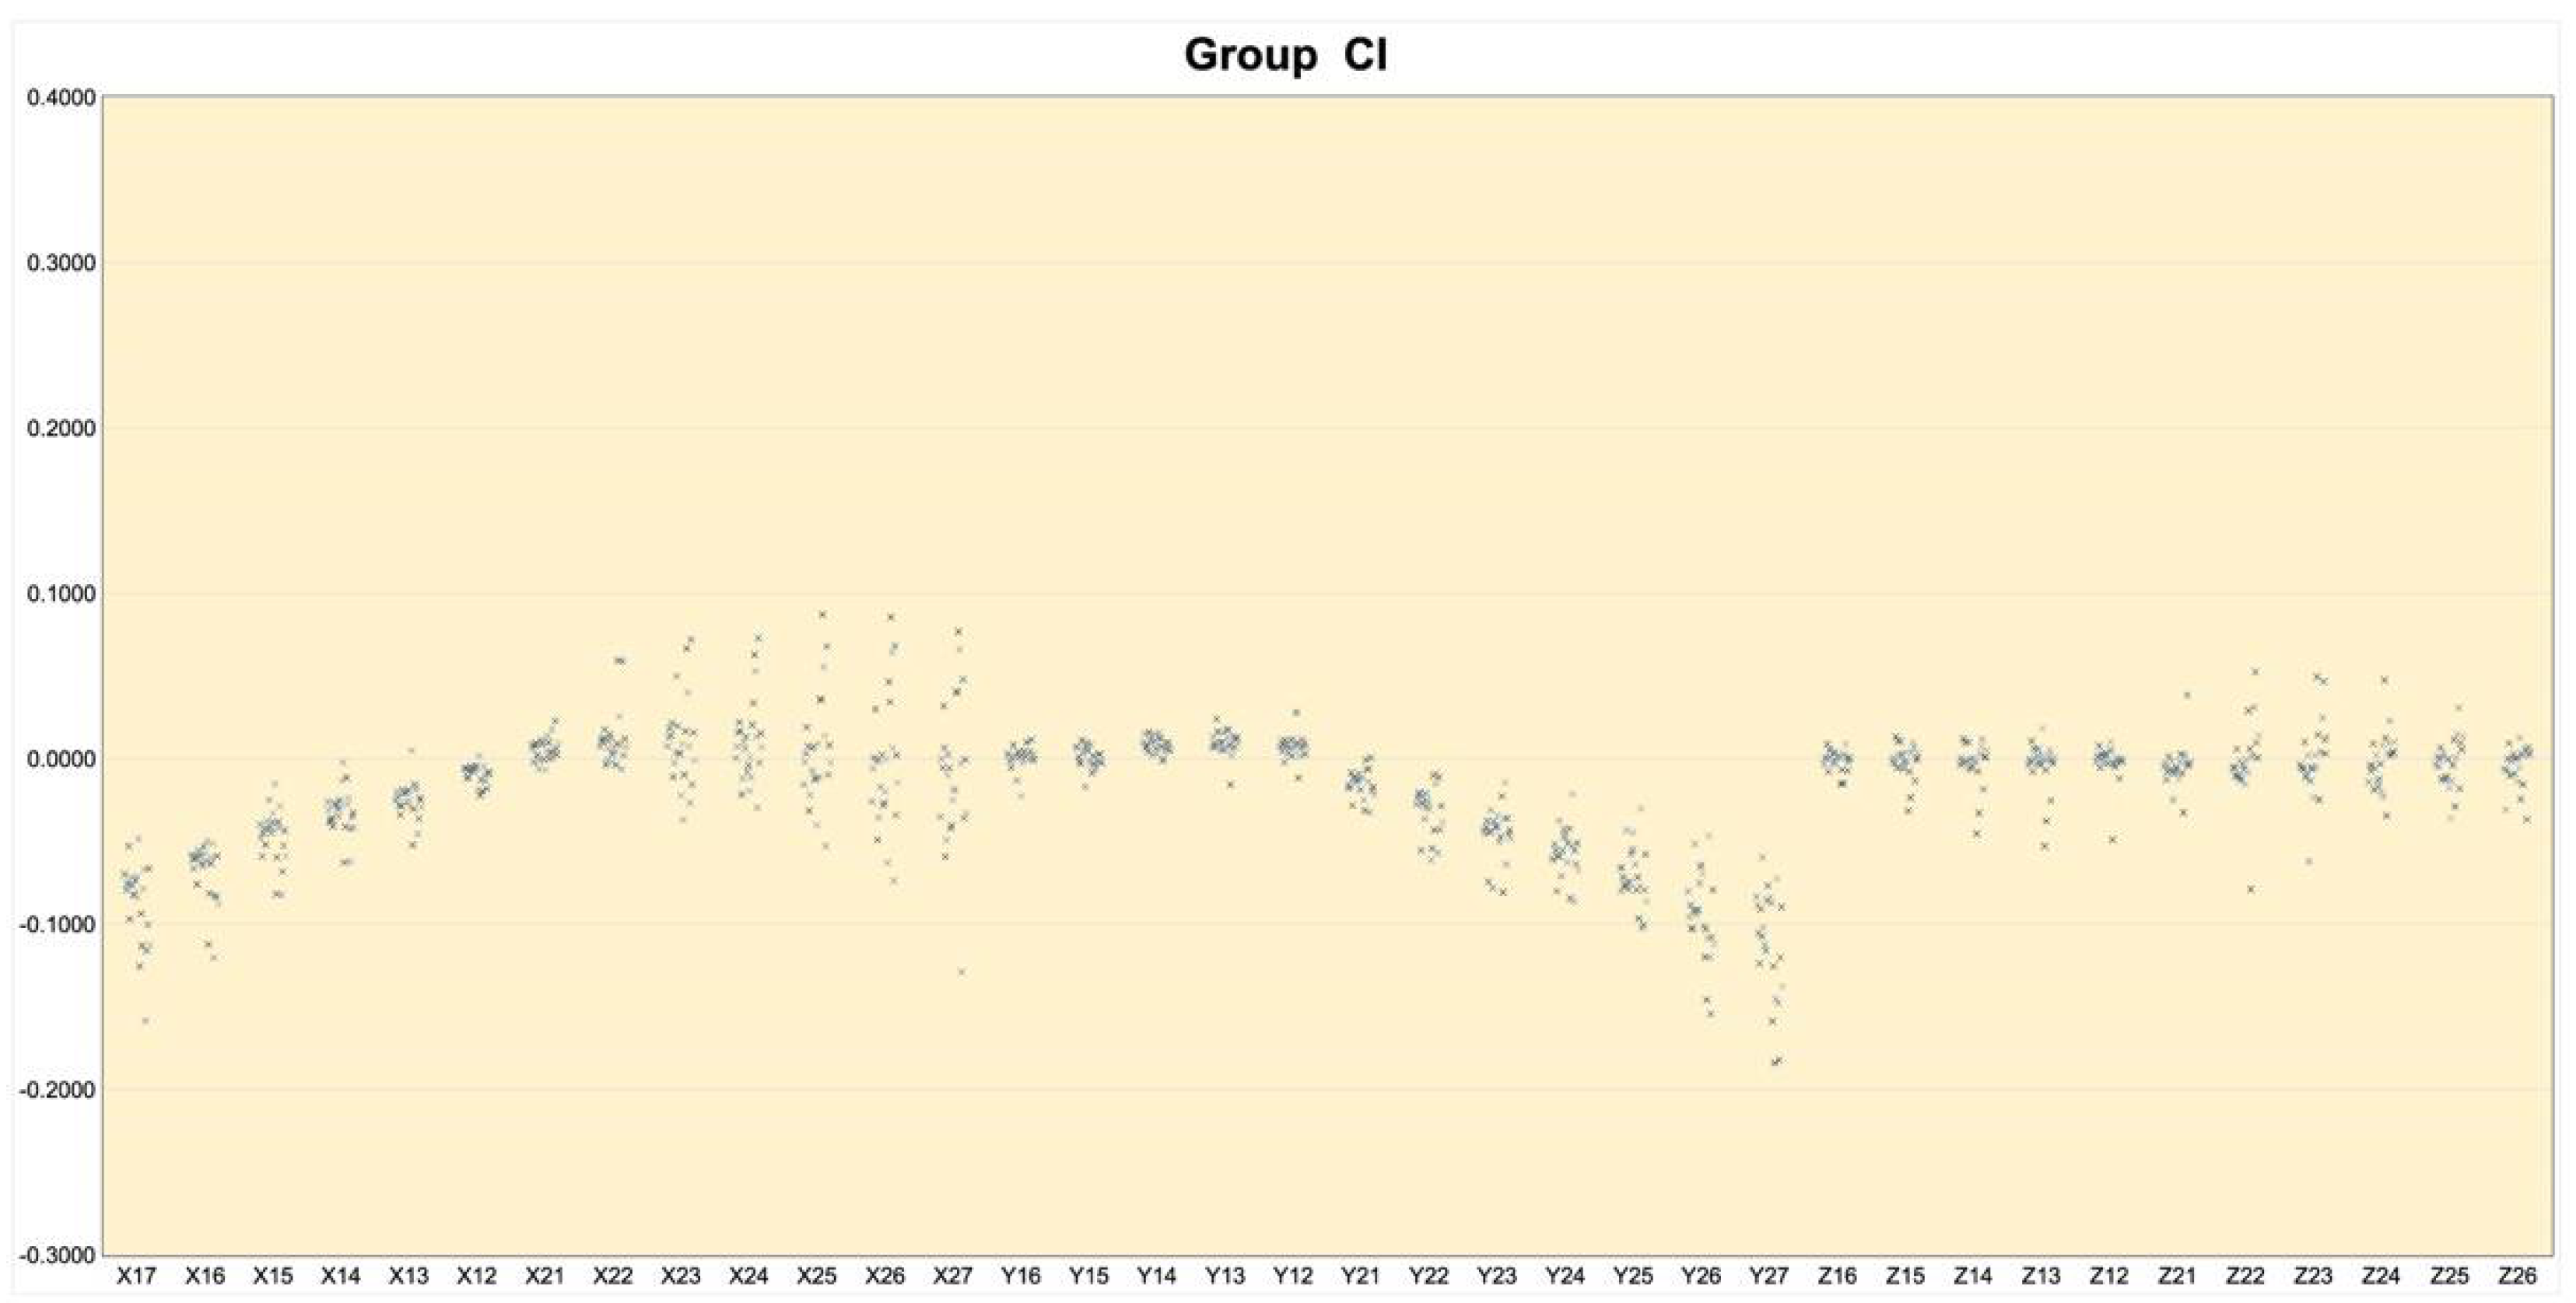
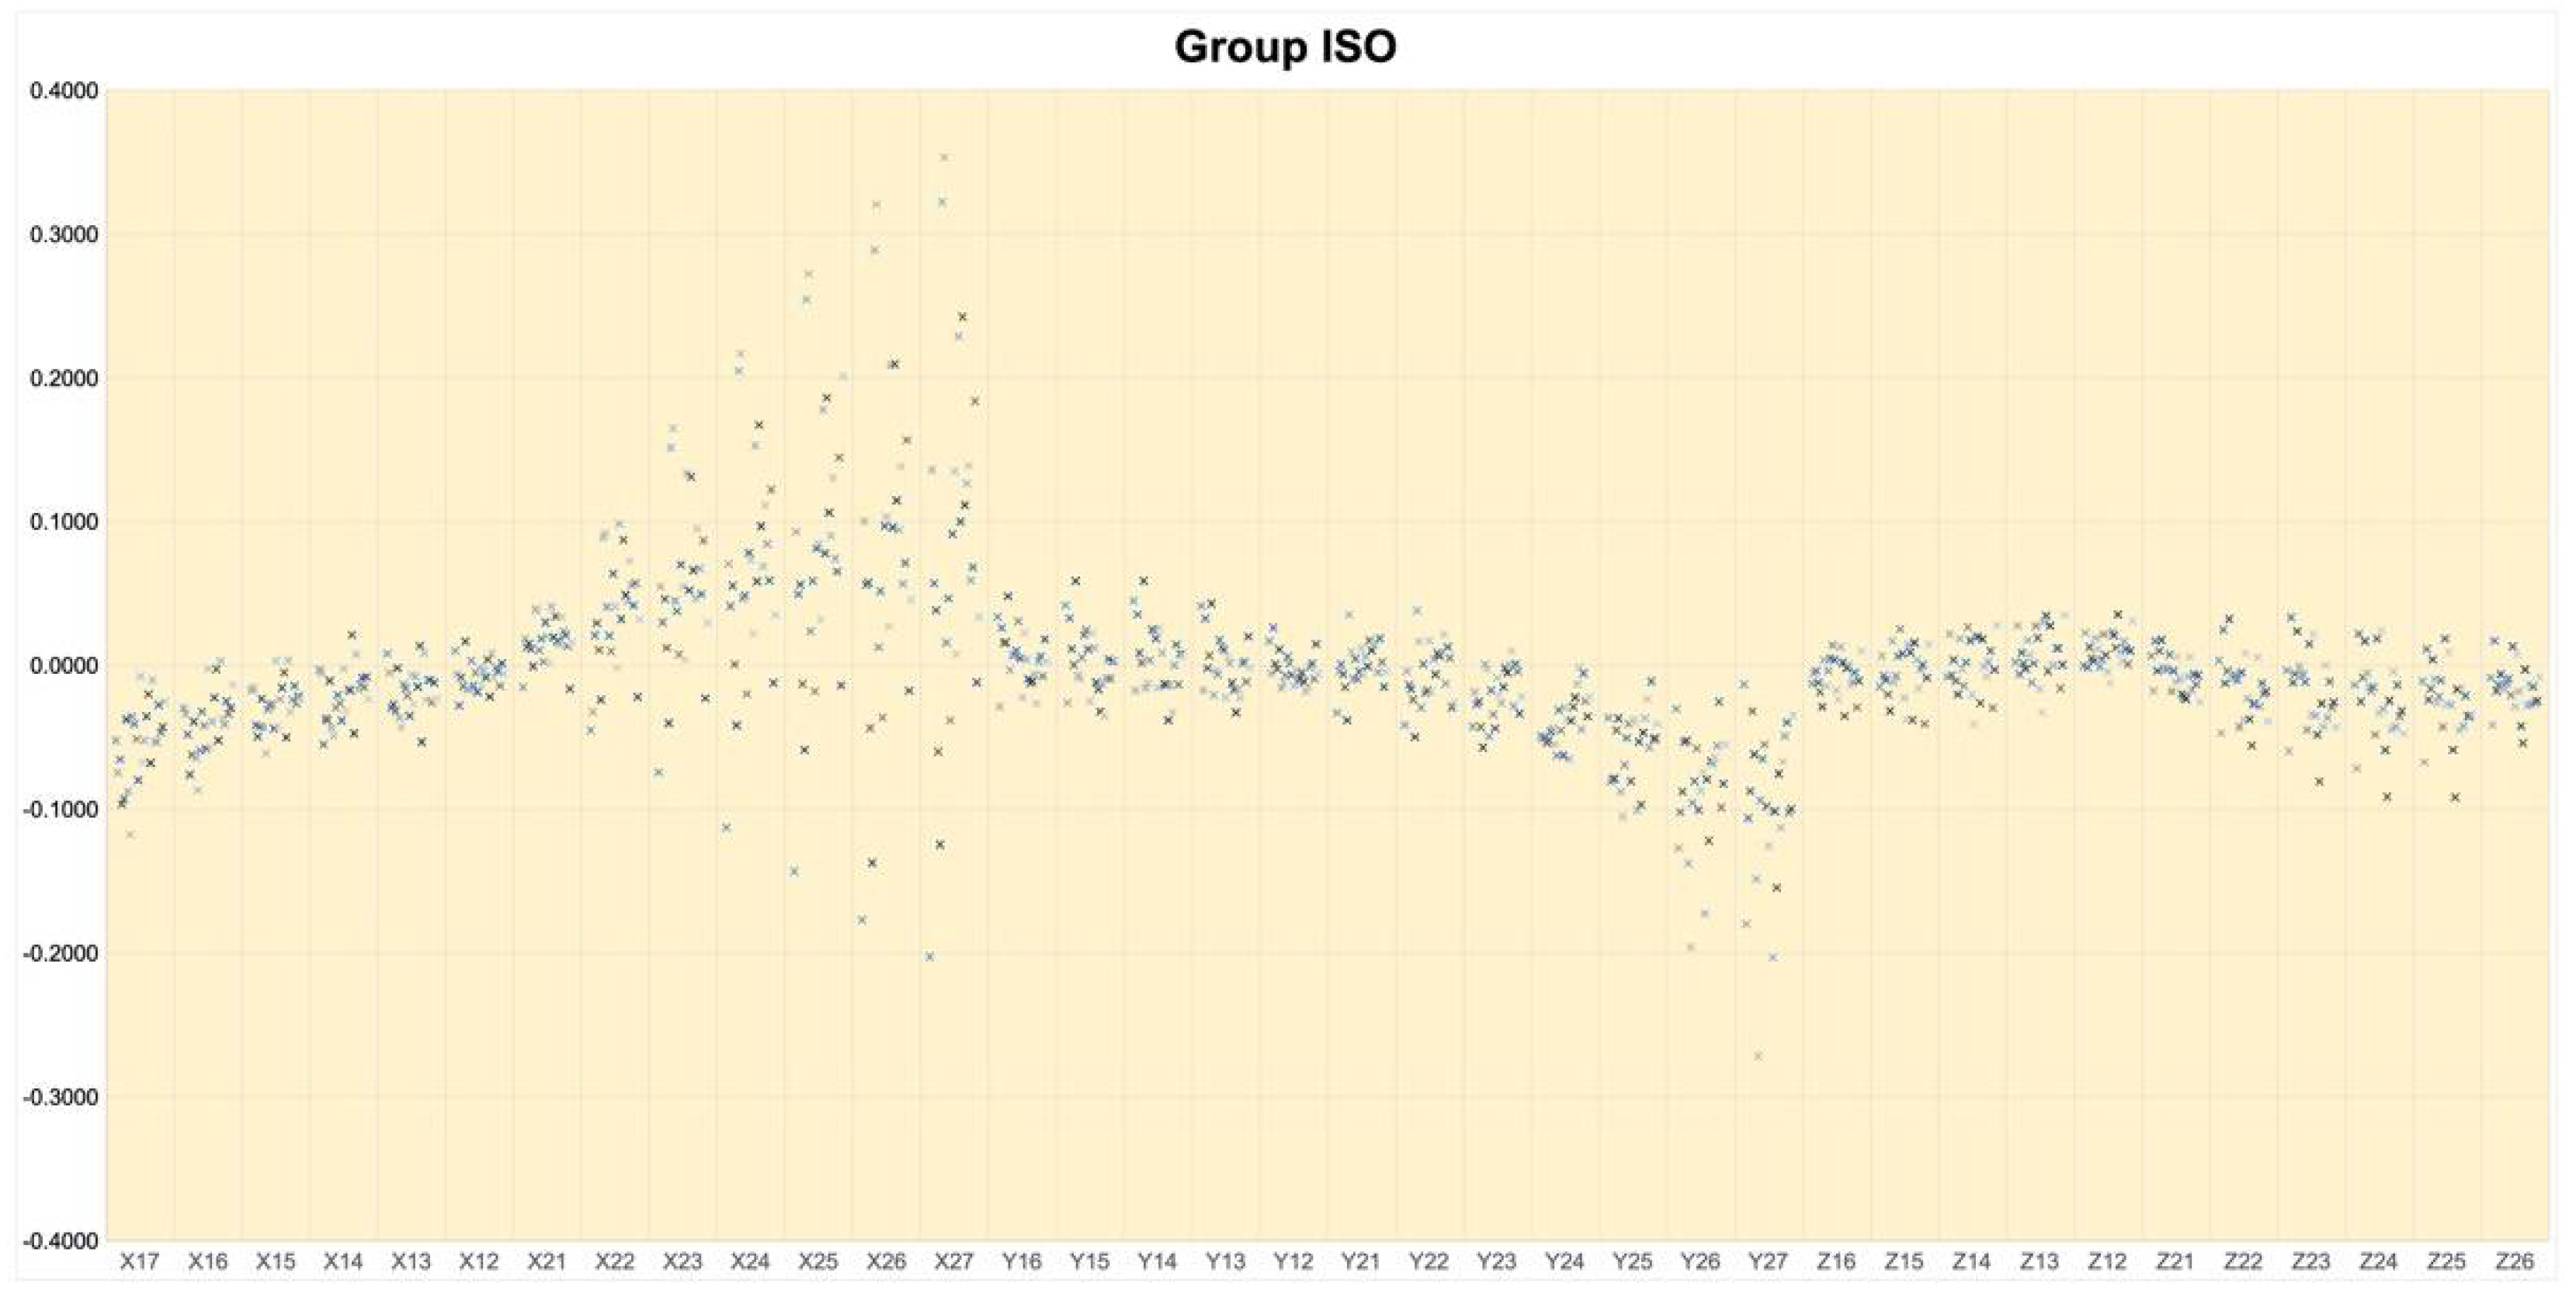
Figure 7 and Figure 8 present the amount of Δx, Δy, and Δz at each cylinder position in groups CI and ISO, respectively. In the right quadrant, the amounts of Δx and Δy were inclined negative and greatest at #17C, then values converged on zero as the position of the cylinder got closer to the origin. In the left quadrant, the amounts of Δx and Δy tended to gradually increase as the cylinder positions moved away from the origin. The Δx values were distributed as positive and negative, while the Δy values were mostly negative. The Δz values were relatively small compared to Δx or Δy both in the right and left quadrants.
The general tendency of trueness was evaluated using the linear mixed model, and the results showed that the conventional impression method was more accurate than intraoral digital scans for Δx, Δy, Δz, and ΔD (p < 0.05) (Table 3). Table 4 presents the comparison of absolute precision between conventional and digital impressions. The conventional impression method showed a more accurate precision than intraoral digital scans at every centroid coordinate except the x coordinate of #15C and z coordinate of #22C. Conventional impression also showed a more accurate overall precision for Δx, Δy, and Δz (p < 0.001).
4. Discussion
The primary aim of the present study was to verify the reliability of a new method to analyze the three-dimensional accuracy of complete-arch impressions. In addition, the second aim was to compare the accuracy of conventional and intraoral digital impressions using the new method.
The CMM used in the present study has a 0.7-μm accuracy, with a 0.55-μm repeatability, and the geometric analysis software is reported to have less than 10−4 microns and 10−4 arc second of separation or tilt for cylinders and planes [29,30]. Therefore, the CMM and the geometric software were accurate enough to measure the physical models (master model and definitive casts) and the digital models. In the present study, a new coordinate system was set using the three reference centroids, therefore, all 13 centroids’ coordinates, except the origin (#11C), were influenced by any deviation of the reference centroids. The results show that each ICC of Δx, Δy, and Δz resulted in the value of 1 for the master model, definitive casts, as well as the digital models, therefore, the first null hypothesis was rejected. Landis and Koch classified the degree of reliability into five categories, which were slight (0.00 < ICC ≤ 0.20), fair (0.21 < ICC ≤ 0.40), moderate (0.41 < ICC ≤ 0.60), substantial (0.61 < ICC ≤ 0.80), and almost perfect (0.81 < ICC ≤ 1) [26]. The ICC value of 1 for the physical and digital models in the present study meant that the new method had an almost perfect reliability to evaluate the accuracy of complete-arch impressions. The inter-operator reliability test also showed that the new method had an almost perfect reliability between different operators.
The present study applied three-dimensional metrology to assess the position of each tooth. To the authors’ knowledge, this is the first study to evaluate the three-dimensional distortion of each tooth position using the metrology concept. Natural tooth has an irregular freeform configuration; therefore, coordinate measurements cannot be applied to locate tooth positions. In the present study, a basic geometrical shape, a cylinder, was used to represent each tooth; therefore, coordinate measurements could be used to assess the three-dimensional position of each cylinder centroid and the displacement of each centroid in the X, Y, and Z axes. The new method presented in this study can exclude the inherent superimposition errors of best fit alignment, which was frequently used to compare the accuracy between digital models. In addition, it also excluded the inherent errors in converting the master model and definitive casts to digital models. This new method can be applied to evaluate the accuracy of any physical or digital model; therefore, it is possible to apply it to a wide variety of fields. The method can be applied to evaluate the accuracy of newly developed impression materials, as well as stereolithography models fabricated using different types of three-dimensional printers. Further, researchers can also analyze the amount of distortion in each impression step by scanning an impression before pouring any modeling stone. Then, the amount of distortion can be divided into the distortion from polymerization shrinkage of impression materials from the setting expansion of modeling stone.
A linear mixed model is an analytical method that can be analyzed while taking intra-subject correlations that are characteristic of repeated measurement data into account. Linear mixed model analysis showed that conventional impressions resulted in more accurate absolute trueness than intraoral digital scans, even though intraoral digital scans showed more accurate trueness at several tooth positions using an independent two sample t-test. In addition, conventional impressions showed more accurate precision at every x, y, z coordinate except the x coordinate of #15C and z coordinate of #22C (p > 0.05). Based on the results above, the second null hypothesis was also rejected. This finding is in agreement with that of the other studies evaluating the accuracy of complete-arch digital scans compared with conventional impressions. Ender et al. evaluated the complete-arch impression accuracy of intraoral digital scans, and reported that the intraoral digital scan was less accurate than conventional impressions and showed a different pattern of deviations [27]. Kuhr et al. evaluated the trueness and precision of complete-arch digital impressions using various intraoral scanners and reported that the conventional impression method was significantly more accurate than intraoral scanners [24]. A recent study also reported that digital scans using an intraoral scanner were less accurate than the conventional impression method on partial or full arches [22]. Previous studies have reported that digital impressions using intraoral scanners showed comparable accuracy with conventional impression methods on quadrant impressions [17,18]. Group CI and ISO showed similar Δx, Δy and Δz raw data distributions in Figure 7 and Figure 8, however, Group ISO resulted in a greater dispersion than Group CI. Therefore, it can be concluded that the accuracy of intraoral digital scans was still less accurate than conventional impressions for complete-arch impressions.
The present study has some limitations. Coordinate measurements can be only applied to basic geometric shapes; therefore, it is not possible to apply this method to real dentitions. Further, it was difficult to find a general trend of each centroid’s deviation direction, and this is due to the use of absolute values for trueness and precision. Instead of raw values, absolute values were chosen to prevent dilution of the amount of deviation. The current study used only one commercial intraoral scanner; different intraoral scanners could lead to different results. Even with the limitations above, this new method is very useful to compare the statistical significance of trueness and precision between impression methods, but not to measure the amount of trueness and precision. Simply, this new method favors qualitative rather than quantitative comparisons. Quantitative, as well as qualitative analyses, will be included in future studies.
5. Conclusions
Within the limitations of the current study, the following conclusions were drawn.
- The new method was reliable to evaluate the three-dimensional accuracy of complete-arch impressions.
- Conventional impressions showed a more accurate absolute trueness than intraoral digital scans in x, y, z coordinates, as well as the linear three-dimensional distance, ΔD.
- Conventional impression also showed more accurate precision than intraoral digital scans in the x, y, and z coordinates.
Author Contributions
S.K. designed and managed the experiment, wrote the manuscript; K.S. performed all the measurements, prepared all the experiment, wrote the draft. Both authors have read and agreed to the published version of the manuscript.
Funding
This study was partly funded by Academic & Research Fund 2020, College of Dentistry, Yonsei University.
Institutional Review Board Statement
Not applicable.
Informed Consent Statement
Not applicable.
Data Availability Statement
Data can be provided upon requested from the corresponding author.
Conflicts of Interest
The authors declare no conflict of interest.
References
- Perakis, N.; Belser, U.C.; Magne, P. Final impressions: A review of material properties and description of a current technique. Int. J. Periodontics Restor. Dent. 2004, 24, 109–117. [Google Scholar]
- Chandran, D.T.; Jagger, D.C.; Jagger, R.G.; Barbour, M.E. Two- and three-dimensional accuracy of dental impression materials: Effects of storage time and moisture contamination. Bio-Med. Mater. Eng. 2010, 20, 243–249. [Google Scholar] [CrossRef]
- Soğanci, G.; Cinar, D.; Caglar, A.; Yagiz, A. 3D evaluation of the effect of disinfectants on dimensional accuracy and stability of two elastomeric impression materials. Dent. Mater. J. 2018, 37, 675–684. [Google Scholar] [CrossRef] [Green Version]
- Dounis, K.S.; Dounis, G.; Ditmyer, M.M.; Ziebert, G.J. Accuracy of successive casts for full-arch fixed prostheses. Int. J. Prosthodont. 2010, 23, 446–449. [Google Scholar] [PubMed]
- Shah, S.; Sundaram, G.; Bartlett, D.; Sherriff, M. The use of a 3D laser scanner using superimpositional software to assess the accuracy of impression techniques. J. Dent. 2004, 32, 653–658. [Google Scholar] [CrossRef] [PubMed]
- Robben, J.; Muallah, J.; Wesemann, C.; Nowak, R.; Mah, J.; Pospiech, P.; Bumann, A. Suitability and accuracy of CBCT model scan: An in vitro study. Int. J. Comput. Dent. 2018, 20, 363–375. [Google Scholar]
- Thongthammachat, S.; Moore, B.K.; Barco, M.T.; Hovijitra, S.; Brown, D.T.; Andres, C.J. Dimensional accuracy of dental casts: Influence of tray material, impression material, and time. J. Prosthodont. 2002, 11, 98–108. [Google Scholar] [CrossRef]
- Vitti, R.P.; Da Silva, M.A.B.; Consani, R.L.X.; Sinhoreti, M.A.C. Dimensional Accuracy of Stone Casts Made from Silicone-Based Impression Materials and Three Impression Techniques. Braz. Dent. J. 2013, 24, 498–502. [Google Scholar] [CrossRef] [Green Version]
- Mann, K.; Davids, A.; Range, U.; Richter, G.; Boening, K.; Reitemeier, B. Experimental study on the use of spacer foils in two-step putty and wash impression procedures using silicone impression materials. J. Prosthet. Dent. 2015, 113, 316–322. [Google Scholar] [CrossRef]
- Kim, S.; Nicholls, J.I.; Han, C.-H.; Lee, K.-W. Displacement of implant components from impressions to definitive casts. Int. J. Oral Maxillofac. Implant. 2006, 21, 745–755. [Google Scholar]
- Kwon, J.-H.; Son, Y.-H.; Han, C.-H.; Kim, S. Accuracy of implant impressions without impression copings: A three-dimensional analysis. J. Prosthet. Dent. 2011, 105, 367–373. [Google Scholar] [CrossRef]
- Joda, T.; Zarone, F.; Ferrari, M. The complete digital workflow in fixed prosthodontics: A systematic review. BMC Oral Health 2017, 17, 124. [Google Scholar] [CrossRef]
- Joda, T.; Brägger, U. Time-Efficiency Analysis Comparing Digital and Conventional Workflows for Implant Crowns: A Prospective Clinical Crossover Trial. Int. J. Oral Maxillofac. Implant. 2015, 30, 1047–1053. [Google Scholar] [CrossRef] [PubMed]
- Beuer, F.; Schweiger, J.; Edelhoff, D. Digital dentistry: An overview of recent developments for CAD/CAM generated restorations. Br. Dent. J. 2008, 204, 505–511. [Google Scholar] [CrossRef] [PubMed]
- Ahlholm, P.; Sipilä, K.; Vallittu, P.; Jakonen, M.; Kotiranta, U. Digital Versus Conventional Impressions in Fixed Prosthodontics: A Review. J. Prosthodont. 2018, 27, 35–41. [Google Scholar] [CrossRef] [PubMed] [Green Version]
- Rutkūnas, V.; Gečiauskaitė, A.; Jegelevičius, D.; Vaitiekūnas, M. Accuracy of digital implant impressions with intraoral scanners. A systematic review. Eur. J. Oral Implant. 2017, 10 (Suppl. 1), 101–120. [Google Scholar]
- Chochlidakis, K.M.; Papaspyridakos, P.; Geminiani, A.; Chen, C.-J.; Feng, I.J.; Ercoli, C. Digital versus conventional impressions for fixed prosthodontics: A systematic review and meta-analysis. J. Prosthet. Dent. 2016, 116, 184–190. [Google Scholar] [CrossRef] [PubMed]
- Kim, W.K.; Kim, S. Effect of number of pontics and impression technique on the accuracy of four-unit monolithic zirconia fixed dental prostheses. J. Prosthet. Dent. 2018, 119, 860-e1. [Google Scholar] [CrossRef]
- Ender, A.; Mehl, A. In-vitro evaluation of the accuracy of conventional and digital methods of obtaining full-arch dental impressions. Quintessence Int. 2015, 46, 9–17. [Google Scholar] [CrossRef]
- Ender, A.; Mehl, A. Full arch scans: Conventional versus digital impressions--an in-vitro study. Int. J. Comput. Dent. 2011, 14, 11–21. [Google Scholar] [CrossRef]
- Patzelt, S.B.M.; Emmanouilidi, A.; Stampf, S.; Strub, J.R.; Att, W. Accuracy of full-arch scans using intraoral scanners. Clin. Oral Investig. 2014, 18, 1687–1694. [Google Scholar] [CrossRef] [PubMed]
- Malik, J.; Rodriguez, J.; Weisbloom, M.; Petridis, H. Comparison of Accuracy Between a Conventional and Two Digital Intraoral Impression Techniques. Int. J. Prosthodont. 2018, 31, 107–113. [Google Scholar] [CrossRef]
- Tomita, Y.; Uechi, J.; Konno, M.; Sasamoto, S.; Iijima, M.; Mizoguchi, I. Accuracy of digital models generated by conventional impression/plaster-model methods and intraoral scanning. Dent. Mater. J. 2018, 37, 628–633. [Google Scholar] [CrossRef] [PubMed] [Green Version]
- Kuhr, F.; Schmidt, A.; Rehmann, P.; Wöstmann, B. A new method for assessing the accuracy of full arch impressions in patients. J. Dent. 2016, 55, 68–74. [Google Scholar] [CrossRef]
- Su, T.-S.; Sun, J. Comparison of repeatability between intraoral digital scanner and extraoral digital scanner: An in-vitro study. J. Prosthodont. Res. 2015, 59, 236–242. [Google Scholar] [CrossRef]
- Güth, J.-F.; Edelhoff, D.; Schweiger, J.; Keul, C. A new method for the evaluation of the accuracy of full-arch digital impressions in vitro. Clin. Oral Investig. 2016, 20, 1487–1494. [Google Scholar] [CrossRef] [PubMed]
- Ender, A.; Mehl, A. Accuracy of complete-arch dental impressions: A new method of measuring trueness and precision. J. Prosthet. Dent. 2013, 109, 121–128. [Google Scholar] [CrossRef] [Green Version]
- Landis, J.R.; Koch, G.G. The measurement of observer agreement for categorical data. Biometrics 1977, 33, 159–174. [Google Scholar] [CrossRef] [Green Version]
- Available online: https://applications.zeiss.com/C1257A26006EFF9E/0/DC5EC1E87A19912DC1257A3900659A80/$FILE/EN_60_020_0166II_ZEISS_Bridge-type-CMMs.pdf (accessed on 18 May 2021).
- Available online: https://support.3dsystems.com/s/article/3D-Systems-Software-Certification?language=en_US (accessed on 2 May 2020).
Figure 1.
Master model. Irregular patterns were engraved around the polyetheretherketone cylinders to differentiate each cylinder.
Figure 1.
Master model. Irregular patterns were engraved around the polyetheretherketone cylinders to differentiate each cylinder.

Figure 2.
Definitive cast fabricated by conventional impression.

Figure 3.
Scanning sequence for digital impression of the master model.

Figure 4.
Measurements of the master model using a computerized coordinate measuring machine.

Figure 5.
Coordinate measurement of the digital model using a digital geometric analysis software.

Figure 6.
The part coordinate system used in the current study. Centroid of #11C was defined as the origin (0, 0, 0). The line connecting the centroids of #11C and #17C was designated as the X-axis. A plane consisting of three points, the centroids of #17C, #11C, and #27C, was designated as the XY plane.

Figure 7.
Distributions of Δx, Δy, and Δz in Group CI. Vertical axis represents the amount of difference between the master model and definitive casts (trueness values) in millimeters. Horizontal axis represents the cylinder position according to the axis (i.e., X17 represents Δx at cylinder 17).
Figure 7.
Distributions of Δx, Δy, and Δz in Group CI. Vertical axis represents the amount of difference between the master model and definitive casts (trueness values) in millimeters. Horizontal axis represents the cylinder position according to the axis (i.e., X17 represents Δx at cylinder 17).

Figure 8.
Distribution of Δx, Δy, and Δz in Group ISO. Vertical axis represents the amount of difference between the master model and digital models (trueness values) in millimeters. Horizontal axis represents the cylinder position according to the axis (i.e., X17 represented Δx at cylinder 17).
Figure 8.
Distribution of Δx, Δy, and Δz in Group ISO. Vertical axis represents the amount of difference between the master model and digital models (trueness values) in millimeters. Horizontal axis represents the cylinder position according to the axis (i.e., X17 represented Δx at cylinder 17).


Table 1.
Reliability test using intraclass correlation coefficient (ICC).
| ICC (95% CI) | p | ||
|---|---|---|---|
| Master model | Δx | 1.000 (1.000–1.000) | <0.001 |
| Δy | 1.000 (1.000–1.000) | <0.001 | |
| Δz | 1.000 (1.000–1.000) | <0.001 | |
| Group CI | Δx | 1.000 (1.000–1.000) | <0.001 |
| Δy | 1.000 (1.000–1.000) | <0.001 | |
| Δz | 1.000 (1.000–1.000) | <0.001 | |
| Group IOS | Δx | 1.000 (1.000–1.000) | <0.001 |
| Δy | 1.000 (1.000–1.000) | <0.001 | |
| Δz | 1.000 (1.000–1.000) | <0.001 | |
| Operators | 1.000 (1.000–1.000) | <0.001 |
Table 2.
Absolute trueness values and standard deviation (SD) for x, y, z coordinates and 3-dimensional linear distortion (mm).
Table 2.
Absolute trueness values and standard deviation (SD) for x, y, z coordinates and 3-dimensional linear distortion (mm).
| Δx | Δy | Δz | ΔD | |||||||||
|---|---|---|---|---|---|---|---|---|---|---|---|---|
| Position | Group CI | Group IOS | p | Group CI | Group IOS | p | Group CI | Group IOS | p | Group CI | Group IOS | p |
| #17C | 0.086 ± 0.024 | 0.054±0.027 | <0.001 | 0.086±0.024 | 0.054±0.027 | <0.001 | ||||||
| #16C | 0.068 ± 0.018 | 0.039 ± 0.022 | <0.001 | 0.005 ± 0.005 | 0.015 ± 0.012 | <0.001 | 0.004 ± 0.004 | 0.012 ± 0.009 | 0.001 | 0.069 ± 0.018 | 0.048 ± 0.019 | <0.001 |
| #15C | 0.047 ± 0.016 | 0.028 ± 0.016 | <0.001 | 0.005 ± 0.004 | 0.018 ± 0.014 | <0.001 | 0.007 ± 0.007 | 0.016 ± 0.011 | 0.003 | 0.048 ± 0.016 | 0.041 ± 0.019 | 0.111 |
| #14C | 0.032 ± 0.013 | 0.023 ± 0.015 | 0.033 | 0.008 ± 0.005 | 0.019 ± 0.014 | 0.001 | 0.008 ± 0.011 | 0.015 ± 0.011 | 0.018 | 0.036 ± 0.013 | 0.038 ± 0.015 | 0.665 |
| #13C | 0.025 ± 0.010 | 0.020 ± 0.013 | 0.107 | 0.011 ± 0.005 | 0.015 ± 0.012 | 0.106 | 0.008 ± 0.013 | 0.014 ± 0.012 | 0.092 | 0.031 ± 0.013 | 0.034 ± 0.012 | 0.377 |
| #12C | 0.009 ± 0.006 | 0.010 ± 0.007 | 0.666 | 0.008 ± 0.005 | 0.009 ± 0.006 | 0.504 | 0.005 ± 0.010 | 0.012 ± 0.010 | 0.015 | 0.015 ± 0.011 | 0.021 ± 0.008 | 0.017 |
| #21C | 0.007 ± 0.006 | 0.019 ± 0.011 | <0.001 | 0.015 ± 0.008 | 0.012 ± 0.010 | 0.247 | 0.008 ± 0.010 | 0.011 ± 0.007 | 0.241 | 0.021 ± 0.009 | 0.029 ± 0.010 | 0.012 |
| #22C | 0.013 ± 0.015 | 0.045 ± 0.027 | <0.001 | 0.031 ± 0.015 | 0.018 ± 0.012 | 0.002 | 0.014 ± 0.018 | 0.022 ± 0.015 | 0.089 | 0.040 ± 0.021 | 0.058 ± 0.023 | 0.006 |
| #23C | 0.020 ± 0.019 | 0.063 ± 0.043 | <0.001 | 0.045 ± 0.015 | 0.022 ± 0.017 | <0.001 | 0.015 ± 0.016 | 0.026 ± 0.020 | 0.029 | 0.055 ± 0.023 | 0.079 ± 0.037 | 0.006 |
| #24C | 0.019 ± 0.019 | 0.080 ± 0.057 | <0.001 | 0.057 ± 0.015 | 0.039 ± 0.017 | <0.001 | 0.012 ± 0.011 | 0.030 ± 0.021 | 0.001 | 0.064 ± 0.018 | 0.102 ± 0.050 | 0.001 |
| #25C | 0.023 ± 0.023 | 0.100 ± 0.072 | <0.001 | 0.071 ± 0.017 | 0.058 ± 0.025 | 0.036 | 0.011 ± 0.010 | 0.029 ± 0.021 | <0.001 | 0.078 ± 0.022 | 0.126 ± 0.067 | 0.002 |
| #26C | 0.029 ± 0.026 | 0.109 ± 0.081 | <0.001 | 0.095 ± 0.026 | 0.087 ± 0.040 | 0.426 | 0.009 ± 0.010 | 0.019 ± 0.012 | 0.001 | 0.102 ± 0.030 | 0.147 ± 0.080 | 0.013 |
| #27C | 0.033 ± 0.029 | 0.117 ± 0.094 | <0.001 | 0.111 ± 0.033 | 0.099 ± 0.058 | 0.386 | 0.118 ± 0.038 | 0.160 ± 0.099 | 0.051 | |||
| Overall | 0.032 ± 0.029 | 0.055 ± 0.058 | <0.001 | 0.038 ± 0.038 | 0.035 ± 0.050 | 0.183 | 0.009 ± 0.012 | 0.019 ± 0.016 | <0.001 | 0.059 ± 0.037 | 0.072 ± 0.064 | 0.001 |
Table 3.
Linear mixed model analysis. Estimated mean values (mm) ± standard error.
| Group CI | Group IOS | p | |
|---|---|---|---|
| Δx | 0.003 ± 0.001 | 0.007 ± 0.001 | 0.001 |
| Δy | 0.007 ± 0.001 | 0.010 ± 0.001 | 0.024 |
| Δz | 0.003 ± 0.001 | 0.008 ± 0.001 | <0.001 |
| ΔD | 0.010 ± 0.001 | 0.014 ± 0.001 | 0.006 |
Table 4.
Mean precision values and standard deviations (SD).
| Δx | Δy | Δz | |||||||
|---|---|---|---|---|---|---|---|---|---|
| Position | Group CI | Group IOS | p | Group CI | Group IOS | p | Group CI | Group IOS | p |
| #17C | 0.026 ± 0.023 | 0.032 ± 0.023 | 0.004 | ||||||
| #16C | 0.018 ± 0.018 | 0.026 ± 0.019 | <0.001 | 0.007 ± 0.007 | 0.022 ± 0.016 | <0.001 | 0.007 ± 0.006 | 0.015 ± 0.010 | <0.001 |
| #15C | 0.017 ± 0.014 | 0.019 ± 0.014 | 0.15 | 0.007 ± 0.006 | 0.026 ± 0.019 | <0.001 | 0.011 ± 0.010 | 0.022 ± 0.015 | <0.001 |
| #14C | 0.014 ± 0.012 | 0.021 ± 0.015 | <0.001 | 0.006 ± 0.004 | 0.027 ± 0.020 | <0.001 | 0.014 ± 0.014 | 0.022 ± 0.015 | <0.001 |
| #13C | 0.011 ± 0.010 | 0.019 ± 0.013 | <0.001 | 0.015 ± 0.016 | 0.020 ± 0.014 | <0.001 | 0.015 ± 0.016 | 0.020 ± 0.014 | <0.001 |
| #12C | 0.006 ± 0.005 | 0.012 ± 0.009 | <0.001 | 0.009 ± 0.013 | 0.013 ± 0.009 | <0.001 | 0.009 ± 0.013 | 0.013 ± 0.009 | <0.001 |
| #21C | 0.008 ± 0.006 | 0.017 ± 0.013 | <0.001 | 0.009 ± 0.007 | 0.018 ± 0.014 | <0.001 | 0.012 ± 0.013 | 0.014 ± 0.010 | 0.003 |
| #22C | 0.015 ± 0.017 | 0.045 ± 0.032 | <0.001 | 0.017 ± 0.013 | 0.024 ± 0.017 | <0.001 | 0.023 ± 0.023 | 0.025 ± 0.017 | 0.238 |
| #23C | 0.029 ± 0.023 | 0.063 ± 0.049 | <0.001 | 0.016 ± 0.015 | 0.021 ± 0.015 | <0.001 | 0.025 ± 0.022 | 0.032 ± 0.023 | <0.001 |
| #24C | 0.027 ± 0.022 | 0.083 ± 0.064 | <0.001 | 0.016 ± 0.013 | 0.020 ± 0.014 | 0.001 | 0.021 ± 0.018 | 0.033 ± 0.024 | <0.001 |
| #25C | 0.035 ± 0.028 | 0.106 ± 0.081 | <0.001 | 0.020 ± 0.015 | 0.029 ± 0.021 | <0.001 | 0.019 ± 0.015 | 0.028 ± 0.022 | <0.001 |
| #26C | 0.045 ± 0.034 | 0.126 ± 0.099 | <0.001 | 0.029 ± 0.022 | 0.044 ± 0.036 | <0.001 | 0.013 ± 0.011 | 0.018 ± 0.014 | <0.001 |
| #27C | 0.049 ± 0.039 | 0.143 ± 0.109 | <0.001 | 0.038 ± 0.029 | 0.064 ± 0.053 | <0.001 | |||
| Overall | 0.023 ± 0.025 | 0.054 ± 0.069 | <0.001 | 0.015 ± 0.017 | 0.027 ± 0.027 | <0.001 | 0.015 ± 0.016 | 0.022 ± 0.018 | <0.001 |
Publisher’s Note: MDPI stays neutral with regard to jurisdictional claims in published maps and institutional affiliations. |
© 2021 by the authors. Licensee MDPI, Basel, Switzerland. This article is an open access article distributed under the terms and conditions of the Creative Commons Attribution (CC BY) license (https://creativecommons.org/licenses/by/4.0/).
Share and Cite
MDPI and ACS Style
Seo, K.; Kim, S. A New Method to Evaluate Trueness and Precision of Digital and Conventional Impression Techniques for Complete Dental Arch. Appl. Sci. 2021, 11, 4612. https://0-doi-org.brum.beds.ac.uk/10.3390/app11104612
AMA Style
Seo K, Kim S. A New Method to Evaluate Trueness and Precision of Digital and Conventional Impression Techniques for Complete Dental Arch. Applied Sciences. 2021; 11(10):4612. https://0-doi-org.brum.beds.ac.uk/10.3390/app11104612
Chicago/Turabian StyleSeo, KweonSoo, and Sunjai Kim. 2021. "A New Method to Evaluate Trueness and Precision of Digital and Conventional Impression Techniques for Complete Dental Arch" Applied Sciences 11, no. 10: 4612. https://0-doi-org.brum.beds.ac.uk/10.3390/app11104612
Note that from the first issue of 2016, this journal uses article numbers instead of page numbers. See further details here.