Article

Physico-Chemical Parameters and Health Risk Analysis of Groundwater Quality

1
Chemistry and Chemical Engineering Department, Faculty of Applied Chemistry and Engineering, “Ovidius” University of Constanta, 900527 Constanta, Romania
2
Department of Economics, Faculty of Entrepreneurship, Business Engineering and Management, University POLITEHNICA of Bucharest, 060042 Bucharest, Romania
3
Department of Economic Engineering, Faculty of Entrepreneurship, Business Engineering and Management, University POLITEHNICA of Bucharest, 060042 Bucharest, Romania
4
Department of Fundamental Sciences and Humanities, Constanta Maritime University, 900663 Constanta, Romania
*
Author to whom correspondence should be addressed.
Submission received: 6 May 2021 / Revised: 19 May 2021 / Accepted: 19 May 2021 / Published: 23 May 2021

Abstract

:
Groundwater pollution is a very common problem worldwide, as it poses a serious threat to both the environment and the economic and social development and consequently generates several types of costs. The analysis of pollution control involves a permanent comparison between pollution costs and the costs associated with various methods of pollution reduction. An environmental policy based on economic instruments is more effective than an environmental policy focused on command and control tools. In this respect, the present paper provides a case study showing how anthropogenic factors such as wastewater, industrial, agricultural, and natural factors are able to change the physical and chemical parameters of groundwater in the study area, thus endangering their quality. In order to monitor the groundwater quality in the region of Dobrudja, an analysis of physico-chemical parameters was performed. The content of heavy metals was analyzed and the health risk index was taken into account and analyzed, in order to set a better correctness of the metal content from the underground waters. Studies on groundwater quality control have shown that, in many parts of the world, water has different degrees of quality depending on the natural and anthropogenic factors acting on the pertaining environment. This is why more attention should be paid to the prevention of groundwater pollution and the immediate remediation of accidents.

1. Introduction

The list of environmental issues that humanity has to face currently includes topics specific to areas (forest degradation) and activities (chemical risk) or global topics (climate change) that bring out three factors that are basic components of the current environmental crisis: overpopulation, depletion of resources, and pollution.
Groundwater occupies a special place in the economy, primarily as the main fresh water resource, as well as for agricultural irrigation, and industrial utilization. Groundwater quality can be affected by hydrogeochemical process and anthropogenic impacts such as rapid urbanization, and industrial and agricultural development [1].
In many countries all over the world, groundwater has become an important part of the drinking water supply process for industrialized areas, for agriculture, and not least for household use [2,3]. Recently, the support of life on earth has been based on the supply of drinking water from groundwater aquifers. They are superior in quality and have a natural protection against microbial activities. Another quality of groundwater is that it can be found all over the globe [4]. Groundwater has recently served as the main source of water supply for the earth’s populations, therefore its quality is very important. Both anthropogenic and natural factors are the main sources of water contamination [5].
The loss of the integrity of groundwater occurs due to domestic, public, and industrial wastewater that seeps through various channels in the ground such as defective canals, absorbent boreholes, or even through the ground layer. Another cause is the infiltration of rainwater loaded with pollutants from the atmosphere or even from the soil, due to uninsulated open-air industrial landfills, such as: ash from thermal power plants, wood waste, chloro-sodic landfills, sugar factory sludge, household waste, or metallurgical slag. The suspended materials from vehicular traffic, tire wear, and oil and gas leaks from vehicles are deposited on pavements, and all this material is carried by rainwater and infiltrate the surface of permeable pavements and the other base layers, accumulating over time. Permeable pavement systems, unlike conventional pavement, can reduce the amount of pollutants transported by rainwater and therefore decrease the total quantity of pollutants delivered to the receiving water bodies [6].
Defective tanks containing various fluid substances, losses due to the transport of petroleum products or other fluids, and even loading and unloading stations are other causes of groundwater infestation with pollutants [2]. Some of the factors that destroy the quality of groundwater are soil characteristics, groundwater circulation through different types of rocks, topography, and saline water infusion in coastal areas; but human activities also have effects on groundwater [3]. Of major importance, due to the frequency of infestation by this process, is the spread of fertilizers and phytopharmaceuticals on the soil surface, which then, by means of atmospheric precipitation, infiltrate underground. Of all these aspects, prevention action is the only effective way to protect groundwater quality [2].
Groundwater pollution is a very common problem worldwide [7,8,9,10,11], as it poses a serious threat to both the environment and economic and social development. Groundwater resources are threatened globally due to population growth [12], rapid urbanization [13], and agricultural/industrial development [14].
Nitrogen exists in the soil in the forms of nitrate, nitrite, and ammonium and can easily move into the groundwater by leaching effects. Elevated nitrate is a severe problem affecting regional groundwater quality in Korea [15], Denmark [16], Indonesia [17], China [18], and Italy [19].
Heavy metal pollution of groundwater is a serious problem for human health, as it causes toxicity and carcinogenic effects [3]. Human health, industrialization, as well as the practices of modern agriculture, require increased attention and protection of groundwater quality but also a rational exploitation within the limits of exploitation reserves [1]. In order to assess the groundwater quality, identify sources of contamination, and plan preventive measures to reduce the public health risks, authorities will need to perform routine monitoring of groundwater [20].
In Romania, the main economic sectors regarded as significant sources of water pollution are represented by industrial activities (the extractive industry, mining industry, chemical processing, metallurgical industry), agro-zootechnical activities, as well as unauthorized and inappropriate household and industrial landfills.
Economic Aspects of Pollution.
Pollution is an economic problem primarily because it reduces the value of the resources a society has at its disposal. Secondly, pollution is an economic problem also due to the fact that it involves a process of choice for resolving conflicts of interest (e.g., the polluter–polluted relationship will always be marked by the existence of conflicts of interest). Thirdly, pollution is an economic problem because the means themselves by which this phenomenon can be reduced require the use of resources (which in turn involve certain costs). Therefore, the analysis of pollution control involves a permanent comparison between pollution costs and the costs associated with different methods of pollution reduction.
Pollution generates several types of costs. Pollution reduction costs are the costs generated by reduction of the pollutant amount. The polluter can reduce the amount of pollutant by reducing the production of polluting goods. Yet pollution generates costs that are borne by society as a whole. As soon as pollution has occurred and the polluter fails to prevent it, there are two types of costs that society as a whole face [21].
When analyzing a polluting activity in terms of its economics, one cannot ignore the external cost of said activity. If a company fails to take measures to reduce pollution, the costs will be represented by the reduction of the value of production or consumption activities as affected by pollution. These costs are in the nature of damage, and that is why we have grown accustomed to calling them pollution damage. The variety of the damage (costs) is amazing. They are highlighted, for example, by the measurable loss of profit or utility of those affected by pollution (deterioration of water quality causes increased production costs of the company using this water, and therefore decreased profit).
In general, the decrease in profit is measurable for the simple reason that the additional factors necessary to rectify the situation are assessed on the market. The unfavorable mental consequences of polluting activities are much more difficult to measure, but certainly such effects influence consumption. Leaving aside the theoretical and practical difficulties of measuring these effects, we can say that the decrease in the value of production activities and the decrease in the value of consumption due to pollution are similar from a conceptual point of view. They both reduce the well-being obtained by society by using the resources at its disposal.
In other words, the external cost occurs when a consumption or production activity induces a direct loss of utility or an increase in the cost of production in the sphere of another activity, and these negative effects are not included in the calculations of the producer [22].

1.1. The Efficiency of the Economic Instruments Used in the Environmental Protection Policy

The following are some of the arguments that can be made to prove that an environmental policy based on the use of economic instruments is more effective than an environmental policy that focuses on command and control tools.

1.1.1. Economic Instruments Facilitate the Internalization of Negative Externalities Generated by Polluting Activities

Negative externalities are in the nature of a cost that is not included in the price of the goods produced. Therefore, the main reason for using economic instruments in an environmental protection policy is the inclusion of pollution costs (external costs) in the price of goods generated by a certain economic activity. The internalization of external costs by using economic instruments will place the production of polluting goods at an optimal level from a social point of view.

1.1.2. Economic Instruments Induce Changes in Both the Behavior of Producers and the Behavior of Consumers

For example, if a polluting product is taxed, the producer of that product will try to reduce the pollution. The charged fee will raise the product price, and consumers will buy less of that product. It is true, however, that the change in behavior will be evident if the demand for said goods is elastic, i.e., when the polluting product has many less-polluting potential substitutes.

1.1.3. Economic Instruments Are Often More Cost-Effective Than Other Instruments

According to the regulatory instruments (standards, authorizations, etc.) used for pollution control, all pollutants must reduce pollution according to the same imposed standards, regardless of the costs of achieving this goal. An economic instrument will help each polluter decide whether it is more convenient to pay that fee or to bear the costs of reducing pollution. Those facing low pollution-reduction costs will reduce their emissions more than those who have to bear higher costs. Moreover, given that economic instruments are imposed in terms of unit (kg, t, m3) of the remaining emissions, there will always be an incentive to reduce pollution.

1.1.4. Economic Instruments Encourage Investments in Green Technology

Economic instruments help the economy move towards an eco-efficient use of limited resources. In the world we live in, there is huge potential for increasing resource productivity via technological solutions that can contribute to sustainable economic growth.

1.1.5. Economic Instruments Generate Income for Environmental Investments

In contrast to command and control instruments, environmental fees generate revenue that is later used for various purposes. In the case of user fees (e.g., wastewater treatment, entrance fees to national parks, etc.), the collected revenues are used by the authorities to provide quality services, without negative effects on the natural environment and allowing full recovery of costs. Revenues from environmental fees can be collected in special environmental funds or in general budgets.
However, there is a paradox that needs to be mentioned: the greater the effectiveness of an environmental tax, the lower the income generated by it. The explanation is as follows: the higher an eco-tax, the more stimulated is the polluter to invest in reducing pollution and therefore the taxing basis is lower. As a result, eco-tax collectors may sometimes be interested in keeping pollution high.

1.1.6. Economic Instruments Support the “Polluter Pays” and “User Pays” Principles

The “polluter pays” principle guarantees that all financial responsibility for reducing pollution lies with the polluter [23,24,25]. The “user pays” principle states that resources have economic value, and the costs of their usage have to be borne by the user.

2. Materials and Methods
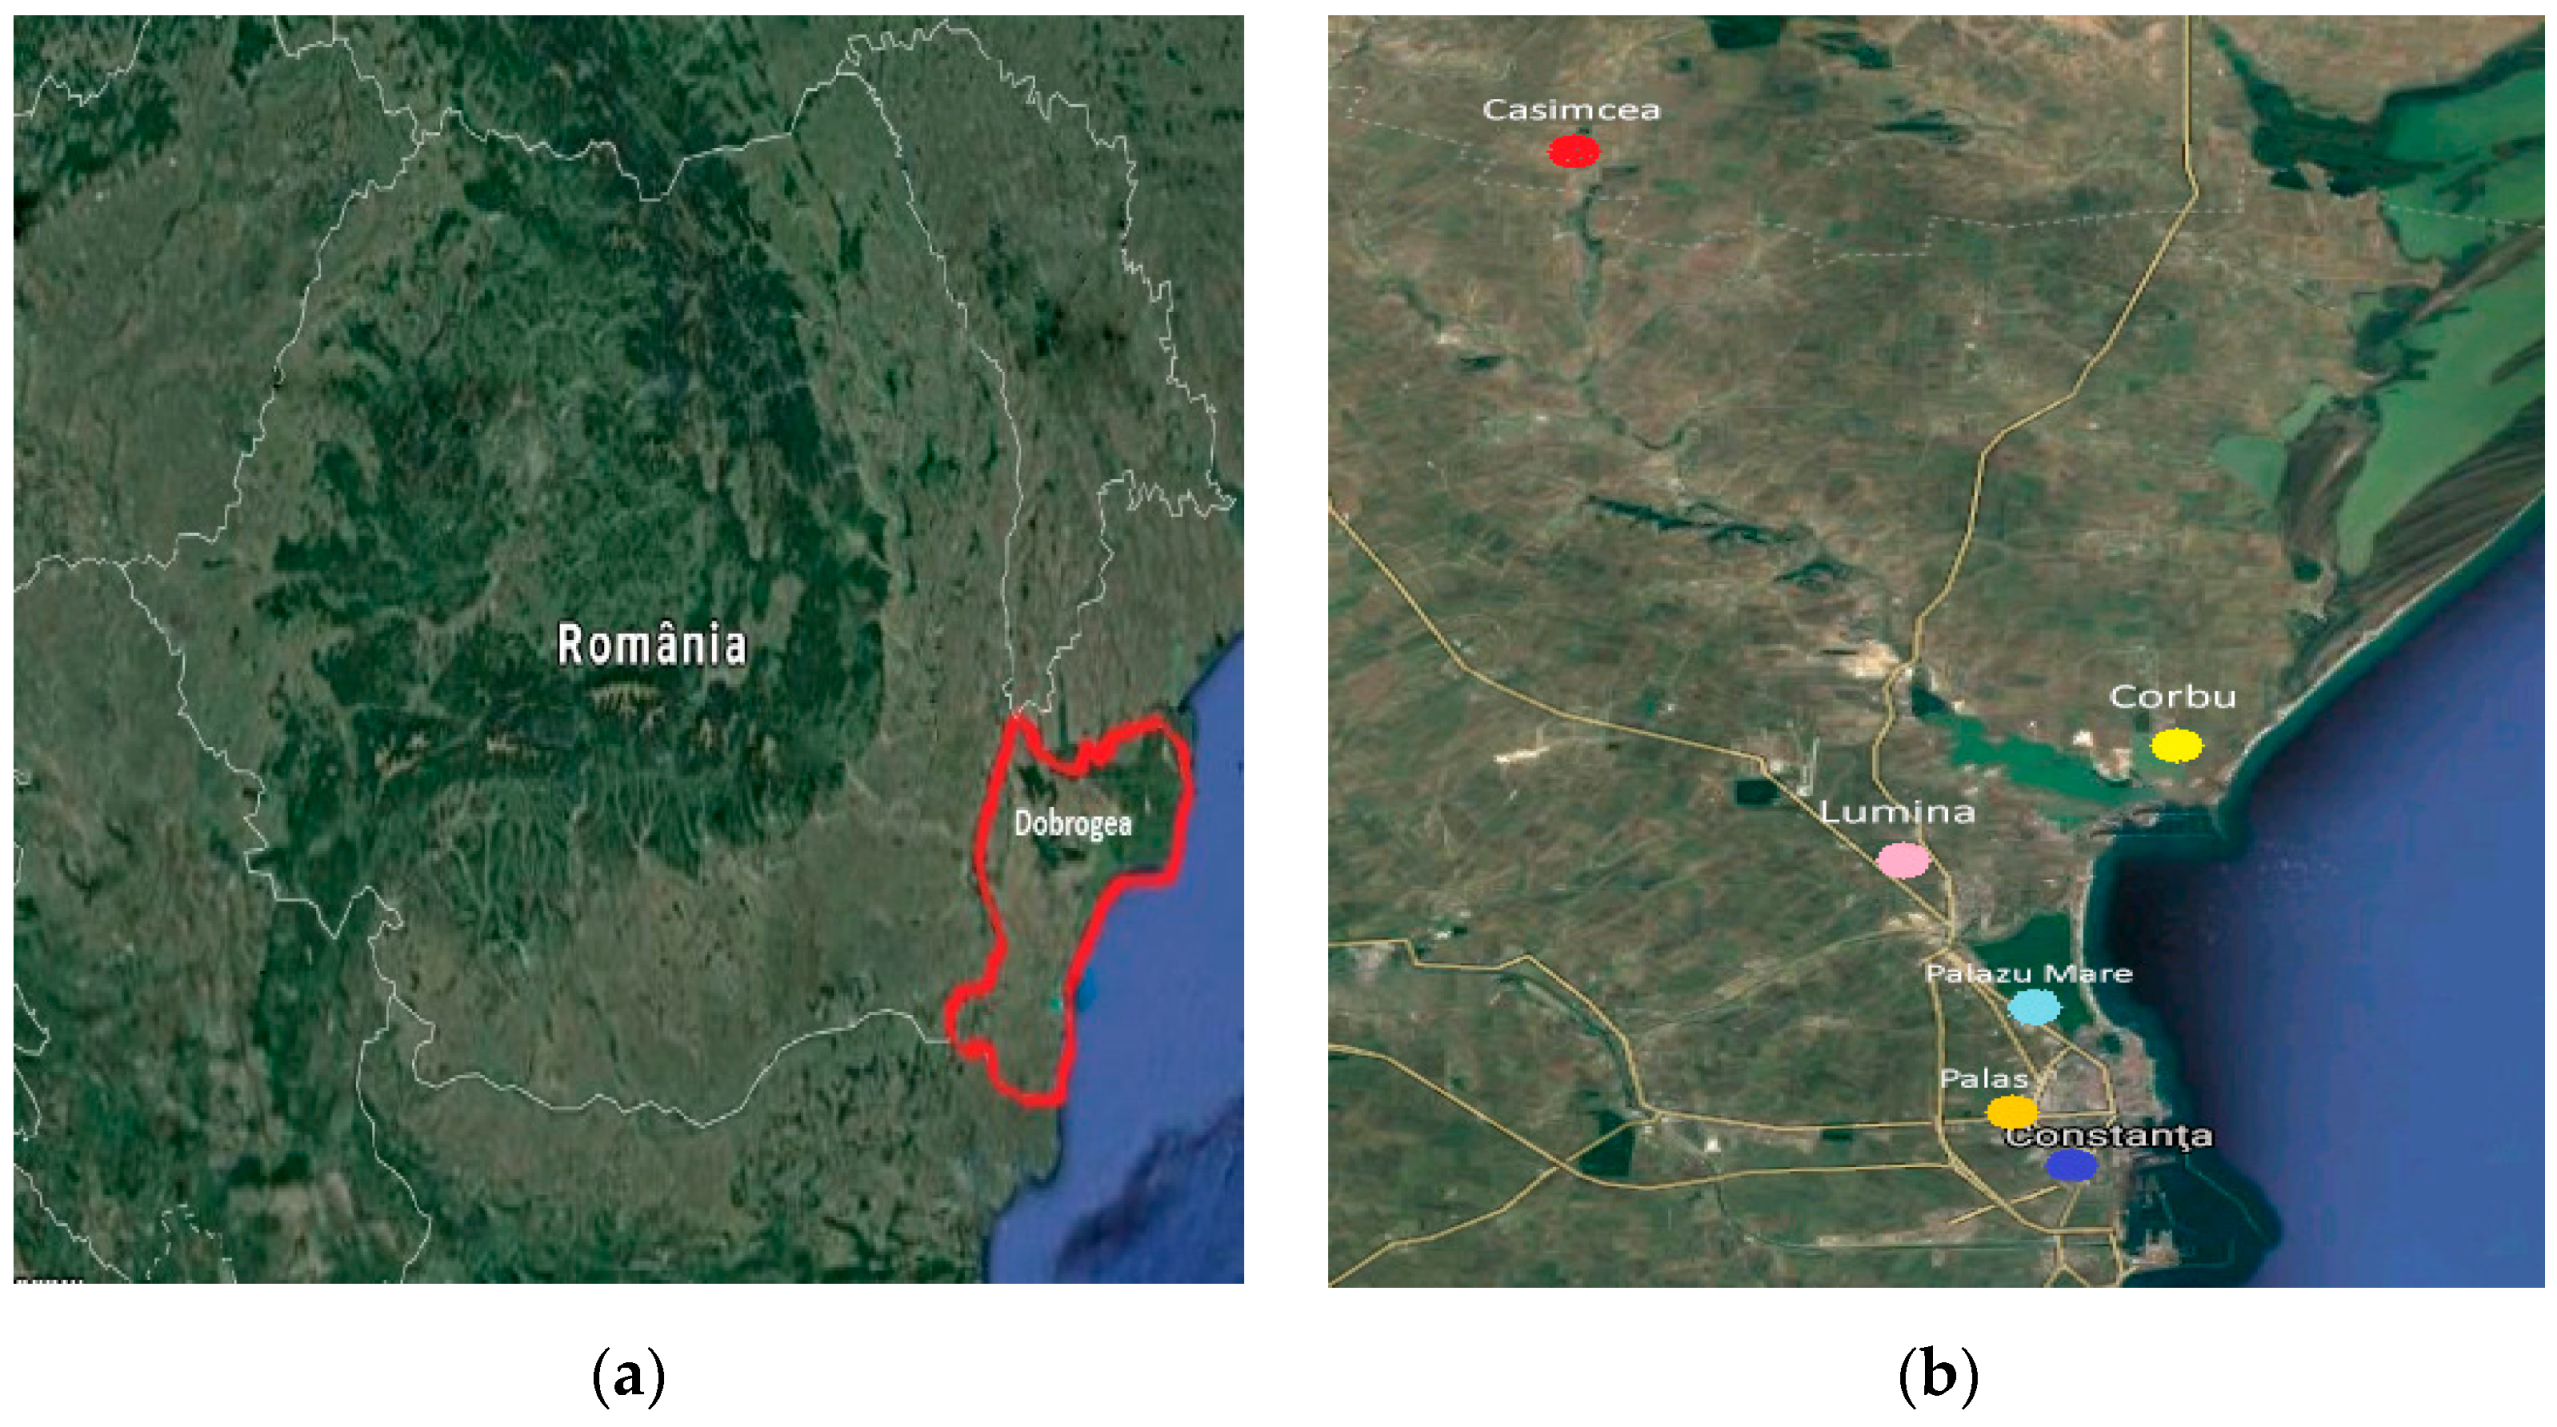
A Case Study: Quality Control of Groundwater in the Region of Dobrudja, Romania.
In this paper, a case study shows how anthropogenic factors such as wastewater, industrial, agricultural, and natural factors, such as soil-water interaction, are able to change the physical and chemical parameters of groundwater in the study area, thus endangering their quality. In the process of evaluating the groundwater quality, the physical and chemical properties represent the most important factors. In this context, the physico-chemical parameters of groundwater such as pH, electrical conductivity, turbidity, alkalinity, hardness, nitrates, nitrites, ammonium, chlorides have been investigated in the groundwater of the region of Dobrudja to generate an assessment of groundwater quality and its use for drinking purposes. The content of heavy metals such as chromium, cadmium, copper, iron, manganese, nickel, lead, and zinc in these samples has been analyzed. In addition, the health risk index was taken into account and analyzed, in order to set a better correctness of the metal content from the underground waters located on Dobrudja’s territory.

2.1. The Study Area

The study area was the region of Dobrudja, where the underground catchments have been developed at a fast pace, replacing the surface ones, which are even more expensive and more inadequate in terms of water quality. In the past, Dobrudja was known as a region almost devoid of underground supply possibilities, but more advanced studies carried out on the territory of this area have shown that large areas, such as the basins of the Sava, Telita, and Taita rivers have important resources capable of ensuring a substantial flow of drinking water [26].
The groundwater on the territory of Dobrudja, which is part of the Upper Cretaceous–Jurassic aquifer complex, is bicarbonate-calcium and magnesium, having a mineralization below 500 mg/l, and being drinkable, while the waters from Sarmatian limestones located in the Mangalia area are bicarbonate-calcium and chlorinated sodium with a higher mineralization up to 1000 mg/l, which are also drinkable but with an intense smell of hydrogen sulfide [2].

2.2. Sampling

Six different locations in the region of Dobrudja were established for groundwater sampling from wells (Figure 1) situated in urban areas (Constanta, Palas, Palazu Mare) and in rural areas (Lumina, Corbu, and Casimcea). The collected samples were stored at 4 °C before analysis.

2.3. Groundwater Analysis

The potentiometric method was used for pH measurement using a pH meter from Hanna. The conductivity (C) is directly related to the concentration of ions dissolved in water, i.e., the higher the number of ions, the higher the conductivity. The conductivity was determined using a CONSORT K610 conductometer. Water alkalinity is the content of ions that give the water an alkaline character. It is determined against two indicators: “p” alkalinity—compared to phenolphthalein—and “m” alkalinity—compared to methyl orange. The “p” alkalinity is called permanent alkalinity and the “m” alkalinity is called total alkalinity. The alkalinity was determined by titrating a known volume of the sample with an HCl solution 0.1 N in the presence of phenolphthalein up to the discoloration of the solution, followed by titration in the presence of methyl orange to yellow. In the first stage, the anions representing the “p” alkalinity are neutralized, after which the other anions representing the alkalinity of the water are neutralized. The full volume of the HCl solution consumed on titration contains an amount of acid equivalent to the total alkalinity (TA). Nitrites are present in the water due to infiltration into the groundwater in agricultural areas where fertilizers are used intensively, but can also result from improperly stored animal manure. The reaction of the nitrites presents in the sample, with the reagent 4-amino-benzene-sulfonamide in the presence of orthophosphoric acid leading to the formation of a red complex. Nitrates in groundwater come from the washing by rainwater of naturally occurring nitrates in the surface soil, or may have as a source the fertilizers used for soil fertilization. Nitrogen compounds released into the air from combustion processes by automobiles and industry can increase the nitrate content of rainwater and deposited dust, representing another source of nitrate in water. Sulfuric acid and phosphoric acid used in the reaction of nitrates with 2.6-dimethylphenol lead to the formation of 4-nitro-2.6-dimethylphenol. The spectrometric measurement of the absorbance at the wavelength of 324 nm was followed by the reading of the nitrate concentration in the sample using the calibration curve. Determination of total hardness consists of complexing the metal cations that form the hardness, with the disodium salt of ethylene-diamino-tetraacetic acid (EDTA), at pH = 10, in the presence of the indicator eriochrome T. The turbidity of water was determined by measuring the intensity of a diffused light flux when passing through the water sample (variant I) or by measuring the attenuation of the intensity of an incident light flux when passing it through the water sample (variant II). In both cases, the obtained value reads the turbidity on a calibration curve drawn on the basis of the formazine suspension standard, which has the absorbances inscribed on the ordinate, and on the abscissa the corresponding formazine turbidity units. Turbidity is expressed in units of formazine turbidity (UTF) and was read directly on the calibration curve. Determination coefficients (R2) obtained from linear regression analysis were 0.9999. The equation of the calibration curve is y = 0.0027x + 0.0002. Determination of ammonium consists of ammonium’s reaction with salicylate and hypochlorite ions in the presence of sodium nitrosopentacyanoferrate (III) (sodium nitroprusside). A blue compound is formed, which will be measured spectrometrically at a wavelength of approximately 650 nm. The reaction of chloramine with sodium salicylate takes place at pH 12.6 in the presence of sodium nitroprusside. The chloramines present in the sample are determined quantitatively, and the role of sodium citrate is to mask the interference given by cations, such as calcium and magnesium. The principle of the method for chlorides determination was chlorides precipitation with silver nitrate solution in the presence of potassium chromate as an indicator. The end point of the titration is highlighted by the appearance of the silver–chromate precipitate, colored brick-red. Metals (Cd, Pb, Cu, Cr, Zn, Mn, Ni, Fe) were determined by atomic absorption spectrometry (AAS). Atomic absorption spectrometer contrAA 700 Analytik Jena was equipped with a graphite furnace with a background correction system and cavity cathode lamp. Table 1 presents the calibration data and detection limits.
Water samples are filtered and preserved by acid treatment. A volume of 20 μL of sample solution was injected into the platform graphite furnace of the atomic absorption spectrometer. The oven is electrically heated. By gradually increasing the temperature the sample is dried, pyrolyzed, and atomized. The light source emits a specific light for each analyte. When the ray of light passes through the cloud of atoms in the heated graphite furnace, light is selectively absorbed by the atoms of the analyte. The decrease in light intensity is measured with a detector at a specific wavelength. The concentration of metals in the sample was determined by comparing the absorbance of the sample with the absorbance of the calibration solutions, according to Lambert Beer’s law. Chemical modifiers are used to remove its spectral non-spectral interference from a sample (matrix effects). For Cd, Cr, Cu, Fe, Mn, Zn the chemical modifier Pd/Mg (NO3)2 0.1: 0.05% was used, and for Ni and Pb, Pd (NO3)2 0.05%.

3. Results

In order to monitor the groundwater quality in the Dobrudja area, an analysis of physico-chemical parameters was performed (Table 2).
The values of metal concentrations for the studied samples are presented in Table 3.

4. Discussion

pH value is an important parameter of water quality and the contamination level in the watershed area. This study has revealed that the pH value of well water is slightly alkaline and varied from 7.22 pH units (Constanta) to 7.91 pH units (Casimcea). The well water samples are within the permissible limit prescribed by Romanian legislation [27] (Table 4).
Regarding the conductivity of this groundwater, the highest value was observed in Casimcea (3070 μs/cm), while Lumina had the lowest value (969 μs/cm). The higher EC values of the well could be attributed to its shallow depth, as ongoing surface activities can affect the conductivity values [28]. Only the sample from Casimcea (3070 μs/cm) exceeded the maximum allowed value of 2500 μs/cm (Table 4) [22].
The permanent alkalinity had the same value for all six groundwater samples in the Dobrudja region (0.000 mmol/L), while the values for total alkalinity fluctuated—the highest value being recorded for the water from Palazu Mare (13.0 mmol/L) and the lowest for the water in the rural district of Casimcea (8.0 mmol/L).
The concentration of nitrate contained in water seems to be from the high agricultural waste and sewage contamination. Such an increase may be due to rapid decomposition of organic matter. When the dead organic matter decomposes in water, it forms complex proteins, which are converted into nitrogenous organic matter and finally to nitrate by bacterial activity. The highest level of nitrates was found in the waters of Casimcea (532 mg/L), and the lowest in Lumina (0.132 mg/L). For nitrites, the highest level was highlighted in the groundwater in Casimcea (0.245 mg/L), and the lowest level in Lumina (0.002 mg/L).
The highest value of hardness (95.9) was found in the waters of Casimcea, while the lowest value was identified in the waters of Lumina (21.2). The studied waters thus fall into the category of hard waters (those from Lumina and Corbu) and very hard waters, with hardness values over 30 degrees German hardness.
Higher turbidity affects life indirectly by cutting the light utilized by phytoplankton growth. It should be noted that the water in Lumina had the highest value of turbidity (0.75 UTF). The lowest value could be observed for the waters in Constanta (0.013 UTF). At all sites turbidity is low (Table 2), because there is no exploitation activity in the area.
Ammonium is an indicator parameter of recent organic pollution. Its sudden increase indicates the intervention of a pollutant of either natural or artificial origin. The ammonium parameter registers the highest value in Corbu (0.075 mg/L), and the lowest value is found simultaneously in two areas: Palazu Mare and Palas (0.001 mg/L).
Chloride is one of the most important parameters in assessing the water quality. The higher concentration of chloride indicates higher degree of organic pollution. The highest value for chloride concentrations was determined in Casimcea (312.7 mg/L) and the lowest value in Lumina (89.0 mg/L).
Following the results obtained, it can be seen that the values of the parameters ammonium, nitrites, pH, and turbidity for all groundwater samples in the region of Dobrudja are in accordance with legal provisions (Table 4). Physico-chemical parameters such as chlorides, conductivity, hardness, and nitrates exceed the maximum permitted levels. The nitrate values from the studied water samples exceed the maximum allowed limit of 50 mg/L, except for the sample of Lumina, which has a value according to the legal provisions of 0.132 mg/L. The hardness parameter presents values above the maximum limits allowed by the Romanian legislation in all groundwater samples in the region of Dobrudja.
Physico-chemical parameters that exceed the permitted limits can cause serious problems for the population and the environment. Values of pH, conductivity, chlorides, nitrates within the maximum permissible limits were obtained in the Chandigarh region [29], while the value for hardness exceeded the maximum permissible limit. Groundwater in the northern China’s Yuncheng Basin has reached nitrate levels at different depths [30] and it can be concluded that groundwater in the depths of the earth is less polluted by anthropogenic factors than those at the surface. In the region of Dobrudja, the nitrate level exceeded the maximum limits allowed by the Romanian legislation.
Following the analyses, it was observed that in the samples studied, cadmium and iron were below the detection limit, copper was present only in the water from Lumina, and nickel only in the water sample from Palazu Mare (Table 3). The region of Dobrudja is known as the largest karst area in Romania. The transportation of metals in groundwater can be influenced by hydrogeological and geochemistry properties of the karst area. The precipitation of hydroxide or carbonate phase will inhibit the concentration of metal ions in karstic water to low values [31]. Another reason why metals concentrations are mostly below detection limit is pollutants transport. A karst aquifer has an anisotropic permeability structure that may adsorb substances easily onto the aquifer. Moreover, the increasing pollutant concentrations in a karst aquifer is caused by the larger groundwater velocity of karst areas than other lands [32].
The highest value for chromium was obtained for the sample from Palazu Mare (15.32 μg/L) and the lowest for Corbu (6.452 μg/L). For manganese, the highest value was found in the water samples from Lumina (3.662 μg/L), and the lowest value in the sample from Corbu (0.259 μg/L). The highest value observed for lead in groundwater was in Palazu Mare (1.016 μg/L), while in Palas and in Corbu this metal was below the detection limit. Zinc, the metal found in the largest quantities in all groundwater samples in the Dobrudja region, recorded oscillating values, so the highest value was recorded in Lumina (37.93 μg/L), and the lowest in Corbu (5.036 μg/L).
The concentrations of the studied metals were within the maximum allowed limits established by the Romanian legislation regarding the maximum allowed limits of heavy metals in drinking water [27].
Correlations among metals were determined using the Pearson correlation analysis to provide information on their sources. Table 5 shows the Pearson correlation coefficients for target metals for the six locations in the region of Dobrudja. There are high values for these coefficients for the following pairs of metals: Pb–Cr, Pb–Ni, Cu–Zn, Cu–Mn, Zn–Mn, some of them greater than 0.9 (Pb-Cr, Pb-Ni). These strongly positive correlations between pairs of metals indicate identical behavior of metals in the water column and could suggest the possibility of their common origin. Pb was significantly correlated with Cr (p < 0.01) and Ni (p < 0.05), and these correlations may reflect similar sources of pollution or similar cumulative characteristics among the corresponding samples. Between Pb–Zn, Pb–Mn, Cr–Mn, Zn–Ni, and Mn–Ni were observed low positive Pearson correlations. However, no statistical correlation was found between these pairs, likely indicating the different origins of these elements. There was an inverse relationship between Pb–Cu, Cu–Cr, and Cu–Ni, which was likely due to their origins from different sources, or antagonism.
Positive Pearson coefficients between metals suggest a pollution source (industrial, urban, or agriculture pollution). In addition, to verify if there is variability between groundwater samples from different areas (rural and urban), an analysis of variance (ANOVA) was carried out. According to this test, statistically significant differences were not found between samples from urban and rural areas (p > 0.05).
In addition, a Pearson correlation analysis was used to identify the relationship between metals concentrations and water physico-chemical parameters (pH, conductivity, total alkalinity, nitrates, nitrites, hardness, turbidity, ammonium, and chloride)—Table 6.
Pb showed strong positive significant correlation with total alkalinity, and Cu and Zn with turbidity.
In the studied groundwater samples, metals showed small positive correlations with most of the physico-chemical parameters (Pb with C, NO 3 , dT; Cu with pH, TA; Cr with C, TA, NO 3 , dT; Zn with pH. TA, NO 3 ; Mn with TA, TU and Ni with C, TA, NO 3 , dT). For the other studied metals with physico-chemical parameters, a low negative correlation was observed.
Chloride as the representative ion of salinity had negative correlations with all studied metals, except Ni (r = 0.01), indicating that terrestrial inputs strongly contributed to the distribution of these metals in groundwater samples.
Thus, in the central area of Bangladesh, located in the south of the Asian continent, values were recorded for Fe from 52 to 19.600 μg/L, for Mn from 0.04 to 4.23 μg/L, for Ni from 1.1 to 18.8 μg/L, for Pb from 0.02 to 28.6 μg/L, and for Zn from 2 to 58 μg/L [33]. Comparing these results of heavy metals in the groundwater of central Bangladesh with those of groundwater in the Dobrudja area, it can be seen that Fe, Mn, and Pb exceed the maximum permissible limits. It can also be seen that in the groundwater of the southern part of the Asian continent there are large quantities of heavy metals compared to those found in the groundwater of the southeastern part of the European continent, more precisely in the Dobrudja area of Romania.
Also in Bangladesh, but this time in the western area, data on the existence of trace metals were monitored, which showed that of the six metals analyzed, namely Cu, Cd, Fe, Mn, Ni and Zn, only Cu and Zn were within the maximum allowed limits, the rest of the metals being found in much larger quantities [34]. This once again demonstrates the increased degree of pollution in the groundwater of Bangladesh, perfectly in contrast to that of groundwater in the Dobrudja area.
Another area where trace metals were monitored was in the Bazman Basin, located in southeastern Iran [35]. From metals analyzed in this area, it was shown that only Cr, Cu, Fe, Mn, Ni, and Zn were within the maximum allowed limits.
Determination of the health risk index.
The health risk index (HRI) was estimated as the ratio of daily metal intake (MRI) to mean reference metal (RfD) values, according to the report [36]:
HIR = DIM RfD = C water · I BM · RfD
where:
  • Cwater—metal content in water samples;
  • I—daily water intake;
  • BM—average body mass of an adult;
  • RfD—the value for the average reference dose of metals.
From specialized data [36], it is known that I = 2 L and BM = 70 kg.
The results obtained after determining the health risk index of metals (Cd, Pb, Cu, Cr, Zn, Mn, Ni) are represented in Table 7.
The order of the toxicity of heavy metals according to the average HRI values, calculated for each groundwater sample, was as follows:
  • for the groundwater sample from Constanta Zn> Pb> Cr> Mn> Cd, Cu, Ni;
  • for the groundwater sample from Palazu Mare Pb> Ni> Zn> Mn> Cr> Cd, Cu;
  • for the groundwater sample from Palas Zn> Mn> Cr> Cd, Pb, Cu, Ni;
  • for the groundwater sample from Lumina Zn> Pb> Mn> Cr> Cu> Cd, Ni;
  • for the groundwater sample from Corbu Zn> Cr> Mn> Cd, Pb, Cu, Ni;
  • for the groundwater sample from Casimcea Zn> Pb> Cr> Mn> Cd, Cu, Ni.
Taking into account the fact that the value of the health risk index should be much less than 1 (HRI << 1), it can be concluded that it exceeds this value in the case of water from Palazu Mare for lead, zinc, and nickel. This exceedance is also observed in the case of the waters from Lumina and Casimcea for zinc, thus demonstrating that their use presents a danger for human health.

5. Conclusions

At present, groundwater occupies a special place in nature, primarily as a source of drinking water for the population, and for industry and agriculture. It has better drinking qualities than surface water, which is why its exploitation and capture process has become increasingly important.
Recent studies on groundwater quality control have shown that, in many parts of the world, water has different degrees of quality depending on the natural and anthropogenic factors acting upon them.
  • This study has revealed that the pH values of well water are slightly alkaline and varied from 7.22 pH units to 7.91 pH units and are within the permissible limit prescribed by the Romanian legislation.
  • Regarding the conductivity of the studied groundwater, the highest value was observed in Casimcea (3070 μs/cm); the higher EC value of the well could be attributed to its shallow depth, as ongoing surface activities can affect the conductivity values.
  • The concentration of nitrate contained in water seems to be the high agricultural waste and sewage contamination. The highest level of nitrates was found in the waters of Casimcea (532 mg/L), while for nitrites, the highest level was highlighted also in the groundwater in Casimcea (0.245 mg/L). In the region of Dobrudja, the nitrate level exceeded the maximum limits allowed by the Romanian legislation.
  • The studied waters fall into the category of hard waters (those from Lumina and Corbu) and very hard waters, with hardness values over 30 degrees German hardness.
  • Higher turbidity affects the life indirectly by cutting the light to be utilized by the phytoplankton growth. At all sites, turbidity is low, because there is no exploitation activity in the area.
  • Ammonium is an indicator parameter of recent organic pollution. Its sudden increase indicates the intervention of a pollution that can be both natural and artificial origin. The ammonium parameter registers the highest value in Corbu (0.075 mg/L).
  • Chloride is one of the most important parameters in assessing the water quality. The higher concentration of chloride indicates higher degree of organic pollution. The highest value for chloride concentrations was determined in Casimcea (312.7 mg/L) and the lowest value in Lumina (89.0 mg/L).
  • The concentrations of the studied metals were within the maximum allowed limits established by the Romanian legislation regarding the maximum allowed limits of heavy metals in drinking water.
  • In the case of the water from Palazu Mare the health risk index exceeds the maximum value for lead, zinc, and nickel. This exceedance is also observed in the case of the waters from Lumina and Casimcea for zinc, thus demonstrating that their use presents a danger to human health.
In conclusion, more attention should be paid to the prevention of groundwater pollution and the immediate remediation of accidents. This would lead to lower, cost-effective costs as well as environmental protection.

Author Contributions

Conceptualization, A.S. (Alina Soceanu), N.M., C.I.D., and S.D.; methodology, A.S. (Alina Soceanu), G.V.; software, V.P. and A.S. (Anca Sirbu); validation, S.D.; formal analysis, G.V.; investigation, G.V.; resources, A.S. (Alina Soceanu), S.D., N.M. and C.I.D.; data curation, V.P.; writing—original draft preparation, A.S. (Anca Sirbu); writing—review and editing, A.S. (Alina Soceanu); visualization, V.P.; supervision, S.D., A.S. (Anca Sirbu); project administration, N.M. and C.I.D. All authors have read and agreed to the published version of the manuscript.

Funding

This research received no external funding.

Institutional Review Board Statement

Not applicable.

Informed Consent Statement

Not applicable.

Data Availability Statement

Not applicable.

Conflicts of Interest

The authors declare no conflict of interest.

References

  1. Zhang, H.; Cheng, S.; Li, H.; Fu, K.; Xu, Y. Groundwater pollution source identification and apportionment using PMF and PCA-APCA-MLR receptor models in a typical mixed land-use area in Southwestern China. Sci. Total Environ. 2020, 741, 140383. [Google Scholar] [CrossRef] [PubMed]
  2. Bretotean, M. Groundwaters, An Important Natural Wealth; Ceres: Bucharest, Romania, 1981. (In Romanian) [Google Scholar]
  3. Shakerkhatibi, M.; Mosaferi, M.; Pourakbar, M.; Ahmadnejad, M.; Safavi, N.; Banitorab, F. Comprehensive investigation of groundwater quality in the north-west of Iran: Physicochemical and heavy metal analysis. Groundw. Sustain. Dev. 2019, 8, 156–168. [Google Scholar] [CrossRef]
  4. Xiao, L.; Liu, J.; Ge, J. Dynamic game in agriculture and industry cross-sectoral water pollution governance in developing countries. Agric. Water Manag. 2021, 243, 106417. [Google Scholar] [CrossRef]
  5. Zacchaeus, O.O.; Balogun Adeyemi, M.; Azeem Adedeji, A.; Adegoke, K.A.; Okehi Anumah, A.; Taiwo, A.M.; Ganiyu, S.A. Effects of industrialization on groundwater quality in Shagamu and Ota industrial areas of Ogun state, Nigeria. Heliyon 2020, 6, 04353. [Google Scholar] [CrossRef]
  6. Sambito, M.; Severino, A.; Freni, G.; Neduzha, L. A Systematic Review of the Hydrological, Environmental and Durability Performance of Permeable Pavement Systems. Sustainability 2021, 13, 4509. [Google Scholar] [CrossRef]
  7. Raval, N.P.; Kumar, M. Geogenic arsenic removal through core–shell based functionalized nanoparticles: Groundwater in-situ treatment perspective in the post–COVID anthropocene. J. Hazard. Mater. 2021, 402, 123466. [Google Scholar] [CrossRef] [PubMed]
  8. Kumar, M. Runoff from firework manufacturing as major perchlorate source in the surface waters around Diwali in Ahmedabad, India. J. Environ. Manag. 2020, 273, 111091. [Google Scholar] [CrossRef] [PubMed]
  9. Masoud, A.A. Groundwater quality assessment of the shallow aquifers west of the Nile Delta (Egypt) using multivariate statistical and geostatistical techniques. J. Afr. Earth Sci. 2014, 95, 123–137. [Google Scholar] [CrossRef]
  10. Atwia, M.G.; Abu-Heleika, M.M.; El-Horiny, M.M. Hydrogeochemical and vertical electrical soundings for groundwater investigations, Burg El-Arab area, Northwestern Coast of Egypt. J. Afr. Earth Sci. 2013, 80, 8–20. [Google Scholar] [CrossRef]
  11. Fathy Abdalla, Ramadan Khalil, Potential effects of groundwater and surface water contamination in an urban area, Qus City, Upper Egypt. J. Afr. Earth Sci. 2018, 141, 164–178. [CrossRef]
  12. He, B.; He, J.; Wang, l.; Zhang, X.; Bi, E. Effect of hydrogeological conditions and surface loads on shallow groundwater nitrate pollution in the Shaying River Basin: Based on least squares surface fitting model. Water Res. 2019, 162, 114880. [Google Scholar] [CrossRef] [PubMed]
  13. Zhang, F.; Huanga, G.; Houa, Q.; Liua, C.; Zhanga, Y.; Zhang, Q. Groundwater quality in the Pearl River Delta after the rapid expansion of industrialization and urbanization: Distributions, main impact indicators, and driving forces. J. Hydrol. 2019, 577, 124004. [Google Scholar] [CrossRef]
  14. Jia, X.; O’Connor, D.; Hou, D.; Jin, Y.; Li, G.; Zheng, C.; Ok, Y.S.; Daniel, C.W.; Tsang, D.C.W.; Luo, J. Groundwater depletion and contamination: Spatial distribution of groundwater resources sustainability in China. Sci. Total Environ. 2019, 672, 551–562. [Google Scholar] [CrossRef] [PubMed]
  15. Koh, E.-H.; Lee, E.; Lee, K.-K. Application of geographically weighted regression models to predict spatial characteristics of nitrate contamination: Implications for an effective groundwater management strategy. J. Environ. Manag. 2020, 268, 110646. [Google Scholar] [CrossRef]
  16. Hansen, B.; Thorling, L.; Kim, H.; Blicher-Mathiesen, G. Long-term nitrate response in shallow groundwater to agricultural N regulations in Denmark. J. Environ. Manag. 2019, 240, 66–74. [Google Scholar] [CrossRef]
  17. Taufiq, A.; Effendi, A.J.; Iskandar, I.; Hosono, T.; Hutasoit, L.M. Controlling factors and driving mechanisms of nitrate contamination in groundwater system of Bandung Basin, Indonesia, deduced by combined use of stable isotope ratios, CFC age dating, and socioeconomic parameters. Water Res. 2019, 148, 292–305. [Google Scholar] [CrossRef]
  18. Huan, H.; Hu, L.; Yang, Y.; Jia, Y.; Lian, X.; Ma, X.; Jiang, Y.; Xi, B. Groundwater nitrate pollution risk assessment of the groundwater source field based on the integrated numerical simulations in the unsaturated zone and saturated aquifer. Environ. Int. 2020, 137, 105532. [Google Scholar] [CrossRef]
  19. Serio, F.; Miglietta, P.P.; Lamastra, L.; Ficocelli, S.; Intini, F.; Leo, F.D.; Donno, A.D. Groundwater nitrate contamination and agricultural land use: A grey water footprint perspective in Southern Apulia Region (Italy). Sci. Total Environ. 2018, 645, 1425–1431. [Google Scholar] [CrossRef]
  20. Singh, C.K.; Kumar, A.; Shashtri, S.; Kumar, A.; Kumar, P.; Mallick, J. Multivariate statistical analysis and geochemical modeling for geochemical assessment of groundwater of Delhi, India. J. Geochem. Explor. 2017, 175, 59–71. [Google Scholar] [CrossRef]
  21. Dumitrescu, I.C. Sustainable Development and the Natural Environment; Bren: Bucharest, Romania, 2005. (In Romanian) [Google Scholar]
  22. Molinos-Senante, M.; Maziotis, A.; Sala-Garrido, R. Changes in the total costs of the English and Welsh water and sewerage industry: The decomposed effect of price and quantity inputs on efficiency. Util. Policy 2020, 66, 101063. [Google Scholar] [CrossRef]
  23. Ruiz-Rosa, I.; García-Rodríguez, F.J.; Antonova, N. Developing a methodology to recover the cost of wastewater reuse: A proposal based on the polluter pays principle. Util. Policy 2020, 65, 101067. [Google Scholar] [CrossRef]
  24. Luppi, B.; Parisi, F.; Rajagopalan, S. The rise and fall of the polluter-pays principle in developing countries. Int. Rev. Law Econ. 2012, 32, 135–144. [Google Scholar] [CrossRef] [Green Version]
  25. Tilton, J.E. Global climate policy and the polluter pays principle: A different perspective. Resour. Policy 2016, 50, 117–118. [Google Scholar] [CrossRef]
  26. Pișota, I.; Buta, I. Hidrology; EDP: Bucharest, Romania, 1984. (In Romanian) [Google Scholar]
  27. Law no. 458/2002 on Drinking Water Quality; published in the Legal Gazette of Romania, Part I, issue no. 552 of 29 July 2002; Romanian Parliament: Bucharest, Romania, 2002.
  28. Abeer, N.; Akbar Khan, S.; Muhammad, S.; Rasool, A.; Ahmad, I. Health risk assessment and provenance of arsenic and heavy metal in drinking water in Islamabad, Pakistan. Environ. Technol. Innov. 2020, 20, 101171. [Google Scholar] [CrossRef]
  29. Ravindra, K.; Singh Thind, P.; Mor, S.; Singh, T.; Mor, S. Evaluation of groundwater contamination in Chandigarh: Source identification and health risk assessment. Environ. Pollut. 2019, 255, 113062. [Google Scholar] [CrossRef]
  30. Currell, M.J.; Cartwright, I.; Bradley, D.C.; Han, D. Recharge history and controls on groundwater quality in the Yuncheng Basin, north China. J. Hydrol. 2010, 385, 216–229. [Google Scholar] [CrossRef]
  31. Astuti, R.D.P.; Mallongi, A.; Amiruddin, R.; Hatta, M.; Rauf, A.U. Risk identification of heavy metals in well water surrounds watershedarea of Pangkajene, Indonesia. Gac Sanit. 2021, 35, S33–S37. [Google Scholar] [CrossRef]
  32. Pu, J.; Cao, M.; Zhang, Y.; Yuan, D.; Zhao, H. Hydrochemical indications of human impact on karst groundwater in a subtropical karst area, Chongqing, China. Environ Earth Sci. 2014, 72, 1683–1695. [Google Scholar] [CrossRef]
  33. Bodrud-Doza, M.; Islam, S.M.; Hasan, M.T.; Alam, F.; Haque, M.M.; Rakib, M.A.; Asad, M.A.; Rahman, M.A. Groundwater pollution by trace metals and human health risk assessment in central west part of Bangladesh. Groundw. Sustain. Dev. 2019, 9, 100219. [Google Scholar] [CrossRef]
  34. Bodrud-Doza, M.; Towfiqul Islam, A.R.M.; Ahmed, F.; Das, S.; Saha, N.; Rahman, M.S. Characterization of groundwater quality using water evaluationindices, multivariate statistics and geostatistics in central Bangladesh. Water Sci. 2016, 30, 19–40. [Google Scholar] [CrossRef] [Green Version]
  35. Rezaei, A.; Hassani, H.; Hassani, S.; Jabbari, N.; Belgheys, S.; Mousavi, F.; Rezaei, S. Evaluation of groundwater quality and heavy metal pollution indices in Bazman basin, southeastern Iran. Groundw. Sustain. Dev. 2019, 9, 100245. [Google Scholar] [CrossRef]
  36. Masime, J.O. Analysis of the Levels of Arsenic, Nitrate, Nitrite and Phosphate in Home Made Brews, Spirits, Tap Water and in Raw Materials in Nairobi County; MST, Department of Chemistry, Technical University of Kenya: Nairobi, Kenya, 2016. [Google Scholar]
Figure 1. (a) Dobrudja region from Romania; (b) map of groundwater sampling locations in the region of Dobrudja (Constanta, Palas, Palazu Mare, Lumina, Casimcea, Corbu).
Applsci 11 04775 g001
Table 1. Calibration data and quantification limits.
MetalsThe Range
µg/L
R2LOQ
Cd0.4–40.99130.00041
Cr2–200.99020.00206
Cu3–300.99020.00310
Fe3–300.99300.1183
Mn1.5–150.99780.00151
Ni7–700.99400.00708
Pb10–1000.99460.01002
Zn0.5–50.99240.1076
Table 2. Values of quality parameters for the studied samples.
ParametersConstantaPalazu MarePalasLuminaCorbuCasimcea
pH7.227.237.57.547.447.91
C (σ) μ s / cm 18622320137096918263070
TA mmol / L 11.1138.6511.19.48
N O 3   mg / L 1754731180.13270.1532
N O 2   mg / L 0.0130.020.0150.0020.0430.245
dT German 41.5144.130.321.222.395.9
TU UTF0.0130.110.20.750.020.15
N H 4 + mg / L 0.0030.0010.0010.0030.0750.047
C l mg / L 112.4150.790.889147.1312.7
Table 3. Values of metal concentrations for the studied samples.
Metals
µg/L
ConstantaPalazu MarePalasLuminaCorbuCasimcea
Cd<LOQ <LOQ<LOQ<LOQ<LOQ<LOQ
Pb0.471.01<LOQ0.11<LOQ0.11
Cu<LOQ <LOQ<LOQ0.09<LOQ<LOQ
Cr12.6715.328.257.866.457.82
Zn9.5524.898.6237.935.0517.43
Mn0.672.851.483.660.250.53
Ni<LOQ 2.35<LOQ <LOQ <LOQ <LOQ
Fe<LOQ <LOQ<LOQ<LOQ<LOQ<LOQ
Table 4. Calibration data and quantification limits.
ParameterUnit of MeasureMaximum Permissible Limit
Ammonium mg / L 0.50
Chlorides mg / L 250
Conductivity μ s · cm 1 at 20 °C2500
HardnessGerman degrees5
Nitrites mg / L 50
Nitrates mg / L 0.50
pHpH units 6.5 ; 9.5
TurbidityUTF 1.0
Table 5. Pearson correlation coefficients of metals in groundwater samples.
CdPbCuCrZnMnNiFe
Cd1
PbNaN1
CuNaN−0.3511
CrNaN0.963 **−0.2641
ZnNaN0.2650.817 *0.1571
MnNaN0.3600.7360.2920.889 *1
NiNaN0.900 *−0.2000.7910.3020.4501
FeNaNNaNNaNNaNNaNNaNNaN1
NaN (not a number) means there is a result, but it cannot be represented in the computer. ** Correlation is significant at the 0.01 level. * Correlation is significant at the 0.05 level.
Table 6. Pearson’s correlation coefficient of metals with physico-chemical parameters in groundwater samples.
CdPbCuCrZnMnNiFe
pHNaN−0.610.13−0.680.11−0.20−0.47NaN
C NaN0.29−0.620.21−0.22−0.480.28NaN
TA NaN0.84 *0.230.790.480.630.73NaN
N O 3 NaN0.53−0.500.450.36−0.140.54NaN
N O 2 NaN−0.23−0.28−0.29−0.08−0.45−0.19NaN
dT NaN0.08−0.370.05−0.03−0.360.03NaN
TUNaN−0.240.96 **−0.290.83 *0.78−0.17NaN
N H 4 + NaN−0.46−0.28−0.59−0.44−0.65−0.32NaN
C l NaN−0.04−0.36−0.14−0.07−0.430.01NaN
pH units, C—conductivity, TA—total alkalinity, N O 3 nitrates, N O 2 nitrites, dT hardness, TU turbidity, N H 4 + ammonium, and C l chloride. NaN (not a number) means there is a result, but it cannot be represented in the computer. ** Correlation is significant at the 0.01 level. * Correlation is significant at the 0.05 level.
Table 7. Risk index values for the studied samples.
Metals RfD
[ mg · kg 1 · day 1 ]
ConstantaPalazu MarePalasLuminaCorbuCasimcea
Cd0.0010------
Pb0.00350.3298.293-0.937-0.900
Cu0.0400---0.066--
Cr1.50000.2410.2910.1570.1490.1220.148
Zn0.30000.9102.3700.8213.6120.4811.66
Mn0.14000.0950.5820.3020.7470.0520.108
Ni0.0200-3.355----
Publisher’s Note: MDPI stays neutral with regard to jurisdictional claims in published maps and institutional affiliations.

