Article

Sustainability Levels in Comparison with Mechanical Properties and Durability of Pumice High-Performance Concrete

1
Faculty of Civil Engineering, Brno University of Technology, Veveří 331/95, 602 00 Brno, Czech Republic
2
Faculty of Civil Engineering, VŠB—Technical University of Ostrava, L. Podéště 1875, 708 00 Ostrava-Poruba, Czech Republic
3
Department of Civil and Environmental Engineering, California State University Fullerton, Fullerton, CA 92831, USA
*
Author to whom correspondence should be addressed.
Submission received: 14 May 2021 / Revised: 26 May 2021 / Accepted: 27 May 2021 / Published: 28 May 2021
(This article belongs to the Special Issue Sustainable and Durable Building Materials)

Abstract

:
In the production of cement and concrete, mechanical and durable properties are essential, along with reasonable cost and sustainability. This study aimed to apply an evaluation procedure of the level of sustainability of mixtures of high-performance concretes (HPC) with various eco-friendly supplementary cementitious materials (SCM). The major supplementary cementitious materials (SCMs), namely, volcanic pumice pozzolan (VPP), Class C and F fly ash, ground granulated blast furnace slag of grade 120, silica fume, and metakaolin, were included. Twenty-seven concrete mixtures were analyzed using a previously presented comprehensive material sustainability indicator in a cost-effective variant. The results indicated that the rank of the concretes differed at 28, 56, and 91 days after concreting. In addition, the study showed no correlation of strength and diffusion parameters with sustainability indicators. Finally, this study will contribute to the optimal selection of mixtures of HPC with VPP in terms of sustainability, cost, and durability for future implementation in reinforced concrete bridge deck slabs and pavements. The values of sustainability indicators for pumice-based mixtures were compared with those for other SCMs, highlighting the sustainable performance of volcanic ash-based SCM.

1. Introduction

In general, concrete is the most popular building construction material in the world due to its cost, technical properties, and durability characteristics. The impacts of the selected materials—e.g., steel or reinforced concrete in both civil and transportation infrastructure constructions—on the economic and ecological levels are often compared. In the transportation infrastructure, concrete is more valuable as it allows the creation of structures of various shapes and is used in all parts of a construction. In addition to steel reinforcement in reinforced concrete [1], cement is the most important component in this respect—historically, ordinary Portland cement (OPC) is the most widely used [2].
It should be noted that there are ways to reduce the cost of concrete production while maintaining its desirable properties, for example, by replacing the aggregates [3,4,5,6], but this is not the subject of the present research. Concrete production alone emits almost 8% of global greenhouse gases [7,8,9,10], mainly due to the use of fossil fuels. A study shows that cement production and processing are responsible for 85% of CO2 production in the entire concrete industry [11].
A current and extremely large study involving thousands of scientific outputs has shown the modern trends of high-performance concretes (HPC), atypical reinforced concretes, their disadvantages and possibilities, and, above all, has provided a comprehensive overview of studies dealing with concrete with SCMs [12].
For this reason, it is highly desirable to seek alternative substitutes of OPC using various other SCMs [5,6,7,8,9]; therefore, research on the use of fly ash, slag, silica fume, and metakaolin has been gaining attention at a rapid pace in recent decades [13,14,15,16,17].
SCM replacement levels may vary from mixture to mixture based on chemical composition, cost, availability, and local resources. Most studies aim to present the strength properties or properties related to durability. Alternatively, researchers are looking for shortcomings in current testing methods due to different chemical compositions of concrete [18,19,20]. In many recent studies, a new SCM has been introduced, specifically, volcanic pumice pozzolan (VPP), which increases HPC performance in a significant manner [21,22,23,24,25].
For the needs of the presented investigation, the results from a previous study [26] were obtained and evaluated in terms of sustainability and other related factors. The acquisition of HPC material properties with SCM was a challenge in addition to the testing strategy. The evaluation of a high-quality mixture and especially the correct categorization of the results are important. Degradation of reinforced concrete structures is the result of the combined effects of environmental and mechanical damage, and owners pay significant attention to the issue of ageing [27,28,29].
The effect of degradation must be taken into account, with a strong emphasis on sustainability assessment [30,31].
This has a significant impact on performance requirements critical to the design procedure, life cycle analysis, reliability and, in addition, sustainability-based concepts [32,33,34].
The evaluation of the sustainability of concrete using the so-called sustainability indicators, including material properties, durability, and eco-cost, was presented earlier in [28,34,35], using an indicator marked as kSB (see Equation (1) in Section 2.4). The methodology was improved and enriched later by others authors [36], who included financial costs for the material and the production of concrete, thus creating the indicator kSB,C.
Moreover, a holistic indicator framework for concrete material sustainability evaluation was presented in another study [37].
It is also worth mentioning that the issue of sustainability is currently more emphasized in the regulations—e.g., for the current ACI 318 Code cycle [38], a new subcommittee was established to work on greatly expanding the concrete building code provisions related to sustainability design. A similar situation applies to the forthcoming fibMC2020 [39].
These above-mentioned sustainability indicators can serve as a yardstick for selecting the most appropriate mixture for a broader study and preparing its future implementation, and this is the procedure presented in this article. Material properties are adopted from the study [26]. The diffusion coefficient was included as an indicator of durability, as well as the cost and eco-cost of concrete mixtures for evaluated their rank at three different concrete ages (28, 56, and 91 days). The correlation between the properties directly measured (strength, diffusion parameter) and those derived (sustainability indicators) was also evaluated. We examined the hypothesis that it is not sufficient to evaluate only the strength of concrete or only the durability characteristics, but on the contrary, the sustainability indicator may show a significantly different rank of the investigated concrete mixtures. The results of sustainability indicators of pumice-based HPC mixtures were compared with results for other SCMs [36], highlighting the sustainable performance of volcanic ashes.

2. Materials and Methods

The composition of the investigated concrete mixtures, the results obtained from the adopted study, and the values obtained from the cost and eco-cost evaluation are presented below. A basic description of the method used, the so-called sustainability indicators, and its applicability are also illustrated.

2.1. Volcanic Pumice Pozzolan

VPP is a natural material of volcanic origin and is abundant on the west coast of the United States. As of 2017, California state lawmakers have mandated state-funded projects to report global warming potential (GWP) information based on the use of materials in the project to be assigned an upper limit. As there is still no clear methodology to reduce CO2 emissions in concrete, detailed research is in demand in this area [40]. This SCM is also extensively used in other parts of the world. As an example, VPP is widely used as a supplement to Portland cement in countries including Italy, Germany, Kenya, Turkey, China, and Greece [41] and is a good example of a sustainable substitute for concrete mineral admixtures.
Basic data such as strength, diffusion coefficients, and material composition were obtained from an extensive durability study of volcanic pumice-based ultrafine HPC mixtures [25]. As an example of the developed methodology, 27 different concrete mixtures were investigated, including the reference mixture of ordinary Portland cement (OPC), binary mixtures (OPC and one SCM), and ternary mixtures (OPC and two SCMs) integrating VPP [25]. The chemical properties of OPC, VPP, and other SCMs are shown in Table 1 [26].

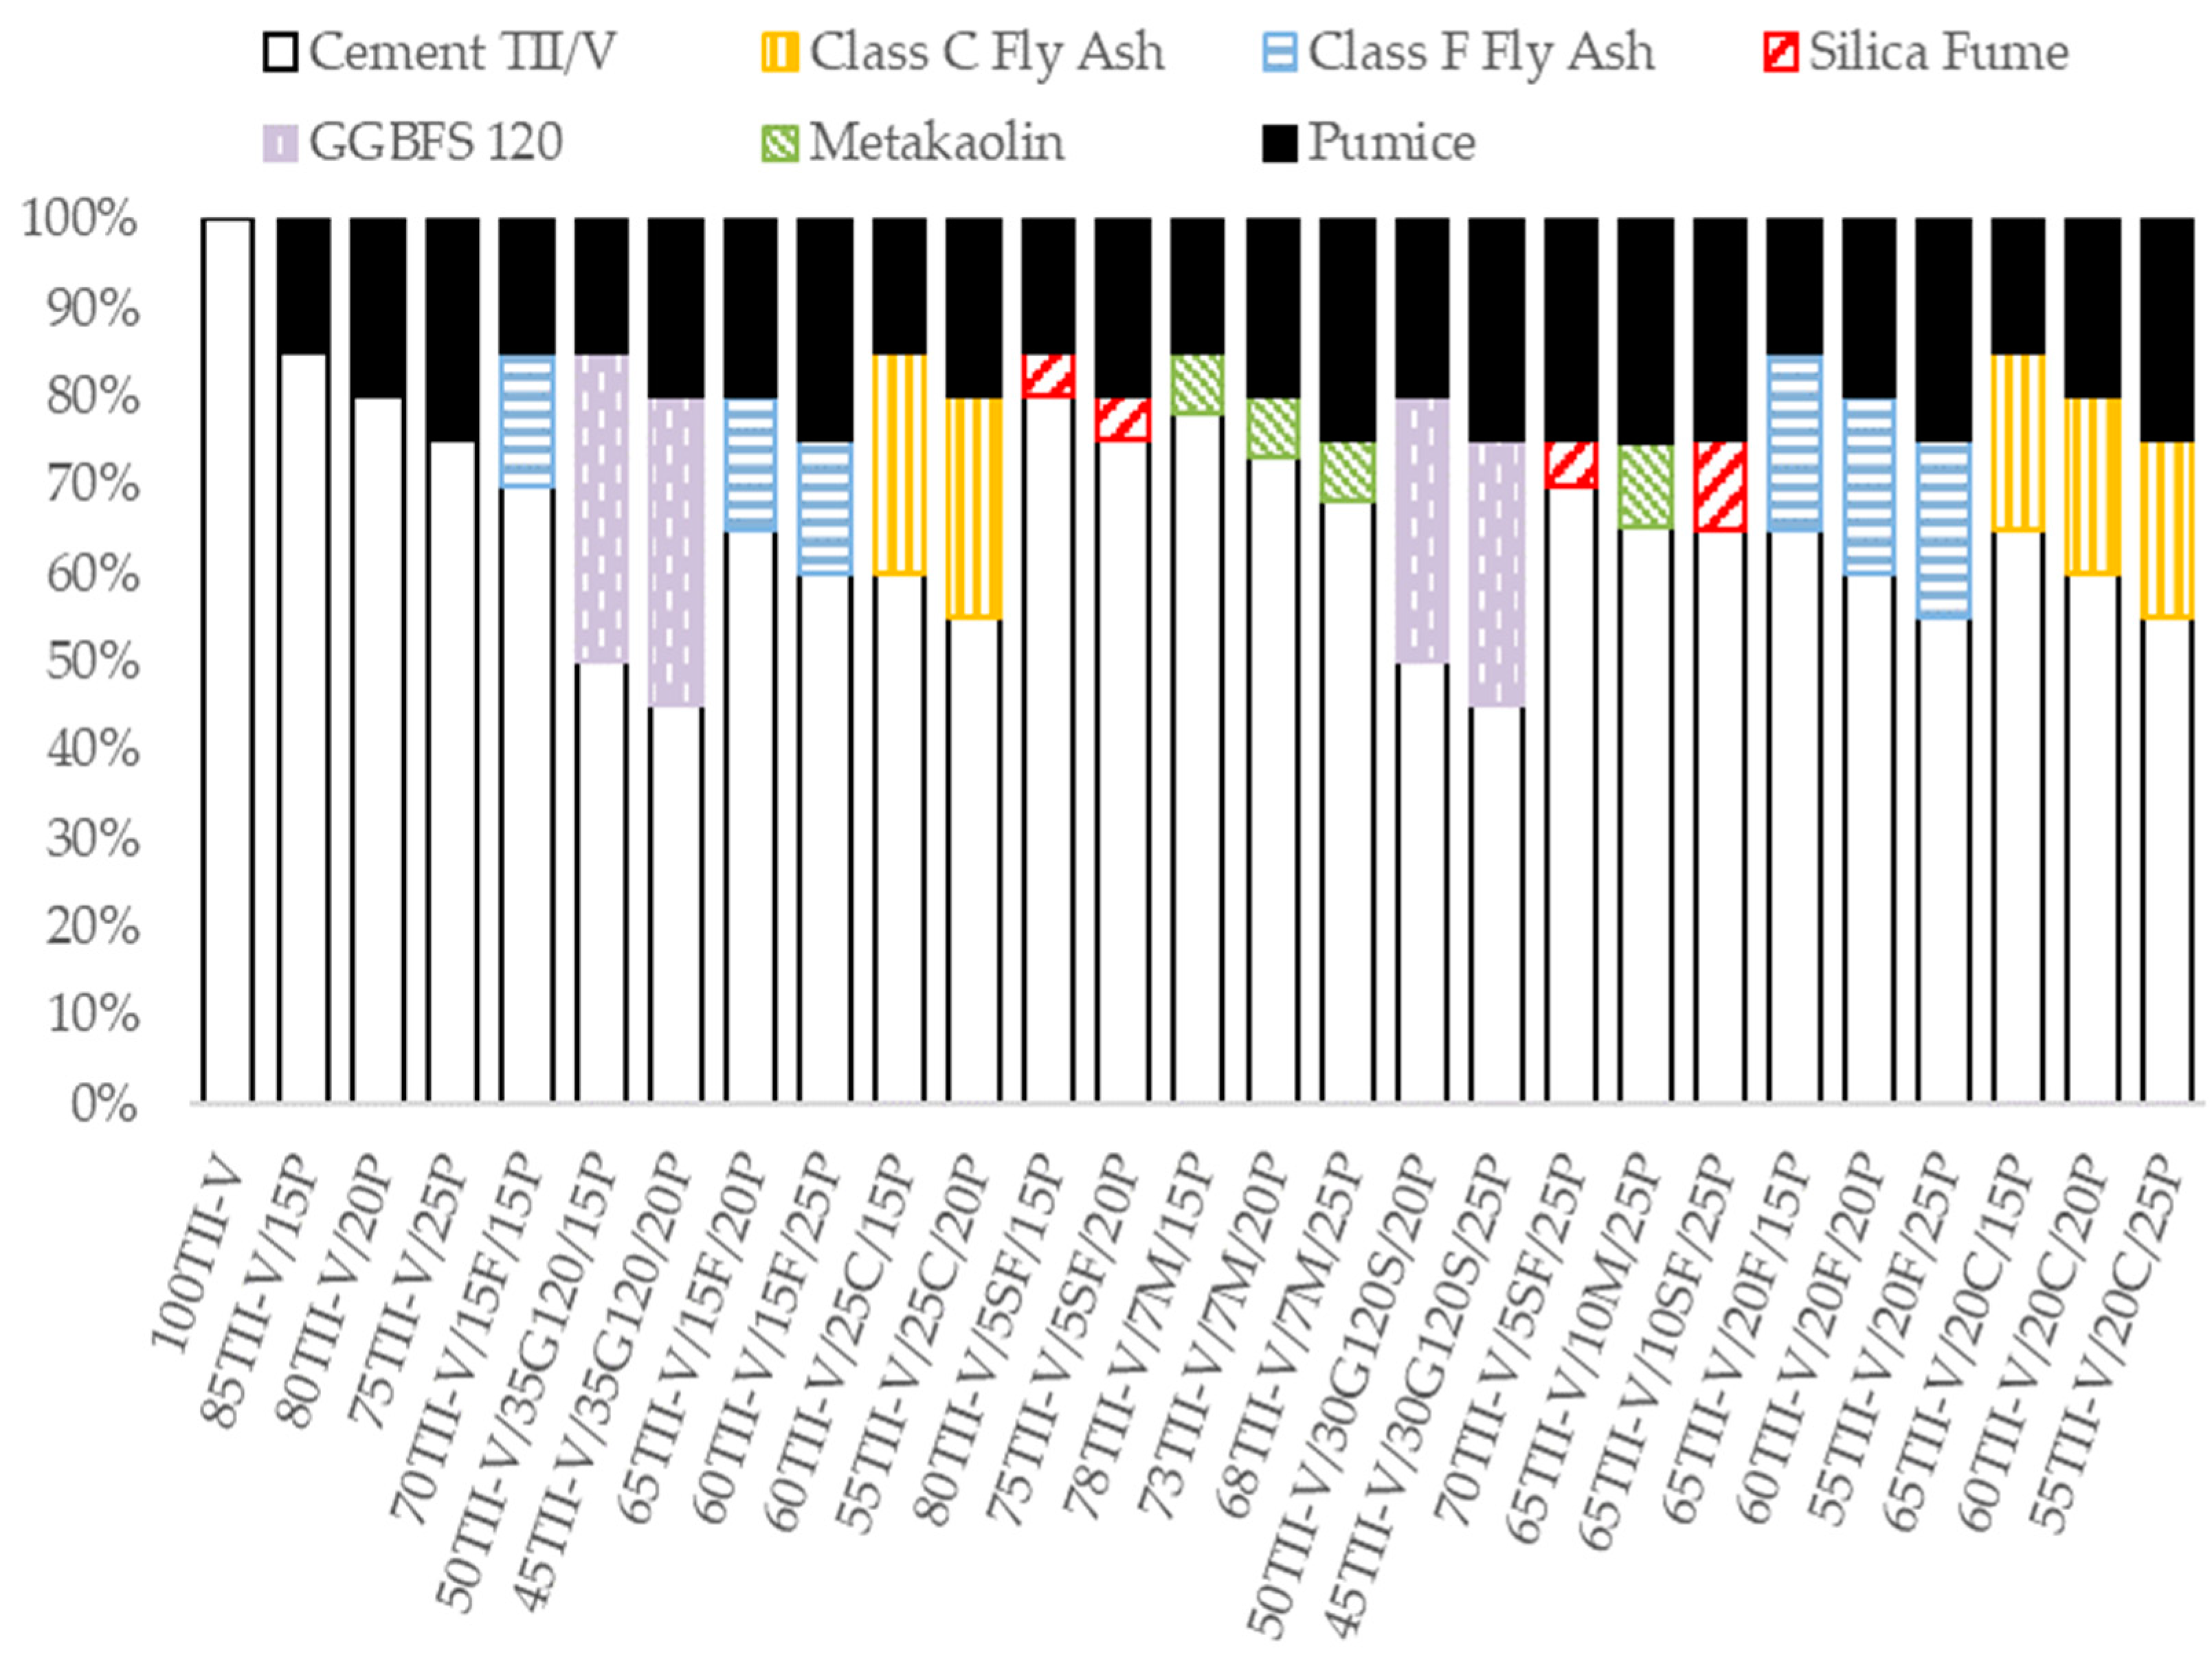
2.2. Investigated Mixture Composition

Concrete mixtures were designed with a water/cementitious materials ratio of 0.4 and contained 335 kg/m3 of cementitious materials, 147 kg/m3 of water, 1038 kg/m3 of gravel, and between 701 kg/m3 to 731 kg/m3 of natural sand. The basic element was the Portland Cement Type II–V (TII–V), which is widely used in California due to the sulphate attack problem. It is to be noted that Type I cement is prohibited in California. Various SCMs were utilized, namely, Class C fly ash (C), Class F fly Ash (F), Silica fume (SF), ground granulated blast furnace slag of grade 120 (G120S), Metakaolin (M), and Volcanic Pumice Pozzolan (P). Volcanic pumice was the major ingredient, as it is incorporated in all binary and ternary concrete mixtures. The specific gravity of Cement TII/V is 3.15, that of Class C Fly Ash is 2.32, that of Class F Fly Ash is 2.32, that of GGBFS 120 is 2.92, that of Silica Fume is 2.22, that of Metakaolin is 2.6, that of Pumice is 2.35, that of Natural Sand is 2.66, and that of Gravel is 2.71.
Furthermore, a water-reducing admixture (Glenium 7500) and an air-entraining admixture (MBVR AE90) were used to achieve better processability and other workability specifications. Mixtures were marked according to the cementitious materials and their percentage replacement by mass, e.g., 70TII-V/15F/15P stands for 70% Type II-V Cement, 15% Class F fly ash, and 15% Pumice (see Figure 1). It can be noticed that the first concrete mixture was taken as a reference for all calculations, and was designated as OPC.

2.3. Material Properties

A published article studied the strengths and electrochemical properties at 28, 56 and 91 days after concreting [26]. For further sustainability assessment, the strength values were converted from psi to MPa. Furthermore, diffusion parameters were subsequently computed from the measured values of the charge passed according to the ASTM C1202 standard (a detailed description of the measurement is provided in [42,43]). Diffusion coefficients (Dc) were also obtained at 28, 56, and 91 days after concreting, using the Nernst–Einstein equation [44]. The environmental costs and the cost of each component of the concrete mixture were obtained from a database [45,46] and computed for each concrete mixture. It should be noted that these costs are related to the area of origin, i.e., the USA. Table 2 shows the values for all concrete mixtures.

2.4. Sustainability Indicator

Sustainability can be evaluated using the sustainability indicator kSB, which has already been described in details, and the cost of the concrete mixture has been considered (material and production) to obtain a modified indicator, i.e., kSB,C [34,36,47]. The methodology used was based on previous published findings [35]. It should be noted that the cost of the material is mostly dependent on the region or country. The present analysis focused on the values for the USA. As the design of the concrete structure ensures structural safety and serviceability, along with durability, robustness, sustainability, and resilience, the sustainability indicator kSB,C can be incorporated to create a rank of concrete mixtures. The main advantage of kSB,C is its complexity, which includes all aspects, namely, strength, resilience, ecology, and economy. Equation (1) [34] was used for the computation of kSB:
k SB = R L ref × L L ref E E ref
where:
  • R is the performance—suitable for the mechanical characteristics of concrete, namely, compressive strength [MPa]
  • L is the service life—using a suitable analytical model (see e.g., [6,7]), the service life of L [years] is then determined. Instead of the model, alternatively, a quantity characterizing the service life related to a certain degradation phenomenon can be used for L—in the present case, it is a diffusion parameter used to calculate the resistance of concrete to chloride ions and in connection with corrosion of reinforcement [9,10]
  • E is the eco-cost, i.e., the amount that could be spent to reduce the environmental impact to a sustainable level. It includes the impact of mining and processing of materials
  • Rref, Lref, and Eref are optional values, in this case, relevant to the reference concrete mixture (OPC).
The extension of the sustainability indicator by the cost of the material can be considered in Equation (2) [36] to obtain kSB,C:
k SB = R L ref × L L ref E E ref × C C ref
The description of the parameters is listed below:
  • C is the cost, i.e., the price of all materials according to the specific composition of concrete, depending mainly on the region or country
  • Cref is a cost related to the reference concrete.
Considering these parameters, it is possible to categorize concrete mixtures based on data obtained from previous research studies. The highest values of kSB and kSB,C show the most advantageous concrete mixture in the studied group in terms of sustainability. Details of the entire methodology for evaluating the sustainability indicator are described comprehensively in a published study [36].

3. Results

It was possible to evaluate the various groups of concrete mixtures and determine their rank in the group with the above-mentioned assumptions and the application of the methodology of sustainability indicators. The results represent the kSB values and the respective rank, as well as the kSB,C values and the respective rank. Both parameters were calculated for three time periods. Subsequently, linear regression was applied in order to evaluate the correlation between kSB and kSB,C, which indicated how the cost determine fundamental differences of the material in the investigated group. Further evaluation was carried out considering kSB correlation at different concrete ages, namely, 28 days versus 56 days, 28 days versus 91 days, and 56 days versus 91 days. Finally, our analysis showed a correlation of the strength and diffusion parameters with the kSB and kSB,C indicators. It is worth mentioning that other possible regression curves did not show a higher agreement compared to linear regression. Therefore, only linear regression is presented herein. This allows understanding whether it is necessary to use indicators or whether it is possible to evaluate concrete in terms of sustainability purely based on material characteristics.

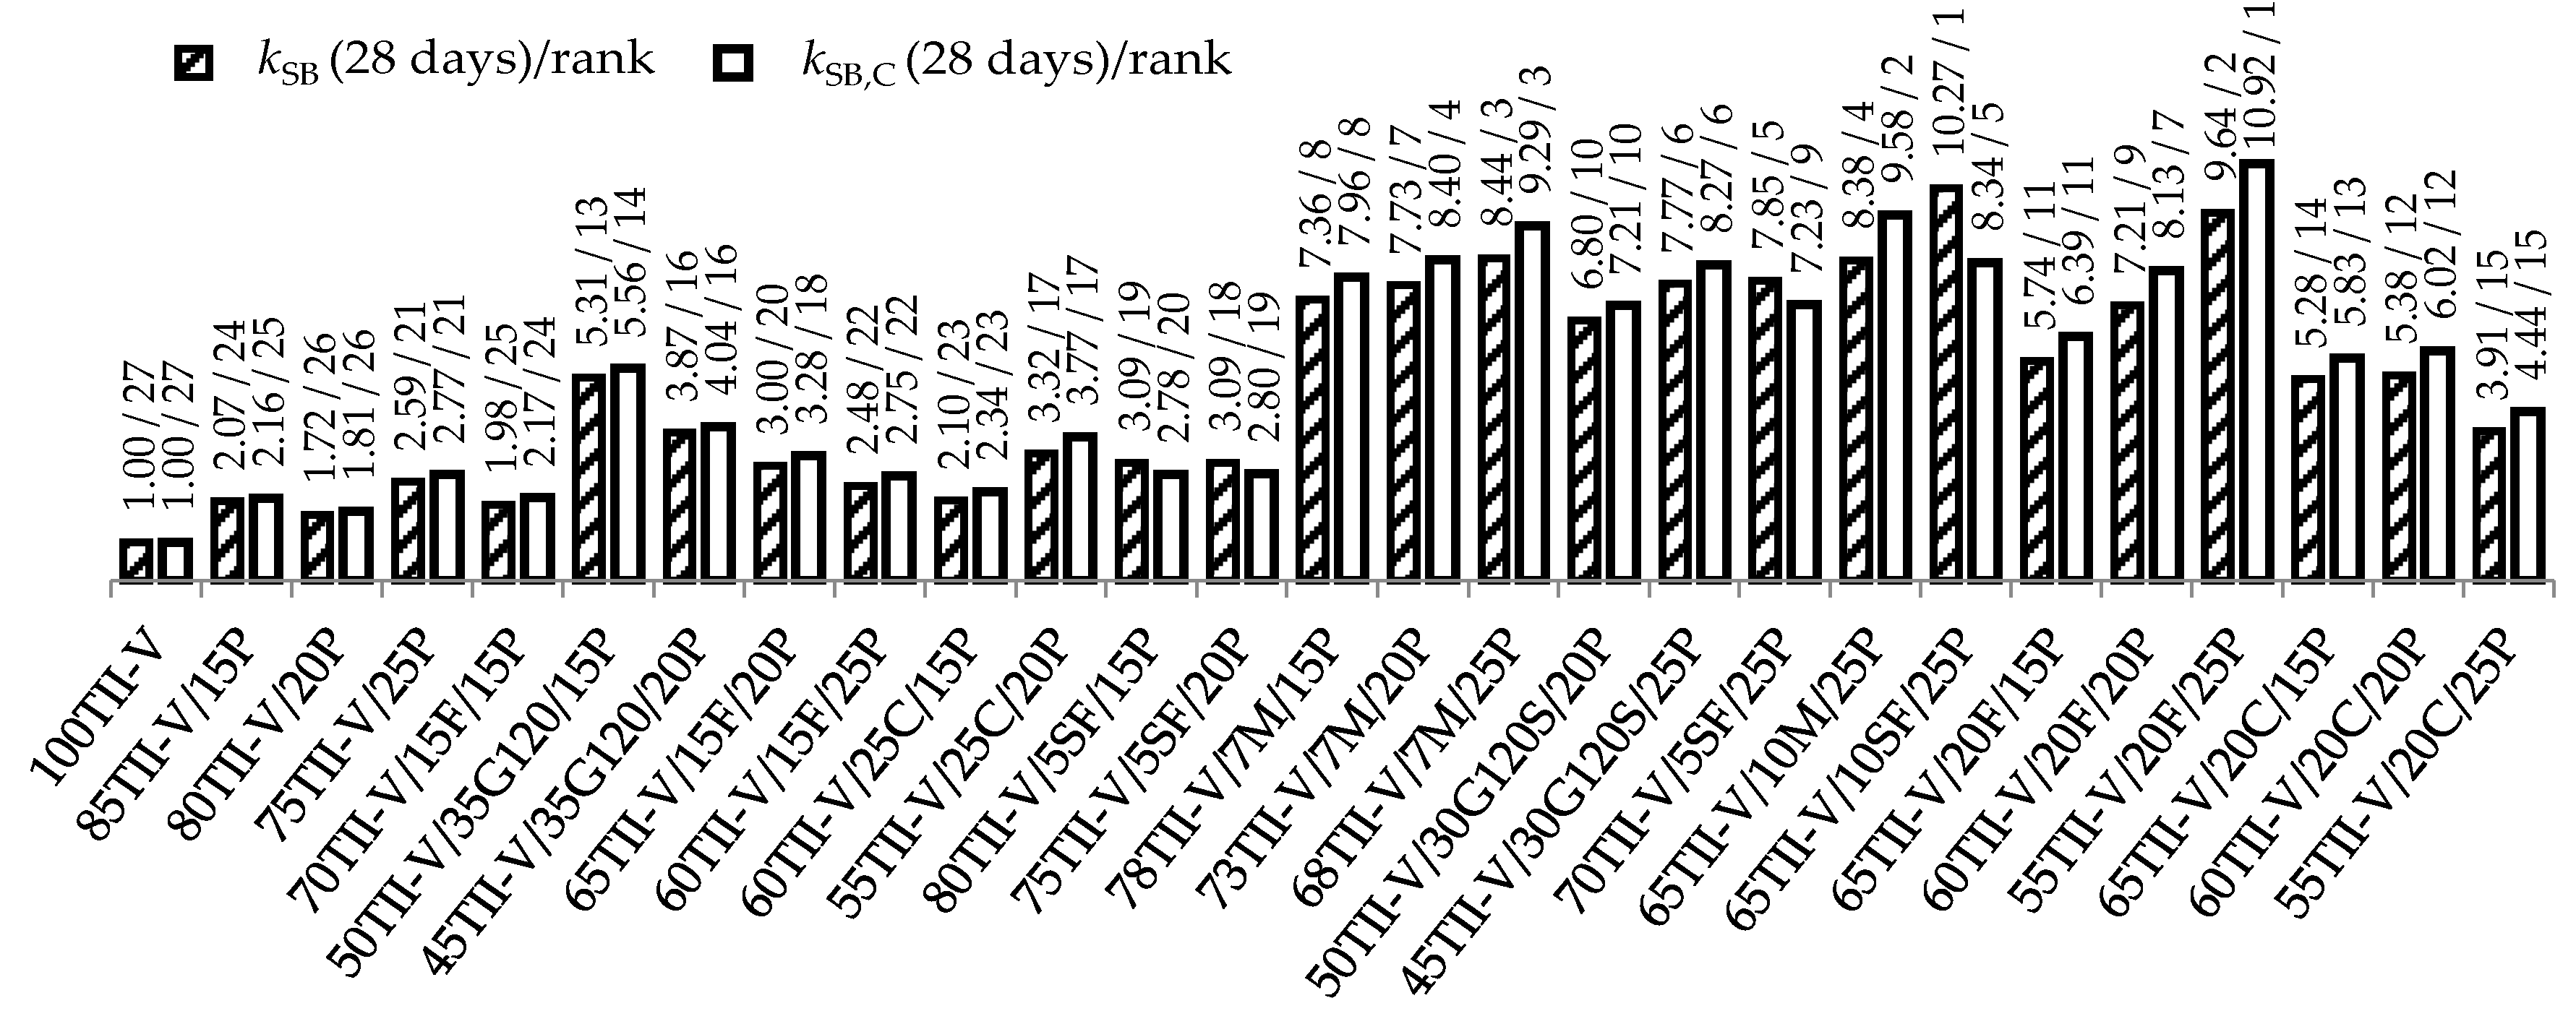
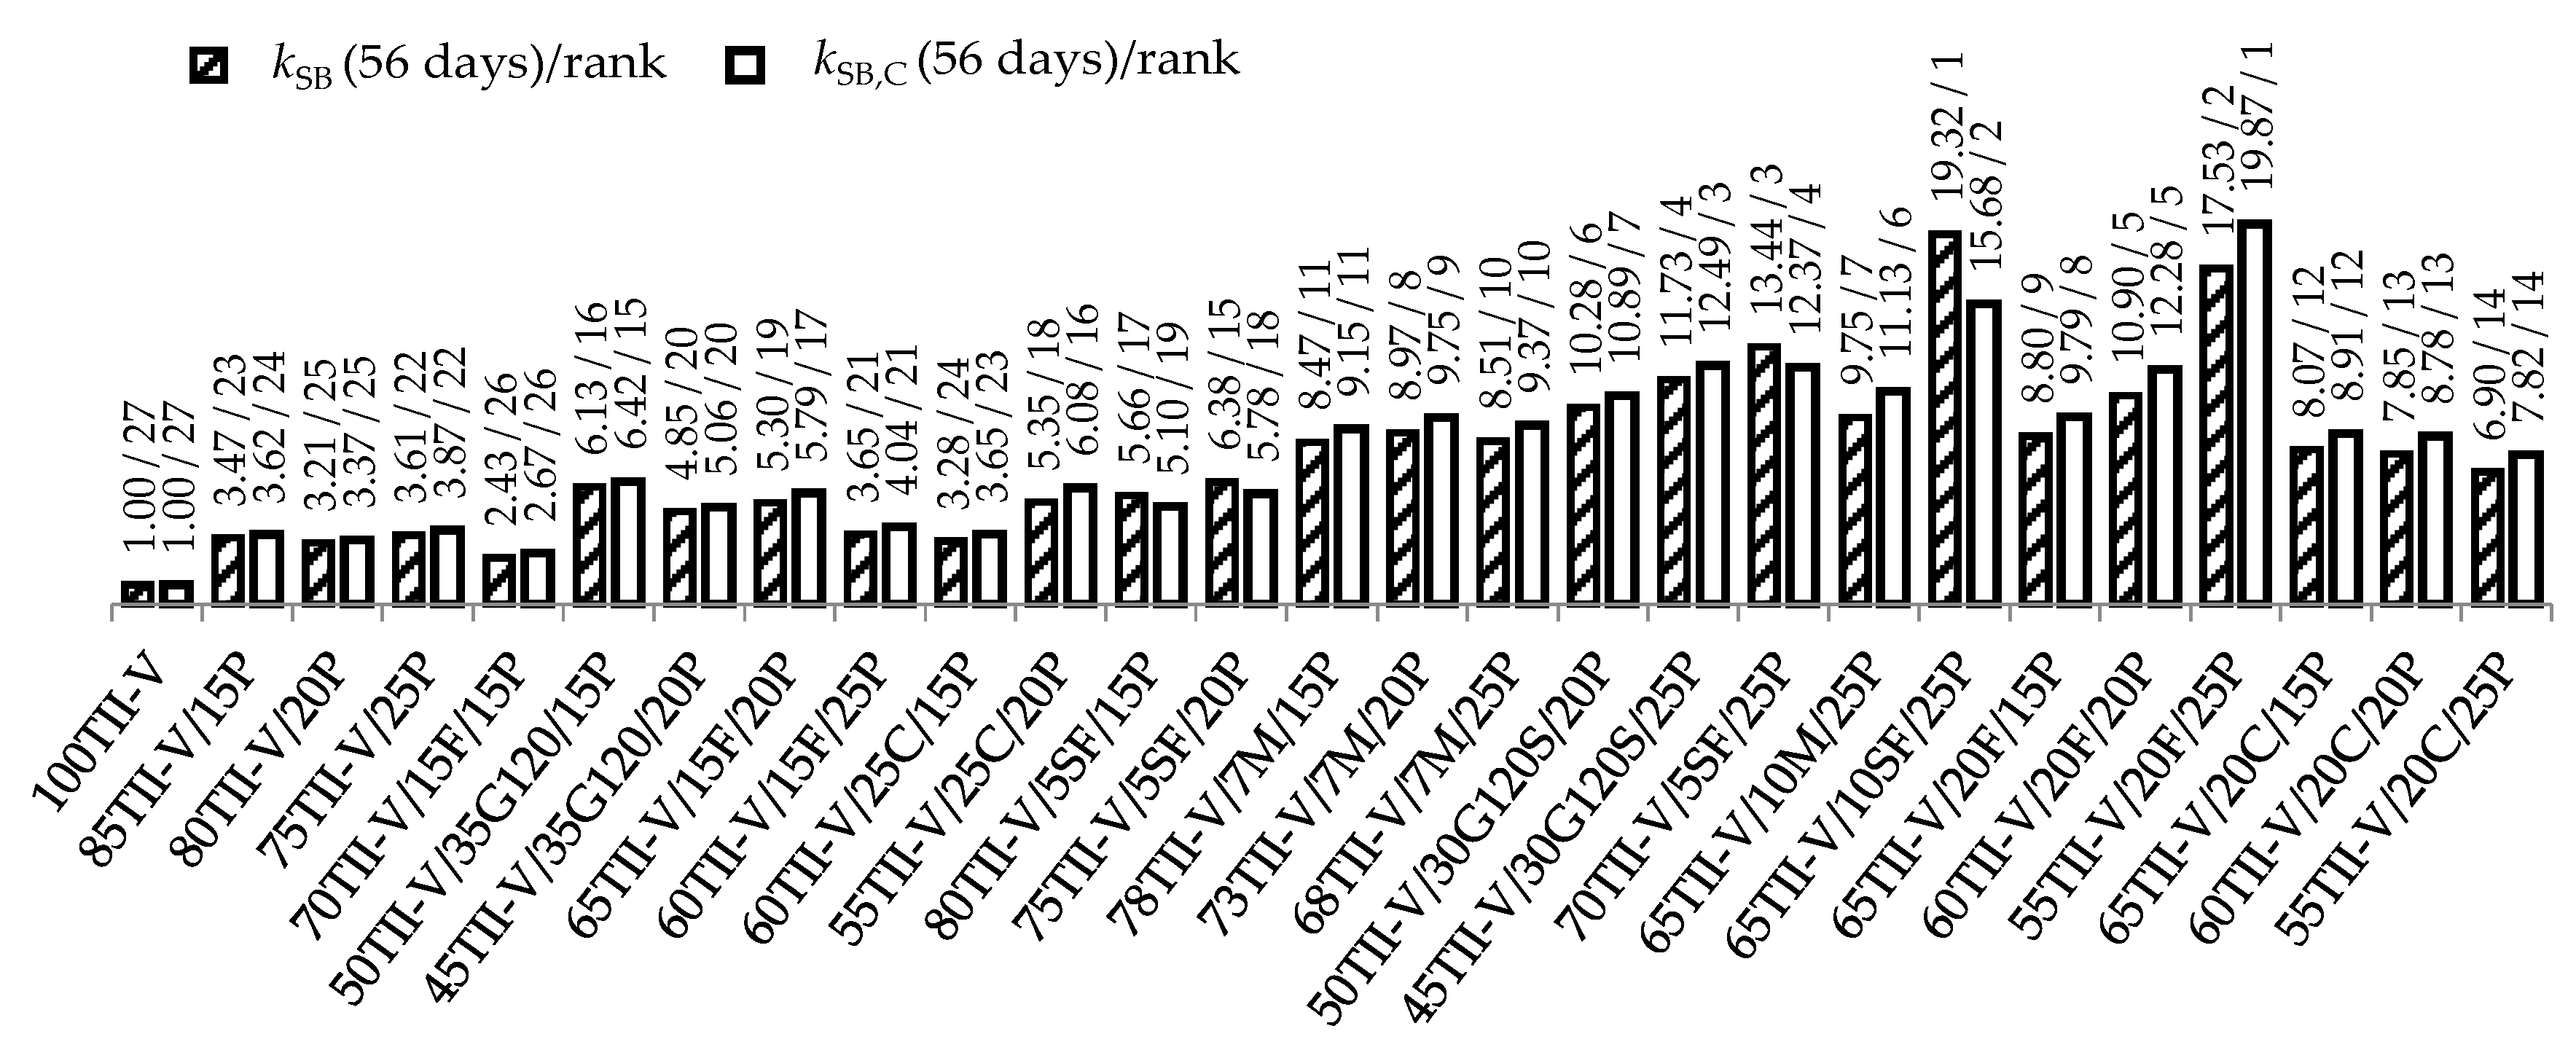
3.1. Rank of Concrete Mixtures

Equations (1) and (2) were used to obtain the rank of all mixtures. For example, the mixture 80TII–V/15P presented the following values after 28 days: R = 1.60 MPa (strength), L = 4.90 × 10⁻¹² m2/s (diffusion coefficient), E = 54.91 €/m3 and C = 44.57 €/m3. The reference values of 100TII–V were selected for all mixtures after 28 days as Rref = 6.16 MPa, Lref = 27.08 × 10⁻¹² m2, Eref = 50.95 €/m3, and Cref = 46.47 €/m3. The result according to Equation (1) is 2.07 in 28 days, while, according to Equation (2), it is 2.16. All mixtures were calculated and then sorted from the highest to the lowest value—thus obtaining a rank. The results of the evaluation using the sustainability indicator at 28, 56, 91 days after concreting are shown in Figure 2, Figure 3 and Figure 4.
The reference concrete mixture (100TII-V) has a value of 1 and is ranked 27th, as both indicators for all mixtures showed better performance compared to the reference concrete mixture. The results showed that the best possible mixture in terms of sustainability without cost is 65TII-V/10SF/25P, whereas, considering the cost, it is 55TII-V/20F/25P. This applied to all investigated times. The subsequent rank was different; however, the difference was not significant.

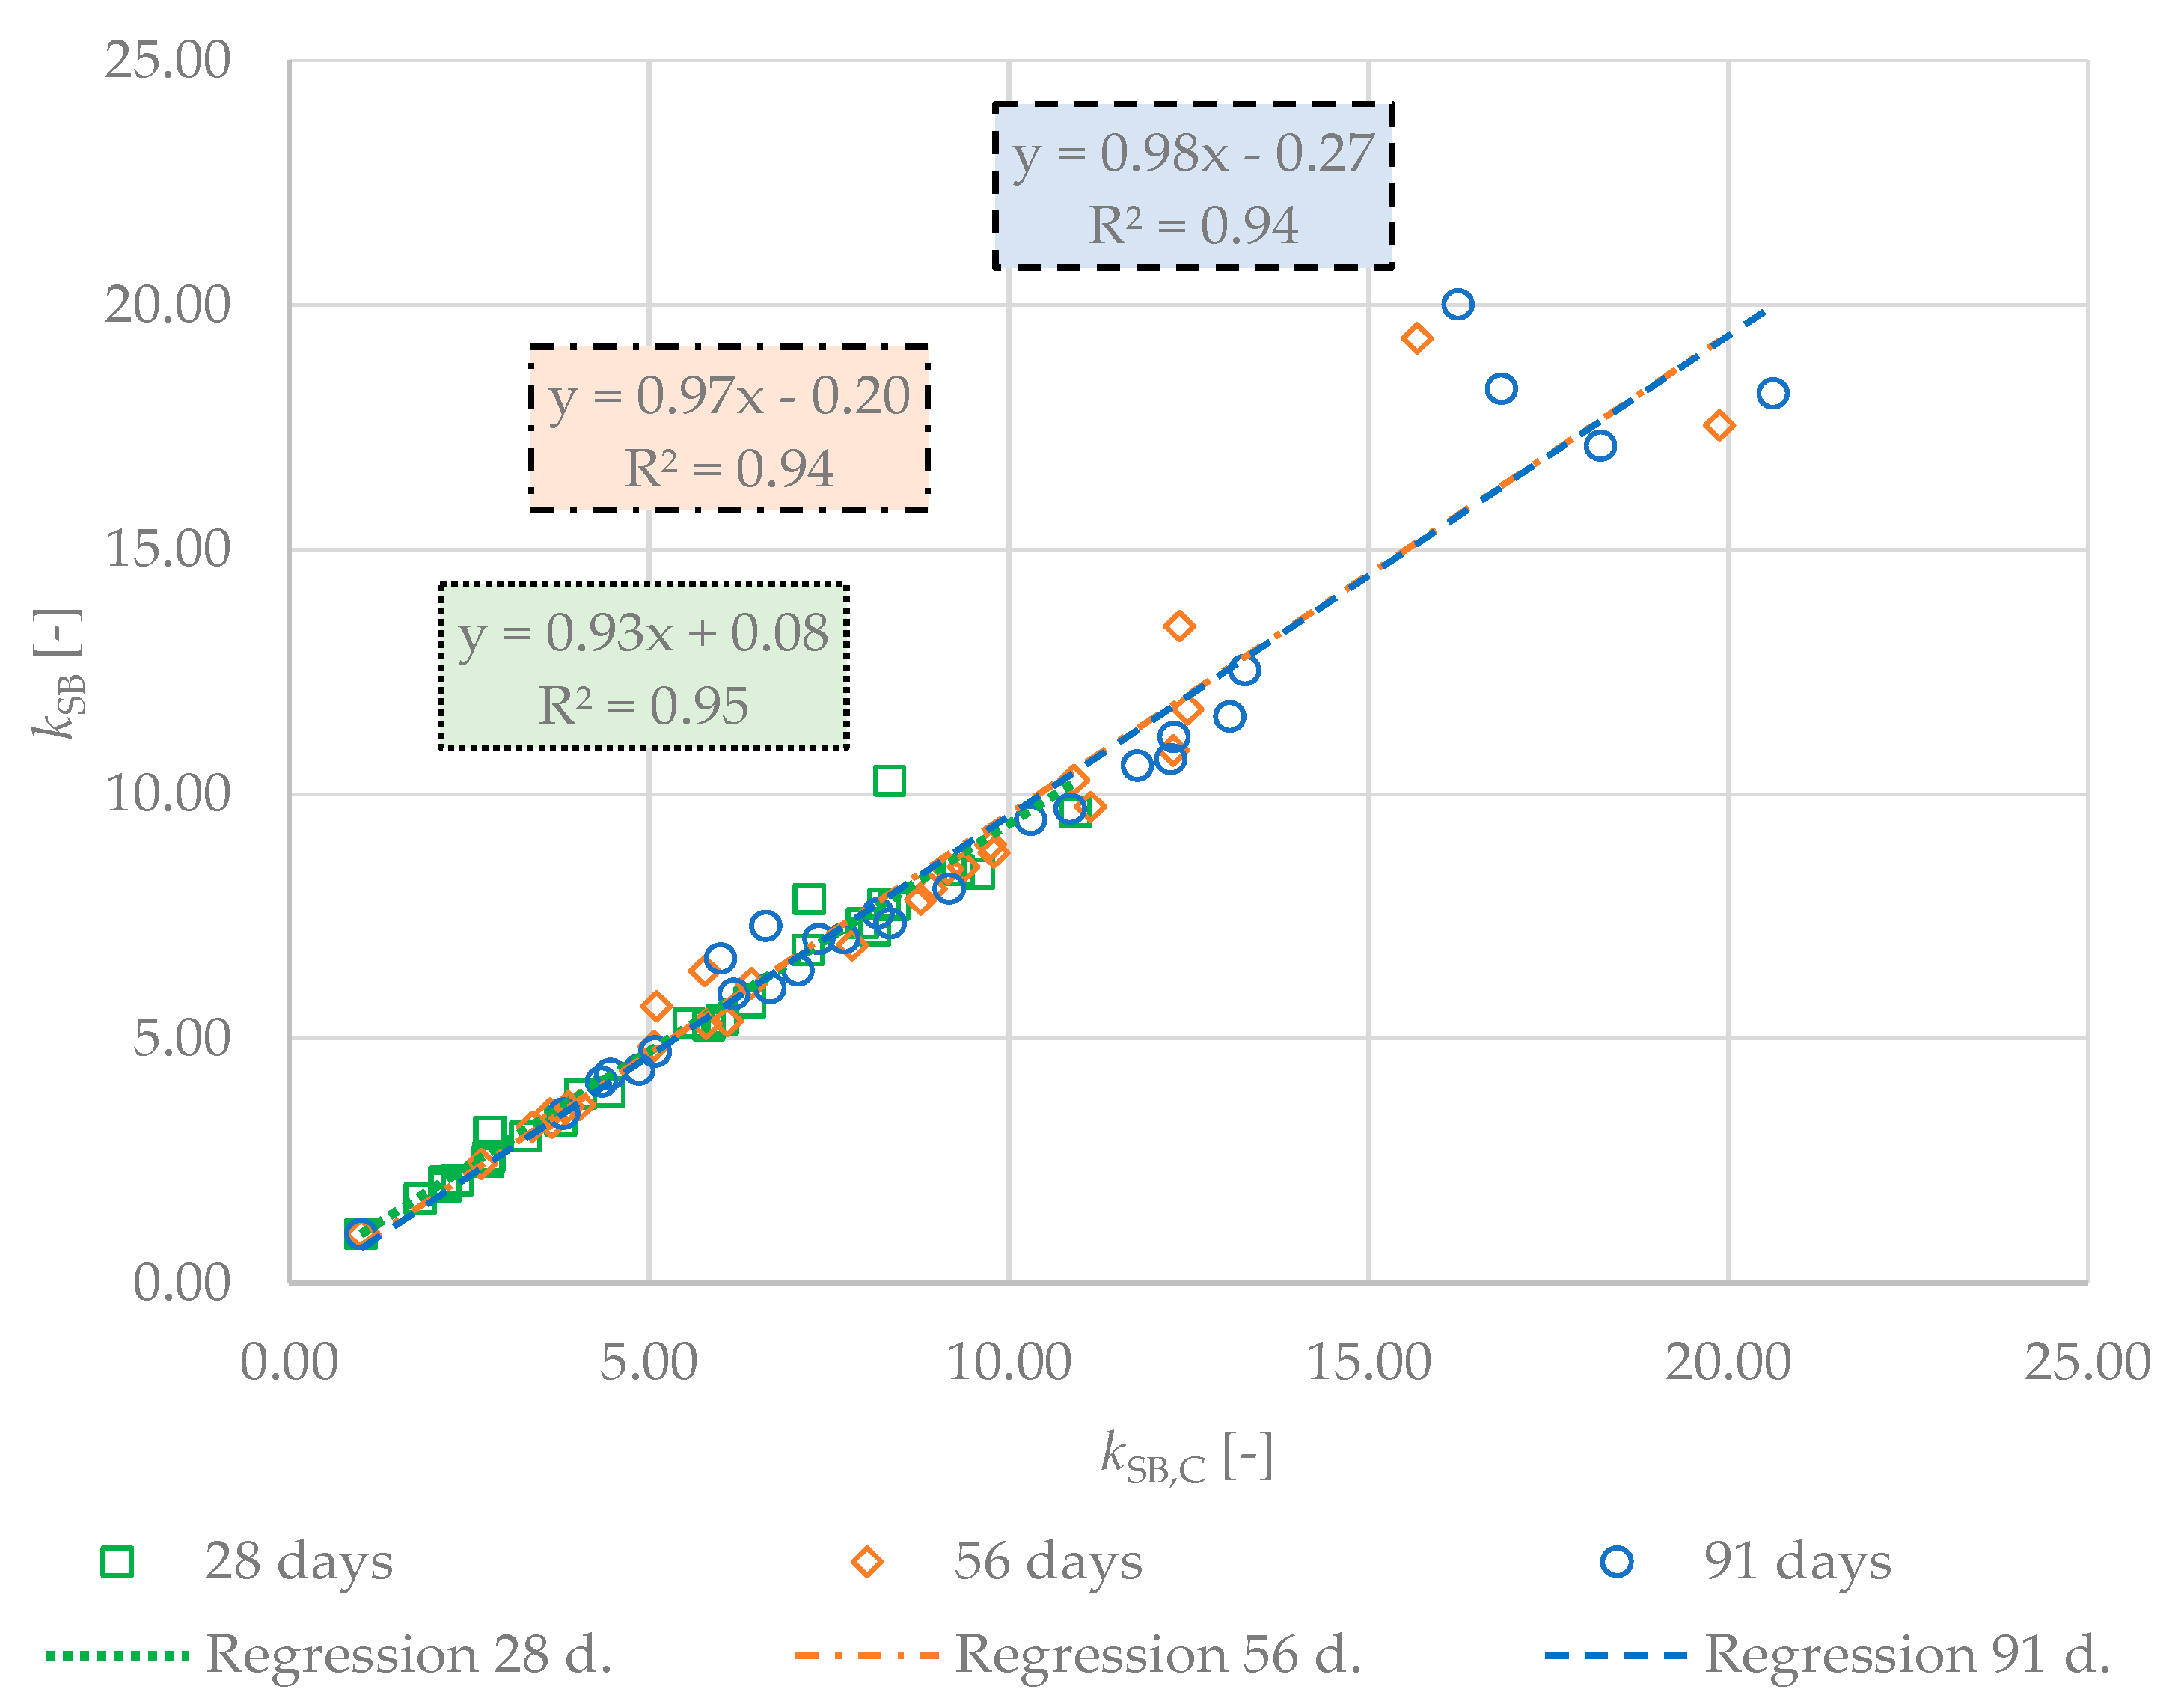
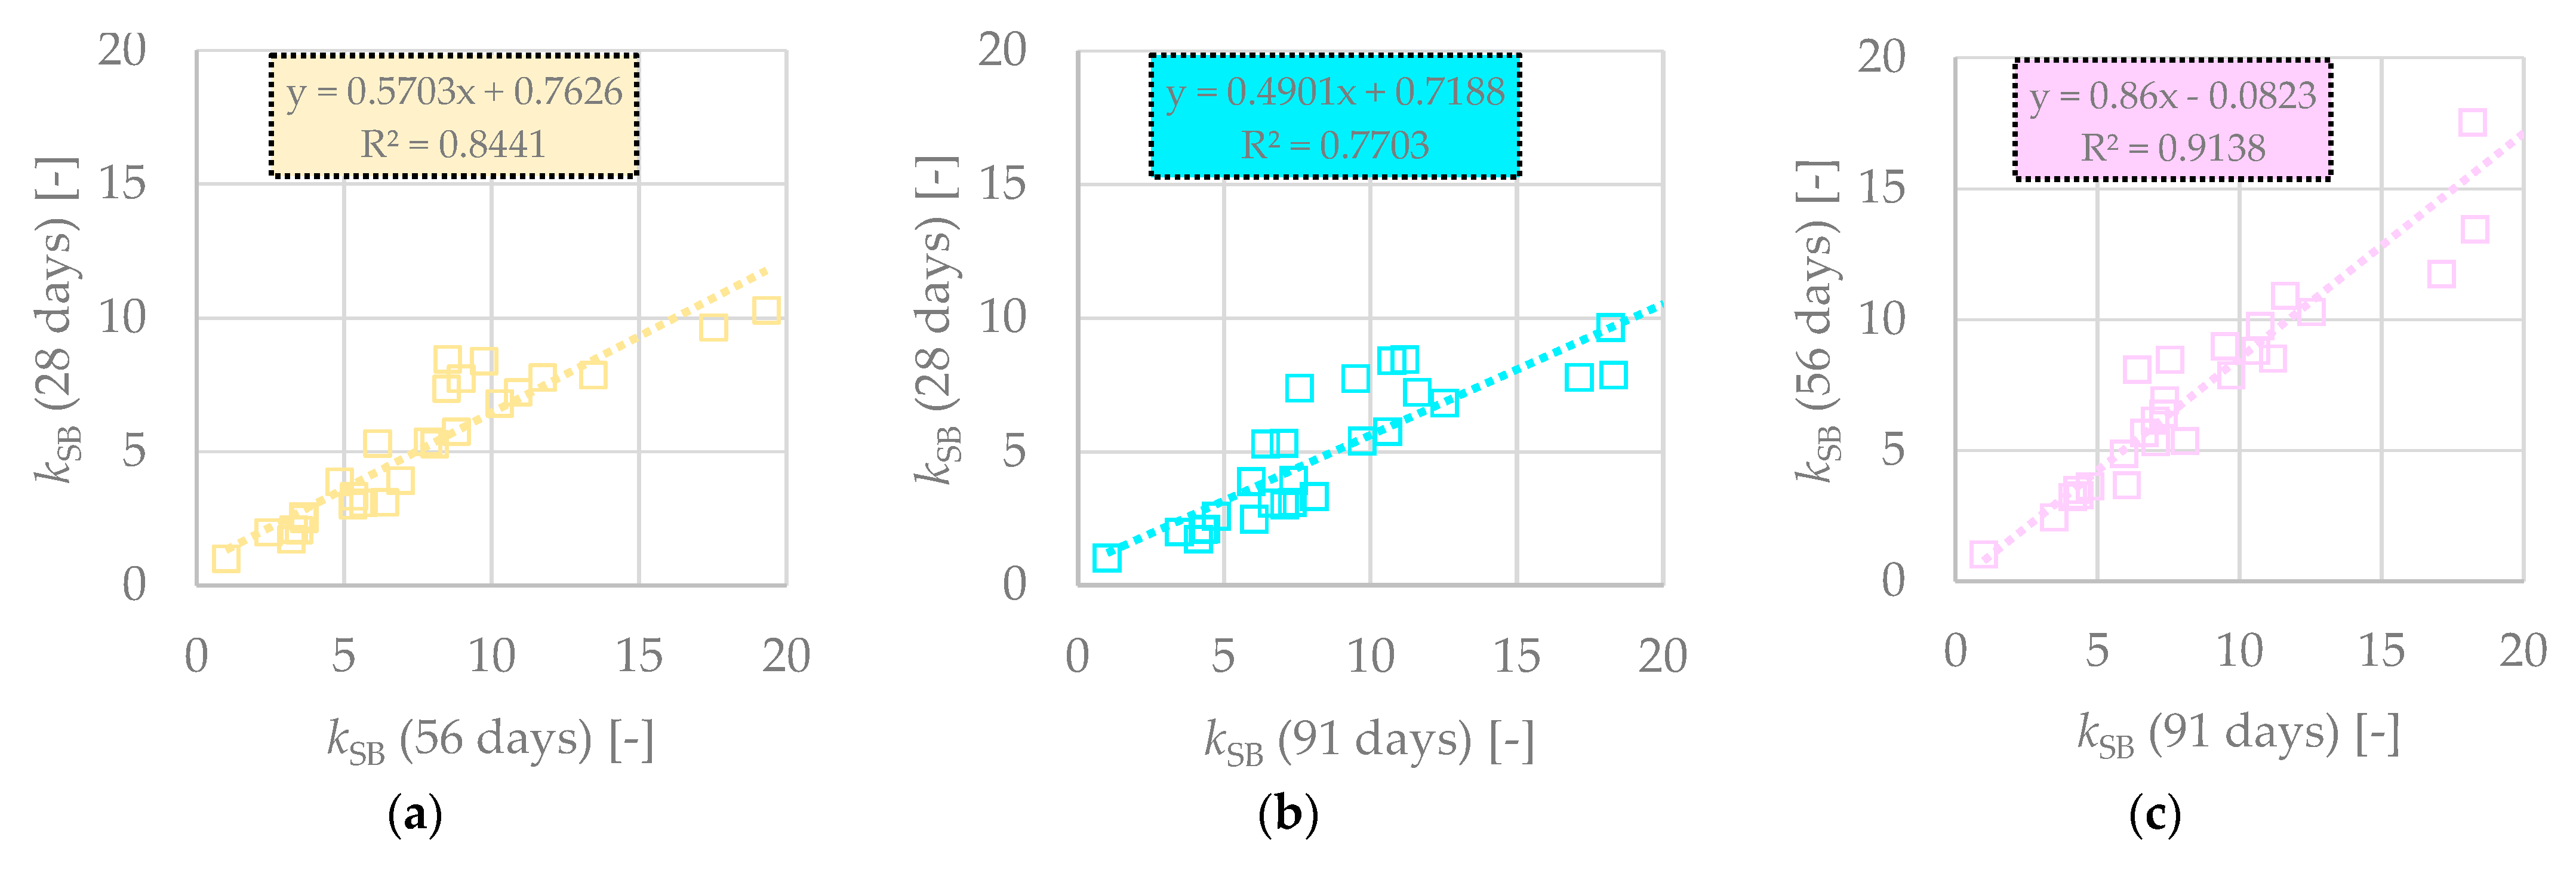
3.2. Correlation between Sustainability Indicators

The difference between kSB was verified by kSB,C, evaluating the correlation at each time frame (see Figure 5). It could be concluded that both parameters showed similar results based on the high coefficient of the determination values.
The major reason was the cost of individual materials, which did not differ significantly from the average value. However, when evaluating an individual mixture, it was observed that the rank was alternate. The highest and lowest correlation was observed in 28 days and 91 days, respectively; however, the difference was quite small. Therefore, the relative weight of cost has the same significance as that of other parameters in the case of the studied group of concrete mixtures. As a complementary result, there was a correlation between kSB values at different times (Figure 6). The values at 28 and 91 days showed the lowest agreement. On the contrary, the highest agreement was observed at 56 and 91 days (which was to be expected, due to the more matured concrete with Pumice SCM).

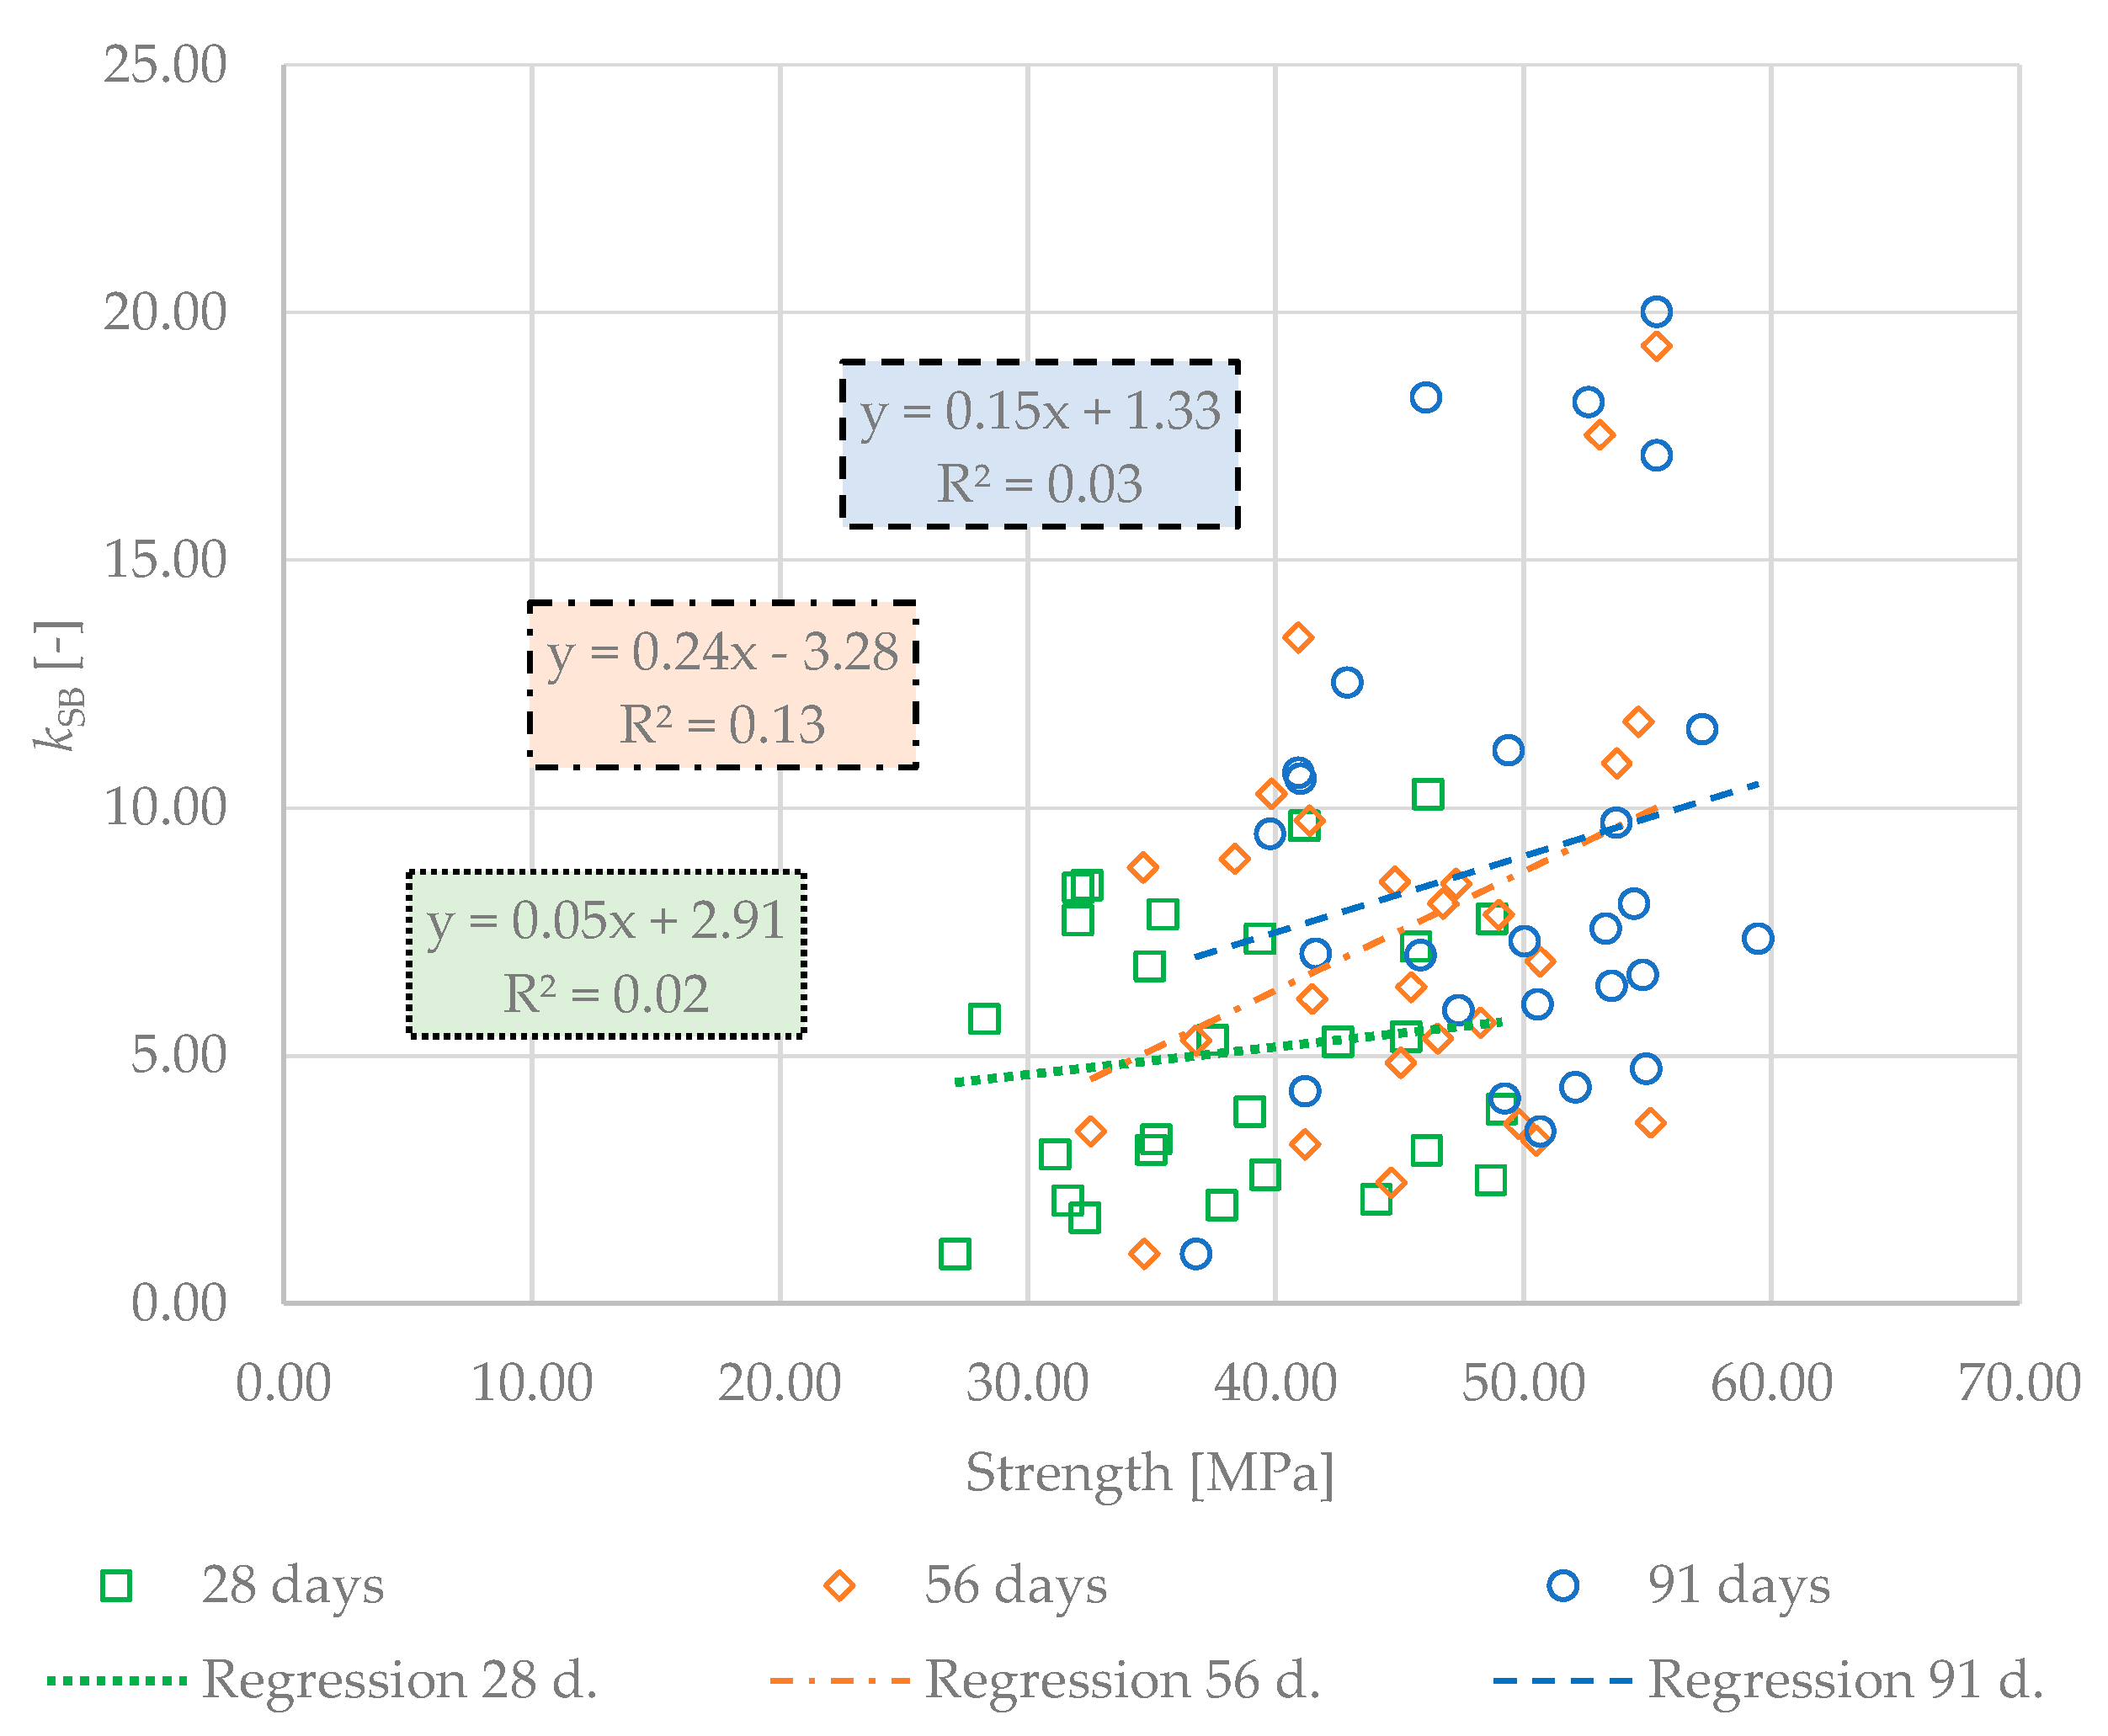
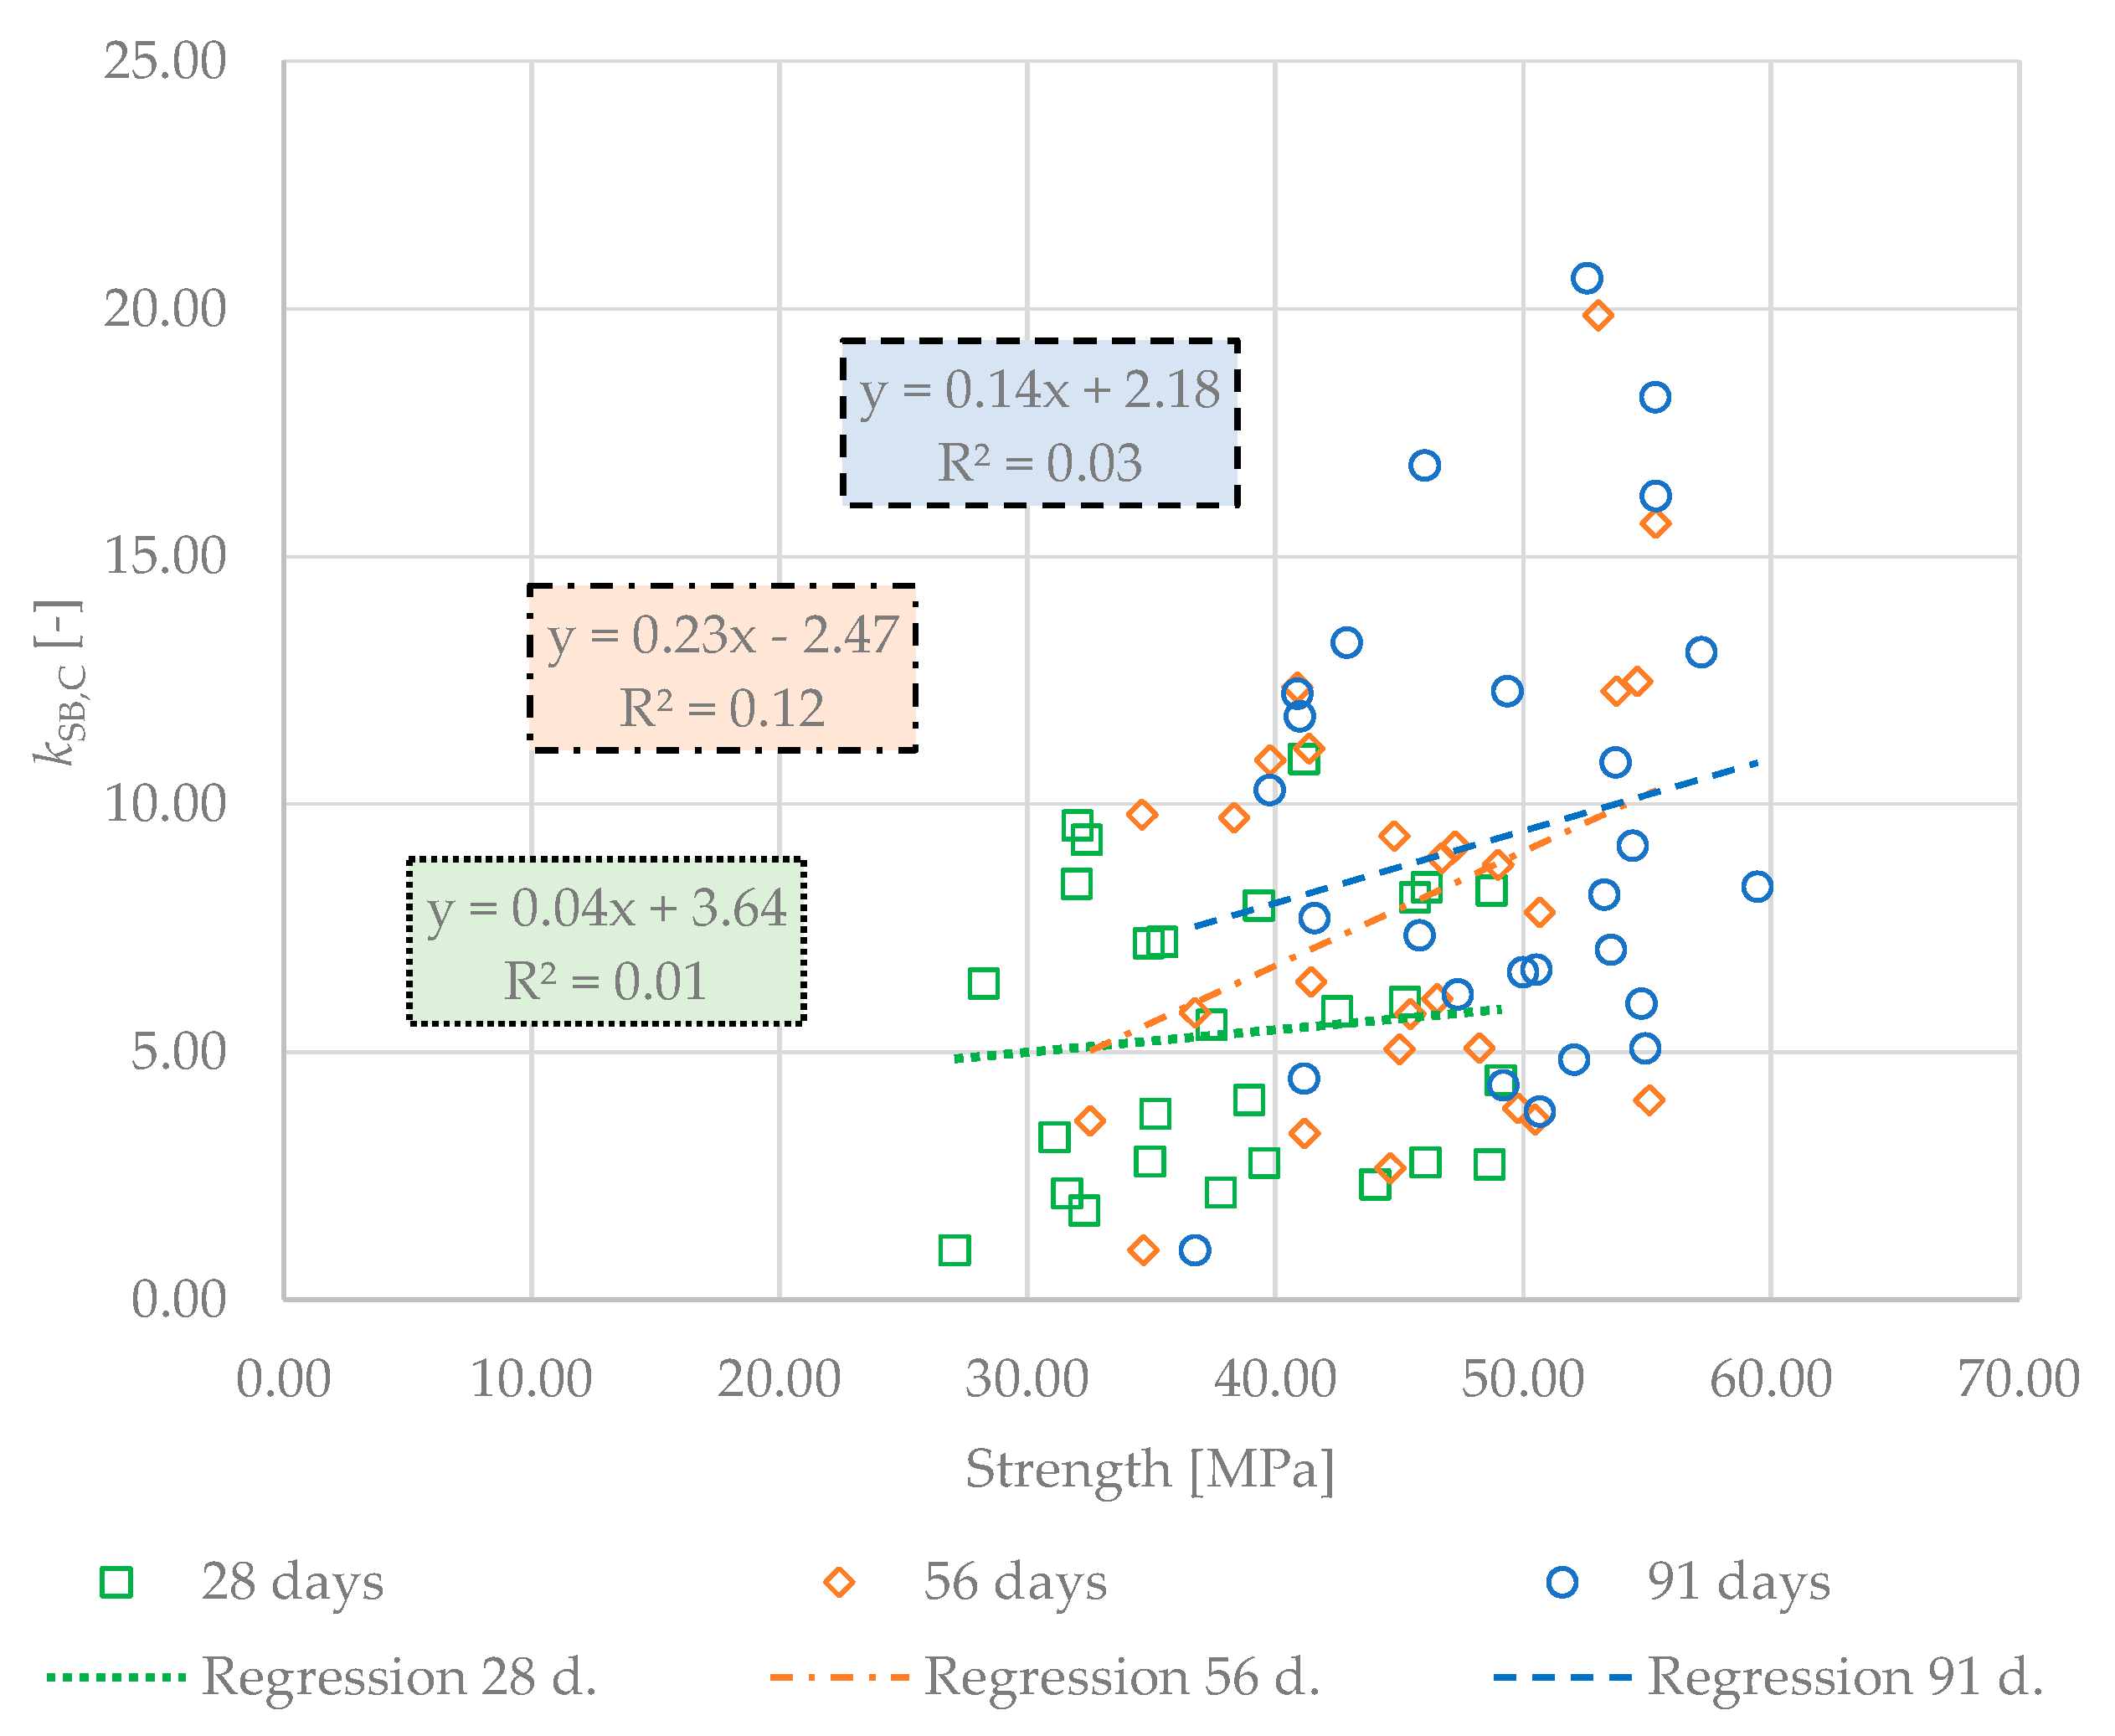
3.3. Correlation between Sustainability Indicators and Strength

Correlations were determined to evaluate the hypothesis that the sustainability indicator may suggest a significantly different order of the investigated concrete mixtures compared to the strength (see Figure 7 and Figure 8).
It can be observed from the results of the R-square parameters that there was a very low correlation. This proves that both sustainability indicators did not have a direct linear dependence on the strength of the concrete mixtures. This confirmed the first assumption that it is appropriate to use these indicators to determine the ranking with respect to sustainability.

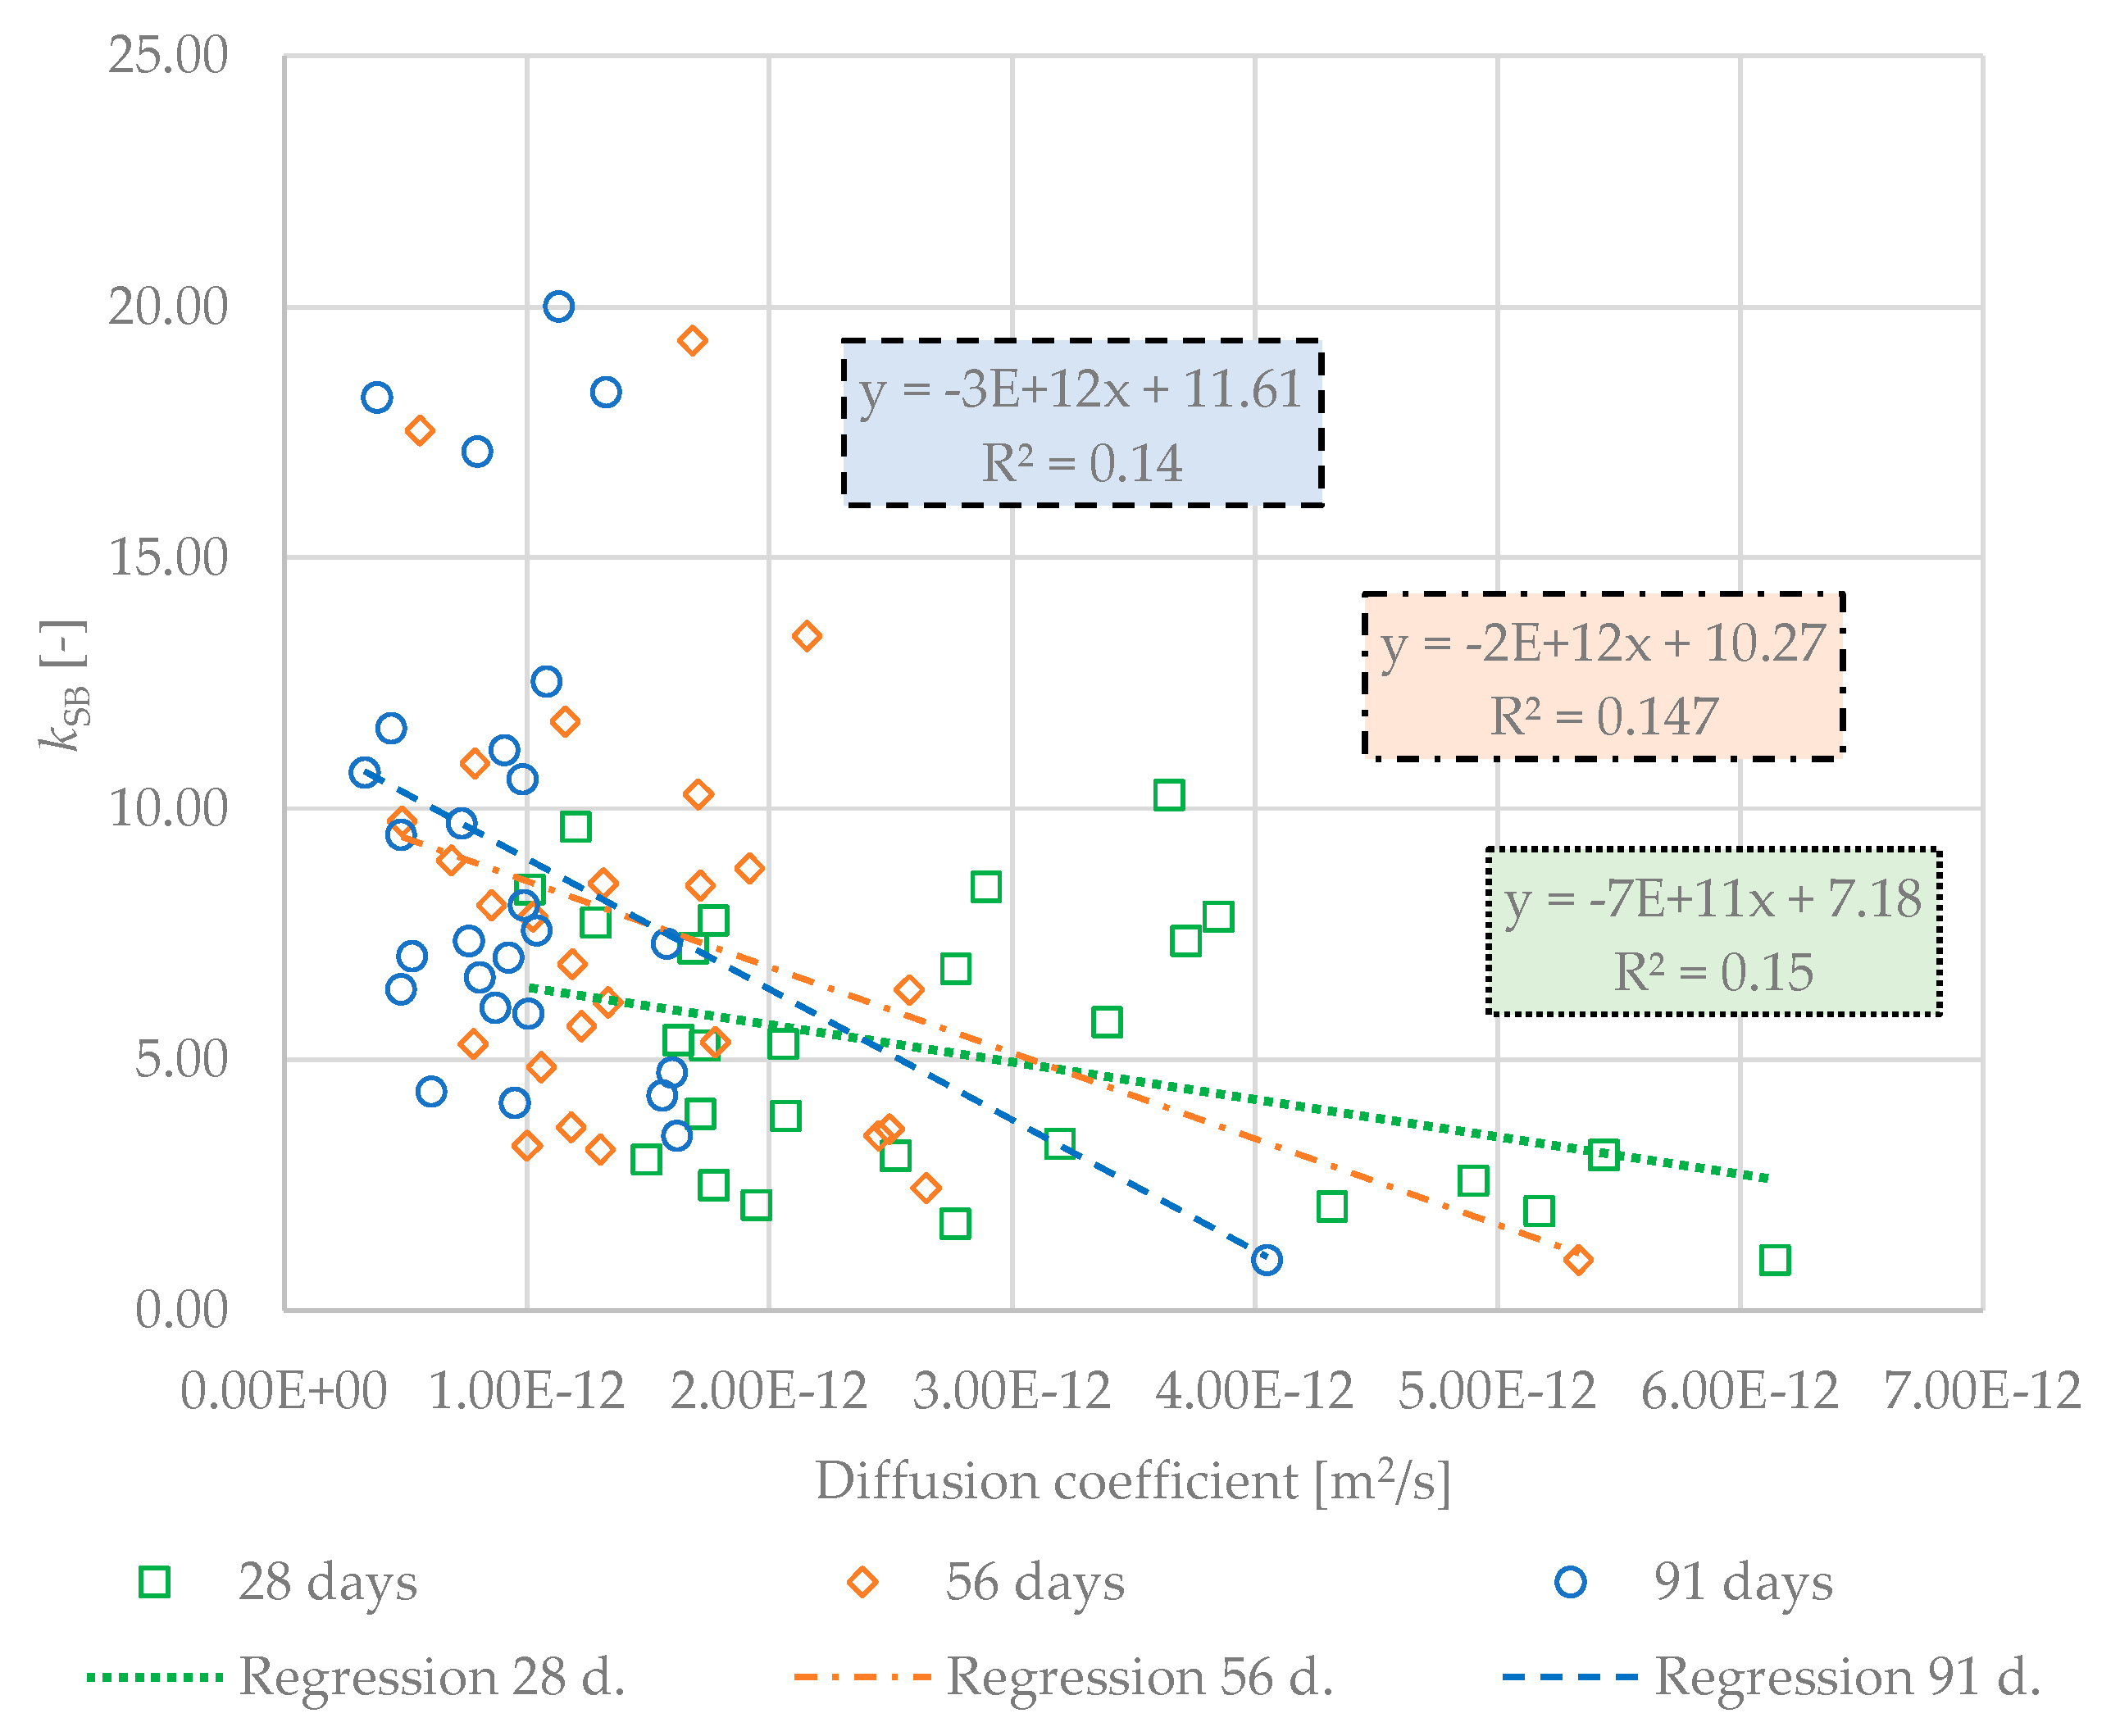
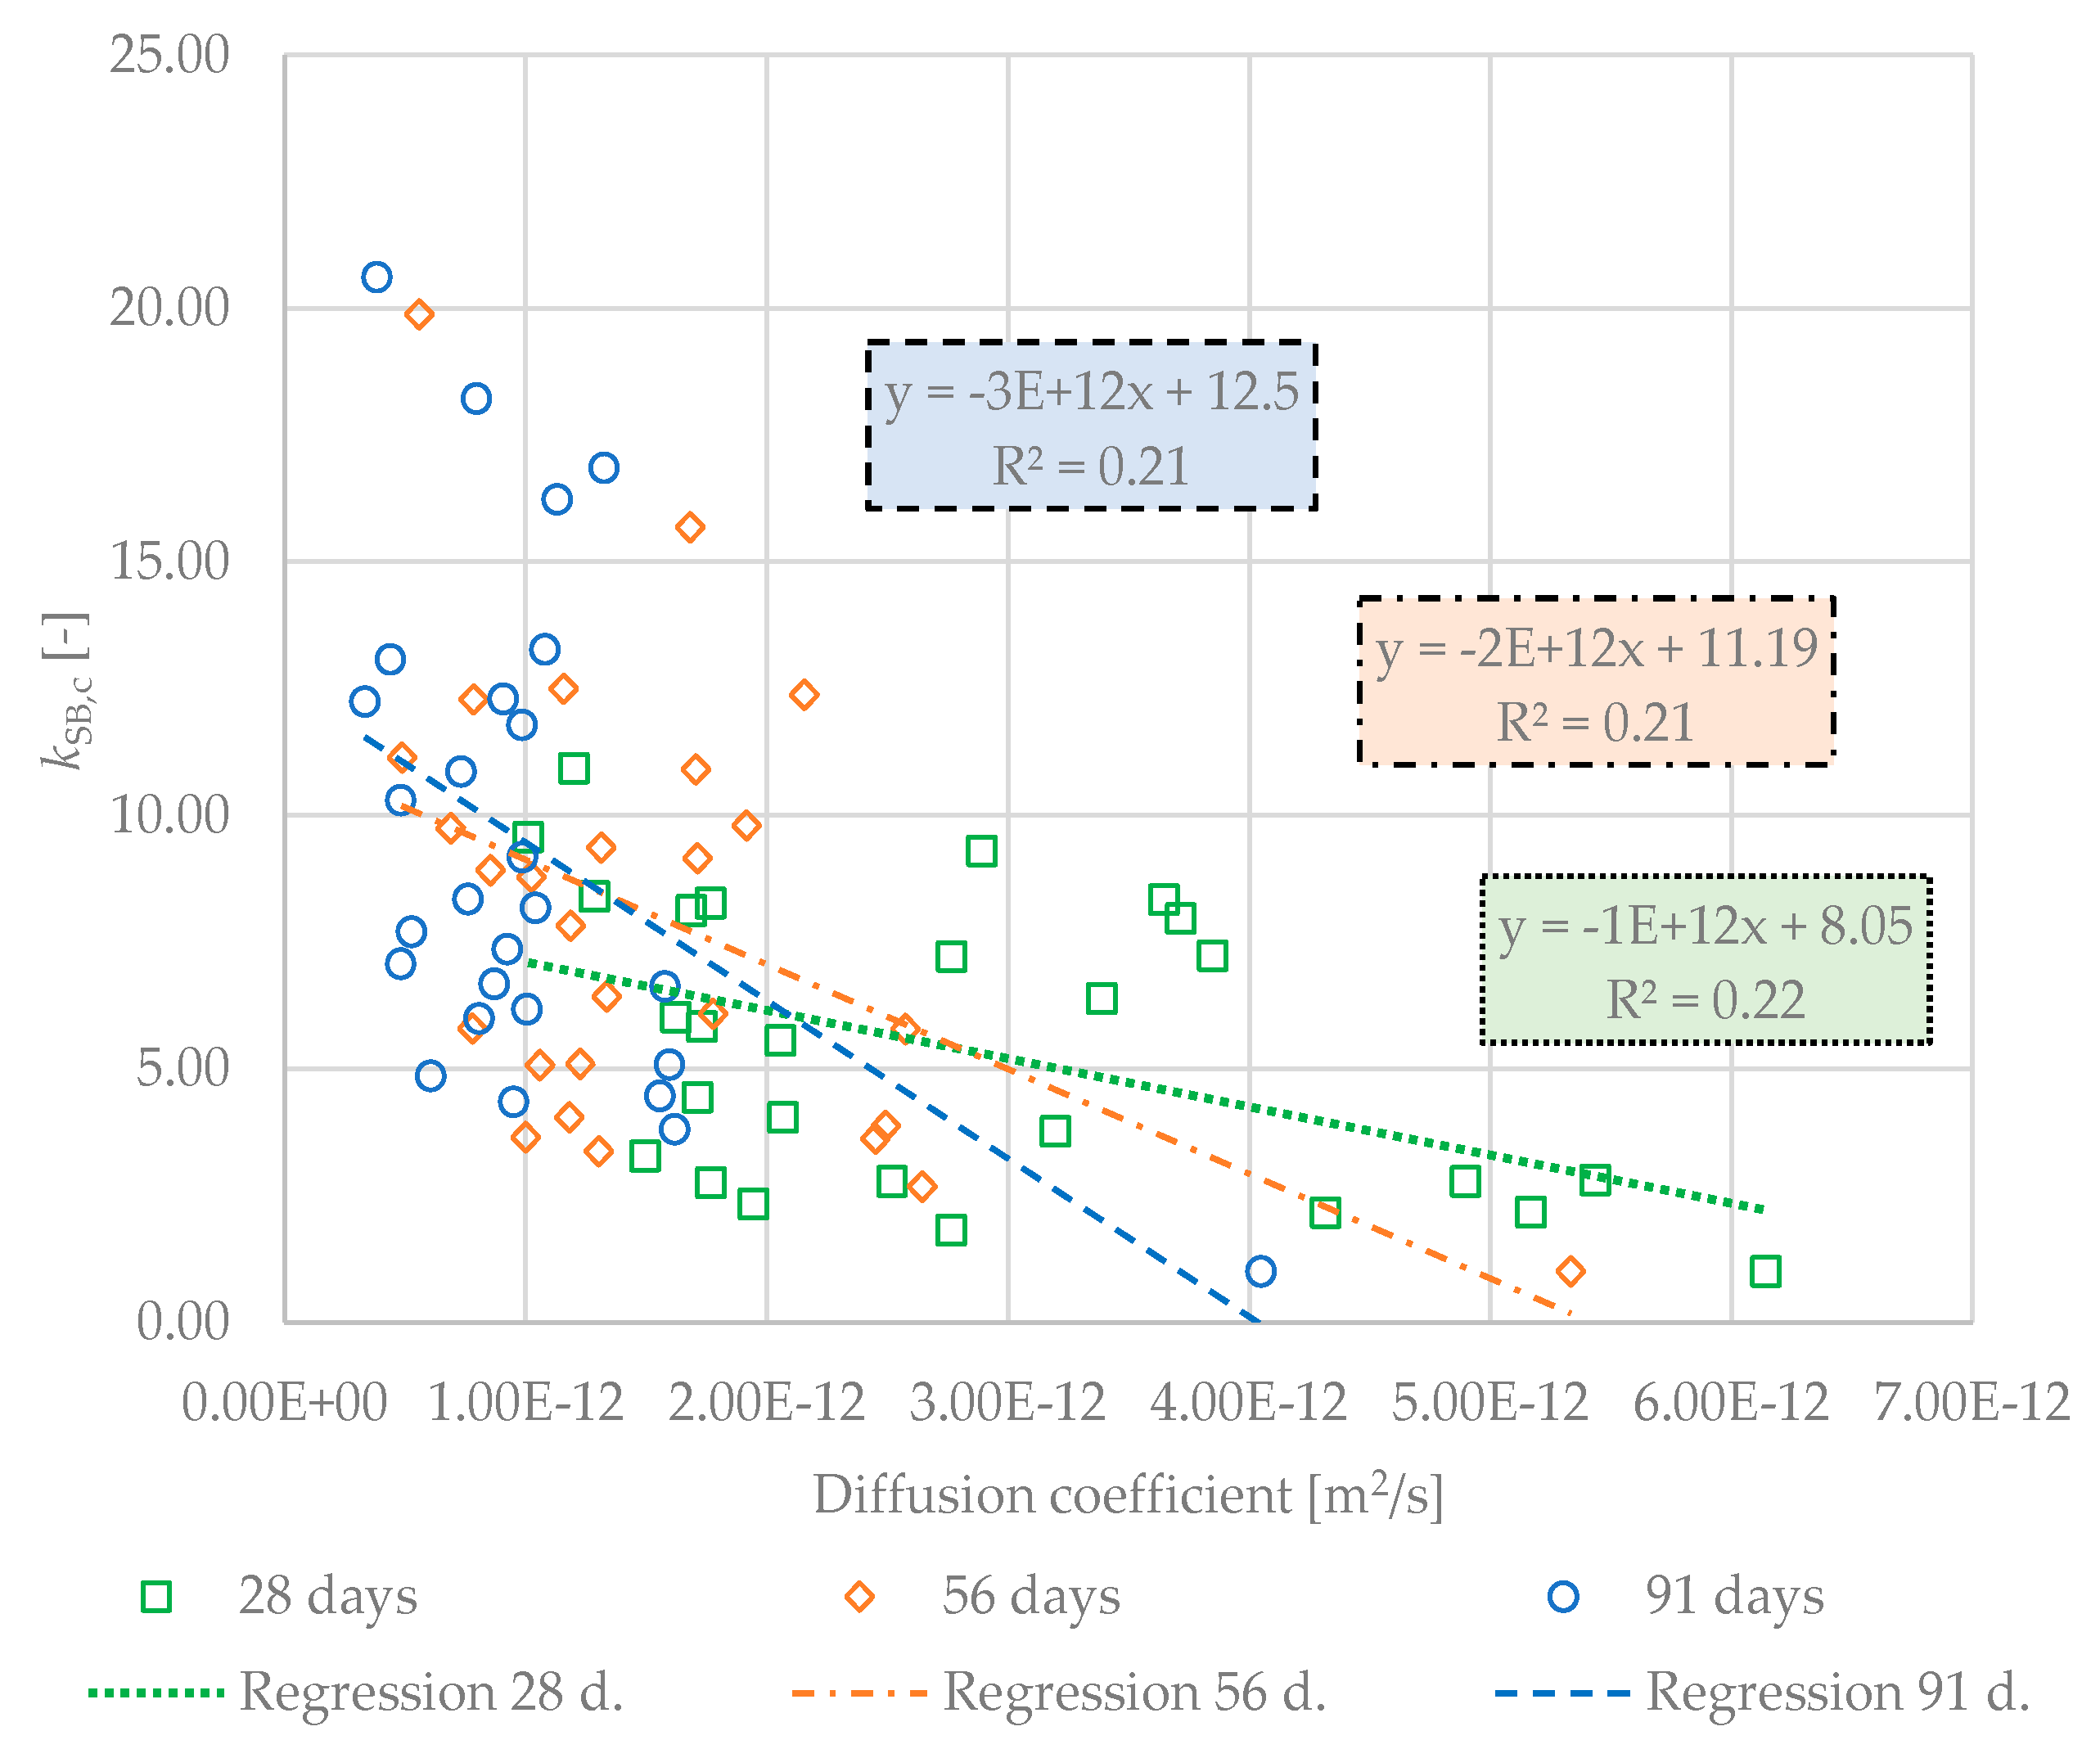
3.4. Correlation between Sustainability Indicators and Diffusion Coefficient

Similarly, correlations were examined to evaluate the hypothesis that the sustainability indicators may suggest a significantly different order of the investigated concrete mixtures compared to the diffusion parameter. This diffusion parameter was used to calculate the resistance of concrete to chloride ions in connection with corrosion of reinforcement (see Figure 9 and Figure 10).
Although the correlation parameter was higher in the results than in the comparison with the strength, it is evident that there was no linear relationship between the diffusion coefficient and the sustainability indicators.

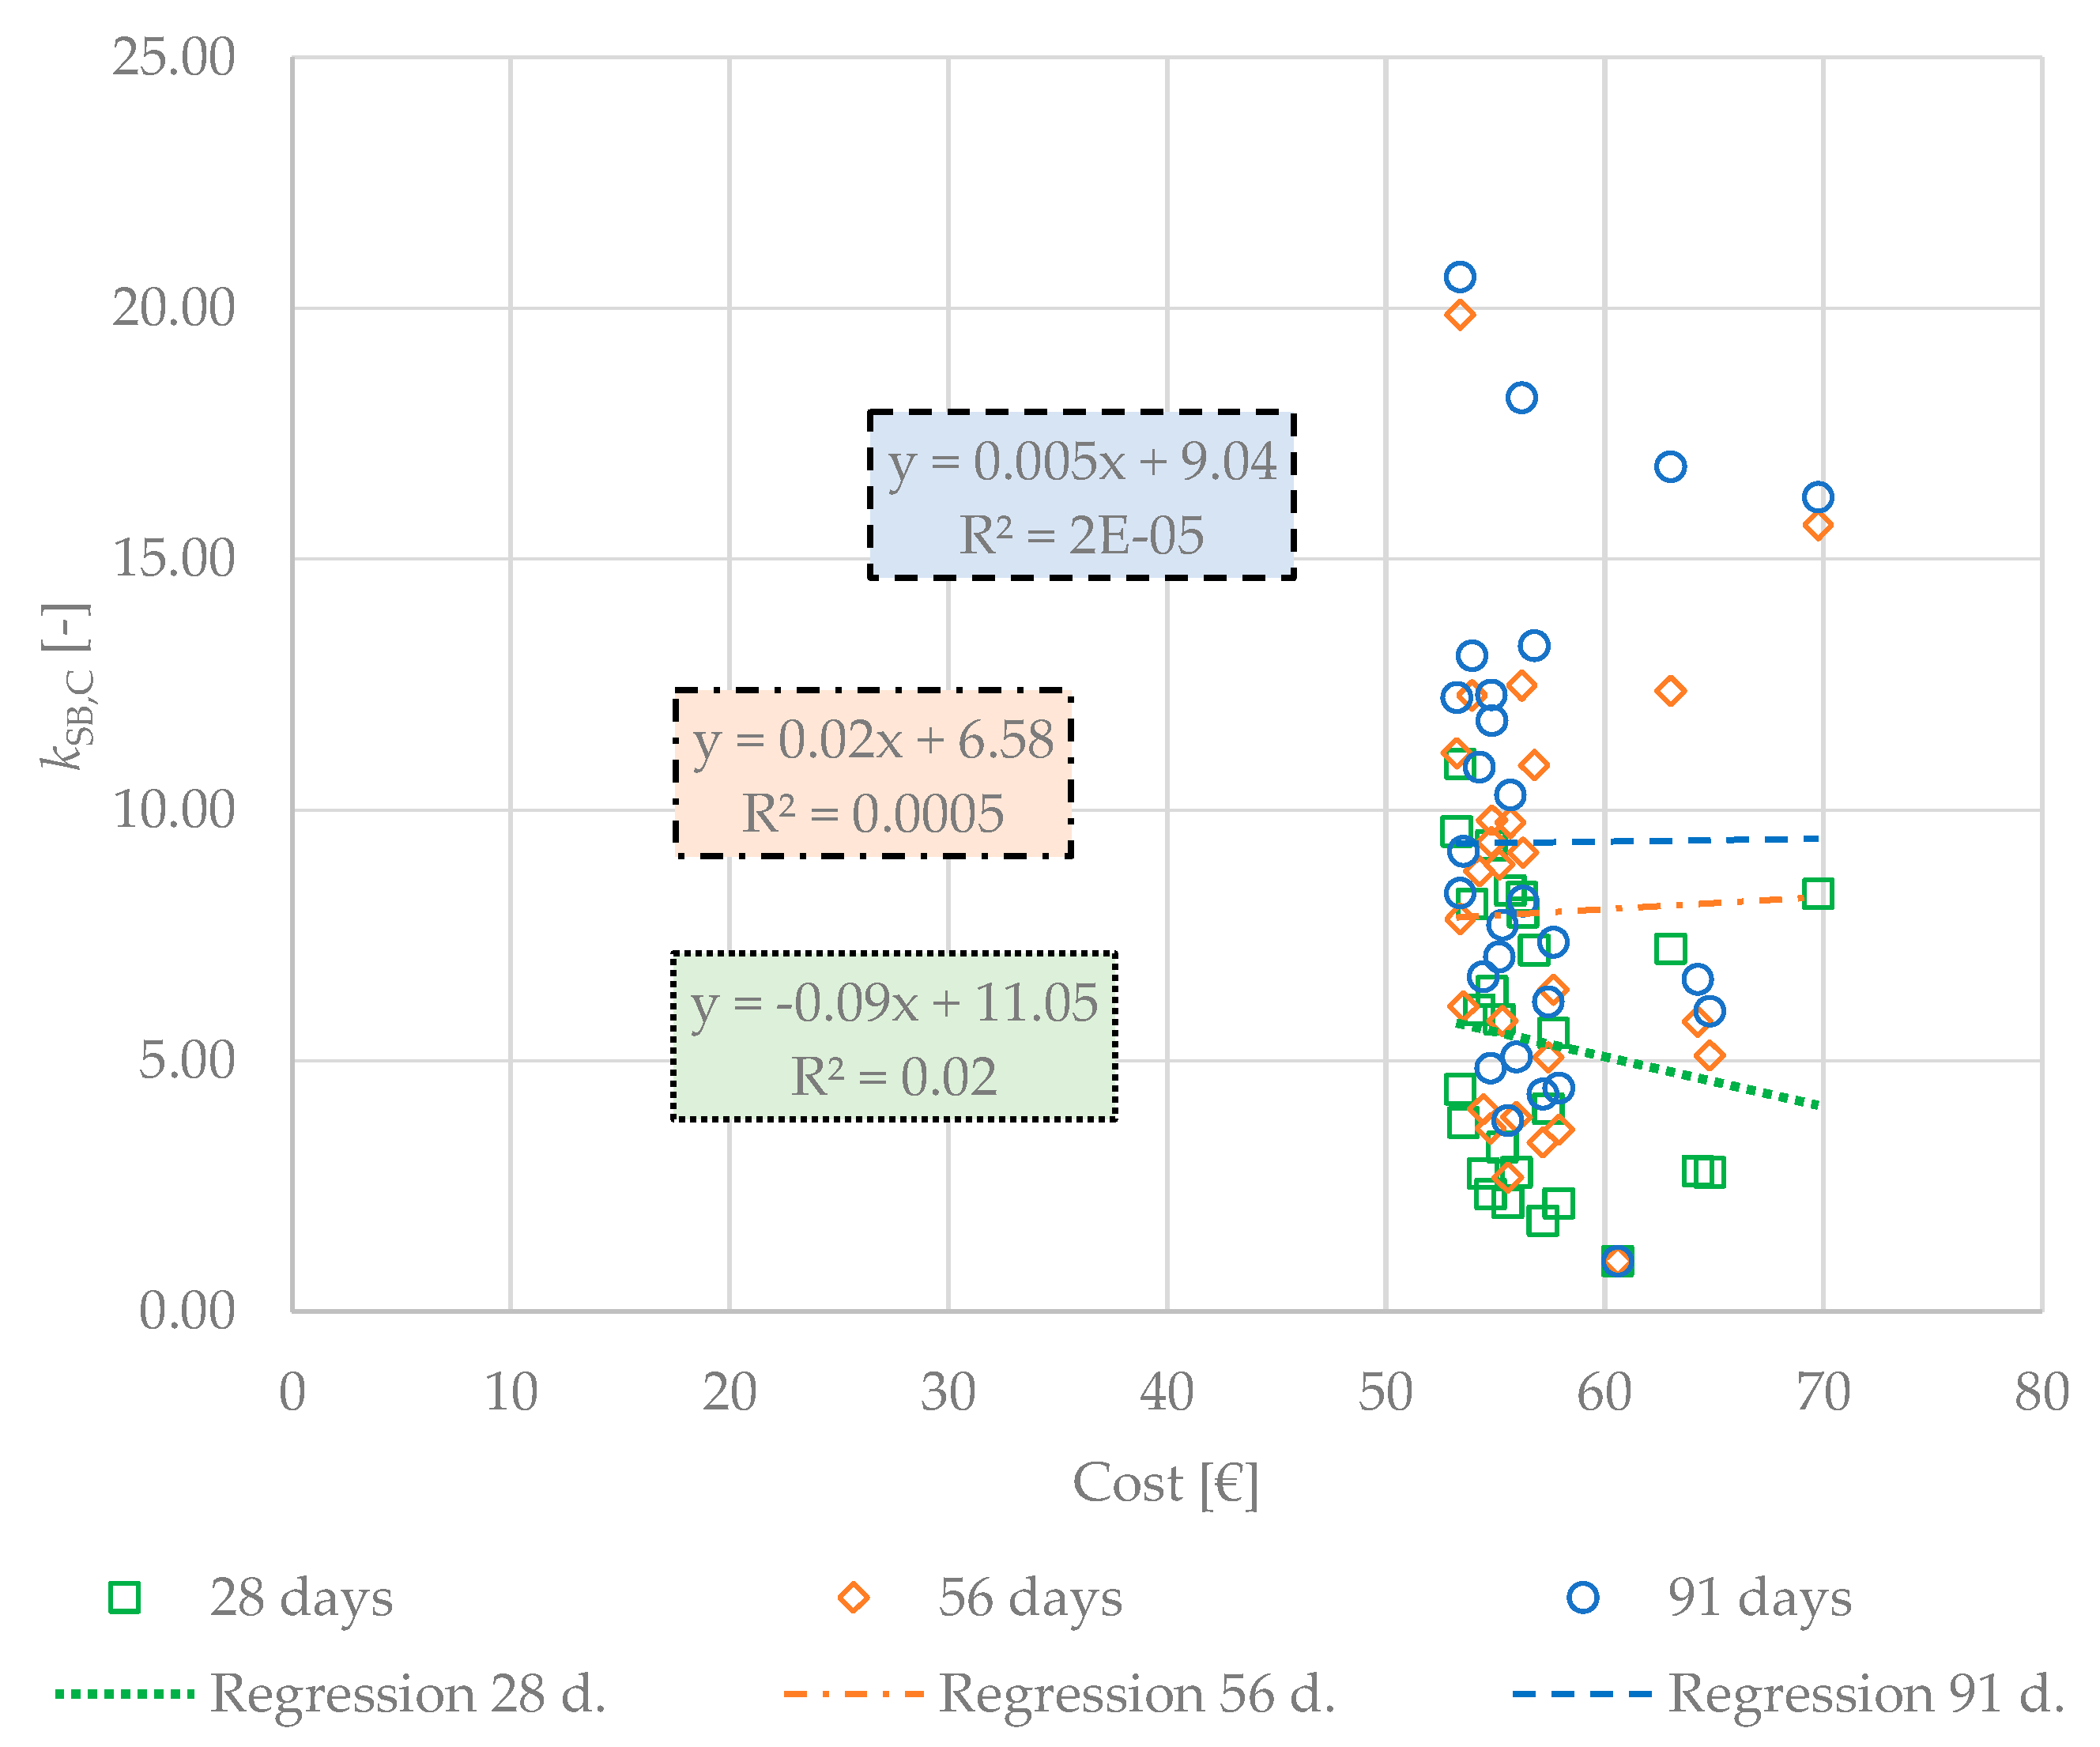
3.5. Correlation between Sustainability Indicator and Costs

Finally, the relationship between cost and the sustainability indicator kSB,C was studied. There was a need to prove that the cost is not the factor that will affect the most this second indicator. It can be observed from Figure 11 that the correlation coefficient was very low, and the variance of the data showed that there was no direct linear relationship.

4. Discussion

The presented results of rank of 27 pumice-based HPC mixtures can be compared with those of other concrete mixtures. In a previous study [36], an analysis based on the same procedure was presented, with the reference concrete having the same composition and being prepared in the same laboratory investigation. It should be noted that this was a new reference concrete mixture, but the differences in performance, durability, cost, and eco-cost were negligible. Therefore, it is possible to compare the results of both studies. In this previous study [36], other concrete mixtures with different SCMs were also analyzed, and the maximum values of kSB and kSB,C were 4.01 and 3.72 at 91 days. In contrast, significantly higher values were observed for the pumice (VPP) mixtures in this study (maximum 20.01 and 20.62). The strength of the concretes (91 days) in the previous study [36] ranged from 36 MPa to 55 MPa, and the pumice mixtures studied here had a strength from 40 MPa to 59 MPa (91 days).
Even though the performance of the pumice mixtures was similar, the ecological aspects are dominant; therefore, the sustainability indicator for volcanic mixtures was significantly higher. Moreover, the remarkable performance in relation to ecological aspects, a reasonable price, and a good performance of Pumice-based mixtures compared to other SCMs previously studied [36] indicate the possibilities to use the kSB and kSB,C sustainability indexes to quantify the level of sustainability, which is essential if sustainability is to be dealt with in engineering operations.

5. Conclusions

The methodology for evaluating the sustainability of concrete described and applied in this study provided a rank for the studied group of concretes. The effects of durability, material mechanical properties, and ecological and economic aspects were included. The analysis brought the following major conclusions:
  • The sustainability assessment of volcanic pumice concrete mixture indicated that VPP is a suitable SCM for civil engineering infrastructures, considering eco-friendly aspects. The mixture containing 65% of Portland Cement Type II–V, 10% of Silica fume, and 25% of Volcanic Pumice Pozzolan showed the best values in terms of sustainability, without considering cost.
  • The highest value, considering cost, was assigned to the mixture containing 55% of Portland Cement Type II–V, 20% of Class F fly Ash, and 25% of Volcanic Pumice Pozzolan.
  • The pumice mixtures significantly over performed other SCM-based mixtures on the basis of the evaluated sustainability indicator.
  • The rank of the mixtures was different at different concrete maturity, but the trend was very similar.
  • There was no correlation of strength and the diffusion parameter with sustainability indicators.
  • The present study shows that the kSB and kSB,C sustainability indexes are suitable for quantifying the level of sustainability. Therefore, this study might help the industry to tackle sustainability issues in civil engineering in a rather simple way.
It should be added that the advantage of this procedure is the possibility to consider the various degradation effects, or their combinations, of concrete mixtures containing different SCMs, either with the use of mathematical modelling of service life or with the help of experimental measurements on specific samples. This is an evaluation of the material, which can be used especially at the beginning of the process of designing a concrete structure, when, among other variables, the type of concrete is chosen. At the same time, the sustainability indicator can be viewed as an evaluation tool that can help to choose materials with regard to the issue of carbon footprint.

Author Contributions

Conceptualization, P.L. and P.K.; methodology, B.T. and P.G.; validation, K.H., P.L. and P.K.; formal analysis, K.H.; investigation, P.G.; resources, K.H.; data curation, B.T.; writing—original draft preparation, P.L.; writing—review and editing, P.K., K.H., B.T., and P.G.; visualization, P.L.; supervision, B.T.; project administration, P.K.; funding acquisition, K.H. All authors have read and agreed to the published version of the manuscript.

Funding

Financial support from VŠB-Technical University of Ostrava by means of the Czech Ministry of Education, Youth, and Sports through the Institutional support for the conceptual development of science, research, and innovation for the year 2021 is gratefully acknowledged.

Acknowledgments

Financial support from VŠB-Technical University of Ostrava by means of the Czech Ministry of Education, Youth, and Sports through the Institutional support for the conceptual development of science, research, and innovation for the year 2021 is gratefully acknowledged.

Conflicts of Interest

The authors declare no conflict of interest.

References

  1. Angst, U.M. Challenges and opportunities in corrosion of steel in concrete. Mater. Struct. 2018, 51, 4. [Google Scholar] [CrossRef] [Green Version]
  2. Durastanti, C.; Moretti, L. Environmental Impacts of Cement Production: A Statistical Analysis. Appl. Sci. 2020, 10, 8212. [Google Scholar] [CrossRef]
  3. Katzer, J.; Domski, J. Quality and mechanical properties of engineered steel fibres used as reinforcement for concrete. Constr. Build. Mater. 2012, 34, 243–248. [Google Scholar] [CrossRef]
  4. Horňáková, M.; Lehner, P. Relationship of surface and bulk resistivity in the case of mechanically damaged fibre reinforced red ceramic waste aggregate concrete. Materials 2020, 13, 5501. [Google Scholar] [CrossRef]
  5. Lloyd, N.A.; Rangan, B.V. Geopolymer concrete: A review of development and opportunities. In Proceedings of the 35th Conference on Our World in Concrete and Structures, Singapore Concrete Institute, Singapore, 25–27 August 2010; pp. 25–27. [Google Scholar]
  6. Silva, R.V.; De Brito, J.; Dhir, R.K. Properties and composition of recycled aggregates from construction and demolition waste suitable for concrete production. Constr. Build. Mater. 2014, 65, 201–217. [Google Scholar] [CrossRef]
  7. Purnell, P. Material nature versus structural nurture: The embodied carbon of fundamental structural elements. Environ. Sci. Technol. 2012, 46, 454–461. [Google Scholar] [CrossRef]
  8. Damineli, B.L.; Kemeid, F.M.; Aguiar, P.S.; John, V.M. Measuring the eco-efficiency of cement use. Cem. Concr. Compos. 2010, 32, 555–562. [Google Scholar] [CrossRef]
  9. Barker, D.J.; Turner, S.A.; Napier-Moore, P.A.; Clark, M.; Davison, J.E. CO2 Capture in the Cement Industry. Energy Procedia 2009, 1, 87–94. [Google Scholar] [CrossRef] [Green Version]
  10. Benhelal, E.; Zahedi, G.; Shamsaei, E.; Bahadori, A. Global strategies and potentials to curb CO2 emissions in cement industry. J. Clean. Prod. 2013, 51, 142–161. [Google Scholar] [CrossRef]
  11. Lippiatt, N.; Ling, T.-C.; Pan, S.-Y. Towards carbon-neutral construction materials: Carbonation of cement-based materials and the future perspective. J. Build. Eng. 2020, 28, 101062. [Google Scholar] [CrossRef]
  12. de Brito, J.; Kurda, R. The past and future of sustainable concrete: A critical review and new strategies on cement-based materials. J. Clean. Prod. 2021, 281, 123558. [Google Scholar] [CrossRef]
  13. Zhao, H.; Sun, W.; Wu, X.; Gao, B. The properties of the self-compacting concrete with fly ash and ground granulated blast furnace slag mineral admixtures. J. Clean. Prod. 2015, 95, 66–74. [Google Scholar] [CrossRef]
  14. Zhang, Z.; Provis, J.L.; Zou, J.; Reid, A.; Wang, H. Toward an indexing approach to evaluate fly ashes for geopolymer manufacture. Cem. Concr. Res. 2016, 85, 163–173. [Google Scholar] [CrossRef]
  15. Younsi, A.; Turcry, P.; Rozière, E.; Aït-Mokhtar, A.; Loukili, A. Performance-based design and carbonation of concrete with high fly ash content. Cem. Concr. Compos. 2011, 33, 993–1000. [Google Scholar] [CrossRef] [Green Version]
  16. Sujjavanich, S.; Suwanvitaya, P.; Chaysuwan, D.; Heness, G. Synergistic effect of metakaolin and fly ash on properties of concrete. Constr. Build. Mater. 2017, 155, 830–837. [Google Scholar] [CrossRef]
  17. Ghosh, P.; Tran, Q. Correlation Between Bulk and Surface Resistivity of Concrete. Int. J. Concr. Struct. Mater. 2015, 9, 119–132. [Google Scholar] [CrossRef]
  18. Lehner, P.; Konečný, P.; Ponikiewski, T. Comparison of material properties of scc concrete with steel fibres related to ingress of chlorides. Crystals 2020, 10, 220. [Google Scholar] [CrossRef] [Green Version]
  19. Millar, S.; Wilsch, G.; Eichler, T.; Gottlieb, C.; Wiggenhauser, H. Laser Induced Breakdown Spectroscopy (LIBS) in civil engineering—Innovative analysis of building materials [Laser Induced Breakdown Spectroscopy (LIBS) im Bauwesen—Automatisierte Baustoffanalyse]. Beton-und Stahlbetonbau 2015, 110, 501–510. [Google Scholar] [CrossRef]
  20. Nguyen, P.T.; Bastidas-Arteaga, E.; Amiri, O.; El Soueidy, C.P. An Efficient Chloride Ingress Model for Long-Term Lifetime Assessment of Reinforced Concrete Structures Under Realistic Climate and Exposure Conditions. Int. J. Concr. Struct. Mater. 2017, 11, 199–213. [Google Scholar] [CrossRef]
  21. Hossain, K.M.A.; Lachemi, M. Performance of volcanic ash and pumice based blended cement concrete in mixed sulfate environment. Cem. Concr. Res. 2006, 36, 1123–1133. [Google Scholar] [CrossRef]
  22. Anwar Hossain, K.M. Properties of volcanic pumice based cement and lightweight concrete. Cem. Concr. Res. 2004, 34, 283–291. [Google Scholar] [CrossRef]
  23. Ulusu, H.; Aruntas, H.Y.; Gencel, O. Investigation on characteristics of blended cements containing pumice. Constr. Build. Mater. 2016, 118, 11–19. [Google Scholar] [CrossRef]
  24. Nozahic, V.; Amziane, S.; Torrent, G.; Saïdi, K.; De Baynast, H. Design of green concrete made of plant-derived aggregates and a pumice–lime binder. Cem. Concr. Compos. 2012, 34, 231–241. [Google Scholar] [CrossRef]
  25. Yadollahi, M.M.; Benli, A.; Demirboğa, R. The effects of silica modulus and aging on compressive strength of pumice-based geopolymer composites. Constr. Build. Mater. 2015, 94, 767–774. [Google Scholar] [CrossRef]
  26. Tran, Q.; Ghosh, P. Influence of pumice on mechanical properties and durability of high performance concrete. Constr. Build. Mater. 2020, 249, 118741. [Google Scholar] [CrossRef]
  27. Biondini, F.; Frangopol, D.M. Probabilistic limit analysis and lifetime prediction of concrete structures. Struct. Infrastruct. Eng. 2008, 4, 399–412. [Google Scholar] [CrossRef]
  28. Teplý, B.; Podroužek, J. Service life, reliability and their role in the life cycle analysis of concrete structures. Adv. Environ. Res. 2017, 55, 47–63. [Google Scholar]
  29. Kumar, R.; Gardoni, P.; Sanchez-Silva, M. Effect of cumulative seismic damage and corrosion on the life-cycle cost of reinforced concrete bridges. Earthq. Eng. Struct. Dyn. 2009. [Google Scholar] [CrossRef] [Green Version]
  30. Martín-Pérez, B.; Zibara, H.; Hooton, R.; Thomas, M.D. A study of the effect of chloride binding on service life predictions. Cem. Concr. Res. 2000, 30, 1215–1223. [Google Scholar] [CrossRef]
  31. Matthews, S. fib Model Code 2020—A new development in structural codes. Struct. Concr. 2017, 651–652. [Google Scholar] [CrossRef] [Green Version]
  32. Kloepffer, W. Life cycle sustainability assessment of products. Int. J. Life Cycle Assess. 2008, 13, 89–95. [Google Scholar] [CrossRef]
  33. Hrabova, K.; Teply, B.; Vymazal, T. Sustainability assessment of concrete mixes. IOP Conf. Ser. Earth Environ. Sci. 2020, 444, 012021. [Google Scholar] [CrossRef]
  34. Teplý, B.; Rovnaníková, P.; Vymazal, T. Sustainability Quantification of Concrete Structures. In Advances in Environmental Research; NOVA Science Publishers: New York, NY, USA, 2018; ISBN 978-1-53613-918-1. [Google Scholar]
  35. Müller, H.S. Sustainable structural concrete—From today’s approach to future challenge. Struct. Concr. 2013, 14, 299–300. [Google Scholar] [CrossRef]
  36. Konečný, P.; Ghosh, P.; Hrabová, K.; Lehner, P.; Teplý, B. Effective methodology of sustainability assessment of concrete mixtures. Mater. Struct. Constr. 2020, 53. [Google Scholar] [CrossRef]
  37. Opon, J.; Henry, M. An indicator framework for quantifying the sustainability of concrete materials from the perspectives of global sustainable development. J. Clean. Prod. 2019, 218, 718–737. [Google Scholar] [CrossRef]
  38. ACI Committee 318. Building Code Requirements for Structural Concrete: (ACI 318-95); and Commentary (ACI 318R-95); American Concrete Institute: Farmington Hills, MI, USA, 1995. [Google Scholar]
  39. Matthews, S. Fib Model Code 2020. Struct. Concr. 2019, 20, 860–866. [Google Scholar] [CrossRef]
  40. De Schepper, M.; Van den Heede, P.; Van Driessche, I.; De Belie, N. Life Cycle Assessment of Completely Recyclable Concrete. Materials 2014, 7, 6010–6027. [Google Scholar] [CrossRef] [Green Version]
  41. Chappex, T.; Scrivener, K. Alkali fixation of C-S-H in blended cement pastes and its relation to alkali silica reaction. Cem. Concr. Res. 2012. [Google Scholar] [CrossRef]
  42. ASTM C1202 Standard Test Method for Electrical Indication of Concrete’s Ability to Resist Chloride Ion Penetration. Am. Soc. Test. Mater. 2012, 1–8. [CrossRef]
  43. Paredes, M.; Jackson, N.M.; El Safty, A.; Dryden, J.; Joson, J.; Lerma, H.; Hersey, J. Precision Statements for the Surface Resistivity of Water Cured Concrete Cylinders in the Laboratory. Adv. Civ. Eng. Mater. 2012, 1, 1–23. [Google Scholar] [CrossRef]
  44. Lu, X. Application of the Nernst-Einstein equation to concrete. Cem. Concr. Res. 1997, 27, 293–302. [Google Scholar] [CrossRef]
  45. Eco Costs Data Design-4-Sustainability: Inspiration and Knowledge by Designers for Designers. Available online: http://www.design-4-sustainability.com/ecocosts (accessed on 1 January 2021).
  46. The Model of the Eco-Costs/Value Ratio (EVR). Available online: http://www.ecocostsvalue.com/ (accessed on 1 January 2021).
  47. Vymazal, T.; Teply, B.; Hrabova, K. The assessment and prediction of concrete sustainability. IOP Conf. Ser. Mater. Sci. Eng. 2019, 583, 012035. [Google Scholar] [CrossRef]
Figure 1. Composition of the cementitious materials of concrete mixtures.
Applsci 11 04964 g001
Figure 2. Sustainability indicators and rank of concrete mixtures 28 days after concreting (indicator value/rank).
Applsci 11 04964 g002
Figure 3. Sustainability indicators and rank of concrete mixtures 56 days after concreting (indicator value/rank).
Applsci 11 04964 g003
Figure 4. Sustainability indicators and rank of concrete mixtures 91 days after concreting (indicator value/rank).
Applsci 11 04964 g004
Figure 5. Correlation of kSB and kSB,C for all concrete mixtures.
Applsci 11 04964 g005
Figure 6. Correlation of kSB at different times: (a) 28 days vs. 56 days, (b) 28 days vs. 91 days, (c) 56 days vs. 91 days.
Applsci 11 04964 g006
Figure 7. Correlation of kSB and compressive strength for all concrete mixtures.
Applsci 11 04964 g007
Figure 8. Correlation of kSB,C and compressive strength for all concrete mixtures at all studied times.
Applsci 11 04964 g008
Figure 9. Correlation of kSB and the diffusion coefficient for all concrete mixtures.
Applsci 11 04964 g009
Figure 10. Correlation of kSB,C and the diffusion coefficient for all concrete mixtures.
Applsci 11 04964 g010
Figure 11. Correlation between kSB,C and cost for all concrete mixtures.
Applsci 11 04964 g011
Table 1. Chemical composition of cementitious materials [26].
Chemical [%]Cement Type II/VClass C Fly AshClass F Fly AshSlag G120Silica FumeMetakaolinPumice
SiO221.2034.0245.0536.8197.9051.9587.40
Al2O33.9018.2023.719.660.1844.2710.52
Fe2O33.506.5916.430.610.070.410.174
MgO2.105.060.8810.030.210.050.126
CaO2.702.700.68-0.170.02-
Na2O + K2O63.1027.183.7836.770.420.06-
MnO0.541.912.260.660.710.30-
ZnO----0.03--
SiO2----0.08--
SrO---1.10---
Cl---0.05---
Fe2O4----0.09-0.194
Na------0.128
K------0.099
Ca------0.090
TiO2------0.0074
SO4------0.0041
H2O 1.110
Table 2. Diffusion coefficient Dc, compressive strength, eco-cost, and cost for all concrete mixtures.
Mix IDDc
(28 Days) ×10−12 [m2/s]
Dc
(56 Days) ×10−12 [m2/s]
Dc
(91 Days) ×10−12 [m2/s]
Strength
(28 Days)
[MPa]
Strength
(56 Days)
[MPa]
Strength
(91 Days)
[MPa]
Eco-Costs
[€/m3]
Costs
[€/m3]
100TII–V6.145.334.0527.0834.7036.7651.6660.59
85TII-V/15P4.902.491.6039.5849.8154.9245.8257.91
80TII-V/20P5.442.571.5834.9645.4550.0243.8557.19
75TII-V/25P3.852.151.3335.4440.8946.0541.8955.97
70TII-V/15F/15P4.322.451.5631.6032.5441.1643.4455.57
50TII-V/35G120/15P2.061.330.9237.4341.4545.8240.3757.65
45TII-V/35G120/20P2.771.711.0834.9239.8142.8938.457.42
65TII-V/15F/20P3.721.711.0439.3547.2753.2841.4755.33
60TII-V/15F/25P3.391.920.9828.2634.6341.0039.5154.44
60TII-V/25C/15P5.172.641.6237.8144.6650.6741.0154.77
55TII-V/25C/20P3.201.780.9935.1646.5354.4439.0553.55
80TII-V/5SF/15P2.761.300.9532.3141.1849.2143.9164.81
75TII-V/5SF/20P2.891.310.9132.3944.8049.3741.9564.25
78TII-V/7M/15P1.771.180.8748.6555.1050.5543.9156.26
73TII-V/7M/20P1.771.160.8048.7254.6355.3441.9455.7
68TII-V/7M/25P1.711.190.7649.1150.6659.4539.9854.81
50TII-V/30G120S/20P1.951.000.6144.0550.5052.0639.1856.78
45TII-V/30G120S/25P1.730.850.4842.4946.7453.5437.2256.21
70TII-V/5SF/25P1.690.790.4445.6553.7557.1939.9963.03
65TII-V/10M/25P1.621.020.7345.2448.9953.7239.1653.23
65TII-V/10SF/25P1.200.560.3841.1553.0452.6038.0869.76
65TII-V/20F/15P1.490.780.5331.1136.7841.6042.6454.84
60TII-V/20F/20P1.280.690.4832.0038.3439.7740.6853.95
55TII-V/20F/25P1.010.490.3332.0241.3740.9138.7253.39
65TII-V/20C/15P2.071.061.0138.9645.0447.3641.9755.17
60TII-V/20C/20P2.521.230.8146.0648.2654.7940.0154.28
55TII-V/20C/25P3.651.681.1346.1255.3655.3638.0553.39
Publisher’s Note: MDPI stays neutral with regard to jurisdictional claims in published maps and institutional affiliations.

