Article

Experimental Validation of a Thermo-Electric Model of the Photovoltaic Module under Outdoor Conditions

by
Klemen Sredenšek
1,*,
Bojan Štumberger
1,2,
Miralem Hadžiselimović
1,2,
Sebastijan Seme
1,2 and
Klemen Deželak
1
1
Faculty of Energy Technology, University of Maribor, Hočevarjev trg 1, 8270 Krško, Slovenia
2
Faculty of Electrical Engineering and Computer Science, University of Maribor, Koroška cesta 46, 2000 Maribor, Slovenia
*
Author to whom correspondence should be addressed.
Submission received: 26 April 2021 / Revised: 20 May 2021 / Accepted: 4 June 2021 / Published: 7 June 2021

Abstract

:
An operating temperature of the photovoltaic (PV) module greatly affects performance and its lifetime. Therefore, it is essential to evaluate operating temperature of the photovoltaic module in different weather conditions and how it affects its performance. The primary objective of this paper is to present a dynamic thermo-electric model for determining the temperature and output power of the photovoltaic module. The presented model is validated with field measurement at the Institute of Energy Technology, Faculty of Energy Technology, University of Maribor, Slovenia. The presented model was compared with other models in different weather conditions, such as clear, cloudy and overcast. The evaluation was performed for the operating temperature and output power of the photovoltaic module using Root-Mean-Square-Error (RMSE) and Mean-Absolute-Error (MAE). The average RMSE and MAE values are 1.75 °C and 1.14 °C for the thermal part and 20.34 W and 10.97 W for the electrical part.

1. Introduction

The commercial use of photovoltaic modules dates back to the 1970s and 1980s of the 20th century. Ease of use, maintenance and installation led to mass integration in the early 21st century. The PV systems are classified into grid-connected and off-grid applications according to the type of grid connection [1]. Nowadays, due to self-sufficiency, the off-grid system is a very common way of connection, as it presents a great energy potential in underdeveloped countries or in countries without a well-established electricity network. To facilitate the digital transformation of energy infrastructure, it is also necessary to encourage the development and introduction of smart grids [2,3,4] and microgrids [5]. A crucial factor for PV system integration is also the assessment of energy potential [6] at a specific location, which ranges from 650 to 1500 kWh/kWp for the area of Europe.
Electricity production of PV systems depends on parameters, such as solar radiation, operating temperature of the PV module and air mass factor. Nevertheless, it is extremely important to assess the performance of the PV system in partial shading conditions [7]. The operating temperature of the PV module mainly affects the electrical parameters of the PV cell, such as saturation current, photon current, shunt and series resistance, diode ideality factor, short-circuit current, open-circuit voltage and consequently, the output power of the PV module [8]. An increase in temperature of the PV module by 1 °C results in a 0.45% drop in the output power [9] or a 0.22% drop in efficiency of the PV module [10]. The temperature under standard test conditions (STC) is defined as the operating temperature of the PV module, but only in the PV cell layer. It is very difficult or almost impossible to measure the temperature of the PV cell layer in various outdoor conditions. Therefore, various models have been developed in order to determine the operating temperature of PV cells with help of meteorological and experimental data [11,12,13,14,15]. In addition to meteorological data, operating temperature of the PV module is also influenced by the type of materials and operation PowerPoint at which the PV module operates. The operating temperature of the PV cell is higher than the temperature of the backside or backsheet layer. However, the measurements of the operating temperature of the PV cell are almost impossible to perform under outdoor conditions. Therefore, the temperature sensors and all other measuring equipment should be calibrated in an estimated time to avoid some unnecessary errors. The most common equipment used for meteorological measurements is the platinum resistance thermometer (temperature sensor), anemometer (wind speed and direction sensor) and pyranometer (solar irradiance). Pyranometer [16] and anemometer [17] are some of the most sensible sensors that need to be calibrated in the estimated time (approx. 1–2 years). Otherwise, they can cause measurement uncertainties that increase with age.

1.1. Literature Review of the Existing Studies

Based on a large number of different models for estimating the temperature distribution in the PV module, a comprehensive review of existing studies was performed in this part of the study. Many static and dynamic models have been developed to estimate the temperature distribution in the PV module accurately. Since temperature distribution in the PV module is described differently for many types and designs, Ross [18] provides an overview of design requirements, design analysis and test methods for flat-plate PV modules. At that time, the NOCT model was usually used for temperature assessment of the PV module. Similarly, Faiman [19] presents the flat-plate PV module outdoor operating temperature assessment using a simple modified form of the Hottel-Whillier-Bliss (HWB) equation. Furthermore, Sandia National Laboratories [20] proposed a new empirically-based thermal model for flat-plate PV modules mounted in an open rack. The thermal model consists of temperature calculation of the backsheet layer and PV cell. This model has proven to be adaptable and adequate for flat-plate PV modules with an accuracy of ±5 °C. The results show that the temperature of the PV cell and the temperature of the backsheet layer can differ significantly, especially for different types of PV modules. In their study, Migliorini et al. [21], review two different approaches for determining a physical model of the PV module. The first model consists of a detailed temperature description, while the second electric model, is described by an explicit equation. The second model consists of a detailed electric model for I-V curve prediction, while the NOCT model describes the operating temperature of the PV module. Li et al. [10] propose a comprehensive multi-state dynamic thermal model for temperature estimation of the PV cell. Temperatures are modeled as internal states and are corrected according to the observations, which leads to high accuracy of the proposed model and reliable prediction of PV cells temperature and output power. Barry et al. [22] present a simple dynamic thermal model using non-linear optimization with four parameters. The proposed model reduces RMSE between measured and modeled PV module temperature to 1.58 °C on average. However, it does not consider optical losses and losses due to power generation but uses both global and diffuse solar radiation as an input parameter. In their study, Yu et al. [23], focus on the 2D temperature-irradiance coupling model of the flat-plate photovoltaic/thermal (PV/T) collector, which is very similar to the described model in [21], without the energy balance equation of water flow in copper tubes. This model includes the global and diffuse solar radiation as its input and considers the change of the absorptivity, transmissivity and reflectivity at a specific incident angle, which can be calculated by Snell’s law.

1.2. Aims and Specifics of the Current Research

The originality of the current study lies in the development of a thermo-electric model for the assessment of temperature distribution in PV module. In this paper both, thermal and electric models of the PV module are described with dynamic modeling. The dynamic thermal model is used from [10]. While the dynamic electric model is presented by a double diode PV cell model, including electrical parameters as a function of solar radiation and the operating temperature of the PV module. Modeling of the thermo-electric model of the PV module was performed in Matlab/Simulink software package using the s-function block diagram. Validation of the presented thermo-electric model is based on meteorological and experimental data of the PV system used in this study. By accurately determining the temperature distribution in the PV module, also lifetime of the PV module can be predicted. In addition, two other models for determining the temperature distribution in the PV module and the output power are included. The temperature distribution in the PV module was calculated using the Ansys Transient Thermal software package, and the already confirmed empirical equation [10,24,25,26,27,28,29] was used to calculate the output power of the PV module. In addition to validating the presented dynamic thermo-electric model, the importance of accuracy of measuring devices and optical losses is also included. Various authors [10,12,13,23,30] used constant values of optical losses in their models to determine the temperature distribution of fixed PV modules. Even though, in this paper measurements are performed on a dual-axis tracking system, the optical losses were calculated as a function of an incident angle of the Sun’s rays, which is similar as in the following studies [31,32]).
The paper consists of five sections. The first section provides an introduction and literature review. The second section presents the methodology and measurement site, the third section includes some results of the proposed model and the fourth section presents thediscussion of the results compared to other studies. The last section presents the essential findings or conclusions.

2. Materials and Methods

Our study covers more than 35 scientific papers, published from 1982 to 2021, in which authors deal with different approaches to determine the temperature distribution on the backside of the PV module and/or the output power of the PV module. The first subsection presents the experimental set-up on where the measurements were performed, while the second and third subsections describe the mathematical equations for defining the thermal and electric parts of the PV module.

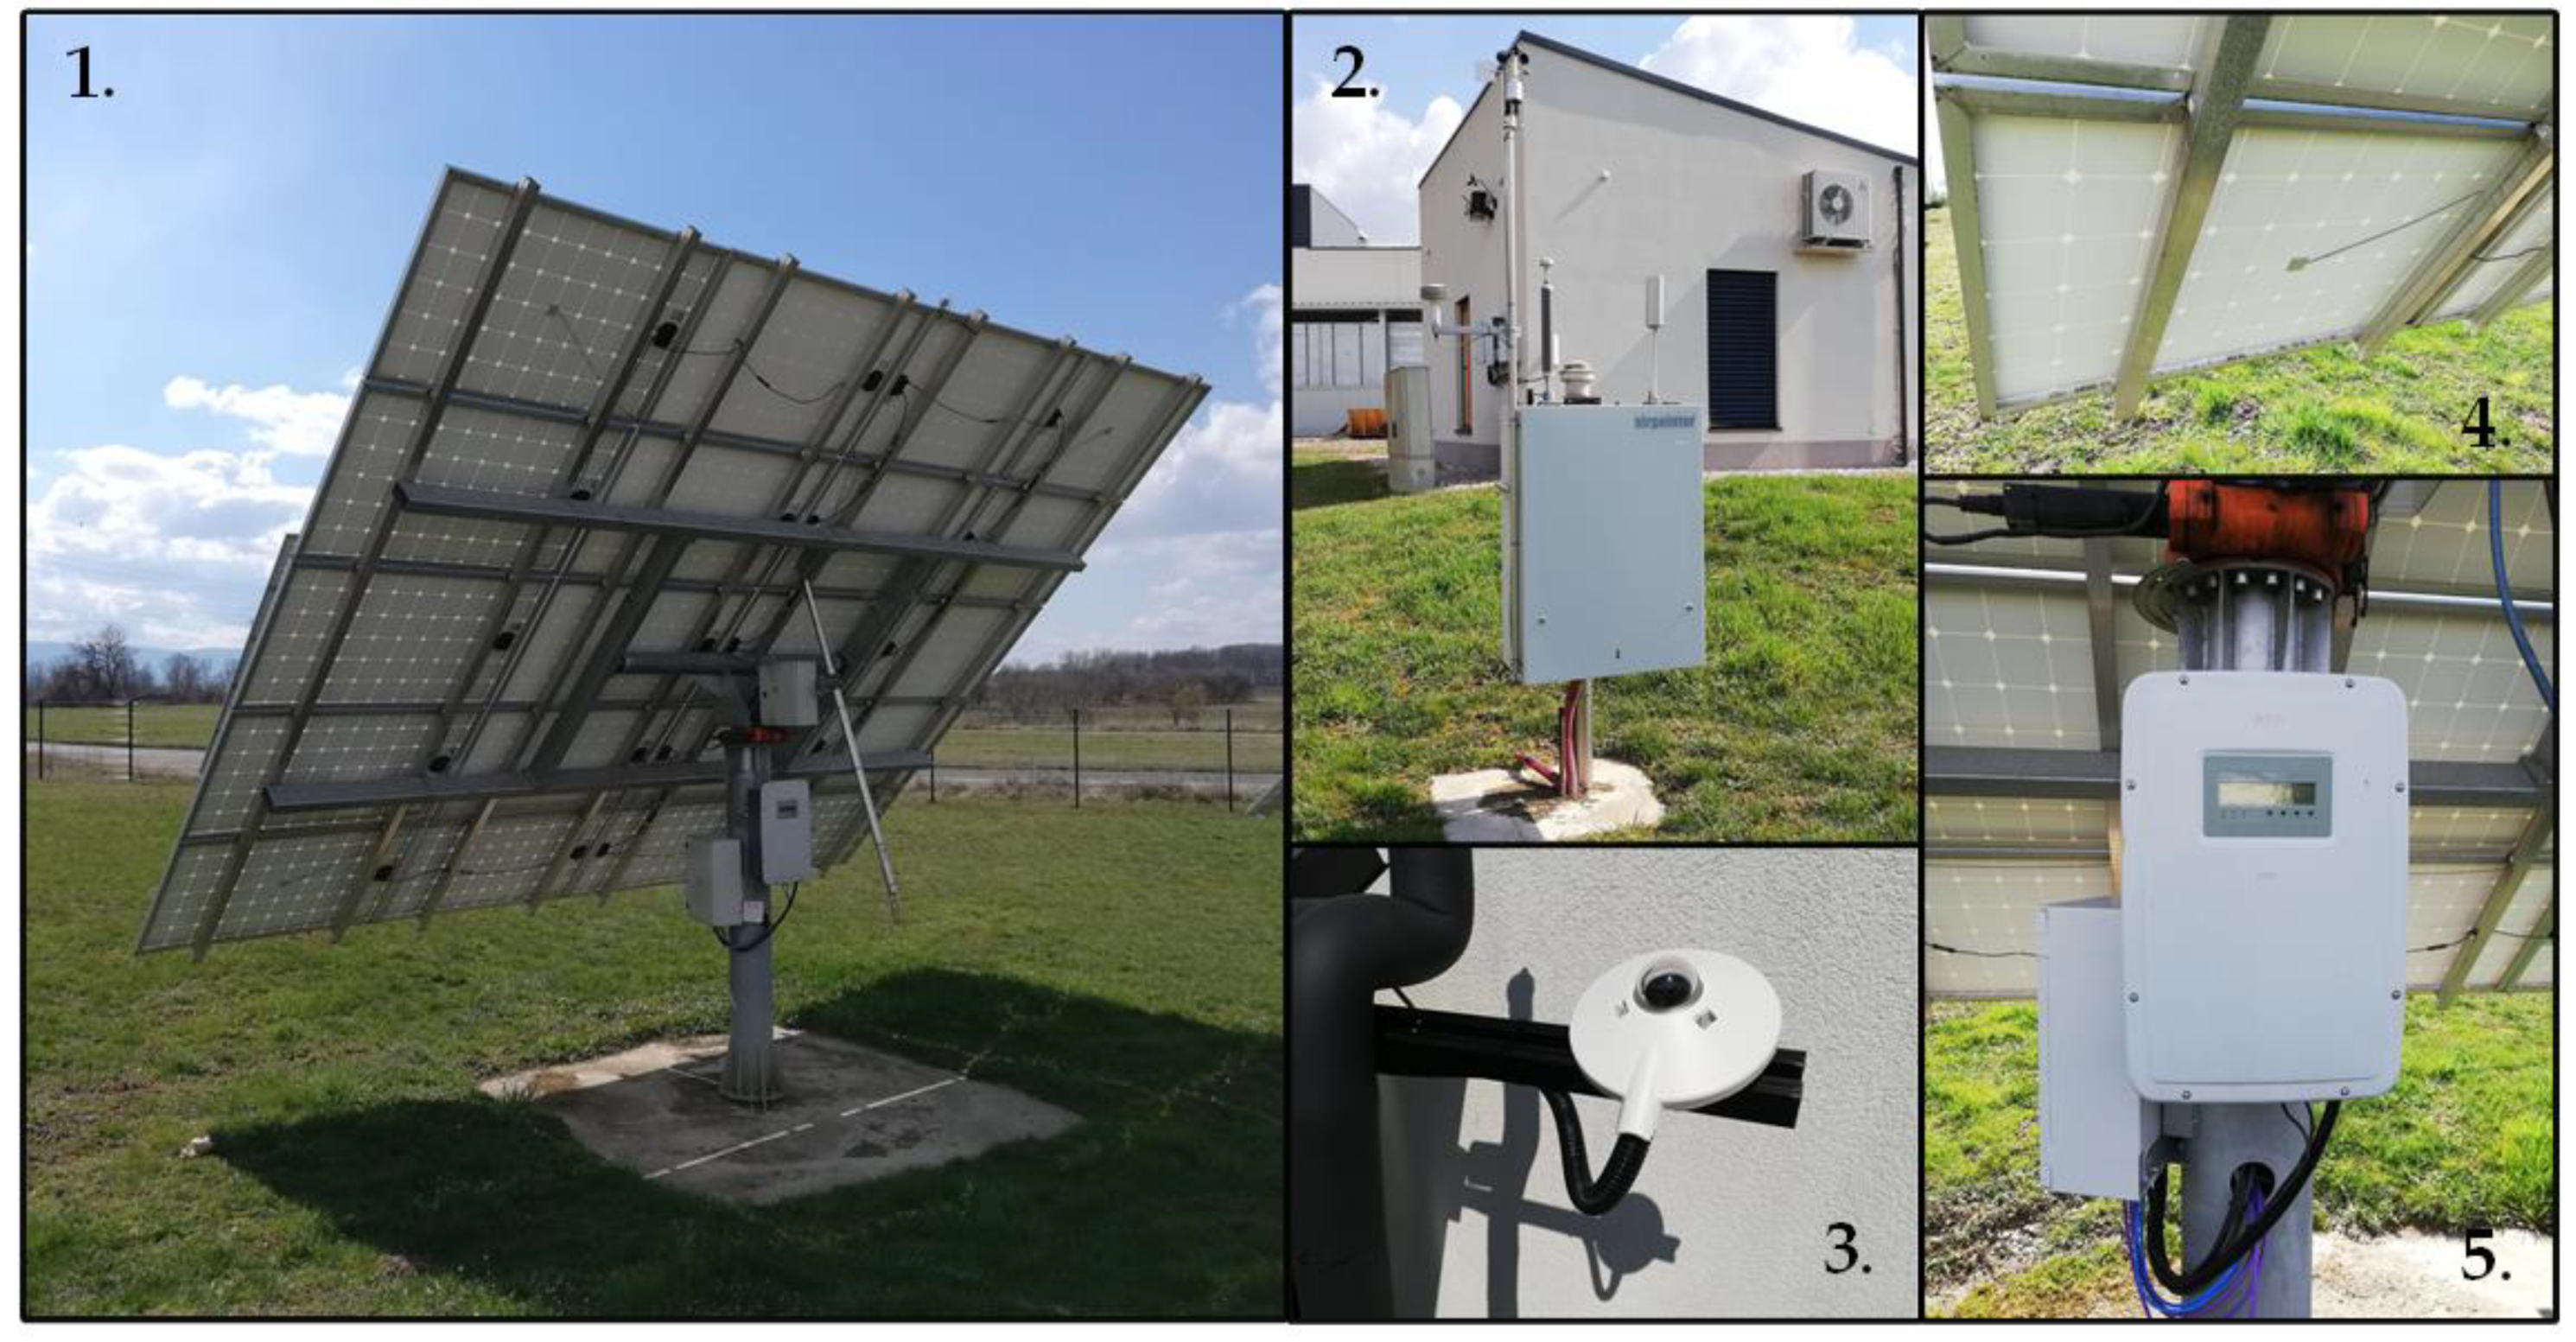
2.1. Experimental Set-Up

The measurements required for the validation of thermo-electric models were performed in the experimental field of the Institute of Energy Technology, Faculty of Energy Technology, University of Maribor. The experimental field consists of nine dual-axis PV tracking systems with additional measuring equipment (shown in Figure 1). One dual-axis PV tracking system consists of twenty series-connected 260 Wp silicon PV modules with a total installed power of 5.2 kWp. Each PV tracking system is equipped with a pyranometer for solar radiation measuring, four temperature sensors for measuring the operating temperature of the PV module on the backside and a DC/AC inverter. The DC/AC inverter does not include measurements of AC and DC current, voltage and output power data, therefore a Power Meter (Siemens SENTROM PAC4200—AC measurements) and a Hall Effect Sensor (T201DCH100—DC measurements) are additionally installed. The entire system is connected to a several-local-and-one-global PLC (Siemens S7-300), while the data is displayed in a SCADA software system that allows easy monitoring and management. All meteorological and experimental data are sampled every 5 min. Several detailed information on the accuracy and calibration time of the measuring devices are shown in Table 1.

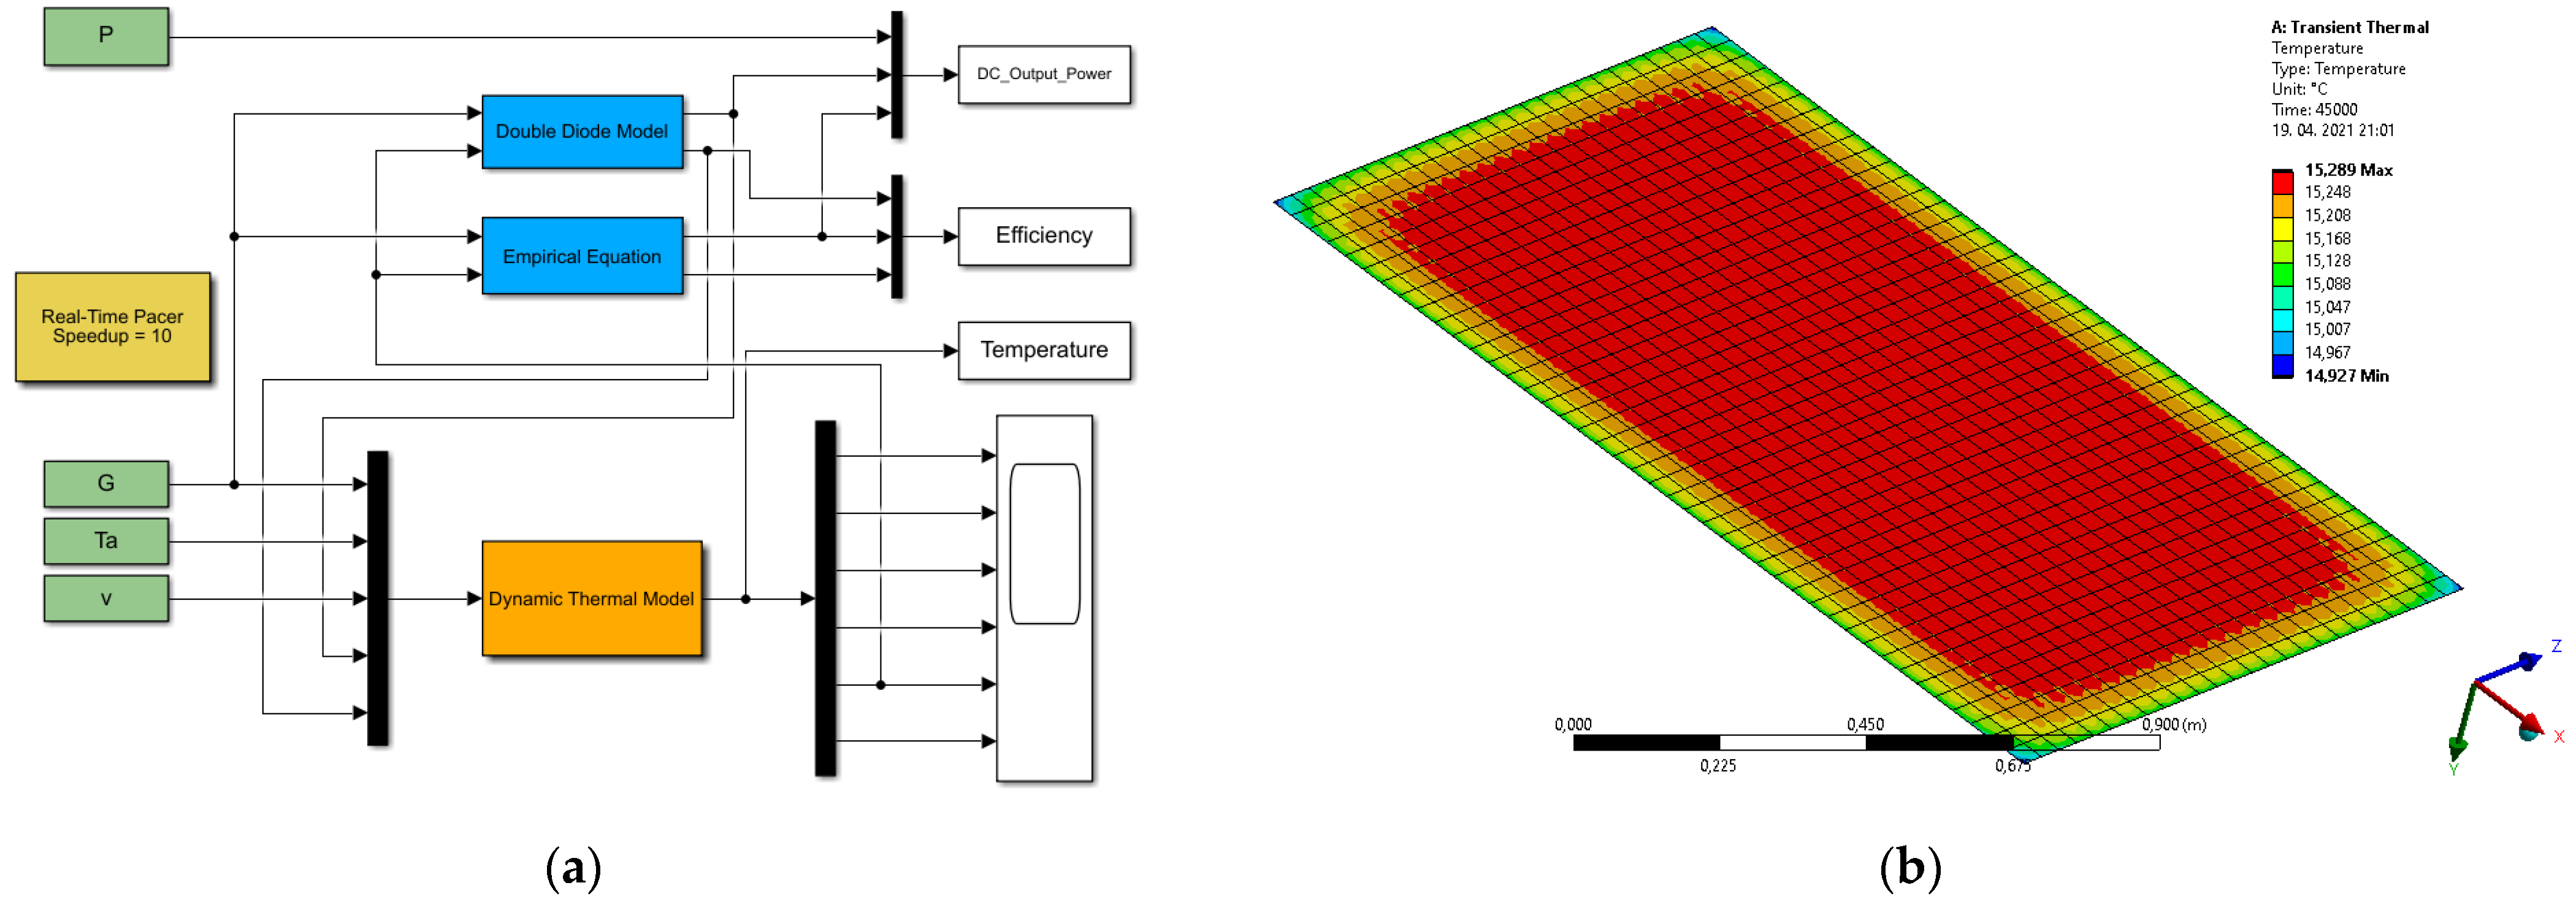
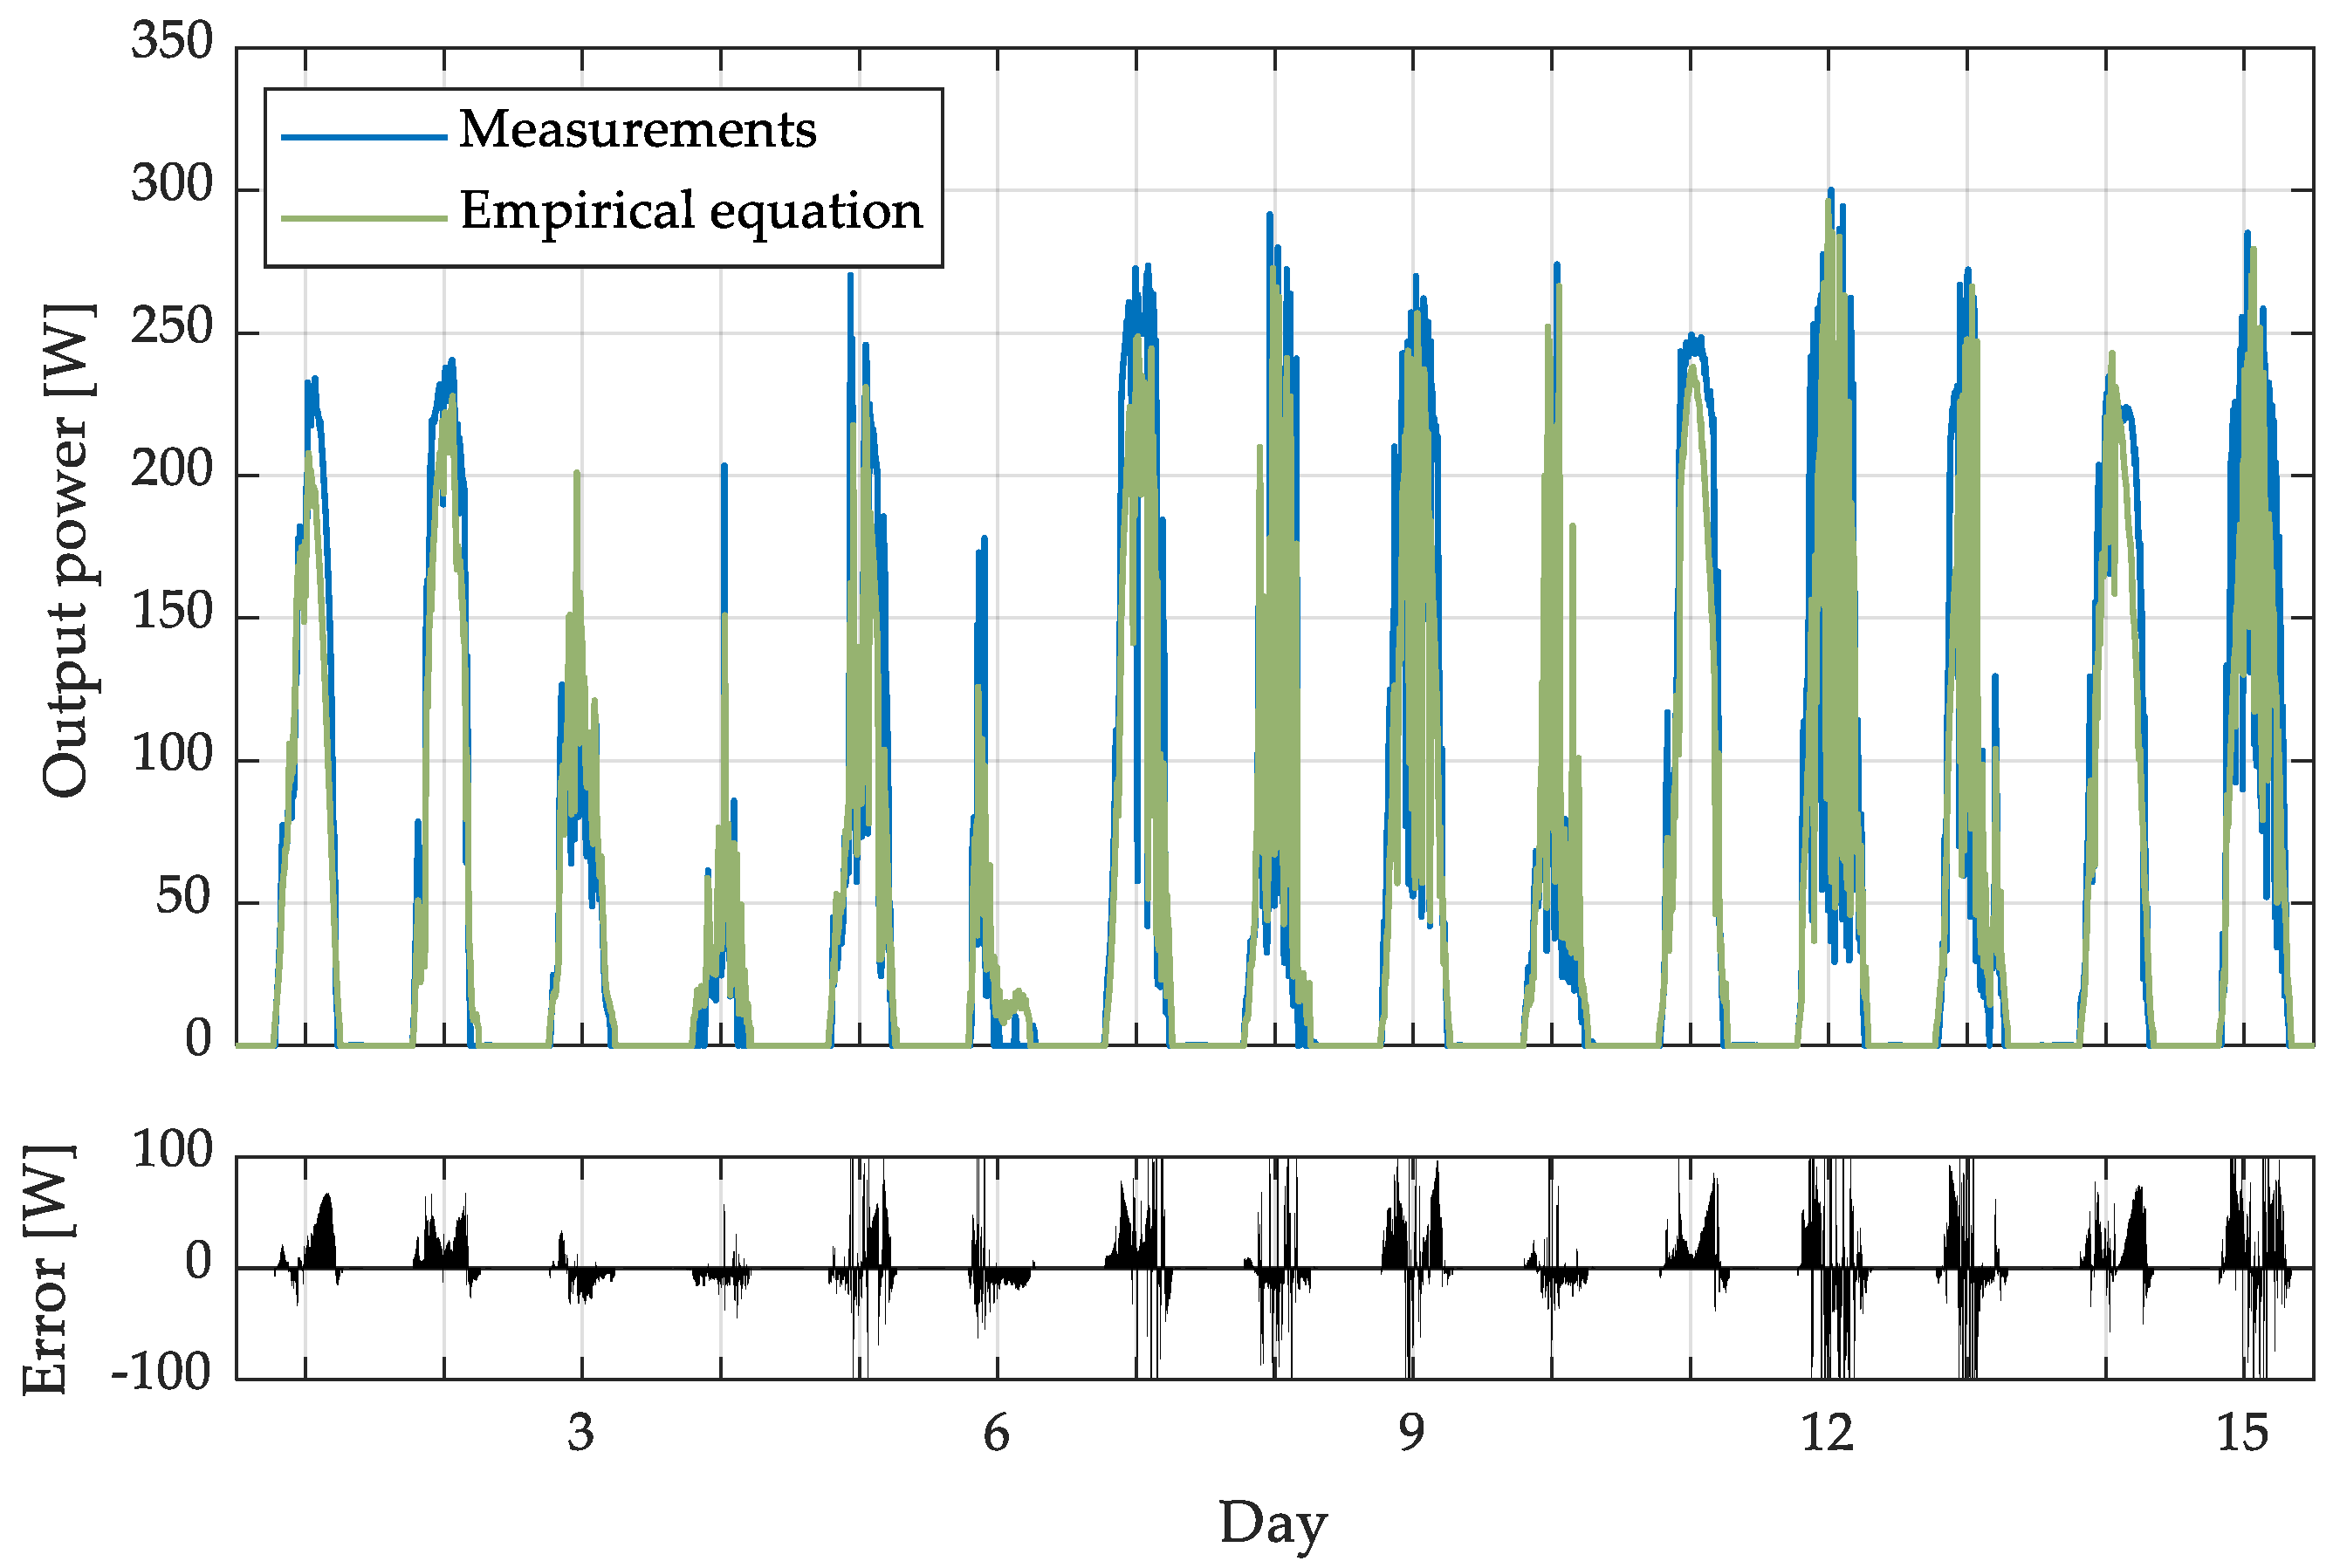
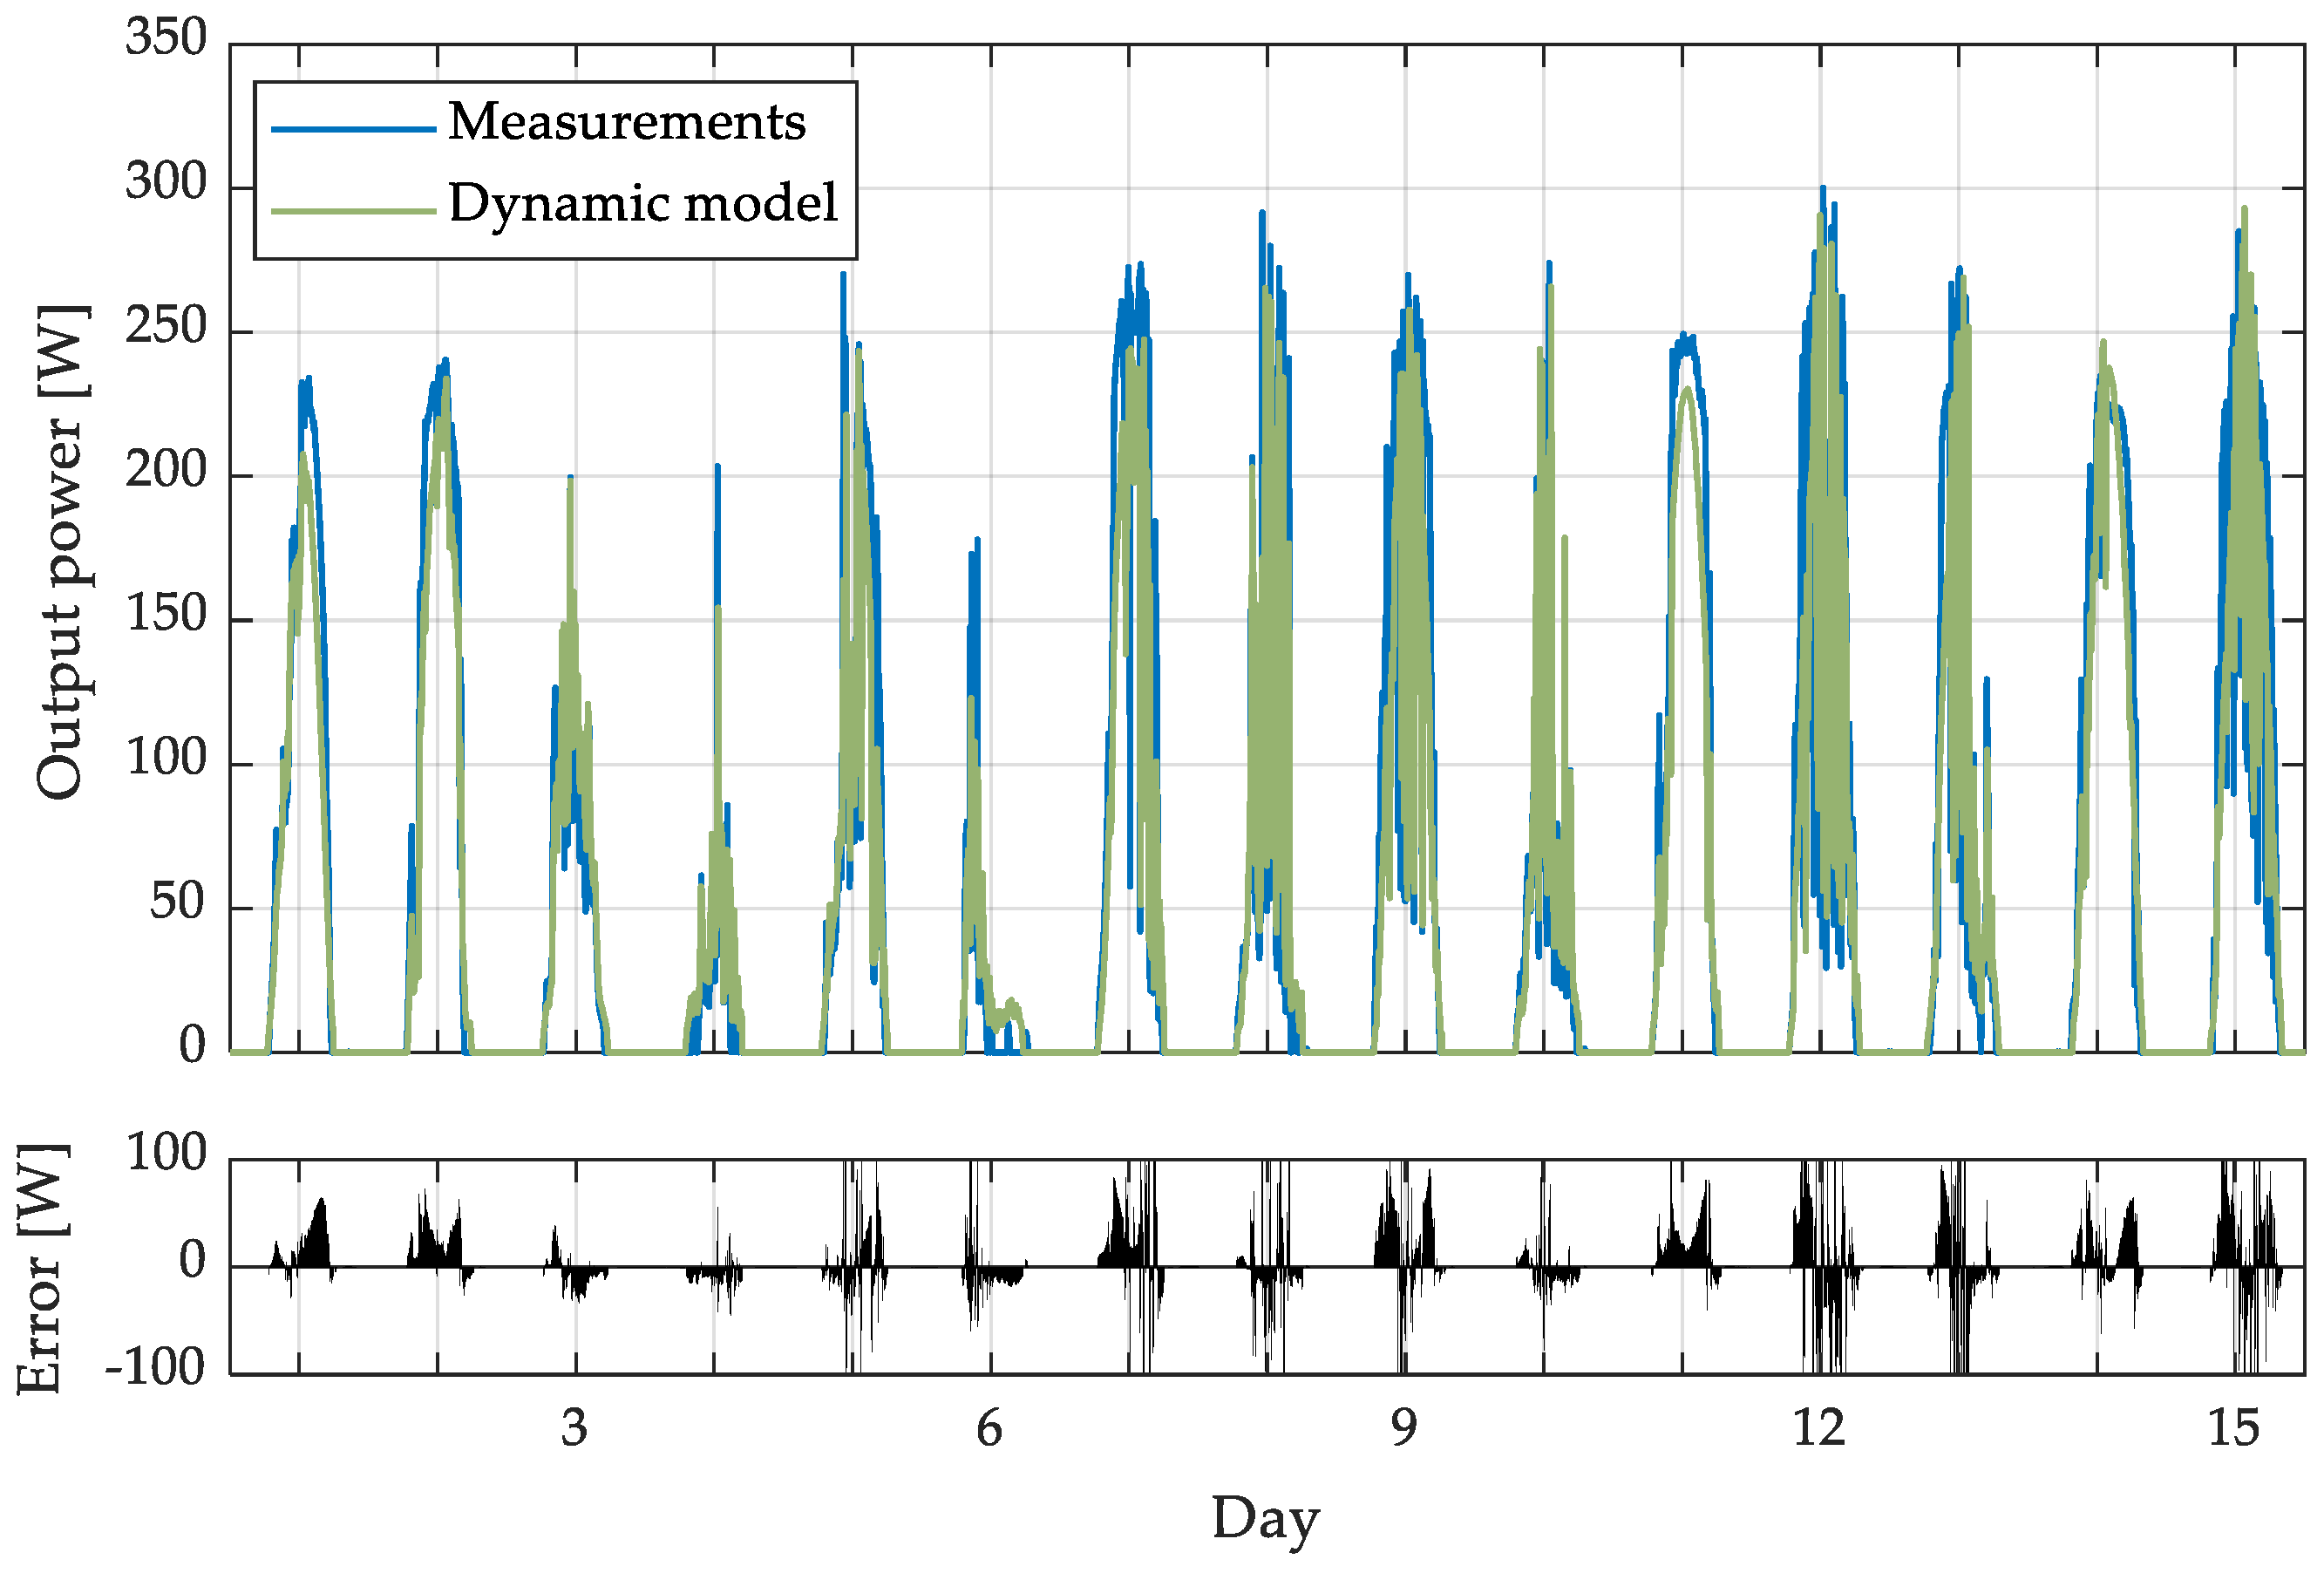
2.2. Dynamic Electric Model of the Photovoltaic Module

Electric models of the PV module could be found in several papers [10,29,33] as a simple empirical correlation between output power PDC, solar radiation G and operating temperature of the PV module T or as a single/double diode model [34,35,36,37,38] using the algorithm for a maximum power point tracking (MPPT). In this paper, the dynamic electric model is presented as a double diode model taking into account four parameters (short-circuit current ISC, open-circuit voltage VOC, series resistance Rs and shunt resistance Rsh) as a function of solar radiation G and the operating temperature of the PV module T. The double diode model of the PV cell is expressed by (1):
I = I ph I 01 ( exp ( V + I R s V T 1 N s ) 1 ) I 02 ( exp ( V + I R s V T 2 N s ) 1 ) ( V + I R s R sh )
where Ns is the number of series-connected PV cells, Iph is the photocurrent, I01 and I02 are the reverse saturation current of the first and second diode, while VT1 and VT2 stand for thermal voltage of the first and second diode. The last five parameters (Iph, I01, I02, VT1 and VT2) are described in more detail in Appendix A. As mentioned above, a short-circuit current, an open-circuit voltage, a series and shunt resistance [39] of the PV module are calculated as a function of the solar radiation G and the operating temperature of the PV module T by (2)–(5), where K is the Boltzman
n constant (1.38065 × 10²³ J/K), q is the electron charge (1.602 × 10¹⁹ C) and n is the diode ideality factor (dimensionless). Furthermore, μ I SC and μ V OC are temperature coefficients of ISC and VOC, while ISC,STC, VOC,STC, GSTC and TSTC presents short-circuit current, open-circuit voltage, solar radiation and temperature of the PV module under STC conditions.
I S C ( G , T ) = ( G G S T C ) ln ( I S C , S T C I S C ) ln ( G S T C G ) ( I S C , S T C + μ I SC ( T T S T C ) )
V O C ( G , T ) = V O C , S T C + N S K T n q ln ( G ) + μ V OC ( T T S T C )
R s ( G , T ) = G S T C ( V O C , S T C V M P P , S T C ) 4 ( G ( I M P P , S T C + μ I SC ( T T S T C ) ) )
R s h ( G , T ) = 2 G S T C ( V M P P , S T C μ V OC ( T T S T C ) ) ( G ( I S C , S T C I M P P , S T C ) )
As mentioned in the introduction, different mathematical models exist for calculating the output power of the PV module. One of those [10,29,33] is the empirical equation presented by (6), which will be further used to validate the double diode and experimental data.
P D C = P S T C ( G G S T C ) ( 1 + μ P MPP ( T 25 ) )
where μ P MPP is the temperature coefficient of PMPP and PSTC is the output power of PV module under STC conditions. All of the parameters that appear in (1)–(6) are presented in Table 2 for the considered mono-crystalline PV module for STC (PV Future—PVF 60M) [40].

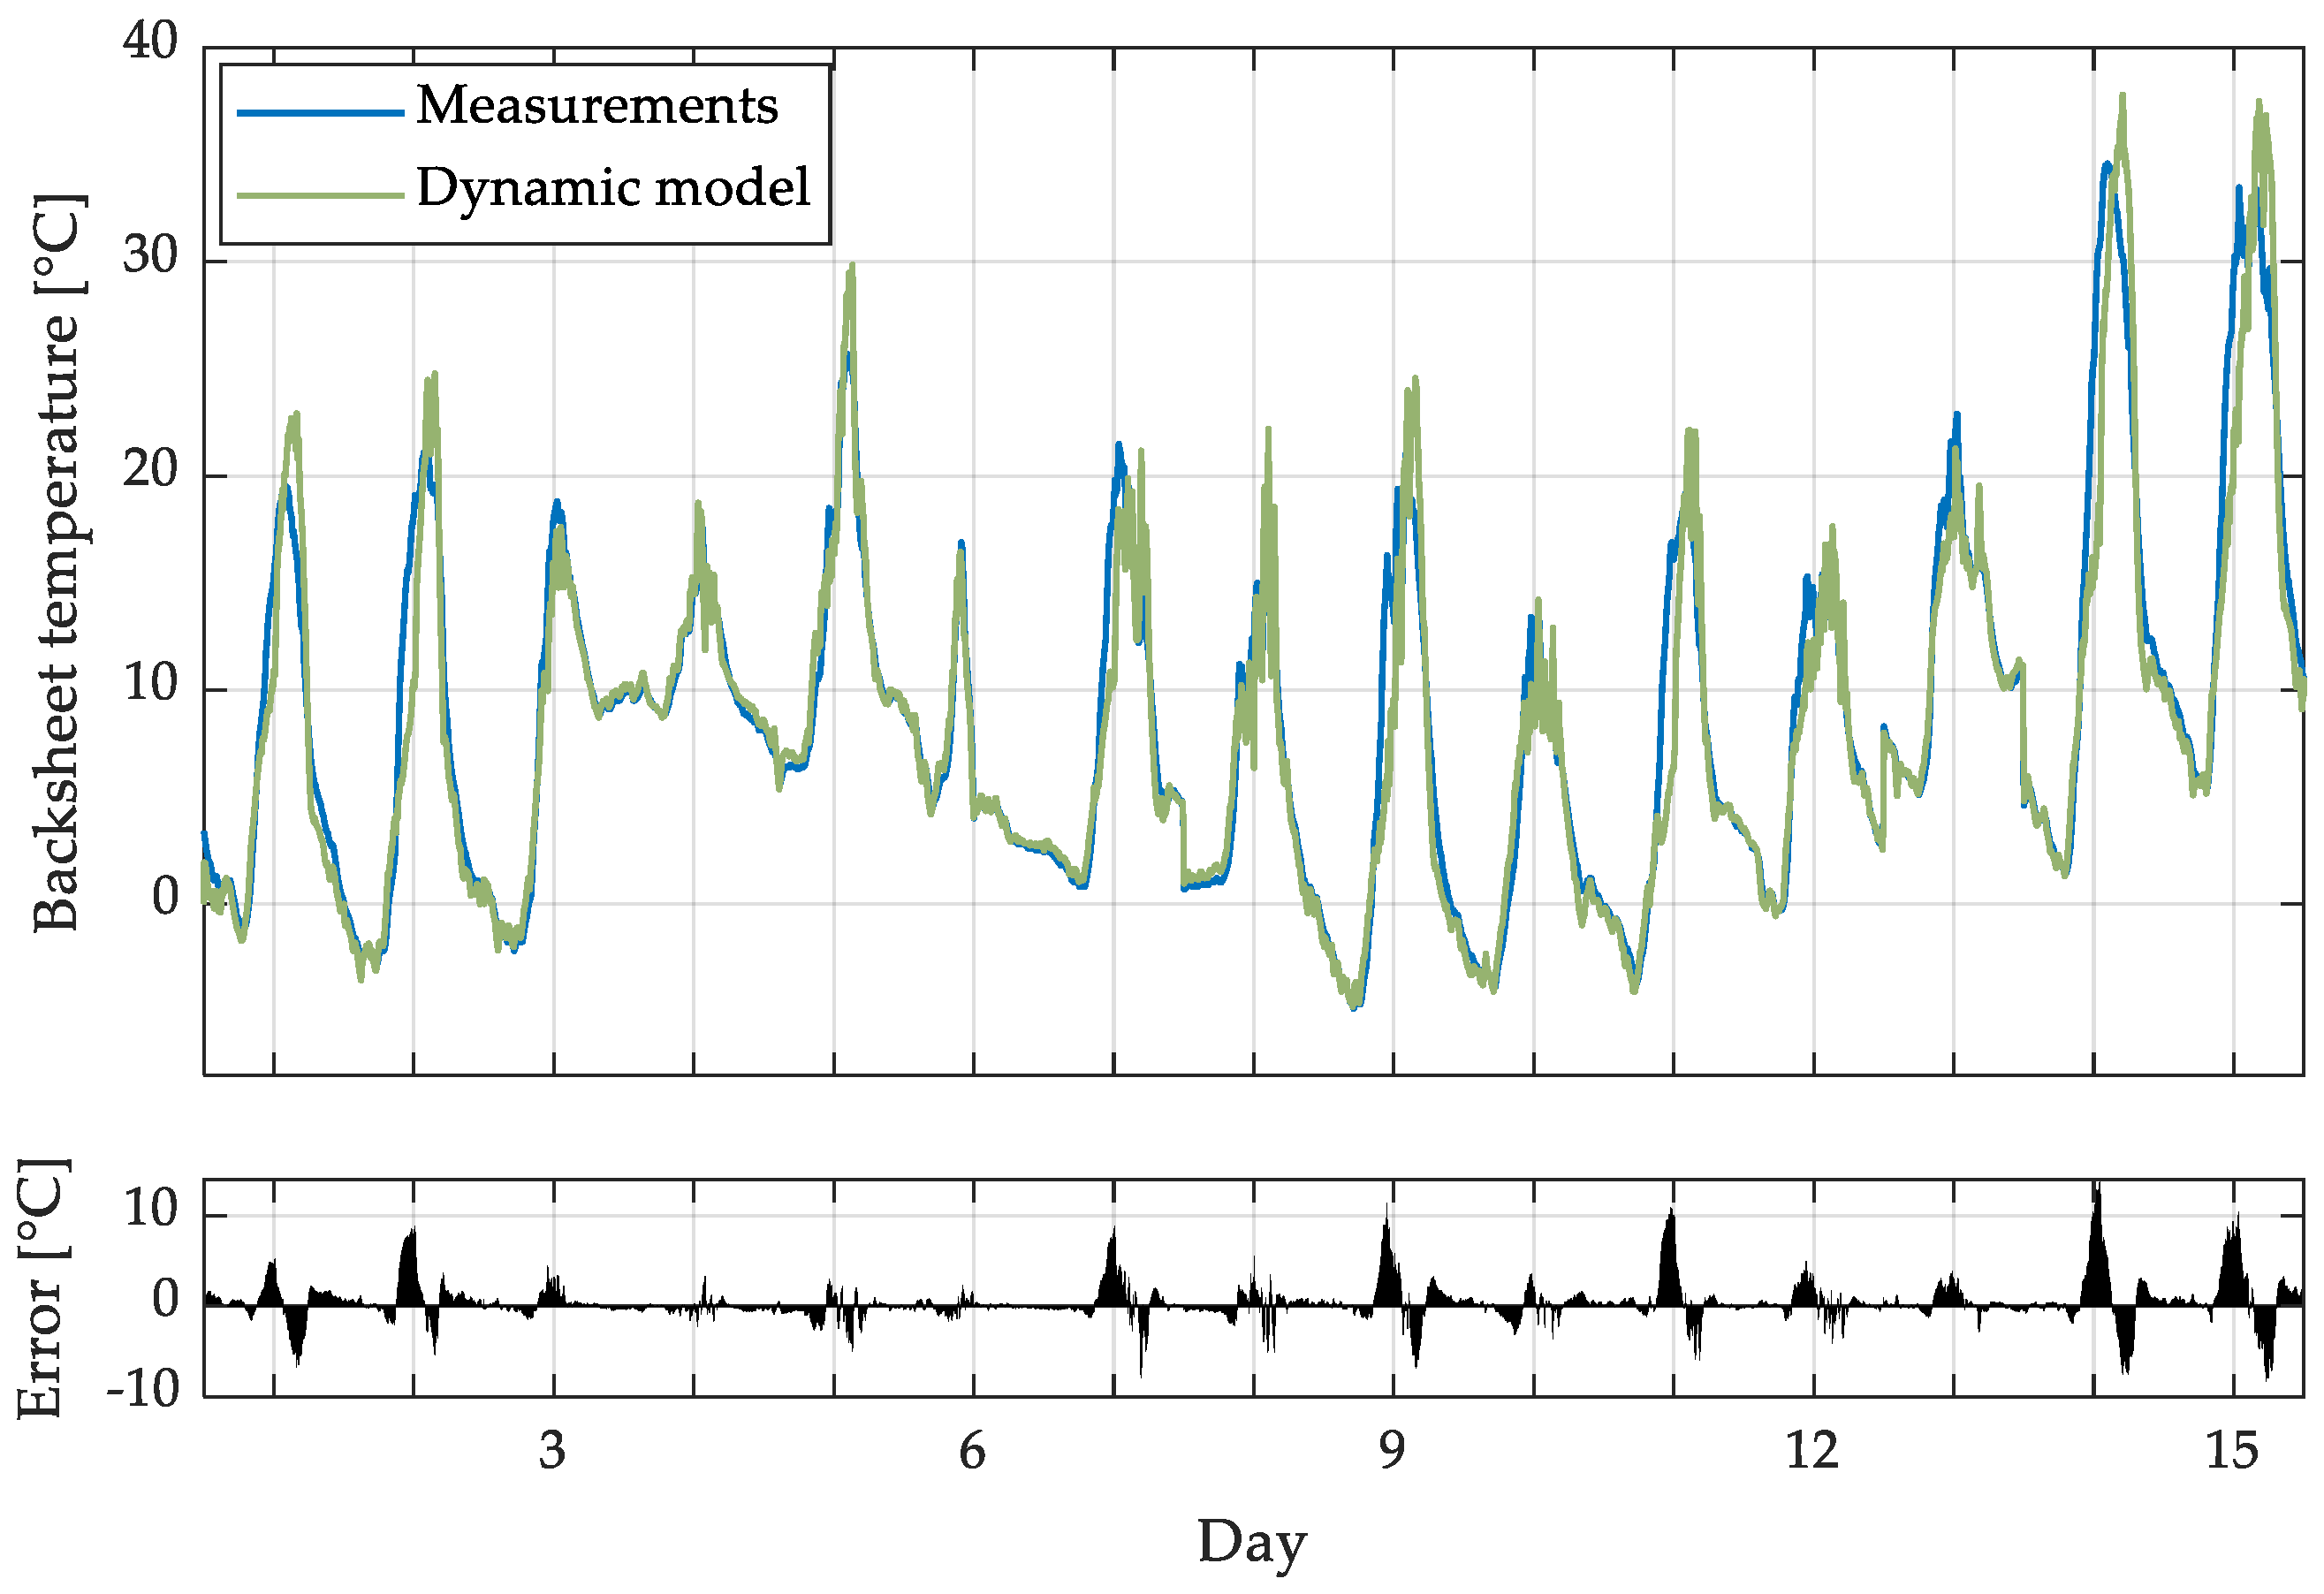
2.3. Dynamic Temperature Model of the Photovoltaic Module
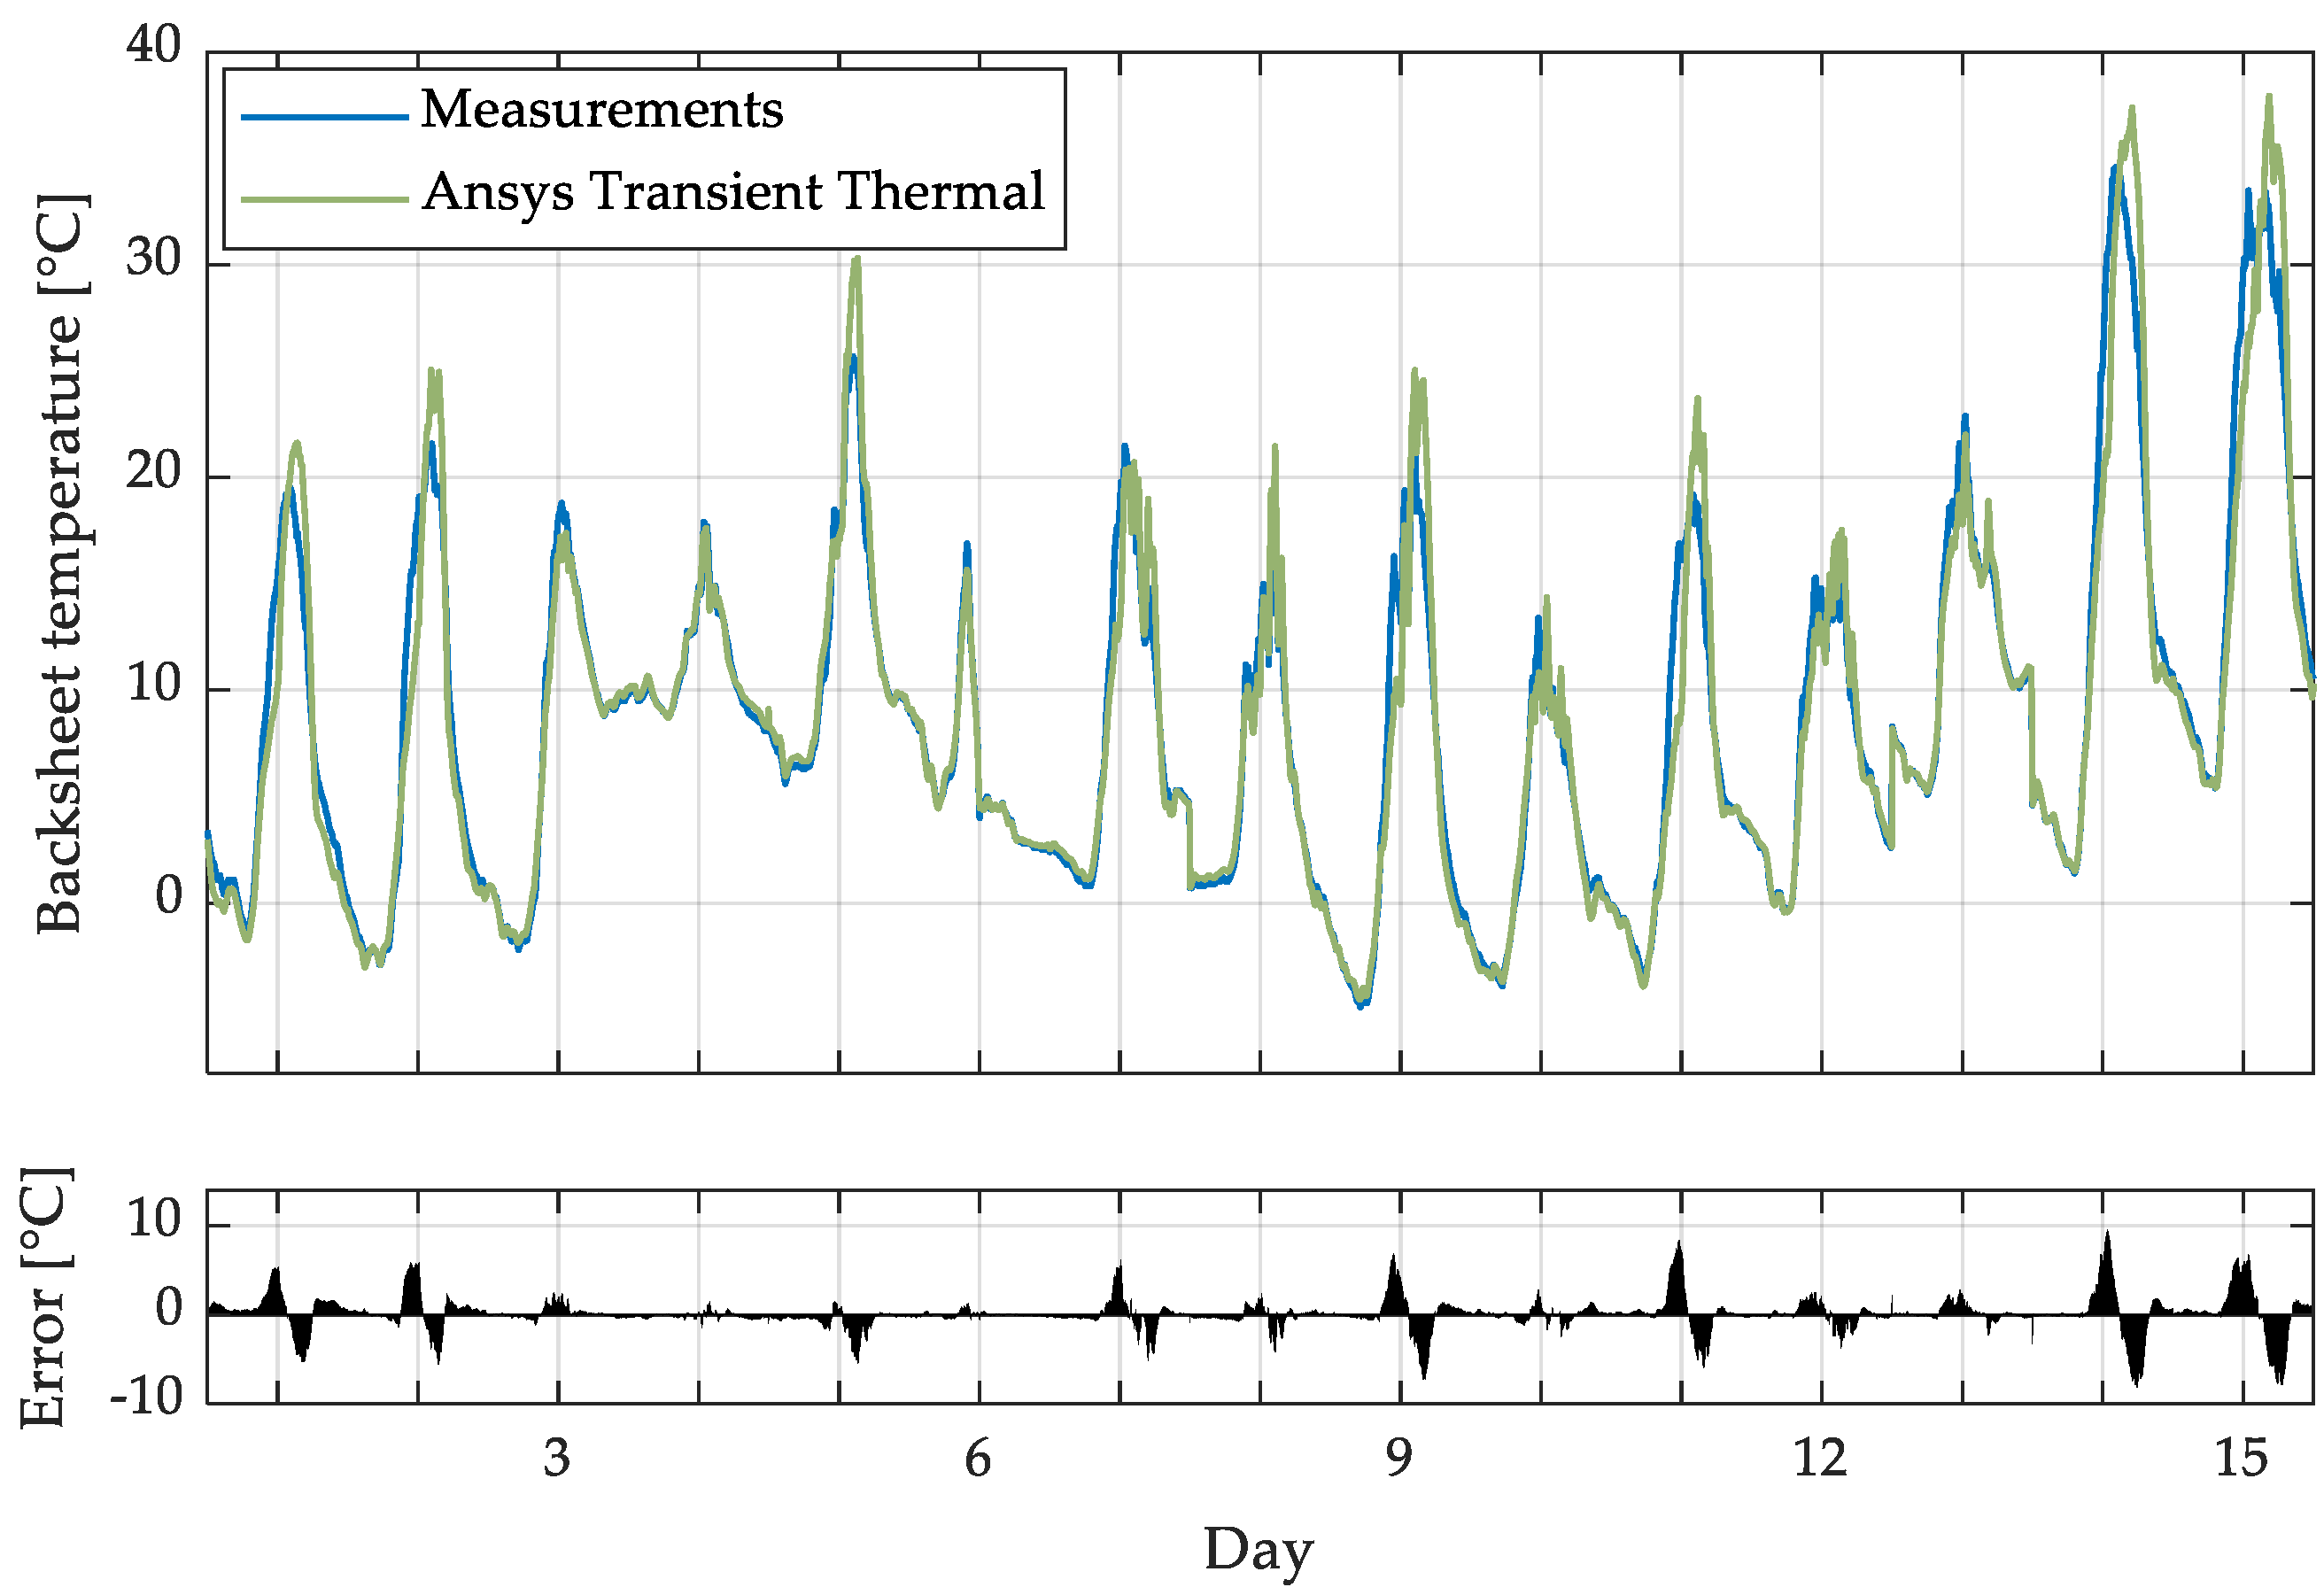
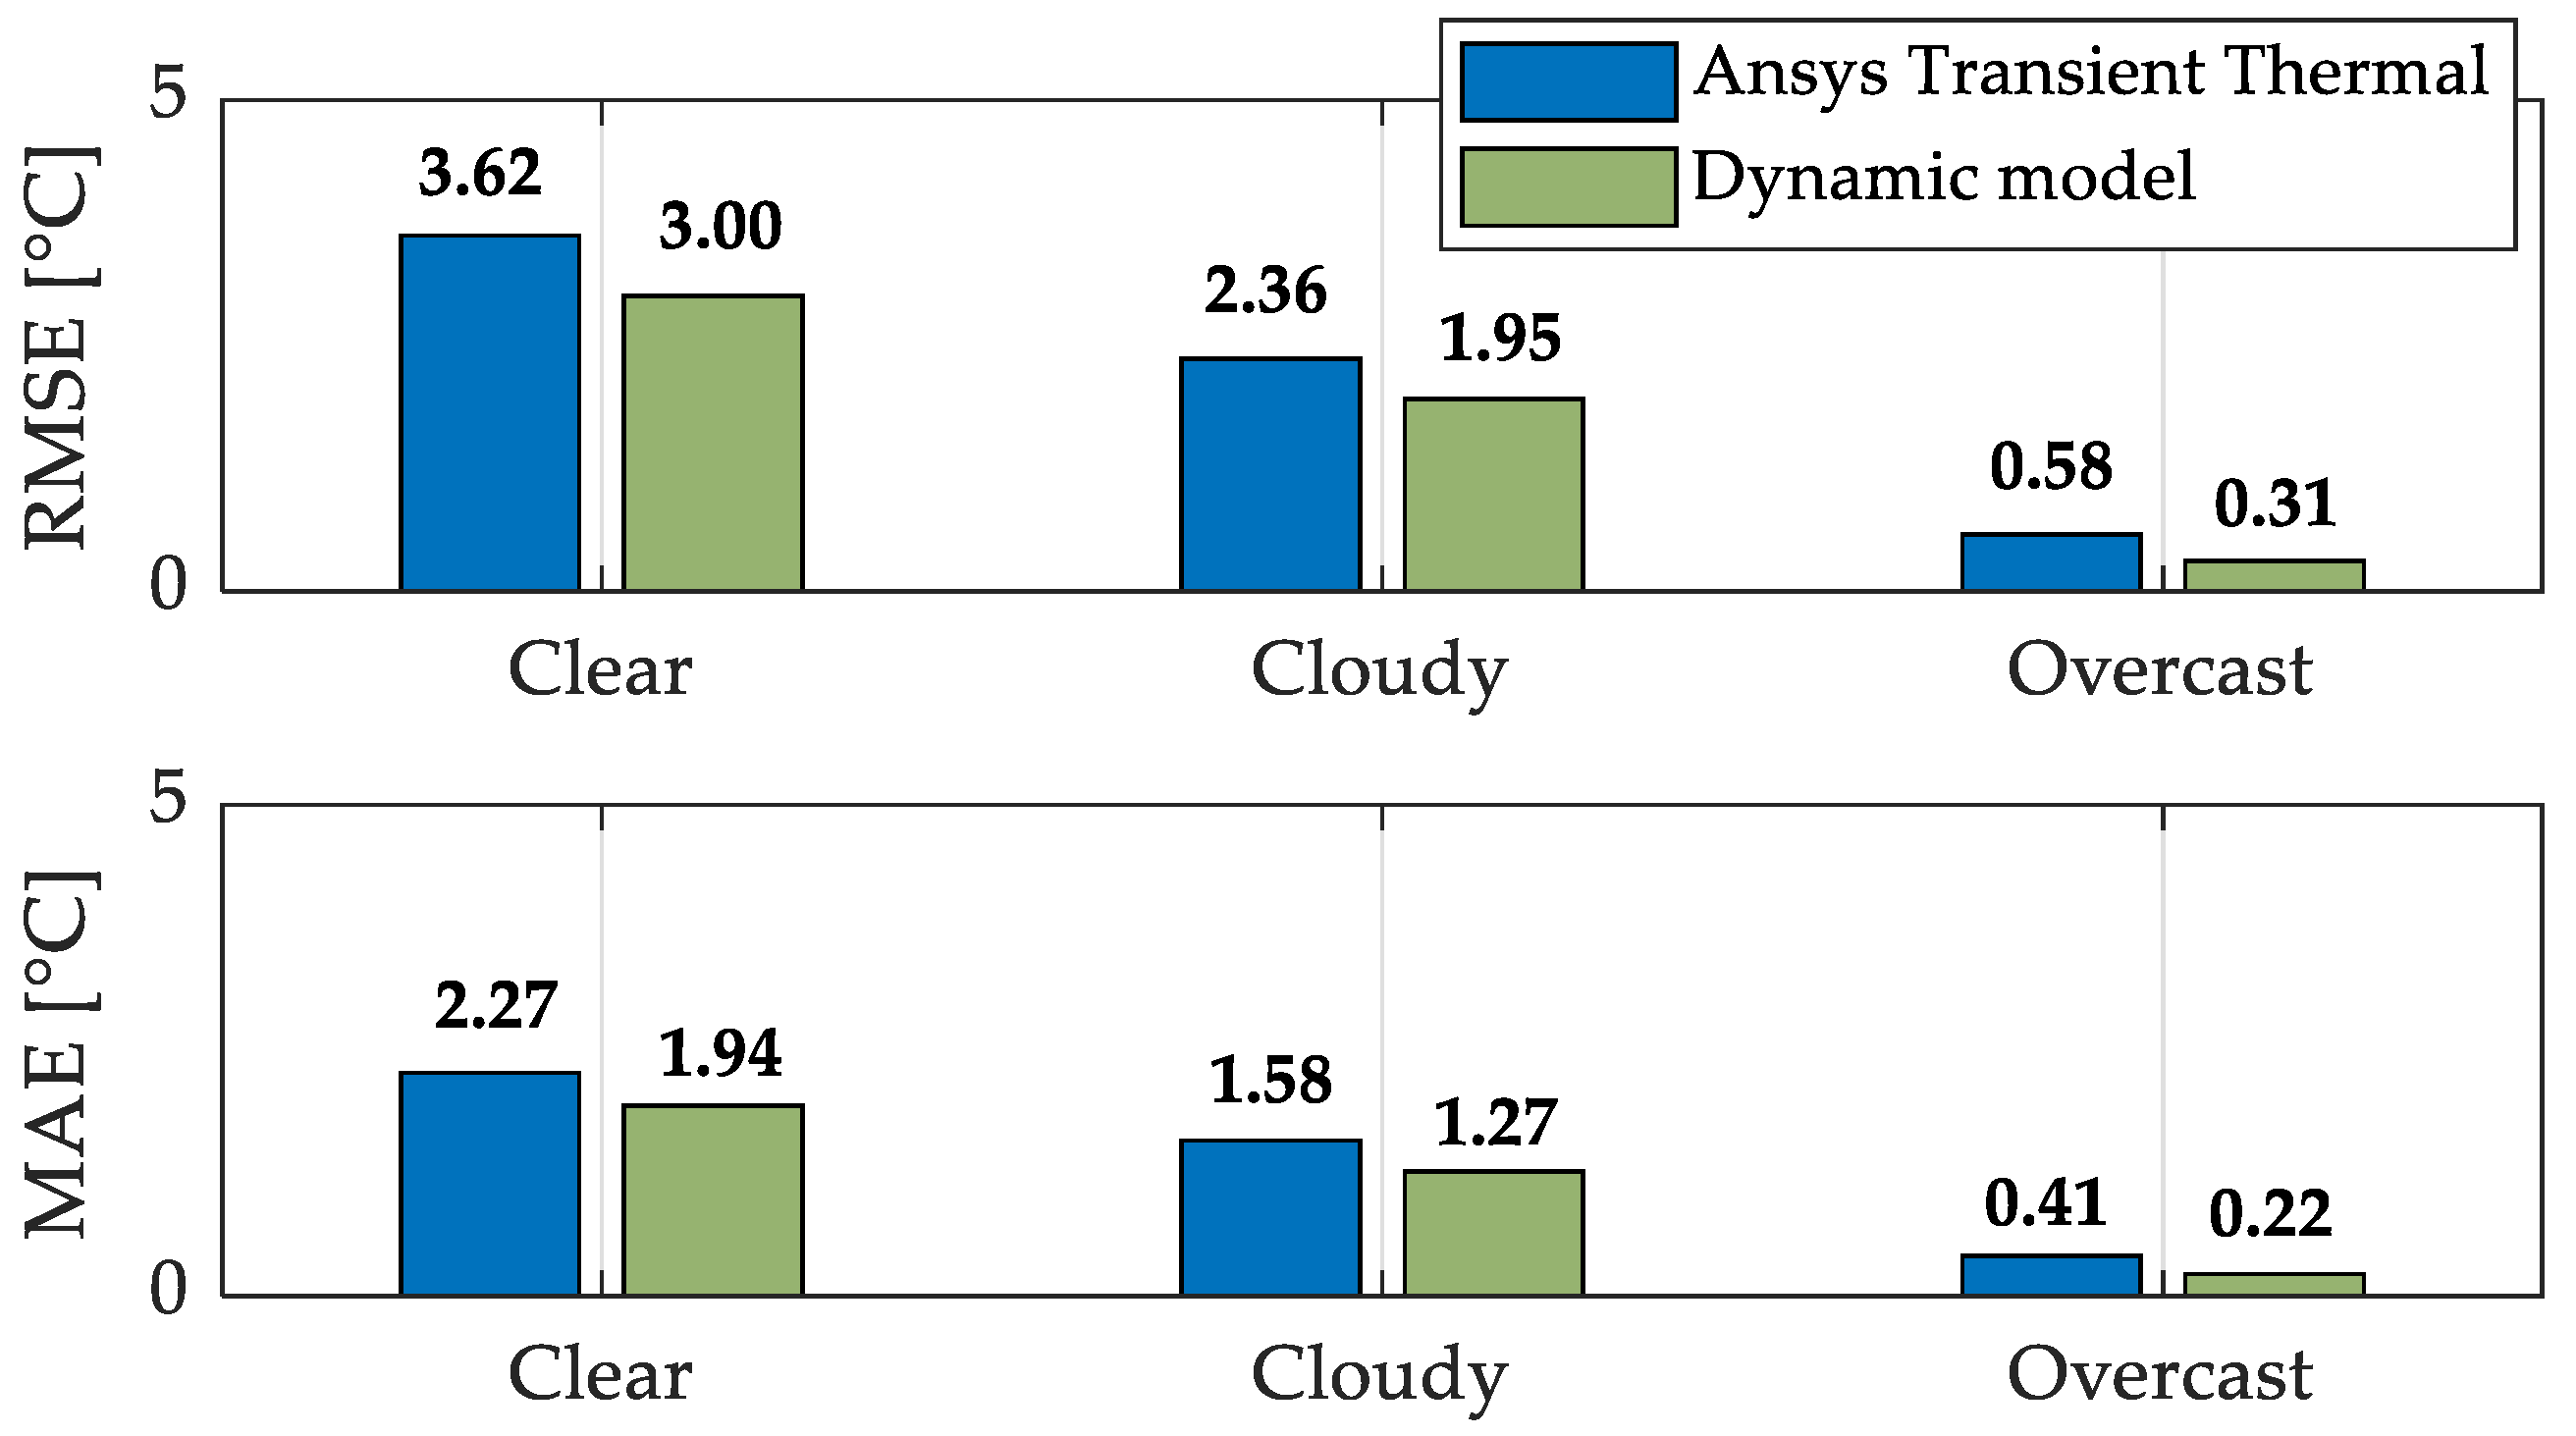
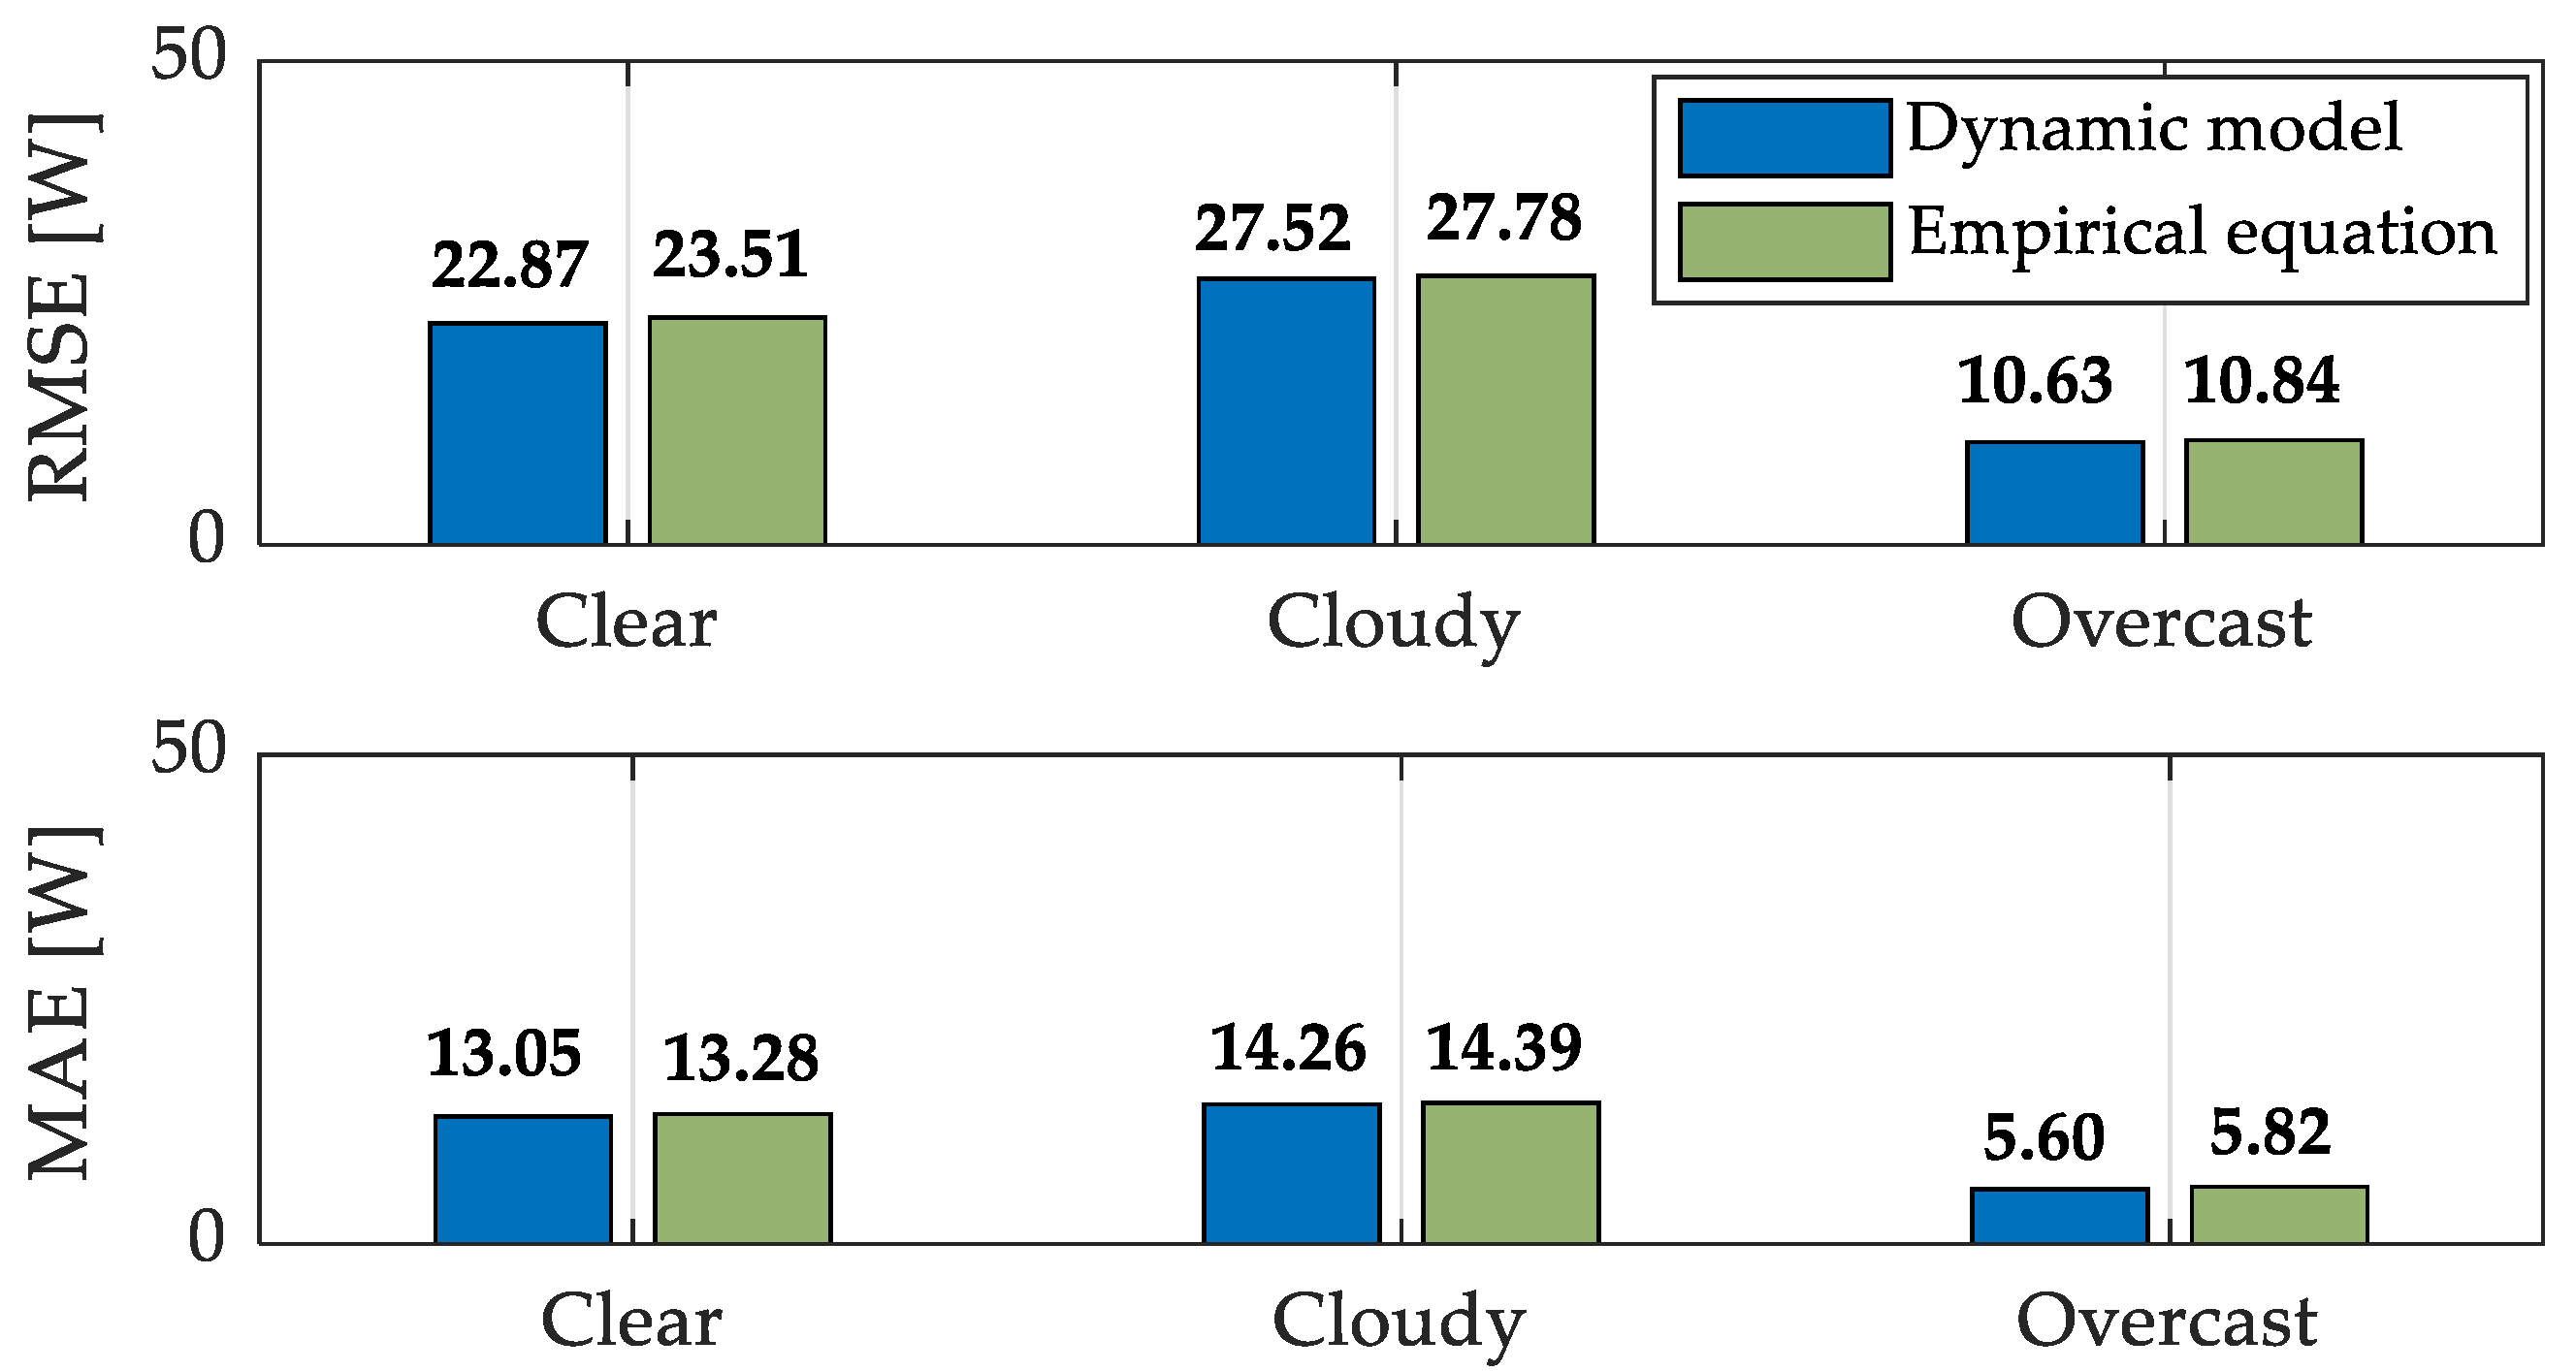
The dynamic thermal model of the PV module is presented differently within several papers [10,21,22,41,42,43,44]. The authors focus primarily on 1-D models of temperature distribution in PV module layers. Based on the thermal model of the PV module presented by [10], the dynamic heat balance presented in this paper consists of additional layers of Ethylene-vinyl acetate (EVA) foils. Therefore, the dynamic equations for all five layers, namely glass, EVA, PV cell, EVA and tedlar or PVF film-based backsheet, can be expressed by (7)–(11).
A PV ρ g d g C g d T g d t = A PV ( α g G ( 1 ϕ 1 ) h conv . a g ( T g T a ) h cond . g PV ( T g T PV )
A PV ρ EVA d EVA C EVA d T EVA d t = A PV ( τ g α EVA G ( h cond . EVA g ( T EVA T g ) h cond . E V A PV ( T EVA T PV ) )
A PV ρ PV d PV C PV d T PV d t = A PV ( τ g α PV G F F ( h cond . PV g ( T PV T g ) h cond . PV t ( T PV T t ) ) P DC
A PV ρ EVA d EVA C EVA d T EVA d t = A PV ( τ g α EVA G ( h cond . EVA PV ( T EVA T PV ) h cond . E V A t ( T EVA T t ) )
A PV ρ t d t C t d T t d t = A PV ( τ g α t G ( 1 F F ) ( 1 ϕ 2 ) h conv . t a ( T t T a ) h cond . PV t ( T t T PV ) )
where G is the solar radiation, APV is the surface area of PV module, φ1 is the heat flux ratio (equal to 0.46 [44]), φ2 is the thermal radiation flux (equal to 0.52 [10]) between a tedlar layer and an ambient for the open-racked PV module, Ta is the ambient temperature, hconv and hcond are the convective and conductive heat transfer coefficient (described in Appendix A), PDC is the output power, FF is the fill factor and ρ, d, C, T, τ and α are the density, thickness, heat capacity, temperature, transmissivity and absorptivity of different layer, respectively. The indexes in the above-mentioned parameters describe the glass, EVA, PV cell and tedlar layers.
Thermal and mechanical parameters of the considered mono-crystalline PV module are presented in Table 3 (based on the literature [10,13,14,41]).

3. Results

This section is divided into two subsections. The first subsection presents basic meteorological and experimental data: solar radiation G, wind speed v, ambient temperature Ta, direct current IDC, direct voltage VDC and direct output power PDC of dual-axis PV tracking systems. The second section includes the result of thermal (temperature distribution) and electric (direct output power) models of the PV module.

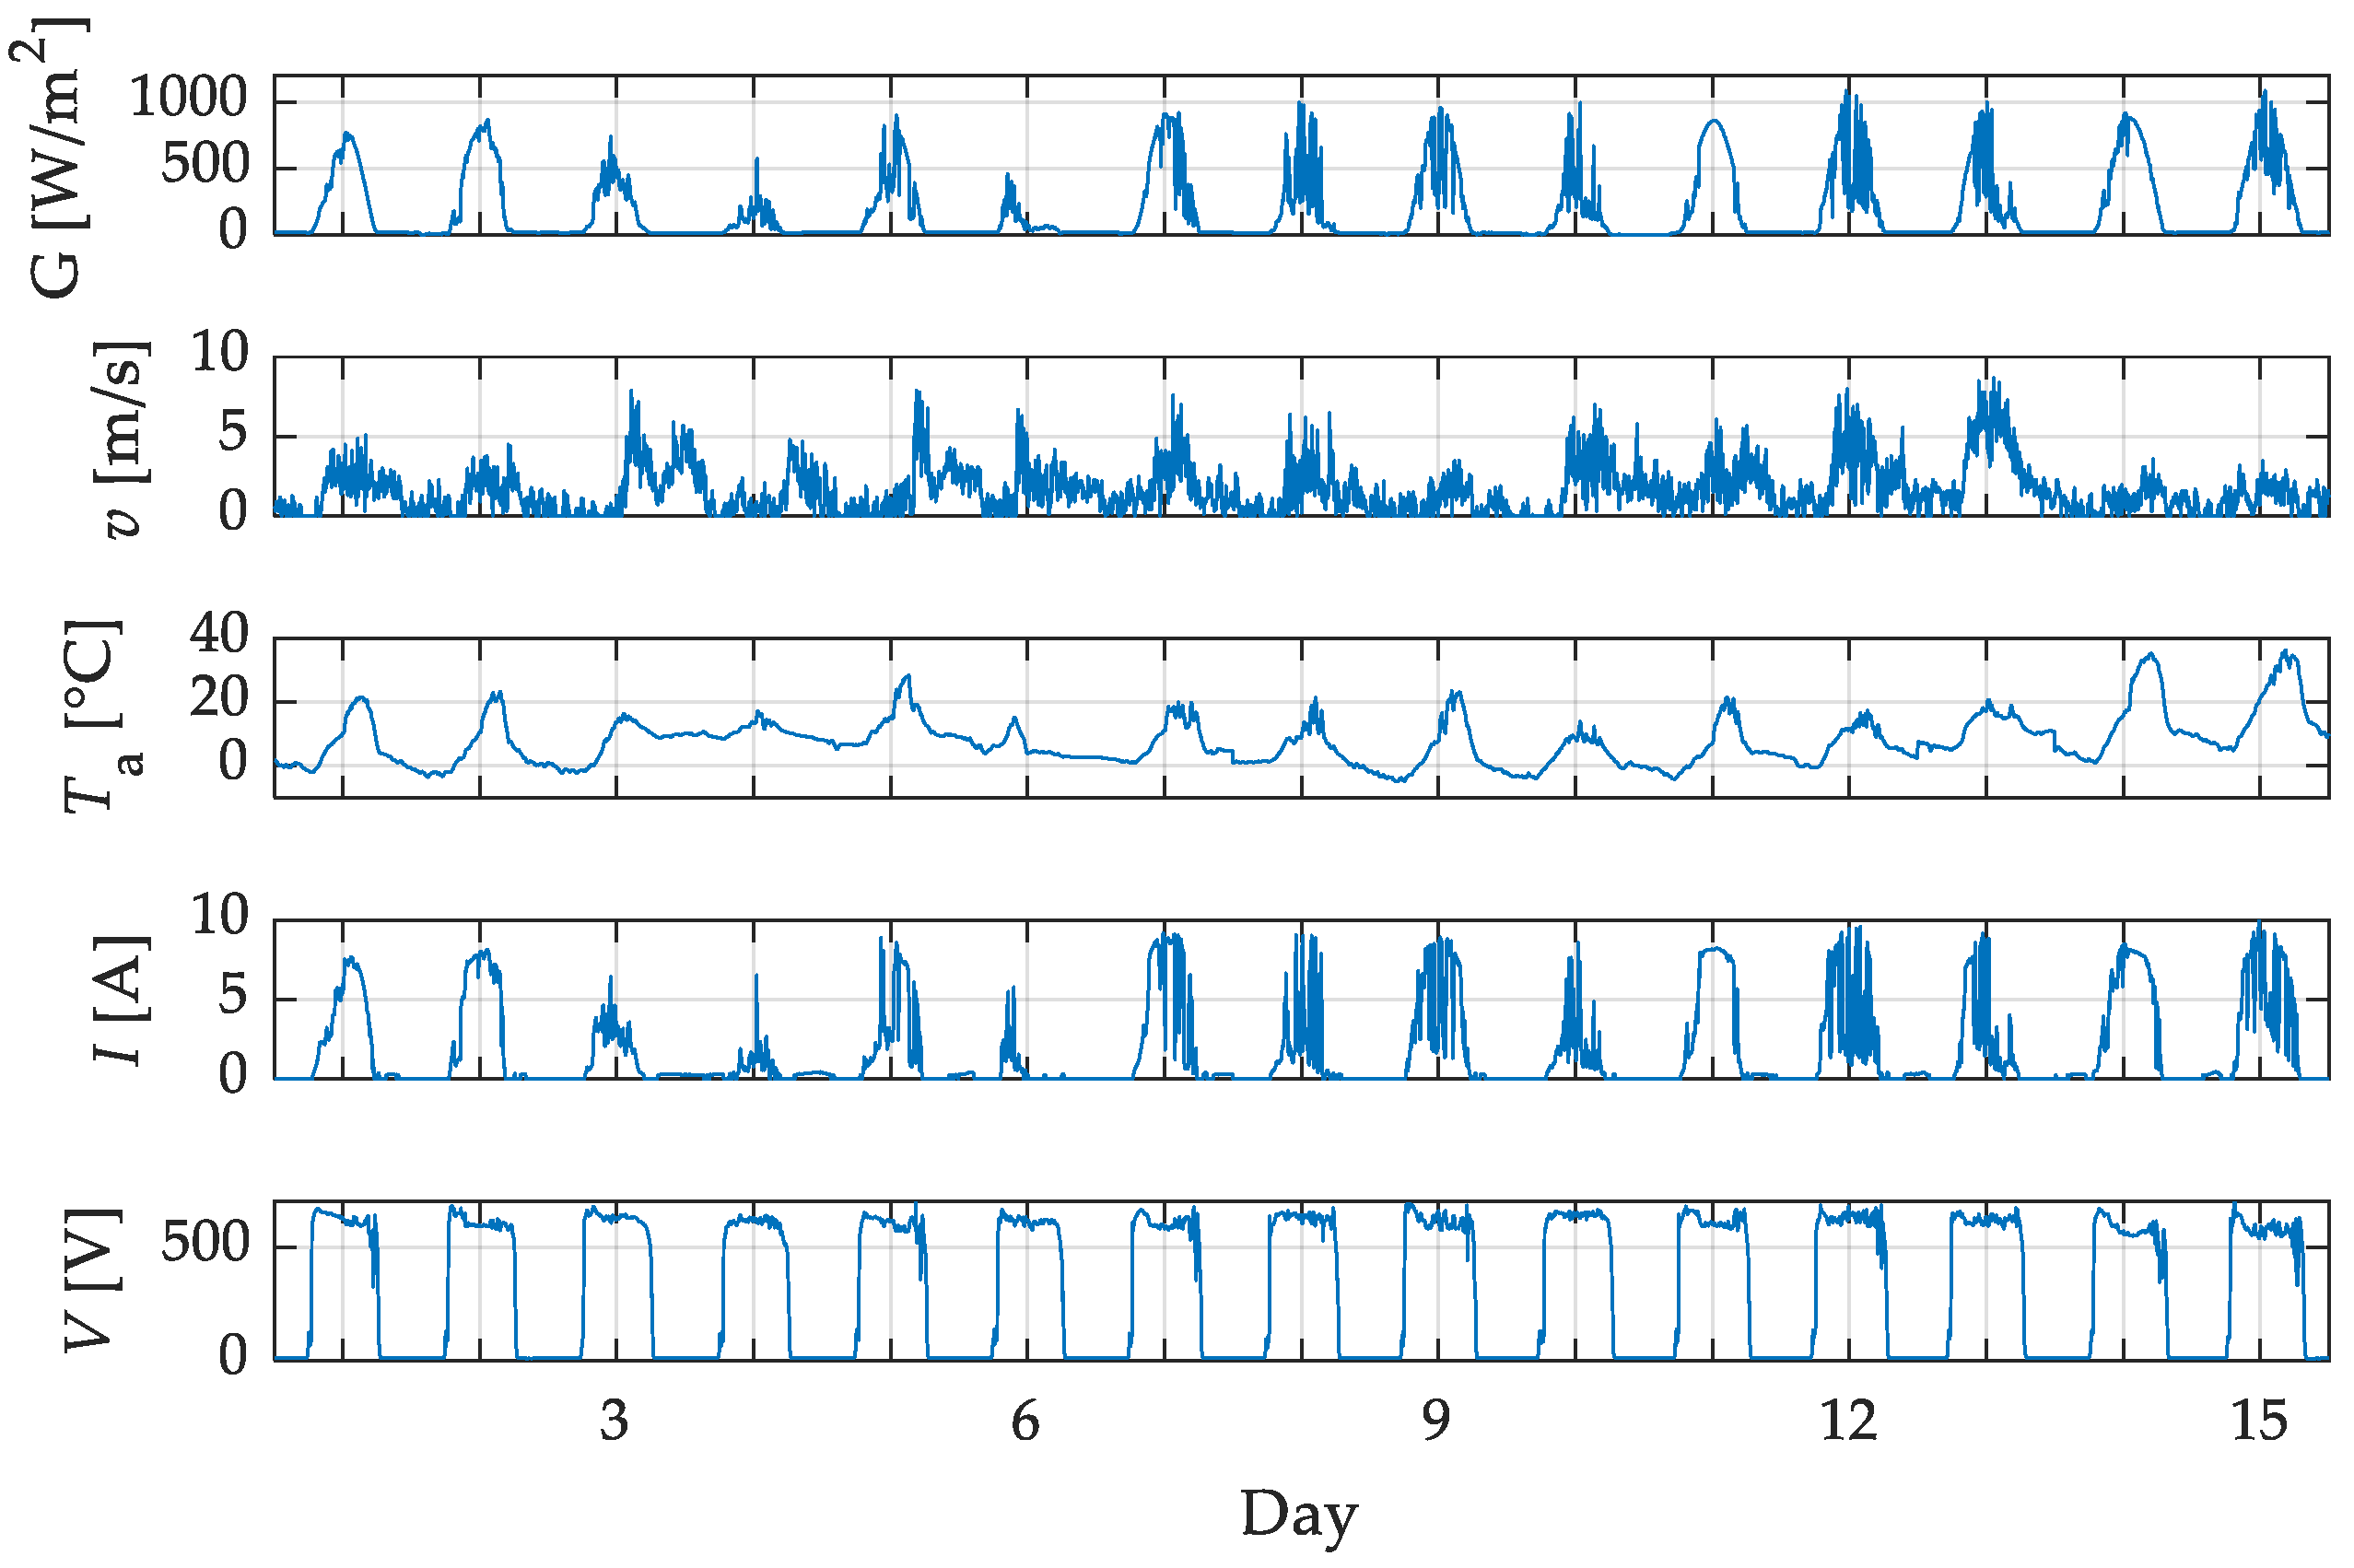
Meteorological and Experimental Data

Validation of different models was performed based on meteorological and experimental data under outdoor conditions for 15 days in March. The three most common types of weather conditions were selected for comparison, namely: clear (2nd and 11th day), overcast (4th and 6th day) and cloudy (remaining 11 days). In fact, clear days are quite rare in Slovenia for the aforementioned month, so cloudy days are the most prevalent, which can be seen from the measurements of solar radiation shown in Figure 2. Furthermore, the wind speed in March is relatively low as well, with an average velocity of 1.55 m/s and a maximum velocity of 8.7 m/s.
Figure 3a presents the dynamic thermo-electric model created in Matlab/Simulink 2020b software by applying the s-function block diagram used for differential equations, while Figure 3b presents a static thermal model created in Ansys Transient Thermal 2020 R2 software for FEM analysis.
The input parameters of the dynamic-thermal model made in Matlab/Simulink were solar radiation G, ambient temperature Ta, wind speed v, output power PDC and, fill factor FF, while the parameters for the dynamic electric model were solar radiation G and operating temperature of the PV module T. On the other hand, the parameters of the static-thermal model made in Ansys Transient Thermal were solar radiation G, ambient temperature Ta and, convective heat transfer coefficient hconv. The validation of the existing dynamic model [10] with the static model was performed, as well. The results of both models are shown in Figure 4 and Figure 5.
The largest temperature deviations occur more or less on days with a higher proportion of direct solar radiation (clear days). On average, the temperature error for 15 days is 0.32 °C (dynamic-thermal) and 0.63 °C (static-thermal). Figure 6 shows the RMSE and MAE values obtained for different weather conditions: clear, cloudy and overcast.
It is clear that there are smaller temperature deviations in the case of the dynamic thermal model, as it is shown by the dynamic responses. Similar results are indicated by other authors [10,21,22]. It can be observed that on overcast days, there is a very small error of RMSE and MAE, due to smaller influence of direct solar radiation. In this case, the model is especially influenced by the ambient temperature Ta and the wind speed v. Therefore, it was found that the pyranometers mounted on the dual-axis PV tracking systems measure the solar radiation with a significant error. The measurement error occurs due to non-compliance with the proposed calibration time by the manufacturer, which is also shown in Table 1 (calibration time). Temperature deviations are also affected by the missing diffuse component of solar radiation, which is not measured by pyranometers described in this study. Another important reason for the solar radiation measurement errors is dirt [45]. The dirt is accumulated on the pyranometer glass due to the weather conditions and must be cleaned once per year.
Influence of measurement error of solar radiation seen as an inner factor of the electric model for the calculation of the output power, will be presented below. However, as an essential part of the thermal models, optical loss (absorptivity, transmissivity and reflectivity), that significantly contributes to the increase or decrease of the proportion of solar radiation, strongly depends on the angle of incidence of the Sun’s rays. In our case, the measurements were performed on a dual-axis PV tracking system that tracks the Sun’s path (inclination and orientation) once per 4 min. Thus, a change in the inclination and orientation was predicted to calculate absorptivity, transmissivity and reflectivity by ±3° incident angle of the Sun’s rays. Aforementioned, reflectivity, transmissivity and absorptivity are described by Snell’s law as a function of the incident angle of the Sun’s rays.
Meteorological and experimental data were also used for output power calculation and validation by using a dynamic electric model (double diode model) and already validated static electric model (empirical equation [10,29,33]). The validation results of both models are shown in Figure 7 and Figure 8.
The largest output power deviations occur on days with a high to a medium proportion of direct solar radiation (clear and cloudy days). On average, the output power error for 15 days is 3.70 W (dynamic-electric model) and 4.06 W (static-electric model). Figure 9 shows the RMSE and MAE values obtained for different weather conditions: clear, cloudy and overcast.
For the output power calculation, the static model (empirical equation) represents a simple correlation between the output power P, solar radiation G and operating temperature of the PV module T, while the double diode model considers a more accurate calculation, including several PV cell characteristics. However, the deviation between those two models is extremely small. The RMSE and MAE values differ by only 0.37 W and 0.19 W on average between the static and dynamic electric model. Solar radiation G has the greatest influence on the output power of the PV module, followed by the operating temperature of the PV module T and afterward, the air mass factor AM (which was neglected due to the small influence). To explain the deviation of the output power, the actual measured temperature values of the PV module were used as input variables. It turned out that the output power was only 1%–2% more accurate, which confirms the accuracy of the thermal models. Based on the deviation between the calculated temperature distribution and the output power of the PV module, the assumption of incorrect measurements of solar radiation was confirmed. The output power of PV modules is also significantly affected by degradation, which reduces the output power of the PV module by 1% annually [46]. Degradation of PV modules involves many types of effects such as cell cracking, yellowing, browning and more [47,48]. The degradation rate takes effect when the output power of the PV module is reduced by at least 10%. However, high-efficiency PV modules with a 50% degradation rate can be more efficient than low-efficiency PV modules with a lower degradation rate [43]. Regardless of the error of measuring devices, the proposed dynamic thermo-electric model consisting of a dynamic thermal model presented in [10,21,22,41,42,43,44] and a dynamic electric model (double diode model) represent a good agreement between measured and simulated results.

4. Discussion

Our literature review has shown that there are currently quite a few different models (both static and dynamic) that summarize the temperature distribution in the PV module and/or the output power of the PV module. The models are presented dynamically in most cases, but very few models consist of a dynamic thermal and electrical part. Therefore, this paper aims to present a novel dynamic thermo-electric model of the PV module based on known equations involving different parameters given in various dependencies. In most studies, the temperature distribution in the PV module was presented for only one or three layers, while our study takes into account all five layers (glass, EVA, PV cell, EVA and tedlar). Optical losses of the thermal model are presented as a function of the incidence angle of the Sun’s rays, which is very important for fixed PV modules. The RMSE and MAE values for cloudy and overcast days are in the same range or even better compared to the results of other studies [10,22,30], while more significant deviations are observed in the case of sunny days due to measurement error. As described in Section 2.2, the calculation of the output power of the PV module is based on the double diode model. Some specific parameters are presented as a function of the solar radiation and the operating temperature of the PV module, which gives additional adaptability and accuracy to the model. The double diode model has already been very well presented in specific studies and represents an exact way of determining the output power of the PV module. From this point of view, the paper aimed to use the accuracy of a double diode model in combination with the dynamics of the thermal model to present a novel dynamic thermo-electric model of the PV module. Compared to the results of other studies [10], the double diode model results represent a more accurate assessment of the output power of the PV module, despite the measurement errors.

5. Conclusions

This paper presents a novel dynamic thermo-electric model of the PV module that consists of two interconnected parts via the operating temperature and output power of the PV module. The thermal model is described by heat balance equation for five different layers (glass, EVA, PV cell, EVA, tedlar), while the electric model is described by double diode model. The validation of the proposed model was made using the meteorological and experimental data of the presented dual-axis PV tracking system under outdoor conditions. Nevertheless, the thermal part of the model was additionally compared with the static model made in Ansys Transient Thermal, while the electric part was compared with a simple empirical equation for the output power calculation. The validation was made for three the most common types of weather conditions, namely clear, cloudy and overcast. The comparison of several models with each other was performed primarily due to the multi-criteria estimation and secondly due to the relatively large deviation between measured and simulated results. It was found that the measuring device (pyranometer) contains a measurement error due to several years of operation without calibration. However, the average RMSE and MAE values are 1.75 °C and 1.14 °C for the thermal part and 20.34 W and 10.97 W for the electrical part. The RMSE and MAE values differ between the static and dynamic thermal models by only 0.44 °C and 0.28 °C and between static and dynamic electric models by 0.37 W and 0.19 W on average. The advantage of the proposed model is that optical losses change as a function of the incident angle of the Sun’s rays and are not a constant value, which is generally very important for a fixed PV system. Apart from that, it is important to note that most of the parameters (both thermal and electrical) are also presented as a function of the solar radiation G and the operating temperature of the PV module T. The presented dynamic thermo-electric model will be upgraded and used in future research areas, especially to determine the coolant temperature in PV/T modules.

Author Contributions

Conceptualization, K.S. and S.S.; methodology, K.S.; software, K.S.; validation, K.S.; formal analysis, K.S.; investigation, K.S.; resources, S.S., M.H. and B.Š.; data curation, K.S.; writing—original draft preparation, K.S.; writing—review and editing, S.S. and K.D.; visualization, K.S. and K.D.; supervision, S.S., M.H., K.D. and B.Š.; project administration, S.S., M.H. and B.Š.; funding acquisition, S.S., M.H. and B.Š. All authors have read and agreed to the published version of the manuscript.

Funding

This research and the APC was funded by Slovenian Research Agency under grants Applied Electromagnetics P2-0114.

Institutional Review Board Statement

Not applicable.

Informed Consent Statement

Not applicable.

Conflicts of Interest

The authors declare no conflict of interest. The funders had no role in the design of the study; in the collection, analyses or interpretation of data; in the writing of the manuscript or in the decision to publish the results.

Nomenclature

PVphotovoltaic
PV/Tphotovoltaic/thermal
STCstandard test condition
RMSEroot mean square error
MAEmean absolute error
NOCTnominal operating cell temperature
MPPTmaximum power point tracking
EVAethylene-vinyl acetate
Quantities used in equations:
APVsurface area of the PV module
Cheat capacity
dthickness
Eg0bandwidth of cell material
FFfill factor
Gsolar radiation
GSTCinput signal
hcondconductive heat transfer coefficient
hconvconvective heat transfer coefficient
I01reverse saturation current of the first diode
I02reverse saturation current of the second diode
IDCdirect current
IMPP,STC
Iphphotocurrent
ISCshort-circuit current
ISC,STCmaximal output current
KBoltzmann constant (1.38065 × 10²³ J/K)
kthermal conductivity
Kiextinction coefficient
nreal refractive index
n1the diode ideality factor of the first diode
n2the diode ideality factor of the second diode
NSnumber of series-connected PV cells
PDCdirect output power
PSTCoutput power under STC conditions
qelectron charge (1.602 × 10¹⁹ C)
Rsseries resistance
Rshshunt resistance
Toperating temperature of the PV module
Taambient temperature
TSTCoutput signal
vwind speed
VDCdirect voltage
VMPP,STC
VOCopen-circuit voltage
VOC,STCopen-circuit voltage under STC conditions
VT1thermal voltage of the first diode
VT2thermal voltage of the second diode
αabsorptivity
Θ1angle of incidence
Θ2angle of reflection
μ P MPP temperature coefficient of PMPP
μ I SC temperature coefficient of ISC
μ V OC temperature coefficient of VOC
ρdensity
τgtransmissivity
φ1heat flux ratio
φ2thermal radiation flux

Appendix A

This appendix is intended to provide an additional presentation of mathematical modeling described in Section 2.2 and Section 2.3. A numerical method called Trapezoidal Rule—Backward Difference Formula of the 2nd order (TR-BDF2) was used to solve the implicit equation of the double diode model (described in Section 2.2). The photocurrent Iph, the reverse saturation current of the first I01 and second I02 diode and the thermal voltage of the first VT1 and second VT2 diode is expressed by (A1)–(A6):
I ph = ( I SC + μ I SC ( T T STC ) ) G G STC
I ph = I SC
I 01 = ( I SC ( exp V OC q T K N S n 1 1 ) ) ( T T STC ) 3 exp ( q E g 0 ( 1 T STC 1 T ) n 1 K )
I 02 = ( I SC ( exp V OC q T K N S n 2 1 ) ) ( T T STC ) 3 exp ( q E g 0 ( 1 T STC 1 T ) n 2 K )
V T 1 = n 1 K T q
V T 2 = n 2 K T q
where Eg0 is the bandwidth of cell material (1.21 eV), while n1 and n2 are the ideality factors of the first and second diode. The ideality factors n1 and n2 represent the diffusion and recombination current components for the double diode model, while their values range between 1 (ideal diode) and 2 (more realistic diode). In this study, the values of n1 and n2 were 1 and 1.2, respectively.
The convective hconv and conductive hcond heat transfer coefficients are expressed by (A7)–(A8) [49,50]:
h conv = 5.7 3.8 v
h cond . x y = ( d x k x + d y k y ) 1
where d is the layer thickness, k is the thermal conductivity of layers. The indexes x and y describes the current and next layer of the PV module. The absorptivity of the glass layer αg is expressed by (A9) [51]:
α g = 1 τ a
The transmissivity of the glass layer τa is expressed by (A10):
τ a = exp K i d cos Θ 2
where Ki is extinction coefficient (Ki,glass = 3.55 × 10⁻⁶; Ki,EVA = 2.34 × 10⁻⁶), d is the thickness of a layer and Θ2 is the angle of reflection (expressed by (A11)) [52].
Θ 2 = sin 1 ( sin Θ 1 n )
where Θ1 is the angle of incidence and n is the real refractive index (nglass = 1.52; nEVA = 1.48). τ is the transmissivity that considers multiple refractions and reflections between glass layer and PV cell, and is expressed by (A13):
τ r = 1 2 ( 1 tan ( Θ 2 Θ 1 ) tan ( Θ 2 + Θ 1 ) 1 + tan ( Θ 2 Θ 1 ) tan ( Θ 2 + Θ 1 ) + 1 sin ( Θ 2 Θ 1 ) sin ( Θ 2 + Θ 1 ) 1 + sin ( Θ 2 Θ 1 ) sin ( Θ 2 + Θ 1 ) )
τ = τ a τ r

References

  1. Deželak, K.; Bracinik, P.; Sredenšek, K.; Seme, S. Proportional-Integral Controllers Performance of a Grid-Connected Solar PV System with Particle Swarm Optimization and Ziegler–Nichols Tuning Method. Energies 2021, 14, 2516. [Google Scholar] [CrossRef]
  2. Garcia-Torres, F.; Vazquez, S.; Moreno-Garcia, I.M.; Gil-de-Castro, A.; Roncero-Sanchez, P.; Moreno-Munoz, A. Microgrids Power Quality Enhancement Using Model Predictive Control. Electronics 2021, 10, 328. [Google Scholar] [CrossRef]
  3. González, I.; Calderón, A.J.; Portalo, J.M. Innovative Multi-Layered Architecture for Heterogeneous Automation and Monitoring Systems: Application Case of a Photovoltaic Smart Microgrid. Sustainability 2021, 13, 2234. [Google Scholar] [CrossRef]
  4. Dairi, A.; Harrou, F.; Sun, Y.; Khadraoui, S. Short-Term Forecasting of Photovoltaic Solar Power Production Using Variational Auto-Encoder Driven Deep Learning Approach. Appl. Sci. 2020, 10, 8400. [Google Scholar] [CrossRef]
  5. Wang, J.; Li, K.-J.; Liang, Y.; Javid, Z. Optimization of Multi-Energy Microgrid Operation in the Presence of PV, Heterogeneous Energy Storage and Integrated Demand Response. Appl. Sci. 2021, 11, 1005. [Google Scholar] [CrossRef]
  6. Damianaki, K.; Christodoulou, C.A.; Kokalis, C.-C.A.; Kyritsis, A.; Ellinas, E.D.; Vita, V.; Gonos, I.F. Lightning Protection of Photovoltaic Systems: Computation of the Developed Potentials. Appl. Sci. 2021, 11, 337. [Google Scholar] [CrossRef]
  7. Seritan, G.C.; Enache, B.A.; Adochiei, F.C.; Argatu, F.C.; Christodoulou, C.; Vita, V.; Toma, A.R.; Gandescu, C.H.; Hathazi, F.I. Performance evaluation of photovoltaic panels containing cells with different bus bars configurations in partial shading conditions. Rev. Roum. Sci. Tech. Électrotechnique Énergétique 2020, 65, 67–70. [Google Scholar]
  8. Mussa, M.; Saleh, I. 1, Impact of Temperature Variation on PV-module Parameters and Performance. In Proceedings of the Sharjah Solar Energy Conference, Sharjah, United Arab Emirates, 16–22 February 2001. [Google Scholar]
  9. Kane, A.; Vishal, V. Performance enhancement of building integrated photovoltaic module using thermoelectric cooling. Int. J. Renew. Energy Res. 2013, 3, 320–324. [Google Scholar]
  10. Li, C.; Spataru, S.V.; Zhang, K.; Yang, Y.; Wei, H. A Multi-State Dynamic Thermal Model for Accurate Photovoltaic Cell Temperature Estimation. IEEE J. Photovolt. 2020, 10, 1465–1473. [Google Scholar] [CrossRef]
  11. Wiesenfarth, M.; Gamisch, S.; Kraus, H.; Bett, A.W. Investigation on 3-dimensional temperature distribution in a FLATCON-type CPV module. AIP Conf. Proc. 2013, 1556, 189–193. [Google Scholar]
  12. M’Sirdi, N.K.; Benabdellatif, M.; Tina, G.M.; Naamane, A. Dynamic Coupled Electrical and Thermal Model for PV-T Solar Energy Collectors. In Proceedings of the 5th International Symposium on Environment-Friendly Energies and Applications (EFEA), Roma, Italy, 24–26 September 2018; pp. 1–8. [Google Scholar]
  13. Hammami, M.; Torretti, S.; Grimaccia, F.; Grandi, G. Thermal and Performance Analysis of a Photovoltaic Module with an Integrated Energy Storage System. Appl. Sci. 2017, 7, 1107. [Google Scholar] [CrossRef] [Green Version]
  14. Kant, K.; Shukla, A.; Sharma, A.; Biwole, P.H. Heat transfer studies of photovoltaic panel coupled with phase change material. Solar Energy 2016, 140, 151–161. [Google Scholar] [CrossRef]
  15. Jung, D.E.; Lee, C.; Kim, K.H.; Do, S.L. Development of a Predictive Model for a Photovoltaic Module’s Surface Temperature. Energies 2020, 13, 4005. [Google Scholar] [CrossRef]
  16. Kratzenberg, M.G.; Beyer, H.G.; Colle, S.; Albertazzi, A. Uncertainty Calculations in Pyranometer Measurements and Application. In Proceedings of the International Solar Energy Conference (ASME), Denver, CO, USA, 8–13 July 2006; pp. 689–698. [Google Scholar]
  17. Coquilla, R.V.; Obermeier, J.; White, B.R. Calibration Procedures and Uncertainty in Wind Power Anemometers. Wind Eng. 2007, 31, 303–316. [Google Scholar] [CrossRef]
  18. Ross, A.G. Flat-plate photovoltaic module and array engineering. In Proceedings of the 1982 Annual Meeting of the American Section of the International Solar Energy Society, Houston, TX, USA, 1–5 June 1982; pp. 4321–4324. [Google Scholar]
  19. Faiman, D. Assessing the outdoor operating temperature of photovoltaic modules. Prog Photovolt. Res. Appl 2008, 16, 307–315. [Google Scholar] [CrossRef]
  20. King, D.; Boyson, W.; Kratochvil, J. Photovoltaic array performance model. Tech. Rep. 2004, 3535. [Google Scholar]
  21. Migliorini, L.; Molinaroli, L.; Simonetti, R.; Manzolini, G. Development and experimental validation of a comprehensive thermoelectric dynamic model of photovoltaic modules. Solar Energy 2017, 144, 489–501. [Google Scholar] [CrossRef]
  22. Barry, J.; Böttcher, D.; Pfeilsticker, K.; Herman-Czezuch, A.; Kimiaie, N.; Meilinger, S.; Schirrmeister, C.; Deneke, H.; Witthuhn, J.; Gödde, F. Dynamic model of photovoltaic module temperature as a function of atmospheric conditions. Adv. Sci. Res. 2020, 17, 165–173. [Google Scholar] [CrossRef]
  23. Yu, Q.; Hu, M.; Li, J.; Wang, Y.; Pei, G. Development of a 2D temperature-irradiance coupling model for performance characterizations of the flat-plate photovoltaic/thermal (PV/T) collector. Ren. Ener. 2020, 153, 404–419. [Google Scholar] [CrossRef]
  24. Perović, B.D.; Klimenta, D.O.; Jevtić, M.D.; Milovanović, M.J. A thermal model for open-rack mounted photovoltaic modules based on empirical correlations for natural and forced convection. Ther. Sci. 2019, 23, 3551–3566. [Google Scholar] [CrossRef] [Green Version]
  25. Zouine, M.; Akhsassi, M.; Erraissi, N.; Aarich, N.; Bennouna, A.; Mustapha, R.; Outzourhit, A. Mathematical Models Calculating PV Module Temperature Using Weather Data: Experimental Study. Lect. Notes Elec. Eng. 2018, 519, 630–639. [Google Scholar]
  26. Brihmat, F.; Mekhtoub, S. PV Cell Temperature/ PV Power Output Relationships Homer Methodology Calculation. Int. J. Sci. Res. Eng. Technol. 2014, 1, 0-0. [Google Scholar]
  27. Krauter, S.; Preiss, A. Comparison of module temperature measurement methods. In Proceedings of the 34th IEEE Photovoltaic Specialists Conference (PVSC), Philadelphia, PA, USA, 7–12 June 2009; pp. 333–338. [Google Scholar]
  28. Liao, W.; Heo, Y.; Xu, S. Evaluation of Temperature Dependent Models for PV Yield Prediction. In Proceedings of the 4th Building Simulation and Optimization Conference, Cambridge, UK, 11–12 September 2018. [Google Scholar]
  29. Pantic, L.S.; Pavlović, T.M.; Milosavljević, D.D.; Radonjic, I.S.; Radovic, M.K.; Sazhko, G. The assessment of different models to predict solar module temperature, output power and efficiency for Nis, Serbia. Energy 2016, 109, 38–48. [Google Scholar] [CrossRef]
  30. Osma-Pinto, G.; Ordóñez-Plata, G. Dynamic thermal modelling for the prediction of the operating temperature of a PV panel with an integrated cooling system. Ren. Ener. 2020, 152, 1041–1054. [Google Scholar] [CrossRef]
  31. Martínez, M.A.; Andújar, J.M.; Enrique, J.M. Temperature Measurement in PV Facilities on a Per-Panel Scale. Sensors 2014, 14, 13308–13323. [Google Scholar] [CrossRef] [PubMed] [Green Version]
  32. Siddiqui, M.U.; Arif, A.F.M.; Kelley, L.; Dubowsky, S. Three-dimensional thermal modeling of a photovoltaic module under varying conditions. Solar Energy 2012, 86, 2620–2631. [Google Scholar] [CrossRef]
  33. Vergura, S. A Complete and Simplified Datasheet-Based Model of PV Cells in Variable Environmental Conditions for Circuit Simulation. Energies 2016, 9, 326. [Google Scholar] [CrossRef]
  34. Olukan, T.A.; Emziane, M. A Comparative Analysis of PV Module Temperature Models. Energy Procedia 2014, 62, 694–703. [Google Scholar] [CrossRef] [Green Version]
  35. Bellia, H.; Youcef, R.; Fatima, M. A detailed modeling of photovoltaic module using MATLAB. NRIAG J. Ast. Geo. 2014, 3, 53–61. [Google Scholar] [CrossRef] [Green Version]
  36. Farivar, G.; Asaei, B. A New Approach for Solar Module Temperature Estimation Using the Simple Diode Model. IEEE Trans. Energy Convers. 2011, 26, 1118–1126. [Google Scholar] [CrossRef]
  37. Bana, S.; Saini, R.P. A mathematical modeling framework to evaluate the performance of single diode and double diode based SPV systems. Energy Rep. 2016, 2, 171–187. [Google Scholar] [CrossRef] [Green Version]
  38. Alam, M.S.; Alouani, A.T.; Azeem, M.F. Efficient prediction of maximum PV module output power through dynamic modeling. Sustain. Energy Technol. Assess. 2015, 11, 27–35. [Google Scholar] [CrossRef]
  39. Hansen, C.; King, B. Determining series resistance for equivalent circuit models of a PV module. IEEE J. Photovolt. 2019, 9, 538–543. [Google Scholar] [CrossRef]
  40. Photovoltaic Modules—PVF 260. Available online: http://www.pvfuture.eu/static/uploaded/pdf/PVF60M_SLO.pdf (accessed on 26 April 2021).
  41. Armstrong, A.; Hurley, W.G. A thermal model for photovoltaic panels under varying atmospheric conditions. Appl. Therm. Eng. 2010, 30, 1488–1495. [Google Scholar] [CrossRef]
  42. Lobera, D.T.; Valkealahti, S. Dynamic thermal model of solar PV systems under varying climatic conditions. Solar Energy 2013, 93, 183–194. [Google Scholar] [CrossRef]
  43. Dhimish, M.; Alrashidi, A. Photovoltaic Degradation Rate Affected by Different Weather Conditions: A Case Study Based on PV Systems in the UK and Australia. Electronics 2020, 9, 650. [Google Scholar] [CrossRef] [Green Version]
  44. Du, Y.; Fell, C.J.; Duck, B.; Chen, D.; Liffman, K.; Zhang, Y.; Gu, M.; Zhu, Y. Evaluation of photovoltaic panel temperature in realistic scenarios. Energy Convers. Manag. 2016, 108, 60–67. [Google Scholar] [CrossRef]
  45. Jiang, Y.; Lu, L. Experimentally Investigating the Effect of Temperature Differences in the Particle Deposition Process on Solar Photovoltaic (PV) Modules. Sustainability 2016, 8, 1091. [Google Scholar] [CrossRef] [Green Version]
  46. Kudelas, D.; Taušová, M.; Tauš, P.; Gabániová, Ľ.; Koščo, J. Investigation of Operating Parameters and Degradation of Photovoltaic Panels in a Photovoltaic Power Plant. Energies 2019, 12, 3631. [Google Scholar] [CrossRef] [Green Version]
  47. Frick, A.; Makrides, G.; Schubert, M.; Schlecht, M.; Georghiou, G.E. Degradation Rate Location Dependency of Photovoltaic Systems. Energies 2020, 13, 6751. [Google Scholar] [CrossRef]
  48. Rajput, P.; Malvoni, M.; Manoj Kumar, N.; Sastry, O.S.; Jayakumar, A. Operational Performance and Degradation Influenced Life Cycle Environmental–Economic Metrics of mc-Si, a-Si and HIT Photovoltaic Arrays in Hot Semiarid Climates. Sustainability 2020, 12, 1075. [Google Scholar] [CrossRef] [Green Version]
  49. Sartori, E. Convection coefficient equations for forced air flow over flat surfaces. Solar Energy 2006, 80, 1063–1071. [Google Scholar] [CrossRef]
  50. Ceylan, I.; Yilmaz, S.; İnanç, Ö.; Ergün, A.; Gürel, A.E.; Acar, B.; Aksu, A.I. Determination of the heat transfer coefficient of PV panels. Energy 2019, 175, 978–985. [Google Scholar] [CrossRef]
  51. Santbergen, R.; van Zolingen, R.J.C. The absorption factor of crystalline silicon PV cells: A numerical and experimental study. Sol. Energy Mater. Sol. Cells 2008, 92, 432–444. [Google Scholar] [CrossRef]
  52. Green, M.A. Self-consistent optical parameters of intrinsic silicon at 300K including temperature coefficients. Sol. Energy Mater. Sol. Cells 2008, 92, 1305–1310. [Google Scholar] [CrossRef]
Figure 1. Measurement and experimental system: (1) Dual-axis PV tracking system; (2) Ambient temperature sensor; (3) Solar radiation sensor—pyranometer; (4) Temperature sensor; and (5) DC/AC inverter. @Laboratory for Applied Electrical Engineering, Faculty of Energy Technology, University of Maribor.
Applsci 11 05287 g001
Figure 2. Meteorological and experimental data of the density of solar radiation G, wind speed v, ambient temperature Ta, current IDC and voltage VDC.
Applsci 11 05287 g002
Figure 3. A thermo-electric model: (a) Dynamic—Matlab/Simulink; (b) Static—Ansys Transient Thermal.
Applsci 11 05287 g003
Figure 4. Validation of static thermal model (Ansys Transient Thermal) with measurements (for 15 days in March 2021).
Applsci 11 05287 g004
Figure 5. Validation of dynamic thermal model (Matlab/Simulink) with measurements (for 15 days in March 2021).
Applsci 11 05287 g005
Figure 6. Comparison of static and dynamic thermal models for RMSE and MAE under different weather conditions.
Applsci 11 05287 g006
Figure 7. Validation of the static electric model (Matlab/Simulink-empirical equation) with experimental data (for 15 days in March 2021).
Applsci 11 05287 g007
Figure 8. Validation of the dynamic electric model (Matlab/Simulink-double diode model) with experimental data (for 15 days in March 2021).
Applsci 11 05287 g008
Figure 9. Comparison of the static and dynamic electric model for RMSE and MAE under different weather conditions.
Applsci 11 05287 g009
Table 1. Characteristics of measurement devices.
UncertaintyCalibration
Temperature sensor: DS18x20±0.5 °C
(from −10 to 85 °C)
6 years ago
Wind speed sensor: VMT107A±0.5 m/s6 years ago
Solar radiation sensor—pyranometer:
Kipp&Zonen SP Lite 2
<1%6 years ago
Ambient temperature sensor:
TPR 159 (Pt100)
±0.15 °C6 years ago
AC measurement—Power Meter:
Siemens Sentron PAC4200
Current: ±0.2%
Voltage: ±0.2%
3 months ago
DC measurement—Hall Effect Sensor: T201DCH100Current: ±0.5%
Voltage: ±0.5%
3 months ago
Table 2. Electrical parameters of the considered mono-crystalline PV module for STC.
PV Future—PVF 60M
Dimensions (l × w × s) [mm]993 × 1648 × 40
Cell size [mm2]156 × 156
PMPP [W]260
VMPP [V]31
IMPP [A]8.45
VOC [V]37.8
ISC [A]8.9
μ I SC [%/°C]0.040
μ V OC [%/°C]−0.330
μ P MPP [%/°C]−0.445
NOCT [°C]45
Number of series connected cells60
Table 3. Thermal and mechanical parameters of the considered mono-crystalline PV module.
ρ [kg/m3]C [J/kgK]k [W/mK]d [mm]
Glass30005001.84
EVA96020900.350.4
PV cell23306771480.3
Tedlar (PVF)120012500.20.4
Publisher’s Note: MDPI stays neutral with regard to jurisdictional claims in published maps and institutional affiliations.

