1. Introduction
The development of information technologies has caused data processing to be very difficult without the use of electronic devices in present times. Regardless of whether the data are edited, printed or transmitted, they take the form of electrical signals with various structures. These signals control the operation of various elements of electronic devices, and, consequently, the processed data can be observed on a monitor, printed or transmitted over long distances. These processes are also accompanied by other events, such as electromagnetic, acoustic or vibration emissions. Their formation is a natural phenomenon, accepted by a typical user of electronic devices. However, it is disturbing that these emissions can propagate into the surrounding space without major obstacles, and they can be used for non-invasive obtaining of information.
A 3D printer is an example of a device that can be considered a source of the above-mentioned emissions. 3D printing, also referred to as Material Extrusion 3D Printing (ME3DP) or Additive Manufacturing (AM), is the technology that enables creating 3D objects of various materials based on their computer model developed by using popular Computer Aided Design (CAD) type software. 3D printers are most commonly used to design the prototypes of various objects. An interesting overview of 3D printing techniques is presented in [
1,
2].
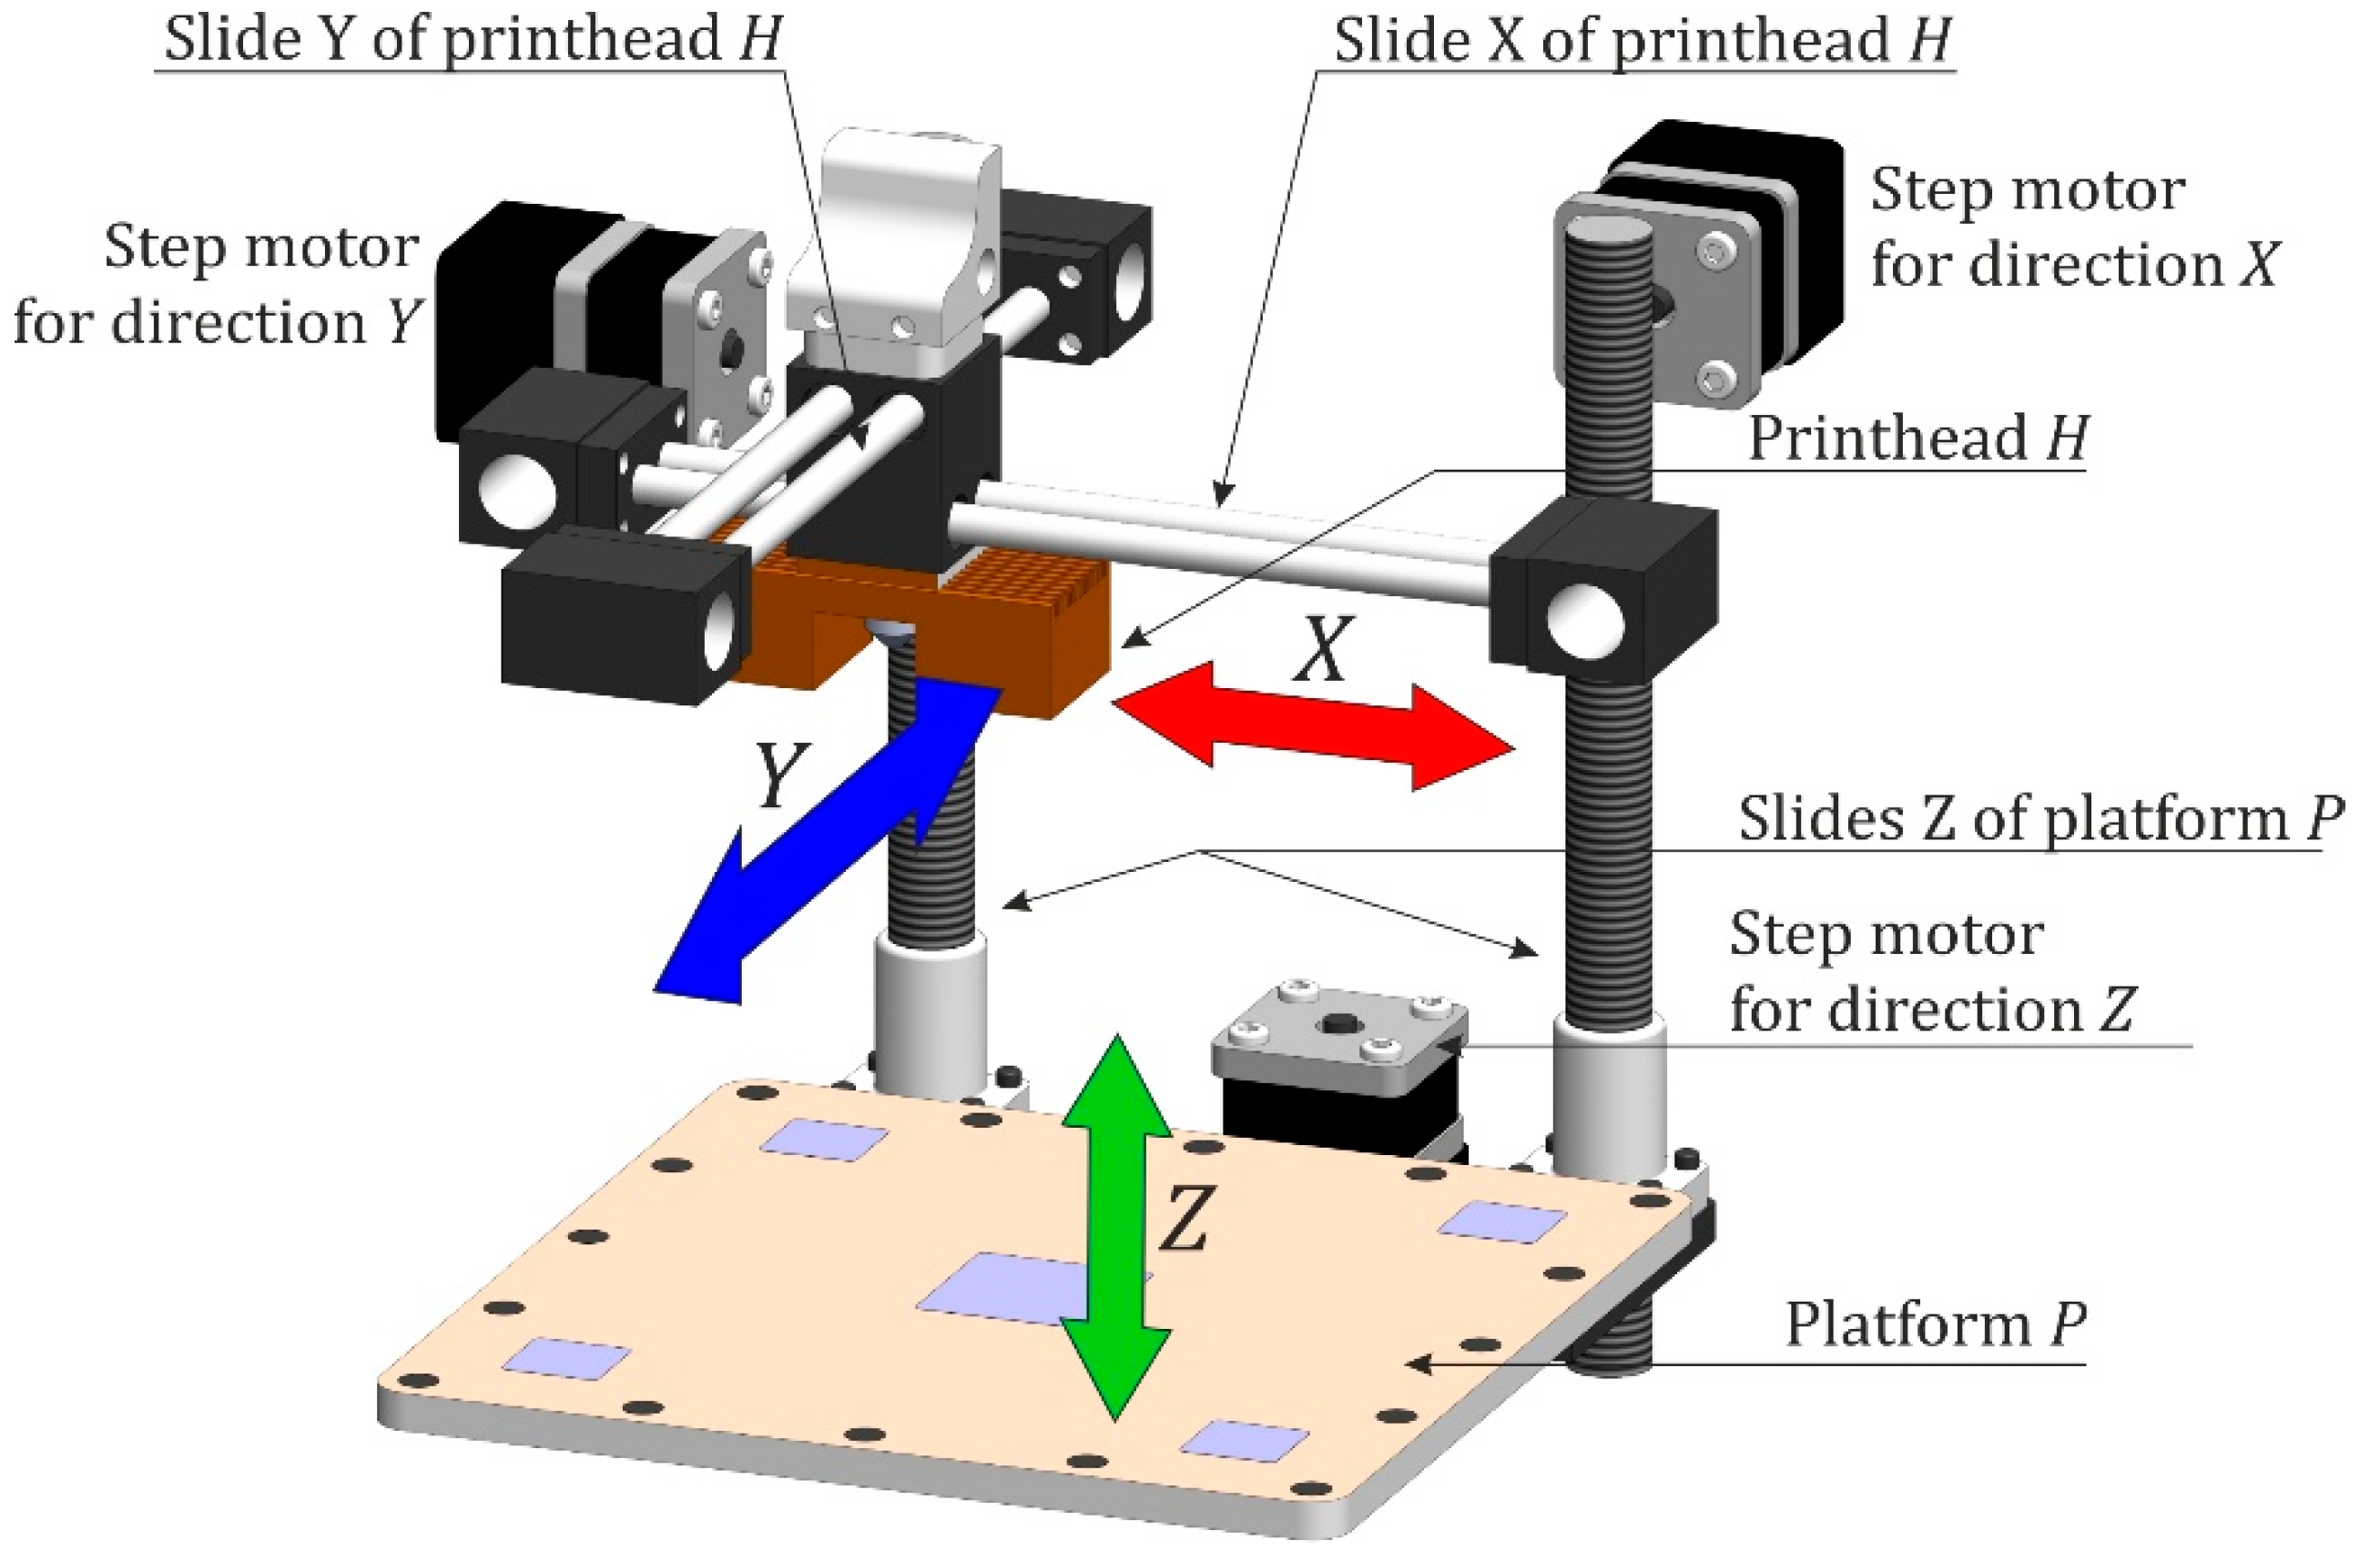
Fused Deposition Modelling (FDM) type machines are the most common 3D printers used in non-professional applications and small design companies. The FDM type 3D print technology, also referred to as Layer Plastic Deposition (LPD), is a solution that uses a continuous thermoplastic fiber, the so-called filament, to form the shape of an object. The hot filament in the printing zone is applied by using a movable, heated head that keeps the filament in a semi-liquid state. The printer head (printhead) is moved along the single print layer plane by the printer driver controlled by commands received from the computer-based analysis of the printed model object. The controller generates signals to control the operation of stepper motors moving the head in X and Y directions (horizontal plane). Movement in the Z direction (vertical plane) can be carried out in two ways: (1) head H moves up, while platform P remains stationary, (2) platform P moves down, at a constant head height (
Figure 1). The speed of releasing plastic material from the printhead can be controlled, allowing to stop the printing process and restart it in another device zone to obtain the complex geometry of the final product. The FDM printers currently offer a high resolution and at the same time provide a low purchase price and reduced costs of operation.
The experience of the authors of this article shows that each information processing device becomes a potential source of sensitive emissions. The type of signal that is most valuable in the process of non-invasive information acquisition depends on the type of device. In the case of graphic data processing, the most valuable emissions allowing for non-invasive acquisition of information about the processed data are electromagnetic emissions. They allow for a reliable reconstruction and acquisition of data about graphic symbols displayed on a computer monitor. Printing devices equipped with a laser system or a strip of LED diodes are an equally susceptible type of device for electromagnetic infiltration. In this case, the electrical signal as the revealing emission source, which controls the irradiation system of the photosensitive drum, has the characteristics of printed graphic data. Thus, the recorded electromagnetic emissions make it possible to obtain data on the content of printed documents.
The above-mentioned devices for displaying the processed data are well known and described from the point of view of susceptibility to electromagnetic infiltration. A less recognized device in terms of the possibility of non-invasive acquisition of data about printed objects is a 3D printer. This type of device is the basis of the work of many companies. They introduce new products to the consumer market. Before this happens, however, they must be presented in the form of preliminary print models. 3D printers are used in this process. Therefore, for the safety of companies and the protection of intellectual thought, 3D printers must be tested from the view point of the source of signals enabling the acquisition of design data of new packaging or new construction solutions for designed objects. Initial analyses of 3D printer design solutions have shown that these devices can be a source of valuable signals from the point of view of the effective wiretapping process. Among the types of signals noticeable during printing are vibration signals that accompany the operation of stepper motors and the movement of the platform.
The protection of industrial property is one of the most important focuses when developing a design. Thus, the question arises: does the use of a 3D printer in the design process guarantee the security of information about the printed object? During the operation of such a device, electromagnetic emissions from electrical signals, which control the operation of the printhead, as well as acoustic and vibration emissions related to the operation of stepper motors and platform movements arise. The existence of these emissions poses a great risk to the confidentiality of the printing process if they could be useful for reconstructing the shape of the printed object.
In [
3] it was shown that the 3D printer is an effective source of acoustic revealing emissions. The distinctive features of the signals recorded with the Behringer C-1U microphone allowed to reconstruct the shapes of simple spatial objects with satisfactory accuracy. However, the results obtained during the tests showed that in order to accurately reproduce the shapes of complex objects, it would be necessary to combine the effects of the analysis of signals other than only those from acoustic emissions.
If it is true that the printer produces vibrations that can reveal information about the printed object, then surely there is a way to obtain such information remotely—for example with a laser vibrometer. Such a device allows to detect vibrations on the order of micro- or even nanometers from a distance of several dozen meters.
The aim of this article is to show the threat to the security of information about an object printed by the 3D printer. An accelerometer was used to measure the vibrations of the printer, which was placed on its housing. It has been assumed that if such a measurement system shows the usefulness of these vibrations for the infiltration process during printing, they can also be detected from greater distances. In such a case, vibration signals, similarly to electromagnetic emissions, e.g., from computer monitors [
4], can be used for non-invasive acquisition of information.
An M200 Plus model manufactured by Zortrax was chosen to conduct the tests. This is a 350 × 430 × 505 mm device fitted with one printhead that makes it possible to print an object with size 200 × 200 × 180 mm. The unit is equipped with a 4-core processor and has an Android operating system.
For M200 Plus, the extruder mechanism (nozzle, heating system, stepper motor) is installed in the system in two mutually perpendicular guides. The movement of guides in X or Y directions is forced by two stepper motors. Each of them is responsible for moving the head in one axis. The motors are installed on the device rear wall. The third motor (invisible) responsible for work table movement (P platform) on the Z axis is placed on the printer base inside its housing. The stepper motor used to move the work table along the Z axis utilizes a threaded shaft. In total, the printer uses four stepper motors (three responsible for positioning the extruder and table, the fourth for moving the filament) that make up the main executive components [
5].
As opposed to computer monitors or laser printers [
6,
7,
8], the 3D printer is not a typical raster device. Indeed, one layer is printed in a plane, but at a specific moment the printhead can move along axis X or Y. In 3D printers, there is no source of a serial signal, being a medium providing data on the object being printed, including vision signal in monitors or laser printers [
9,
10]. The media used to carry this type of data can be stepper motor related signals responsible for positioning the printhead (extruder) or moving the platform.
The sensitivity of a 3D printer to infiltration results from the possibility to receive and analyze signals related mainly to head positioning operation (electromagnetic [
11,
12,
13], acoustic emissions [
14,
15,
16], vibration emissions [
17,
18,
19,
20], and power consumption [
11,
14]). In [
3] it was shown that the 3D printer was an effective source of acoustic compromising emanations. The distinctive features of signals recorded by using the Behringer C-1U microphone allowed to recreate the shape of simple 3D objects with an acceptable accuracy. However, the results obtained during investigations showed that to provide a precise reproduction of complex objects it is necessary to combine the analysis results of signals generated by various emanation sources. Therefore, another step aimed at analyzing the signals collected by vibration sensors (accelerometers) installed on the device housing. Such surveillance cannot be called non-invasive any longer because it requires direct access to the printer and hiding the accelerometer in its surroundings, or even inside its housing [
21]. Such a simple approach was taken for the needs of research; however, to provide a hidden surveillance, precise laser displacement sensors can be used to measure the movement of an object from large distances in values as small as micrometers.
The paper focuses on an assessment of the possibility to recreate the shape of printed objects by analyzing the printer housing vibrations induced by printhead movements in X and Y directions. Another relevant source of such signals is the movement of a printer platform that is carried out on the Z axis; recording the signals allows to identify the moments when one layer is finished and the machine starts printing another layer.
2. Test Conditions
Before starting the research on the usefulness of vibration signals for the recognition of printed objects, preliminary analyses of the examined 3D printer were performed. They concerned the identification of the main sources of vibrations in order to select the sensor mounting locations. The first attempts to install the sensor concerned the head printer and stepper motors. However, the obtained data did not allow to determine the length of the printed walls and the senses of the print head movement. Other sensor locations were looked for. Printer walls turned out to be the best choice. Sensor positioning was an important element of the success of the analyses. A particularly important issue was the proper levelling of the sensor and the alignment of the sensor axis with the X and Y axes—the directions of movement of the print head. Taking these elements into account made it possible to obtain results that allowed for the analysis of the possibility of recovering data on printed objects from the recorded vibration signals.
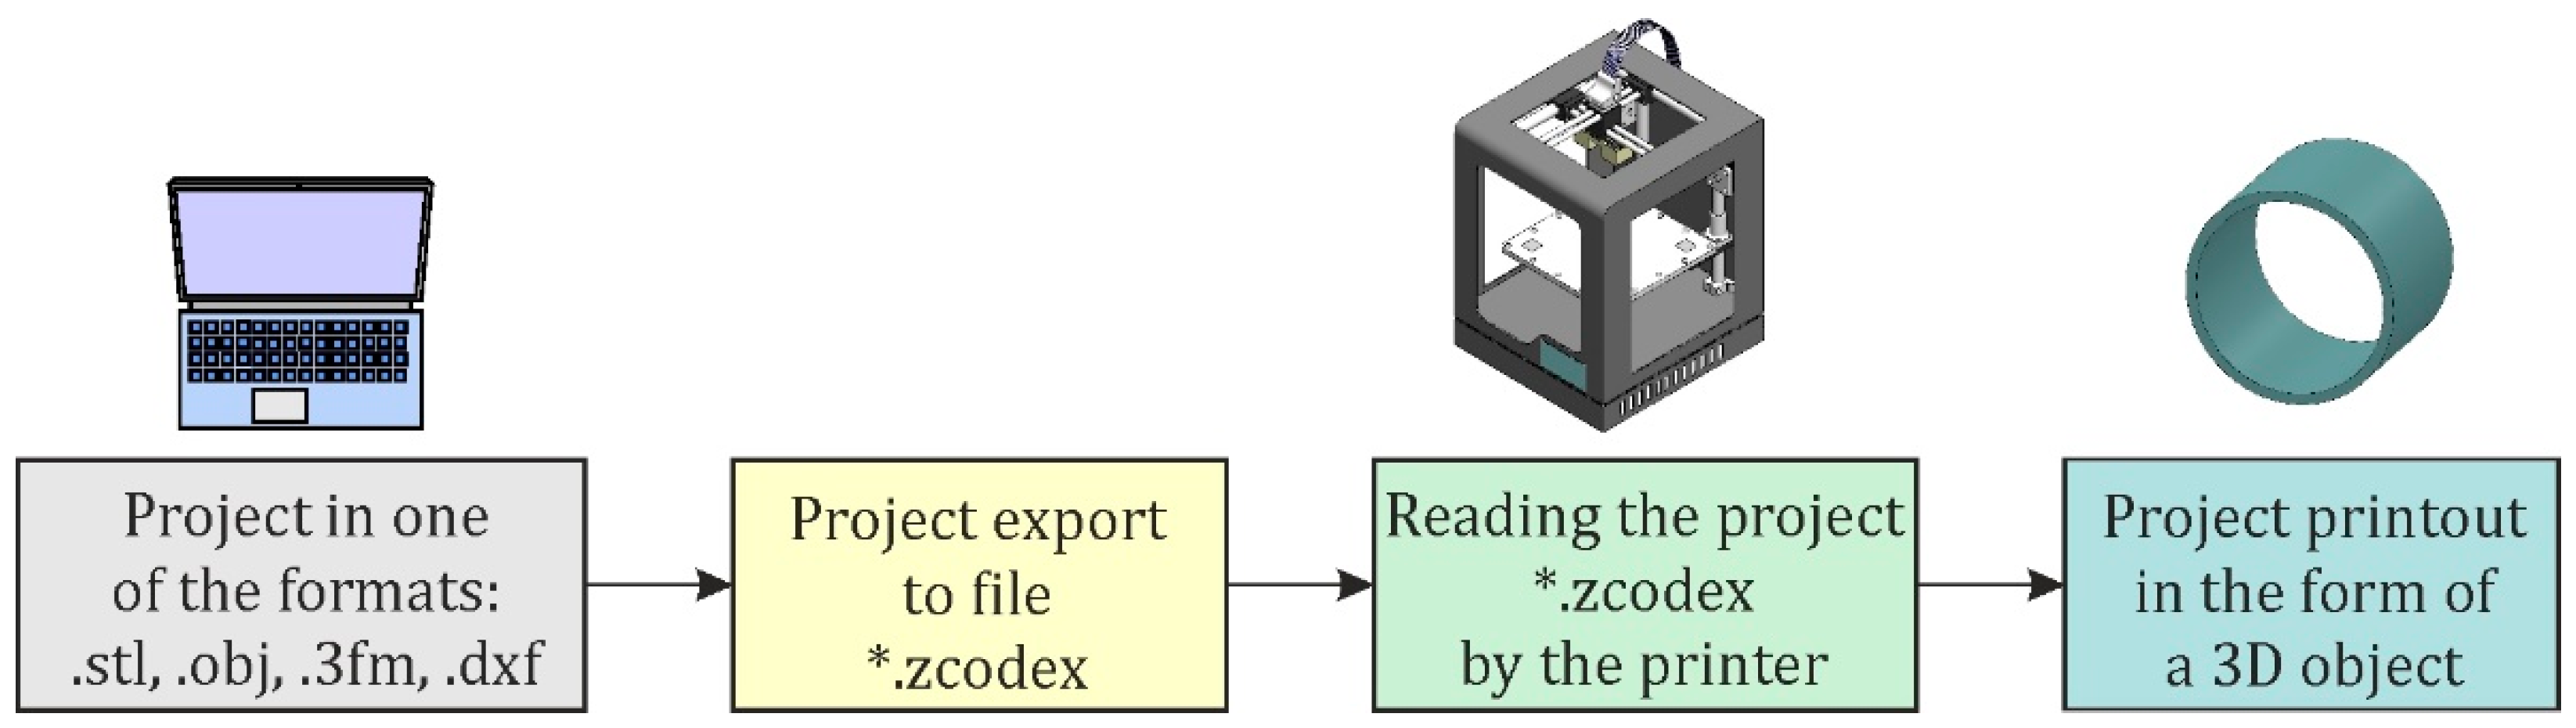
The tests were conducted by using the Zortrax M200 Plus 3D printer. This is an FDM technology-based printer that uses the so-called thermoplastics in the production process, where plastics are used to form object geometries at temperatures around 200 °C. The printed object can be designed by using generally available CAD applications and implemented in the printing process after converting into a file supported by the printer (
Figure 2).
Objects printed using this technology are created by applying the individual layers of semi-liquid material (filament) extruded from the heated nozzle. The filament is a line with a diameter of 1.75 mm or 2.85 mm and is wound on a spool (a filament with a diameter 1.75 mm was used for conducted tests—
Figure 3). On such a printer the head moves along the X and Y axes, while the printing platform moves along the Z axis (
Figure 1). To isolate them from other vibration signals, the tests were conducted in a screening cabin. The printer was placed directly on a laboratory bench, while the accelerometer was glued to the printer housing (
Figure 3).
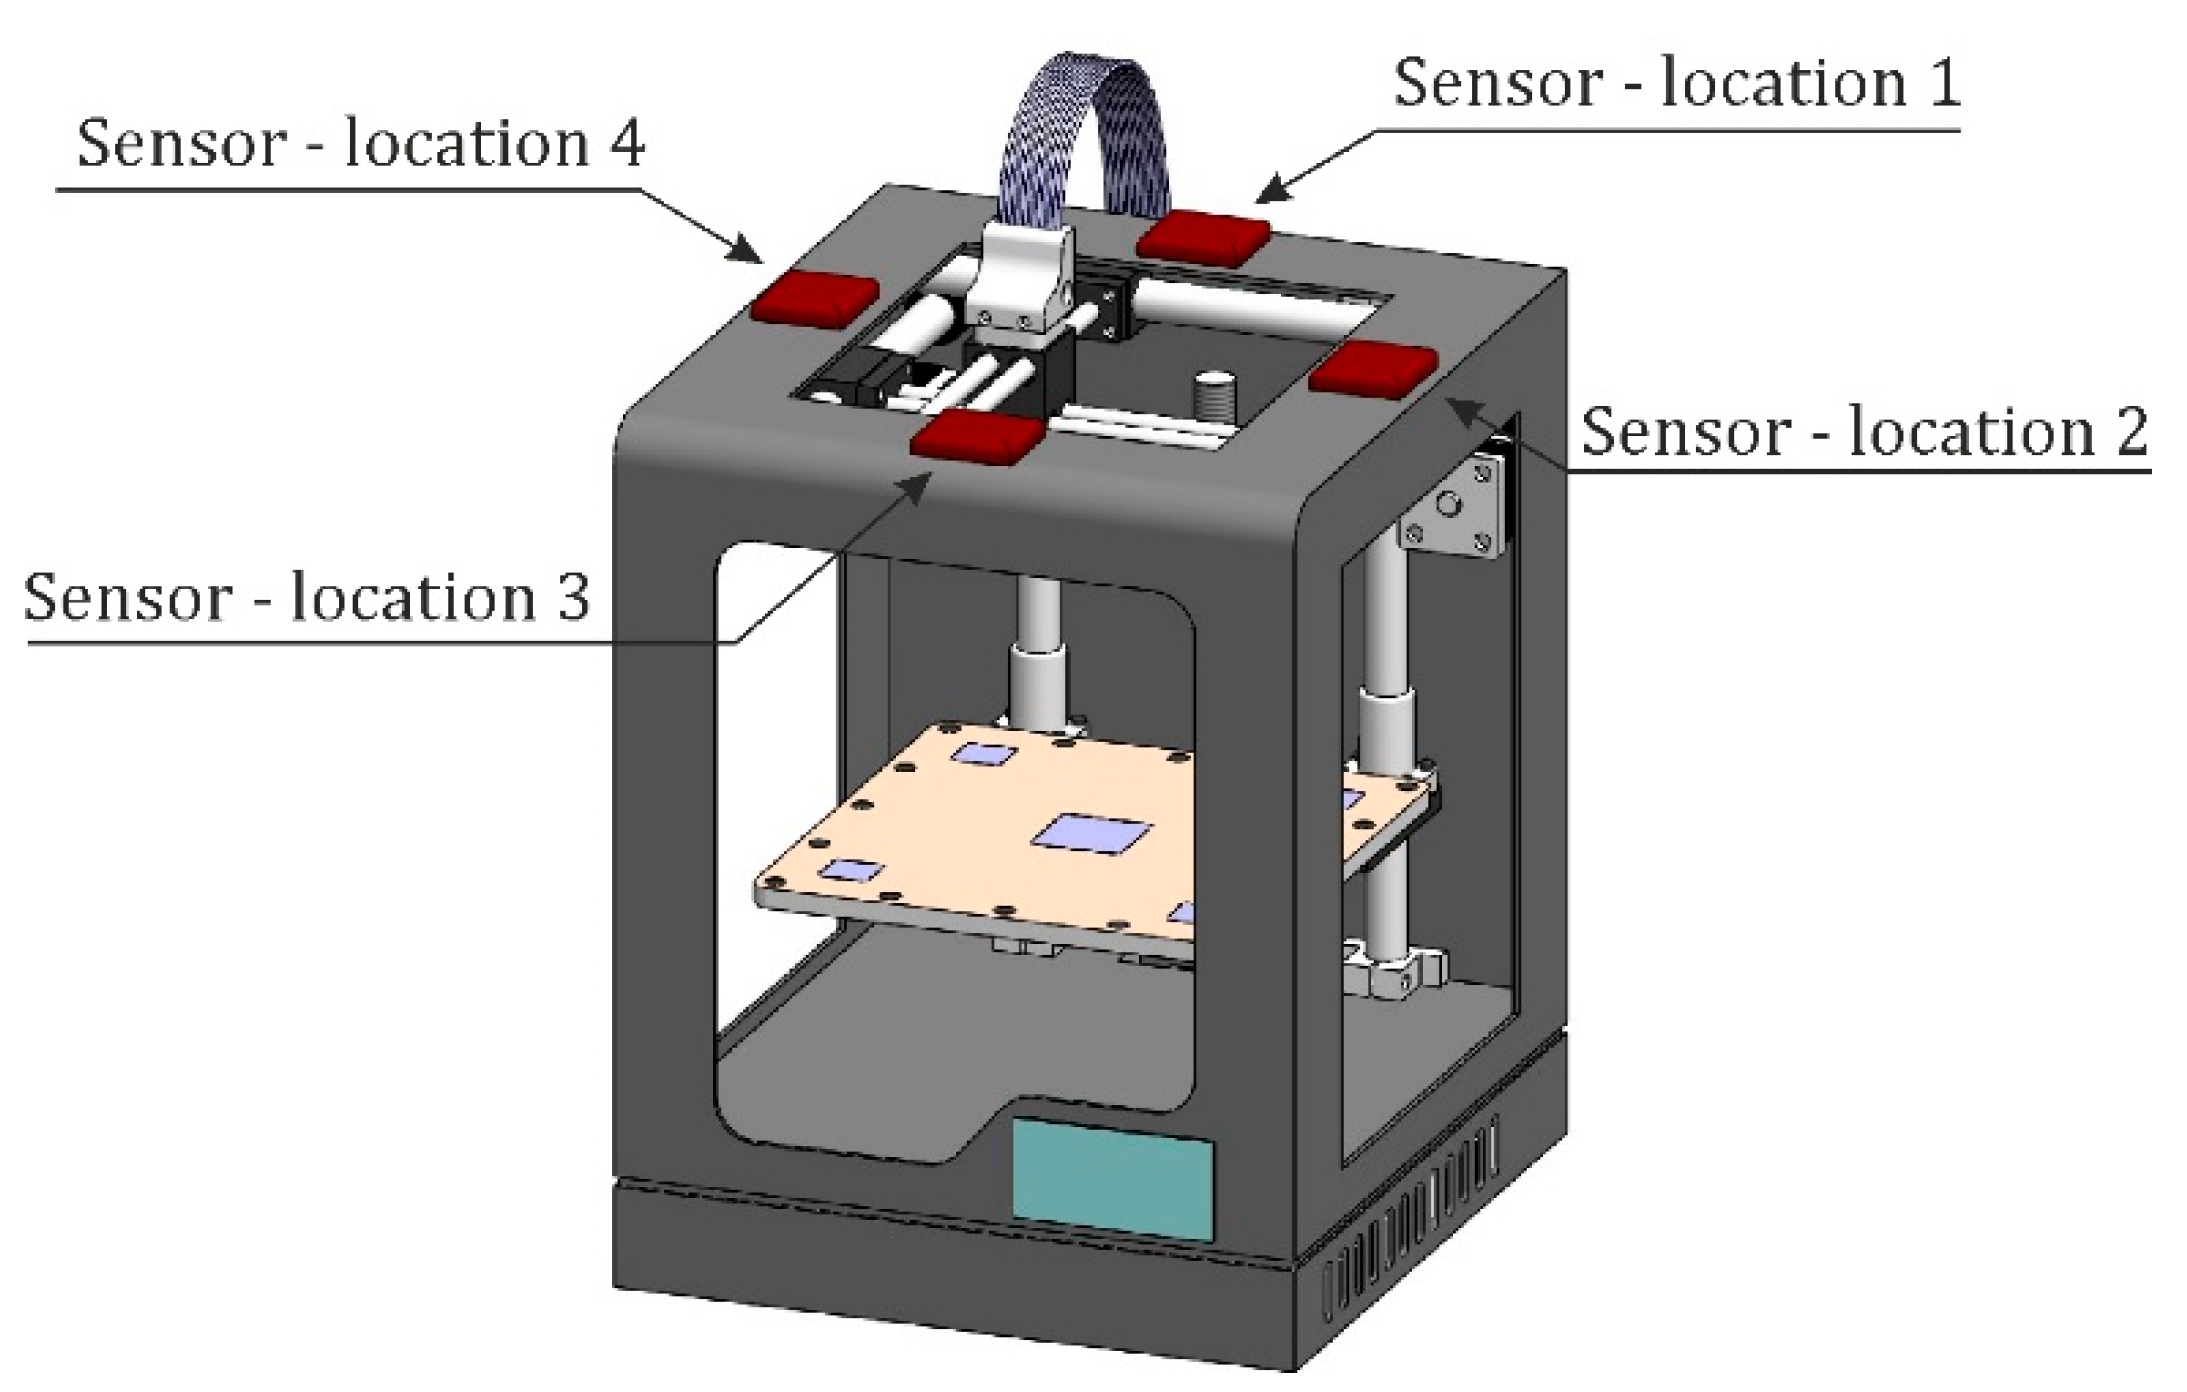
The results presented in this paper were preceded by numerous preliminary tests and recording of vibration signals, the source of which was the Zortrax M200 Plus printer. These tests were performed taking into account the different locations of the accelerometer on the upper part of the printer housing (on the rear, right, front and left sides, respectively—
Figure 4). The usability of three types of accelerometers (ADXL345, MMA8451 and LIS2DH) was tested. The analysis of spectrograms showed that the signals important for presenting the threat of non-invasive acquisition of data about the printed object are contained in a narrow band of frequencies (from several Hz to approx. 400 Hz). The quality of the spectrograms depended primarily on the type of accelerometer, but did not depend on its location. Finally, the most accurate LIS2DH accelerometer was selected and placed in position 1, as shown in
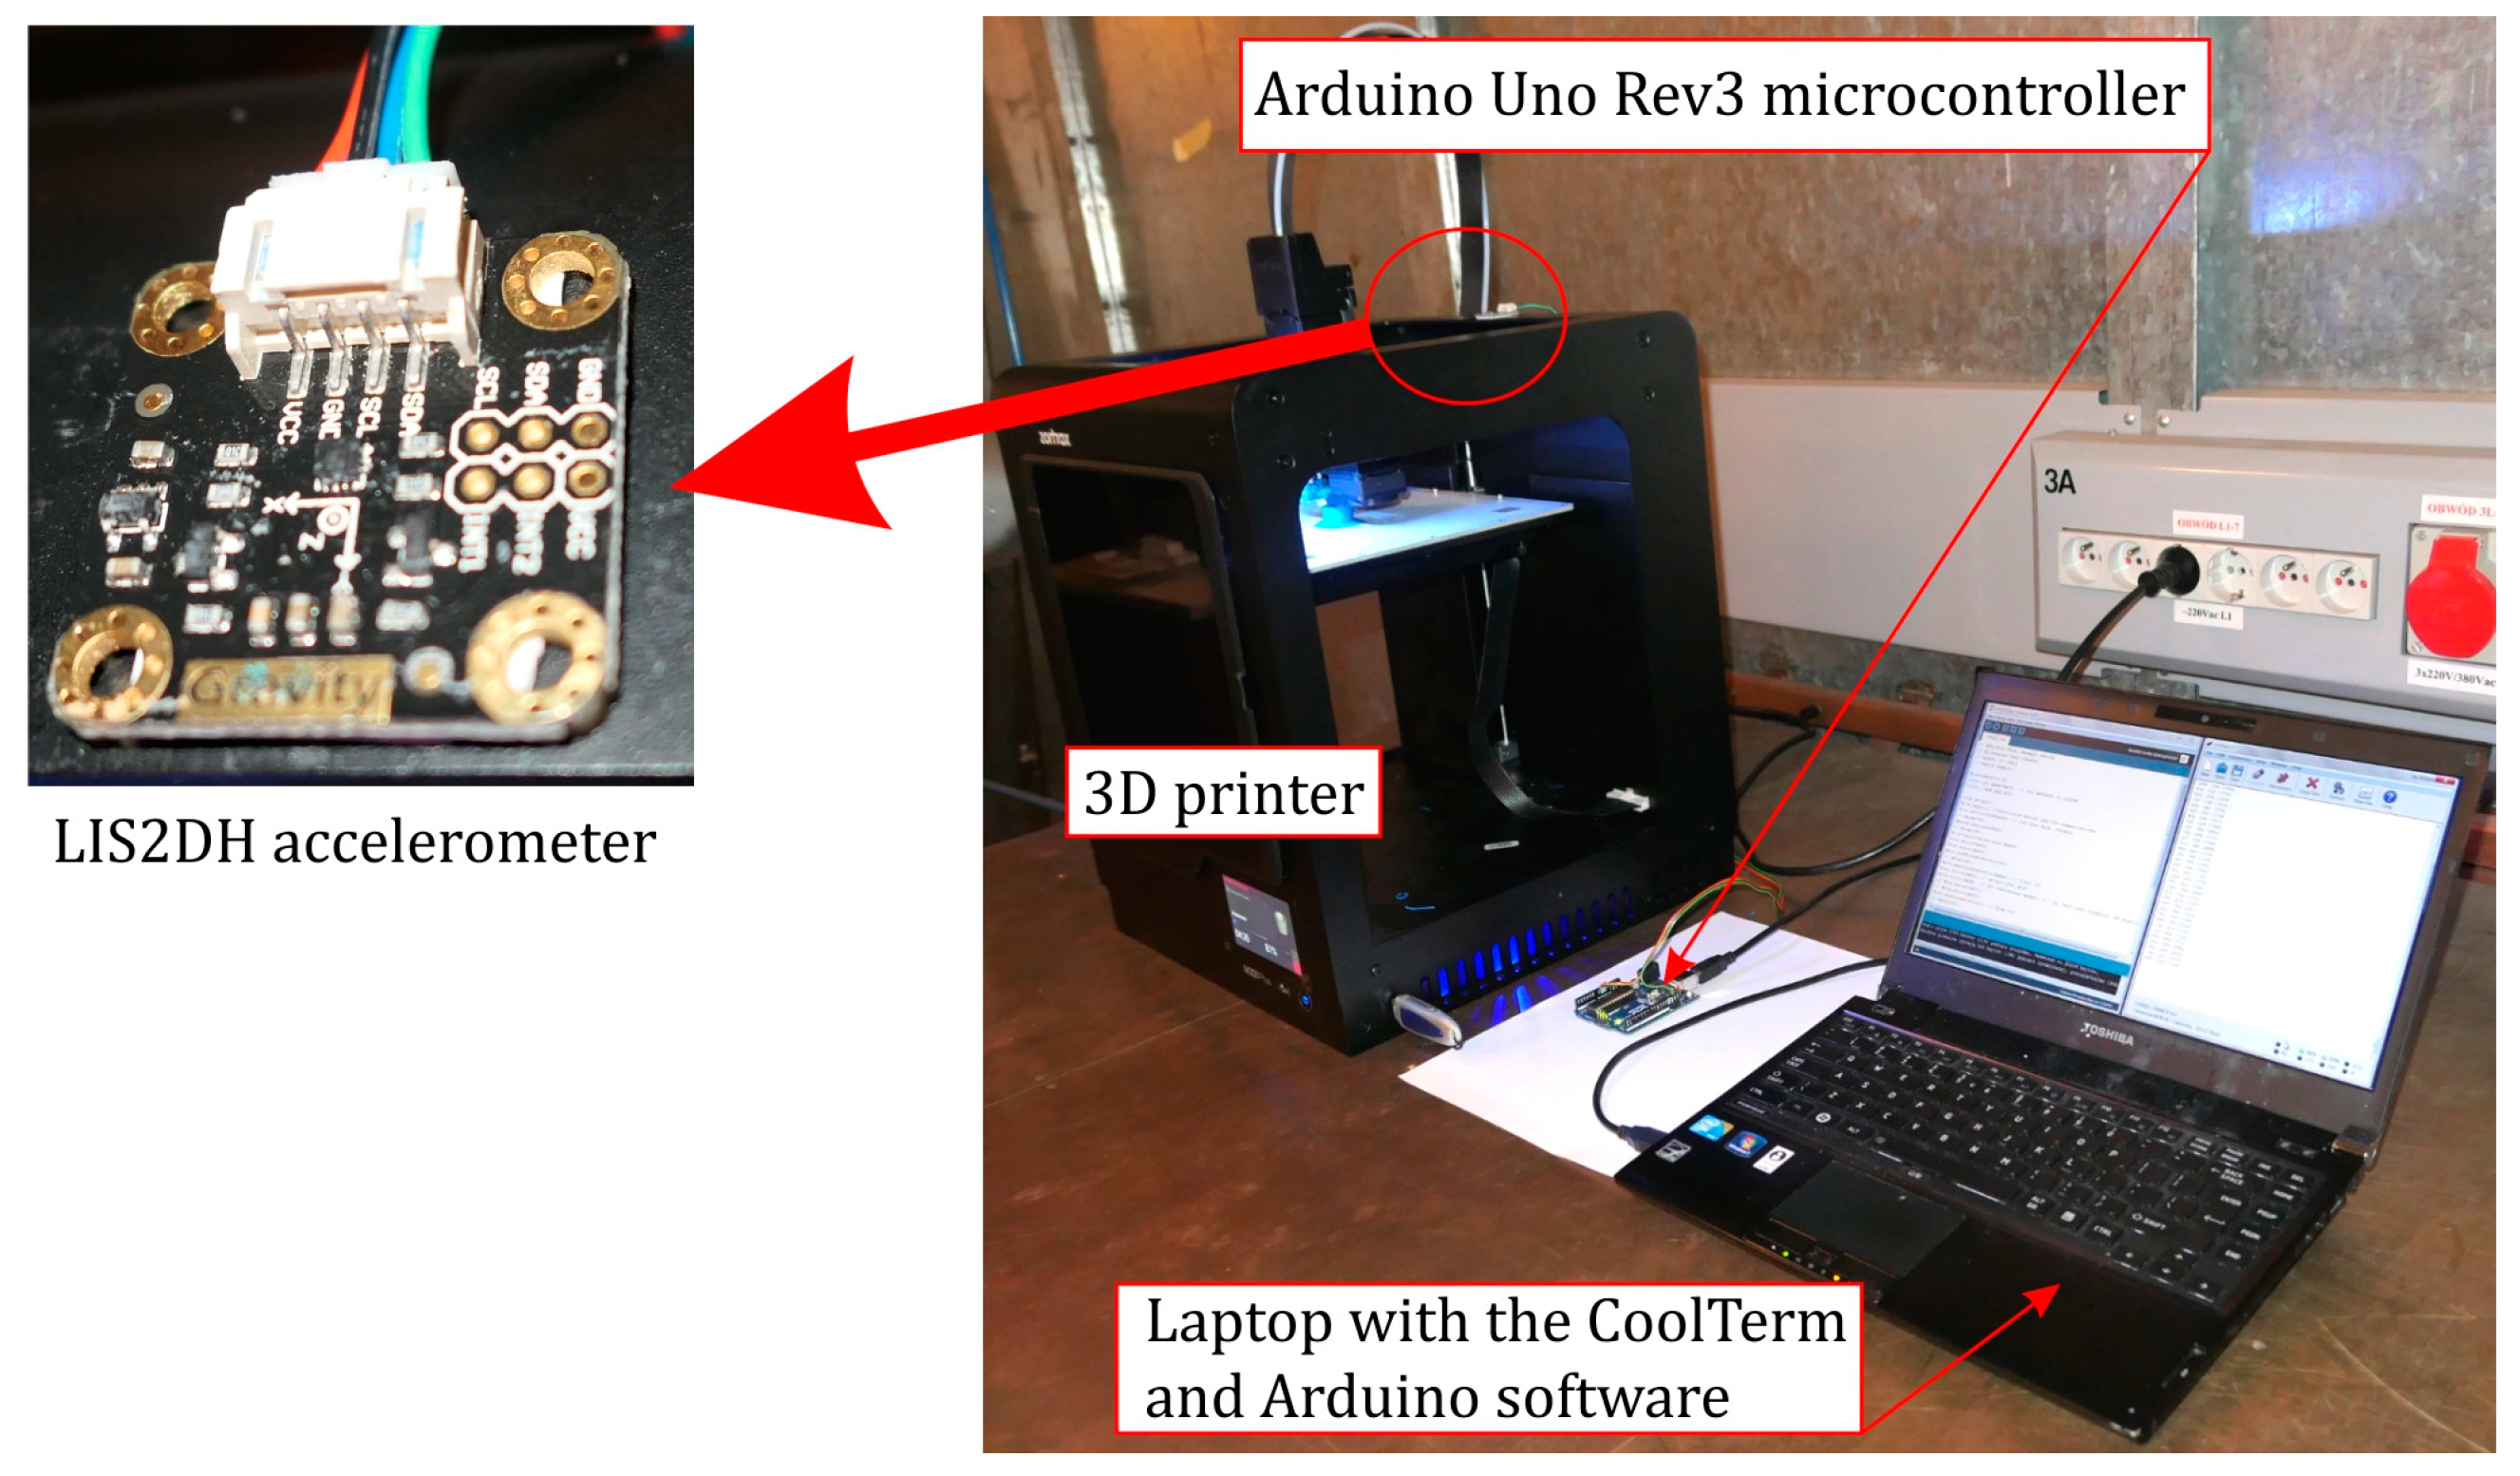
Figure 5. This sensor is used to measure an acceleration in three axes (X, Y and Z) in the ranges ±2 g, ±4 g, ±8 g or ±16 g, and it is capable of measuring accelerations with output data rates from 1 Hz to 5.3 kHz [
22].
The module is powered with a voltage from 3.3 V to 5 V and communicates through an I2C/SPI bus. Measurements were taken at a speed of 1000 12-bit samples per second for each axis (X, Y, Z), at the maximum accelerometer sensitivity (±2 g). In practice, this is the highest sampling rate that can be obtained for this accelerometer without distorting data. Attempts to use built-in filters further lowered this sampling rate.
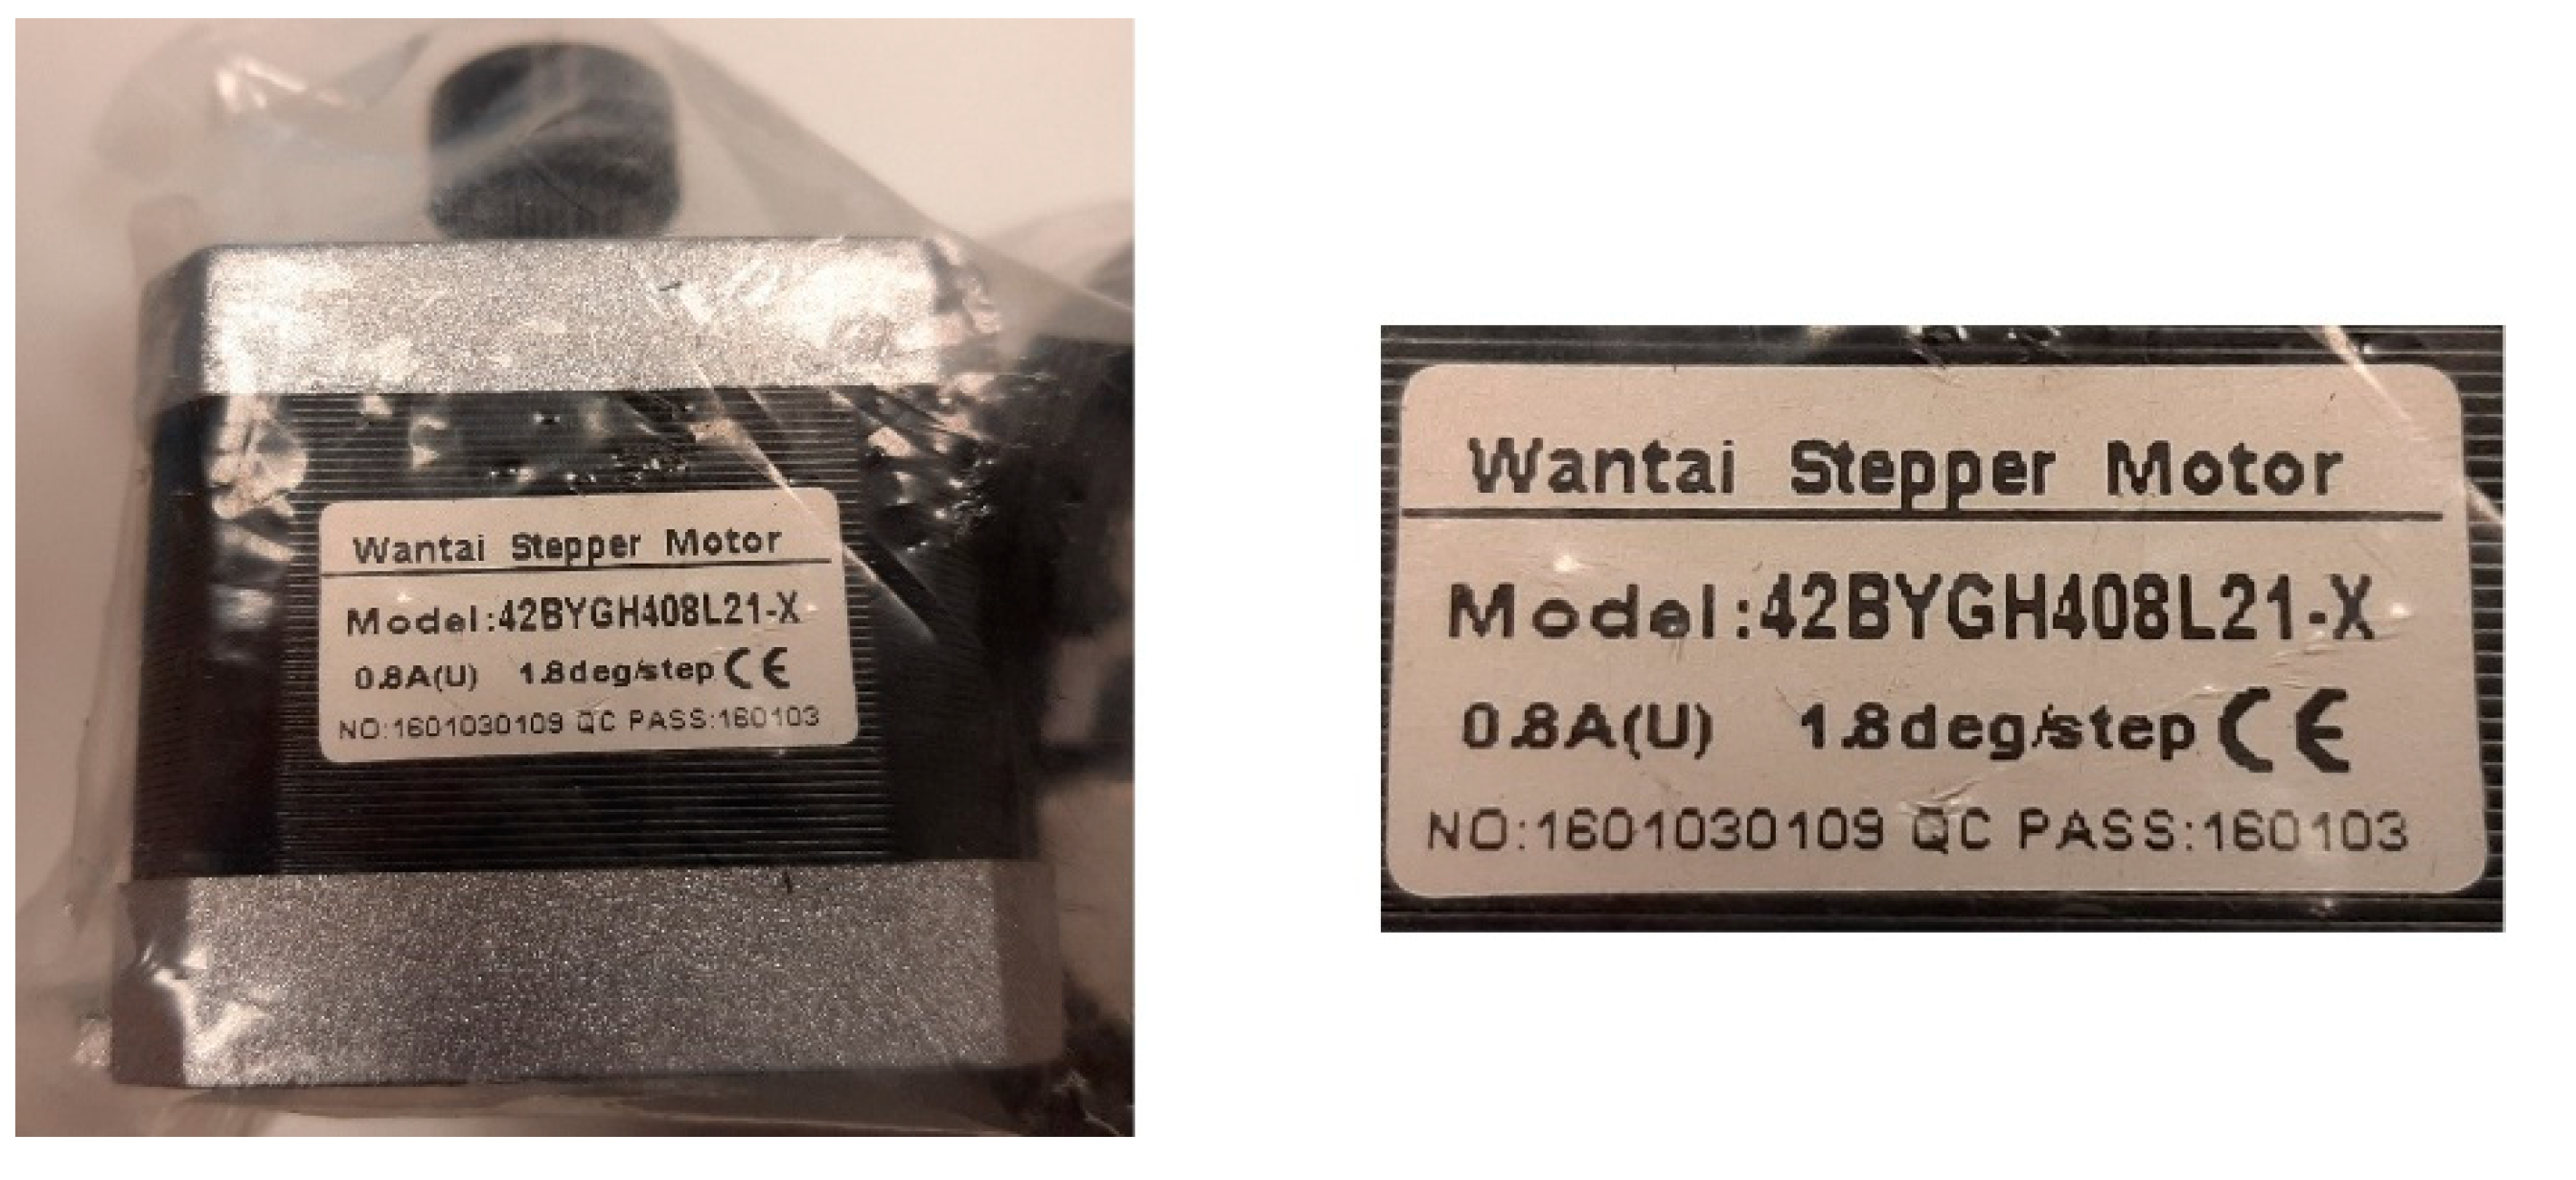
The source of interesting vibrations was primarily the stepper motors forcing the printhead to move in the X and Y directions. These motors are located in the back of the printer (
Figure 1). These are the original motors manufactured by Wantai and used in the M200 Plus printer and have the designation 42BYGH408L21 (
Figure 6). These motors are compatible with the NEMA ICS 16 [
23] standard and belong to the NEMA 17 product group. The manufacturer has not provided specifications for the motors with the above-mentioned designation, and only for other devices of this series [
24].
Raw numerical data obtained during the measurement of vibration signals from the accelerometer were collected with the Arduino Uno Rev3 microcontroller and saved on the computer disk as text files (.txt). The popular CoolTerm software was used for this purpose. The spectrograms were obtained as a result of the fast Fourier transform (FFT) performed by the Sonic Visualiser application. The best quality of spectrograms was obtained for the following settings of this application: Color—green, Scale—linear, Normalization—view, Window—512, Window Overlap—93.75%, Oversampling—4x, Bins—all bins, Frequency Scale—linear. The remaining parameters (Threshold, Colour Rotation and Gain) were determined individually for each spectrogram to obtain the best quality of image. Among other proven ways of visualization, the above method allowed us to obtain the best quality of images for visual analysis of vibration signals when 3D objects are printed.
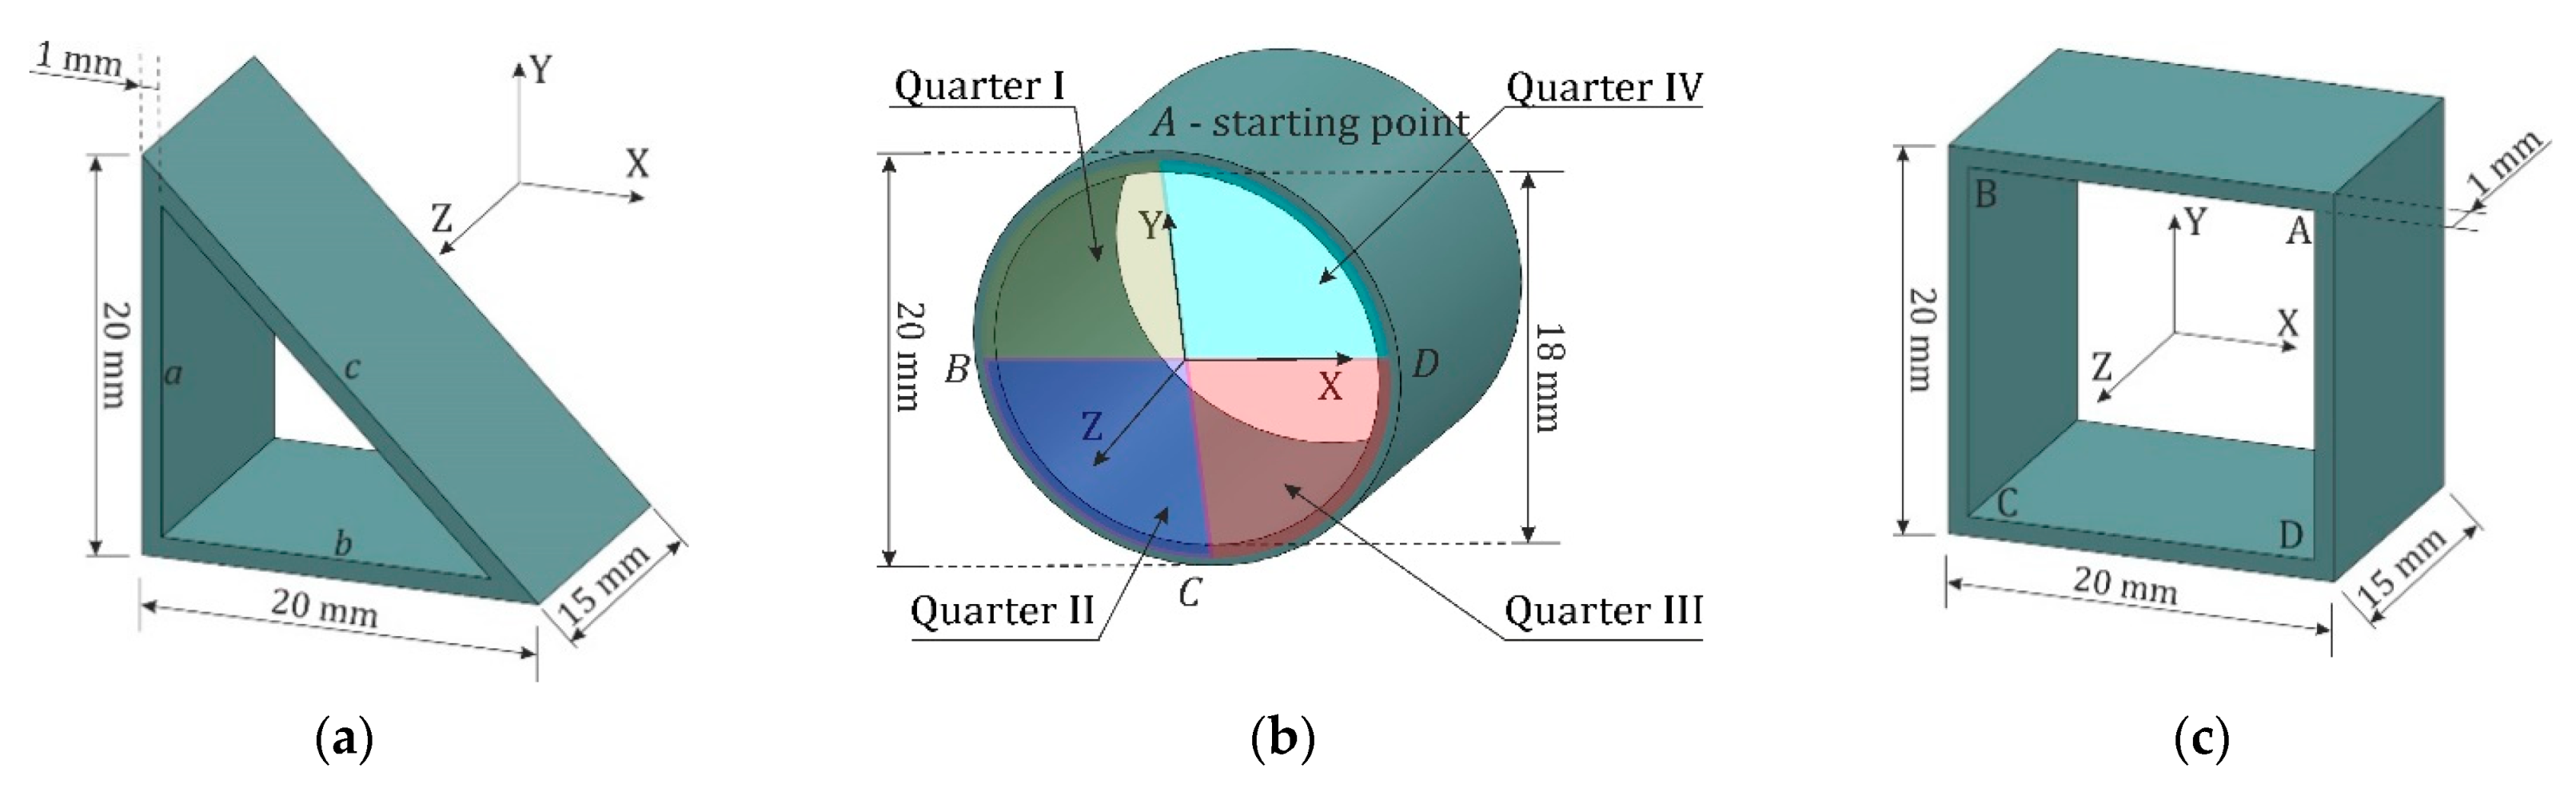
Three objects with simple shapes were printed during tests (
Figure 7), for which the work of the printhead is based on uniform movements (without the acceleration and deceleration phases). This choice was aimed at easy and unambiguous identification of the correlation between the movements of the printhead and the vibration signals generated during printing of the components of a given object. The vibration signals were recorded for the printhead movements when printing these objects. The printhead was moving:
in a straight line, along the X axis;
in a straight line, along the Y axis;
in a straight line positioned at 45° in relation to the X and Y axes;
along the arc.
Selected shapes of objects allowed us to observe the movement of the printhead in four basic directions and to look for the distinctive features of vibration signals correlated with the objects’ printing phases. Such directions of print head movements were selected for analyses because they exist for each printing object, with the possibility of some modification radius of an arc or a slope of a diagonal (a changing of an angle between the diagonal and X and Y axes). Changes in the radius of the arcs and the slope of the diagonals can be observed in the form of different densities of points on the spectrograms.
The time courses and spectrograms of vibration signals were the basis of the analysis.
3. Test and Analyses Results
The analysis of the measurement data was based on the visual evaluation and interpretation of the spectrograms. This approach was based on the adopted assumption: if the results are promising, high-quality measuring equipment and specialized software for signal analysis will be purchased for advanced research. The observations presented in this paper show that the threat of infiltration of 3D printers is so high that it deserves further research aimed at its elimination.
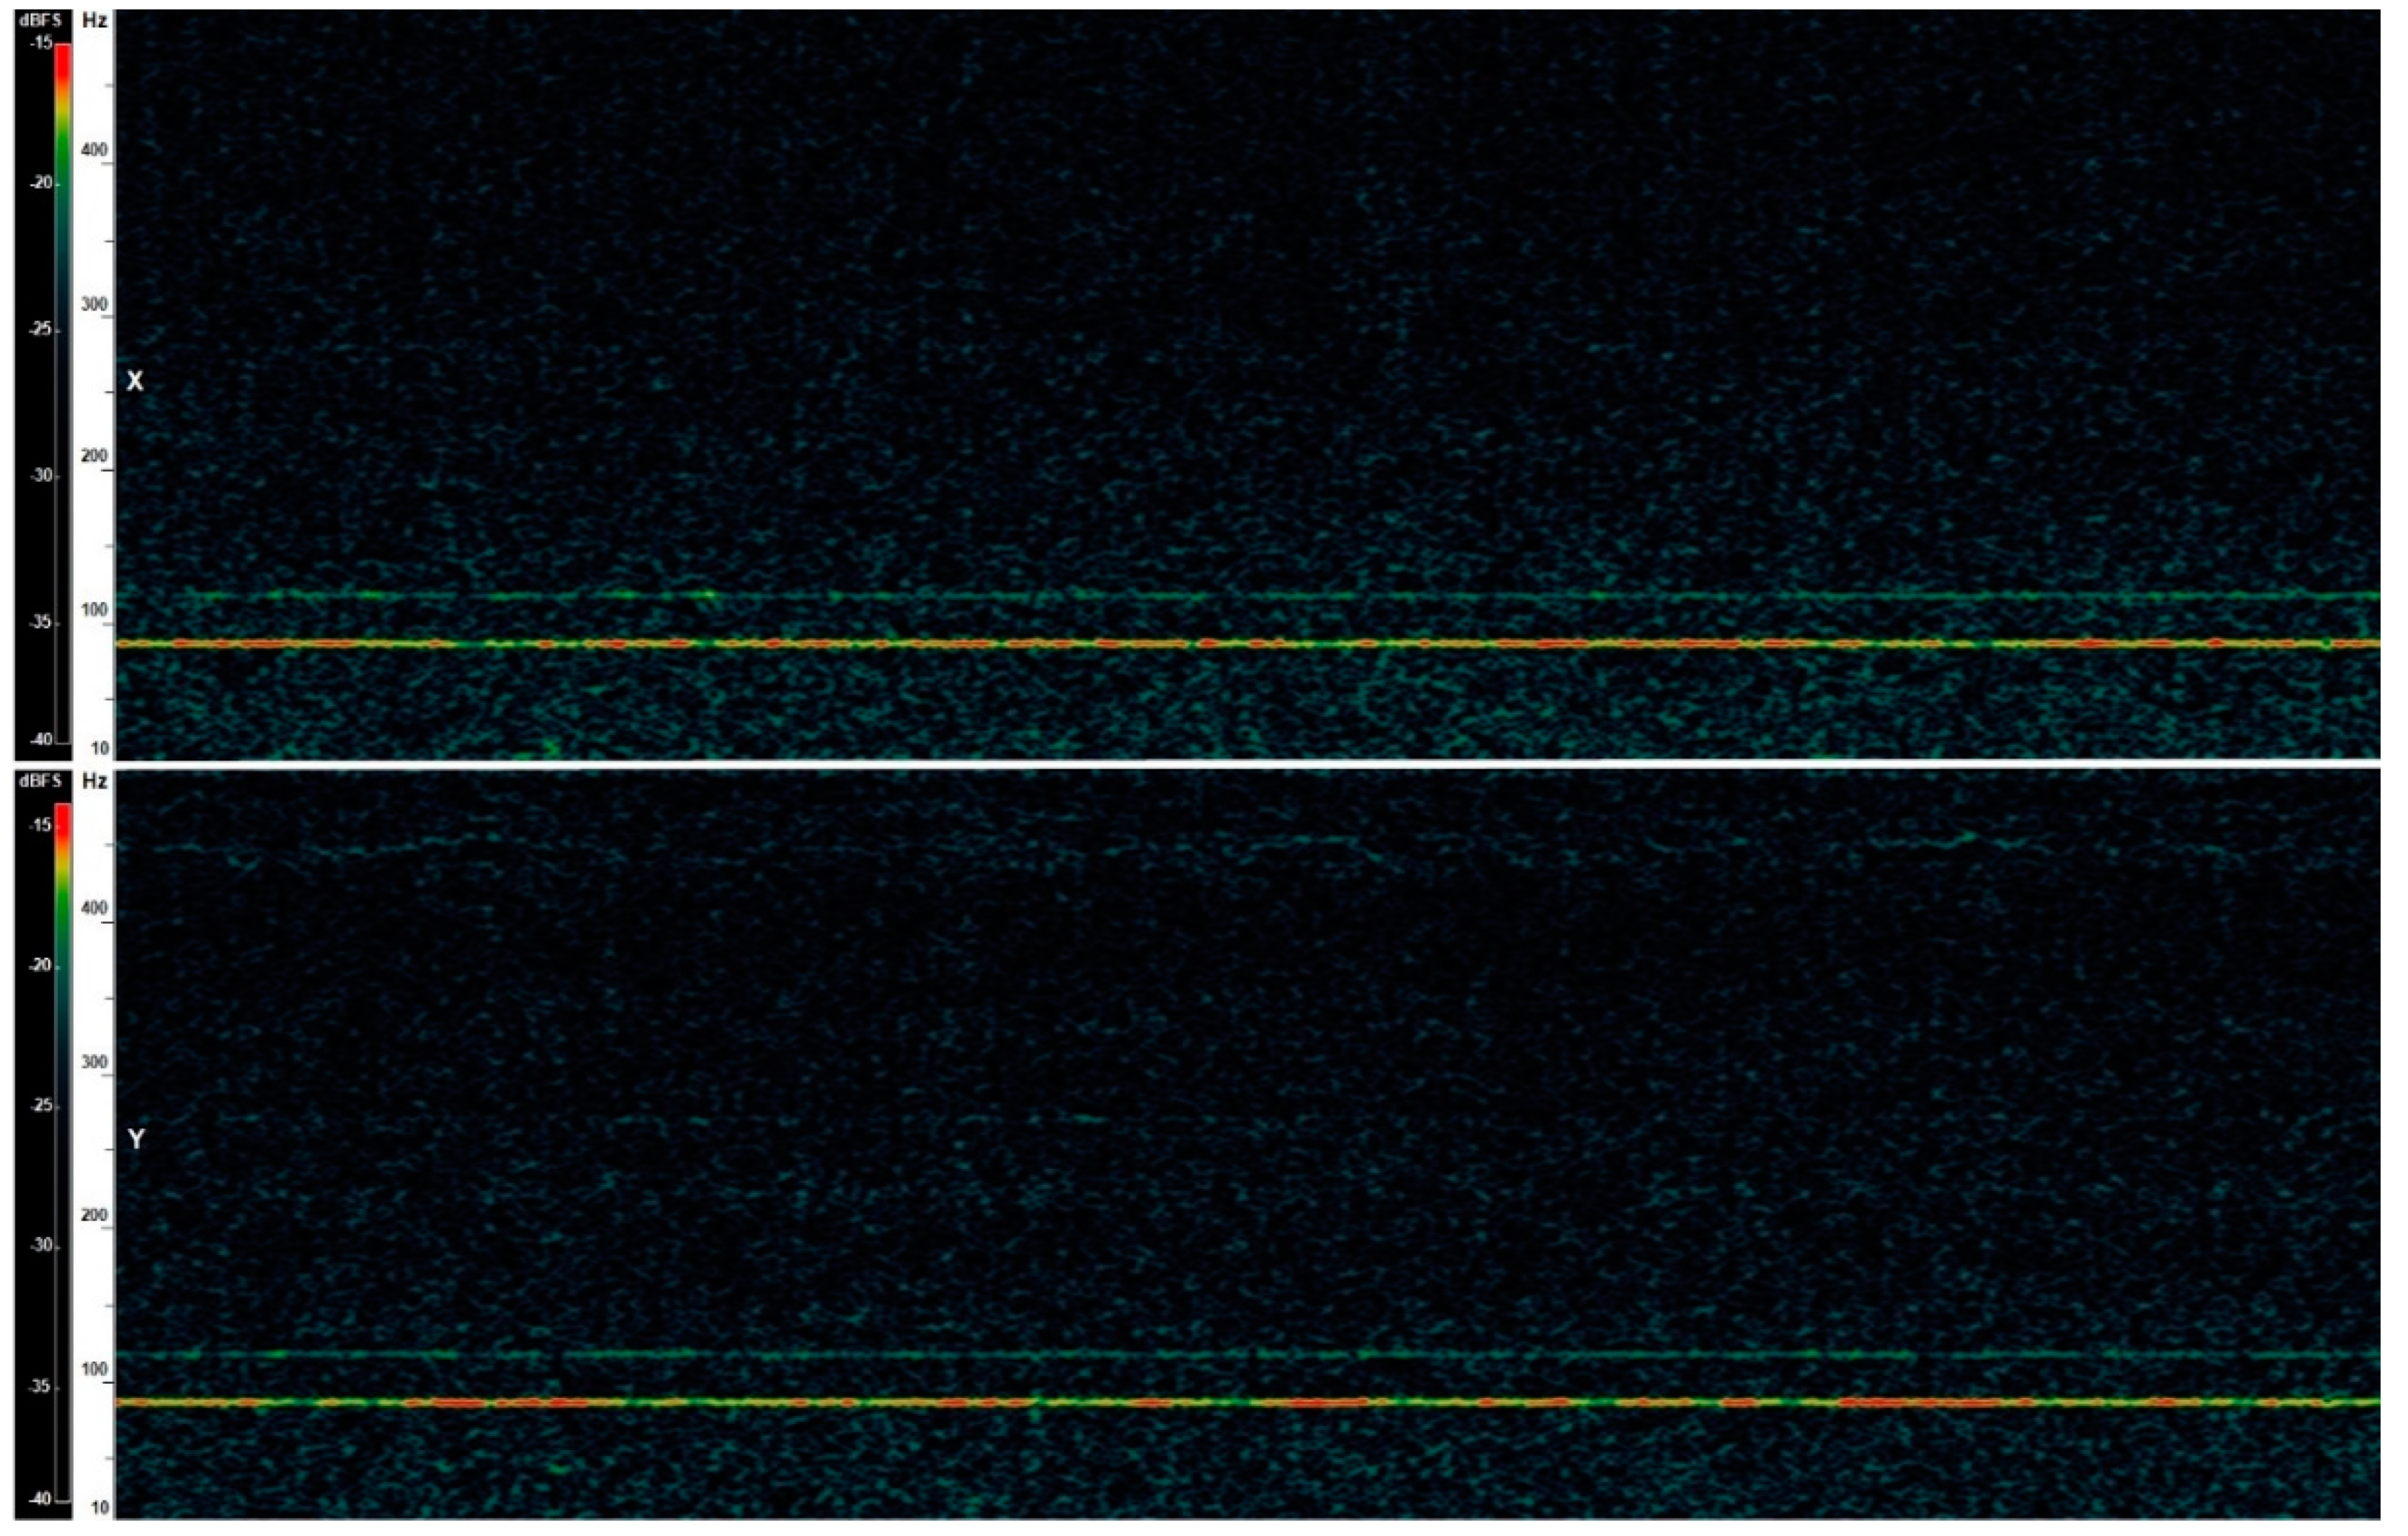
The tests began from measuring of printer vibrations in standby mode [
25]. Spectrograms for X and Y axes are presented in
Figure 8. Horizontal lines at frequencies of approx. 85 Hz and 120 Hz are visible in both spectrograms, and correspond to vibrations induced by the stepper motors operating also in standby mode, maintaining the rotor in a balanced position. These frequencies in further analyses were omitted. In addition, the accelerometer indications for the Z axis were omitted because of scarce information content that could be used to reconstruct printed objects.
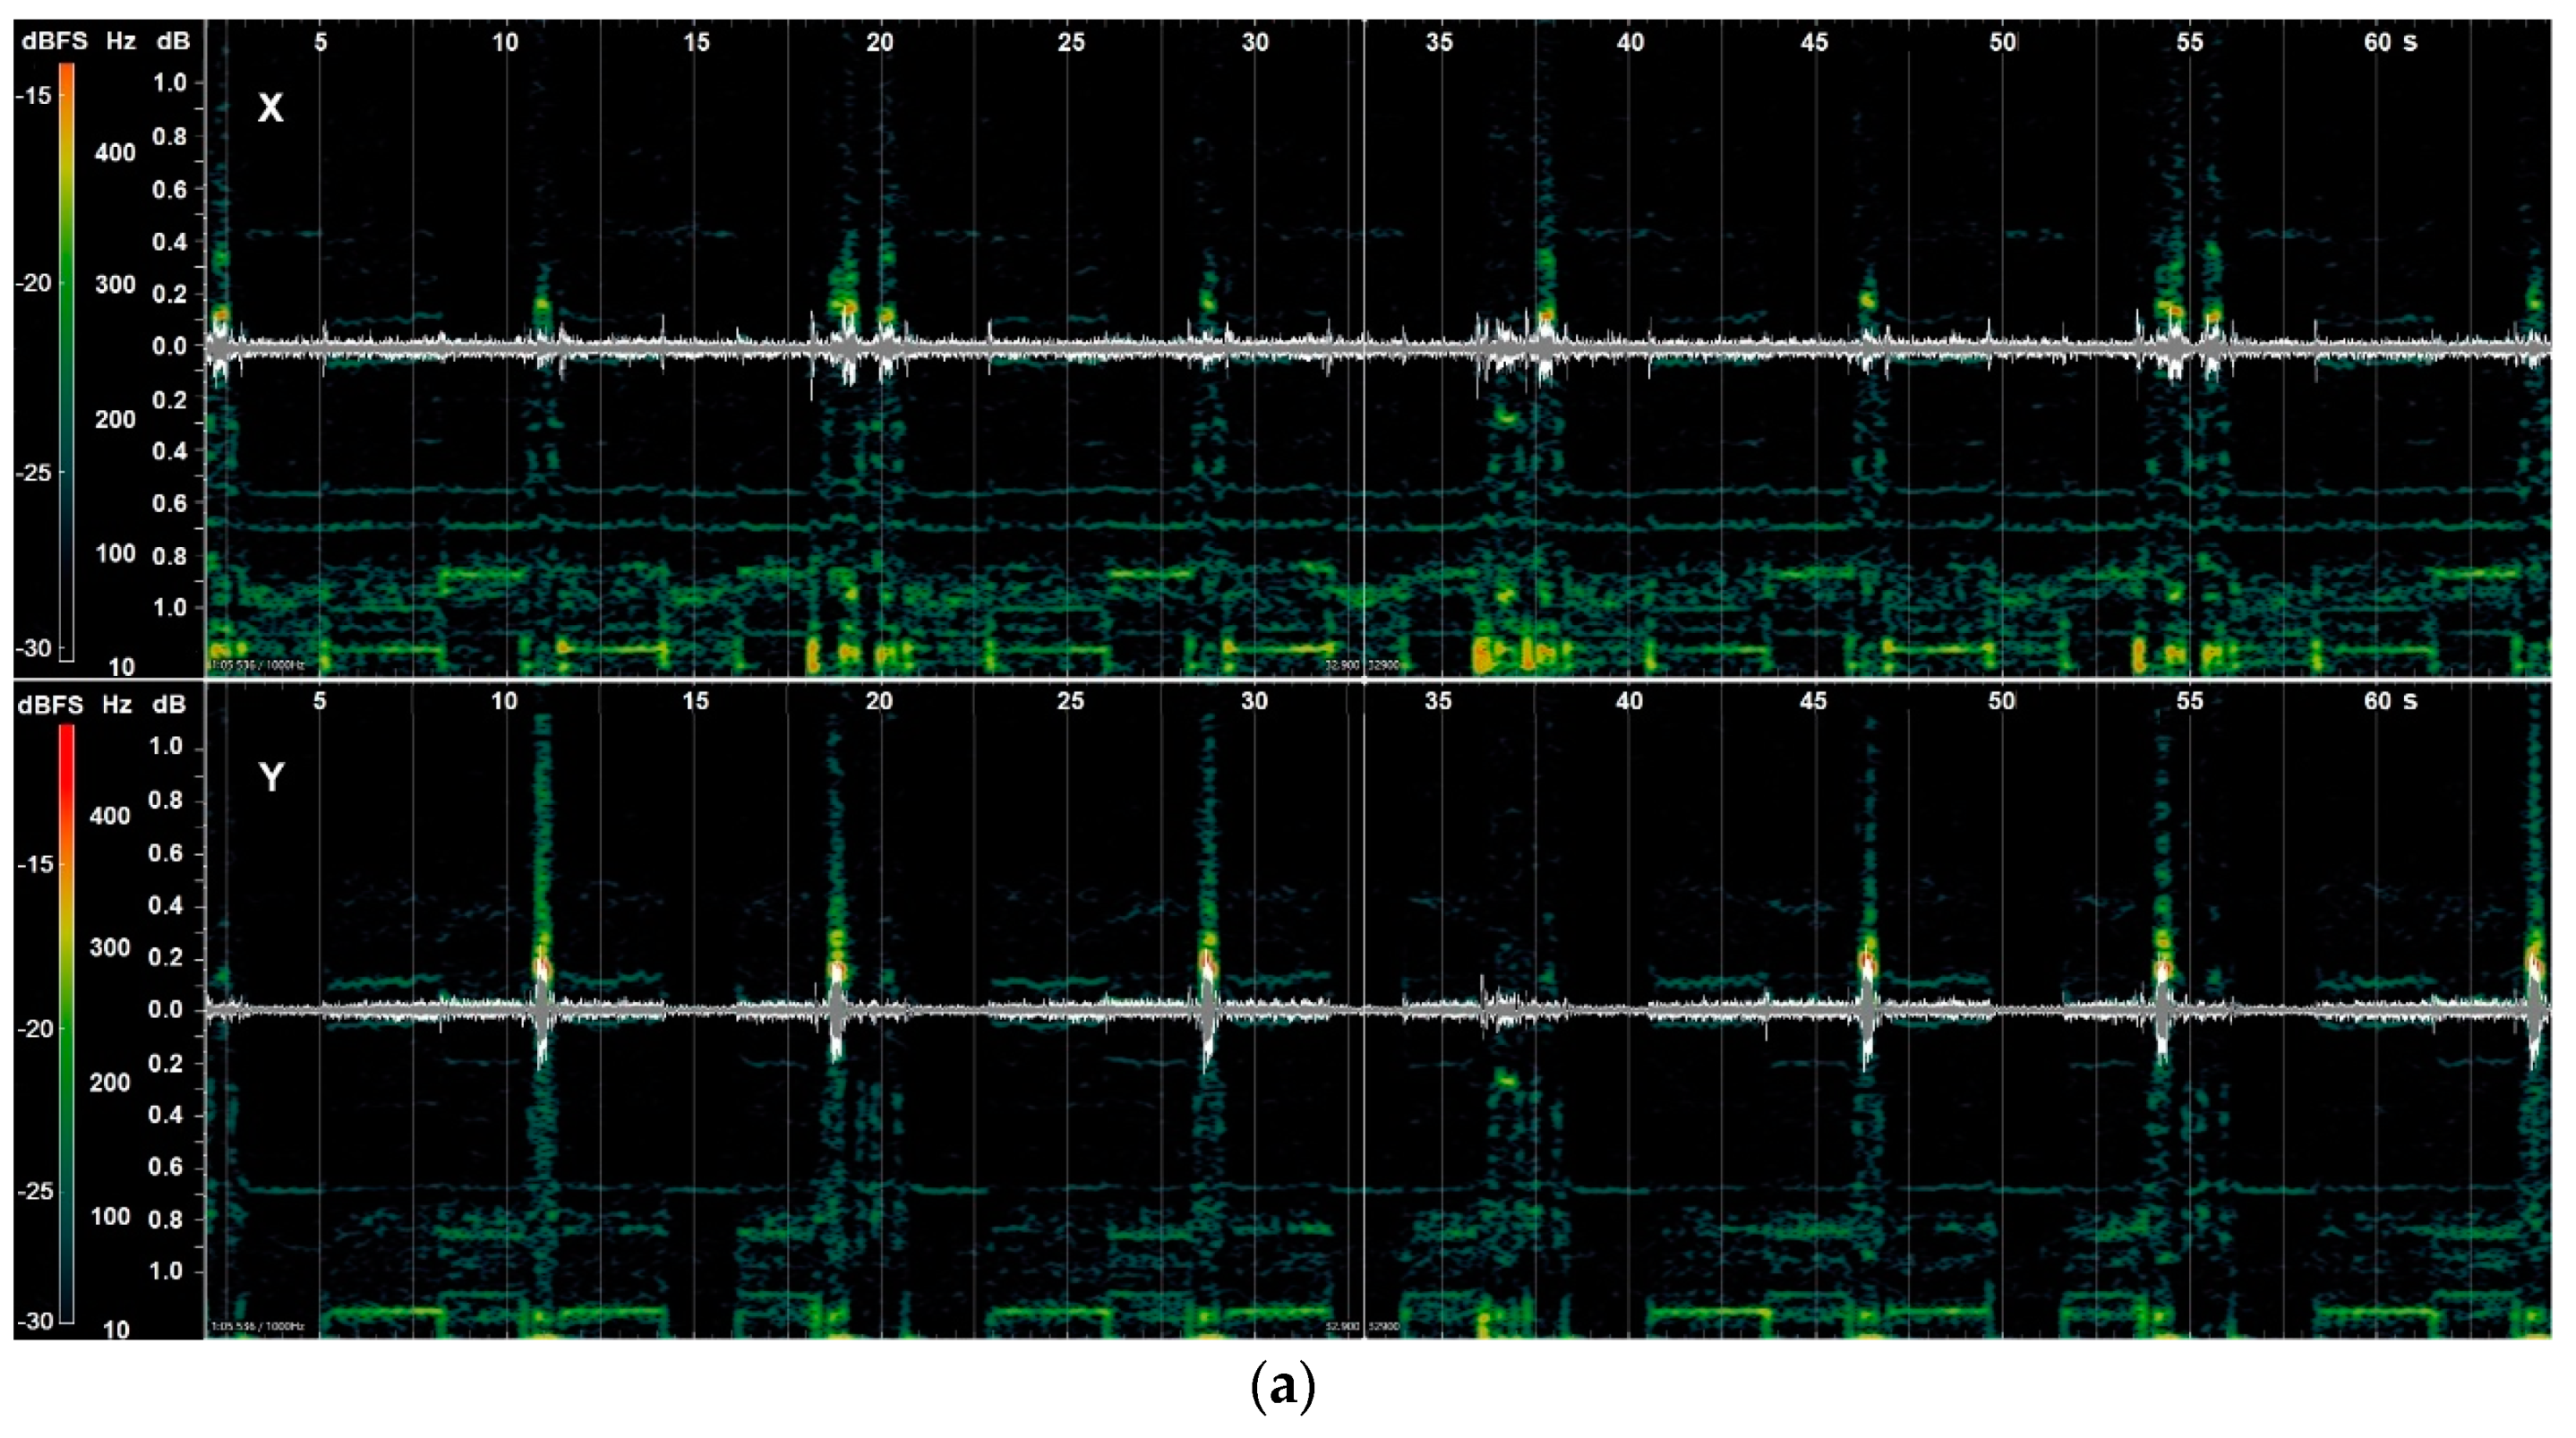
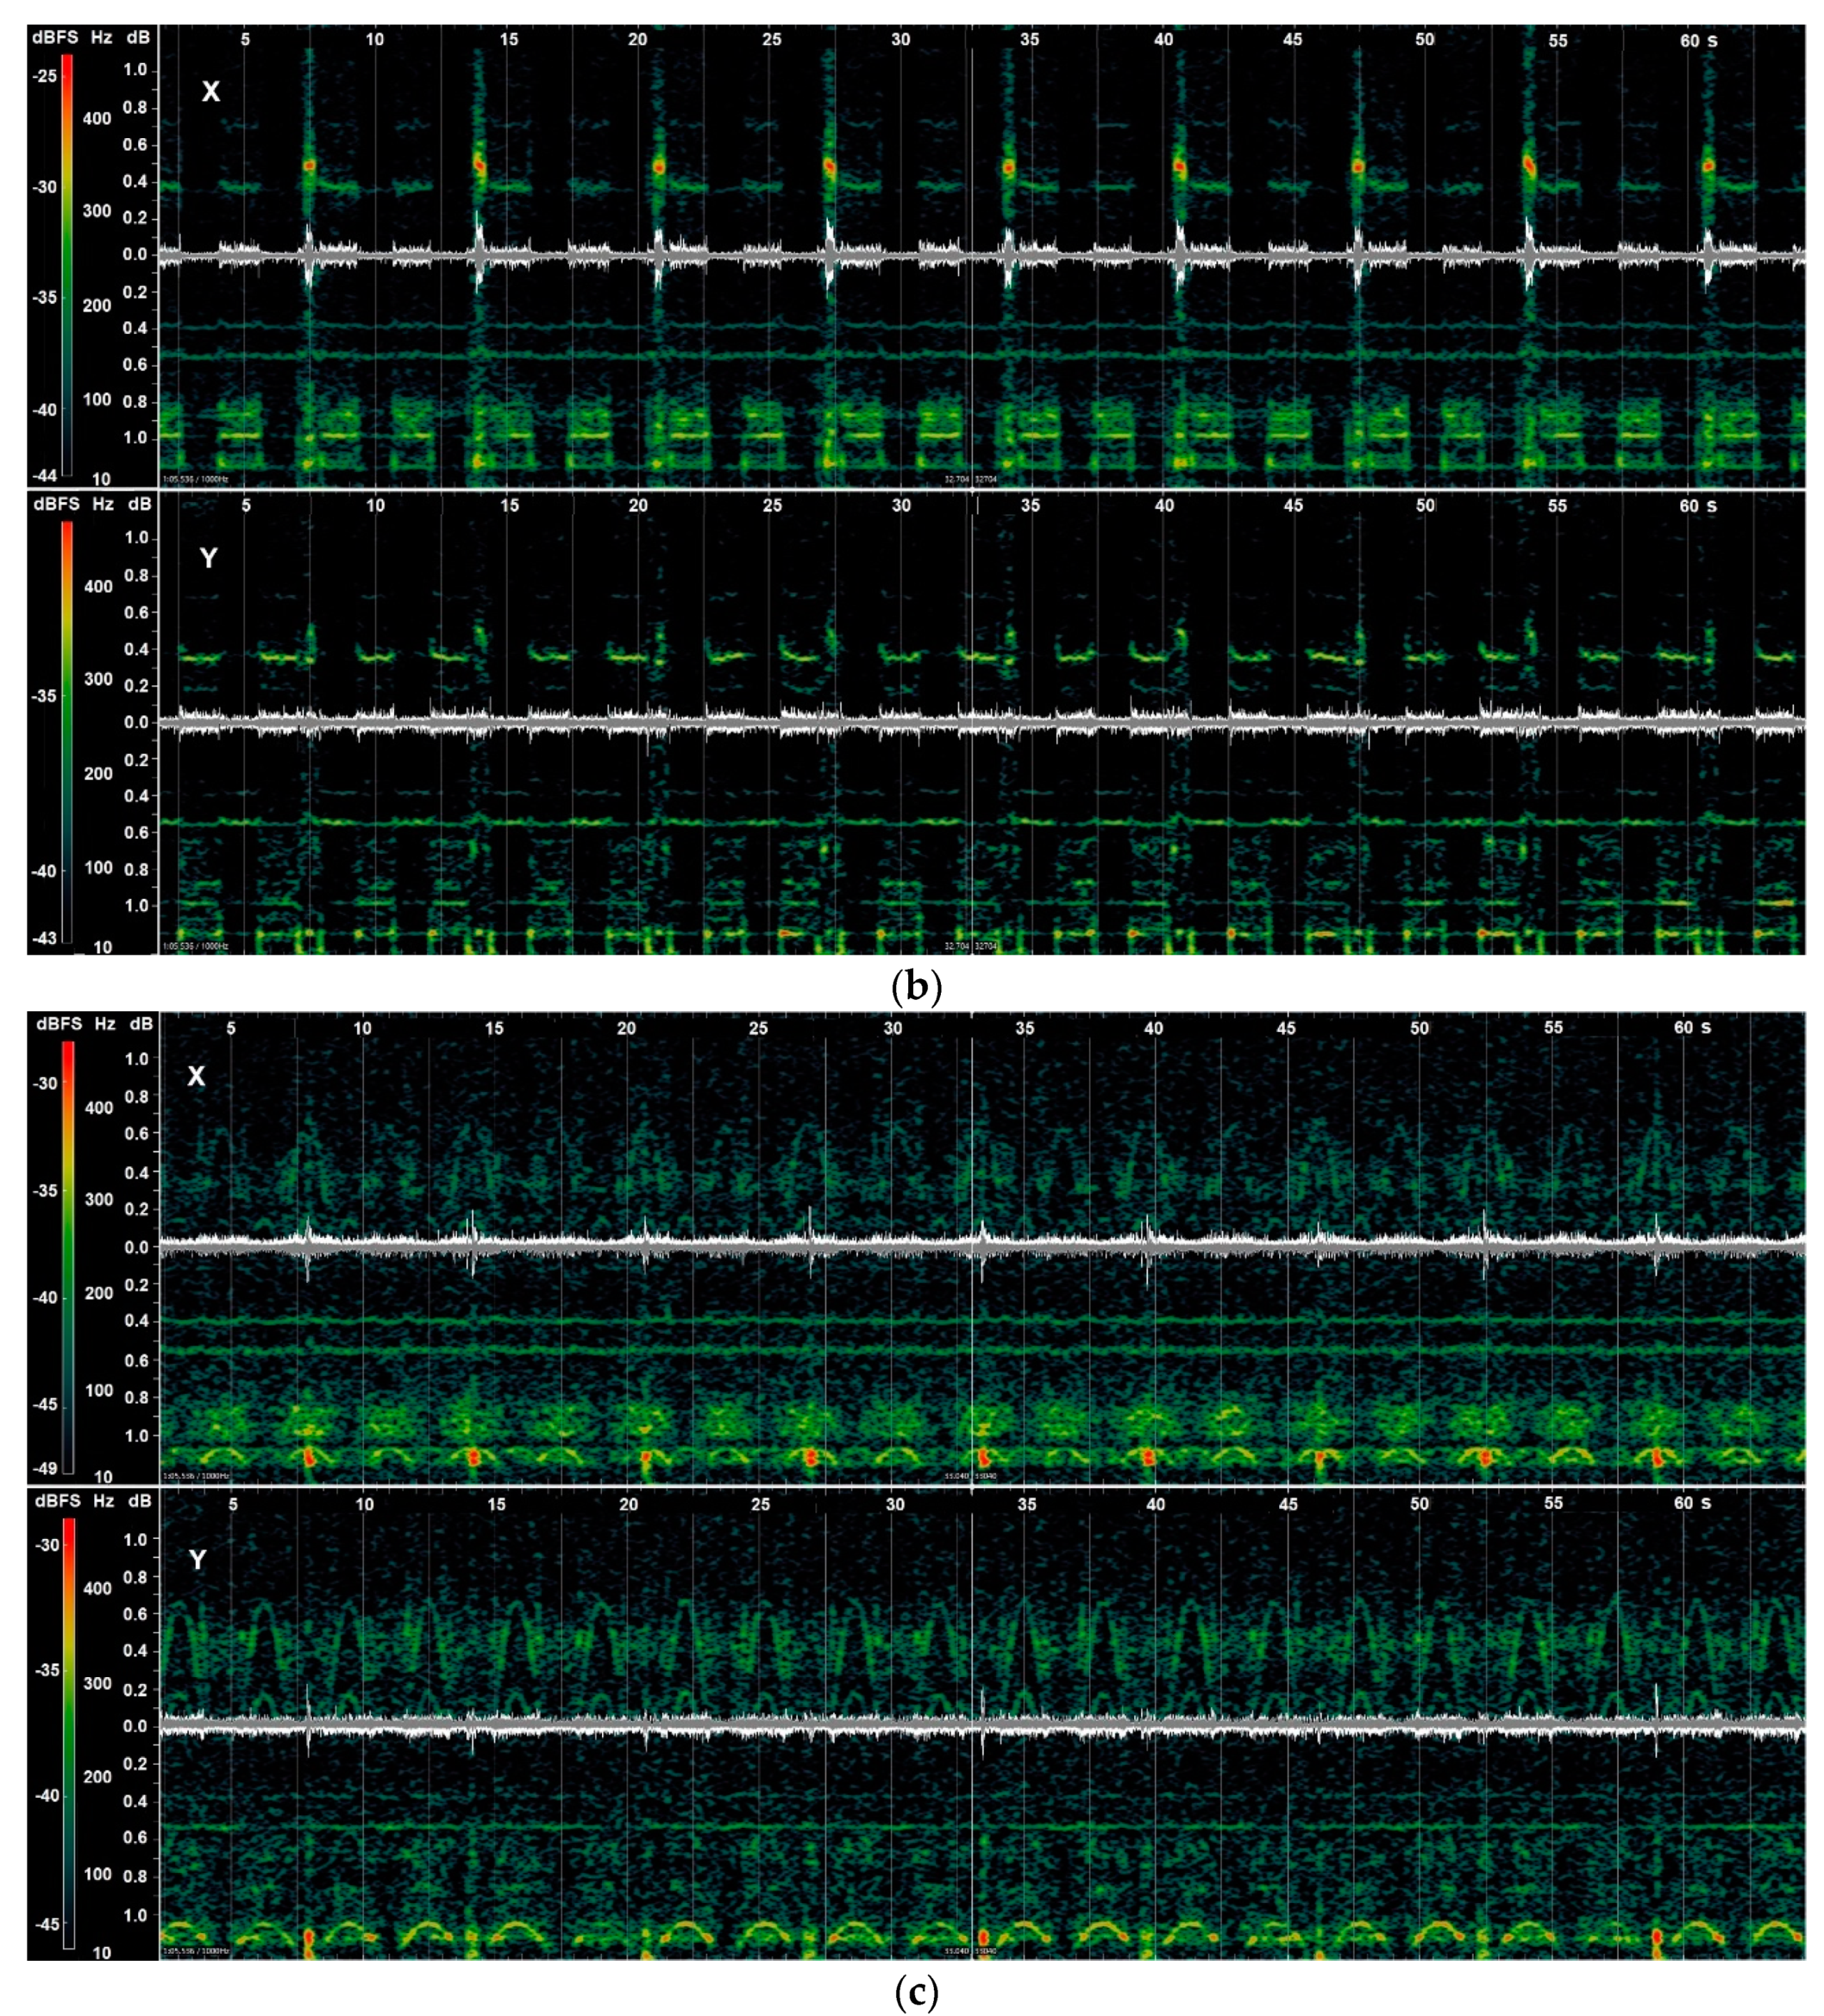
Figure 9 presents waveforms and their spectrograms obtained for printed objects based on signals recorded during 1 min measurement sessions. It results in the repeatability of characteristic printing phases.
To make it easier to distinguish details on the above-mentioned spectrograms obtained from the 3D printer vibration measurements while printing the objects under investigation, the time scale used for further analyses was increased. It has been observed that the printhead always starts printing a given object from the same starting point. Therefore, the printing phases presented on the spectrograms are easy to identify, and their distinctive features can be easily compared.
Figure 10,
Figure 11 and
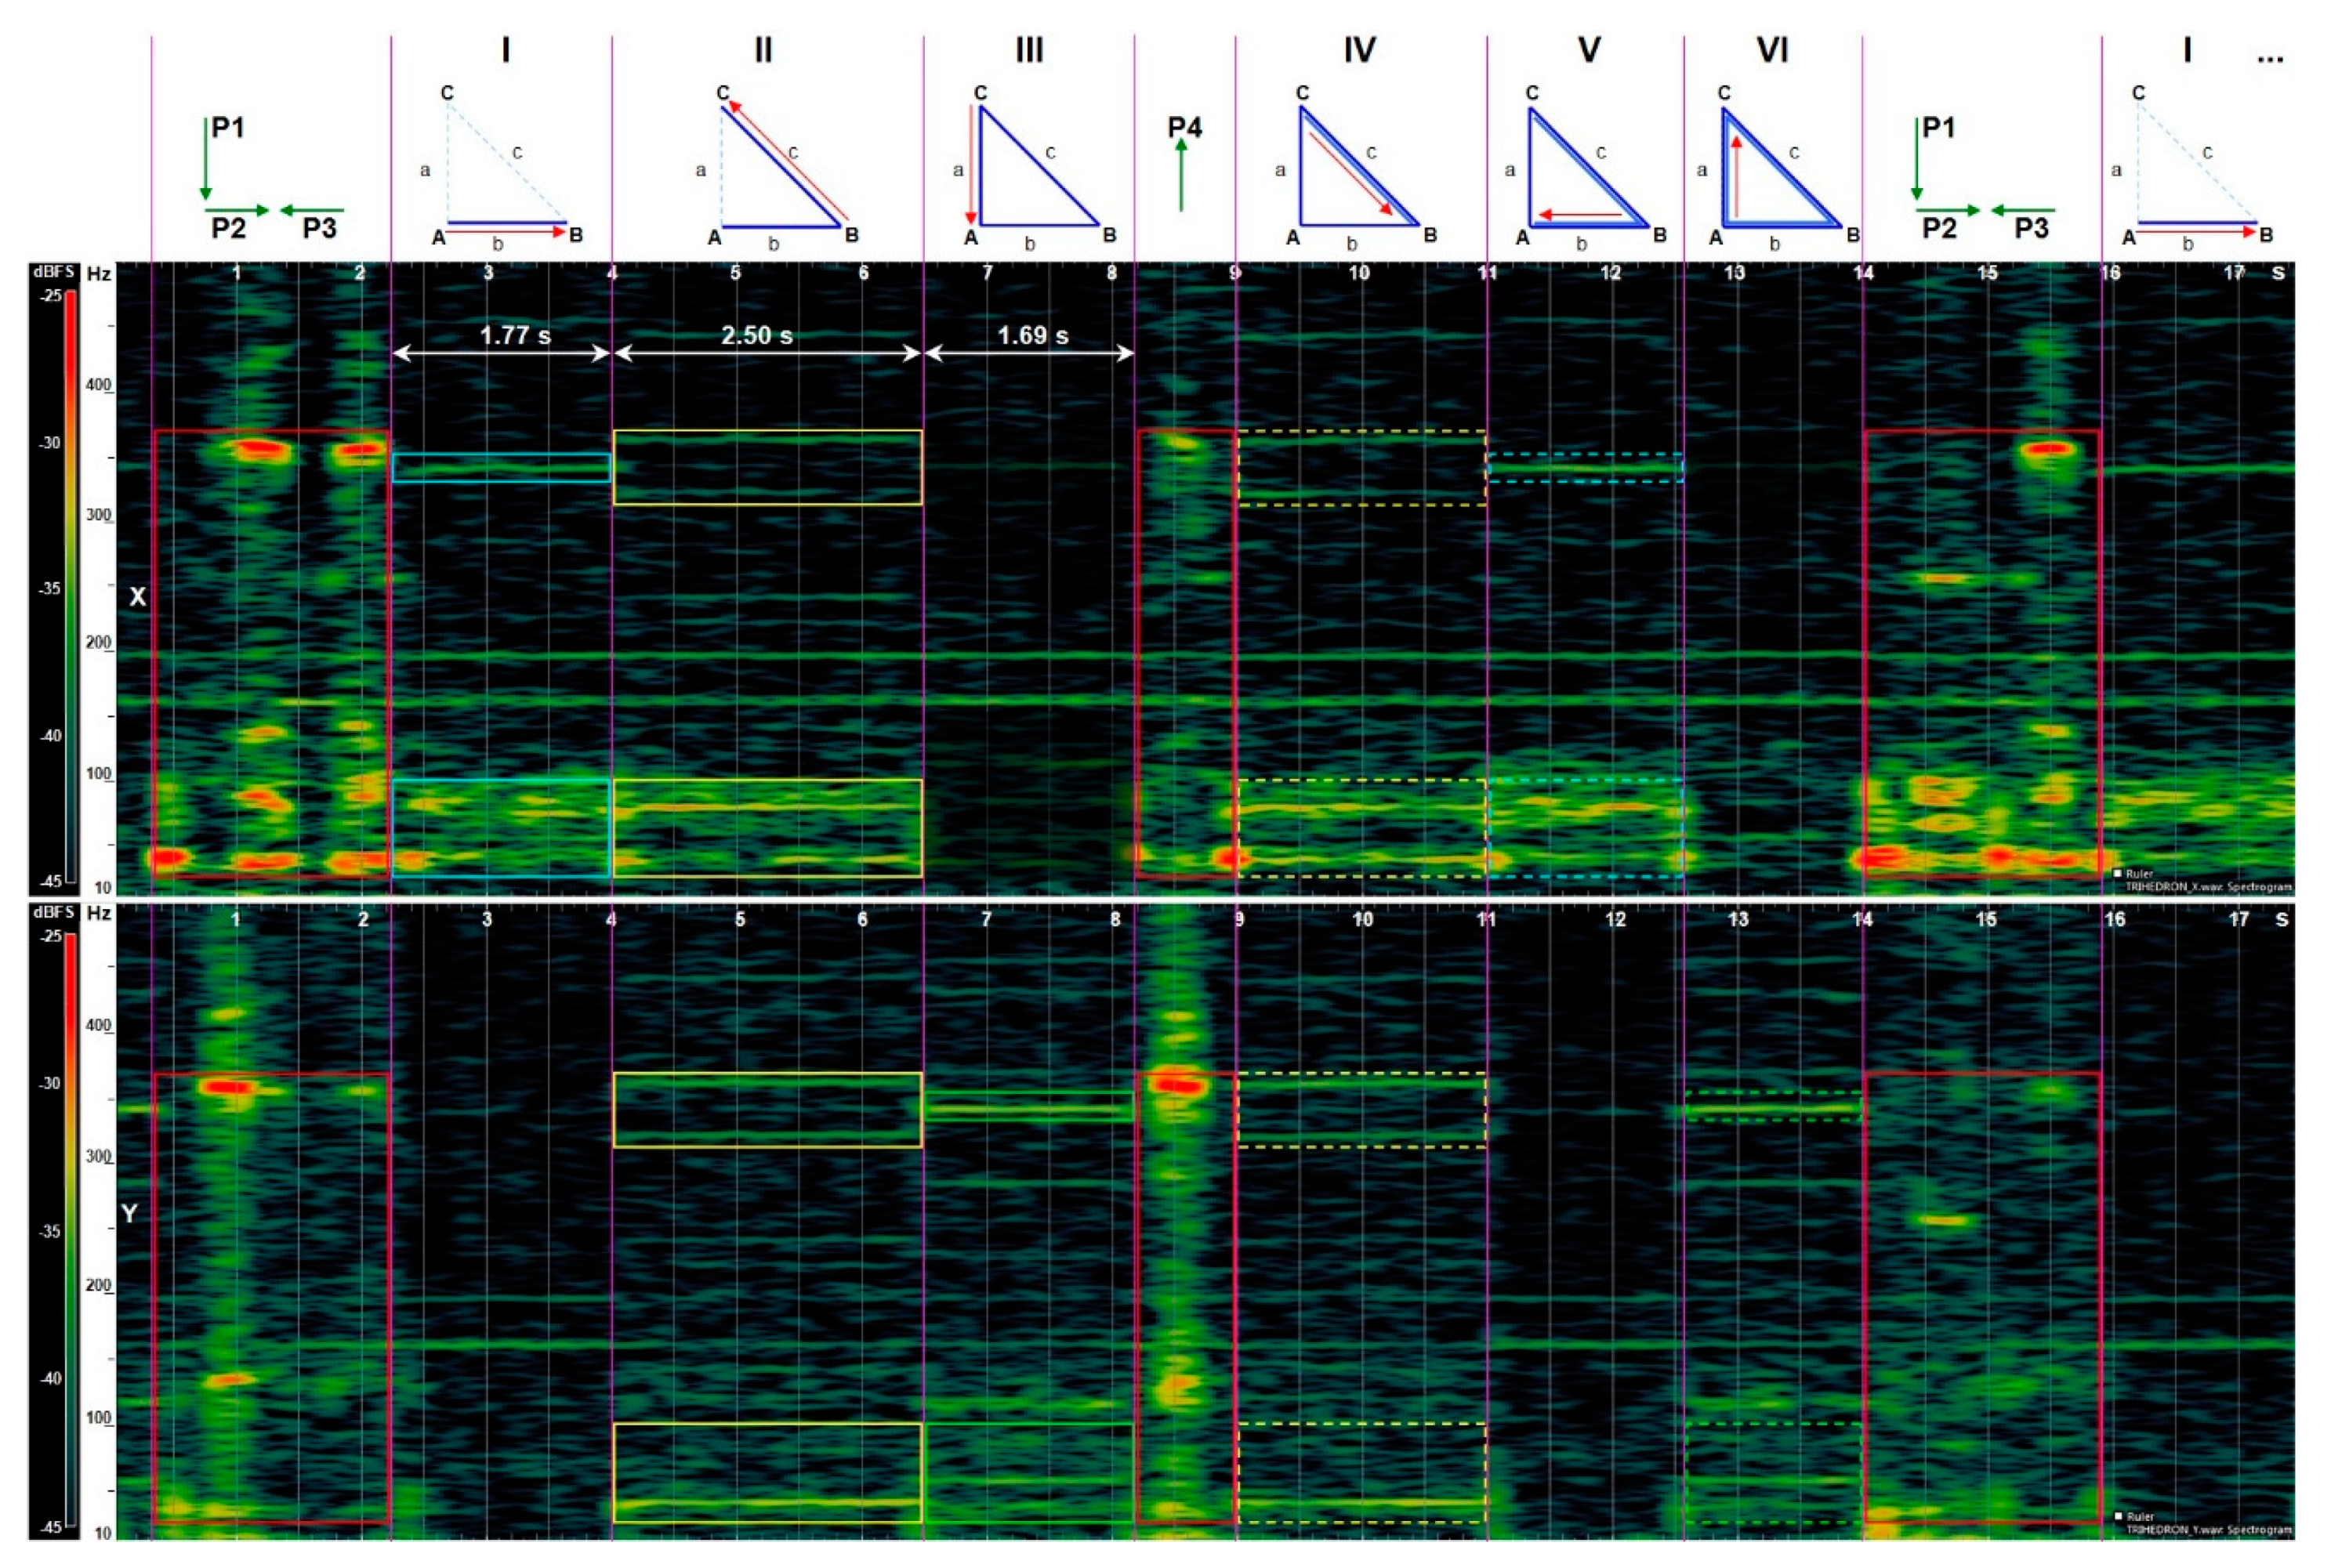
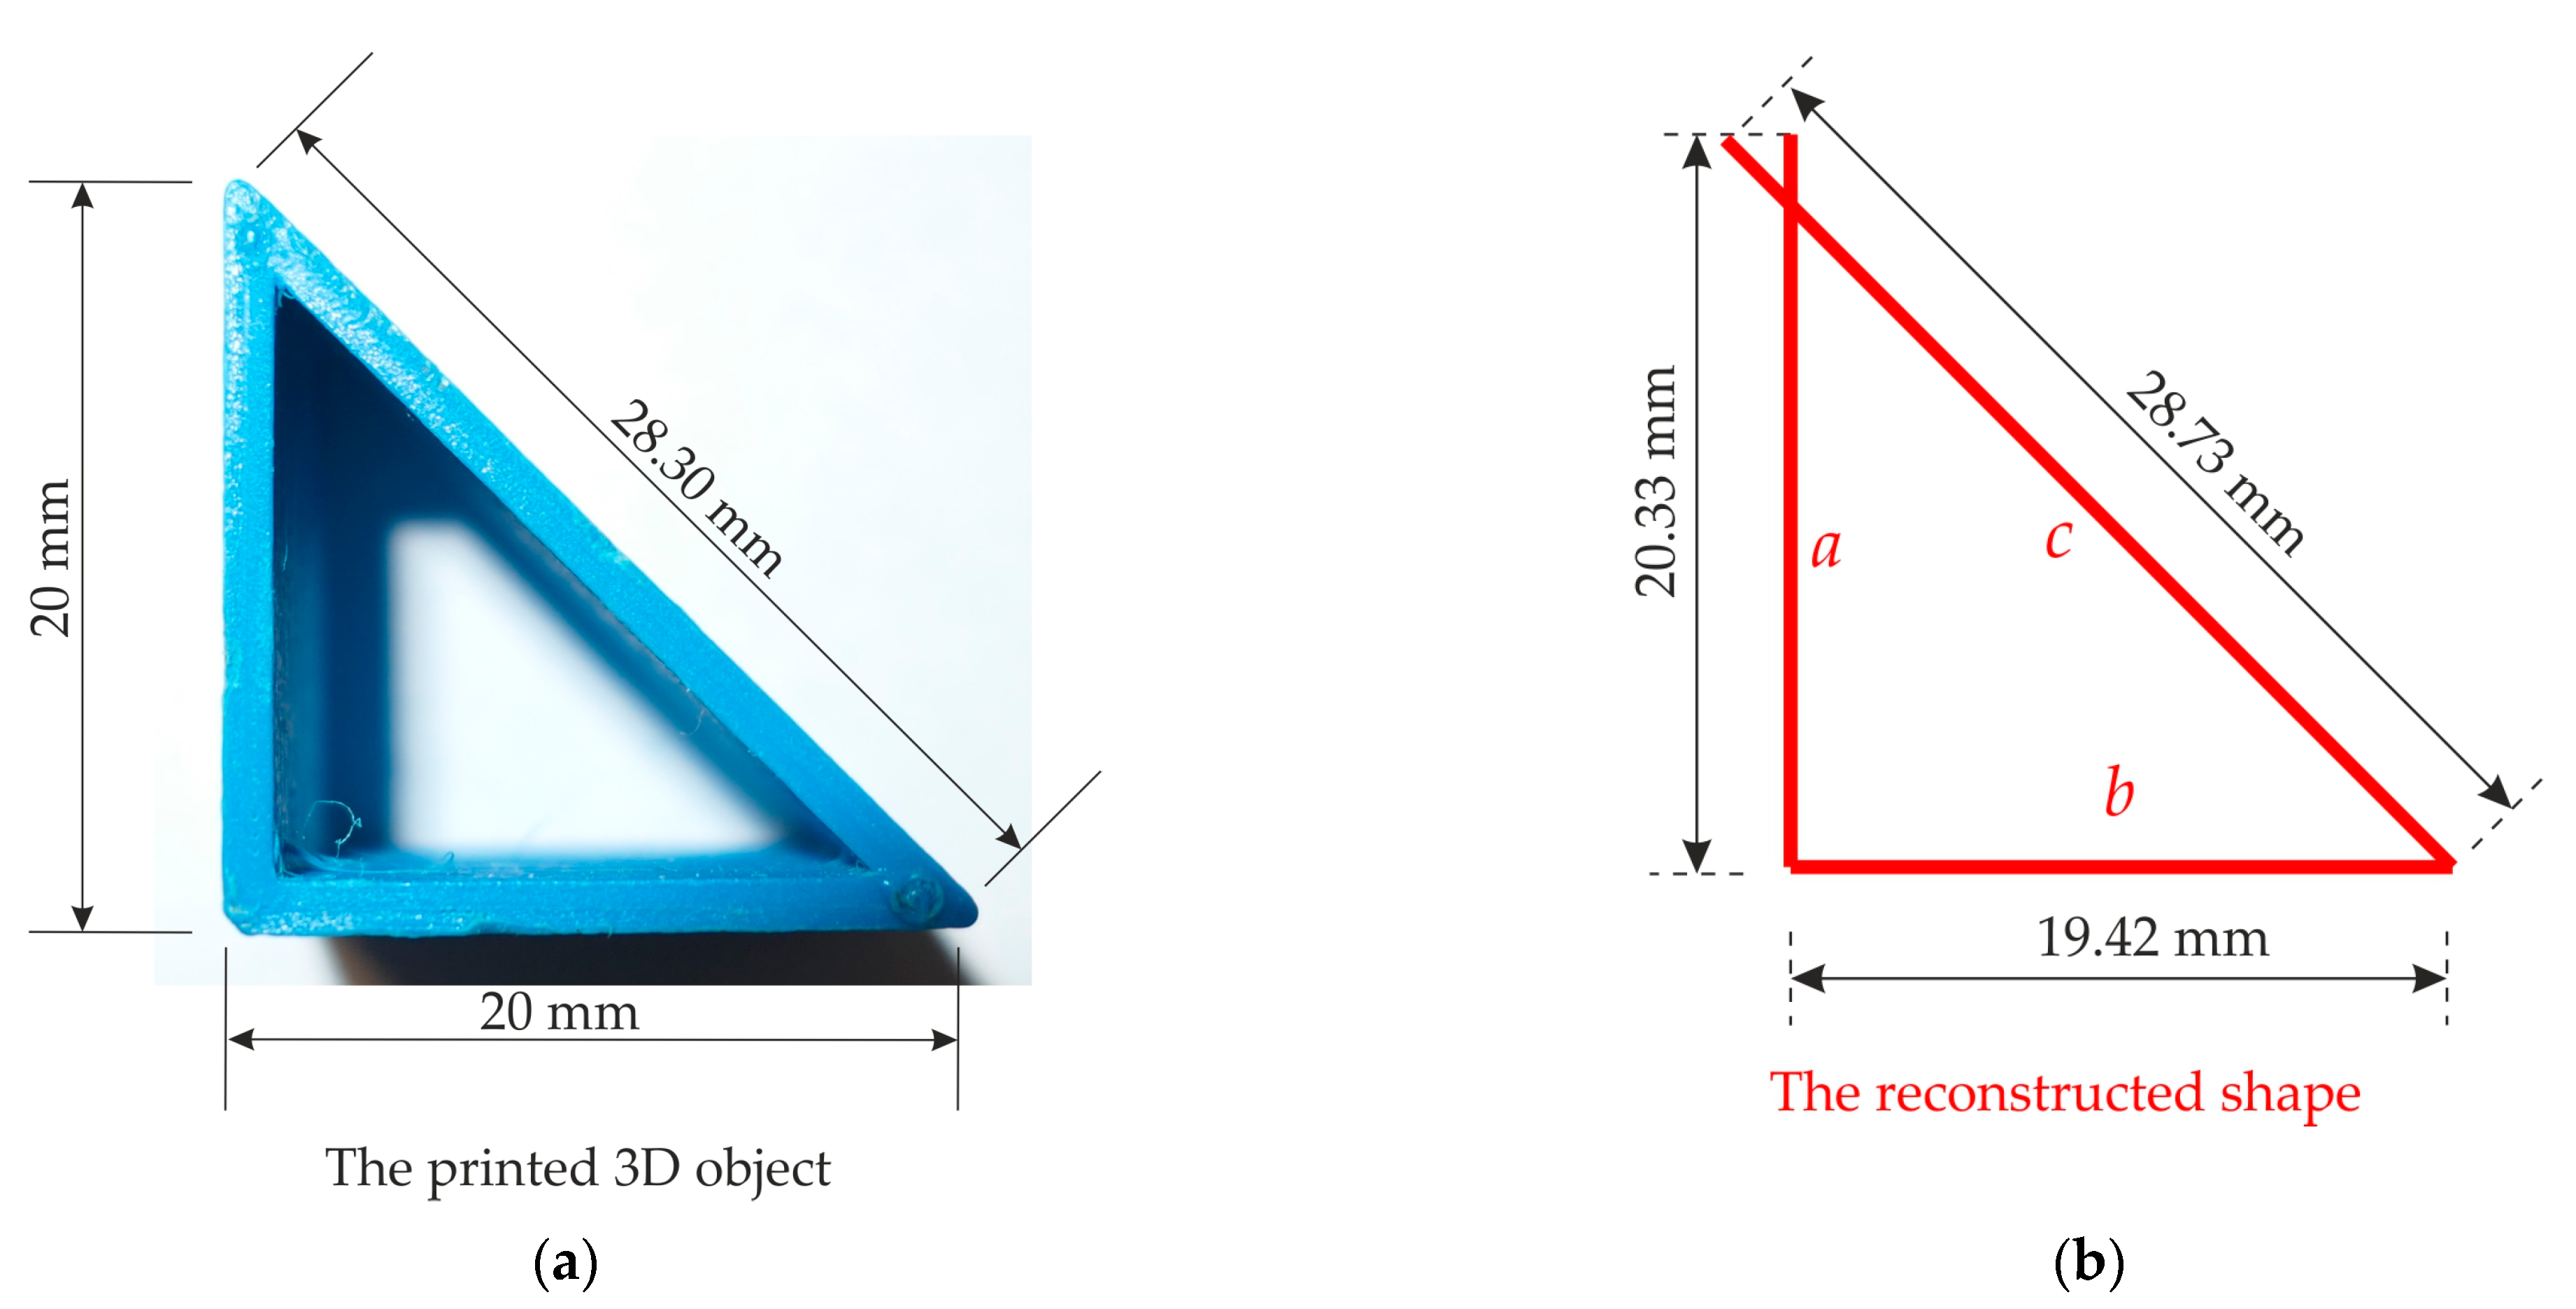
Figure 12 show spectrograms of the vibration signals recorded during the X and Y axis movement of the printhead (upper and lower spectrograms, respectively). From their comparison, it can be concluded in which direction the printhead was moving at a given moment. For example, when printing a trihedron, the movement of the head along the X axis is marked on the upper spectrogram with a clear line at the frequency of 340 Hz, when printing the right side b. A similar relationship can be observed when printing on the side of the square a (movement of the printhead along the Y axis). The double lines marked on both spectrograms with yellow rectangles covering the frequencies 320 Hz and 360 Hz represent the printing phase of the hypotenuse c. These lines indicate alternating X and Y axis motion of the printhead.
Figure 10 shows the spectrograms based on the vibration signals recorded when the walls of the triangle were printed (trihedron,
Figure 7a). A few characteristic printing steps can be distinguished. These steps are marked as I, II, III, IV, V and VI, and P1, P2, P3 and P4. They are defined in the following way:
- P1, P2, P3
the printhead performs the positioning movements (without printing), the platform is lowered by one level;
- I
the printhead prints the side of trihedron (outer path) from point A to B;
- II
the printhead prints the hypotenuse (outer path) from point B to C;
- III
the printhead prints the side of trihedron (outer path) from point C to A;
- P4
the printhead performs the positioning movements (without printing);
- IV
the printhead prints the hypotenuse (inner path) from point C to B;
- V
the printhead prints the side of trihedron (inner path) from point B to A;
- VI
the printhead prints the side of trihedron (inner path) from point A to C.
Condensation of the spectrum in the 30–370 Hz band, marked with a red continuous line in spectrograms, informs about the movement of the platform and/or head positioning.
For steps I and V the characteristic line is at a level of 340 Hz, and the spectrum condensation ranges from 30 Hz to 100 Hz (the fields marked on the X spectrogram with a continuous and a dashed blue line, respectively). Then, the head moves along the X axis and prints the b leg.
For steps II and IV one can notice double lines in both spectrograms (X and Y) at frequencies of approx. 320 Hz and 360 Hz and a spectrum condensation within the range from 30 Hz to 100 Hz on both X and Y spectrograms (the fields marked with a yellow continuous and a dashed line, respectively). Then, the head moves along the diagonal related to X and Y axes, printing the c hypotenuse.
For steps III and VI a clear line is visible at a level of 340 Hz, and the spectrum condensation ranges from 30 Hz to 100 Hz (the fields marked on the Y spectrogram with a continuous and a dashed green line, respectively). Then, the head moves along the Y axis and prints the leg.
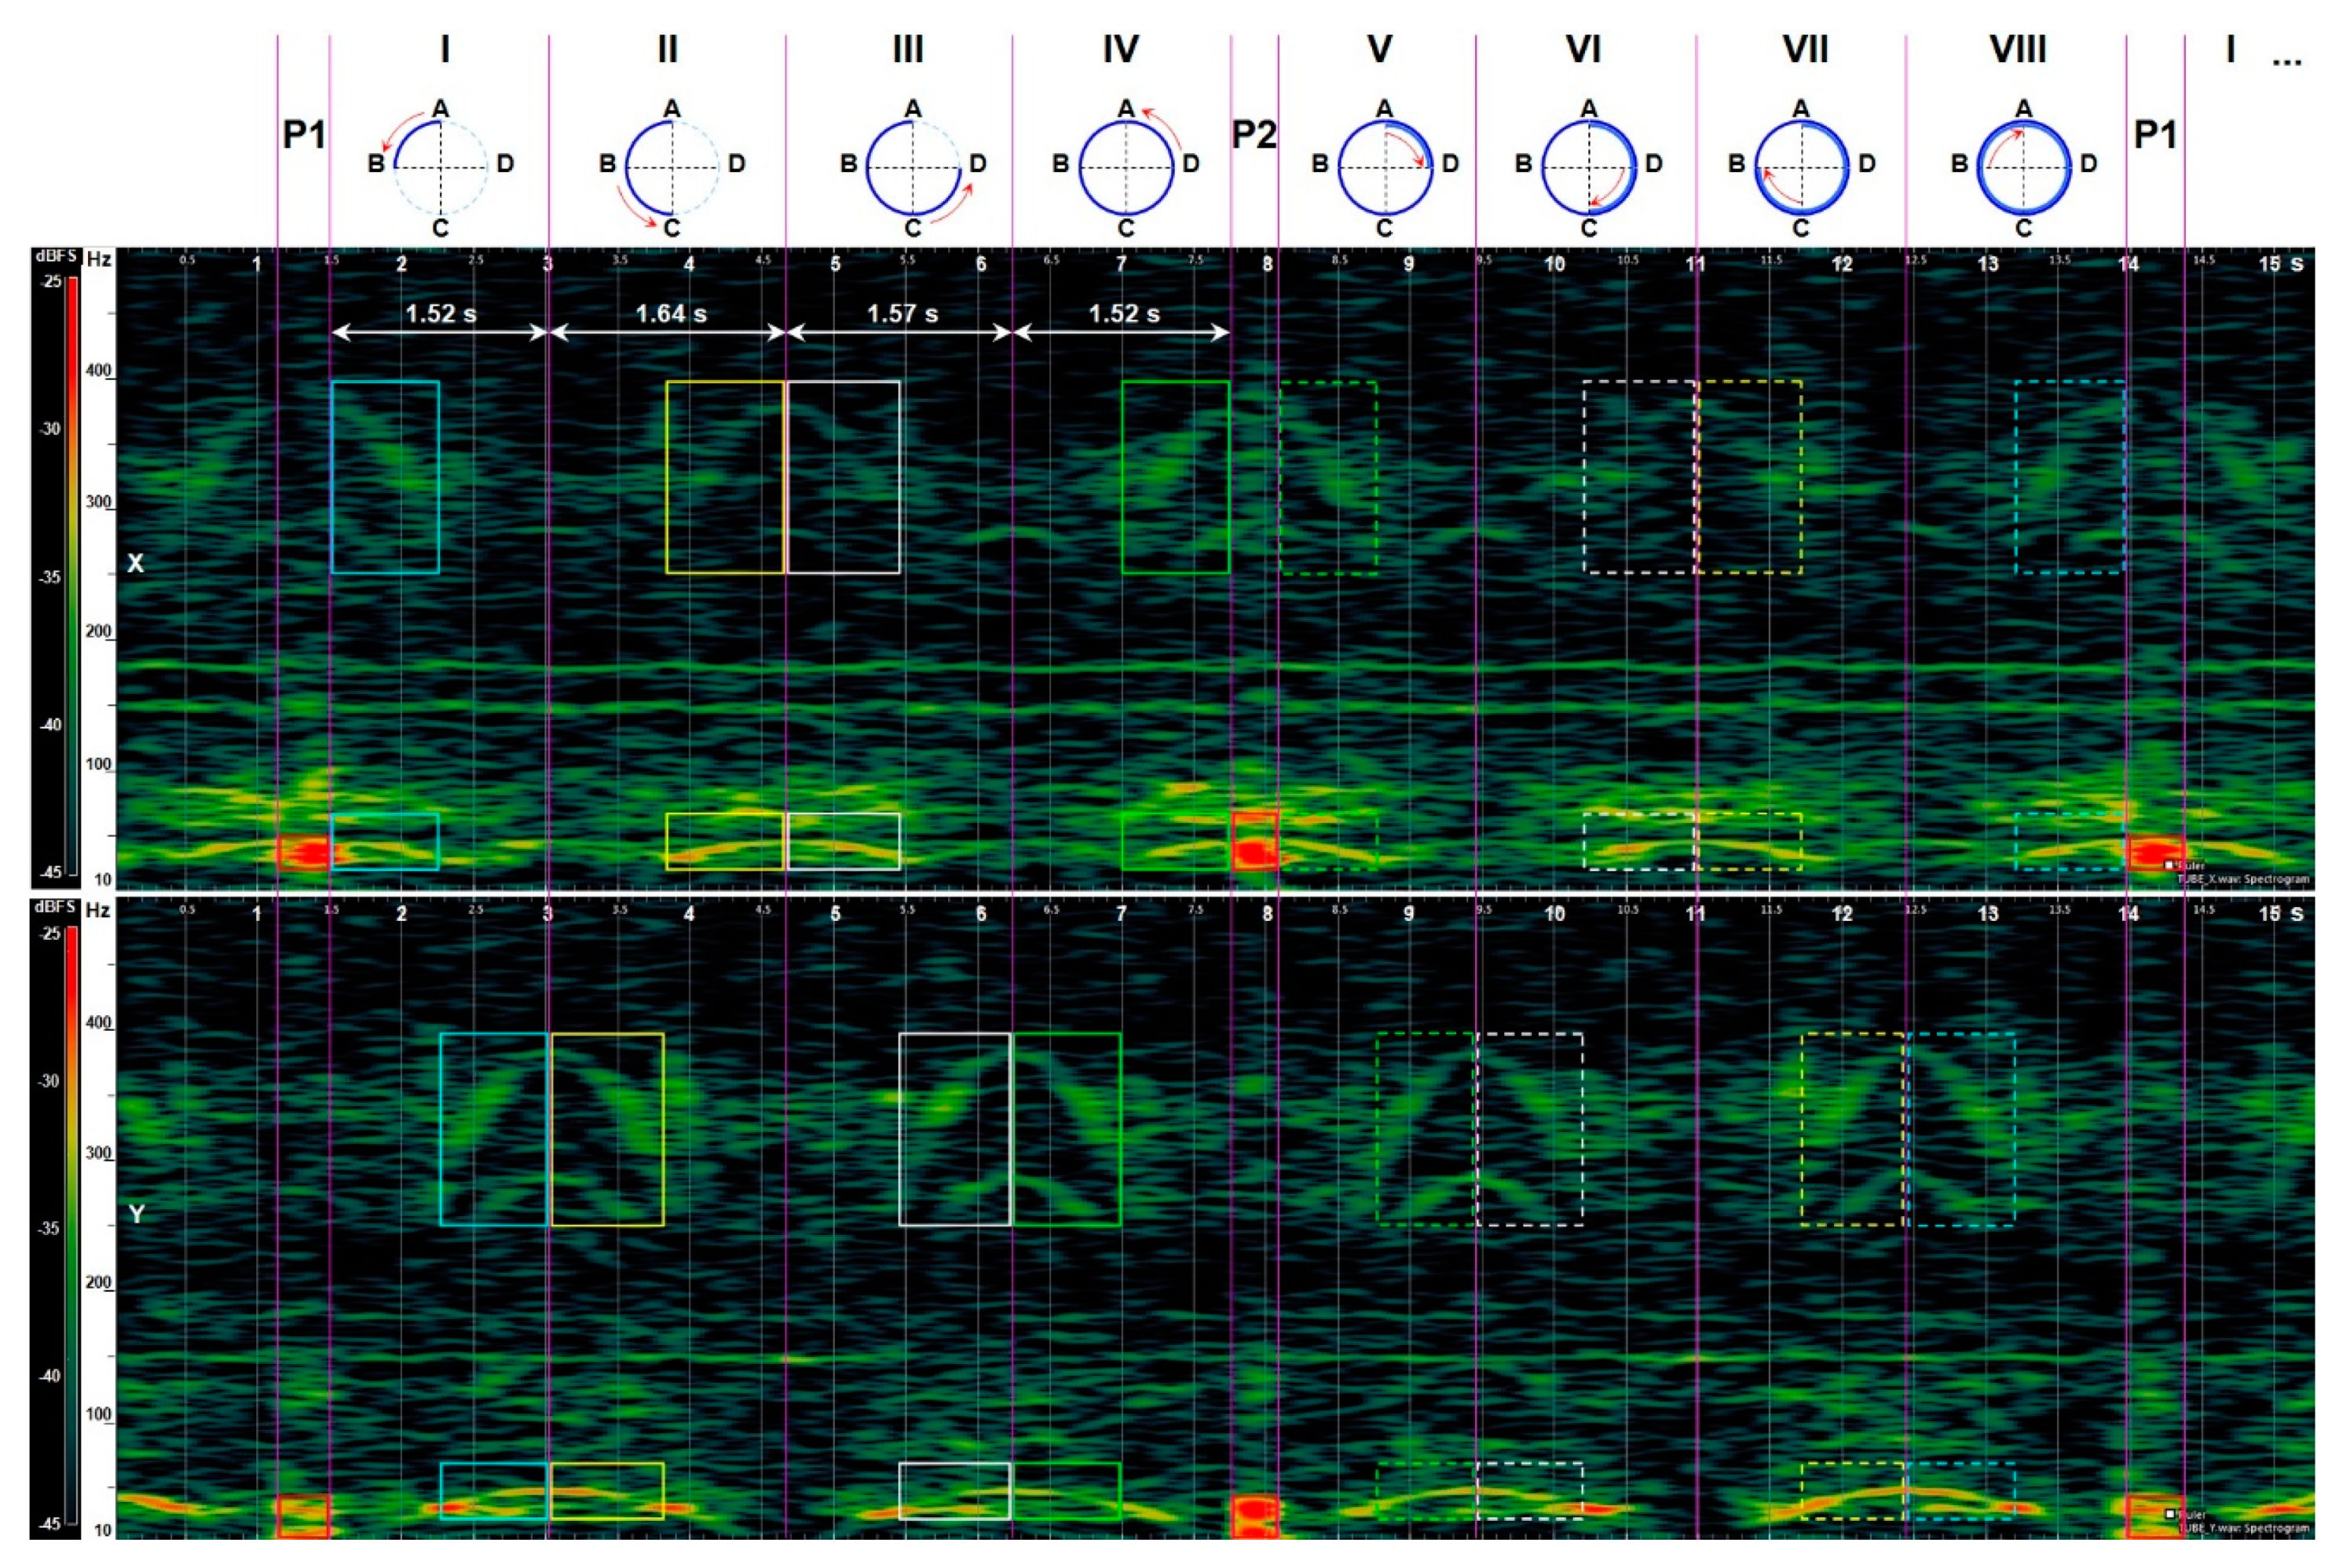
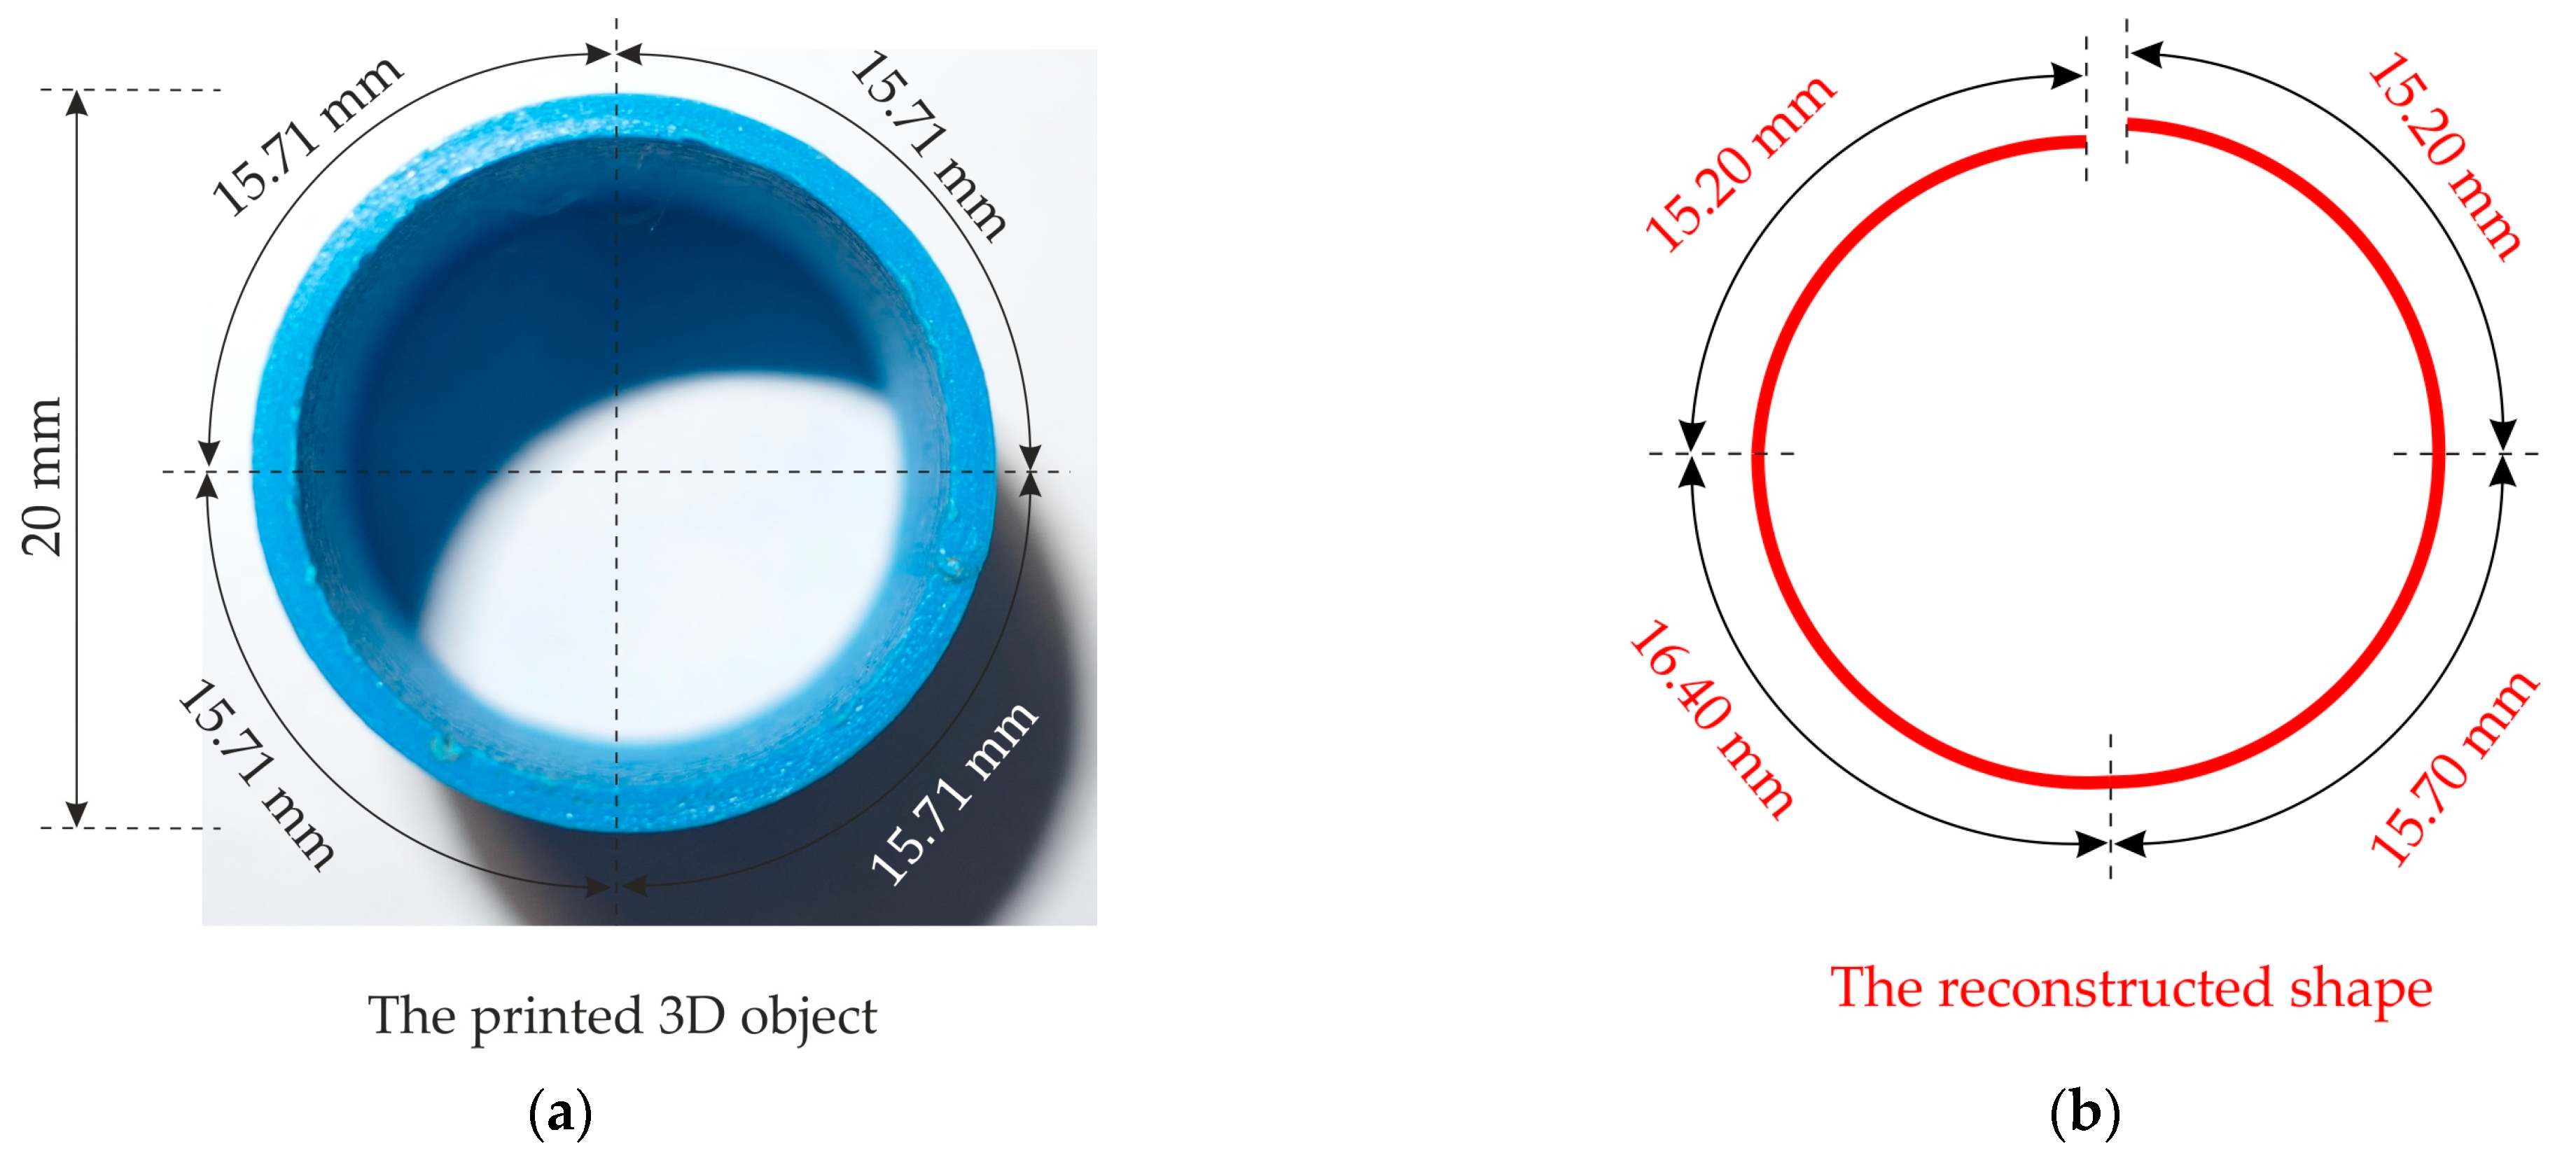
For the object with a horizontal cross-section in the form of a circle (tube,
Figure 7b) one can distinguish the characteristic printing steps marked as I, II, III, IV, V, VI, VII and VIII, and P1 and P2 in
Figure 7. These steps may be defined as follows:
- P1
the printhead performs the positioning movements (without printing), the platform is lowered by one level;
- I
the printhead prints the wall of tube (outer path, perimeter quarter I), along the arc from point A to B;
- II
the printhead prints the wall of tube (outer path, perimeter quarter II), along the arc from point B to C;
- III
the printhead prints the wall of tube (outer path, perimeter quarter III), along the arc from point C to D;
- IV
the printhead prints the wall of tube (outer path, perimeter quarter IV), along the arc from point D to A;
- P2
the printhead performs the positioning movements (without printing);
- V
the printhead prints the wall of tube (inner path, perimeter quarter IV), along the arc from point A to D;
- VI
the printhead prints the wall of tube (inner path, perimeter quarter III), along the arc from point D to C;
- VII
the printhead prints the wall of tube (inner path, perimeter quarter II), along the arc from point C to B;
- VIII
the printhead prints the wall of tube (inner path, perimeter quarter I), along the arc from point B to A.
Characteristic arches and spectrum condensations can be observed for particular printing steps. Depending on the share of the X or Y component while printing particular quarters of the tube’s walls, the arches appear on X and Y spectrograms, respectively. The areas marked respectively with a continuous and a dashed line of the same color represent printing steps where the same quarters of the tube wall are printed, but when the head moves in opposite sense. Please note that the head trajectory in steps I–IV occurs on the outer wall line being printed, while in steps V–VIII, on the inner path.
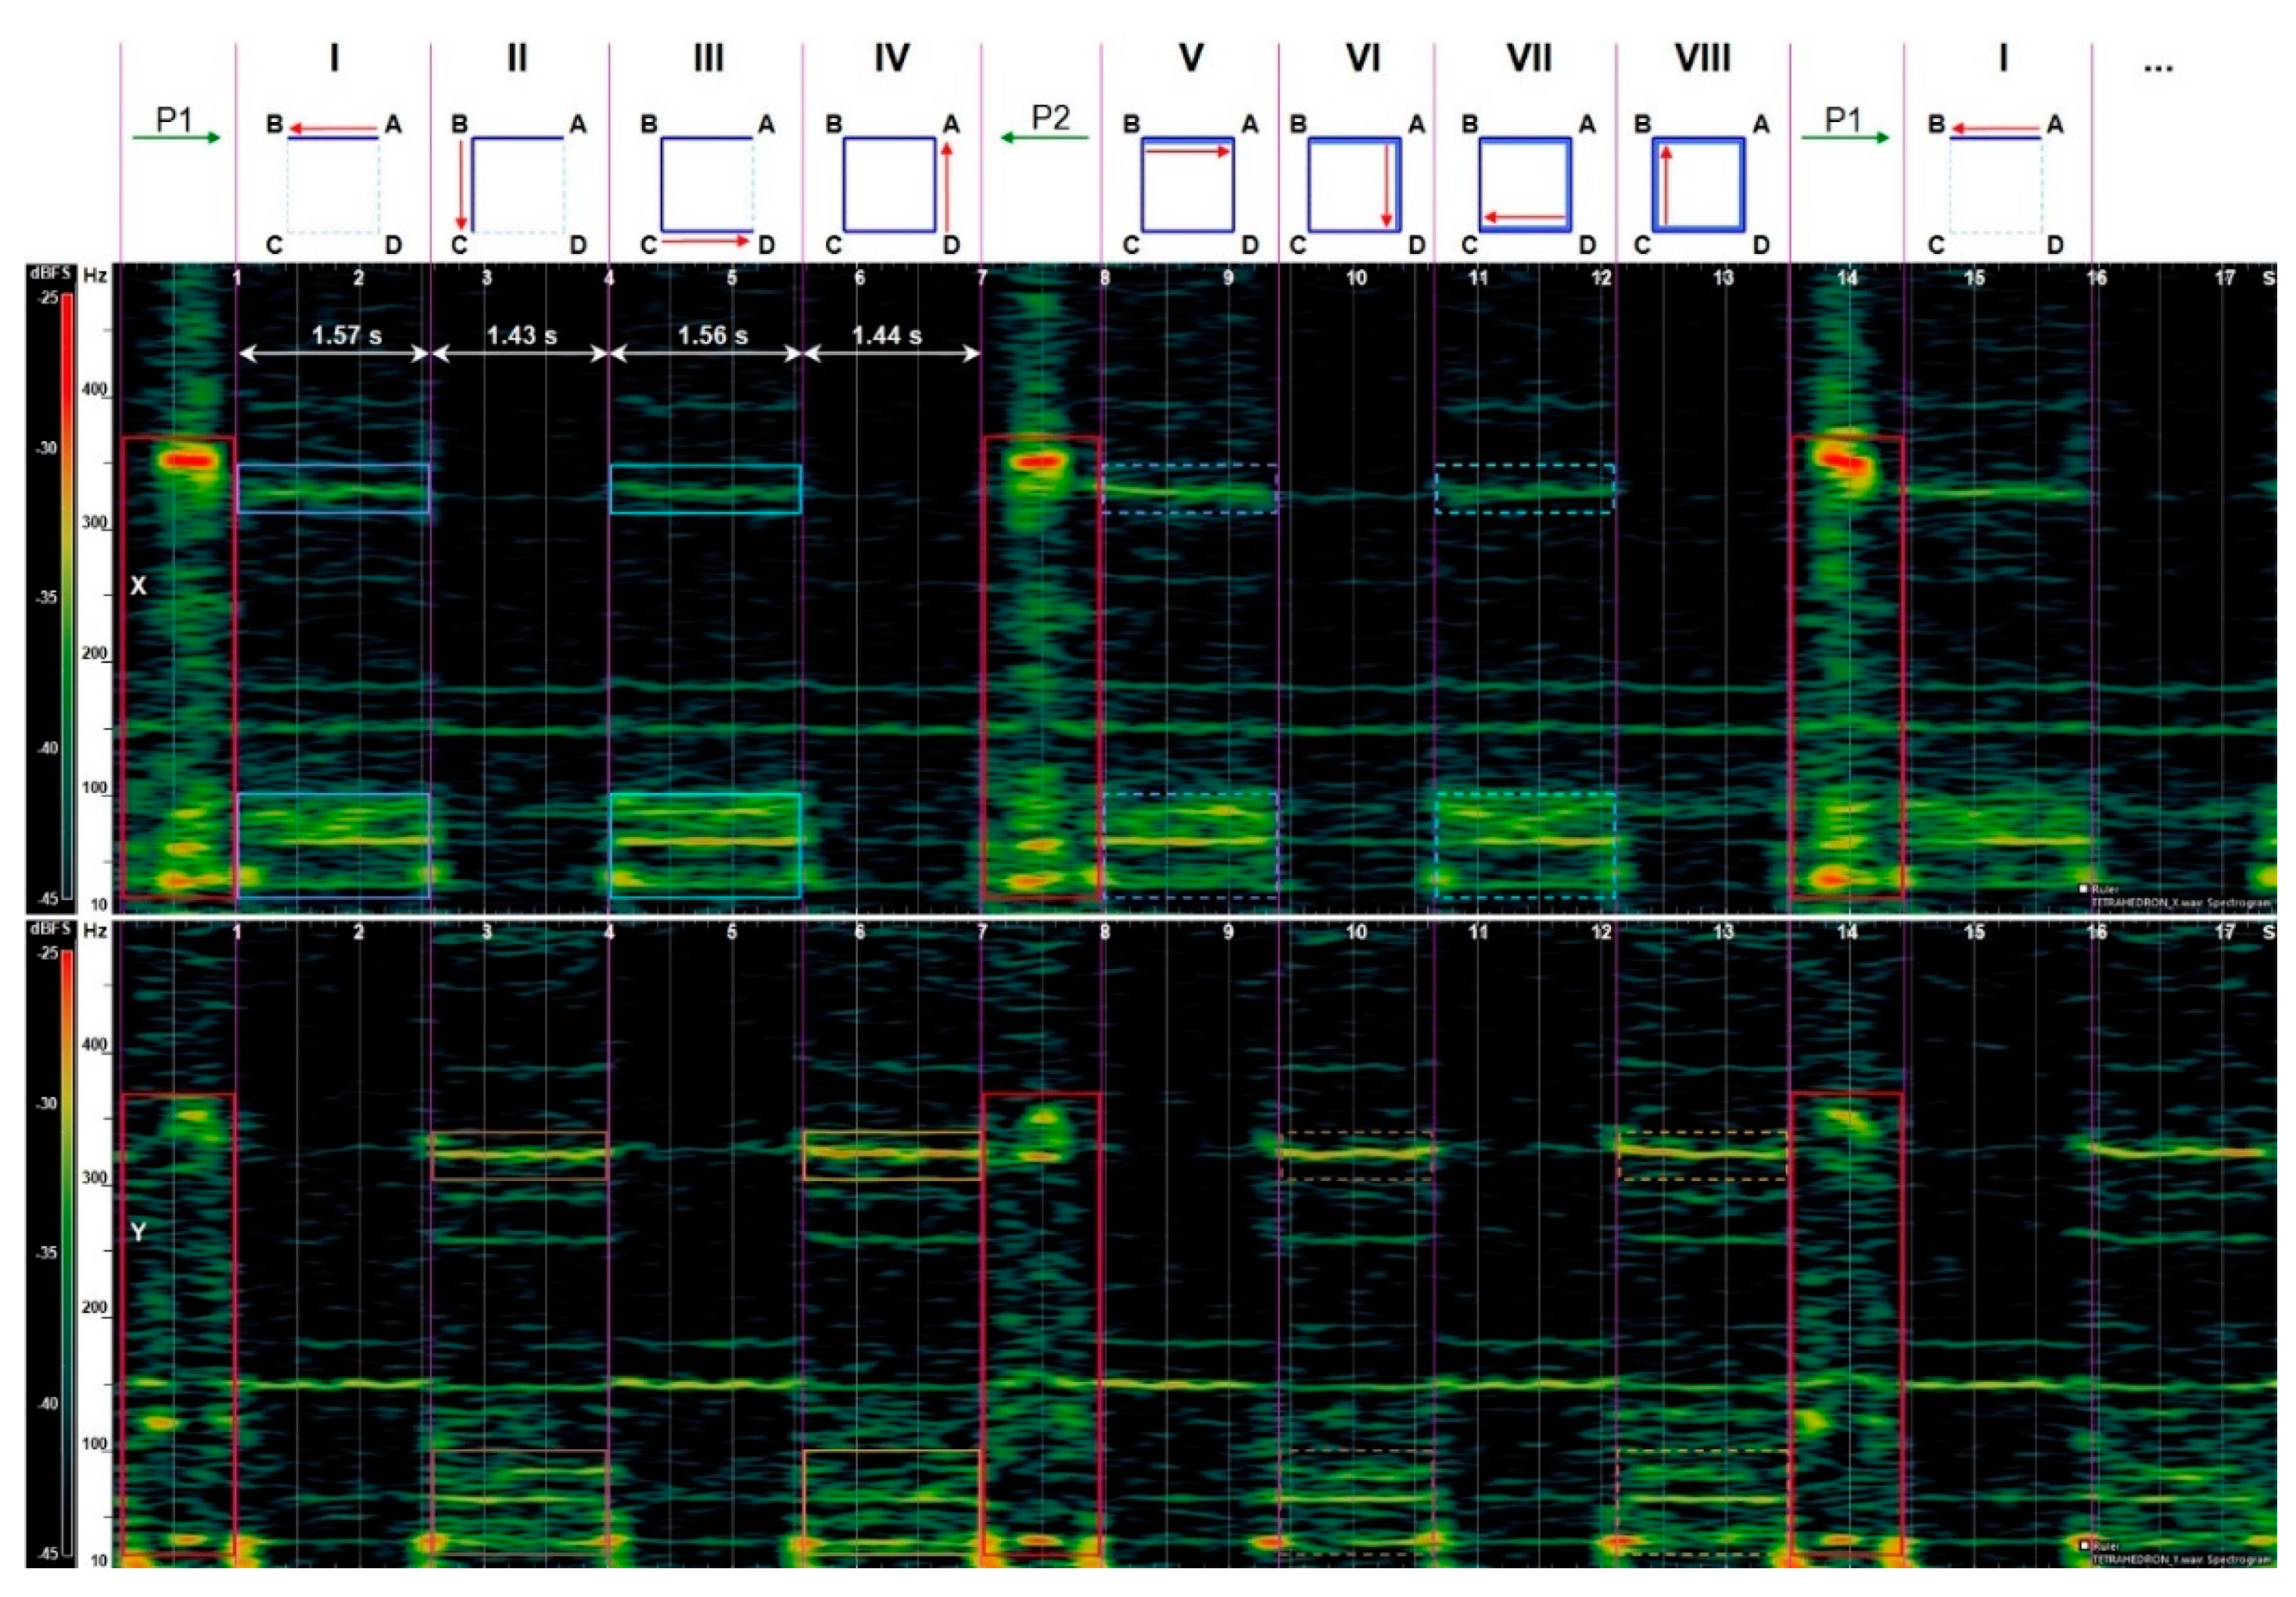
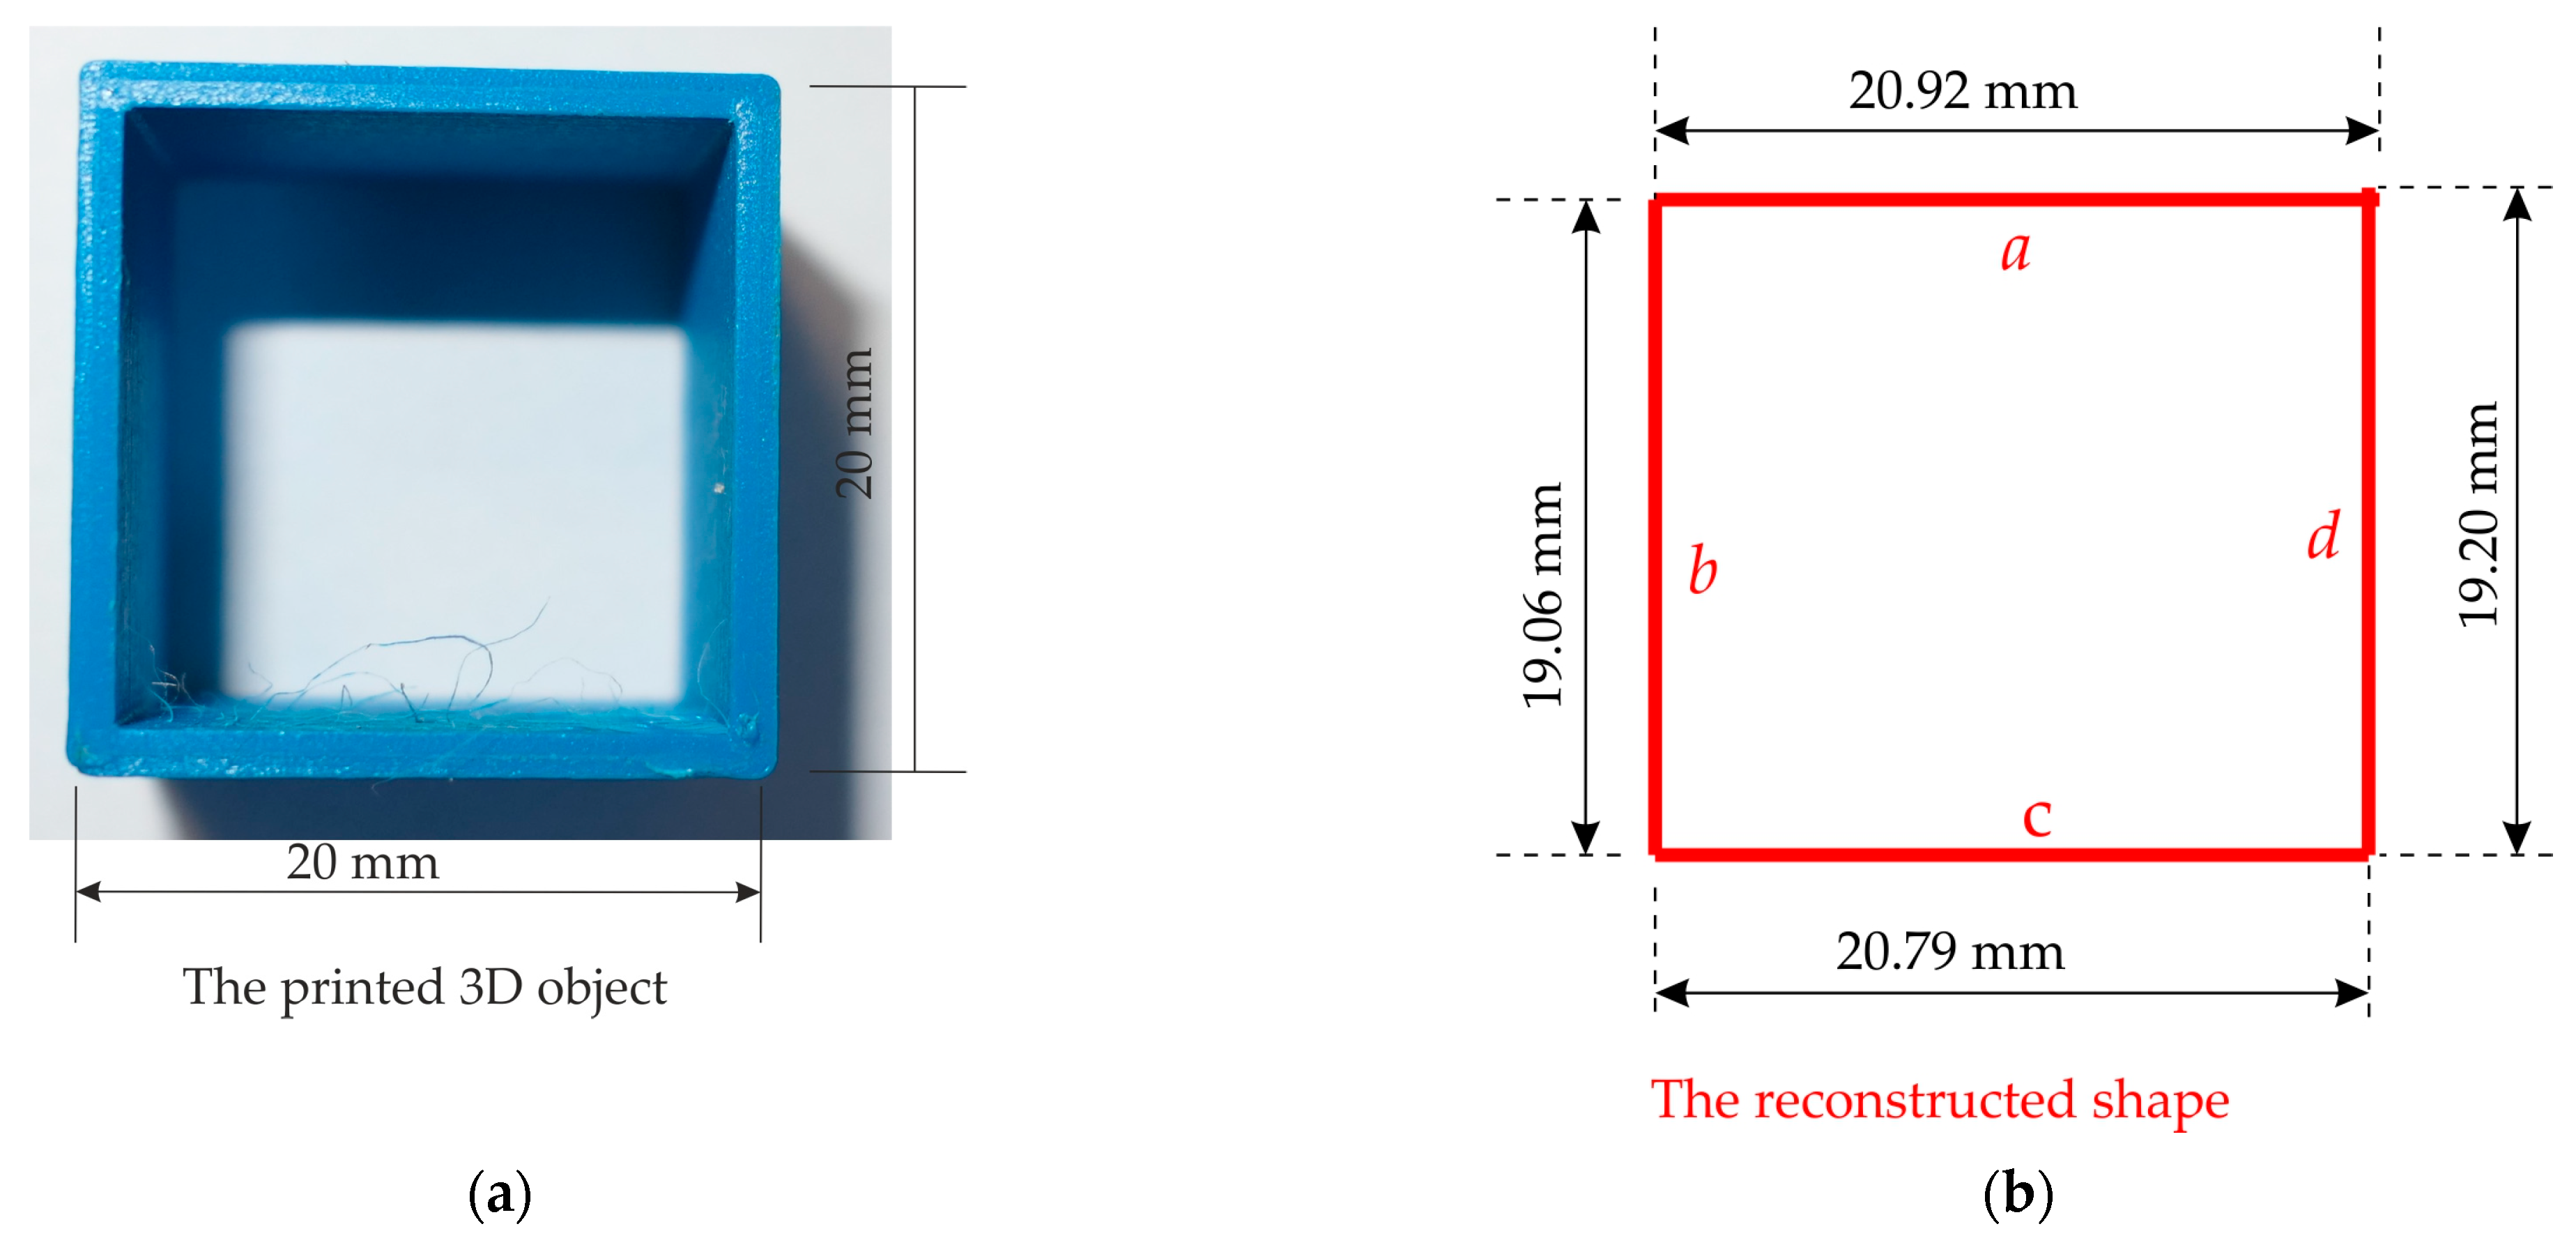
A significant item in the process of reproducing the printed objects includes the information of the printhead movement direction. It is also the head movement sense that is important. To check if it is possible to identify the feature that would reveal this phenomenon, an object (
Figure 7c) in the form of a square cross-section tetrahedron was printed. In this case, the printhead performs two movements along the X or Y axis in the opposed directions to print a specific wall. There are characteristic printing steps for this object marked as I, II, III, IV, V, VI, VII and VIII, and P1 and P2 in
Figure 12. They are characterized as follows:
- P1
the printhead performs the positioning movements (without printing), the platform is lowered by one level;
- I
the printhead print the outer path of the tetrahedron from point A to B;
- II
the printhead prints the outer path of the tetrahedron from point B to C;
- III
the printhead prints the outer path of the tetrahedron from point C to D;
- IV
the printhead prints the outer path of the tetrahedron from point D to A;
- P2
the printhead performs the positioning movements (without printing);
- V
the printhead prints the inner path of the tetrahedron from point B to A;
- VI
the printhead prints the inner path of the tetrahedron from point A to D;
- VII
the printhead prints the inner path of the tetrahedron from point D to C;
- VIII
the printhead prints the inner path of the tetrahedron from point C to B.
Condensation of the spectrum ranging from approx. 20 Hz to 370 Hz, marked with a red continuous line in spectrograms, informs about the movement of the platform and/or head positioning. Horizontal lines at a frequency of approx. 325 Hz on the X spectrogram and the spectrum condensations within the range of 20–100 Hz (the areas marked respectively with a continuous and a dashed dark blue/light blue line) inform about the head movement along the X axis. The same information regarding the head movement along the Y head can be read from the Y spectrogram (the areas marked respectively with a continuous and a dashed dark brown/light brown line). The areas marked respectively with a continuous and a dashed line of the same color represent printing steps where the same tetrahedron’s walls were printed, but when the head was moving in the opposite sense.
It should be noted that by analyzing the spectrograms presented in
Figure 10,
Figure 11 and
Figure 12, it is quite easy to determine the direction of the movement of the printhead, but the identification of its sense is very difficult (too little distinctive data). Nevertheless, the printer vibration has been shown to be a source of the secondary channel emission; therefore, using more sophisticated methods of signal analysis, more accurate information about the printed objects can be obtained.
4. Discussions
The studies of various sensitive signal sources coming from a 3D printer are aimed at assessing the existing risks from the point of non-invasive information acquisition. The information covers the shape of objects being printed. The existing studies and analyses show that the 3D printer is a source of two signal types that can pose a serious threat to data processing confidentiality [
26,
27,
28,
29]. One of them is the acoustic signal [
3] generated by stepper motors and printer moving parts (head, platform). Recording them and proper processing allows to identify the direction and sense of the printhead movement and reproduce the objects being printed with great accuracy. This is extremely important for more complex objects. Another type of signal is oscillations (vibrations) measured on the printer housing (
Figure 4). The vibrations are generated by the operation of stepper motors installed in the rear part of the printer, while printer oscillations are caused by the movement of printhead and the platform. The recorded oscillation (vibration) signals can support the process of the reconstruction of the objects in which acoustic signals are used.
The speed of the printhead movement depends on the type and thickness of the filament used and the shape of the printed object. For the tested 3D printer the printhead movement speeds are as follows:
for the directions along the X or Y axis and diagonal line in relation to the X and Y axis (the trihedron): 1.149 ;
for the directions along the X or Y axis (the tetrahedron): 1.333 ;
for the arc (the circle): 1.000 .
This is based on the dependencies that define the linear speed [
3]:
where:
v—linear speed in
s—distance in
,
t—time in
, and linear speed on the circle with the r radius [
3]:
where:
and
w—temporary linear speed in
,
l—arc length in
,
t—time in
,
r—circle radius in
,
α—arc angle in
. The attempts to recreate the printed objects shown in
Figure 6 were performed.
The results obtained during tests and analyses allowed us to find that oscillations (vibrations) generated during a 3D printer operation are sensitive signals. They make it possible, similar to acoustic signals, to identify the direction of printhead operation and reproduce the objects being printed. Vibration signals can complement the analyses of acoustic signals.
Table 4,
Table 5 and
Table 6 include the results of accuracy errors (percentage) when determining the lengths of walls of objects being printed presented in
Figure 7. For this purpose, the data obtained during the reproduction of objects based on vibration signals and the following relationship were used [
3]:
where:
e—error,
—real length of an object wall being printed,
—reproduced value of an object wall length being printed.
Analyzing the data contained in
Table 4,
Table 5 and
Table 6, it can be seen that the error in recreating the length of the walls of printed objects does not exceed 5%. These are acceptable values. The components of the error are estimation of the print head movement speed (no catalogue data exist), resolution of spectrogram reproduction, precision of marking the characteristic starting and ending moments of printing individual walls (arcs) of objects, starting printing of individual printing levels at a different point and a positioning the vibration sensor on the printer wall 3D.
Despite the noticed factors affecting the error of reproducing printed shapes, one should try to reduce them. For this purpose, tests will be carried out with a laser vibrometer. This approach will confirm the ability to record vibration signals remotely from long distances.
Another possible approach that may reduce the observed errors in reproducing the printed shapes is to undertake further work in the area of analysis of other emission sources correlated with the printed shapes, e.g., sources of electromagnetic emissions signals or the power consumption of the printer during its operation. The combination of data obtained for various sources (acoustic, vibrational, electromagnetic, changes in power consumption) will certainly increase the accuracy of shape reproduction.
5. Conclusions
The paper presents the results of tests and analyses regarding the possibility of using vibration signals in non-invasion shape data acquisition for objects printed with a 3D printer. Signals that can be used in the infiltration process are generated both by stepper motors controlling the printhead and platform and by the head and platform during their operation. The tests used objects with horizontal cross-sections with a shape of a right-angled isosceles triangle, a circle and a square (trihedron, tube and tetrahedron, respectively). The recorded vibration signals were used to create spectrograms with features allowing to identify the printhead movements, which makes it possible to reproduce the shape of the printed object. The frequencies that can be used to identify the shape of the printed object range from approx. 20 Hz to 370 Hz. The frequency spectrum of the recorded signal makes it possible to determine the printhead movement trajectory. Oscillations characteristic for the printhead operation presented in the form of spectrograms allowed us to identify the printed object components (straight lines, arches). The knowledge of the H printhead movement speed allowed us to determine the length of printed components. For the trihedron object, the leg length values of 20.33 mm and 19.42 mm (the actual length of 20.00 mm) were determined, while the value of 28.73 mm was determined for the hypotenuse length (the actual length of 28.30 mm). The reproduction error for the printed object walls was lower than 5%. It should be emphasized that it is easy to determine the direction of printhead movement based on spectrograms, while reproducing its sense is more difficult, if not impossible to specify.
The obtained research results show the great usefulness of vibration signals in the process of non-invasive data acquisition. Not every element of the printer’s construction, e.g., the platform or the print head, is a valuable source of vibration. An important issue of the correctness of the research was the proper positioning of the vibration sensor—levelling and compliance of the sensor axis with the directions of the print head movement. The lack of precision in the settings resulted in significant errors in recreating the shapes of printed objects. In the process of analyzing the recorded vibration signals, resulting in the acquisition of data on printed shapes, it is necessary to identify the starting and ending points of the printout of each level of a given shape. The possibility of reconstructing printed simple shapes is a very important conclusion in the conducted analyses. Obtained results show that the recognition of more complicated objects that are built from the simple analyzed shapes can be possible.
However, it should be noted that using accelerometers in the process of secret information acquisition requires access to the 3D printer operation site, but placing such a sensor in the form of an object normally existing in the 3D printer’s immediate vicinity does not seem to be impossible, and surely harder to notice than any intervention on the very printer. It is the human factor that many times has turned out to be the weakest part of the protection chain, while access to the room can be gained by persons unrelated directly with the object design and manufacturing process using the printer (e.g., cleaning service staff).
Another study stage will cover the signals related to printer power consumption when printing objects chosen for the analysis. The results obtained for acoustic signal analyses, oscillations (vibrations) and power consumption will be used in attempts to automate the recognition of printed objects. In addition, we plan to utilize our experience to recognize more complex objects during the additive manufacturing process.
An important result of research work covering the sensitive signals generated by 3D printers will be to present the possibilities of counteracting non-invasive data acquisition for such devices. Therefore, the final goal is to show the solutions to protect 3D printers against surveillance.


