Article

Carbon Availability and Nitrogen Mineralization Control Denitrification Rates and Product Stoichiometry during Initial Maize Litter Decomposition

1
Section of Plant Nutrition and Crop Physiology, Department of Crop Science, University of Göttingen, 37073 Göttingen, Germany
2
Thünen Institute of Climate-Smart Agriculture, Federal Research Institute for Rural Areas, Forestry and Fisheries, 38116 Braunschweig, Germany
3
Agroecology, Faculty for Biology, Chemistry, and Earth Sciences, University of Bayreuth, 95447 Bayreuth, Germany
4
Department of Genomic and Applied Microbiology, Institute of Microbiology and Genetics, University of Göttingen, 37073 Göttingen, Germany
*
Author to whom correspondence should be addressed.
Submission received: 16 April 2021 / Revised: 1 June 2021 / Accepted: 2 June 2021 / Published: 7 June 2021
(This article belongs to the Special Issue Denitrification in Agricultural Soils II)

Abstract

:
Returning crop residues to agricultural fields can accelerate nutrient turnover and increase N2O and NO emissions. Increased microbial respiration may lead to formation of local hotspots with anoxic or microoxic conditions promoting denitrification. To investigate the effect of litter quality on CO2, NO, N2O, and N2 emissions, we conducted a laboratory incubation study in a controlled atmosphere (He/O2, or pure He) with different maize litter types (Zea mays L., young leaves and roots, straw). We applied the N2O isotopocule mapping approach to distinguish between N2O emitting processes and partitioned the CO2 efflux into litter- and soil organic matter (SOM)-derived CO2 based on the natural 13C isotope abundances. Maize litter increased total and SOM derived CO2 emissions leading to a positive priming effect. Although C turnover was high, NO and N2O fluxes were low under oxic conditions as high O2 diffusivity limited denitrification. In the first week, nitrification contributed to NO emissions, which increased with increasing net N mineralization. Isotopocule mapping indicated that bacterial processes dominated N2O formation in litter-amended soil in the beginning of the incubation experiment with a subsequent shift towards fungal denitrification. With onset of anoxic incubation conditions after 47 days, N fluxes strongly increased, and heterotrophic bacterial denitrification became the main source of N2O. The N2O/(N2O+N2) ratio decreased with increasing litter C:N ratio and Corg:NO3 ratio in soil, confirming that the ratio of available C:N is a major control of denitrification product stoichiometry.

1. Introduction

Returning of crop residues is a common agricultural management strategy to prevent nutrient losses and to increase soil fertility. However, acceleration of N and C cycling processes often lead to increased losses of climate-relevant gases.
Addition of plant litter to soils has been proven to increase CO2 and N2O emissions over a vast range of soil conditions and litter types [1,2,3,4]. Upon degradation, plant litter provides nutrients for decomposing and denitrifying microorganisms. Thus, variations in N2O emissions have often been related to litter quality, especially the C:N ratio [1,2]. For litter with C:N < 25:1, mineralization increases soil NO3 content leading to increased denitrification [5,6], while for C:N > 25:1, N is immobilized by soil microorganisms to decompose litter C compounds [7] and restricts N2O emissions [8]. When litter quality was analyzed in more detail, easily degradable fractions explained a large share of the variability of N2O emissions [9,10], while the lignin content was not relevant [11,12]. Recent studies confirm that the quality of C compounds (especially water-soluble C) from litter is a main driver of denitrification after litter addition [13,14].
Easily degradable C compounds (e.g., sugars, proteins, amino acids, and carbohydrates) control litter decomposition dynamics in the initial phase and subsequent CO2 efflux from soils [4,15,16]. Furthermore, the quality of organic substrates affects decomposition of soil organic matter (SOM) [17]. Readily accessible high-quality substrates increase SOM decomposition, leading to a positive priming effect in soils [18,19]. When litter and SOM turnover are increased after litter addition, microbial O2 demand increases with increasing microbial respiration. This may lead to formation of local hotspots with anoxic or microoxic conditions providing favorable conditions for denitrifying soil microorganisms [20]. Accordingly, a recent study reported the highest denitrification-derived N2O losses in soils with high SOM priming after addition of labile C substrates (glucose, vanillin) [21]. However, further studies with plant residues are necessary to better understand the interactions between C turnover and denitrification.
The aim of this study was to investigate the effect of litter C quality and SOM turnover on denitrification. We anticipate that increased SOM turnover after litter addition promotes the formation of anoxic hotspots for denitrification and expect higher litter and SOM turnover from litter with high degradability. Thus, we hypothesize that (i) N2O fluxes from denitrification increase when C turnover from litter and SOM is high, leading to (ii) higher N2O+N2 losses when litter with a high share of easily degradable C is added, while (iii) the N2O/(N2O+N2) ratio is controlled by the availability of Corg in relation to NO3.
Therefore, we setup a laboratory incubation experiment in an artificial N2-free atmosphere under fully controlled conditions. We compared different types of maize litter (fresh leaves and roots, straw) and investigated the effect of litter quality on total CO2, NO, N2O, and N2 emissions. To trace maize litter (C4 plant) and SOM turnover, we used a grassland soil whose organic C originates solely from C3 vegetation and partitioned the CO2 efflux into its sources (i.e., litter- and SOM-derived CO2) based on the natural 13C isotope abundances. In addition, we analyzed the intramolecular distribution of the naturally occurring 15N and 18O isotopes in the linear N2O molecule and applied the N2O isotopocule mapping approach to estimate the contribution of denitrification to N2O formation [22,23].

2. Materials and Methods

2.1. Preparation of Soil and Plant Material

The soil for the experiment was taken from a long-term field experiment at the grassland research station of the University of Gießen (latitude N50°32′, longitude E8°41.3′, elevation 172 m a.s.l.), sieved to 10 mm, air-dried, and stored at 4 °C. The soil was classified as Fluvic Gleysol of clay loam texture (32% clay, 41% silt, and 27% sand) with a pH (CaCl2) of 5.67. Total soil N content was 0.42%, total soil C content was 4.2%, and δ 13C was −28.37‰. Prior to the incubation experiment, the soil was pre-incubated in the dark for 5 weeks at 50% water holding capacity (WHC) and 20 °C.
Maize plants (Zea mays L. cv. Ronaldinio) were grown in nutrient solution [24] for 5 weeks. Leaves were cut from stems and left to wilt at room temperature for 4 h. Roots were rinsed with H2Odest and carefully dried with paper towels. Leaves and roots were stored at 4 °C and 90% relative humidity until experimental setup. Maize straw was collected from an experimental field site of the University of Göttingen after grain harvest in October 2018. Maize straw was shock frozen in liquid N2 and stored at −20 °C. Prior to setting up the experiment, maize straw was unfrozen and all maize litter was cut to a size of 2 cm. A subsample of soil and maize litter was analyzed for total N, total C, and δ 13C using an elemental analyzer (NA1110, CE-Instruments, Rodano, Milano, Italy) linked to a gas-isotope ratio mass spectrometer (Delta Plus, Finnigan MAT, Bremen, Germany) via a Conflo III Interface (Finnigan MAT, Bremen, Germany). Further, plant litter was analyzed for water-extractable C and N content. Briefly, 0.2 g of finely ground plant litter were extracted in 100 mL H2Obidest, shaken for 1 h, filtered with 0.45 µm polyether sulfone filters (Labsolute, Renningen, Germany), and stored at −20 °C. The extracts were analyzed for organic C and total N content using a multi N/C® Analyzer (Analytik Jena, Jena, Germany). Another subsample of finely ground plant litter was analyzed by 13C solid-state cross polarization magic angle spinning nuclear magnetic resonance spectroscopy (13C-CPMAS NMR) using a Bruker AvanceIII 200 spectrometer (Bruker BioSpin GmbH, Karlsruhe, Germany). Samples were weighed into zircon oxide rotors and spun around a magic angle at a speed of 6.8 kHz. Contact time was 1 ms and the recycle delay time was set to 2 s, line broadening was set at 0. Peak integration areas were separated into −10–45 ppm (alkyl C), 45–110 ppm (O/N-alkyl C), 110–160 ppm (aryl C), and 160–220 ppm (carboxylic C).

2.2. Automatized Laboratory Incubation Experiment and Gas Analysis

The incubation experiment was carried out under fully controlled conditions using an automated soil incubation system with artificial atmosphere similar to systems described earlier [25,26,27,28]. For the incubation experiment, soil moisture was adjusted to 70% water-filled pore space (WFPS, equivalent to 67.7% WHC or 31.9% gravimetric water content) and 50 mg N kg−1 was added by spraying a KNO3 solution onto the soil and thoroughly stirring it with a spoon. For treatments with litter, litter was homogenously mixed with soil (Maize leaves: 40.5 g FM kg−1, maize roots: 42 g FM kg−1, maize straw: 12.8 g FM kg−1). The soil for each pot was prepared separately to ensure the same amount of litter was added. Then, the equivalent of 2.5 kg dry soil was filled into acrylic glass pots (inner diameter 172 mm, height 210 mm) with a porous ceramic plate at the bottom and compacted in a stepwise mode by filling a 2 cm-layer of soil in pots and compacting it with a plunger. To ensure continuity between soil layers, the surface of the compacted layer was gently scratched before adding the next soil layer. Soil height in the pots was 10 cm, and bulk density was 1.1 g cm−3. Each litter treatment was replicated five times, a control treatment without litter was replicated four times, and one empty pot was included as reference to determine background gas concentrations.
Pots were tightly closed with transparent acrylic glass lids with rubber seals, and the outside of the pots was covered with dark plastic sheets to prevent algae growth. Pots were alternately evacuated using a rotary vacuum pump (Pfeiffer Vacuum GmbH, Asslar, Germany) and flushed with a gas mixture (80% He, 20% O2) for 24 h. The gas mixture was prepared by using stainless steel capillaries of different length and inner diameter. For the first cycles, pots were evacuated from the top and the bottom and, subsequently, flushed with the He/O2 gas mixture. Then, pots were evacuated from the bottom and simultaneously flushed from the top to replace the atmosphere inside the soil column. For measurements, the outlet of all pots was connected to flow-through multi-position valves (16 ports, Vici Valco Instruments, Houston, TX, USA) with multi-position actuator control modules (Vici Valco Instruments, Houston, TX, USA), and controlled by Trilution Software (Gilson Inc., Middleton, WI, USA) via an interface module (506C System Interface, Gilson Inc., Middleton, WI, USA). The selected stream outlet tube of the multi-position valve was connected to a gas chromatograph (GC-450, Bruker, Billerica, USA) equipped with a thermal conductivity detector (TCD) for measurement of CO2 and a pulsed discharge detector (PDD, Vici AG International, Schenkon, Switzerland) for N2O and N2. The sample gas outlet of the GC was connected to a flow-through massflowmeter (Alicat Scientific, Tucson, AZ, USA), and a trace-level gas analyzer (CLD 88Yp, Eco Physics AG, Dürnten, Switzerland) equipped with a chemoluminescence detector (CLD) to analyze NO concentrations. To add up to the required 300-mL-flow of the NO analyzer, samples were diluted with synthetic air. Processing of GC data was done using CompassCDS software (SCION Instruments, Livingston, UK). Data from the NO analyzer and flowmeter were read out every 10 s via a serial port.
The analytical precision of the GC was determined by repeated measurements of standard gases (CO2, N2O, N2) and was consistently < 2%. Detection limits were 0.08 µg N2O-N kg−1 h−1 and 5.5 µg N2-N kg−1 h−1. The non-selected outlet streams of the multi-position valves were used to sample headspace gas for analysis of isotopic compositions (δ 13C of CO2, isotopocules of N2O). After 47 days, the pots were flushed with pure helium to establish anoxic conditions to determine potential denitrification. After 8 days of anoxic incubation (55 days in total), the pots were opened for final sampling.

2.3. 13CO2 Sampling, Analysis, and Calculations

For determination of δ13C of soil-emitted CO2, samples were flushed into 12 mL Exetainer® septum-capped vials (Labco, High Wycombe, UK). Samples were taken twice a day for the first 5 days, daily for the next 12 days, every second day for the next 14 days, and every 3 days until day 43. Samples were introduced by a Combi-Pal autosampler (CTC-Analytics, Zwingen, Switzerland) to a GC (GC-Box, Thermo Fisher Scientific, Bremen, Germany) coupled to an isotope ratio mass spectrometer (Delta plus XP, Thermo Fisher Scientific, Bremen, Germany) via a Conflo III Interface (Thermo Fisher Scientific, Bremen, Germany). The fractions of CO2 derived from litter (flitter) and SOM (fSOM) were calculated using Equations (1) and (2):
flitter = (δ13Ctreatment − δ13CControl)/(δ13Clitter − δ13CControl)
flitter + fSOM = 1
where δ13Ctreatment is the measured δ13C (‰) of CO2 from litter treatment, δ13CControl is the measured δ13C (‰) of CO2 from control treatment without litter addition, and δ13Clitter is the mean measured δ13C (‰) of CO2 lost from maize litter (Leaf: −7.91 δ‰, Root: −7.50 δ‰, Straw: −9.33 δ‰, see supplement for details, Figure S2). For each treatment, the priming effect (PE) was calculated as the difference between SOM-derived CO2-C (CSOM) and CO2-C from control treatment without litter (CControl) (3):
PE = CSOM − CControl

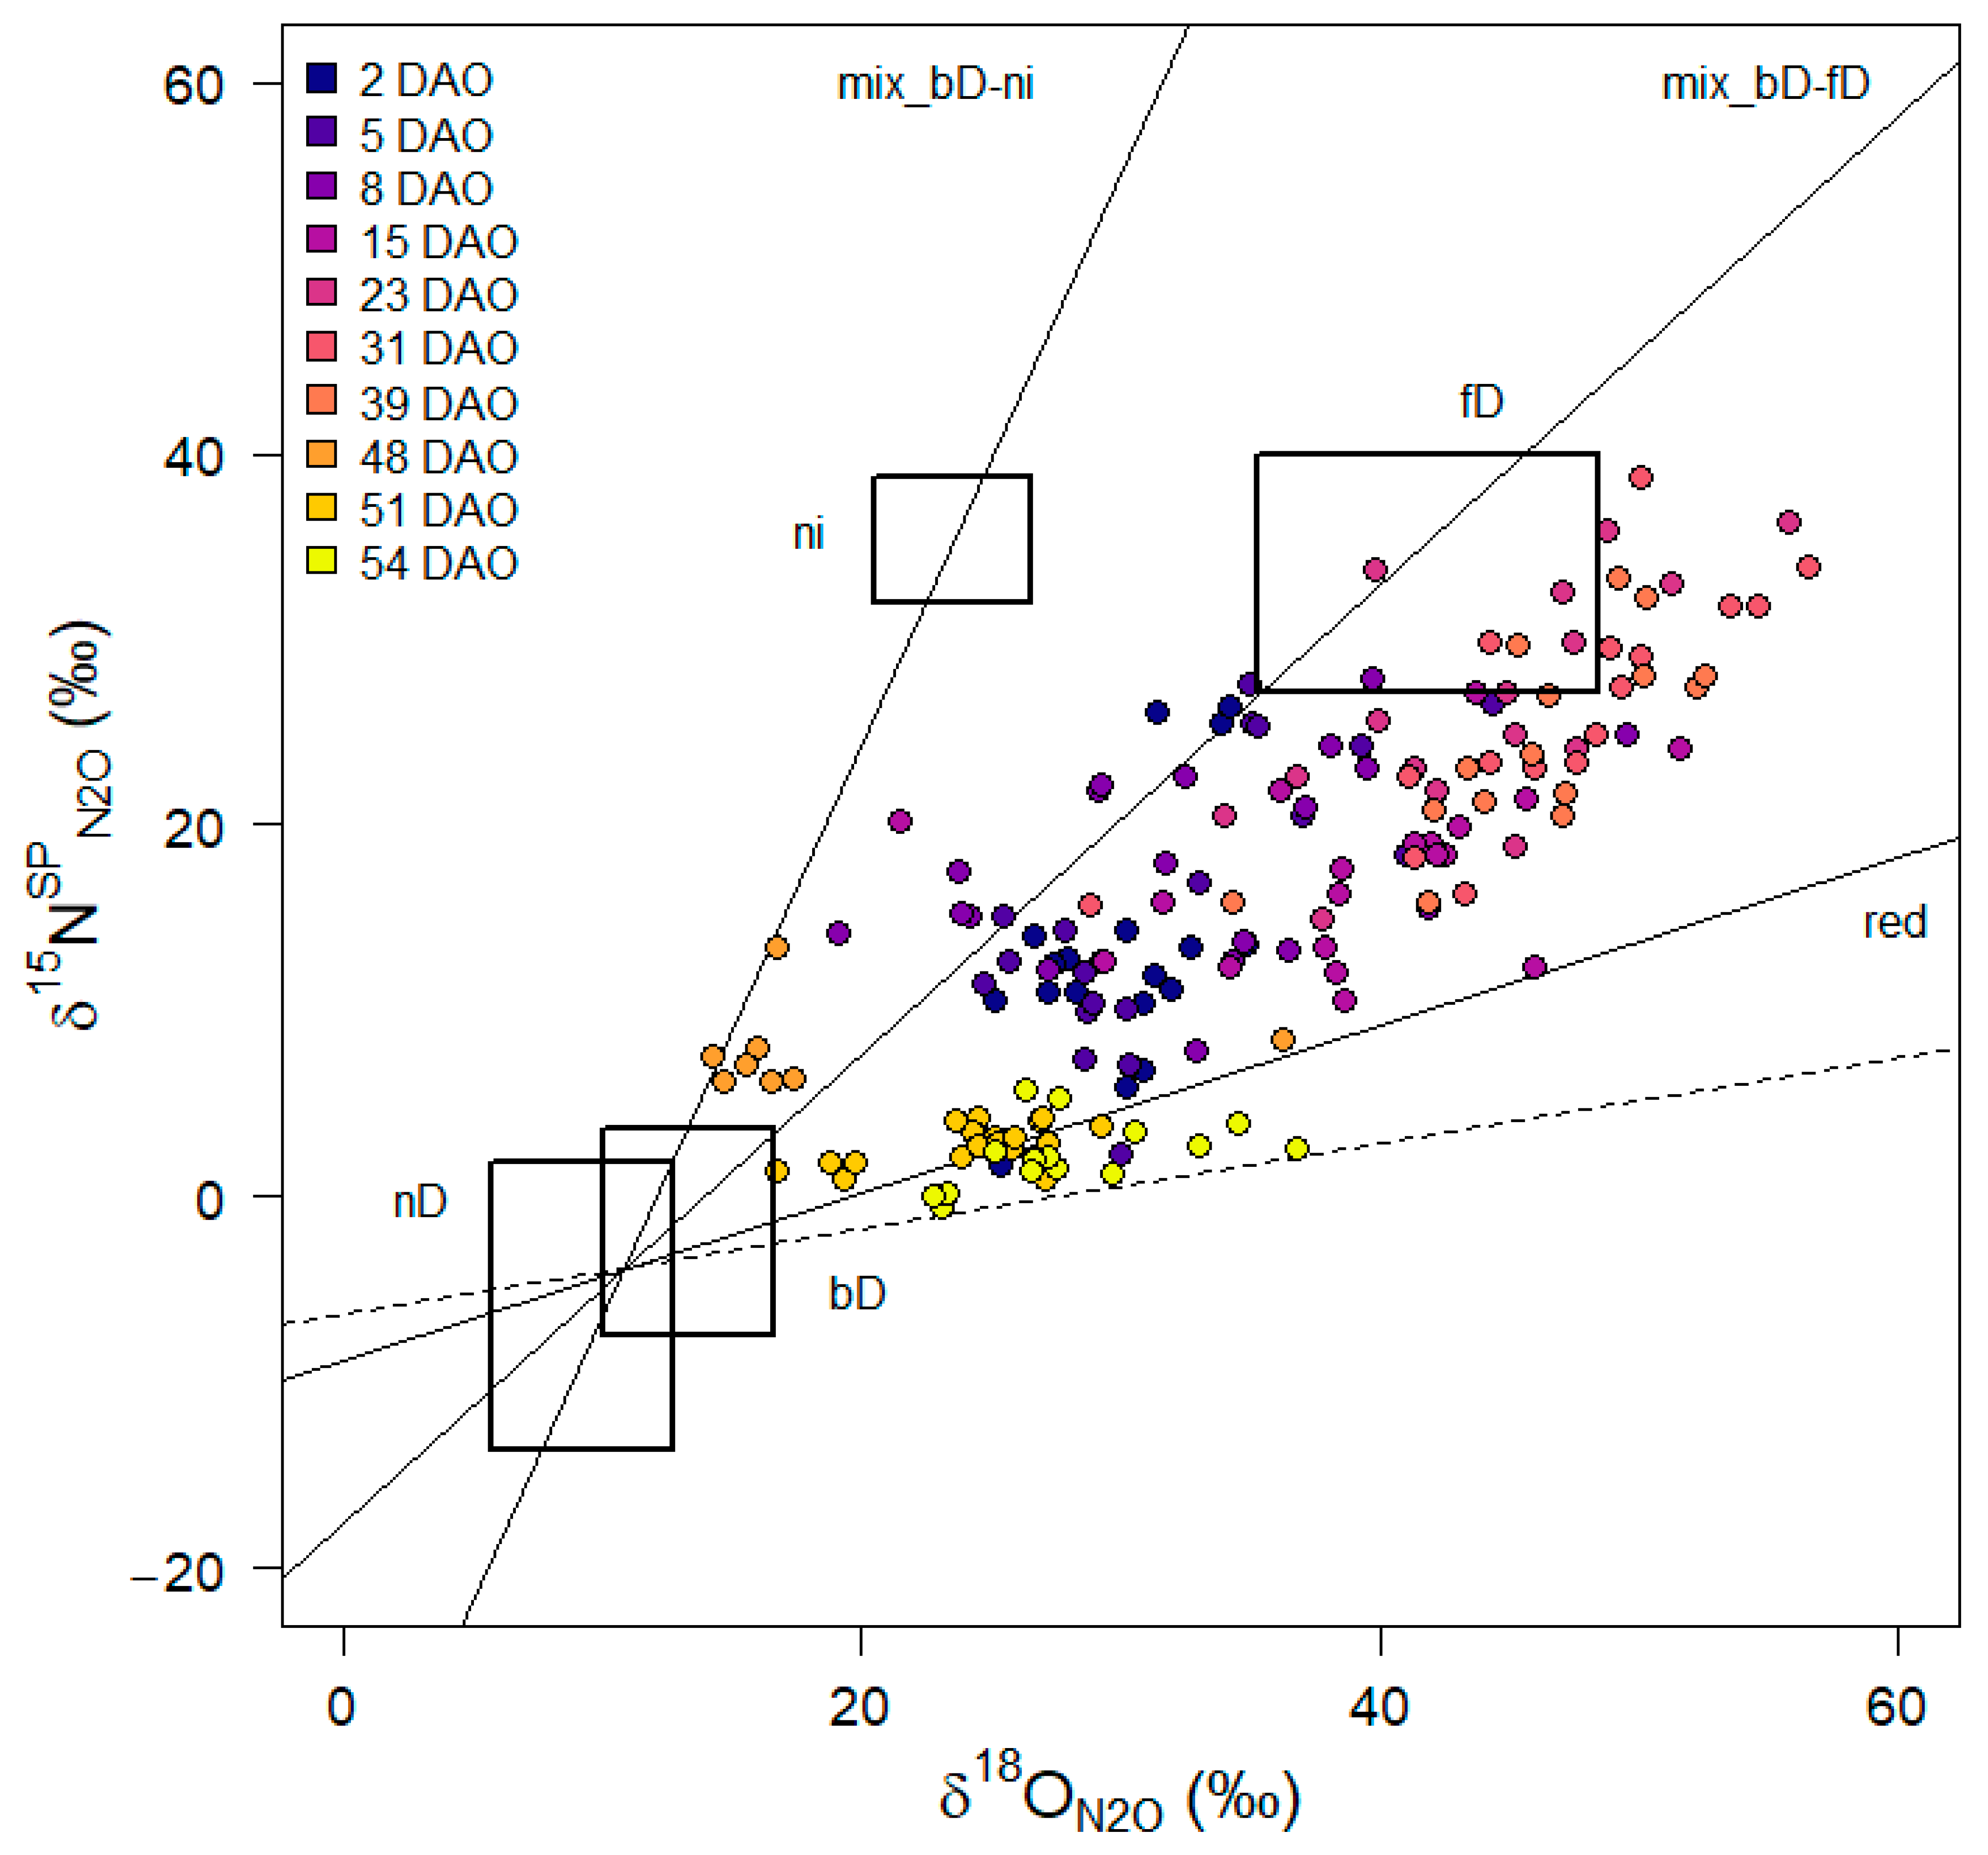
2.4. 15N2O Sampling, Analysis, and Isotopocule Mapping Approach

On 2, 5, 8, 15, 23, 31, 39, 48, 51, and 54 days after onset of incubation (DAO), samples for analyses of N2O isotopomers were flushed into 100 mL crimp-top vials with butyl rubber septa. Samples were analyzed on a gas-isotope ratio mass spectrometer (Delta plus XP, Finnigan MAT, Bremen, Germany) coupled to a trace gas pre-concentration unit Precon (Thermo Electron Cooperation, Bremen, Germany) via a GC/GP Interface (Thermo Electron Cooperation, Bremen, Germany). In this setup, m/z 44, 45, and 46 of the intact N2O+ molecular ions and m/z 30 and 31 of the NO+ fragment ions are measured simultaneously [29], and δ15NbulkN2O, δ15NαN2O, and δ18ON2O values were determined [30]. δ15NβN2O values were calculated based on the following Equation (4):
δ15NbulkN2O = (δ15NαN2O + δ15NβN2O)/2
Site preference (δ15NSPN2O) was calculated as the difference between δ15NαN2O and δ15NβN2O. We used the scrambling factor of 0.096 determined by Buchen et al. (2018) [31] to correct measured data [32]. δ18O of soil water was −6.7 δ‰.
We applied the isotopocule mapping approach by Lewicka-Szczebak et al. (2017) [22] to calculate the fraction of residual unreduced N2O (rN2O) and the N2O fraction from heterotrophic bacterial denitrification (fbD) based on the sample position in the δ15NSP18O map using a mixing equation for the bacterial fraction (6) and the Rayleigh equation for N2O reduction (5):
rN2O = e((δr − δ0)/ηred)
δ0_sample = δbD ∗ fbD + δfD/Ni ∗ (1 − fbD)
where δr is the isotopic signature of residual N2O after partial reduction, δ0 is the isotopic signature of initial N2O before reduction, and ηred is the isotopic fractionation factor associated with N2O reduction to N2. Two main scenarios were considered: (1) N2O emitted from bacterial denitrification is first reduced to N2 and residual N2O is then mixed with N2O originating from nitrification or fungal denitrification (Scenario 1, reduction-mixing). Alternatively, (2) N2O from bacterial denitrification and nitrification or fungal denitrification is first mixed and then partially reduced to N2 (Scenario 2, mixing-reduction). Recently, non-overlapping signatures for N2O produced by nitrification or fungal denitrification were proposed [23], and we calculated both scenarios for mixing of bacterial denitrification with either nitrification or fungal denitrification. A detailed description of the calculations can be found in [33]. We used the isotopic fractionation factors proposed by [23] (Supplementary Table S1), which were corrected for δ18O of soil water (−6.7 δ‰) for mapping and calculations.
In addition, calculations can be based on minimum or maximum end-member values, fractionation factors, and reduction factors, leading to a total of 14 different scenarios [31]. In our study, we used mean values for mixing, fractionation, and reduction whenever possible. However, as during anoxic incubation, samples were distributed outside the mean mixing-reduction area, we used minimum reduction values (mean mixing, mean fractionation) for 51 and 54 DAO. When calculations yielded values < 0 or > 1 for fbD or rN2O, these values were removed from the dataset before calculating means and plotting.

2.5. Soil Analyses

Samples of pre-incubated soil were taken prior to experimental setup. After opening pots at the end of the experiment, soil from each pot was homogenized and a sample was taken for analyses. Subsamples were analyzed for soil mineral N, water-extractable organic C (WEOC), and soil water content. For analysis of mineral N (NO3 and NH4+), 50 g fresh soil were weighed into plastic bottles and frozen at −20 °C until analysis. Frozen samples were extracted with 2 M KCl solution (1:5 w:v) and shaken on an overhead shaker for 60 min. Samples were filtered with 615 ¼ filter paper (Macherey–Nagel GmbH & Co. KG, Düren, Germany) and extracts were analyzed colorimetrically using the San++Continuous-Flow Analyzer (Skalar Analytical B.V., Breda, The Netherlands). To determine isotopic signatures of nitrate, the bacterial denitrification method with Pseudomonas aureofaciens was applied [34,35].
WEOC was extracted by homogenizing 2 g of fresh soil with 10 mL H2Obidest. Samples were centrifuged, filtered with 0.45 µm polyether sulfone filters (Labsolute, Renningen, Germany), and stored at −20 °C. The extracts were analyzed for organic C and total N content using a multi N/C® Analyzer (Analytik Jena, Jena, Germany). Soil water content was determined by oven drying at 105 °C.

2.6. Calculations and Statistics

For all calculations and statistical analyses, the statistical software R version 3.6.0 [36] was used. Fluxes of CO2, N2O, N2, and NO (F, µg kg−1 h−1) were calculated using the dynamic chamber approach (7):
F = (Co − Ci) ∗ Q/m
where Co is the concentration at the outflow and Ci is the concentration at the inflow of each vessel (mg N m−3, or mg C m−3), Q is the flow rate through the headspace (m3 h−1), and m is the dry mass of soil per vessel (kg).
Net N mineralization was calculated according to Equation (8):
Net N mineralization = NO3end + NH4+end + NOcml + N2Ocml + N2cml − (NO3start + NH4+start + NO3fertilizer)
Mean values and standard deviations were calculated using the SlidingWindow function from the package evobiR v.1.1 [37] or the rollapply function from the package zoo [38]. Cumulative emissions were calculated by interpolation between measured fluxes. To test for differences between treatments, a one-way ANOVA was calculated when data were normally distributed or the Kruskal–Wallis rank sum test for non-normally distributed data followed by the LSD post hoc test. A t-test at p < 0.05 was used to compare soil NO3, NH4+, and WEOC content before and after the incubation. To analyze the effect of litter input and litter quality on CO2 and N emissions, simple linear regression models were tested. In all plots, color schemes from the R package viridisLite v0.3.0 [39] were used.

3. Results

3.1. Characterization of Maize Litter

Maize litter types differed in their chemical composition (Table 1). Total C content ranged between 40% in maize roots and 47% in maize leaves. Total N content ranged between 3.8% in maize leaves and 0.85% in maize straw. C:N ratio was highest in maize straw (51.4) and similar in maize leaves and roots (12.3 and 13.8, respectively). Water-soluble C contents were similar in all maize litter types (8–8.5%). Water-soluble N content was highest in maize roots (1.22%) and lowest in maize straw (0.39%). Thus, water-soluble C:N was highest in maize straw and lowest in maize roots. 13C-CPMAS NMR spectroscopy of maize litter revealed that maize straw and maize leaves were closer in their chemical composition than maize roots (Table 1, spectra in Supplementary Figure S1). Maize roots were characterized by the lowest shares of alkyl C and carboxyl C and the highest share of O/N-alkyl C, while maize leaves had highest shares of carboxyl C and alkyl C.

3.2. Soil N and C Content

Soil NO3 content increased in Control, Leaf, and Root treatments during the incubation experiment due to a net mineralization of N (Table 2). In contrast, addition of maize straw significantly decreased soil NO3 content and immobilized N. Soil NH4+ content strongly decreased in all treatments during the incubation period and was significantly higher in all maize litter treatments than in Control, but differences between treatments were small. WEOC content increased in all maize litter treatments, but did not change in Control. No differences were found in soil WEOC content between different litter treatments at the end of the experiment.
δ15NNO3 and δ18ONO3 of added KNO3 were higher compared to initial soil NO3 at onset of incubation (Table 2). At the end of the incubation experiment, δ15NNO3 and δ18ONO3 of soil NO3 differed between litter treatments. The lowest δ15NNO3 was measured in Root, and the lowest δ18ONO3 in Control and Leaf. The highest δ15NNO3 and δ18ONO3 were measured in Straw. δ15NNO3 increased with decreasing net N mineralization (adj. R2 = 0.73, p < 0.001, Table 3).

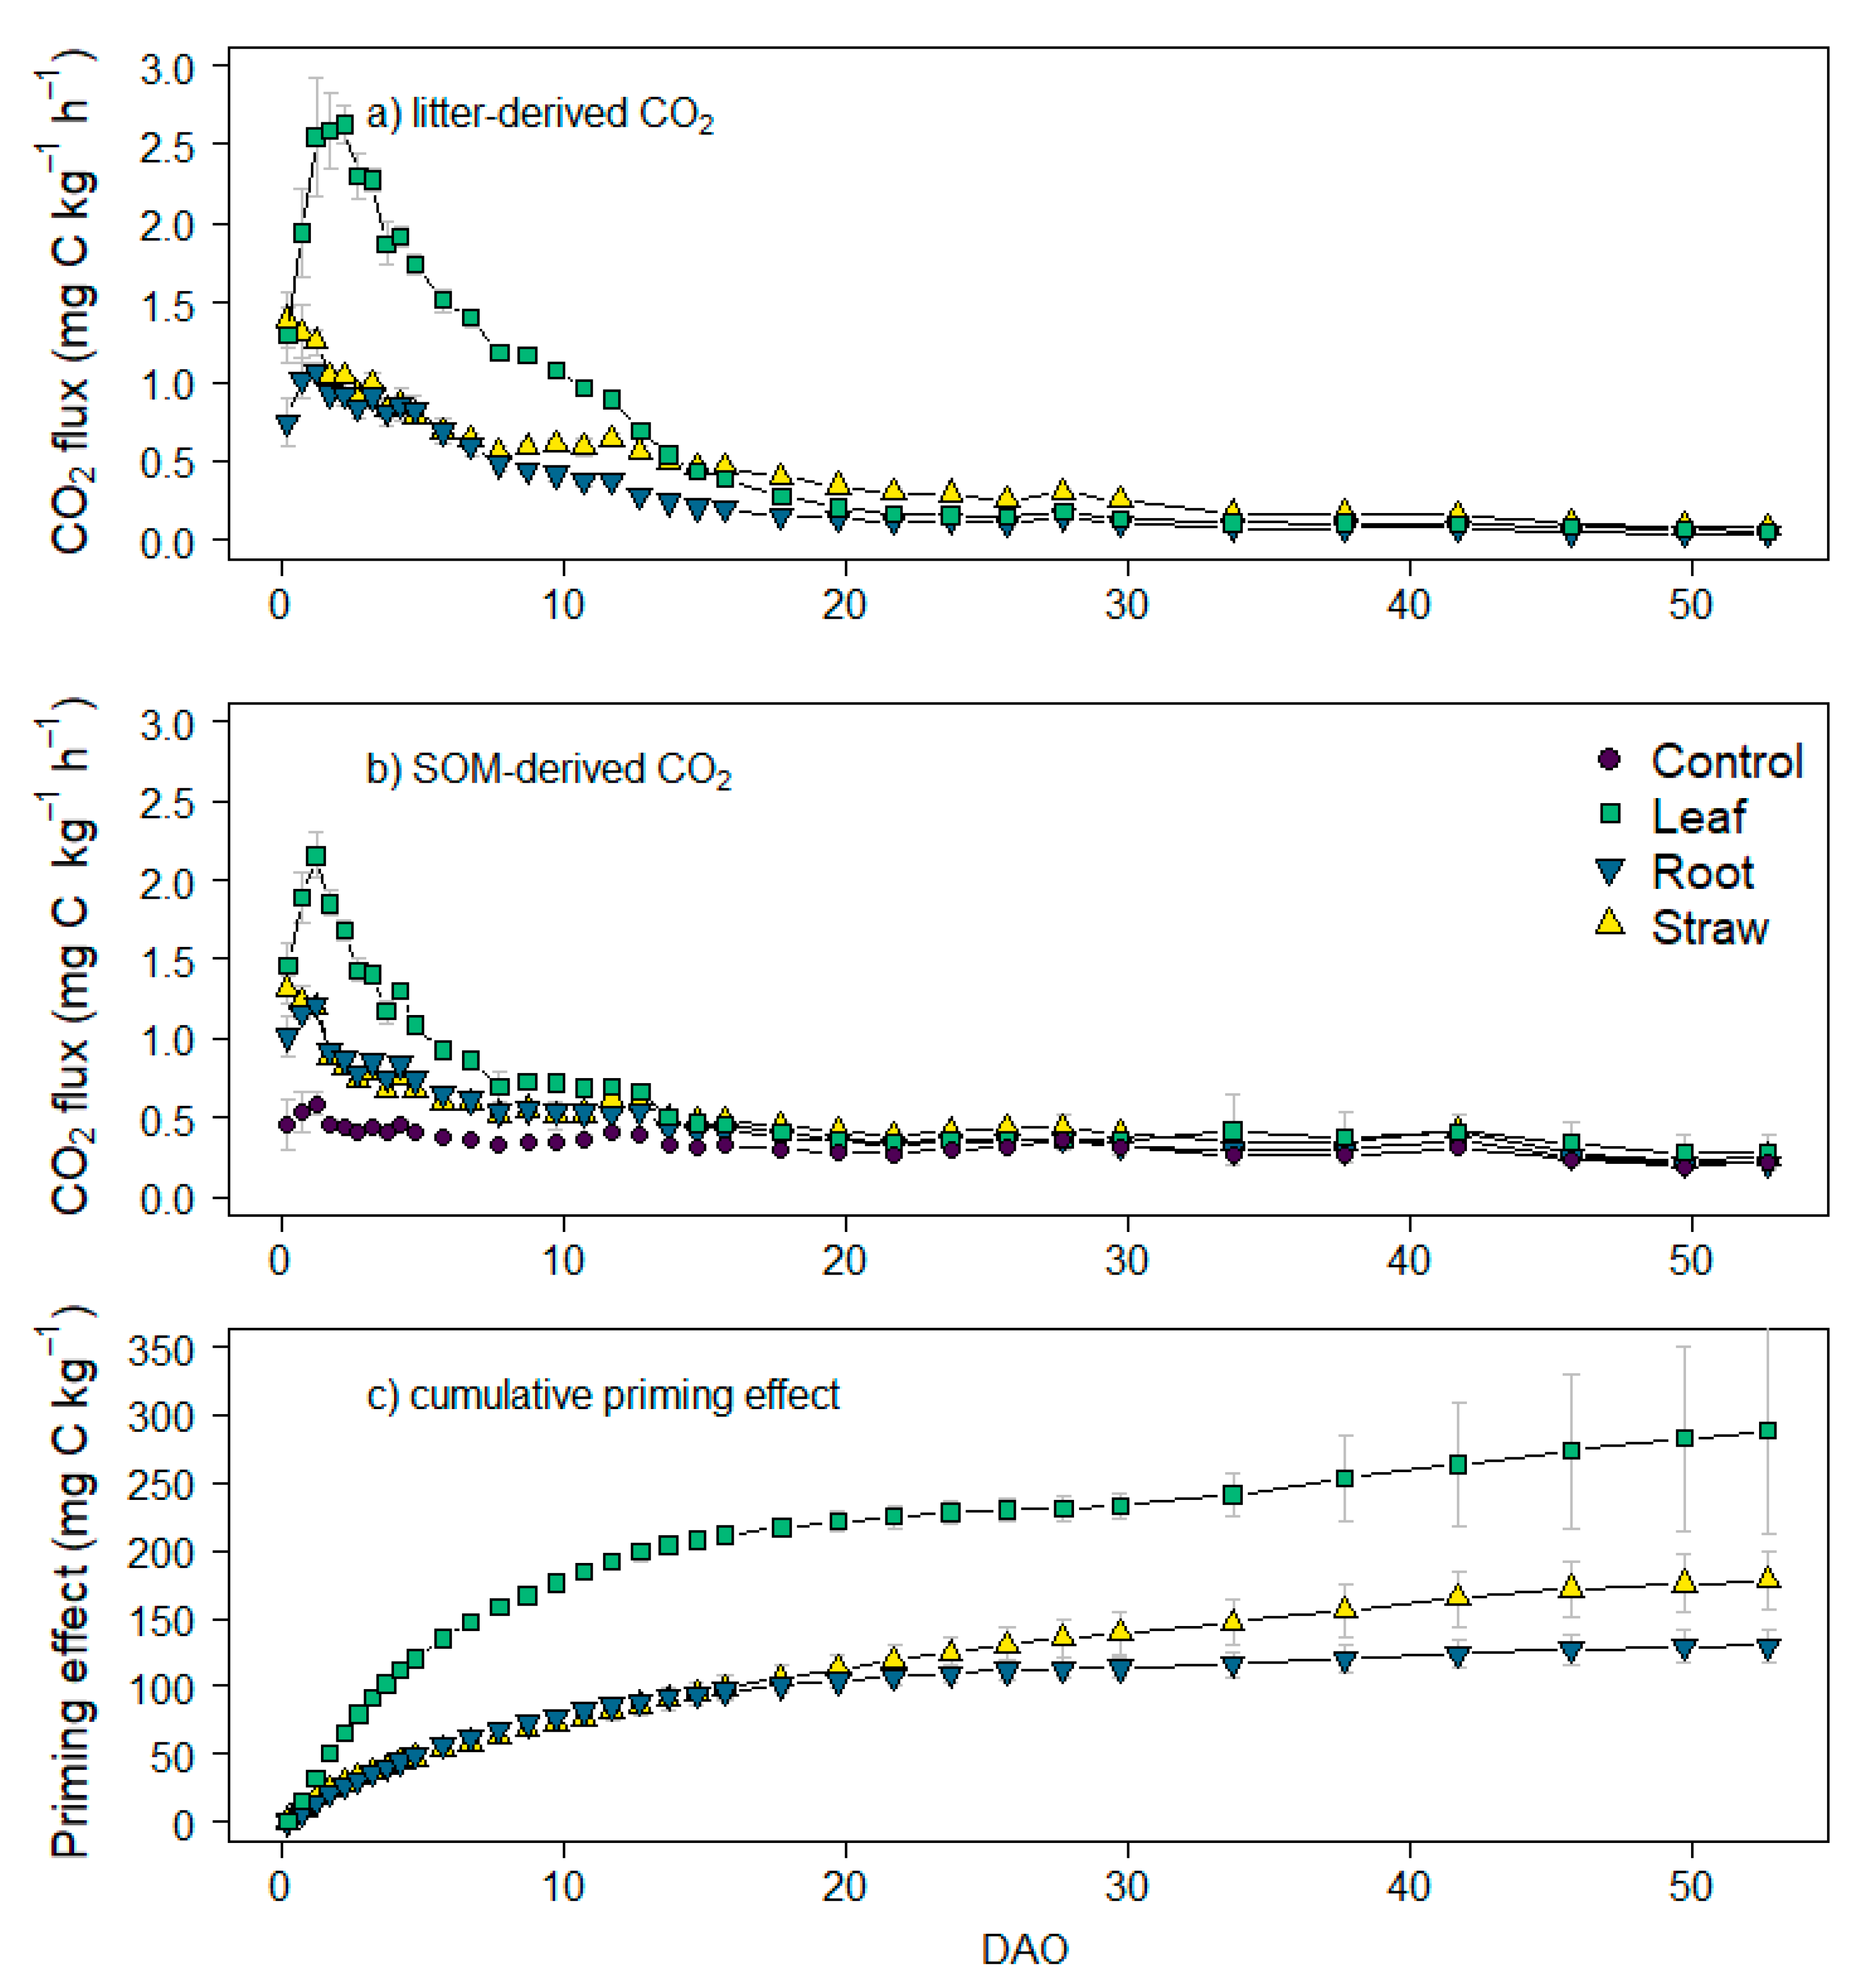
3.3. CO2 and 13CO2 Fluxes and Cumulative Emissions

CO2 fluxes from all litter treatments increased after onset of incubation compared to Control (Figure 1a,b, Supplementary Figure S3). Total CO2 fluxes were highest in Leaf reaching 5.1 mg C kg−1 h−1 on 2 DAO. In Root, CO2 flux peaked on 2 DAO (2.57 mg C kg−1 h−1) and then decreased throughout the incubation period. In Straw, the highest CO2 fluxes were measured directly after onset of incubation (2.8 mg C kg−1 h−1), and continuously decreased afterwards. Litter-derived and SOM-derived CO2 followed a similar pattern as total CO2 fluxes and were highly correlated (adj. R2 = 0.88, p < 0.001, Table 3). Highest litter-derived CO2 fluxes were measured in Leaf on 3 DAO (3.0 mg C kg−1 h−1), in Straw on 1 DAO (1.2 mg C kg−1 h−1), and in Root on 2 DAO (1.7 mg C kg−1 h−1) (Figure 1a). SOM-derived CO2 was highest in Leaf and higher in all litter treatments compared to Control for the first week after onset of incubation (Figure 1b). Accordingly, the cumulative priming effect increased most strongly in all litter treatments during the first days of incubation (Figure 1c) with highest values in Leaf.
Cumulative CO2 emissions from all litter treatments were significantly higher than from Control without litter (p < 0.05, Table 4). The highest cumulative and litter-derived CO2 emissions were measured after addition of maize leaves, followed by maize straw and maize roots; however, cumulative SOM-derived CO2 emissions were higher than litter-derived CO2 emissions in all treatments (Table 4). Total cumulative CO2 emissions were significantly positively correlated with total C and water-soluble C input from maize litter (adj. R2 = 0.80 and adj. R2 = 0.90, respectively, p < 0.001, Table 3). When total cumulative CO2 emissions were standardized against C input from litter, no differences were found (Supplementary Table S2).

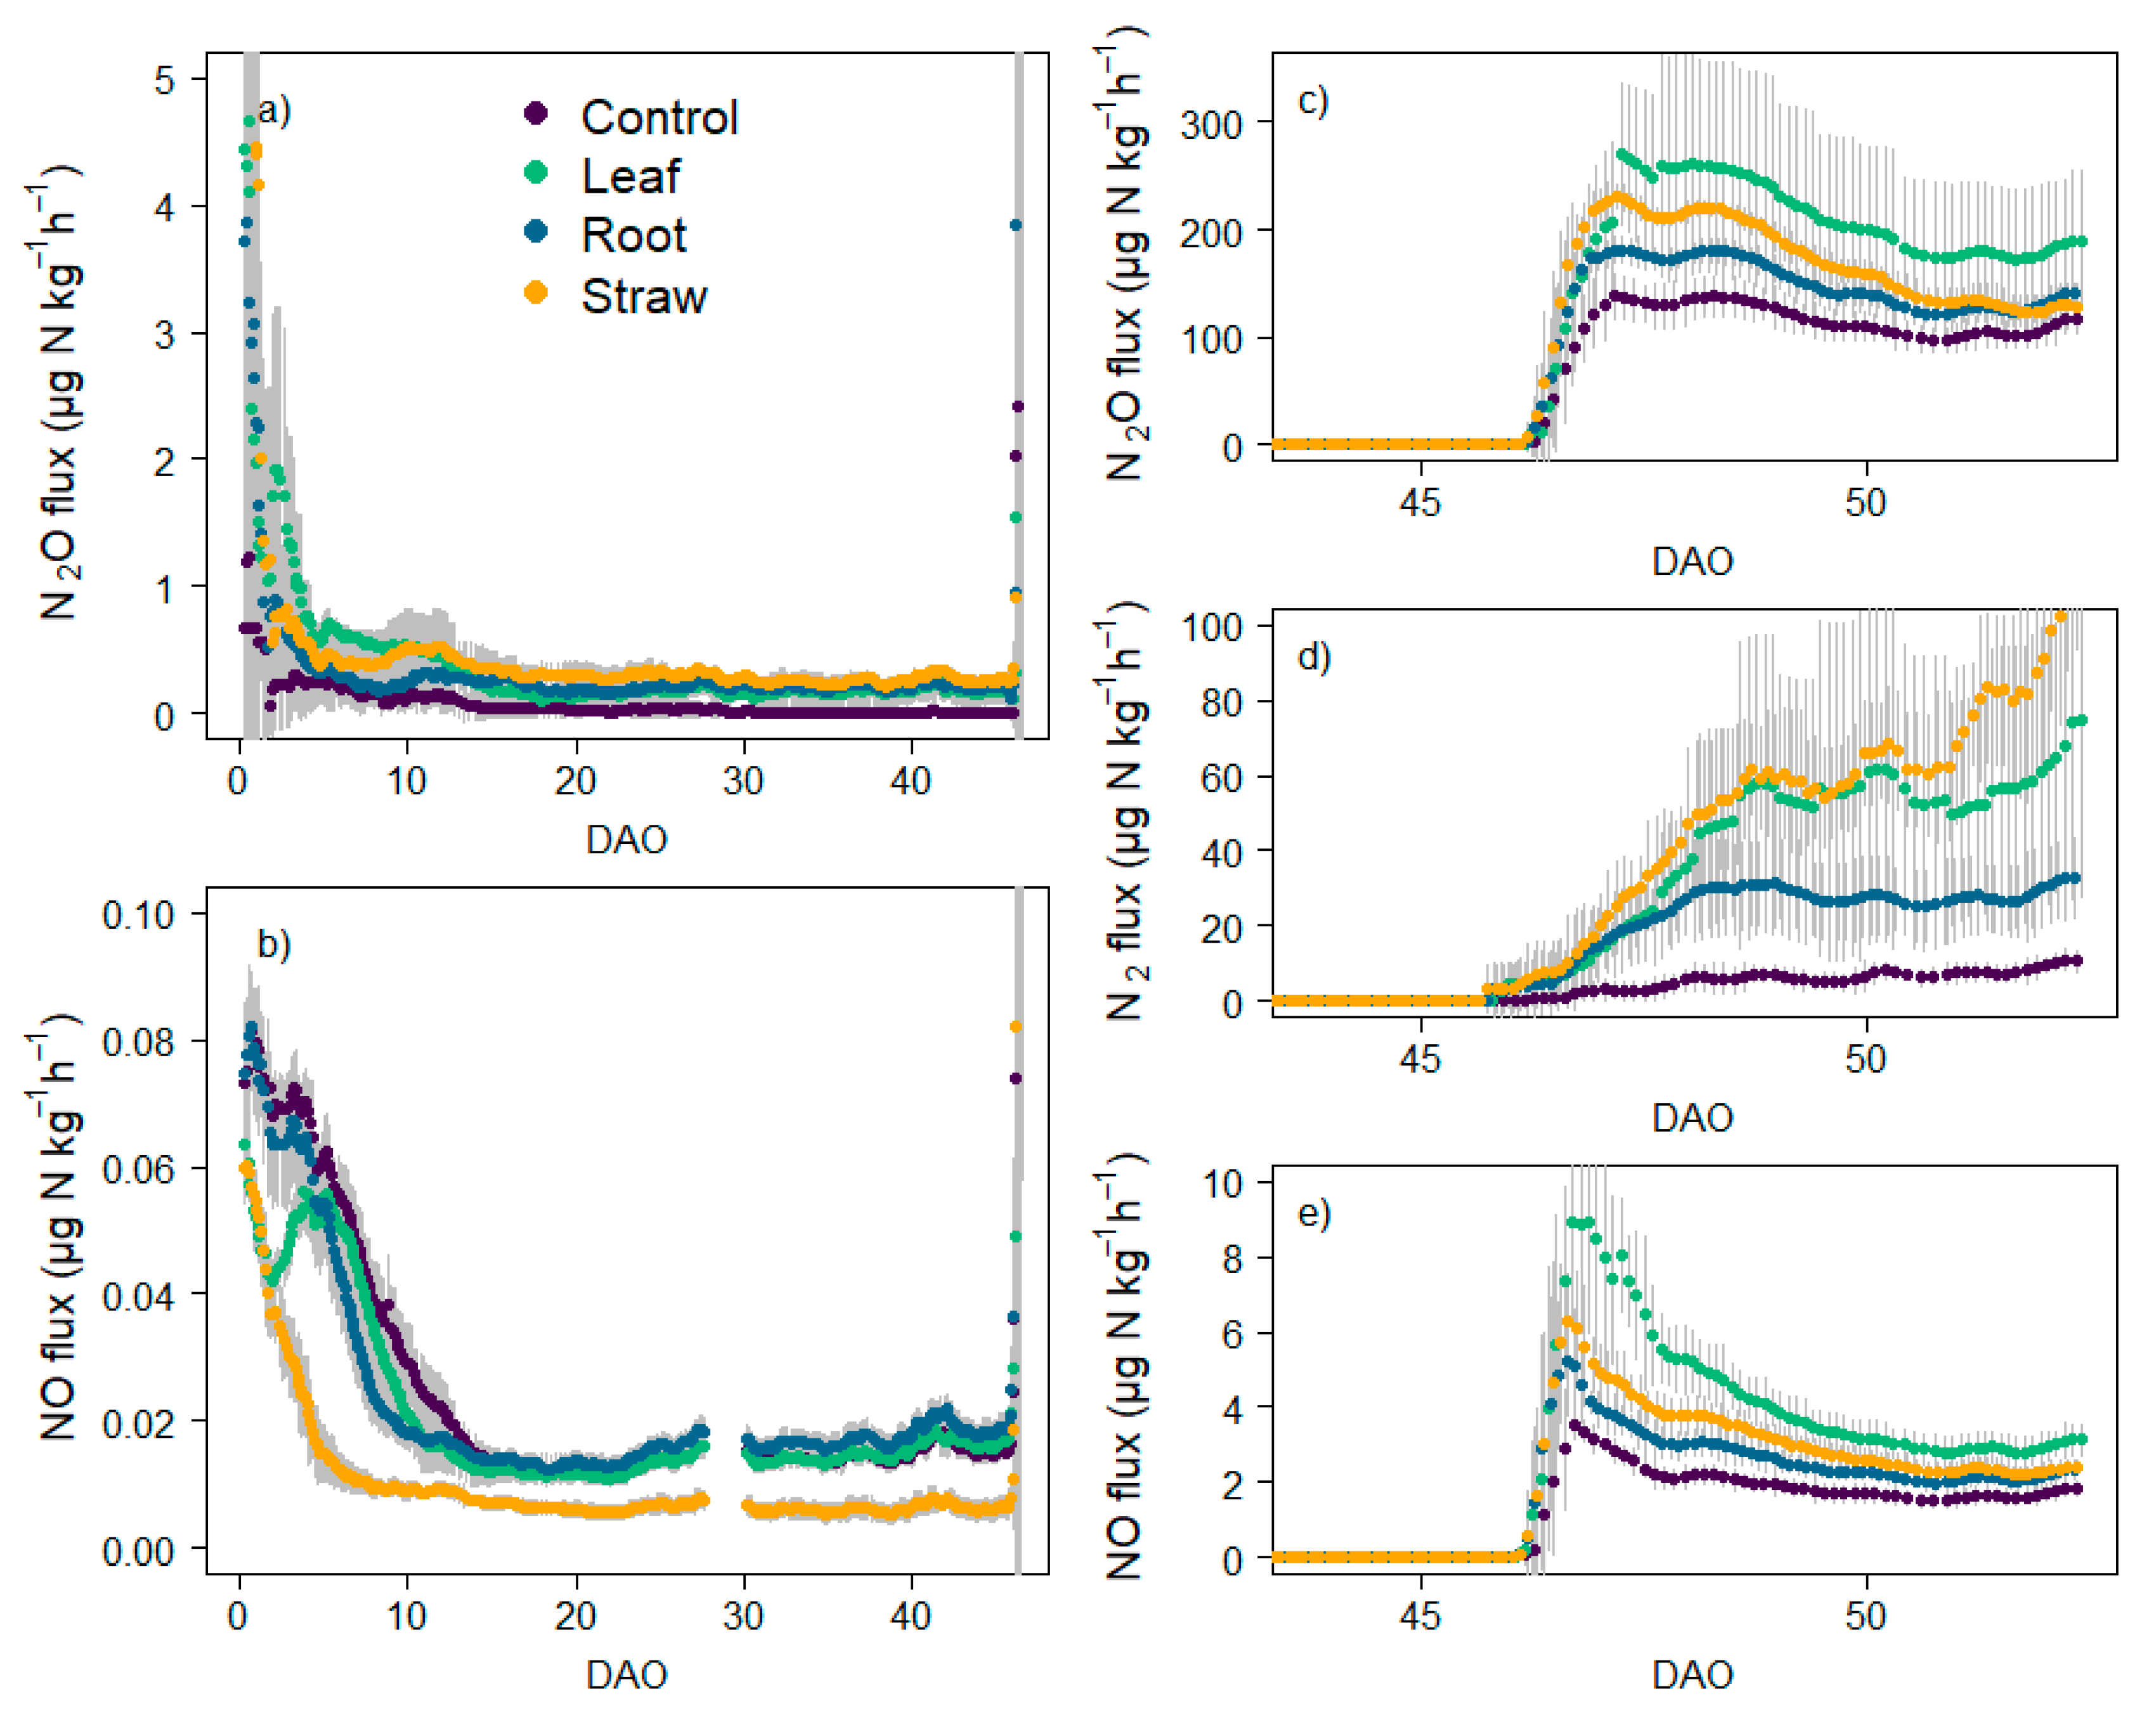
3.4. N Fluxes and Cumulative Emissions

During the oxic incubation phase, only N2O and NO fluxes were measured as N2 fluxes were below the detection limit (Figure 2a,b). N2O fluxes from litter treatments were higher than 3.7 µg N kg−1 h−1 for the first measurements on 1 DAO and declined to <1 µg N kg−1 h−1 until 5 DAO. N2O fluxes from litter-amended soils were in tendency higher than N2O fluxes from Control. Initial NO fluxes were ~0.08 µg N kg−1 h−1 in Control and Root, and ~0.06 µg N kg−1 h−1 in leaves and straw. In Leaf, a second NO peak was detected on 5 DAO. NO fluxes in Control were in tendency higher than in all litter treatments until 14 DAO, while NO flux declined fastest in Straw, where fluxes were smaller than in all other treatments after 3 DAO. The ratio of NO/N2O was highest in Control directly after onset of incubation with maximum values of 0.47 (Supplementary Figure S5). In Root and Leaf, it reached maximum values of 0.2 and 0.1 on 5 and 6 DAO. In Straw, highest measured values were 0.1 on 2 DAO. With onset of the anoxic phase, NO/N2O decreased to 0.015 in all treatments.
During the oxic phase, cumulative N2O emissions from litter-amended soil were higher than from Control (p < 0.05, Table 5). Cumulative emissions in Straw were higher than in Root and similar to Leaf. Cumulative NO emissions were highest in Control and lowest in Straw, and NO/N2O ratio was significantly higher in Control than in litter-amended treatments. NO emissions strongly decreased with decreasing litter C:N ratio (adj. R2 = 0.86, p < 0.001) and increased with increasing N mineralization (adj. R2 = 0.57, p < 0.001) confirming that litter quality affected nitrification-derived NO emissions during the oxic incubation phase.
After 47 days, anoxic incubation conditions were induced by flushing the headspace with pure helium gas. N2O, NO, and N2 fluxes strongly increased with onset of anoxic incubation conditions (Figure 2c–e). N2O and NO fluxes peaked on 48 DAO and then decreased until the end of the experiment. N2 fluxes increased after onset of anoxic conditions until the end of the experiment. During the anoxic phase, cumulative N2O, NO, and N2 emissions were higher in litter treatments than in Control, although the effect was not always statistically significant for maize roots (Table 5). The highest cumulative emissions were measured for NO (0.64 mg N kg−1) and N2O in Leaf (29.8 mg N kg−1), and for N2 in Straw (8.4 mg N kg−1). The ratio of the gaseous end products N2O/(N2O+N2) was highest in Control (0.95) and lowest in Straw (0.75).

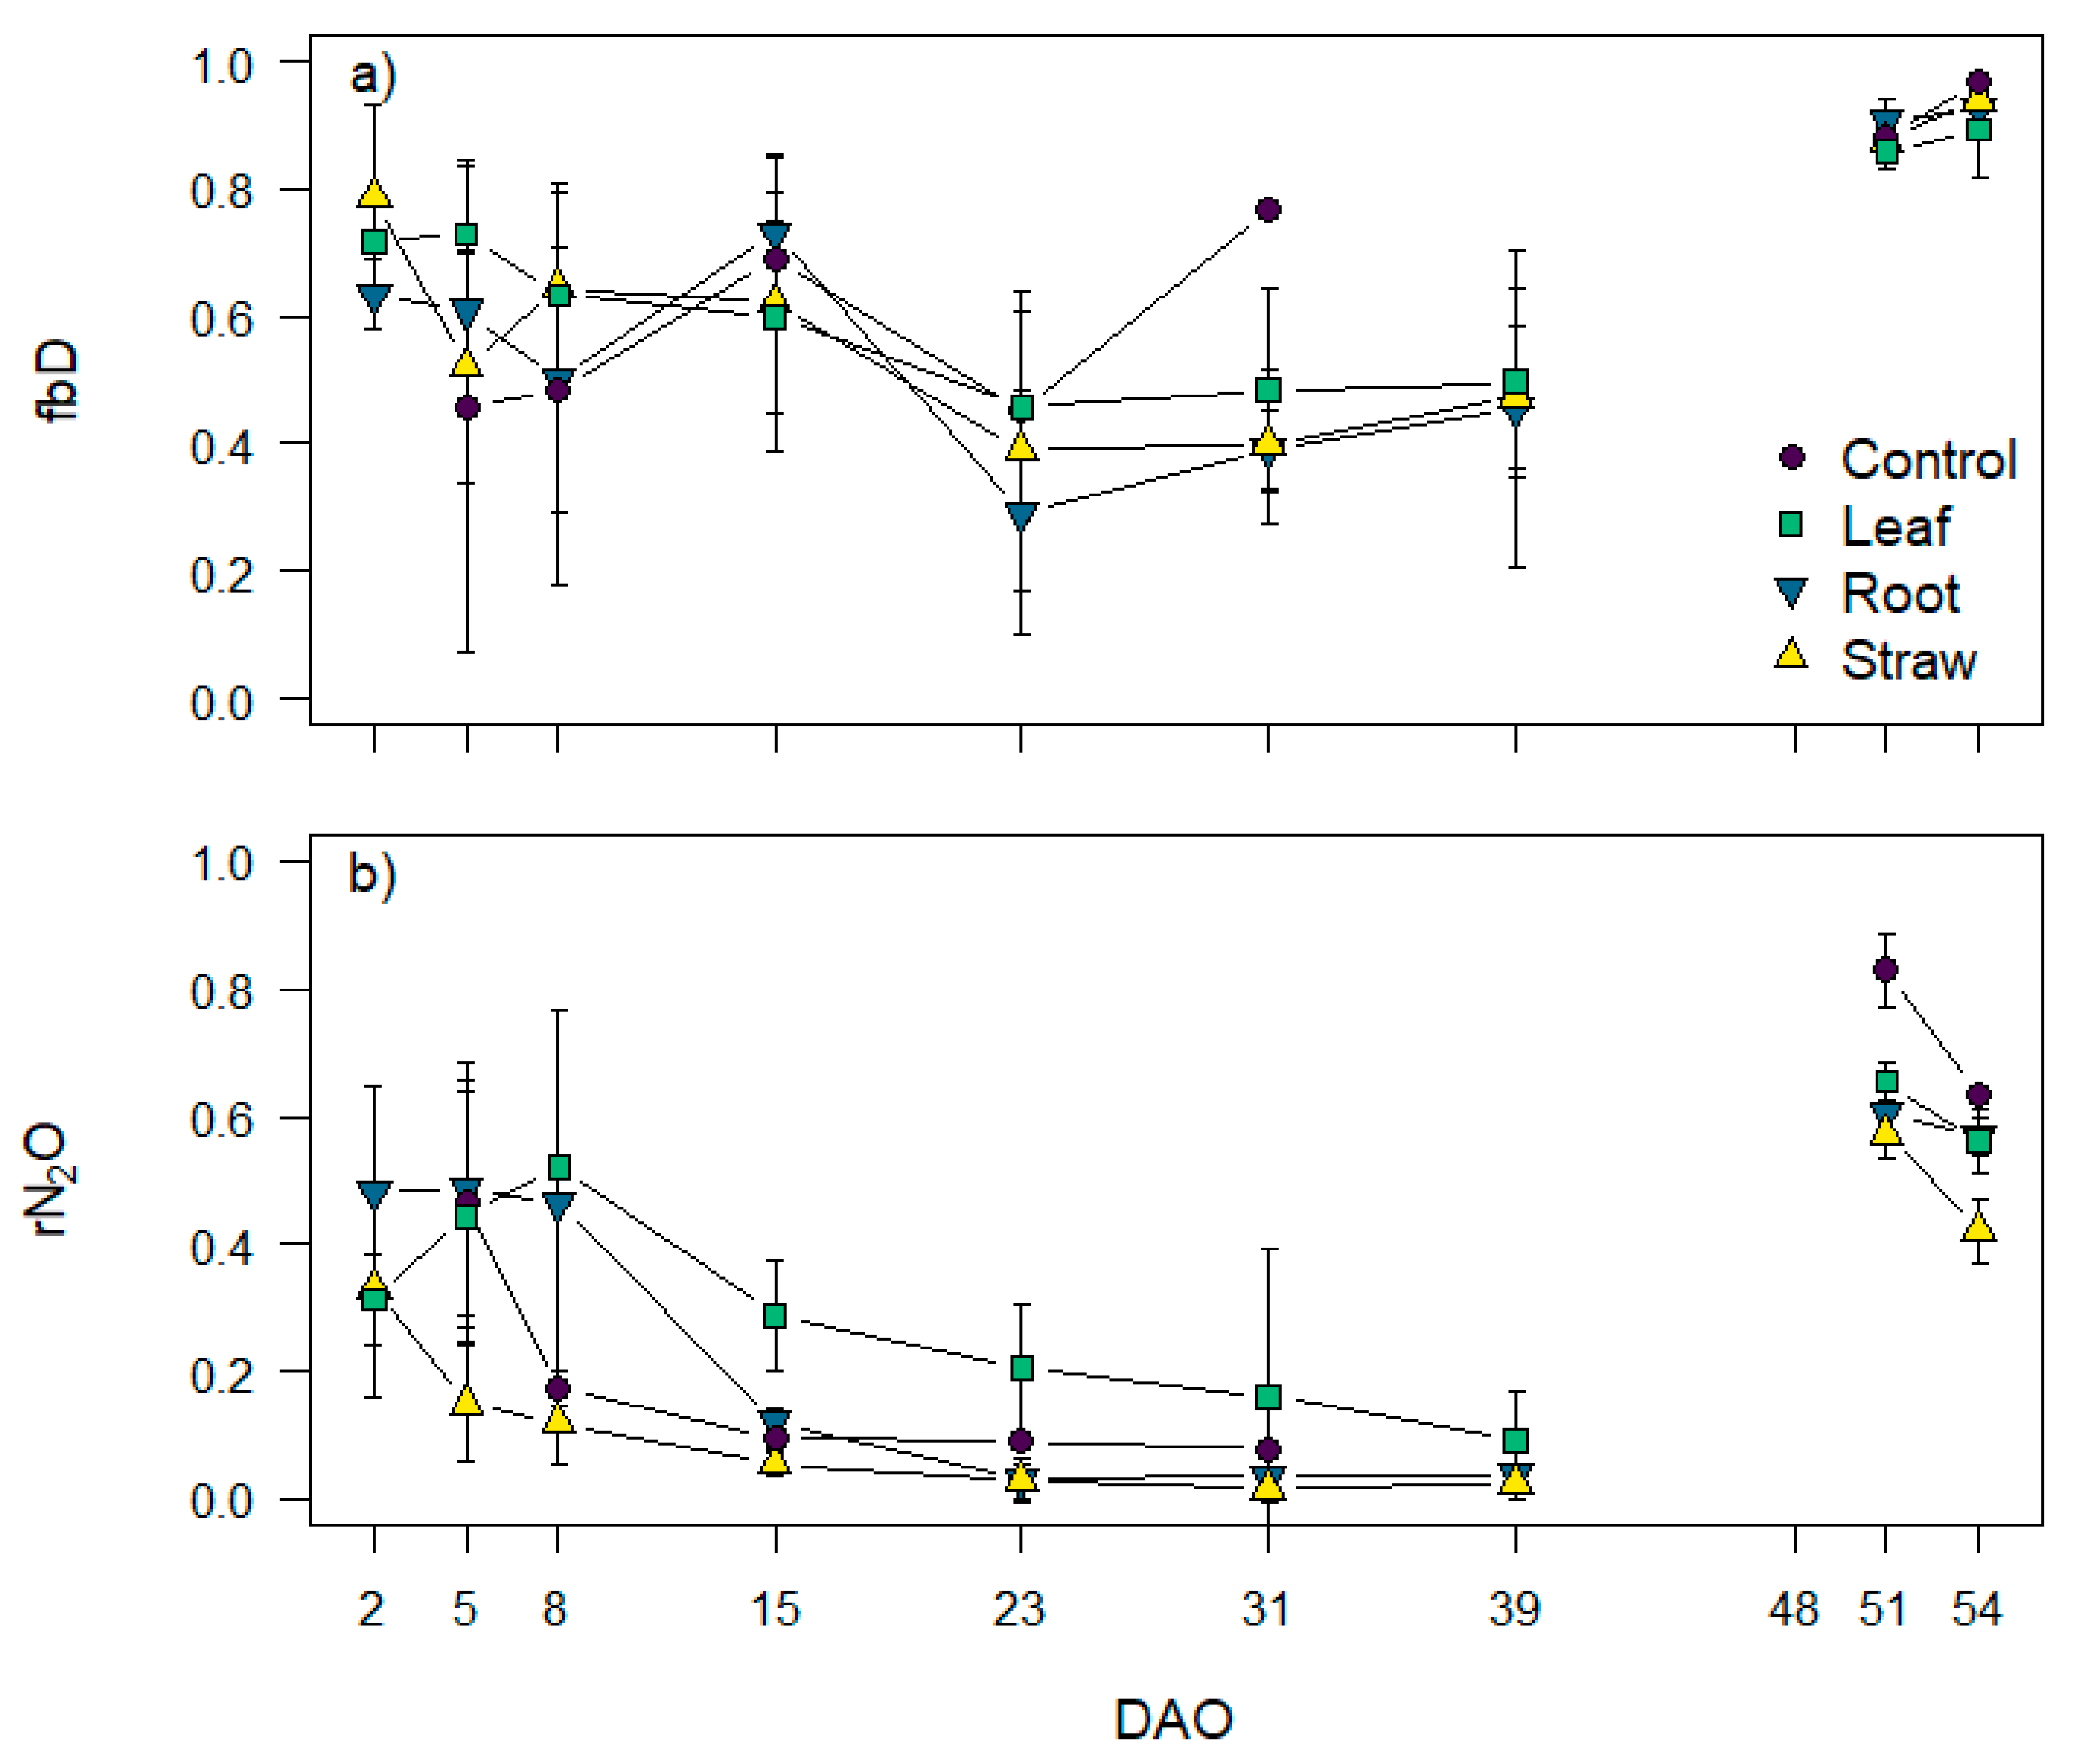
3.5. N2O Isotopocule Mapping Approach, fbD and rN2O Values

The δ15NSP18ON2O isotopocule map showed a strong influence of the incubation day on the isotopic signature of soil-emitted N2O (Figure 3). Most data points were distributed between the mixing line of bacterial and fungal denitrification and the N2O reduction line during the oxic incubation phase (0–47 DAO). With onset of anoxic incubation conditions, bacterial denitrification became the dominant process as samples measured on 48 DAO cluster tightly above the reported ranges for heterotrophic bacterial denitrification. With ongoing anoxic incubation, the samples cluster along the reduction line indicating increasing N2O reduction with ongoing anoxic incubation conditions (51 and 54 DAO).
δ15Nbulk and δ18ON2O of soil-emitted N2O followed a similar pattern. Both values increased slightly during anoxic incubation (Figure 4, Figure S6). With onset of anoxic conditions, both δ15Nbulk and δ18ON2O decreased strongly and increased again until the end of the experiment.
fbD and rN2O values exhibited similar patterns for mixing between heterotrophic bacterial denitrification/nitrifier denitrification and nitrification or fungal denitrification (Figure 5a,b, Supplementary Figure S6). After onset of incubation, the fraction of soil-emitted N2O from heterotrophic bacterial denitrification/nitrifier denitrification (fbD, Figure 5a) was in tendency higher in maize litter treatments compared to Control. While fbD decreased in maize litter treatments during the oxic incubation period, it increased in Control without litter addition. With onset of anoxic incubation conditions, fbD increased strongly in all treatments, reaching values > 0.9, indicating that bacterial denitrification became the dominant process under anoxic incubation conditions. The residual, unreduced N2O fraction (rN2O, Figure 5b) was mostly < 0.5 and decreased during the oxic incubation phase, highlighting the significance of N2O reduction. On 51 DAO, rN2O was highest and decreased until 54 DAO.

3.6. Interactions between C and N Availability and N Fluxes

To test the effect of C availability and SOM turnover on N fluxes and cumulative emissions, simple linear regression models were tested (Table 3).
The relationship between hourly NO+N2O and CO2 fluxes was very weak during the oxic incubation phase (adj. R2 = 0.08, p < 0.001, Table 3). In contrast, NO+N2O+N2 fluxes were highly positively correlated with CO2 fluxes during the anoxic incubation period (adj. R2 = 0.86, p < 0.001, Table 3). Similarly, fbD and rN2O were positively correlated with total CO2 flux from soil, but the relationship was weak (adj. R2 = 0.23 and 0.31, respectively, p < 0.001, Table 3).
Cumulative anoxic N emissions (NO+N2O+N2) were significantly positively correlated with total litter C input (adj. R2 = 0.51, p < 0.001, Table 3). Furthermore, we found a significant negative correlation between the ratio of cumulative N2O/(N2O+N2) emissions during anoxic incubation and the ratio of water-soluble C:N of maize litter types (adj. R2 = 0.51, p < 0.001, Table 3) and also with the soil NO3:WEOC ratio at the end of the experiment (adj. R2 = 0.41, p < 0.01, Table 3). When standardized against C input from litter, total cumulative N emissions did not differ between litter treatments (Supplementary Table S2).

4. Discussion

4.1. Maize Litter Quality Controls N Mineralization

Soil mineral N content, mineralization, and immobilization strongly depended on maize litter quality. In Control without litter addition, soil NH4+ content decreased, but soil NO3 content strongly increased due to mineralization and nitrification of soil organic N. Tillage often leads to increased soil mineral N content [40,41], and net N mineralization from control soils without litter addition has been reported [8,13,42]. In Leaf and Root, mineralization was higher than in Control as additional organic N from litter was mineralized. In contrast, addition of maize straw immobilized N, which coincides with the higher C:N ratio in Straw compared to Leaf and Root. In general, immobilization of N follows the addition of litter with C:N ratios > 25:1 [7]. Net N mineralization after addition of maize roots is in contrast to most other studies reporting net N immobilization after addition of maize roots [8,13,42,43]. However, we used maize roots grown in a nutrient solution, which had higher total and water-soluble N content than those reported in other studies [13,44].

4.2. Effect of Maize Litter Quality on CO2 Emissions and Priming Effect

After onset of incubation, both litter and SOM-derived CO2 fluxes strongly increased in litter treatments, while CO2 efflux in Control was stable. Total cumulative CO2 emissions increased with increasing input of total and water-soluble C, indicating that decomposition dynamics were controlled by the amount and quality of added plant material. The chemical composition of plant litter is known to be a primary controller of decomposition rates of both roots [11,12,15] and aboveground plant litter [4,10].
Especially during the first week after litter addition, SOM turnover was increased in all litter treatments, leading to a positive priming effect. The highest increase in SOM turnover was observed after addition of maize leaves which were characterized by high amounts of easily degradable compounds as indicated by high shares of carboxyl C (i.e., organic acids, amino acids) and alkyl C (i.e., fatty acids, amino acids, paraffines) [45]. Litter and SOM-derived CO2 fluxes followed the same pattern and were highly positively correlated confirming that litter and SOM turnover are interrelated. Thus, our results are in accordance with the concept that litter with high degradability increases SOM turnover leading to a positive priming effect [17,18,19].

4.3. Effect of Litter Quality and N Mineralization on N Emissions and Production Pathways under Oxic Atmosphere

Directly after onset of oxic incubation, NO fluxes were highest in Control and Root while N2O fluxes were higher in litter amended treatments than in Control. The ratio of NO/N2O can be used as an indicator whether NO is produced from nitrification or denitrification [46,47]. While the NO/N2O emission ratio of bacterial denitrification is mostly around 0.01, the emission ratios of NO/N2O from nitrification are often higher than 1 [47]. In our study, the emission ratio of NO/N2O was highest during the first 10 days after onset of incubation, with maximum values of 0.47 in Control indicating a high contribution of nitrification to NO formation. Analysis of soil samples taken prior to the onset of incubation revealed high NH4+ content of soil, which further supports that nitrification contributed to NO emissions during the initial incubation phase. In Straw, where N was immobilized to decompose C compounds, NO fluxes decreased faster and were lower than in all other treatments. Furthermore, oxic cumulative NO emissions strongly decreased with increasing litter C:N ratio (adj. R2 = 0.86, p < 0.001) and increased with increasing N mineralization (adj. R2 = 0.57, p < 0.001) confirming that litter quality affected nitrification-derived NO emissions in the beginning of the oxic incubation phase.
Addition of maize litter increased N2O fluxes compared to non-amended Control. As first, the headspace atmosphere had to be replaced by the mixture of He/O2, measurements started approximately one day after onset of incubation conditions. At this time, decreasing N2O fluxes indicated that N2O fluxes had peaked within 24 h after water and NO3 addition. After this initial increase, N2O fluxes decreased rapidly and then stayed on a similar level throughout the oxic phase. Immediately after onset of the incubation, bacterial denitrification (i.e., heterotrophic bacterial denitrification and nitrifier denitrification) was the dominant N2O emitting process in litter-amended treatments as indicated by the fraction of bacterial denitrification (fbD) > 0.6. Gradually decreasing fbD values then indicate a shift towards nitrification or fungal denitrification. Litter addition [27,48] and soil moisture of 70% WFPS may have promoted fungi, which often contribute to denitrification under weakly anoxic conditions [49,50]. Several studies have described a shift from bacterial to fungal dominance with ongoing incubations [27,51,52,53]. However, nitrification may have contributed to N2O formation in Root and Leaf as indicated by high mineralization and NO/N2O ratio. In Control, nitrification presumably contributed to N2O formation, especially during the first days of the experiment, when fbD was < 0.3 and the NO/N2O ratio was high.
rN2O values were mostly < 0.5, highlighting the significance of N2O reduction, also during the oxic incubation period. Thus, although N2 fluxes were lower than the detection limit of our incubation system (5.5 µg N2-N kg−1 h−1), they significantly contributed to gaseous N losses. N2O reduction to N2 is the last step of denitrification [54] and it usually takes place when availability of NOx is limited [55]. Furthermore, pore size and distribution, and soil moisture may affect N2O reduction to N2, as they control diffusion of O2 and N2O in soil [20,56]. Accordingly, for interpretation of the isotopocule mapping approach in our experiment, we think that the reduction-mixing scenario is more plausible: N2O was produced by denitrifying bacteria and partly reduced to N2 in anoxic microsites, and then N2O diffusing out of these hotspots was mixed with N2O from nitrification and fungal denitrification [57]. We anticipate that nitrification contributed to N2O formation when mineralization was high, while fungal denitrification became more important in litter-amended treatments with ongoing incubation.

4.4. Effect of Maize Litter Quality and Mineralization on Potential Denitrification

With onset of anoxic incubation conditions on 47 DAO, total NO and N2O fluxes increased rapidly, while N2 fluxes increased more slowly. δ18ON2O of N2O emitted on 48 DAO falls in the range of heterotrophic bacterial denitrification reported in earlier studies [23], indicating that heterotrophic bacterial denitrification was the main N2O-emitting process with low reduction to N2. Interestingly, the δ15Nbulk values on 48 DAO strongly deviated from measured δ15Nbulk values on all other sampling days and were slightly outside the reported endmember values of heterotrophic bacterial denitrification. Under oxic conditions, denitrification mostly took place in anoxic hotspots where ongoing reduction led to a fractionation in the NO3 pool undergoing denitrification, which is reflected in gradually increasing δ15Nbulk values. With onset of anoxic conditions, previously unreduced NO3 contributed to N2O formation leading to a shift towards more negative δ15Nbulk values [29,58]. When the contribution of pools with different N dynamics changes, shifts in the isotopic signature have been reported [59,60,61]. For our study, low δ15Nbulk values on 48 DAO are consistent with very high N2O fluxes and the low measured N2O/(N2O + N2) ratio on 48 DAO leading to strong fractionation effects.
Analysis of δ15N and δ18O in soil NO3 may improve accuracy of the N2O mapping approach and estimation of N2O formation processes [23]. δ15NNO3 was higher at the end of the experiment compared to initial soil NO3 and added KNO3, confirming the ongoing fractionation during the reduction of the soil NO3 pool. Furthermore, δ15NNO3 increased with decreasing mineralization, indicating a higher share of added KNO3 to residual NO3 at the end of the incubation experiment. Higher δ18O in Straw and Root may point towards a higher contribution of fungal denitrification, which is consistent with the higher contribution of fungi to decomposition of plant materials rich in celluloses and lignin [16,27]. Overall, it needs to be taken into account, that estimating N2O formation processes based on N2O isotopomers is subject to large uncertainties. Endmember values, reduction and fractionation factors have been obtained under differing incubation and environmental conditions, and may thus lead to over or underestimation of contributing processes [57,61,62].

4.5. Interaction between C Turnover and Denitrification

In agricultural soils, denitrification is often controlled by the availability of readily decomposable organic matter with increasing C availability leading to increased N losses [6,13,14,63,64]. In contrast, we measured low denitrification derived N fluxes under oxic conditions, and the correlation between oxic N and CO2 fluxes was very weak indicating that denitrification was not directly affected by litter decomposition in our study. Although soil NO3 content was high and high litter and SOM turnover confirmed high Corg availability, N2O fluxes were very low, indicating that conditions for denitrifying microorganisms were not optimal. Rohe et al. (2021) [65] reported very low N2O + N2 fluxes from an incubation study with the same soil at 60% WFPS and higher fluxes compared to our study for 75 and 85% WFPS. Thus, our incubation conditions with a soil moisture of 70% WFPS may have been too low to promote denitrifying soil microorganisms. With onset of anoxic conditions, N fluxes increased immediately, confirming that high pO2 was restricting denitrification during the oxic incubation phase. In contrast to our expectations, the microbial respiration of litter and SOM did not promote the formation of litter associated anoxic hotspots for denitrification as high O2 diffusivity limited denitrification [65,66].
In contrast, N and CO2 fluxes were highly positively correlated (adj. R2 = 0.86, p < 0.001) under anoxic conditions, and cumulative N emissions increased with increasing litter C input (adj. R2 = 0.51, p < 0.001) confirming our hypothesis that higher C availability leads to increased gaseous N losses. However, this effect was based on the role of C as energy source for denitrifiers, as the potential O2 consumption by C decomposition was not relevant under anoxic conditions.
The ratio of denitrification end products N2O/(N2O+N2) decreased with increasing water-extractable C:N ratio of litter (adj. R2 = 0.73, p < 0.001) and increasing soil WEOC:NO3 ratio at the end of the experiment (adj. R2 = 0.41, p < 0.01) confirming that the ratio of available C to oxidized N is a major control of denitrification product stoichiometry [67]. Immobilization of N after addition of maize straw with high C:N ratio restricted N availability leading to higher N2O reduction to N2. However, as soil NO3 content was still very high (> 70 mg NO3-N kg−1 in all treatments at the end of the incubation experiment), N2O was the dominant end product, as NO3 is preferentially used as electron acceptor and high soil NO3 content can inhibit the reduction of N2O to N2 [27,67].

5. Conclusions

We investigated the effect of different maize litter types (young leaves and roots, straw) on CO2, NO, N2O, and N2 emissions under oxic and anoxic conditions in a laboratory incubation study. Addition of maize litter increased litter and SOM derived CO2 emissions, leading to a positive priming effect. SOM priming was highest after addition of maize leaves with a high share of easily degradable C compounds during the first week after onset of incubation. Although litter and SOM turnover were high, NO and N2O fluxes were low under oxic conditions as high O2 diffusivity limited denitrification.
The NO/N2O ratio indicated that nitrification contributed to NO and N2O formation during the first two weeks of incubation, especially in Control without litter addition. In the litter-amended treatments, isotopocule mapping revealed that bacterial denitrification dominated N2O formation in the beginning of the incubation experiment with a subsequent shift towards fungal denitrification. With onset of anoxic incubation conditions after 47 days, N fluxes strongly increased and heterotrophic bacterial denitrification became the dominating source of N2O. The N2O/(N2O + N2) ratio decreased with increasing litter C:N ratio and Corg:NO3 ratio in soil confirming that the ratio of available C:N is a major control of denitrification product stoichiometry.

Supplementary Materials

The following are available online at https://0-www-mdpi-com.brum.beds.ac.uk/article/10.3390/app11115309/s1, Figure S1a–c: Solid state 13C-CPMAS NMR spectra of maize litter used in the incubation experiment, Figure S2: δ13C of CO2 derived from maize litter, Figure S3: Total CO2 efflux from soil during oxic and anoxic incubation, Figure S4a: δ13C of CO2 evolving from soil and b: fraction of litter-derived CO2, Figure S5: NO/N2O ratio during oxic and anoxic incubation, Figure S6: δ18O of N2O, added KNO3, and soil NO3 at first and last day of incubation, Figure S7a: Fraction of N2O originating from heterotrophic bacterial denitrification/nitrifier denitrification and b+c: fraction of residual unreduced N2O, Table S1: δ15NSPN2O, δ18ON2O/H2O, and δ15NbulkN2O endmember values from literature used for isotopocule mapping, Table S2: Cumulative CO2, NO, N2O, and N2 emissions and denitrification product ratio standardized against litter C input.

Author Contributions

Conceptualization: P.S.R., R.W., J.P., and K.D., methodology (incubation system): P.S.R., B.P., K.D.; investigation: P.S.R.; data analysis: P.S.R.; data validation: P.S.R., R.W. and J.P.; writing—original draft preparation: P.S.R.; writing—review and editing: P.S.R., R.W., J.P., B.P., and K.D.; visualization: P.S.R.; supervision: R.W., J.P, and K.D.; funding acquisition: K.D. All authors have read and agreed to the published version of the manuscript.

Funding

This research work was supported by the Deutsche Forschungsgemeinschaft through the research unit DFG-FOR 2337: Denitrification in Agricultural Soils: Integrated Control and Modelling at Various Scales (DASIM, grant number DI 546/4-1). The APC was funded by the University of Göttingen.

Institutional Review Board Statement

Not applicable.

Informed Consent Statement

Not applicable.

Data Availability Statement

The datasets from this study can be found at https://0-doi-org.brum.beds.ac.uk/10.25625/FKSRMX.

Acknowledgments

We thank Simone Urstadt and Justus Detring for experimental and laboratory assistance and Jürgen Böttcher for soil classification. We acknowledge the Centre for Stable Isotope Research and Analysis of the University of Göttingen for all isotopic analyses, Jan Reent Köster for help with NO analysis, and Carsten W. Mueller for 13C-CPMAS NMR analyses. Further, we thank Ronny Surey for discussions about plant litter effects under anoxic conditions.

Conflicts of Interest

The authors declare no conflict of interest. The funders had no role in the design of the study; in the collection, analyses, or interpretation of data; in the writing of the manuscript, or in the decision to publish the results.

References

  1. Baggs, E.M.; Rees, R.M.; Smith, K.A.; Vinten, A.J.A. Nitrous oxide emission from soils after incorporating crop residues. Soil Use Manag. 2000, 16, 82–87. [Google Scholar] [CrossRef]
  2. Chen, H.; Li, X.; Hu, F.; Shi, W. Soil nitrous oxide emissions following crop residue addition: A meta-analysis. Glob. Chang. Biol. 2013, 19, 2956–2964. [Google Scholar] [CrossRef]
  3. Johnson, J.M.-F.; Barbour, N.W.; Weyers, S.L. Chemical Composition of Crop Biomass Impacts Its Decomposition. Soil Sci. Soc. Am. J. 2007, 71, 155–162. [Google Scholar] [CrossRef] [Green Version]
  4. Zhang, D.; Hui, D.; Luo, Y.; Zhou, G. Rates of litter decomposition in terrestrial ecosystems: Global patterns and controlling factors. J. Plant Ecol. 2008, 1, 85–93. [Google Scholar] [CrossRef] [Green Version]
  5. Li, X.; Hu, F.; Shi, W. Plant material addition affects soil nitrous oxide production differently between aerobic and oxygen-limited conditions. Appl. Soil Ecol. 2013, 64, 91–98. [Google Scholar] [CrossRef]
  6. Millar, N.; Baggs, E.M. Chemical composition, or quality, of agroforestry residues influences N2O emissions after their addition to soil. Soil Biol. Biochem. 2004, 36, 935–943. [Google Scholar] [CrossRef]
  7. Robertson, G.P.; Groffman, P.M. Nitrogen Transformations. In Soil Microbiology, Ecology and Biochemistry; Paul, E.A., Ed.; Acwdemic Press: Burlington, MA, USA, 2015; pp. 421–446. ISBN 9780128132692. [Google Scholar]
  8. Velthof, G.L.; Kuikman, P.J.; Oenema, O. Nitrous oxide emission from soils amended with crop residues. Nutr. Cycl. Agroecosyst. 2002, 62, 249–261. [Google Scholar] [CrossRef]
  9. Burford, J.R.; Bremner, J.M. Relationships between the denitrification capacities of soils and total, water-soluble and readily decomposable soil organic matter. Soil Biol. Biochem. 1975, 7, 389–394. [Google Scholar] [CrossRef]
  10. Jensen, L.S.; Salo, T.; Palmason, F.; Breland, T.A.; Henriksen, T.M.; Stenberg, B.; Pedersen, A.; Lundström, C.; Esala, M. Influence of biochemical quality on C and N mineralisation from a broad variety of plant materials in soil. Plant Soil 2005, 273, 307–326. [Google Scholar] [CrossRef]
  11. Redin, M.; Guénon, R.; Recous, S.; Schmatz, R.; de Freitas, L.L.; Aita, C.; Giacomini, S.J. Carbon mineralization in soil of roots from twenty crop species, as affected by their chemical composition and botanical family. Plant Soil 2014, 378, 205–214. [Google Scholar] [CrossRef]
  12. Silver, W.L.; Miya, R.K. Global patterns in root decomposition: Comparisons of climate and litter quality effects. Oecologia 2001, 129, 407–419. [Google Scholar] [CrossRef] [PubMed]
  13. Rummel, P.S.; Pfeiffer, B.; Pausch, J.; Well, R.; Schneider, D.; Dittert, K. Maize root and shoot litter quality controls short-term CO2 and N2O emissions and bacterial community structure of arable soil. Biogeosciences 2020, 17, 1181–1198. [Google Scholar] [CrossRef] [Green Version]
  14. Surey, R.; Schimpf, C.M.; Sauheitl, L.; Mueller, C.W.; Rummel, P.S.; Dittert, K.; Kaiser, K.; Böttcher, J.; Mikutta, R. Potential denitrification stimulated by water-soluble organic carbon from plant residues during initial decomposition. Soil Biol. Biochem. 2020. [Google Scholar] [CrossRef]
  15. Birouste, M.; Kazakou, E.; Blanchard, A.; Roumet, C. Plant traits and decomposition: Are the relationships for roots comparable to those for leaves? Ann. Bot. 2012, 109, 463–472. [Google Scholar] [CrossRef] [PubMed] [Green Version]
  16. Kögel-Knabner, I. The macromolecular organic composition of plant and microbial residues as inputs to soil organic matter. Soil Biol. Biochem. 2002, 34, 139–162. [Google Scholar] [CrossRef]
  17. Six, J.; Jastrow, J.D. Organic Matter Turnover. In Encyclopedia of Soil Science; Lal, R., Ed.; Dekker: New York, NY, USA, 2002. [Google Scholar]
  18. Kuzyakov, Y.; Bol, R. Sources and mechanisms of priming effect induced in two grassland soils amended with slurry and sugar. Soil Biol. Biochem. 2006, 38, 747–758. [Google Scholar] [CrossRef]
  19. Rinkes, Z.L.; DeForest, J.L.; Grandy, A.S.; Moorhead, D.L.; Weintraub, M.N. Interactions between leaf litter quality, particle size, and microbial community during the earliest stage of decay. Biogeochemistry 2014, 117, 153–168. [Google Scholar] [CrossRef]
  20. Kravchenko, A.N.; Toosi, E.R.; Guber, A.K.; Ostrom, N.E.; Yu, J.; Azeem, K.; Rivers, M.L.; Robertson, G.P. Hotspots of soil N2O emission enhanced through water absorption by plant residue. Nat. Geosci. 2017, 10, 496–500. [Google Scholar] [CrossRef]
  21. Arcand, M.M.; Congreves, K.A. Elucidating microbial carbon utilization and nitrous oxide dynamics with 13C-substrates and N2O isotopomers in contrasting horticultural soils. Appl. Soil Ecol. 2020, 147, 103401. [Google Scholar] [CrossRef]
  22. Lewicka-Szczebak, D.; Augustin, J.; Giesemann, A.; Well, R. Quantifying N2O reduction to N2 based on N2O isotopocules-validation with independent methods (helium incubation and 15N gas flux method). Biogeosciences 2017, 14, 711–732. [Google Scholar] [CrossRef] [Green Version]
  23. Yu, L.; Harris, E.; Lewicka-Szczebak, D.; Barthel, M.; Blomberg, M.R.A.; Harris, S.J.; Johnson, M.S.; Lehmann, M.F.; Liisberg, J.; Müller, C.; et al. What can we learn from N2O isotope data?–Analytics, processes and modelling. Rapid Commun. Mass Spectrom. 2020, 34, 1–14. [Google Scholar] [CrossRef] [PubMed]
  24. Mengutay, M.; Ceylan, Y.; Kutman, U.B.; Cakmak, I. Adequate magnesium nutrition mitigates adverse effects of heat stress on maize and wheat. Plant Soil 2013, 368, 57–72. [Google Scholar] [CrossRef]
  25. Köster, J.R.; Well, R.; Dittert, K.; Giesemann, A.; Lewicka-Szczebak, D.; Mühling, K.H.; Herrmann, A.; Lammel, J.; Senbayram, M. Soil denitrification potential and its influence on N2O reduction and N2O isotopomer ratios. Rapid Commun. Mass Spectrom. 2013, 27, 2363–2373. [Google Scholar] [CrossRef]
  26. Scholefield, D.; Hawkins, J.M.B.B.; Jackson, S.M. Development of a helium atmosphere soil incubation technique for direct measurement of nitrous oxide and dinitrogen fluxes during denitrification. Soil Biol. Biochem. 1997, 29, 1345–1352. [Google Scholar] [CrossRef]
  27. Senbayram, M.; Well, R.; Bol, R.; Chadwick, D.R.; Jones, D.L.; Wu, D. Interaction of straw amendment and soil NO3 content controls fungal denitrification and denitrification product stoichiometry in a sandy soil. Soil Biol. Biochem. 2018, 126, 204–212. [Google Scholar] [CrossRef]
  28. Wang, R.; Willibald, G.; Feng, Q.; Zheng, X.; Liao, T.; Brüggemann, N.; Butterbach-Bahl, K. Measurement of N2, N2O, NO, and CO2 emissions from soil with the gas-flow-soil-core technique. Environ. Sci. Technol. 2011, 45, 6066–6072. [Google Scholar] [CrossRef] [PubMed]
  29. Lewicka-Szczebak, D.; Well, R.; Köster, J.R.; Fuß, R.; Senbayram, M.; Dittert, K.; Flessa, H. Experimental determinations of isotopic fractionation factors associated with N2O production and reduction during denitrification in soils. Geochim. Cosmochim. Acta 2014, 134, 55–73. [Google Scholar] [CrossRef]
  30. Toyoda, S.; Yoshida, N. Determination of Nitrogen Isotopomers of Nitrous. Anal. Chem. 1999, 71, 4711–4718. [Google Scholar] [CrossRef]
  31. Buchen, C.; Lewicka-Szczebak, D.; Flessa, H.; Well, R. Estimating N2O processes during grassland renewal and grassland conversion to maize cropping using N2O isotopocules. Rapid Commun. Mass Spectrom. 2018, 32, 1053–1067. [Google Scholar] [CrossRef] [PubMed]
  32. Röckmann, T.; Kaiser, J.; Brenninkmeijer, C.A.M.; Brand, W.A. Gas chromatography/isotope-ratio mass spectrometry method for high-precision position-dependent 15N and 18O measurements of atmospheric nitrous oxide. Rapid Commun. Mass Spectrom. 2003, 17, 1897–1908. [Google Scholar] [CrossRef] [PubMed]
  33. Lewicka-Szczebak, D. Mapping approach model after Lewicka-Szczebak et al. (2017)-detailed description of calculation procedures. RG 2018. [Google Scholar] [CrossRef]
  34. Casciotti, K.L.; Sigman, D.M.; Hastings, M.G.; Böhlke, J.K.; Hilkert, A. Measurement of the oxygen isotopic composition of nitrate in seawater and freshwater using the denitrifier method. Anal. Chem. 2002, 74, 4905–4912. [Google Scholar] [CrossRef]
  35. Sigman, D.M.; Casciotti, K.L.; Andreani, M.; Barford, C.; Galanter, M.; Böhlke, J.K. A bacterial method for the nitrogen isotopic analysis of nitrate in seawater and freshwater. Anal. Chem. 2001, 73, 4145–4153. [Google Scholar] [CrossRef]
  36. R Core Team R: A Language and Environment for Statistical Computing 2019. R version 3.6.0 -“Planting of a Tree”; R Foundation for Statistical Computing: Vienna, Austria, 2019.
  37. Blackmon, H.; Adams, R.H. evobiR: Comparative and Population Genetic Analyses 2015. R Package Version 1.1; R Foundation for Statistical Computing: Vienna, Austria, 2015. [Google Scholar]
  38. Zeileis, A.; Grothendieck, G. zoo: S3 Infrastructure for Regular and Irregular Time Series. J. Stat. Softw. 2005, 14, 1–27. [Google Scholar] [CrossRef] [Green Version]
  39. Garnier, S. viridisLite: Default Color Maps from “matplotlib” (Lite Version) 2018. R Package Version 0.3.0; R Foundation for Statistical Computing: Vienna, Austria, 2018. [Google Scholar]
  40. Höper, H. Carbon and nitrogen mineralisation rates of fens in Germany used for agriculture. In Wetlands in Central Europe; Broll, G., Merbach, W., Pfeiffer, E.M., Eds.; Springer: Berlin/Heidelberg, Germany, 2002; pp. 149–164. ISBN 978-3-662-05054-5. [Google Scholar]
  41. Kristensen, H.L.; Debosz, K.; McCarty, G.W. Short-term effects of tillage on mineralization of nitrogen and carbon in soil. Soil Biol. Biochem. 2003, 35, 979–986. [Google Scholar] [CrossRef]
  42. Machinet, G.E.; Bertrand, I.; Chabbert, B.; Recous, S. Decomposition in soil and chemical changes of maize roots with genetic variations affecting cell wall quality. Eur. J. Soil Sci. 2009, 60, 176–185. [Google Scholar] [CrossRef]
  43. Mary, B.; Fresneau, C.; Morel, J.L.; Mariotti, A. C and N cycling during decomposition of root mucilage, roots and glucose in soil. Soil Biol. Biochem. 1993, 25, 1005–1014. [Google Scholar] [CrossRef]
  44. Machinet, G.E.; Bertrand, I.; Barrière, Y.; Chabbert, B.; Recous, S. Impact of plant cell wall network on biodegradation in soil: Role of lignin composition and phenolic acids in roots from 16 maize genotypes. Soil Biol. Biochem. 2011, 43, 1544–1552. [Google Scholar] [CrossRef]
  45. Knicker, H. Solid state CPMAS 13C and 15N NMR spectroscopy in organic geochemistry and how spin dynamics can either aggravate or improve spectra interpretation. Org. Geochem. 2011, 42, 867–890. [Google Scholar] [CrossRef]
  46. Cheng, W.; Tsuruta, H.; Chen, G.; Yagi, K. N2O and NO production in various Chinese agricultural soils by nitrification. Soil Biol. Biochem. 2004, 36, 953–963. [Google Scholar] [CrossRef]
  47. Skiba, U.; Fowler, D.; Smith, K.A. Nitric oxide emissions from agricultural soils in temperate and tropical climates: Sources, controls and mitigation options. Nutr. Cycl. Agroecosyst. 1997, 48, 139–153. [Google Scholar] [CrossRef]
  48. Chen, H.; Mothapo, N.V.; Shi, W. Fungal and bacterial N2O production regulated by soil amendments of simple and complex substrates. Soil Biol. Biochem. 2015, 84, 116–126. [Google Scholar] [CrossRef]
  49. Hayatsu, M.; Tago, K.; Saito, M. Various players in the nitrogen cycle: Diversity and functions of the microorganisms involved in nitrification and denitrification. Soil Sci. Plant Nutr. 2008, 54, 33–45. [Google Scholar] [CrossRef]
  50. Lavrent’ev, R.B.; Zaitsev, S.A.; Sudnitsyn, I.I.; Kurakov, A.V. Nitrous oxide production by fungi in soils under different moisture levels. Moscow Univ. Soil Sci. Bull. 2008, 63, 178–183. [Google Scholar] [CrossRef]
  51. Laughlin, R.J.; Stevens, R.J. Evidence for Fungal Dominance of Denitrification and Codenitrification in a Grassland Soil. Soil Sci. Soc. Am. J. 2002, 66, 1540–1548. [Google Scholar] [CrossRef]
  52. Wu, D.; Senbayram, M.; Well, R.; Brüggemann, N.; Pfeiffer, B.; Loick, N.; Stempfhuber, B.; Dittert, K.; Bol, R. Nitrification inhibitors mitigate N2O emissions more effectively under straw-induced conditions favoring denitrification. Soil Biol. Biochem. 2017, 104, 197–207. [Google Scholar] [CrossRef]
  53. Zhong, L.; Bowatte, S.; Newton, P.C.D.; Hoogendoorn, C.J.; Luo, D. An increased ratio of fungi to bacteria indicates greater potential for N2O production in a grazed grassland exposed to elevated CO2. Agric. Ecosyst. Environ. 2018, 254, 111–116. [Google Scholar] [CrossRef]
  54. Zumft, W.G. Cell biology and molecular basis of denitrification. Microbiol. Mol. Biol. Rev. 1997, 61, 533–616. [Google Scholar] [CrossRef] [PubMed]
  55. Firestone, M.K.; Smith, M.S.; Firestone, R.B.; Tiedje, J.M. The Influence of Nitrate, Nitrite, and Oxygen on the Composition of the Gaseous Products of Denitrification in Soil. Soil Sci. Soc. Am. J. 1979, 43, 1140–1144. [Google Scholar] [CrossRef]
  56. Schlüter, S.; Henjes, S.; Zawallich, J.; Bergaust, L.; Horn, M.; Ippisch, O.; Vogel, H.-J.; Dörsch, P. Denitrification in Soil Aggregate Analogues-Effect of Aggregate Size and Oxygen Diffusion. Front. Environ. Sci. 2018, 6, 1–10. [Google Scholar] [CrossRef]
  57. Wu, D.; Well, R.; Cárdenas, L.M.; Fuß, R.; Lewicka-Szczebak, D.; Köster, J.R.; Brüggemann, N.; Bol, R. Quantifying N2O reduction to N2 during denitrification in soils via isotopic mapping approach: Model evaluation and uncertainty analysis. Environ. Res. 2019, 179, 1–6. [Google Scholar] [CrossRef]
  58. Ostrom, N.E.; Piit, A.; Sutka, R.; Ostrom, P.H.; Grandy, A.S.; Huizinga, K.M.; Robertson, G.P. Isotopologue effects during N2O reduction in soils and in pure cultures of denitrifiers. J. Geophys. Res. Biogeosci. 2007, 112, 1–12. [Google Scholar] [CrossRef] [Green Version]
  59. Bergstermann, A.; Cárdenas, L.; Bol, R.; Gilliam, L.; Goulding, K.; Meijide, A.; Scholefield, D.; Vallejo, A.; Well, R. Effect of antecedent soil moisture conditions on emissions and isotopologue distribution of N2O during denitrification. Soil Biol. Biochem. 2011, 43, 240–250. [Google Scholar] [CrossRef]
  60. Cardenas, L.M.; Bol, R.; Lewicka-Szczebak, D.; Gregory, A.S.; Matthews, G.P.; Whalley, W.R.; Misselbrook, T.H.; Scholefield, D.; Well, R. Effect of soil saturation on denitrification in a grassland soil. Biogeosciences 2017, 14, 4691–4710. [Google Scholar] [CrossRef] [Green Version]
  61. Lewicka-Szczebak, D.; Well, R.; Bol, R.; Gregory, A.S.; Matthews, G.P.; Misselbrook, T.; Whalley, W.R.; Cardenas, L.M. Isotope fractionation factors controlling isotopocule signatures of soil-emitted N2O produced by denitrification processes of various rates. Rapid Commun. Mass Spectrom. 2015, 29, 269–282. [Google Scholar] [CrossRef] [Green Version]
  62. Lewicka-Szczebak, D.; Piotr Lewicki, M.; Well, R. N2O isotope approaches for source partitioning of N2O production and estimation of N2O reduction-validation with the 15N gas-flux method in laboratory and field studies. Biogeosciences 2020, 17, 5513–5537. [Google Scholar] [CrossRef]
  63. Azam, F.; Müller, C.; Weiske, A.; Benckiser, G.; Ottow, J.C.G. Nitrification and denitrification as sources of atmospheric nitrous oxide-Role of oxidizable carbon and applied nitrogen. Biol. Fertil. Soils 2002, 35, 54–61. [Google Scholar] [CrossRef]
  64. Millar, N.; Baggs, E.M. Relationships between N2O emissions and water-soluble C and N contents of agroforestry residues after their addition to soil. Soil Biol. Biochem. 2005, 37, 605–608. [Google Scholar] [CrossRef]
  65. Rohe, L.; Apelt, B.; Vogel, H.-J.; Well, R.; Wu, G.-M.; Schlüter, S. Denitrification in soil as a function of oxygen supply and demand at the microscale. Biogeosciences 2021, 1–32. [Google Scholar]
  66. Schlüter, S.; Zawallich, J.; Vogel, H.J.; Dörsch, P. Physical constraints for respiration in microbial hotspots in soil and their importance for denitrification. Biogeosciences 2019, 16, 3665–3675. [Google Scholar] [CrossRef] [Green Version]
  67. Firestone, M.K. Biological denitrification. In Nitrogen in Agricultural Soils, Agronomy Monograph; American Society of Agronomy, Inc.: Madison, WI, USA; Crop Science Society of America, Inc.: Madison, WI, USA; Soil Science Society of America, Inc.: Madison, WI, USA, 1982; Volume 22, pp. 289–326. [Google Scholar] [CrossRef]
Figure 1. (a) Litter-derived CO2 fluxes, (b) SOM-derived CO2 fluxes, and (c) cumulative priming effect (means and standard deviation for n = 5, n = 4 for Control, when not visible, error bars are smaller than the symbols).
Applsci 11 05309 g001
Figure 2. (a,b) N2O, and NO fluxes during oxic incubation period (0–47 DAO). (ce) N2O, N2, and NO fluxes during anoxic incubation (47–55 DAO) of maize litter on grassland soil (means and standard deviation for n = 5, n = 4 for Control, when not visible, error bars are smaller than the symbols).
Applsci 11 05309 g002
Figure 3. Isotopocule values of soil-emitted N2O per day plotted in the isotopocule map based on Lewicka-Szczebak et al. (2017) [22] and Yu et al. (2020) [23]. Boxes indicate the mean ranges for end-member values of δ15NSPN2O and δ18ON2O (corrected for δ18OH2O) for heterotrophic bacterial denitrification (bD), nitrifier denitrification (nD), nitrification (ni), and fungal denitrification (fD) (view Table S1 for details). The mixing line connects the mean values of bD and fD (mix_bD-fD) or bD and ni (mix_bD-ni), respectively. The slope of the reduction lines (red) is based on the isotopic fractionation factor associated with N2O reduction to N2. Dashed line represents the minimum reduction line (n = 178, oxic incubation conditions from 0 DAO to 46 DAO, anoxic incubation conditions from 47 DAO to 55 DAO).
Applsci 11 05309 g003
Figure 4. δ15Nbulk of N2O (colored symbols and lines), added KNO3 and soil NO3 at first day of incubation (black symbols) and soil NO3 at last day of incubation (colored symbols with black borders) (means for n = 5, n = 4 for Control).
Applsci 11 05309 g004
Figure 5. (a) Fraction of N2O originating from heterotrophic bacterial denitrification/nitrifier denitrification (fbD) and (b) fraction of residual unreduced N2O (rN2O). Values were calculated based on the isotopocule mapping approach by Lewicka-Szczebak et al. (2017) [22] and represent results for scenario 1 (reduction-mixing) of bacterial denitrification with fungal denitrification (mean and standard deviation for n = 5, n = 4 for Control, data points missing for samples with an isotopic signature outside the reduction-mixing area, no N2O emitted from Control on 39 DAO).
Applsci 11 05309 g005
Table 1. Characteristics of maize litter used in the incubation experiment: total and water-soluble C and N content, C:N ratios, δ 13C, and distribution of C species in different plant litter types (values represent the percentage contribution of the different integrated chemical shift regions determined by 13C-CPMAS NMR spectroscopy).
Dry Matter
(%)
C
(%)
δ 13C
(‰)
N
(%)
C:NWater Soluble C
(%)
Water Soluble N
(%)
Water Soluble C:NAlkyl C
(%)
O/N-Alkyl C
(%)
Aryl C
(%)
Carboxyl C (%)
Maize leaves27.946.58−14.703.8012.278.030.6911.616.0563.6710.969.31
Maize roots7.840.12−12.972.9013.828.531.227.08.0880.6510.191.10
Maize straw31.443.84−14.110.8551.368.250.3921.411.4869.9311.237.23
Table 2. Soil mineral N and water-extractable organic C (WEOC) before setup (initial) and at the end of the incubation experiment. Net N mineralization over the whole incubation period of 55 days.
NO3
(mg N kg−1 dry soil)
NH4+
(mg N kg−1 dry soil)
WEOC
(mg C kg−1 dry soil)
Net N Mineralization
(mg N kg−1 dry soil)
δ15NNO3 of Soil NO3 (‰)δ18ONO3 of Soil NO3 (‰)
Initial102.9 ± 4.5934.7 ± 3.1651.4 ± 6.49-−5.74 ± 0.19/2.44 ± 0.22 11.84 ± 0.29/22.95 ± 0.40 1
Control142.1 ± 7.8b ***4.12 ± 0.27c ***56.3 ± 8.0b26.4 ± 5.5b7.80 ± 0.58bc9.21 ± 1.05c
Maize Leaves169.6 ± 4.4a ***5.84 ± 0.28a ***76.4 ± 3.1a ***75.5 ± 15.1a8.58 ± 0.24b9.27 ± 0.31c
Maize Roots176.1 ± 6.9a ***4.85 ± 0.39b ***72.0 ± 5.7a ***69.3 ± 5.4a6.64 ± 0.62c11.49 ± 0.52b
Maize Straw70.6 ± 5.6c ***6.00 ± 0.60a ***71.9 ± 5.3a ***−26.8 ± 5.7c16.40 ± 1.63a14.53 ± 0.34a
Values represent means ± standard deviation (n = 5, Control and Initial n = 4). Different letters in the same column indicate a significant difference according to the LSD post hoc test at p ≤ 0.05. *** indicates a significant difference to Initial content according to t-test at p ≤ 0.05. 1 initial soil NO3 after pre-incubation/added KNO3 (means ± standard deviation, n = 4).
Table 3. Coefficients of determination and p-values for simple linear regressions.
Adjusted R2p-Valuen
Oxic incubation period
Cumulative NO+N2O emissions ~ water-soluble litter C input0.44010.00117219
Cumulative N2O emissions ~ litter C:N ratio0.2470.0342815
Cumulative NO emissions ~ water-soluble litter C:N ratio0.87032.427 × 10−715
Cumulative NO emission ~ net N mineralization0.56710.000119719
NO+N2O flux ~ CO2 flux0.08023<2.2 × 10−161715
Anoxic incubation period
Cumulative N2 emissions ~ water-soluble litter C:N ratio0.25530.0315815
Cumulative NO+N2O+N2 emissions ~ total litter C input0.50870.000365519
N2O/(N2O+N2) ratio ~ water-soluble litter C:N ratio0.50611.886 × 10−619
N2O/(N2O+N2) ratio ~ WEOC: NO3 ratio0.41270.001819
NO+N2O+N2 flux ~ CO2 flux0.864<2.2 × 10−16176
Total incubation period
Cumulative CO2 emissions ~ total litter C input0.89744.84 × 10−1019
Cumulative CO2 emissions ~ water-soluble litter C input0.7981.606 × 10−719
Litter-derived CO2 flux ~ SOM-derived CO2 flux0.8838<2.2 × 10−16495
δ15NNO3 of soil NO3 ~ net N mineralization (52 DAO)0.729<2.024 × 10−619
Table 4. Cumulative SOM and litter-derived CO2 emissions, and priming effect.
Total CO2
(mg C kg−1 dry soil)
SOM-Derived CO2
(mg C kg−1 dry soil)
Litter-Derived CO2
(mg C kg−1 dry soil)
Priming Effect
(mg C kg−1 dry soil)
Control359.5 ± 13.2d359.5 ± 13.2c- -
Maize Leaves1266.0 ± 118.8a654.8 ± 83.5a597.5 ± 33.9a288.2 ± 76.2a
Maize Roots749.8 ± 68.1c504.9 ± 10.7b281.6 ± 17.6c130.0 ± 12.0b
Maize Straw970.8 ± 34.3b561.9 ± 26.9b449.7 ± 21.1b178.4 ± 21.5b
Values represent means (n = 5, for Control n = 4) ± standard deviation. Different letters in the same column indicate a significant difference.
Table 5. Cumulative NO, N2O, and N2 emissions and ratios of gaseous products during oxic and anoxic incubation.
Oxic Incubation Phase (0–46 DAO)Anoxic Incubation Phase (47–55 DAO)
Cumulative NO
(µg N kg−1 dry soil)
Cumulative N2O
(µg N kg−1 dry soil)
NO/N2OCumulative NO
(mg N kg−1 dry soil)
Cumulative N2O
(mg N kg−1 dry soil)
Cumulative N2
(mg N kg−1 dry soil)
N2O/(N2O+N2)
Control24.1 ± 2.5a78.3 ± 97.2c0.37 ± 0.19a0.29 ± 0.04c16.6 ± 2.5c0.88 ± 0.33c0.95 ± 0.03a
Maize Leaves20.8 ± 1.4b387.2 ± 94.4ab0.05 ± 0.02b0.64 ± 0.10a29.8 ± 9.0a6.75 ± 4.28ab0.83 ± 0.04b
Maize Roots22.9 ± 2.8ab319.0 ± 81.0b0.07 ± 0.01b0.41 ± 0.06b21.5 ± 1.5bc3.70 ± 1.58bc0.85 ± 0.05b
Maize Straw10.0 ± 1.7c552.2 ± 260.7a0.02 ± 0.01b0.48 ± 0.06b24.8 ± 1.0ab8.36 ± 2.06ab0.75 ± 0.05c
Values represent means (n = 5, for Control n = 4) ± standard deviation. Different letters in the same column indicate a significant difference according to the LSD post hoc test at p ≤ 0.05. N.b. different units for gas emissions during oxic and anoxic incubation phases.
Publisher’s Note: MDPI stays neutral with regard to jurisdictional claims in published maps and institutional affiliations.

