1. Introduction
The metropolitan area of South Korea includes Seoul, Gyeonggi-do, and Incheon and accounts for 11.8% of the South Korean area. The population of the metropolitan area included over 26 million people in 2019, accounting for 50.03% of the total population. Seoul occupies a small area of 605
but has a population of 10 million people [
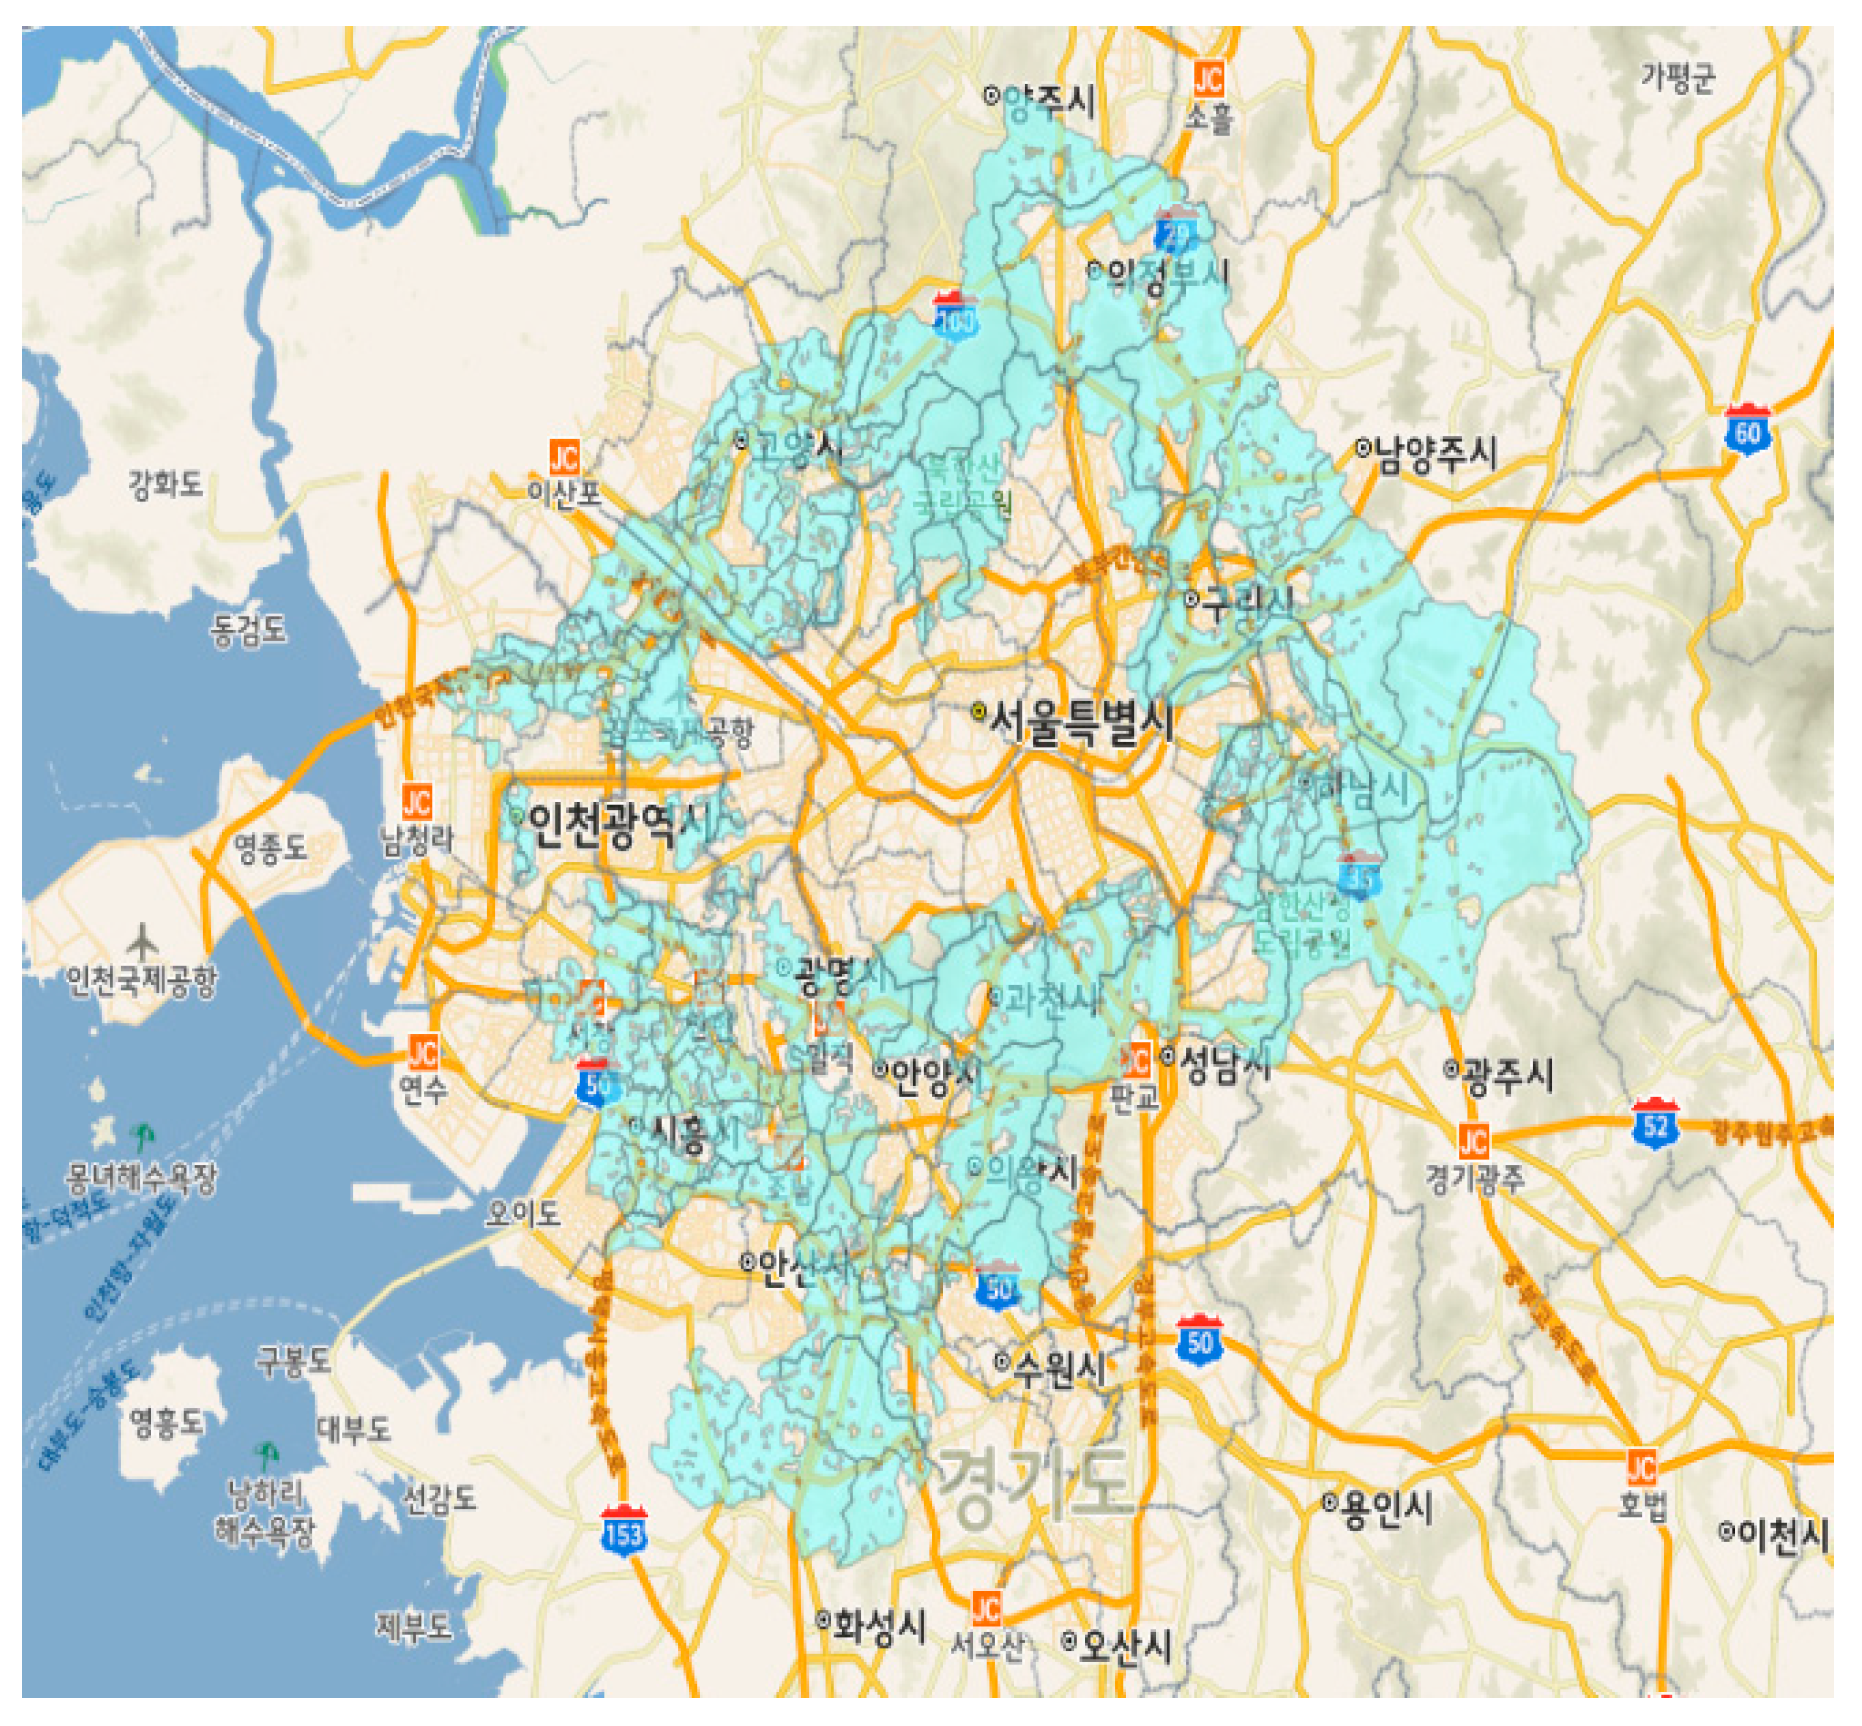
1]. Seoul already has a saturated population, and economic losses due to traffic congestion continue to increase. In addition, demand for transportation is increasing due to the rapid construction of new cities around the metropolitan area. However, congestion costs are expected to increase, as traffic volume in some zones, especially during rush hour, exceeds the capacity due to the lack of transportation facilities. Also, the congested road zones in the metropolitan area are concentrated on the road connecting Seoul and Gyeonggi-do, which is 159.8 km long, as shown in
Table 1. Accordingly, as of 2019, the average commuting time by public transportation in the Seoul metropolitan area was 81 min: 2.8 times higher than the OECD average of 29 min [
2]. Therefore, to overcome this traffic issue, many companies are actively working on urban air mobility (UAM), i.e., air public transportation rather than ground.
Although helicopters are commonly used in urban areas, helicopters are not suitable for UAM, such as air taxis, due to the noise, emissions, and high costs of operation. Thus, electric vertical take-off and landing (eVTOL) vehicles have emerged as an alternative. Many eVTOL vehicles are under development, such as Airbus Vahana, Cityairbus, Lilium Jet, Bell Nexus, Joby S4, Hyundai SA-1, etc., and Uber has announced Elevate, a project that will allow commuters to use flying cars by 2026 [
3].
According to a UAM survey of major specific cities conducted by Booz Allen Hamilton, more than 50% of commuters responded positively to UAM boarding [
4], and if UAM becomes commercialized, many commuters would use eVTOL when commuting. Therefore, the locations of the vertiports should be in a place that is conveniently accessible to commuters. UAM will minimize traffic congestion on ground roads, and it is believed that this change will be positive for most of the population.
In addition, we must consider that this is a new transportation method that has never existed before, so infrastructure is needed to support it. In other words, eVTOL should be designed not only for take-off and landing but also for service infrastructure, such as vertiports, which allow passengers to stand by and board. The problem of emissions and noise should also be considered because the air transport is being operated in urban areas. Moreover, in the case of the Seoul metropolitan area in South Korea, where the area of land is limited, and the residential area is excessively concentrated, these issues are exacerbated. In addition, since the noise level is relative to people, it is important to first analyze it with indicators of standard noise intensity and later create a sustainable system under mutually beneficial conditions for all stakeholders.
As UAM emerges as an alternative transportation in the near term, adverse energy and environmental impacts, particularly noise, may impact community acceptance and potentially persist as the market matures into larger-scale operations. Of the concerns raised, the potential for noise was one of the most commonly raised concerns. However, people were less concerned about individual aircraft noise and more concerned about total ambient noise from multiple aircraft operating in close proximity. People indicated a preference for limiting aircraft operations overnight, particularly in residential neighborhoods.
The most common bothersome noises experienced by the respondents were noise from motor vehicles and neighboring properties, and they tended to be most bothered by noise at home. Overall, respondents preferred that UAM technology have no noticeable noise. The noise levels of the technology could affect support for UAM.
Noise impacts are expected to be more severe near the take-off and landing areas. Existing noise concerns focus on traffic noise during the night and early morning; noise from UAM could pose a more notable obstacle in the future as electric vehicles become more mainstream (potentially causing a reduction in overall ambient noise, making UAM more noticeable) [
4].
Design of transport network, whether land, sea, or air, is a complex problem spanning many disciplines that would also encounter many real-world issues. There are many barriers and challenges, such as noise, to operate UAM. The Booz Allen Hamilton report [
4] explored market size and potential barriers to UAM by focusing on three potential markets—airport shuttle, air taxi, and air ambulance. The barriers and challenges were also stratified according to their applicability or potential mitigation through technology as well as market maturity. In an immature market, the technology challenges are high cost of service, weather conditions, high density operations, battery technology, and environmental impacts, particularly noise. On the other hand, the non-technology challenges are infrastructure constraints, competition, and public perception [
4].
For the UAM study, key metrics from the perspective of operators (e.g., number of flights, potential revenue, and operating costs), passengers (e.g., number and distribution), non-flying public (e.g., flight patterns, potential noise impacts), and infrastructure providers (e.g., number, location, and capacity of vertiports) should be calculated and tracked. However, in this study, only vertiport location selection and noise analysis were performed without considering all these factors [
4]. To select vertiport locations, Antcliff et al. [
5] came up with the idea of using highway cloverleaf interchanges, coastlines, river barges, and private infrastructures as UAM ground infrastructure locations. Also, Corgan, who collaborated with Uber, selected sites for their design in the Dallas/Fort Worth area, which is a primary launch market for Uber Air because of its high commuting population between cities, the high demand of air shuttle, and its existing helicopter routes for navigation [
6]. Daskilewicz et al. [
7] used census data from San Francisco and Los Angeles to collect commuting locations and commuting time. Using this data, 10, 20, and 40 vertiport locations were selected, solving an integer program that maximizes potential time savings compared to driving. German et al. [
8] conducted an eVTOL study for small package delivery and also formulated and solved the optimization formula for maximizing the package demand served. Therefore, they derived one to eight vertiports positions. Rajendran et al. [
9] proposed an iterative constrained clustering algorithm with the multimodal transportation warm-start technique. Using NYC taxi records, 10 to 85 vertiport locations were suggested, including large facilities and small stops. Ploetner et al. [
10] defined three different UAM networks with different numbers of vertiports in the Munich Metropolitan region. Each network has 24, 74, and 130 vertiports, representing low, medium, and high-density networks. Syed et al. [
11] selected 200, 300, 400, and 1000 vertiport locations in Northern California using the K-means algorithm. Lim et al. [
12] selected 10 to 36 vertiport locations using data from a survey from the commuting population and the K-means algorithm and selected three routes to analyze the savings in commuting time. For this study, however, data was filtered by adding assumptions that commuters would not commute to and from the same administrative district using the eVTOL, and vertiports were chosen based on the assumption of building a substantial number of vertiports required when the UAM is commercialized. In addition, regarding the issue of noise, Kim et al. [
13] stated that eVTOL’s noise is one of the most harmful effects of commercializing the technology, and the impact of noise on commuting using an eVTOL in San Francisco was analyzed through two scenarios of use for daily commuting. However, eVTOL noise data was not available in the Aviation Environmental Design Tool (AEDT), so it was modeled using four representative helicopters of different classes.
Uber established a subsidiary dedicated to UAM called Uber Elevate and led the market by standing out in eVTOL development and commercialization. It also plans to operate a certified vehicle in 2023 to generate revenue, signaling commercialization in Los Angeles, Dallas, and Melbourne, Australia. Regarding the selection of vertiports, the K-means algorithm was used to select the most suitable places in LA and London, and in collaboration with Corgan, Uber announced the designs of vertiports in certain U.S. cities. In addition, various types of vertiports, such as parking lots, highway interchanges, and barges, were proposed to address difficulties in infrastructure design in urban areas [
14]. However, Joby acquired Uber’s UAM business in December 2020.
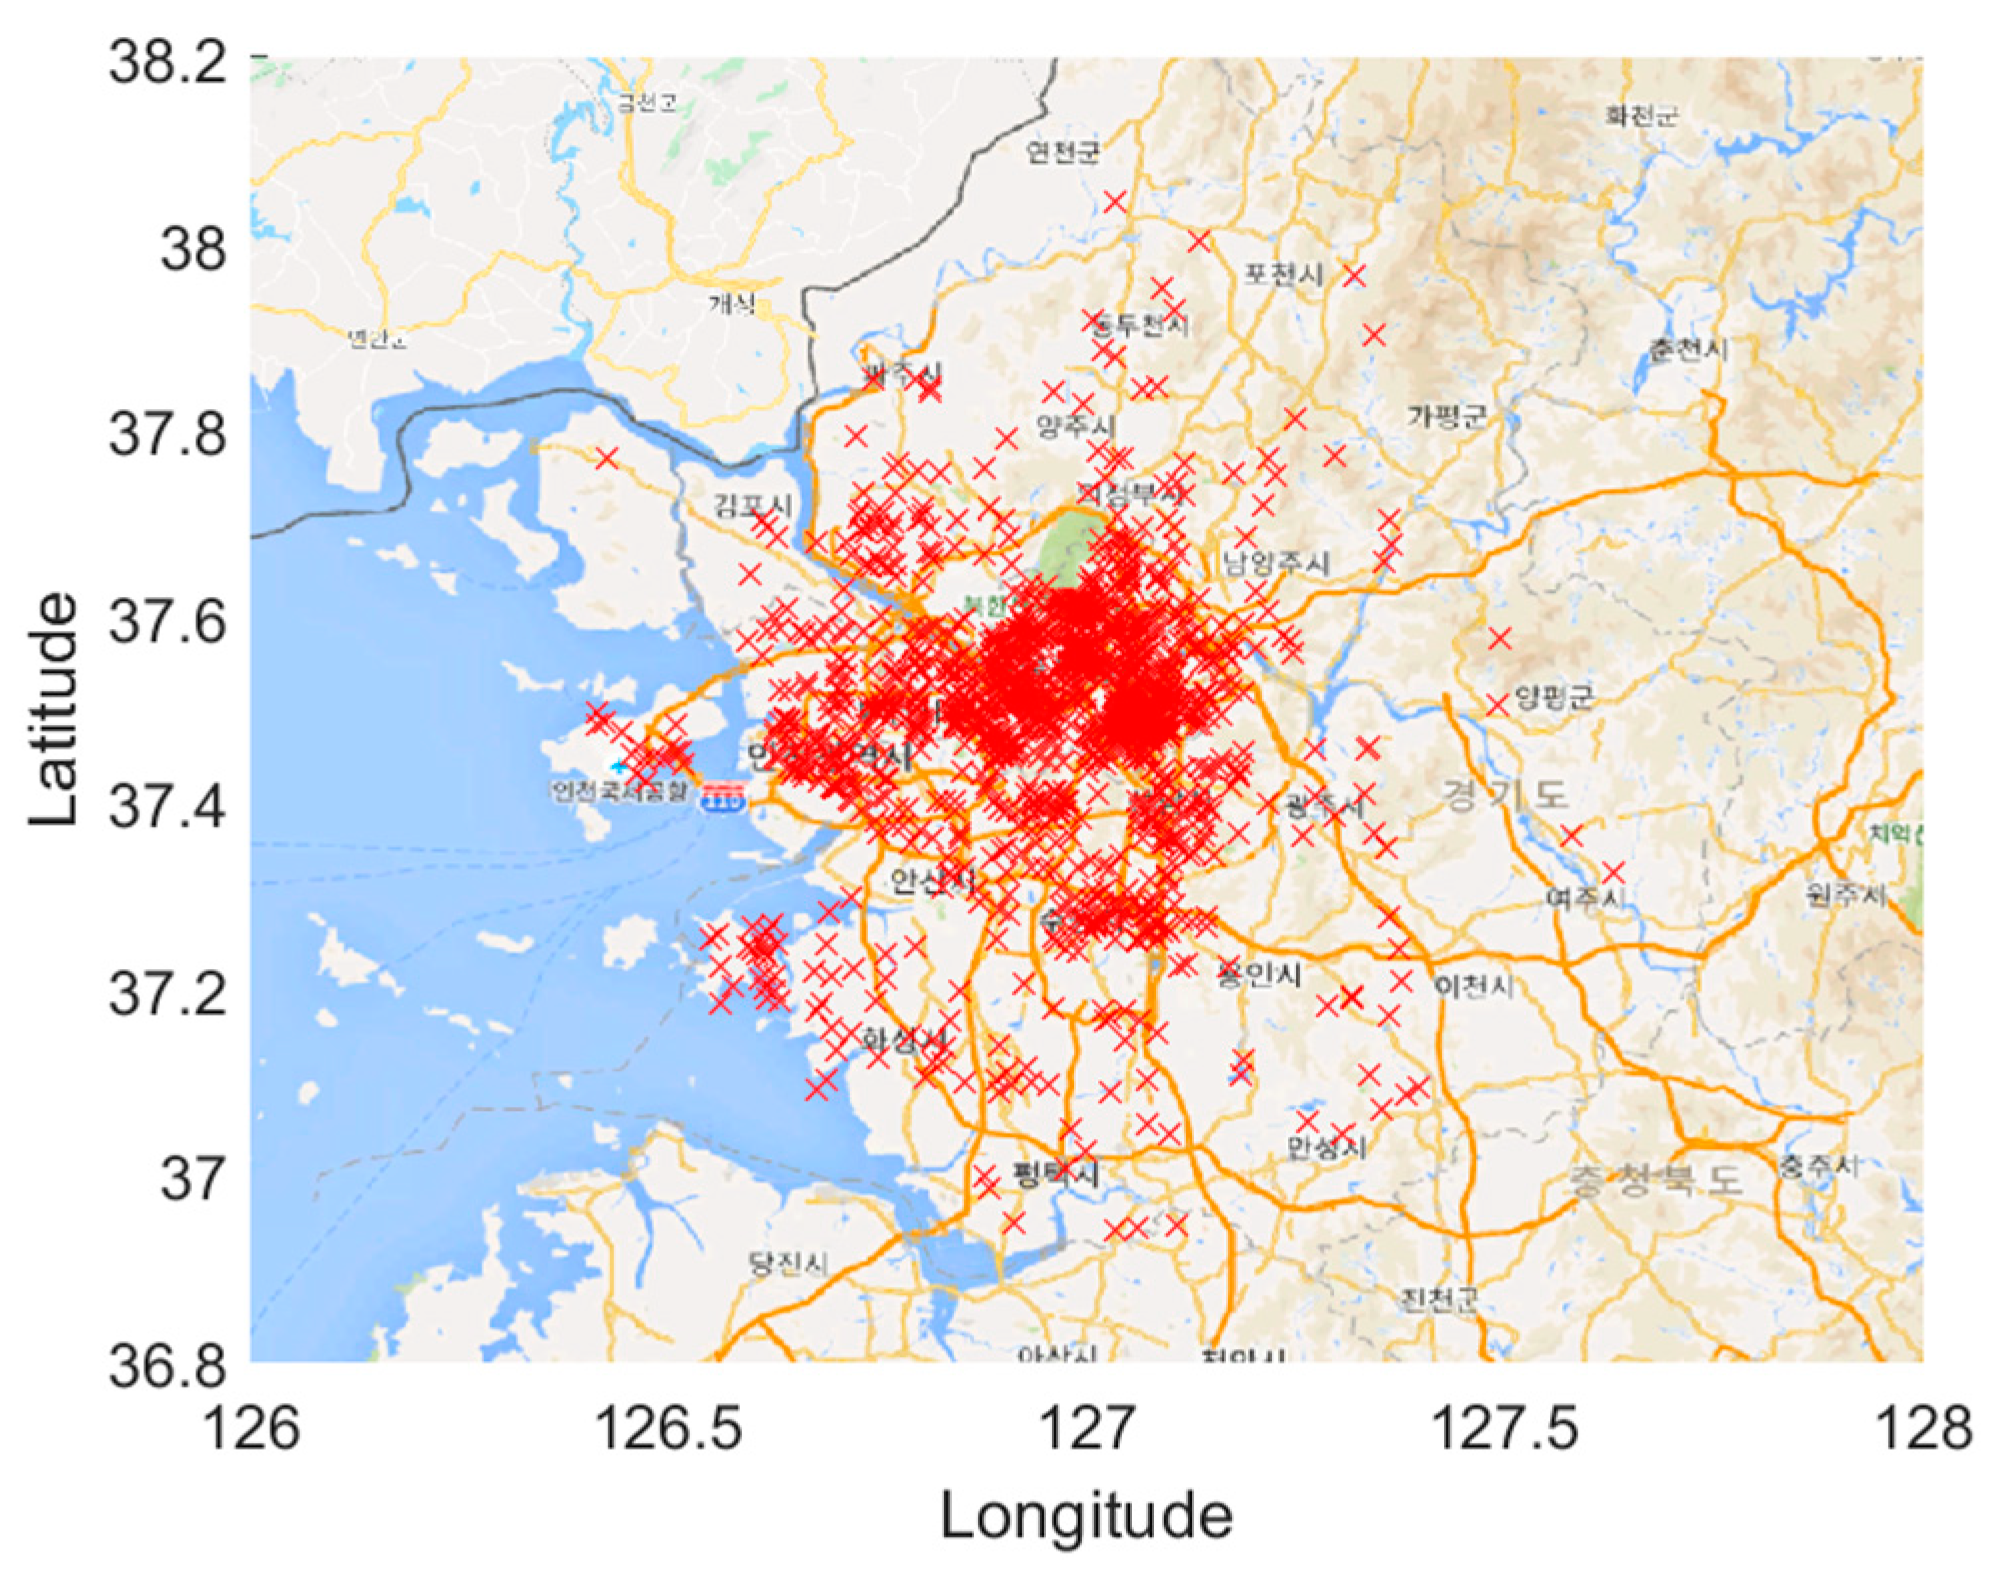
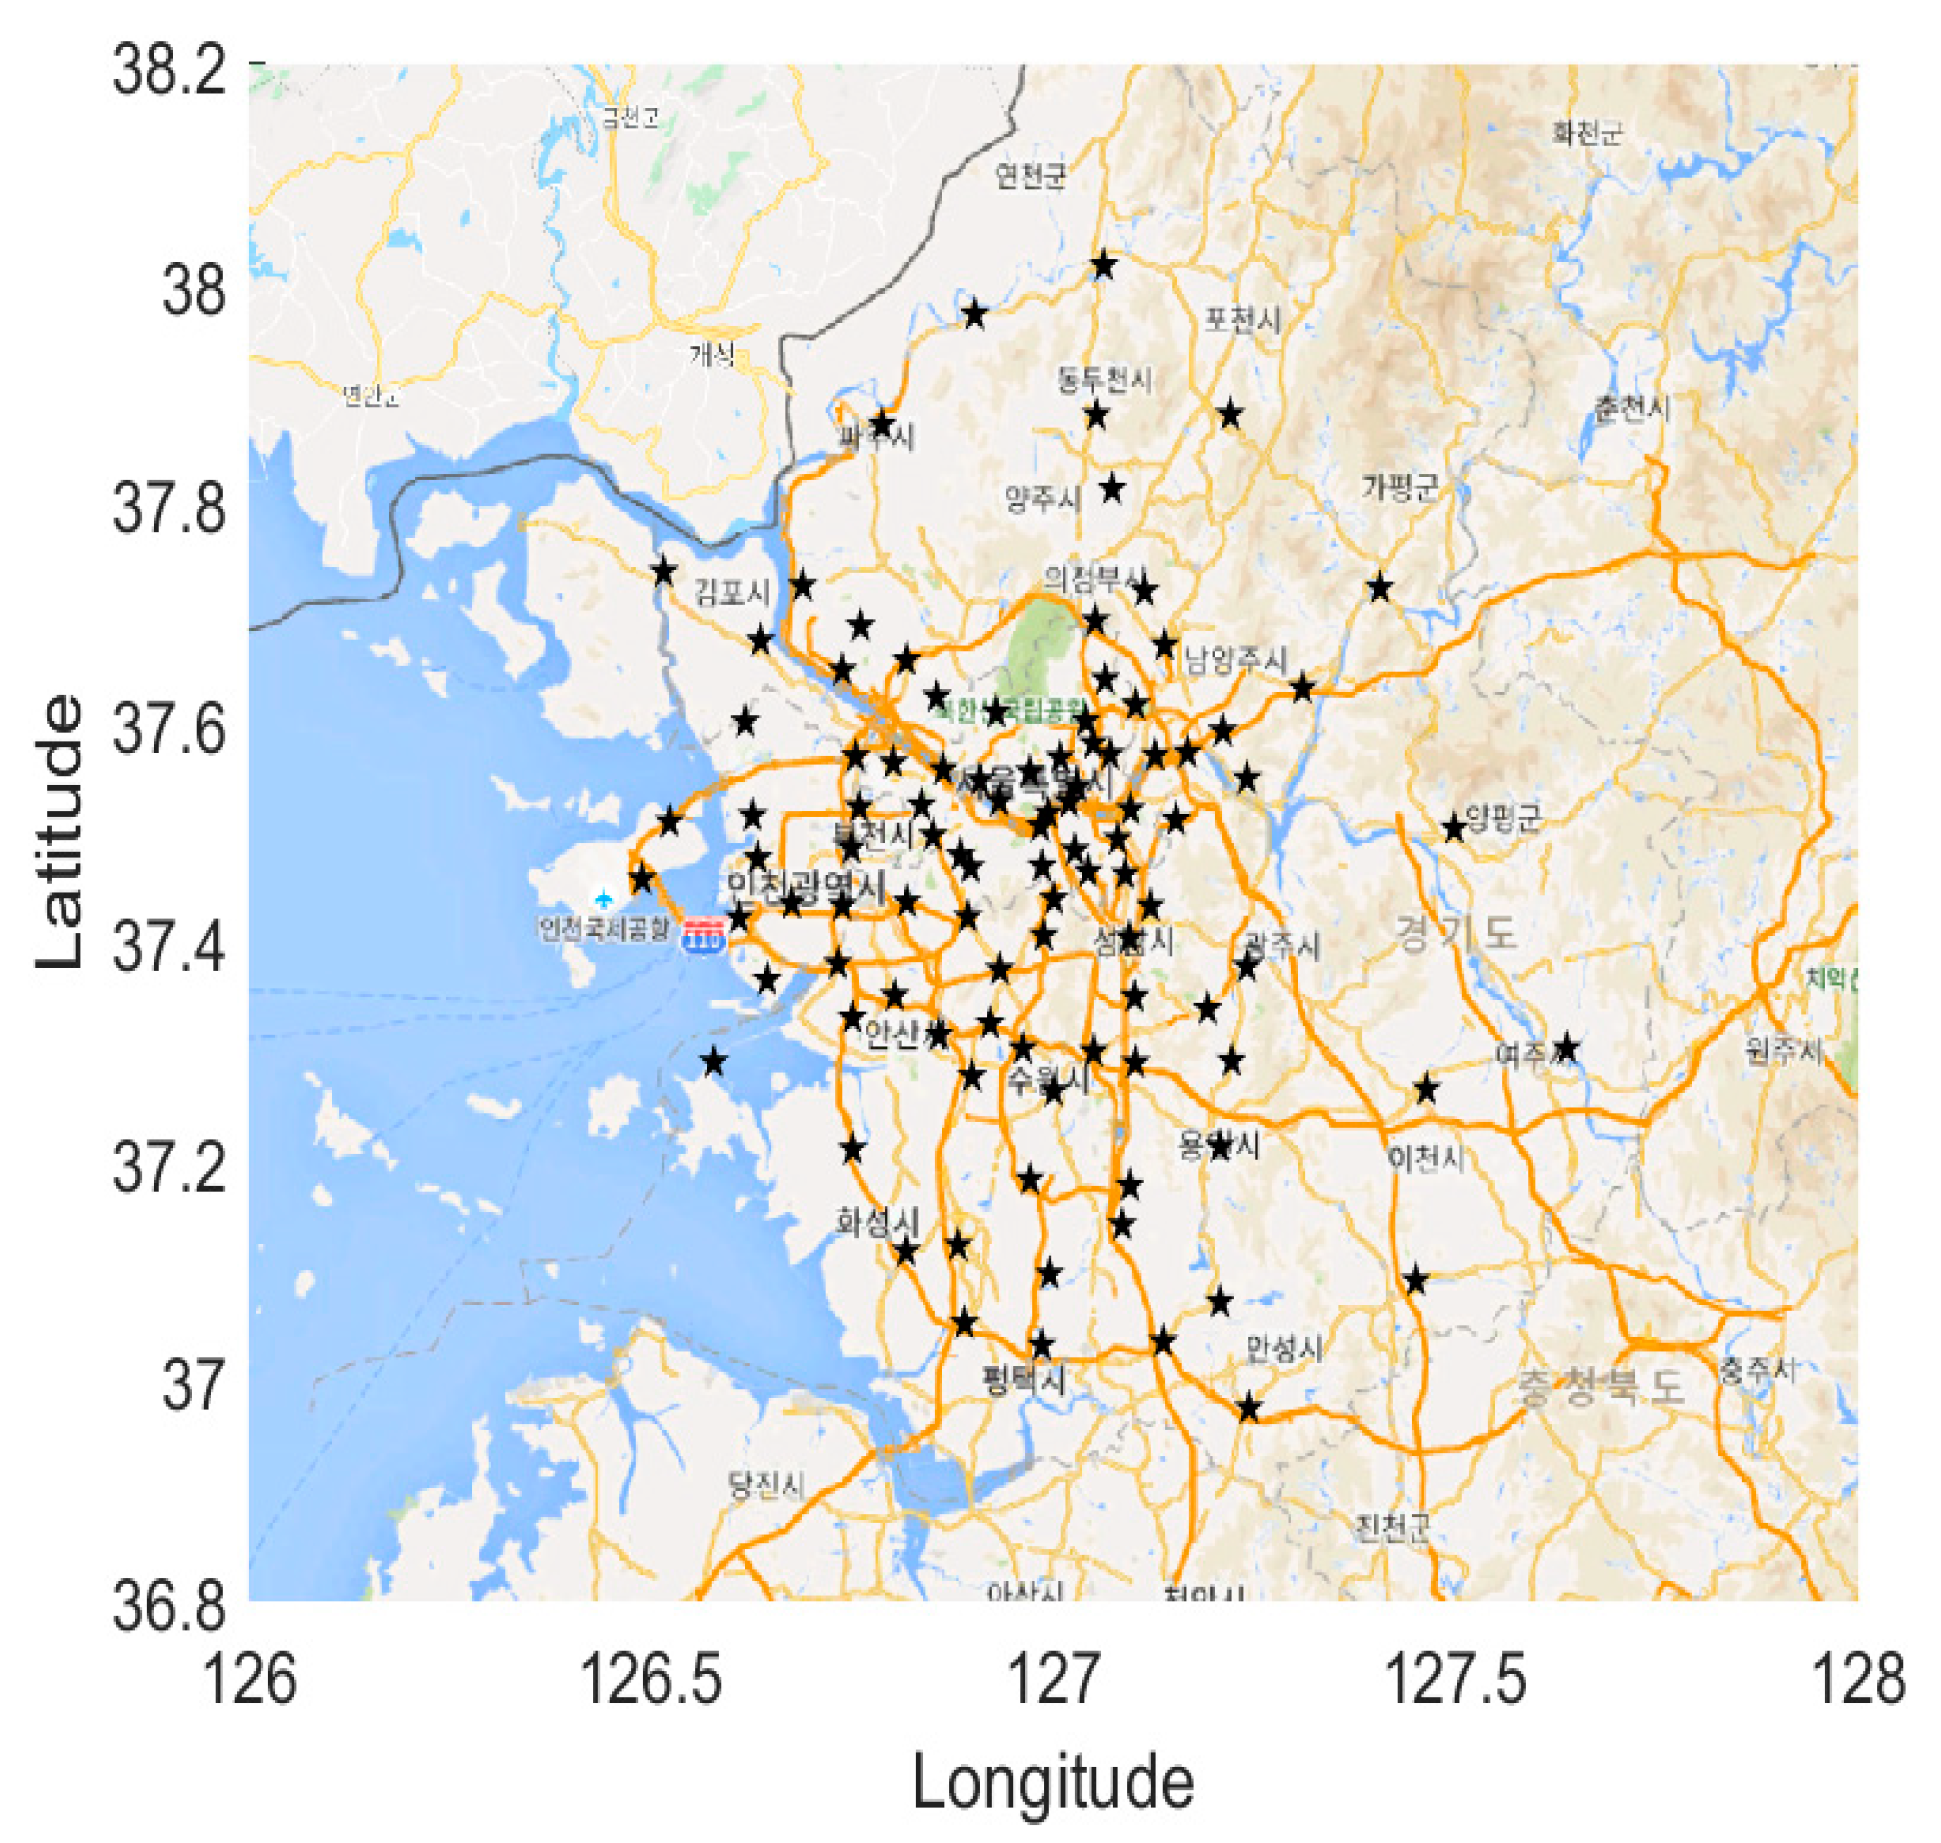
In this paper, the demand for eVTOL is analyzed by examining statistics of the number of people commuting, focusing on the Seoul metropolitan area in Korea, where 50% of the population lives. Vertiport locations are then selected for UAM using the commuter data and K-means algorithm. The Aviation Environmental Design Tool (AEDT), a software that analyzes environmental effects, such as noise, fuel consumption, emissions, and air pollution of aircraft, developed by the FAA (Federal Aviation Administration), was also used to perform noise analysis around the UAM route. In order to minimize the number of people affected by noise, the route was set in the form of noise priority rather than the shortest route directly connecting the origin to the destination. Finally, noise analysis was performed compared to the shortest route.
3. Noise Analysis
3.1. Aircraft Noise Assessment Methods
The aircraft noise assessment units vary, and the resulting assessment criteria are all different. Currently, South Korea uses Weighted Equivalent Continuous Perceived Noise Level (
WECPNL), as shown in Equation (4).
WECPNL is a unit proposed by the International Civil Aviation Organization (ICAO) as a measure of long-term, continuous exposure by aircraft, accounting for the metallic noise characteristics of aircraft. In Korea, noise is calculated close to the actual noise felt by residents by the average of the highest noise of aircrafts weighted by the number of flights per day, night, and in the midnight hours.
represents the average of the maximum noise measured for a day over 10 dB above background noise when the planes pass through. represents the number of aircrafts passed between 24:00 and 07:00, between 07:00 and 19:00, between 19:00 and 22:00, and between 22:00 and 24:00.
However, WECPNL tends to be over-approximated, and other environmental noise in the country applies the equivalent noise method (), making it difficult to compare with aircraft noise, which is limited to reflecting the sum of continuous noise exposure. In addition, advanced aviation countries, such as the U.S. and Europe, have adopted the equivalent noise method. Therefore, the Ministry of Environment of Korea will change the aircraft noise unit from WECPNL to the equivalent noise method in order to unify it into an international standard, which is scheduled to take effect in 2023.
The equivalent noise assessment method complements the shortcomings of the WECPNL and is linearly related to WECPNL. It is also appropriate to use as an aircraft noise assessment indicator considering continuity with the current standard because it is easy to automatically measure with integration without simplification due to the development of noise-measurement technology.
The equivalent noise assessment method is the average noise divided by 24 h, after measuring the equivalent noise level every hour for a day, and weighted hourly. In addition, the two divisions of the time zone are (day-night average sound level), and the three divisions of the time zone are (day-evening-night average sound level). In the case of the two divisions, the daytime is between 07:00 and 22:00, and the nighttime is between 22:00 and 07:00, and only the night time zone is weighted by 10 dB, as shown in Equation (5). In the case of the three divisions, the daytime is between 07:00 and 19:00, the evening is between 19:00 and 22:00, and the nighttime is between 22:00 and 07:00. This case is weighted by 5 dB in the evening and 10 dB in the nighttime.
Therefore, in this paper, noise analysis is performed on the basis of
, as shown in Equation (6), as the equivalent noise assessment easily measures noise and distinguishes day, evening, and night time zones and will be changed from
WECPNL in 2023.
3.2. Determining the Effect of Noise on Population
3.2.1. The Formula for Determining the Percentage of Population Affected by Noise
The operation of eVTOL when UAM is commercialized will result in noise around the operating path, thus affecting the population living in those areas. Therefore, for generating less noise in the UAM operating paths, it is important to measure the percentage of the population in each residential district affected, as shown in Equation (7).
Equation (7) is a curve fitting function of the Shultz curve used to calculate the number of residents negatively affected by noise [
22]. M. Brink et al. stated that the difference in noise levels between
and
in Equations (5) and (6) is small, making it possible to replace
in Equation (7) with
[
23].
According to the original Shultz curve, high-level noise impact at 65 dB is about 12%. However, the noise impact of aircraft tends to be higher than other noise sources, and the Miedema curve shows that the noise impact of aircraft is about 27% [
22].
3.2.2. Determining the Number of People Affected by Noise
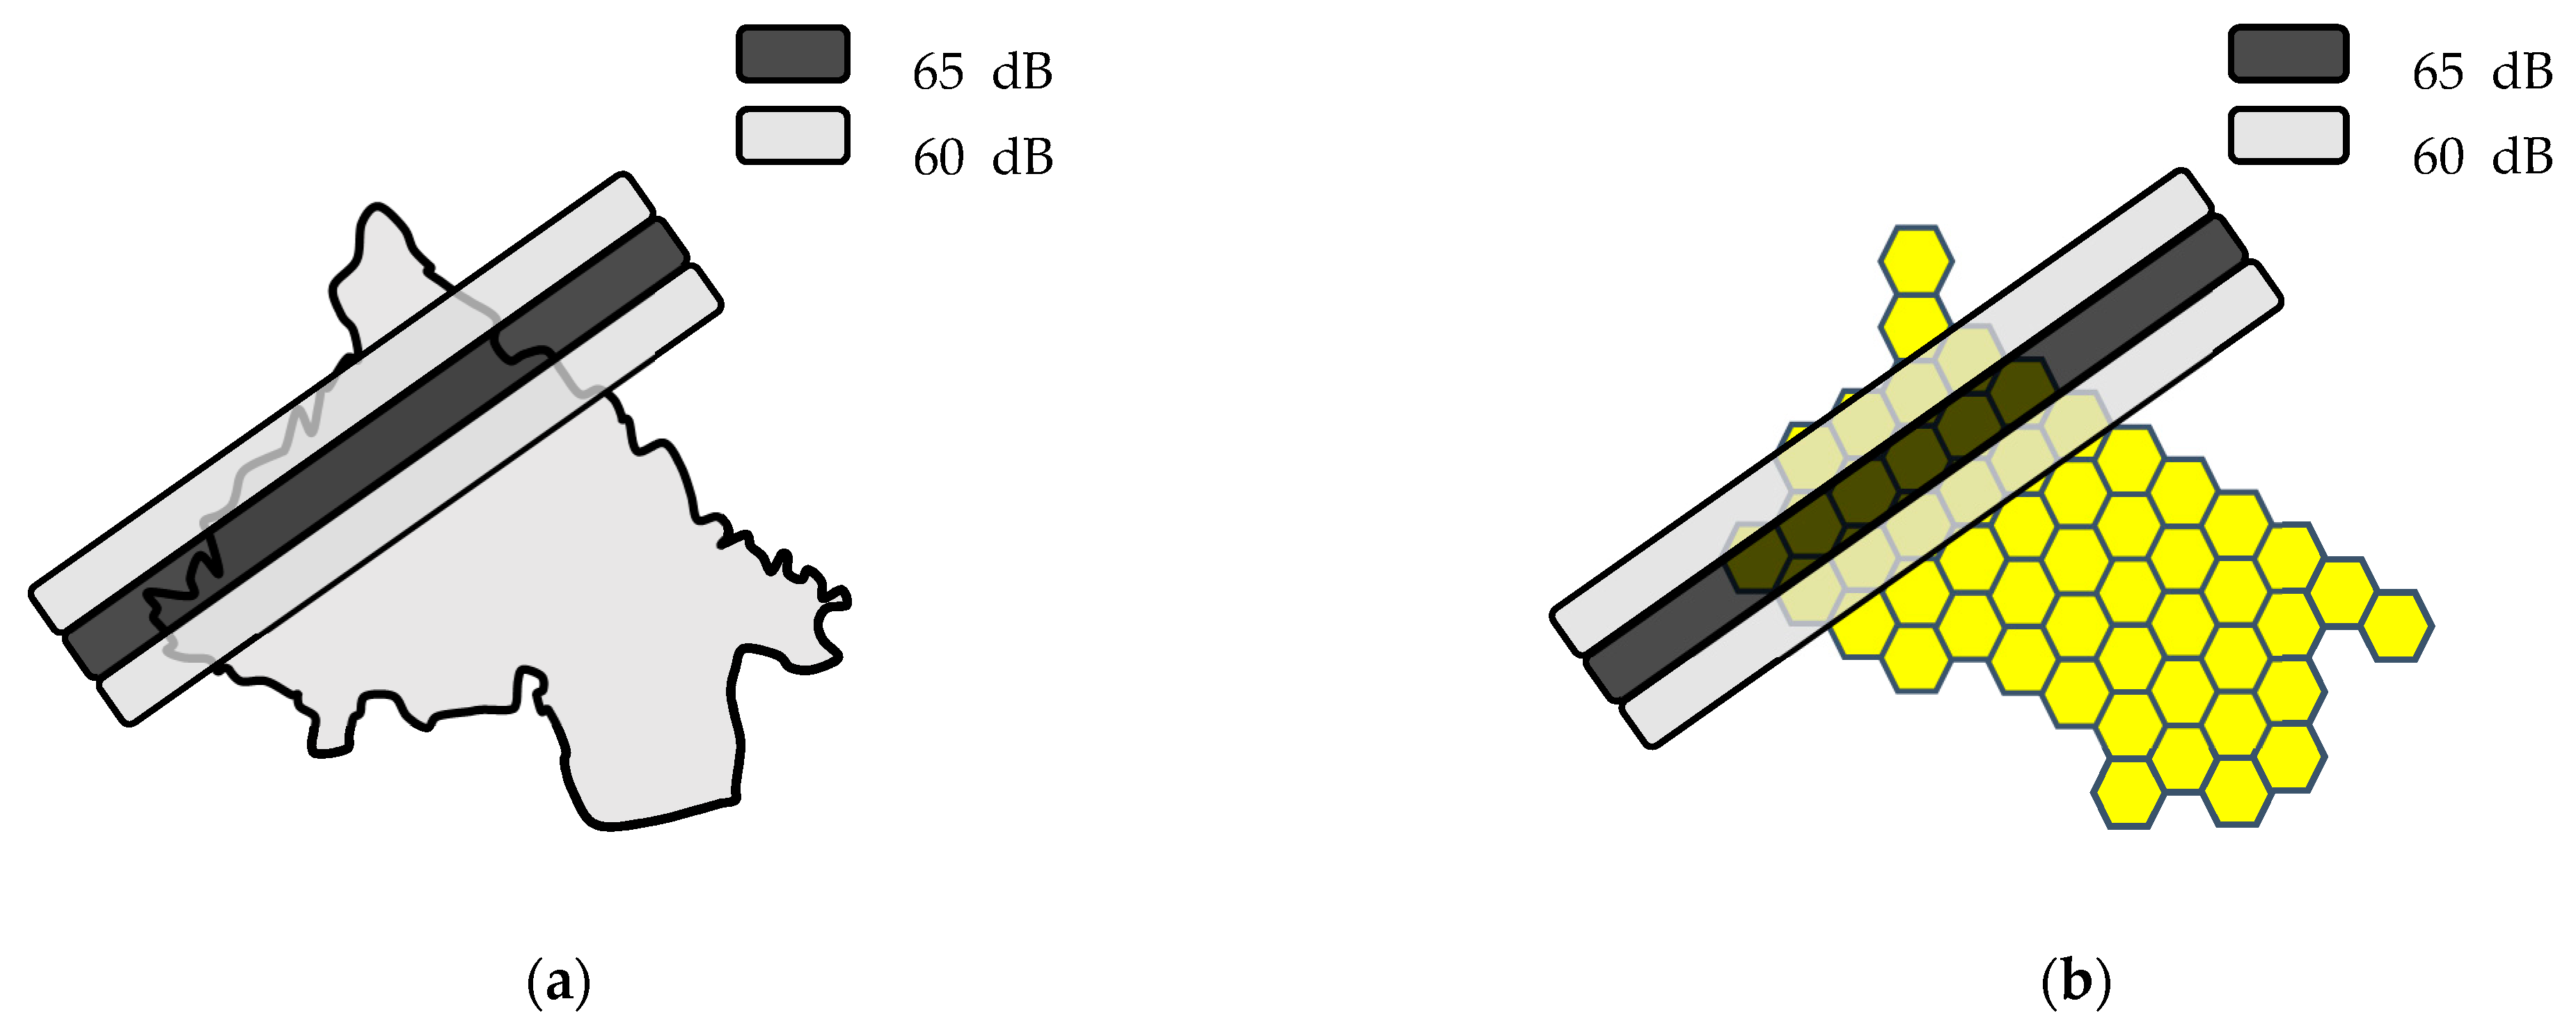
The extent of noise around the route is likely to be limited to parts of the administrative district. In addition, the administrative district is not an ideal shape, such as a square, and residents are not evenly distributed per unit area of the district. Since the current population distribution has statistical data depending on each administrative district, a method to reasonably derive the effect of UAM noise on the population is proposed as follows.
Figure 10a is a hypothetical representation of the noise that eVTOL produces when it passes through an actual city, and
Figure 10b is modeled in an ideal space of hexagonal tiles.
The actual city of
Figure 10 is a replica of Gangseo-gu, with an area of about 41.4
. In an ideal city, one hexagon has an area of about 0.8
, and the city consists of 52 hexagons. Therefore, the total area of the ideal city is about 41.6
, and it is well fitted because it produces about −0.48% of the integral error with the actual city.
According to the resident registration demographics serviced by the Ministry of the Interior and Safety of Korea, the total number of residents in Gangseo-gu is 572,377 as of 2021, and 182,963 of them commute outside Gangseo-gu, according to the Korean Statistical Information Service. In other words, there will be 389,414 people left in Gangseo-gu, and the population is defined as those who can be affected by noise within the living area. On the other hand, because the ideal city consists of 52 hexagons, it can be assumed that there are 7489 people per hexagon.
At 65 dB and 60 dB in the Miedema curve, the effects of air traffic noise are 27% and 18% of the total population, respectively. In an ideal city, as shown in
Figure 10, 65 dB contains six hexagons, and 60 dB contains ten hexagons, and 44,934 and 74,890 represents the number of people living in the hexagons affected by the noise, respectively. As a result, the total number of people affected by the high level of noise generated by the path of the eVTOL vehicle in the ideal city is 12,132 in the 65 dB section and 13,480 in the 60 dB section.
In this paper, these methods were applied to analyze the impact of UAM noise on resident populations and present a feasible method for setting up actual UAM noise priority routes.
3.3. Selection of Routes and Vertiports
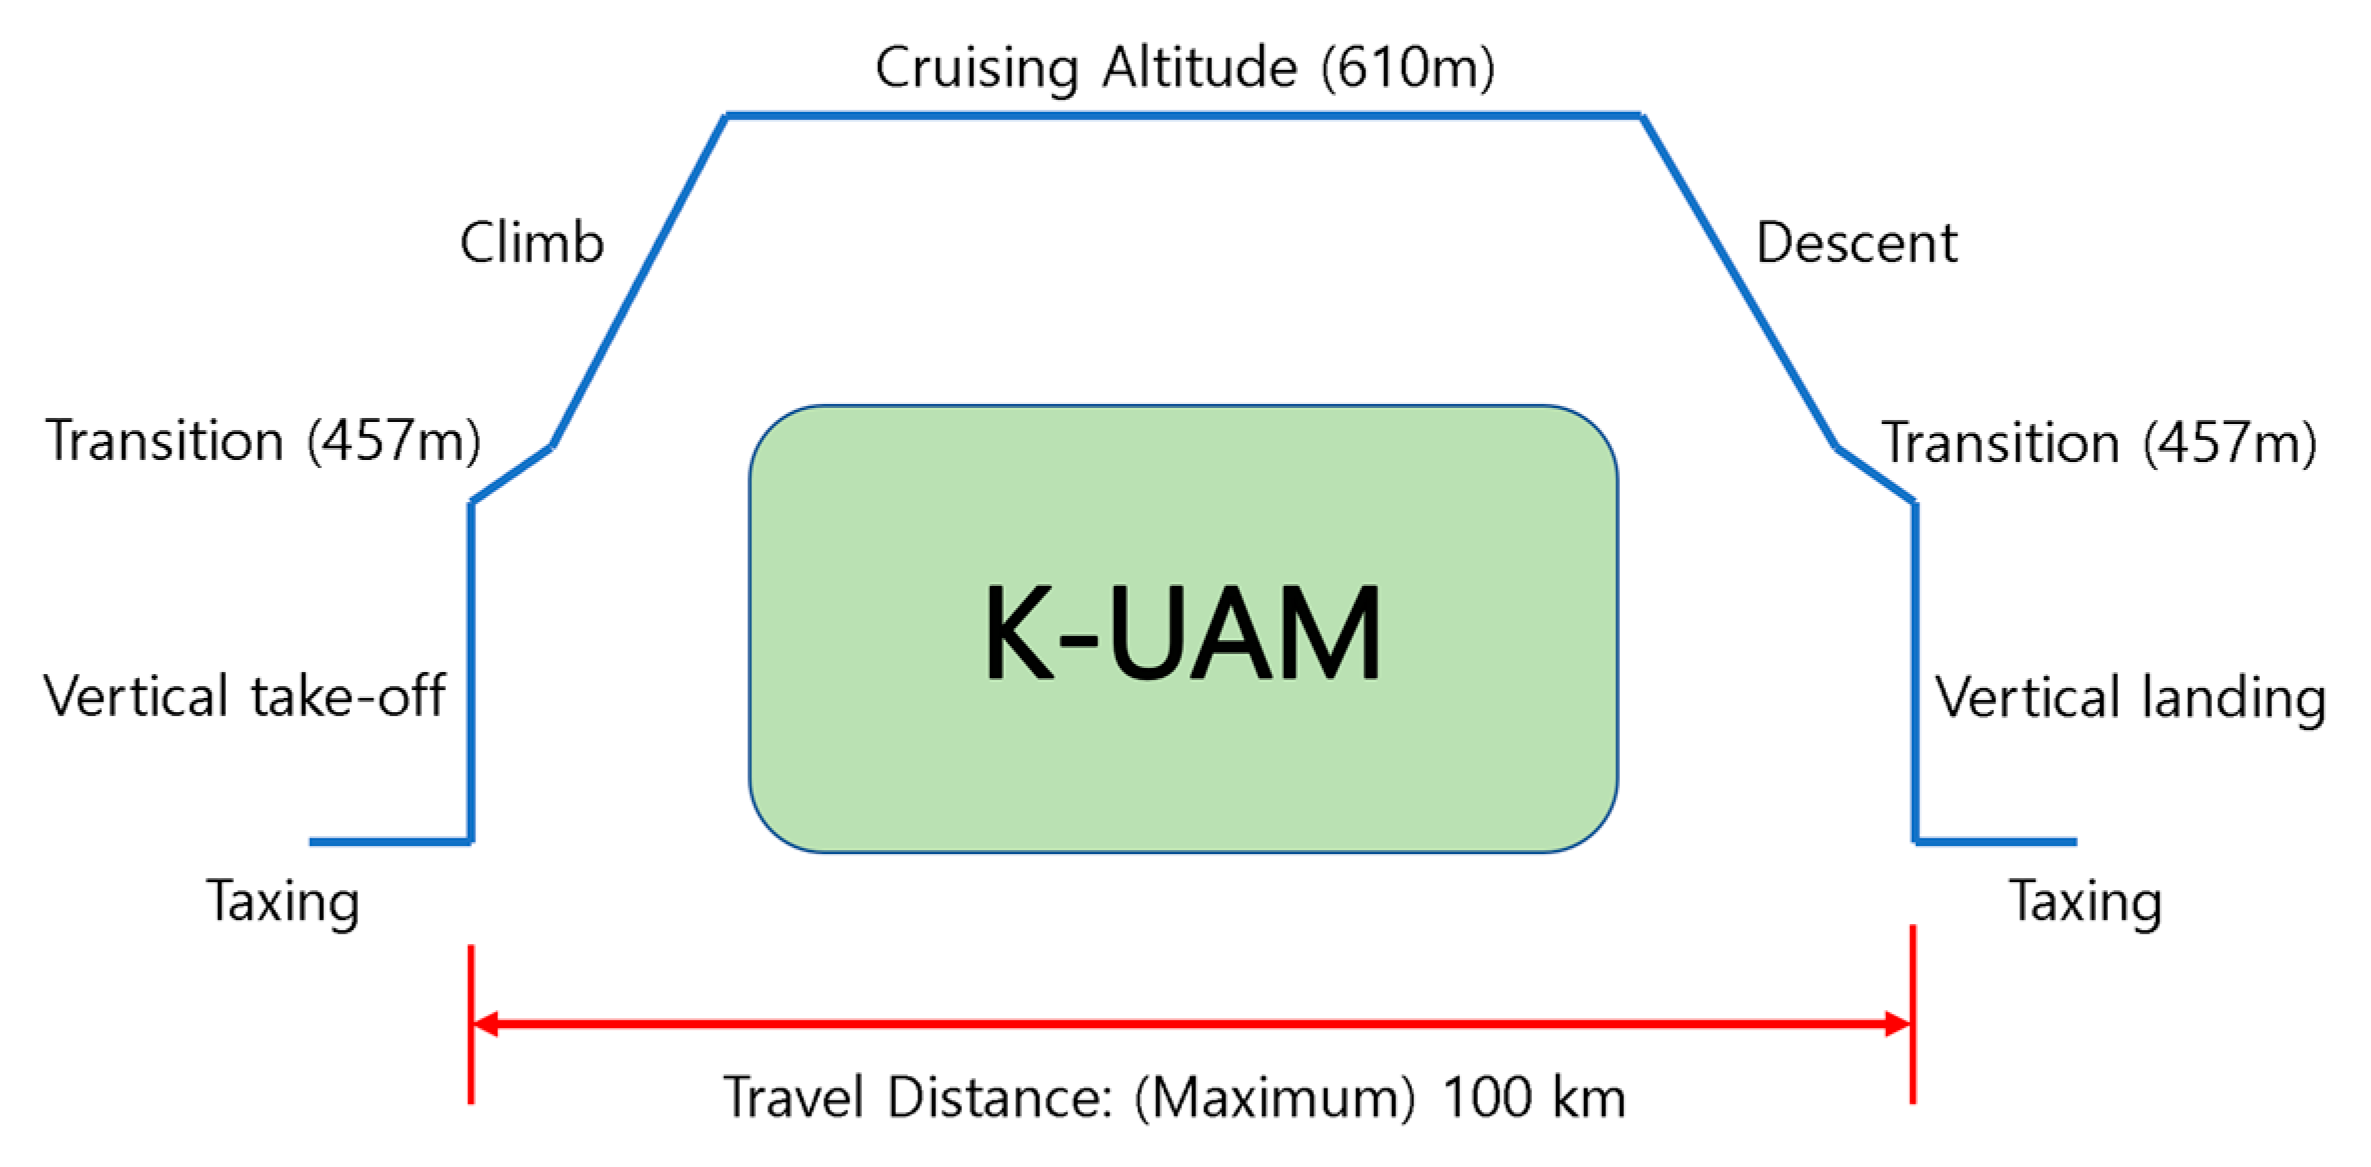
It is assumed that the operation is based on the mission profile, as shown in
Figure 11. On AEDT, we assumed that there would be no significant difference in noise analysis by combining vertical take-off, vertical landing, and transitions into one process, so we performed noise analysis assuming these three as one process.
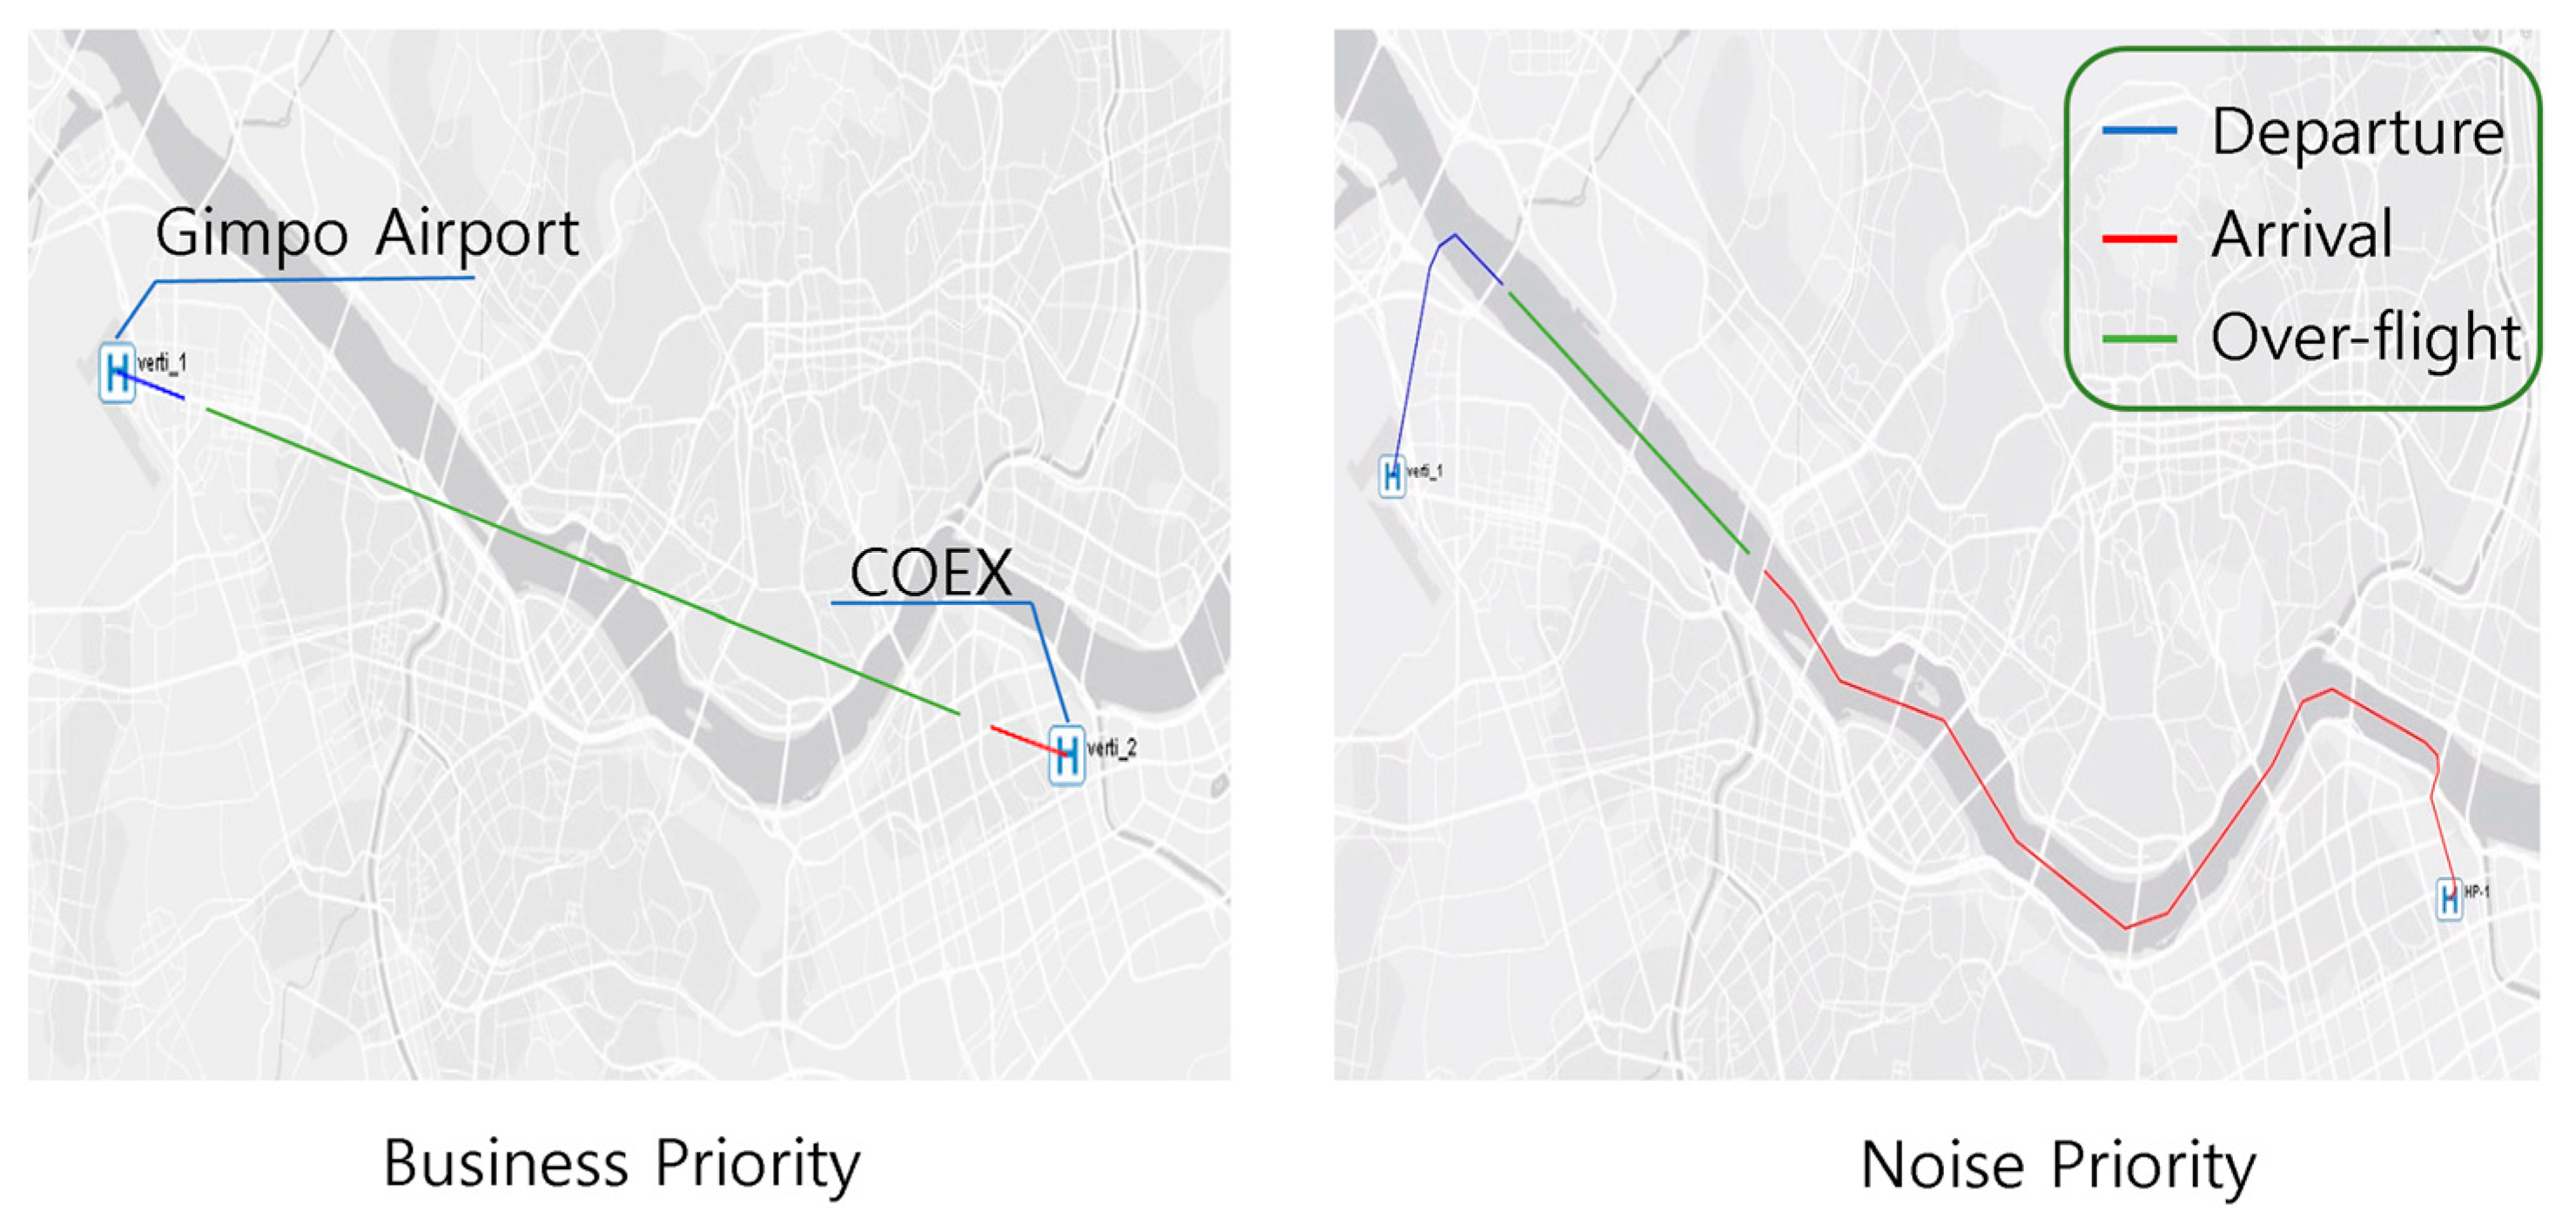
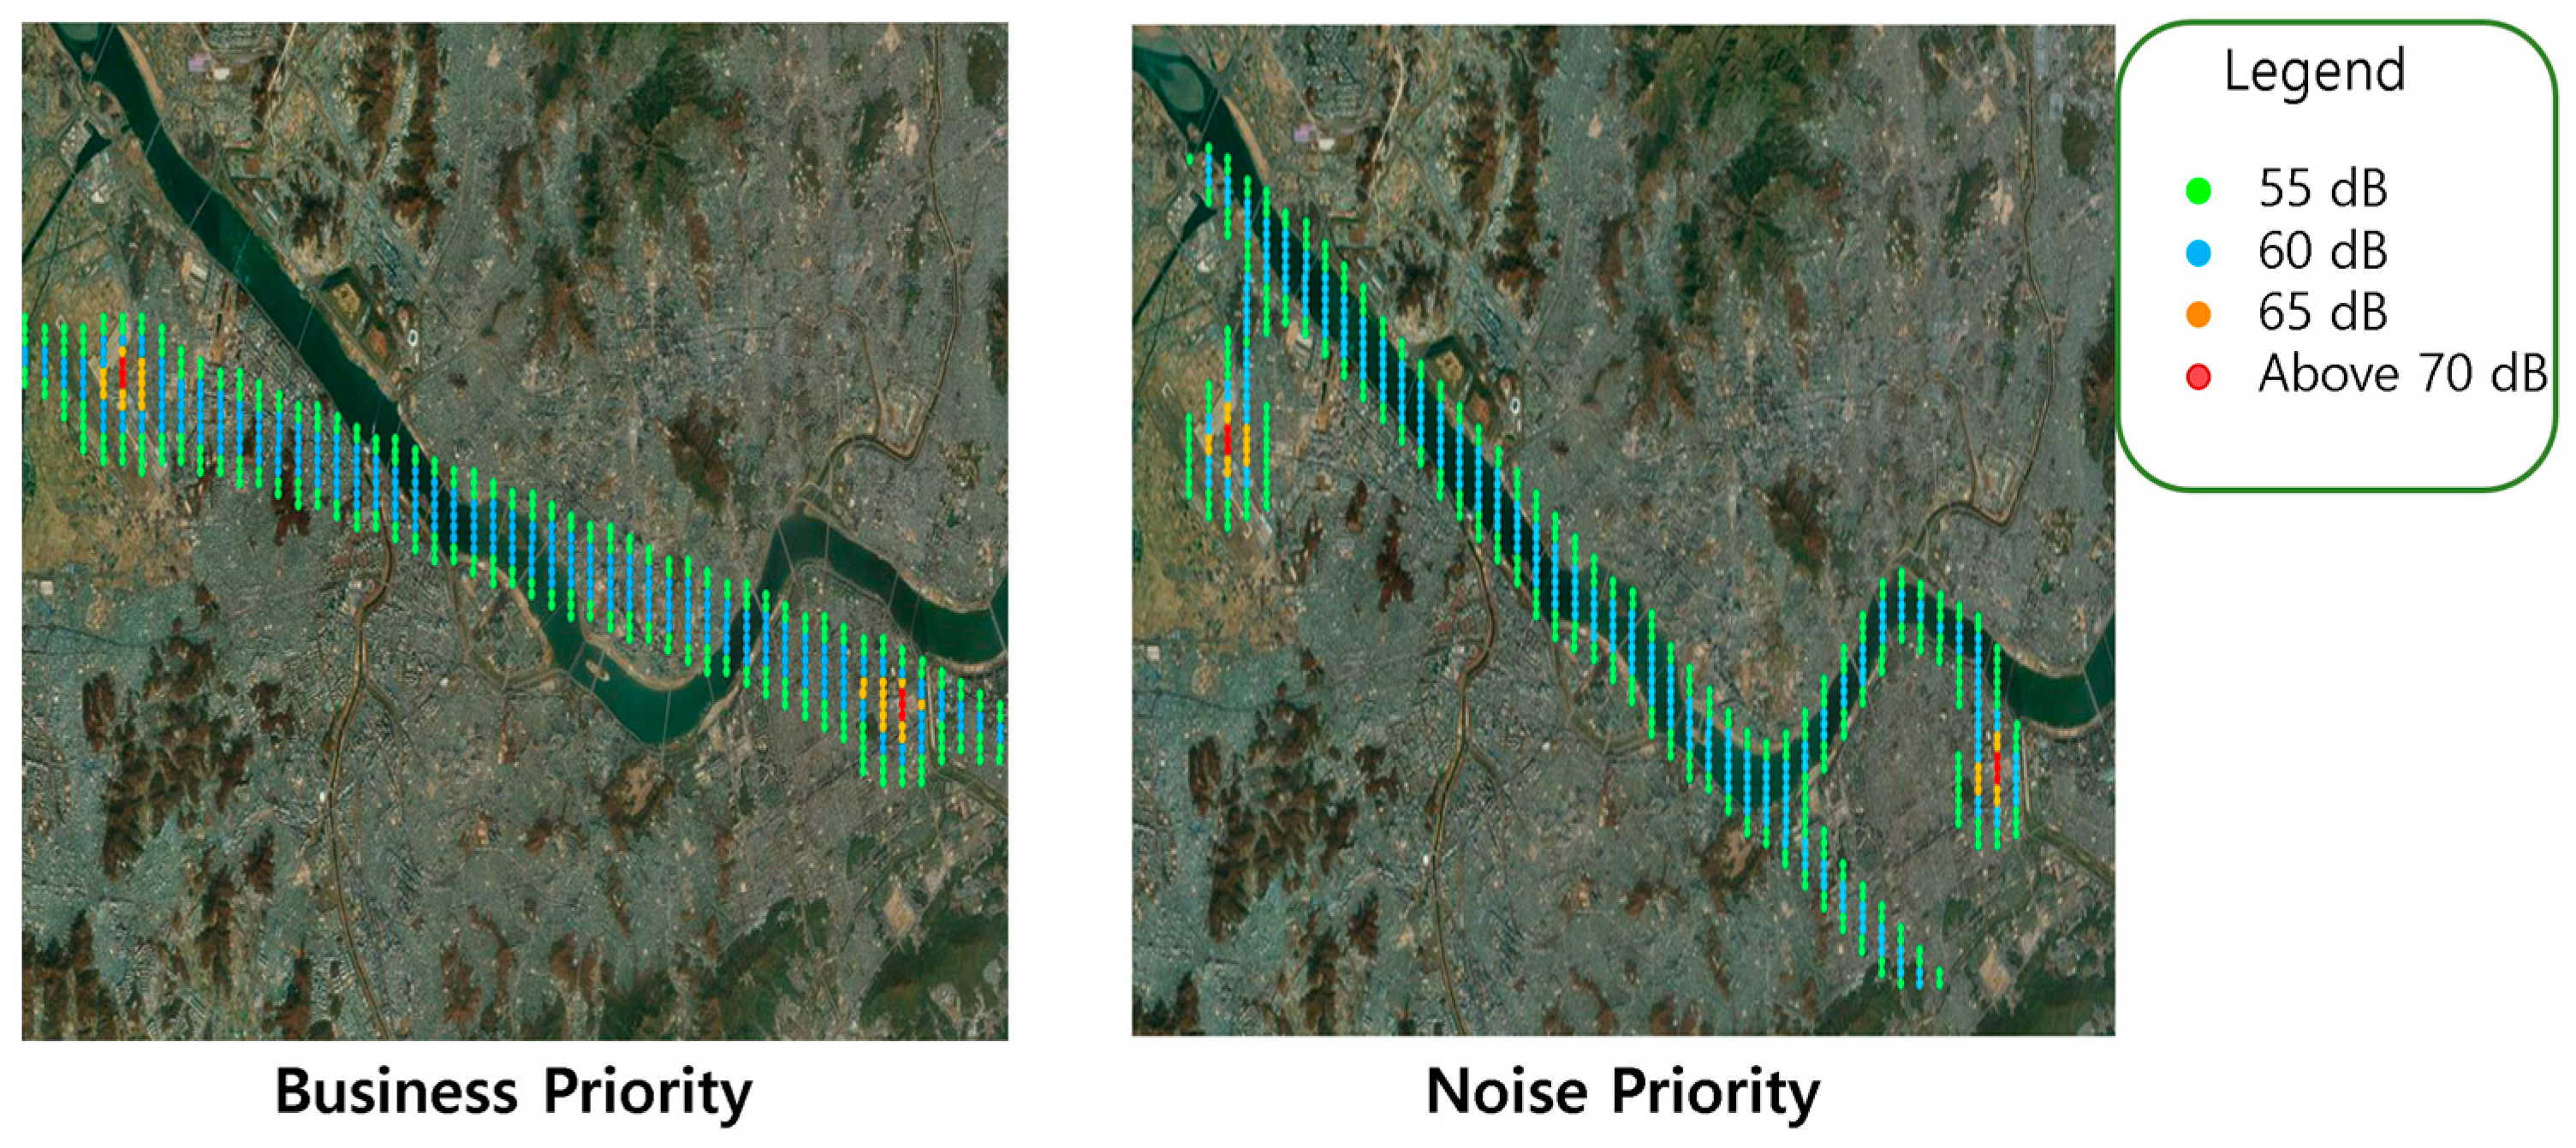
A noise priority scenario is a scenario in which most of the paths are set to fly along the least populated area to reduce their impact on noise as much as possible. On the other hand, a business priority scenario is a scenario that heads to a destination at the shortest distance, ignoring the impact of noise. In the case of a single, straight-line business priority scenario, it is also necessary to run a step-by-step flight through the node, as is the case with the noise priority scenario in the practice analysis.
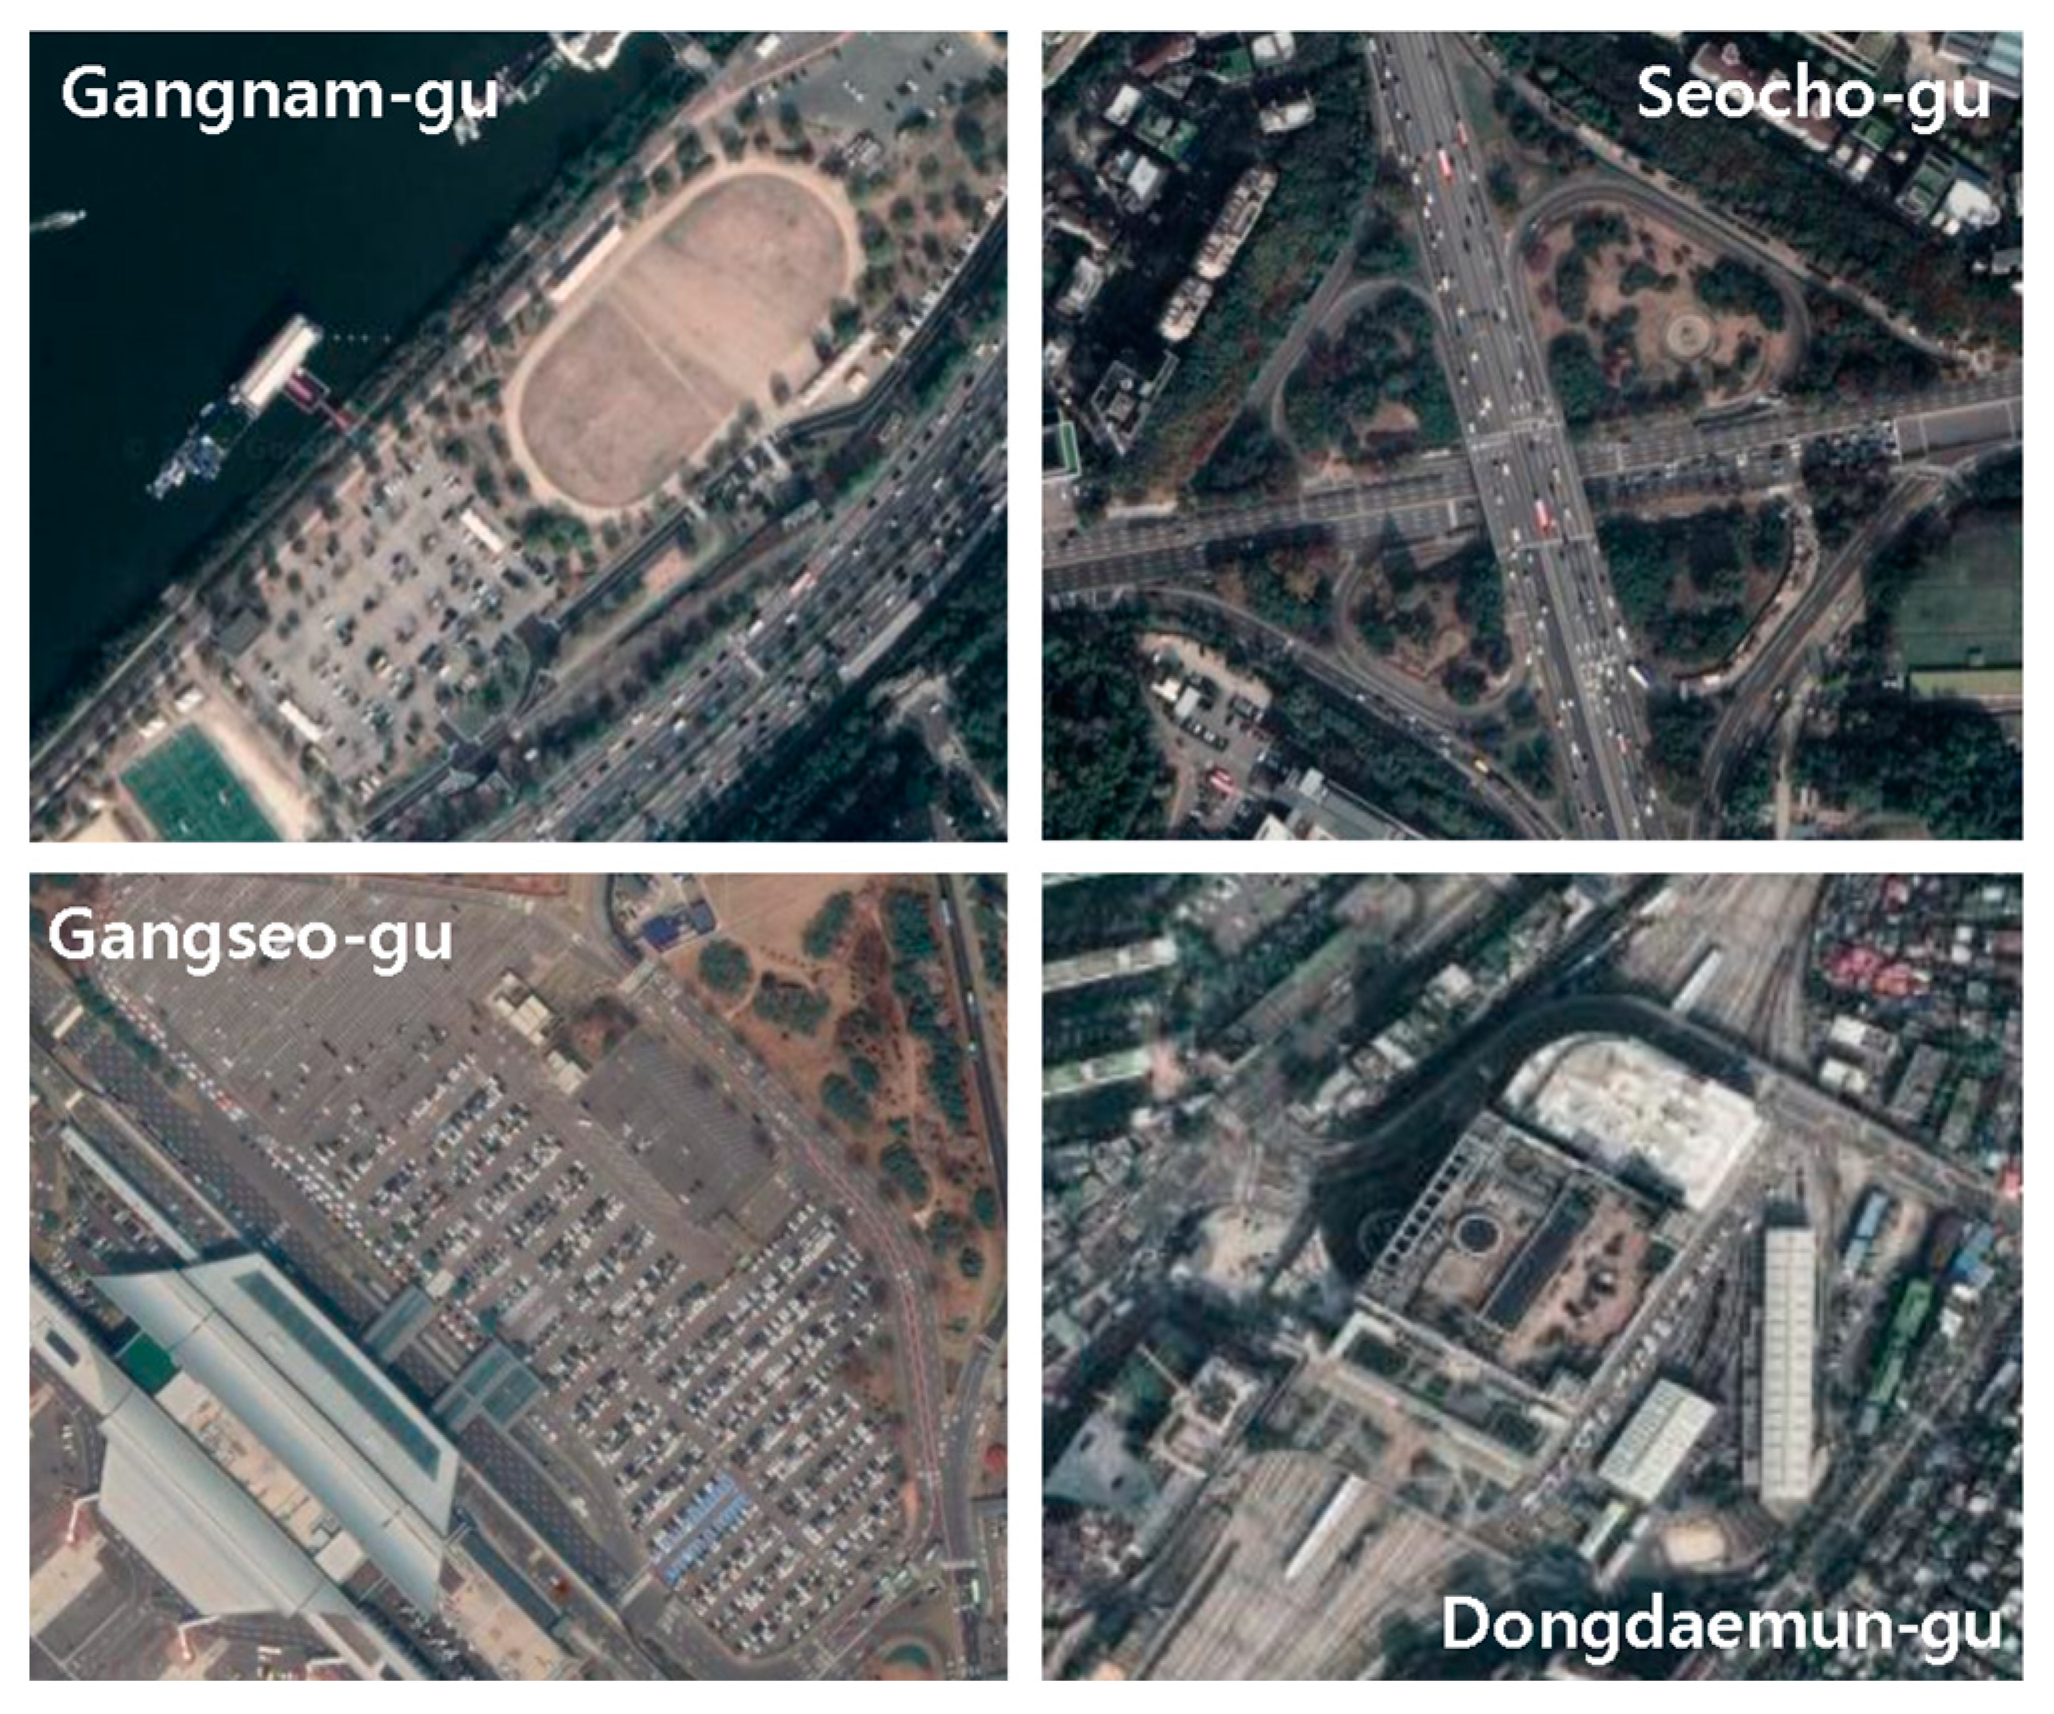
The two scenarios are applied to the routes of COEX in Gangnam-gu from Gimpo Airport on the AEDT among the locations of vertiports selected above, as shown in
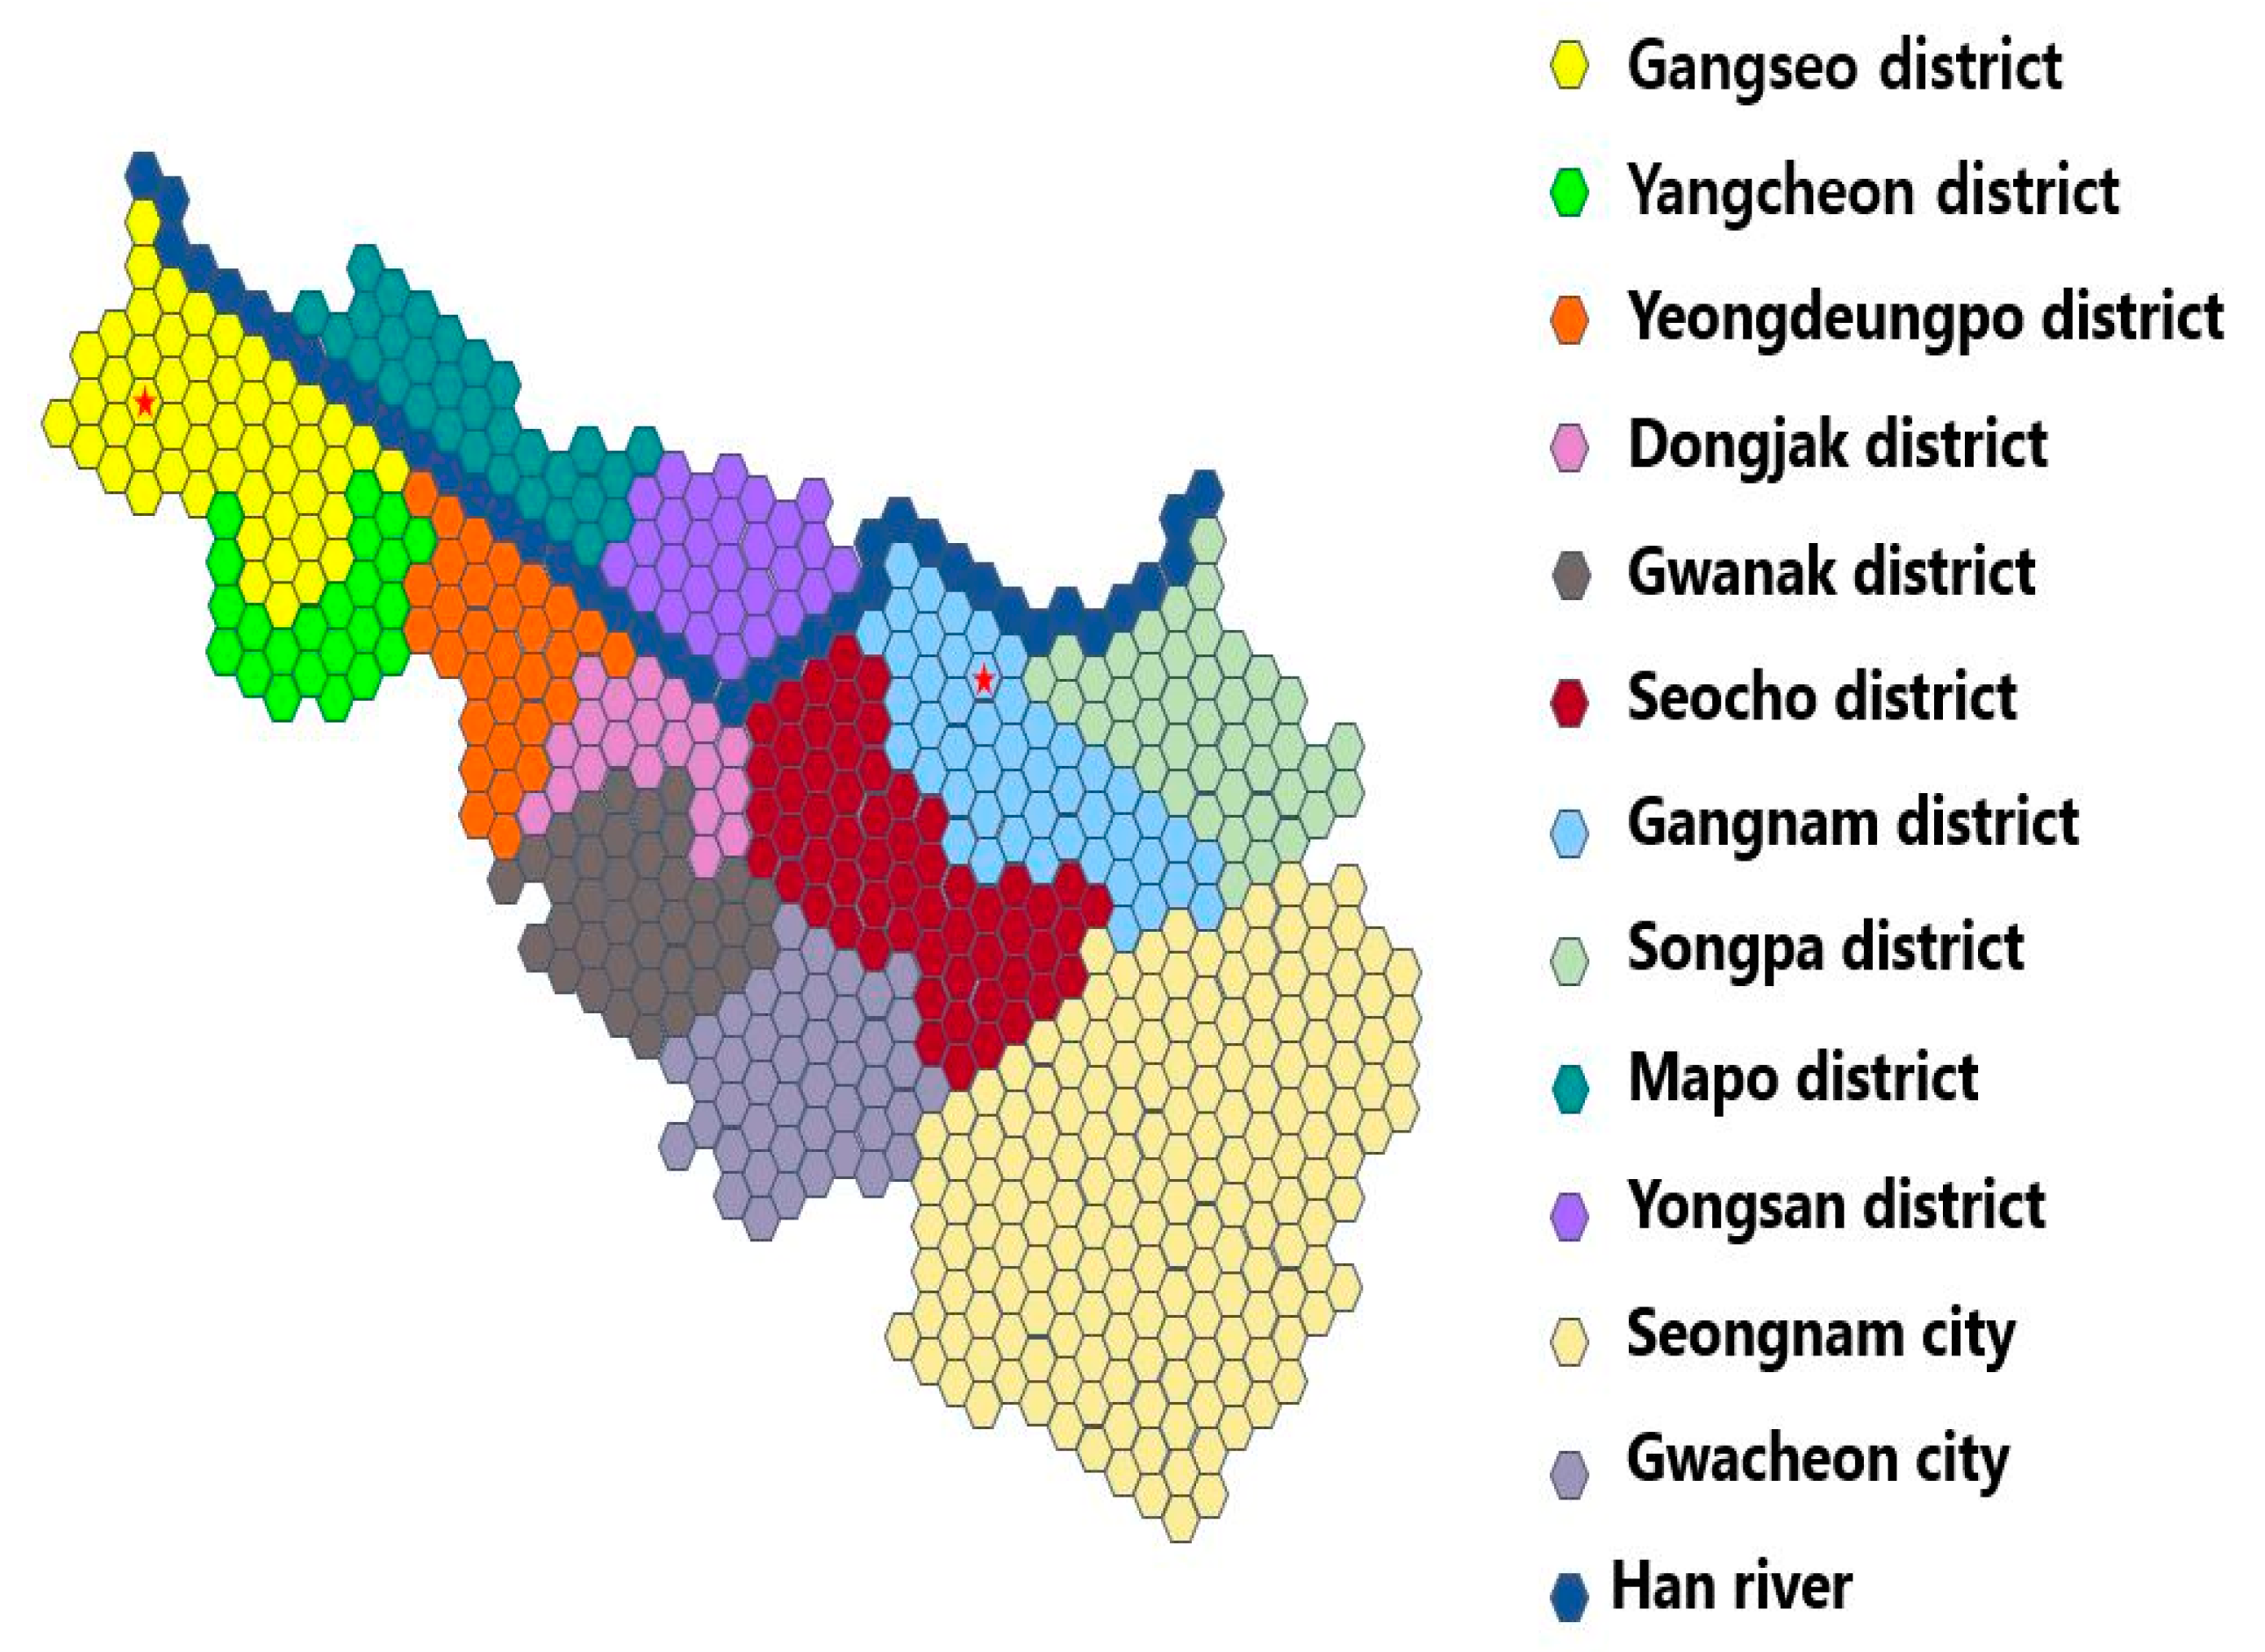
Figure 12. Administrative districts to be included in the districts affected by noise expected from the two routes are Gangseo-gu, Yangcheon-gu, Yeongdeungpo-gu, Dongjak-gu, Seocho-gu, Gangnam-gu, Songpa-gu, Gwanak-gu, Mapo-gu, and Yongsan-gu in Seoul, and Gwacheon-si and Seongnam-si in Gyeonggi-do. Thus, reconstructing each administrative district in the same way as
Figure 10 is shown in
Figure 13, and
Table 7 represents the characteristics of the reconstructed virtual space.
Table 7 shows that the average error rate of the actual area and the virtual space area in each zone is 1.1%, and the maximum error rate is 2.7% of Gwanak-gu; thus, it is situated well.
3.4. Selection of Operating Models
When eVTOL is commercialized, it will operate simultaneously, and the noise may be a superimposed form of noise from multiple vehicles operating together. Therefore, it is considered desirable to obtain noise by inputting the vehicles into the AEDT software so that it is repeatedly operated. However, the eVTOL developer did not provide the data, so in this paper, helicopters, which are currently in operation, were selected as noise operation models.
The helicopters operating for civilian use and market demand in the United States [
13] presented in the 2015 FAA Civil Aircraft Registry Database are as shown in
Table 8. For this study, analysis was conducted using only a 3–5 seat helicopter type to match the SA-1, a five-seat eVTOL under development by Hyundai Motors.
Meanwhile, the target noise of many eVTOL manufacturers is 62 to 63 dB. Therefore, the number of operations was adjusted after fixing it at 06:00–20:00, which includes commuting time, to implement the target noise on the AEDT. The noise map was constructed by increasing the number of operations by 100 from 200 to 500, and there was no significant difference in the take-off and landing sections; however, in the cruise section, 300–500 helicopters included 65 dB-70 dB noise, and 200 helicopters included 60 dB-65 dB, which is the main noise level. Therefore, the number of R44 operations in the AEDT was designated as 200, and the target noise was adjusted to 60–65 dB on cruise.
3.5. Noise Analysis
3.5.1. Measurement of Noise around the Path Using AEDT
The noise maps for the two scenarios shown in the AEDT software are the same as
Figure 14. In order to perform noise analysis according to the route, eVTOL operating hours were set at 06:00 to 20:00, including rush hour, and noise analysis was conducted by applying R44, a five-seat helicopter, for that time.
In the AEDT software, the grid method was selected for the receptor setting, for which the noise map is configured in the range. Since the path is from west to east, a total of 10,000 receptors were placed on the path: 100 from the X-axis and 100 from the Y-axis, based on latitude 37.48 and longitude 126.64. The interval between receptors was set to 0.31 nautical miles for the X-axis and 0.1 nautical miles for the Y-axis.
According to the FAA, 60 dB is the typical noise at the urban level, over 65 dB is the noise outside the critical noise-exposure level, and 55 dB is the quiet noise at the suburban level. Therefore, since this paper aims to analyze noise for eVTOL to operate in urban areas, noise below 55 dB was been considered. In addition, the analysis excludes receptors arising from out-of-path sections where the department line and arrival line are not exactly in line when a path is made via AEDT.
3.5.2. Predicting the Effect of Measured Noise on Population
To determine the number of people affected by noise, population data distributed in each hexagon were obtained. The population data were assumed by the number of people living in each administrative district minus the number of people moving to another administrative district for commuting at working time.
Table 9 represents the distribution of the number of residents in each hexagon based on population data provided by the Ministry of the Interior and Safety and Statistics Korea.
Figure 15 shows the overlapped image of the noise map obtained through AEDT and the administrative districts in the Seoul metropolitan area composed of hexagons.
Table 10 represents the number of hexagons through which receptors pass each administrative district from the results in
Figure 15. The results above 65 dB are the same for both paths since both occur on vertical take-off and landing. In other words, the effect of noise depends on the cruise section in which 60 dB receptors are distributed. Therefore, from the results in
Table 10, the population residing in the 60 dB to 65 dB range was multiplied by the noise-exposure ratio in the Miedema curve [
22], and the number of people affected by high levels of noise in each scenario is shown in
Table 11.
As a result, the number of people affected by noise decreased by about 76.9% in a noise priority scenario compared to in a business priority scenario.
4. Results
In this paper, the locations of vertiports, which is the infrastructure necessary to apply urban air mobility (UAM), which has not yet been commercialized in the Seoul metropolitan area, were selected and evaluated, and AEDT software was used to establish UAM routes. A noise priority scenario was then applied based on population distribution.
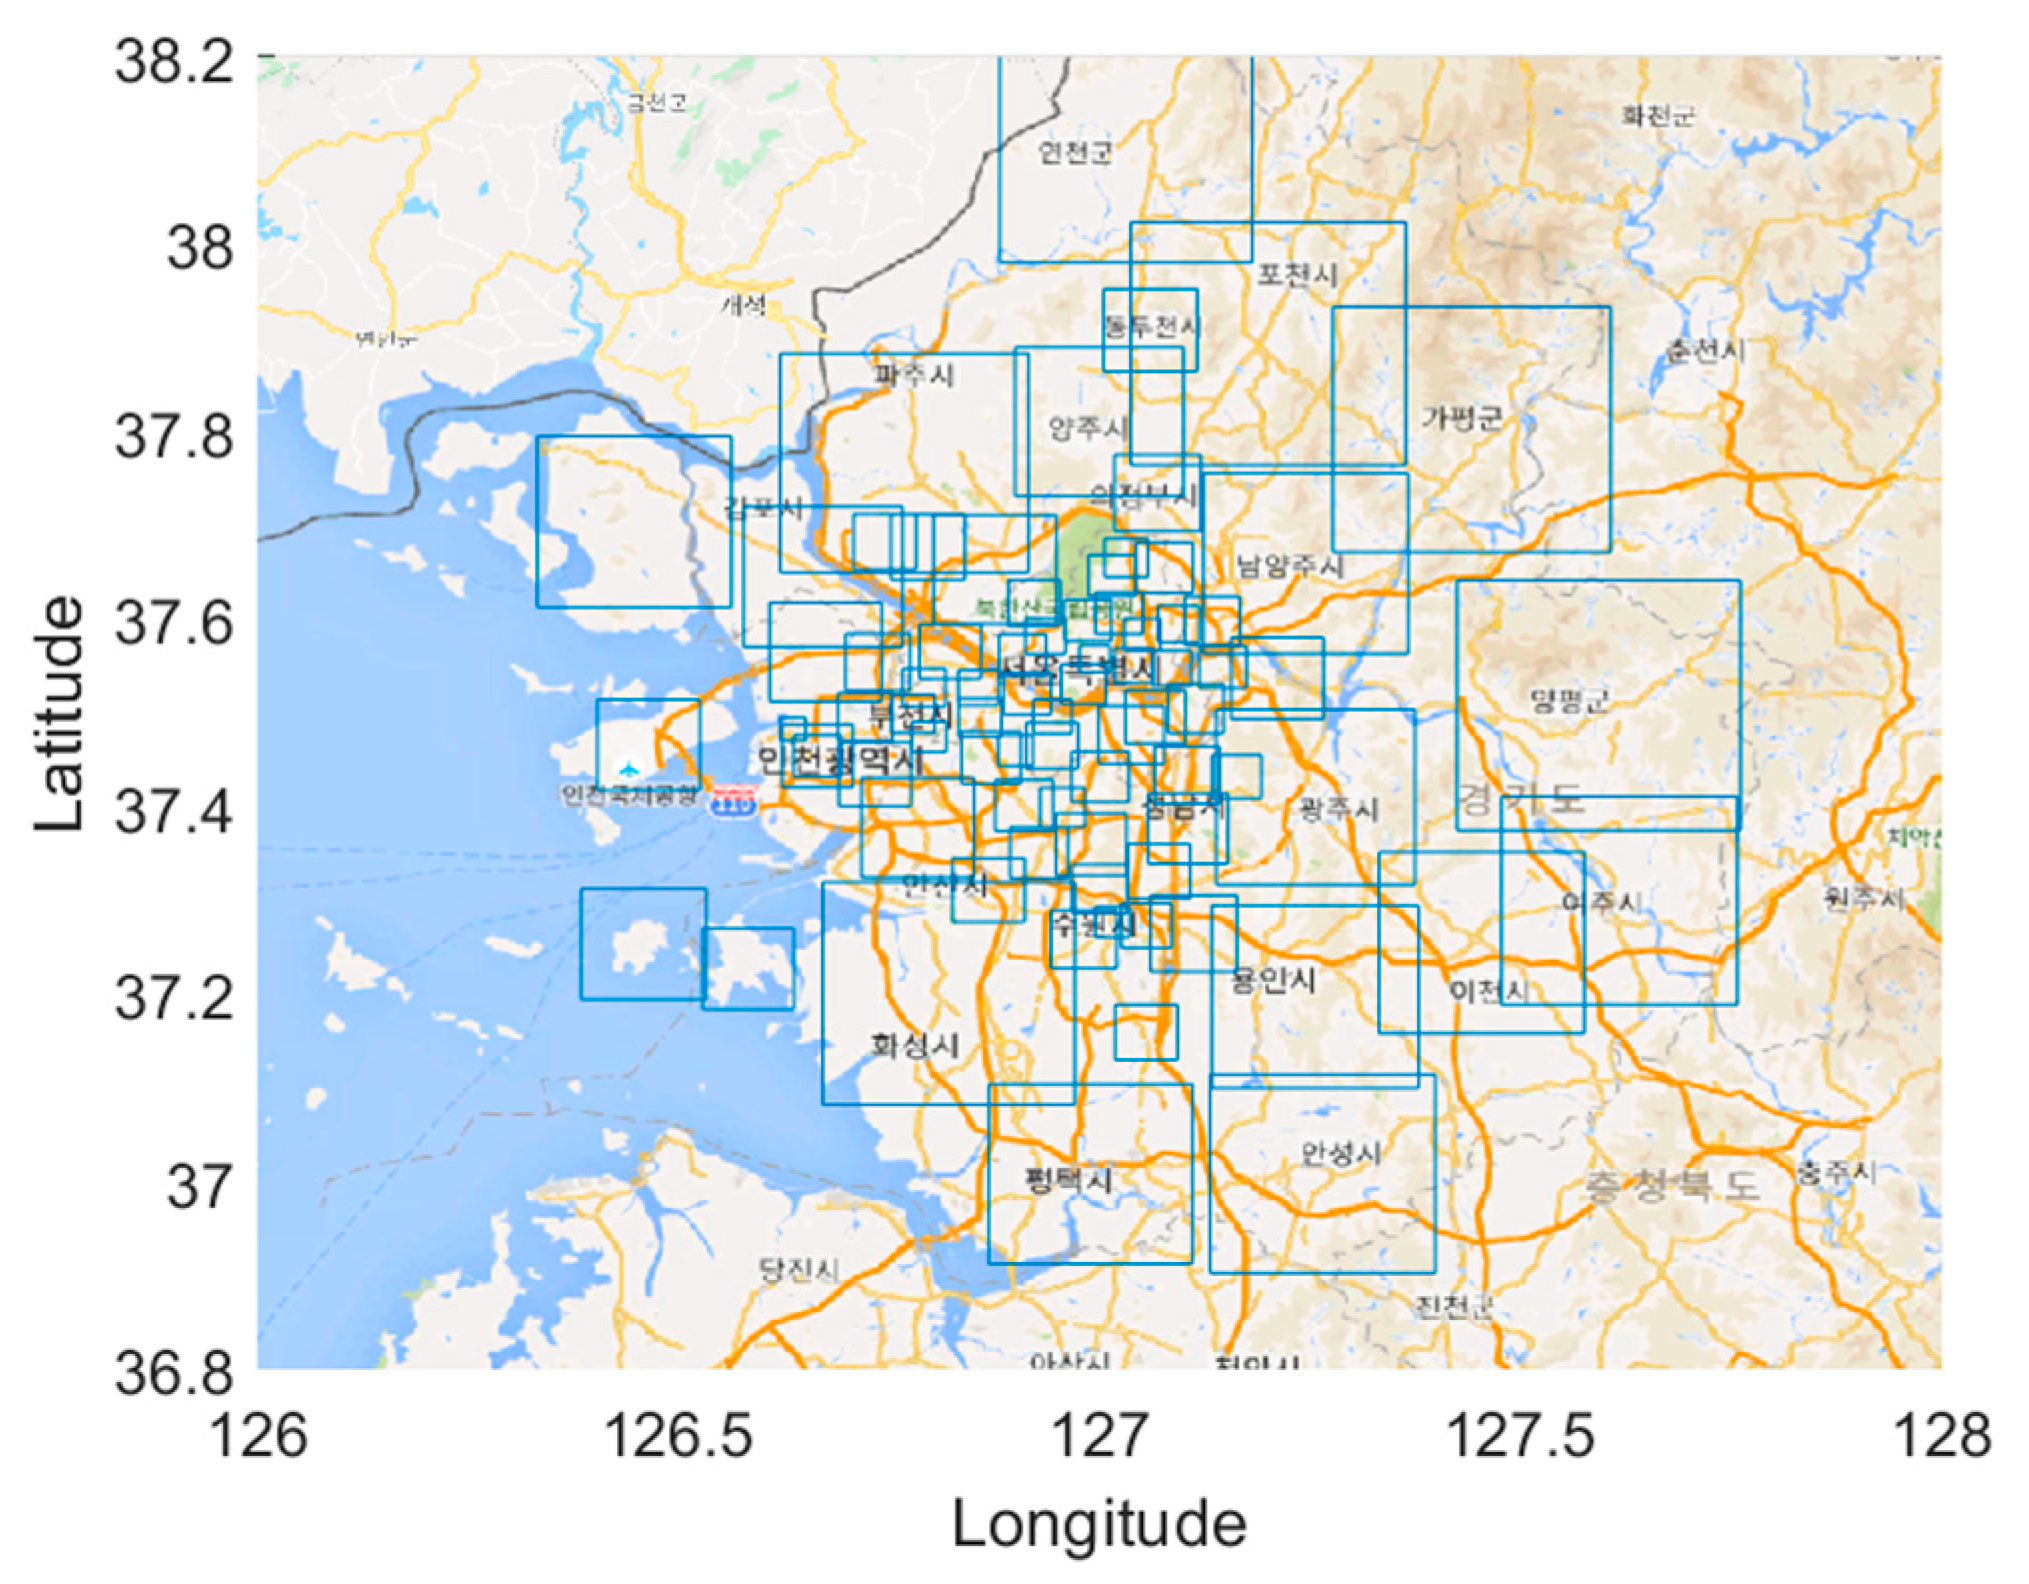
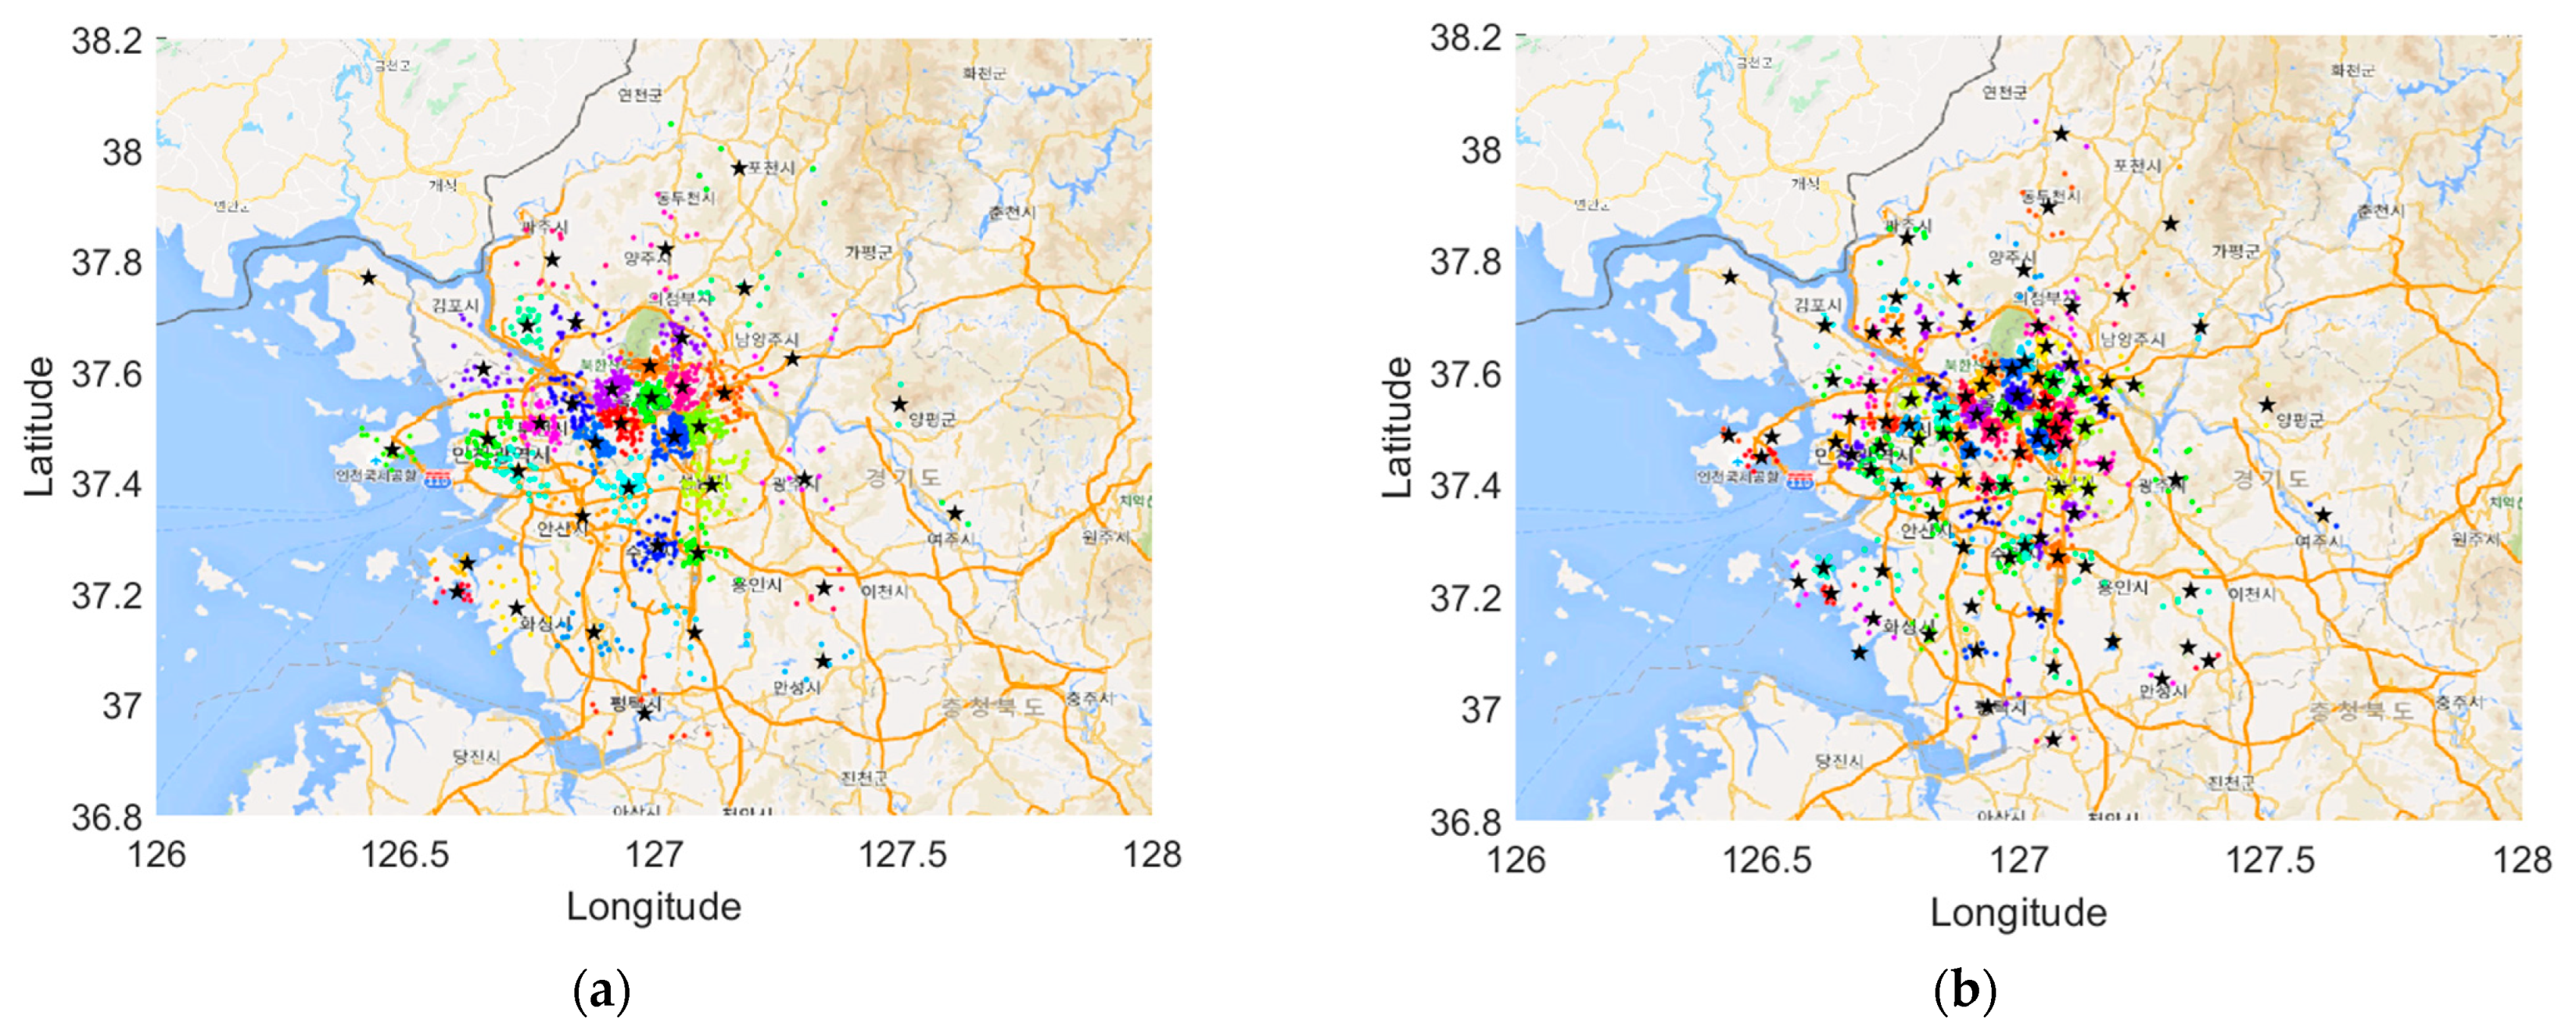
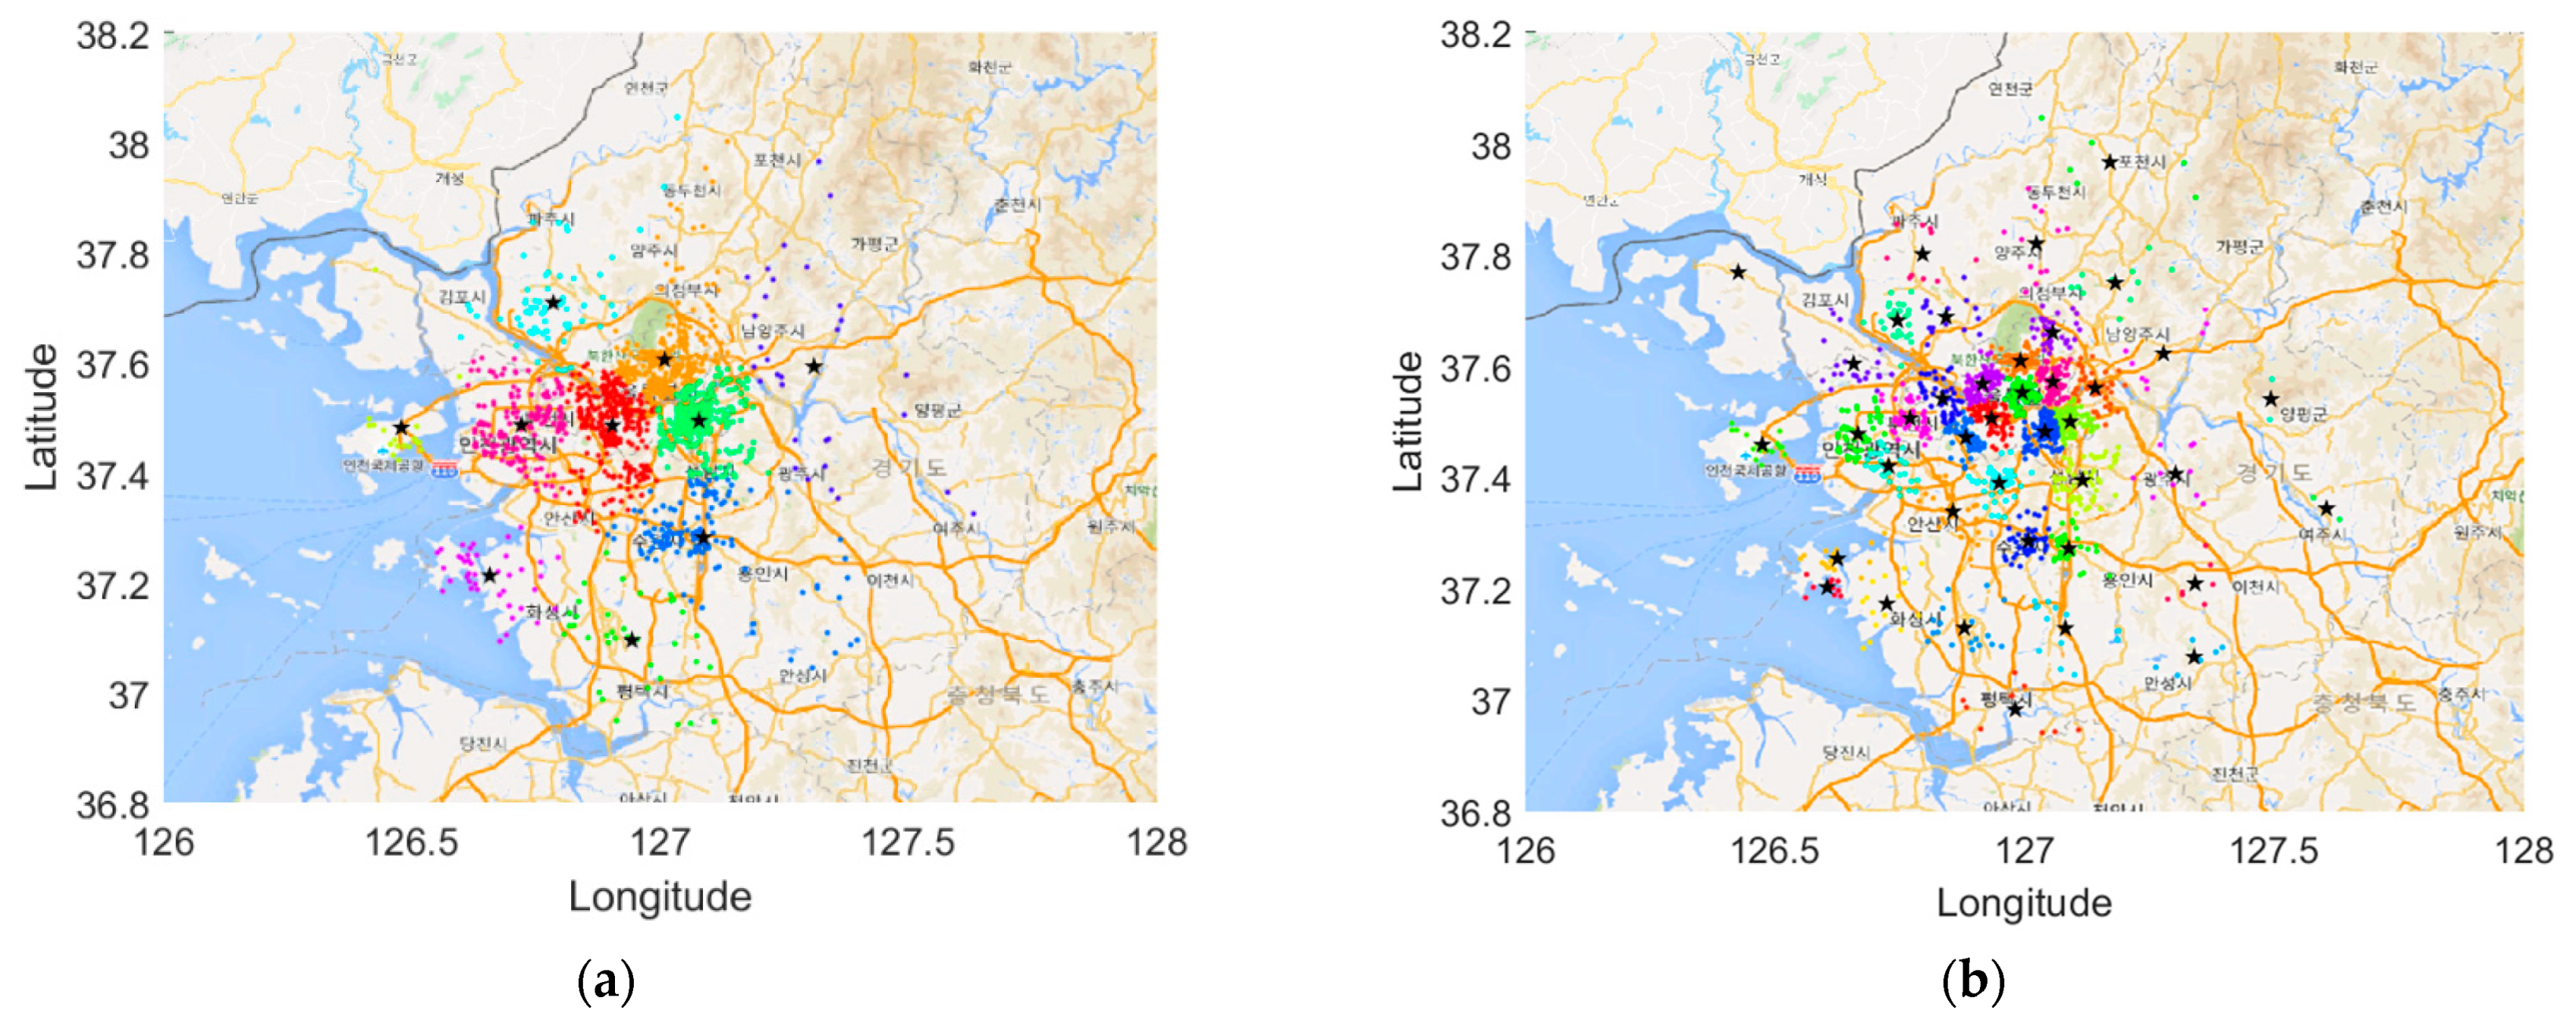
To accomplish this, data from the Statistics Korea’s commuting population survey by residents/commuters were collected, and MATLAB was used to show it on the map. The data were clustered using the K-means algorithm to obtain 40 and 100 locations suitable for vertiports. However, if it is impossible to install a vertiport due to mountain, sea, or residential areas, the repositioning process was deemed necessary, and through this process, the final vertiport was selected. While performing the repositioning process in the Seoul metropolitan area, it was difficult to select the locations of the vertiports because most areas are residential areas. However, the locations of the vertiports were selected by utilizing such areas as Han River Park, Highway IC, and the rooftop of the parking lot building suggested by Uber. It was also determined that a helipad, located on the rooftop of a skyscraper, could serve as a vertiport. In addition, the noise priority scenario shows a 76.9% decrease in the number of people affected by high levels of noise compared to the business priority scenario, which is a simple straight path. In Korea, mountainous areas, airports, and military facilities are concentrated in a narrow land area, so there are many restricted areas for flights; therefore, the development of UAM routes and noise analysis are essential rather than straight lines from the origin to the destination.
The demand data used in this paper are the number of commuters provided by Statistics Korea. This was collected through the census and has excellent accuracy. However, it was difficult to express data in large administrative districts, such as Pocheon-si and Hwaseong-si in Gyeonggi-do, or in an administrative district that is divided into two, such as Ansan-si, because information was only given on the administrative districts and the specific origin and destination locations are unknown. However, since a satellite map was used to select the origin and destination of the most likely candidate sites for the location repositioning process, it is expected to be highly utilized as a final vertiport. For this study, the locations of the vertiports were selected using only the number of commuters, but if UAM is commercialized, it is believed that moving for leisure and tourism will also account for a large portion. Therefore, it is necessary to analyze mobility with various purposes and select the locations of the vertiports.
Considering the lack of data provided by eVTOL developers, the noise analysis process used helicopters as models and was conducted by distributing residents evenly by administrative districts without using more precise data about the residential area. Therefore, it is believed that a better result would be achieved if the path is created using real eVTOL noise data and more detailed population data, applying the exact area affected by real noise using spatial information rather than just the number of hexagons containing receptors. In addition, noise analysis due to changes in operating altitude and payload is required.
On the other hand, for UAM to operate across all administrative districts, noise priority routes must be considered where there is no terrain to reduce noise, such as rivers. For example, for two noise priority scenarios, the scenario that passes through administrative districts with a larger population distribution per hexagon than the other will result in an increase in the population exposed to noise, which will have minimal effect on reducing noise impact.
Therefore, it is necessary to build an optimized path by analyzing the factors affecting various noise priority scenarios, and these studies are believed to contribute to the early commercialization of UAM.


