
Effects of Air Route Alternation and Display Design on an Operator’s Situation Awareness, Task Performance and Mental Workload in Simulated Flight Tasks


Abstract
:Featured Application
Abstract
1. Introduction
2. Materials and Methods
2.1. Participants
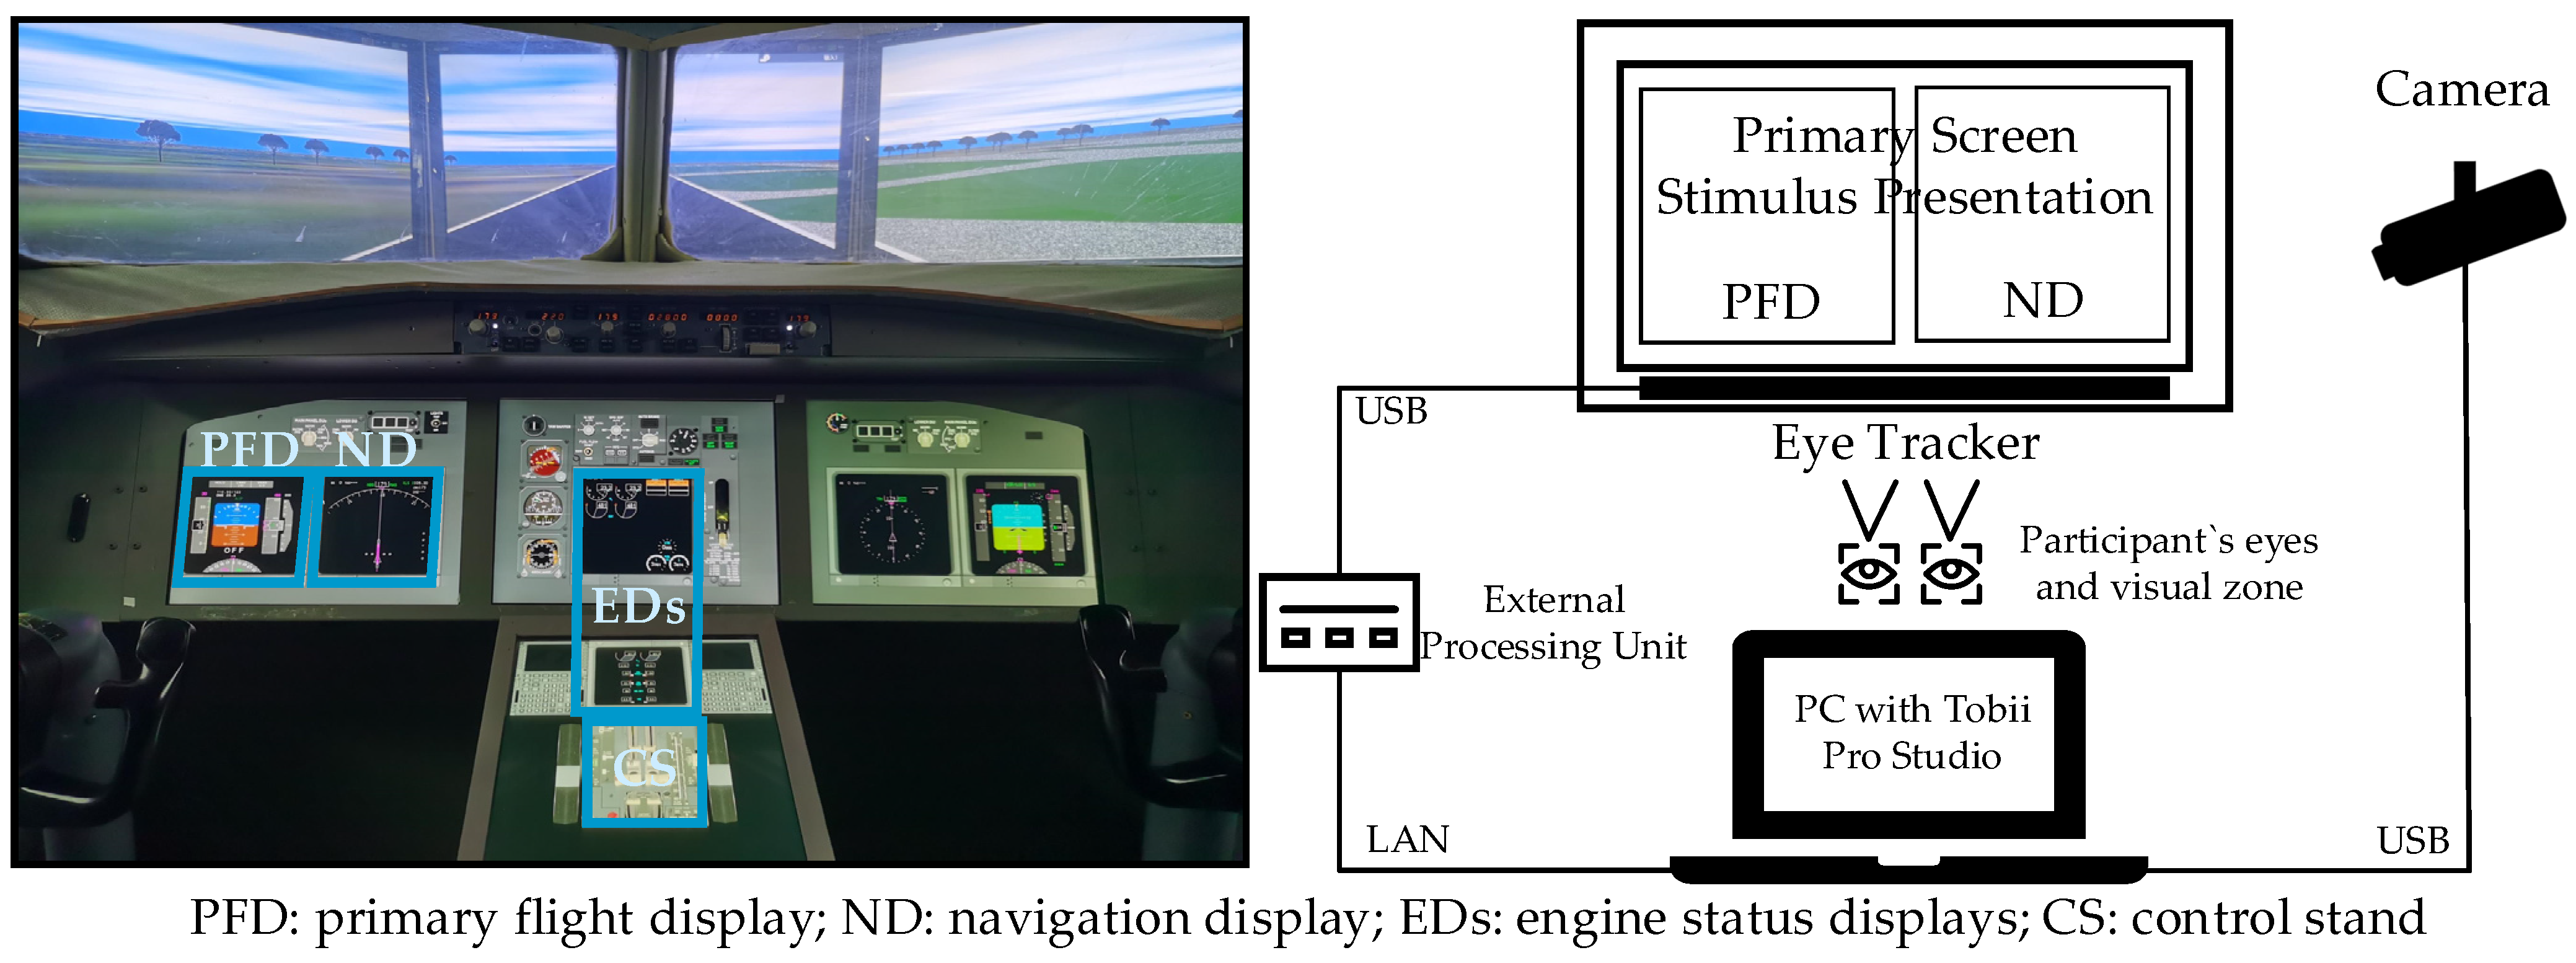
2.2. Apparatus
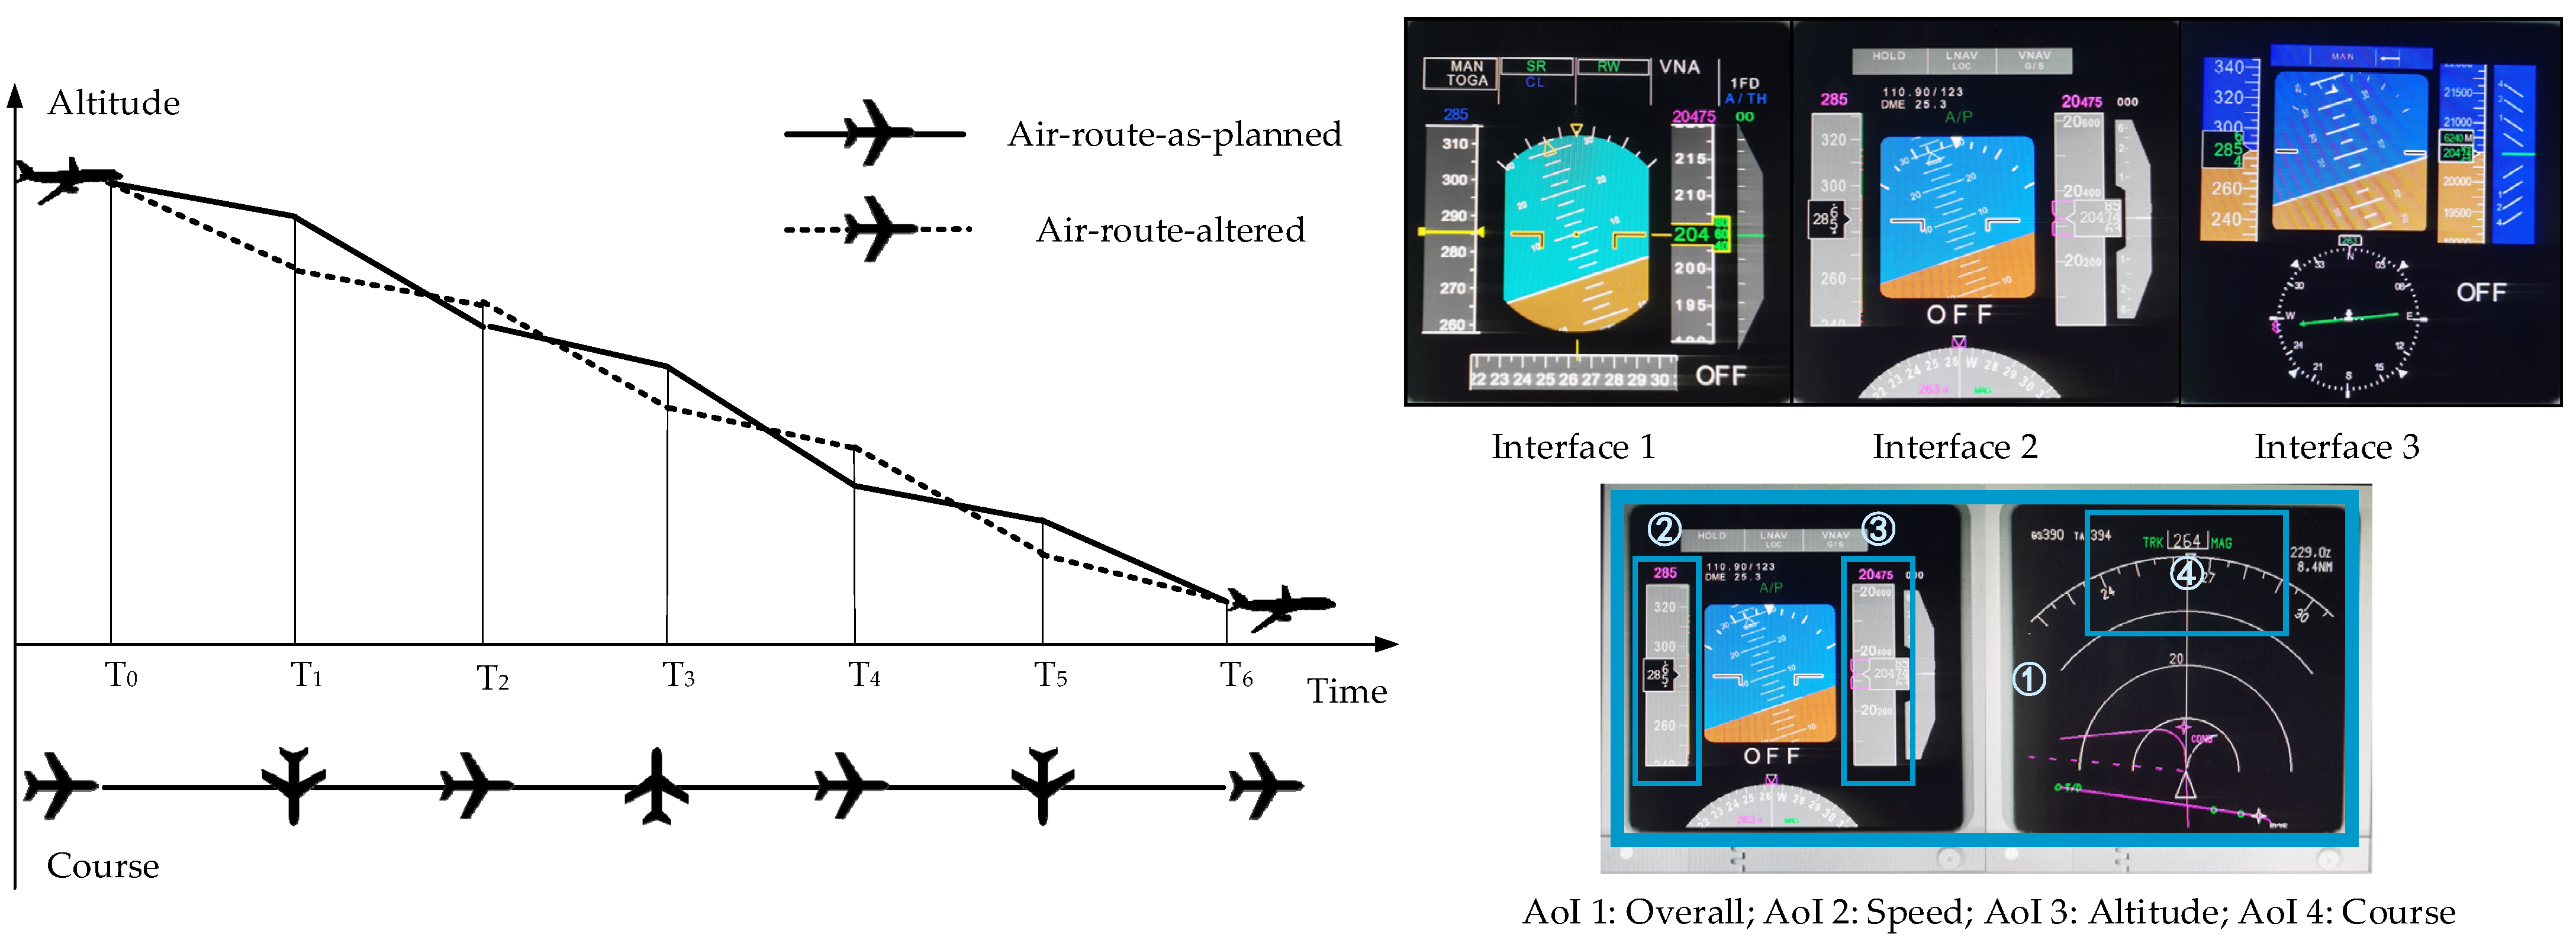
2.3. Experimental Design
2.4. Measurement
2.5. Tasks and Prodcedures
2.6. Data Analysis
3. Results
3.1. Subjective Scales
3.2. Behavioral Performance
3.3. Eye Movement
4. Discussion
4.1. Effects of Air Route Alternation
4.2. Effects of Display Design
4.3. Limitations and Future Works
5. Conclusions
Author Contributions
Funding
Informed Consent Statement
Conflicts of Interest
References
- Endsley, M.R.; Sollenberger, R.; Stein, E. Situation awareness: A comparison of measures. In Proceedings of the Human Performance, Situation Awareness and Automation: User-Centered Design for the New Millennium, Savannah, GA, USA, 16–19 October 2000. [Google Scholar]
- Stanton, N.A.; Salmon, P.M.; Walker, G.H.; Salas, E.; Hancock, P.A. State-of-science: Situation awareness in individuals, teams and systems. Ergonomics 2017, 60, 449–466. [Google Scholar] [CrossRef]
- Flin, R.H.; O’connor, P.; Crichton, M. Safety at the Sharp End: A Guide to Non-Technical Skills; Ashgate: Farnham, UK, 2008. [Google Scholar]
- Sætrevik, B.; Hystad, S.W. Situation awareness as a determinant for unsafe actions and subjective risk assessment on offshore attendant vessels. Saf. Sci. 2017, 93, 214–221. [Google Scholar] [CrossRef] [Green Version]
- Stanton, N.A.; Chambers, P.R.G.; Piggott, J. Situational awareness and safety. Saf. Sci. 2001, 39, 189–204. [Google Scholar] [CrossRef] [Green Version]
- Endsley, M.R. Errors in situation assessment: Implications for system design. In Human Error and System Design and Management; Springer: Cham, Switzerland, 2000; pp. 15–26. [Google Scholar]
- Vanderhaegen, F.; Wolff, M.; Mollard, R. Non-conscious errors in the control of dynamic events synchronized with heartbeats: A new challenge for human reliability study. Saf. Sci. 2020, 129, 11. [Google Scholar] [CrossRef]
- Golestani, N.; Abbassi, R.; Garaniya, V.; Asadnia, M.; Khan, F.I. Human reliability assessment for complex physical operations in harsh operating conditions. Process Saf. Environ. Prot. 2020, 140, 1–13. [Google Scholar] [CrossRef]
- Cak, S.; Say, B.; Misirlisoy, M. Effects of working memory, attention, and expertise on pilots’ situation awareness. Cogn. Technol. Work 2020, 22, 85–94. [Google Scholar] [CrossRef]
- Salmon, P.M.; Walker, G.H.; Stanton, N.A. Pilot error versus sociotechnical systems failure: A distributed situation awareness analysis of Air France 447. Theor. Issues Ergon. Sci. 2016, 17, 64–79. [Google Scholar] [CrossRef]
- David, L.Z.; Schraagen, J.M. Analysing communication dynamics at the transaction level: The case of Air France Flight 447. Cogn. Technol. Work 2018, 20, 637–649. [Google Scholar] [CrossRef] [Green Version]
- Papadimitriou, E.; Schneider, C.; Tello, J.A.; Damen, W.; Vrouenraets, M.L.; Ten Broeke, A. Transport safety and human factors in the era of automation: What can transport modes learn from each other? Accid. Anal. Prev. 2020, 144, 105656. [Google Scholar] [CrossRef]
- Hai, V.P.; Moore, P. Emergency service provision using a novel hybrid som-spiral stc model for group decision support under dynamic uncertainty. Appl. Sci. 2019, 9, 3910. [Google Scholar]
- Fertier, A.; Barthe-Delanoë, A.-M.; Montarnal, A.; Truptil, S.; Bénaben, F. A new emergency decision support system: The automatic interpretation and contextualisation of events to model a crisis situation in real-time. Decis. Support Syst. 2020, 133, 113260. [Google Scholar] [CrossRef]
- Seppänen, H.; Mäkelä, J.; Luokkala, P.; Virrantaus, K. Developing shared situational awareness for emergency management. Saf. Sci. 2013, 55, 1–9. [Google Scholar] [CrossRef]
- Minotra, D.; Mcneese, M.D. Predictive aids can lead to sustained attention decrements in the detection of non-routine critical events in event monitoring. Cogn. Technol. Work 2017, 19, 161–177. [Google Scholar] [CrossRef]
- Asmayawati, S.; Nixon, J. Modelling and supporting flight crew decision-making during aircraft engine malfunctions: Developing design recommendations from cognitive work analysis. Appl. Ergon. 2020, 82, 12. [Google Scholar] [CrossRef]
- Baethge, A.; Rigotti, T. Interruptions to air route: Their relationship with irritation and satisfaction with performance, and the mediating roles of time pressure and mental demands. Work Stress 2013, 27, 43–63. [Google Scholar] [CrossRef]
- Lee, J.; Marla, L.; Jacquillat, A. Dynamic Disruption Management in Airline Networks Under Airport Operating Uncertainty. Transp. Sci. 2020, 54, 973–997. [Google Scholar]
- Weigl, M.; Catchpole, K.; Wehler, M.; Schneider, A. Air route disruptions and provider situation awareness in acute care: An observational study with emergency department physicians and nurses. Appl. Ergon. 2020, 88, 9. [Google Scholar] [CrossRef]
- Bukowski, J.H.; Richards, J.R. Commercial Airline In-Flight Emergency: Medical Student Response and Review of Medicolegal Issues. J. Emerg. Med. 2016, 50, 74–78. [Google Scholar] [CrossRef] [PubMed]
- Martin-Gill, C.; Doyle, T.J.; Yealy, D.M. In-Flight Medical Emergencies A Review. JAMA J. Am. Med. Assoc. 2018, 320, 2580–2590. [Google Scholar] [CrossRef] [PubMed] [Green Version]
- De Caprariis, P.J.; De Caprariis-Salerno, A.; Lyon, C. Healthcare Professionals and In-Flight Medical Emergencies: Resources, Responsibilities, Goals, and Legalities as a Good Samaritan. South. Med. J. 2019, 112, 60–65. [Google Scholar] [CrossRef]
- Pritchett, A.R.; Ockerman, J.J. Supporting mixed-initiative emergency flight planning by portraying procedure context information. Cogn. Technol. Work 2016, 18, 643–655. [Google Scholar] [CrossRef]
- Sene, A.; Kamsu-Foguem, B.; Rumeau, P. Decision support system for in-flight emergency events. Cogn. Technol. Work 2018, 20, 245–266. [Google Scholar] [CrossRef] [Green Version]
- Young, M.S.; Brookhuis, K.A.; Wickens, C.D.; Hancock, P.A. State of science: Mental workload in ergonomics. Ergonomics 2015, 58, 1–17. [Google Scholar] [CrossRef]
- Ackerman, R.K. Army intelligence digitizes situational awareness. Signal 2005, 59, 23. [Google Scholar]
- Wei, H.; Zhuang, D.; Wanyan, X.; Wang, Q. An experimental analysis of situation awareness for cockpit display interface evaluation based on flight simulation. Chin. J. Aeronaut. 2013, 26, 884–889. [Google Scholar] [CrossRef] [Green Version]
- Zhang, X.; Qu, X.; Xue, H.; Tao, D.; Li, T. Effects of time of day and taxi route complexity on navigation errors: An experimental study. Accid. Anal. Prev. 2019, 125, 14–19. [Google Scholar] [CrossRef] [PubMed]
- Nadj, M.; Maedche, A. Situation Awareness in Aircraft Ground Handling: The Impact of Auditory and Visual Notification Cues. J. Cogn. Eng. Decis. Mak. 2019, 13, 102–122. [Google Scholar] [CrossRef]
- Stanton, N.A.; Stewart, R.; Harris, D.; Houghton, R.J. Distributed situation awareness in dynamic systems: Theoretical development and application of an ergonomics methodology. Ergonomics 2006, 49, 1288–1311. [Google Scholar] [CrossRef] [Green Version]
- Burns, C.M.; Skraaning, G.; Jamieson, G.A.; Lau, N.K.C. Evaluation of Ecological Interface Design for Nuclear Process Control: Situation Awareness Effects. Hum. Factors 2008, 50, 663–679. [Google Scholar] [CrossRef]
- Wickens, C.D. Situation Awareness: Review of Mica Endsley’s 1995 Articles on Situation Awareness Theory and Measurement. Hum. Factors 2008, 50, 397–403. [Google Scholar] [CrossRef]
- Endsley, M.R. Designing for Situation Awareness: An Approach to User-Centered Design; CRC Press: Boca Raton, FL, USA, 2016. [Google Scholar]
- Bolstad, C.; Costello, A.; Endsley, M. Bad situation Awareness Designs: What Went Wrong and Why. In Proceedings of the International Ergonomics Association (IEA) 16th World Congress, Maastricht, The Netherlands, 7 July 2006. [Google Scholar]
- Lurie, N.H.; Mason, C.H. Visual Representation: Implications for Decision Making. J. Mark. 2007, 71, 160–177. [Google Scholar] [CrossRef]
- Endsley, M.R.; Connors, E.S. Situation awareness: State of the art. In Proceedings of the 2008 IEEE Power and Energy Society General Meeting—Conversion and Delivery of Electrical Energy in the 21st Century, Pittsburgh, PA, USA, 20–24 July 2008; pp. 1–4. [Google Scholar]
- Schneiders, C.; Vanzetta, J.; Verstege, J.F. Enhancement of situation awareness in wide area transmission systems for electricity and visualization of the global system state. In Proceedings of the 2012 3rd IEEE PES Innovative Smart Grid Technologies Europe (ISGT Europe), Berlin, Germany, 14–17 October 2012; pp. 1–9. [Google Scholar]
- Naderpour, M.; Lu, J. A Human Situation Awareness Support System to Avoid Technological Disasters. Decis. Aid Model. Disaster Manag. Emerg. 2013, 307–325. [Google Scholar] [CrossRef] [Green Version]
- Ackerman, K.A.; Talleur, D.A.; Carbonari, R.S.; Xargay, E.; Seefeldt, B.D.; Kirlik, A.; Hovakimyan, N.; Trujillo, A.C. Automation Situation Awareness Display for a Flight Envelope Protection System. J. Guid. Control Dyn. 2017, 40, 964–980. [Google Scholar] [CrossRef]
- Deng, L.; Wang, G.; Yu, S. Layout Design of Human-Machine Interaction Interface of Cabin Based on Cognitive Ergonomics and GA-ACA. Comput. Intell. Neurosci. 2016, 2016, 1032139. [Google Scholar] [CrossRef] [Green Version]
- Chen, Y.; Gao, Q.; Song, F.; Li, Z.; Wang, Y. Procedure and information displays in advanced nuclear control rooms: Experimental evaluation of an integrated design. Ergonomics 2017, 60, 1158–1172. [Google Scholar] [CrossRef] [PubMed]
- Foulsham, T.; Cheng, J.T.; Tracy, J.L.; Henrich, J.; Kingstone, A. Gaze allocation in a dynamic situation: Effects of social status and speaking. Cognition 2010, 117, 319–331. [Google Scholar] [CrossRef] [PubMed] [Green Version]
- Behrend, J.; Dehais, F. How role assignment impacts decision-making in high-risk environments: Evidence from eye-tracking in aviation. Saf. Sci. 2020, 127, 104738. [Google Scholar] [CrossRef]
- Lu, Y.Y.; Zheng, Y.Y.; Wang, Z.; Fu, S. Pilots’ Visual Scanning Behaviors During an Instrument Landing System Approach. Aerosp. Med. Hum. Perform. 2020, 91, 511–517. [Google Scholar] [CrossRef]
- Lounis, C.; Peysakhovich, V.; Causse, M. Flight Eye Tracking Assistant (FETA): Proof of Concept. In Advances in Human Factors of Transportation, Proceedings of the AHFE 2019 International Conference on Human Factors in Transportation, Washington, DC, USA, 24–28 July 2019; Springer: Cham, Switzerland, 2020; pp. 739–751. [Google Scholar]
- Wanyan, X.R.; Zhuang, D.M.; Wei, H.Y.; Song, J. Pilot attention allocation model based on fuzzy theory. Comput. Math. Appl. 2011, 62, 2727–2735. [Google Scholar] [CrossRef] [Green Version]
- She, M.; Li, Z.; Ma, L. User-defined information sharing for team situation awareness and teamwork. Ergonomics 2019, 62, 1098–1112. [Google Scholar] [CrossRef]
- Sherry, L.; Donnelly, O.S. Design of a Display for Alerting Cockpit Automation Function Configuration Changes. In Proceedings of the 2019 Integrated Communications, Navigation and Surveillance Conference (ICNS), Herndon, VA, USA, 9–11 April 2019. [Google Scholar]
- Zahabi, M.; Kaber, D. Effect of police mobile computer terminal interface design on officer driving distraction—ScienceDirect. Appl. Ergon. 2018, 67, 26–38. [Google Scholar] [CrossRef] [PubMed]
- Mosaly, P.R.; Adams, R.; Tracton, G.; Dooley, J.; Adapa, K.; Nuamah, J.K.; Marks, L.B.; Mazur, L.M. Impact of Workspace Design on Radiation Therapist Technicians’ Physical Stressors, Mental Workload, Situation Awareness and Performance. Pract. Radiat. Oncol. 2021, 11, e3–e10. [Google Scholar] [CrossRef] [PubMed]
- Argyle, E.M.; Gourley, J.J.; Kang, Z.; Shehab, R.L. Investigating the relationship between eye movements and situation awareness in weather forecasting. Appl. Ergon. 2020, 85, 103071. [Google Scholar] [CrossRef]
- Kirkwood, M. Designing for Situation Awareness in the Main Control Room of a Small Modular Reactor. Proc. Hum. Factors Ergon. Soc. Ann. Meet. 2019, 63, 2185–2189. [Google Scholar] [CrossRef]
- Wanyan, X.; Zhuang, D.; Lin, Y.; Xiao, X.; Song, J.-W. Influence of mental workload on detecting information varieties revealed by mismatch negativity during flight simulation. Int. J. Ind. Ergon. 2018, 64, 1–7. [Google Scholar] [CrossRef]
- Lu, T.J.; Lou, Z.S.; Shao, F.; You, M. Attention allocation in pilots based on climbing and circling mission behavior. Psychol. Res. 2021, 85, 1136–1145. [Google Scholar] [CrossRef]
- Taylor, R.M. Situational awareness rating technique (SART): The development of a tool for aircrew systems design. In Situational Awareness; Routledge: London, UK, 2017; pp. 111–128. [Google Scholar]
- Endsley, M.R. A Systematic Review and Meta-Analysis of Direct Objective Measures of Situation Awareness: A Comparison of SAGAT and SPAM. Hum. Factors 2019, 63, 124–150. [Google Scholar] [CrossRef]
- Jeannot, E. Situation Awareness Synthesis and Literature Search (EEC Note No. 16/00); Eurocontrol Experimental Centre: Bretigny-sur-Orge, France, 2000. [Google Scholar]
- Friedrich, M.; Biermann, M.; Gontar, P.; Biella, M.; Bengler, K. The influence of task load on situation awareness and control strategy in the ATC tower environment. Cogn. Technol. Work 2018, 20, 205–217. [Google Scholar] [CrossRef]
- Salmon, P.M.; Stanton, N.A.; Walker, G.H.; Jenkins, D.; Ladva, D.; Rafferty, L.; Young, M. Measuring Situation Awareness in complex systems: Comparison of measures study. Int. J. Ind. Ergon. 2009, 39, 490–500. [Google Scholar] [CrossRef]
- Wei, Z.; Zhuang, D.; Wanyan, X.; Liu, C.; Zhuang, H. A model for discrimination and prediction of mental workload of aircraft cockpit display interface. Chin. J. Aeronaut. 2014, 27, 1070–1077. [Google Scholar] [CrossRef] [Green Version]
- Li, G.F.; Wang, Y.; Zhu, F.P.; Sui, X.; Wang, N.; Qu, X.; Green, P. Drivers’ visual scanning behavior at signalized and unsignalized intersections: A naturalistic driving study in China. J. Saf. Res. 2019, 71, 219–229. [Google Scholar] [CrossRef]
- Nadj, M.; Maedche, A.; Schieder, C. The effect of interactive analytical dashboard features on situation awareness and task performance. Decis. Support Syst. 2020, 135, 13. [Google Scholar] [CrossRef] [PubMed]
- Van Doorn, E.; Horvath, I.; Rusak, Z. Effects of coherent, integrated, and context-dependent adaptable user interfaces on operators’ situation awareness, performance, and workload. Cogn. Technol. Work 2020. [Google Scholar] [CrossRef]
- Van Der Kleij, R.; Hueting, T.; Schraagen, J.M. Change detection support for supervisory controllers of highly automated systems: Effects on performance, mental workload, and recovery of situation awareness following interruptions. Int. J. Ind. Ergon. 2018, 66, 75–84. [Google Scholar] [CrossRef] [Green Version]
- Wickens, C.D. Display Formatting and Situation Awareness Model (DFSAM): An Approach to Aviation Display Design; Aviation Human Factors Division: Moffat Field, CA, USA, 2005. [Google Scholar]
- Lau, N.; Jamieson, G.A.; Skraaning, G., Jr. Empirical evaluation of the Process Overview Measure for assessing situation awareness in process plants. Ergonomics 2016, 59, 393–408. [Google Scholar] [CrossRef]
- Li, W.C.; Zakarija, M.; Yu, C.S.; McCarty, P. Interface design on cabin pressurization system affecting pilot’s situation awareness: The comparison between digital displays and pointed displays. Hum. Factors Ergon. Manuf. Serv. Ind. 2019, 30, 103–113. [Google Scholar] [CrossRef]
- Morando, A.; Victor, T.; Dozza, M. A Reference Model for Driver Attention in Automation: Glance Behavior Changes During Lateral and Longitudinal Assistance. IEEE Trans. Intell. Transp. Syst. 2019, 20, 2999–3009. [Google Scholar] [CrossRef] [Green Version]
- Zhang, L.; Zhuang, D.M.; Wanyan, X.R. Information Coding for Cockpit Human-machine Interface. Chin. J. Mech. Eng. 2011, 24, 707–712. [Google Scholar] [CrossRef]
- Durso, F.T.; Hackworth, C.A.; Truitt, T.R.; Crutchfield, J.; Nikolić, D. Situation awareness as a predictor of performance for en route air traffic controllers. Air Traffic Control Q. 1998, 6, 1–20. [Google Scholar] [CrossRef]
- Almeida, L.; Menezes, P.; Dias, J.M. Interface transparency issues in teleoperation. Appl. Sci. 2020, 10, 6232. [Google Scholar] [CrossRef]


| Air Route Alternation | Display Design | Interaction | ||||||||
|---|---|---|---|---|---|---|---|---|---|---|
| As Planned | Altered | p-Value | ES | Interface 1 | Interface 2 | Interface 3 | p-Value | ES | p-Value | |
| 3D-SART (-) | ||||||||||
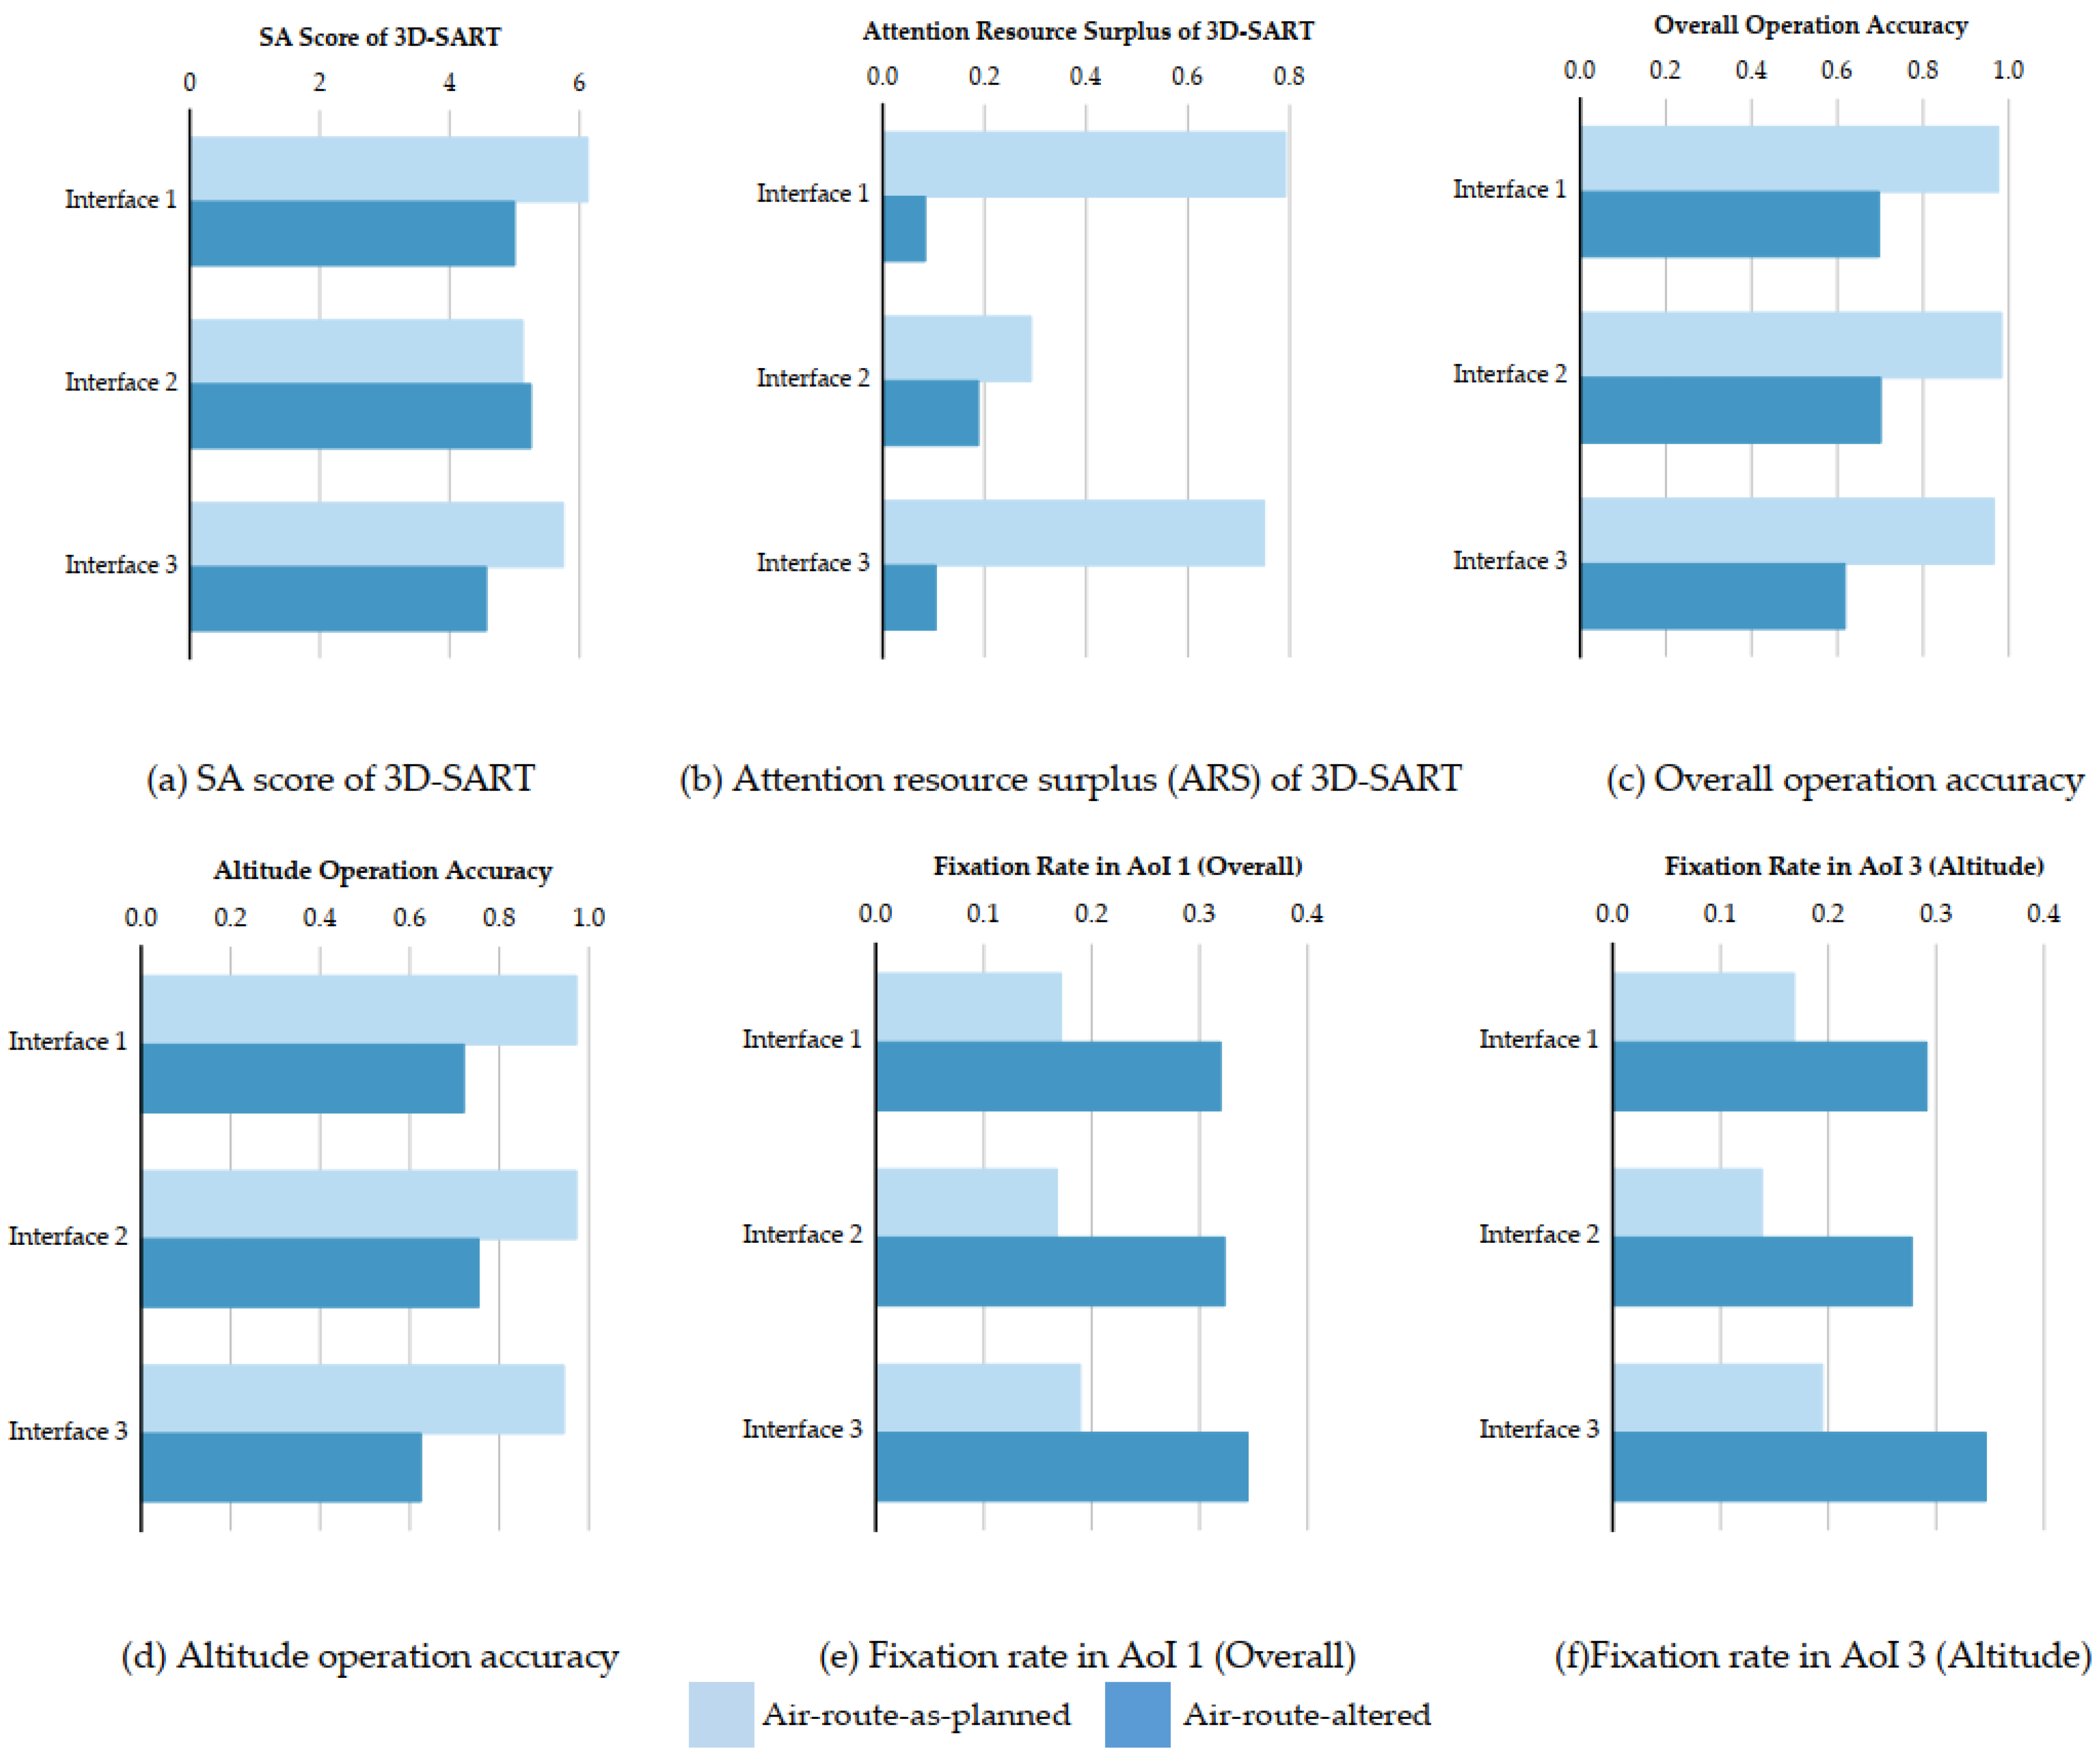
| SA score | 5.677 (0.370) | 4.938 (0.322) | 0.018 | 0.222 | 5.563 (0.312) | 5.188 (0.346) | 5.156 (0.344) | 0.065 | 0.112 | 0.031 * |
| ARS | 0.611 (0.206) | 0.125 (0.211) | 0.004 * | 0.312 | 0.438 (0.208) | 0.240 (0.208) | 0.427 (0.239) | 0.447 | 0.034 | 0.139 |
| NASA-TLX (-) | ||||||||||
| Workload | 10.787 (0.589) | 12.676 (0.535) | <0.001 ** | 0.428 | 11.827 (0.552) | 11.948 (0.545) | 11.419 (0.656) | 0.529 | 0.027 | 0.380 |
| Air Route Alternation | Display Design | Interaction | ||||||||
|---|---|---|---|---|---|---|---|---|---|---|
| As Planned | Altered | p-Value | ES | Interface 1 | Interface 2 | Interface 3 | p-Value | ES | p-Value | |
| SPAM | ||||||||||
| RA (-) | 0.958 (0.015) | 0.873 (0.020) | 00.002 * | 0.349 | 0.896 (0.022) | 0.938 (0.017) | 0.915 (0.020) | 0.290 | 0.052 | 0.279 |
| RT (ms) | 2275 (182) | 2269 (156) | 0.971 | 0.000 | 2554 (267) | 2793 (104) | 2168 (195) | 0.123 | 0.099 | 0.031 * |
| Operation Accuracy (-) | ||||||||||
| Overall | 0.975 (0.008) | 0.672 (0.019) | <0.001 ** | 0.881 | 0.836 (0.013) | 0.842 (0.010) | 0.791 (0.017) | 0.013 * | 0.171 | 0.125 |
| Altitude | 0.963 (0.017) | 0.700 (0.044) | <0.001 ** | 0.526 | 0.847 (0.026) | 0.863 (0.027) | 0.785 (0.024) | 0.014 * | 0.195 | 0.138 |
| Speed | 0.972 (0.028) | 0.694 (0.028) | <0.001 ** | 0.645 | 0.843 (0.029) | 0.860 (0.018) | 0.797 (0.031) | 0.186 | 0.070 | 0.331 |
| Course | 10.000 (0.000) | 0.825 (0.031) | <0.001 ** | 0.585 | 0.914 (0.021) | 0.929 (0.023) | 0.896 (0.020) | 0.450 | 0.034 | 0.450 |
| AoIs | Air Route Alternation | Display Design | Interaction | |||||||
|---|---|---|---|---|---|---|---|---|---|---|
| As Planned | Altered | p-Value | ES | Interface 1 | Interface 2 | Interface 3 | p-Value | ES | p-Value | |
| Fixation rate (-) | ||||||||||
| Overall | 0.180 (0.020) | 0.339 (0.034) | <0.001 ** | 0.893 | 0.246 (0.031) | 0.260 (0.027) | 0.273 (0.030) | 0.371 | 0.073 | 0.736 |
| Altitude | 0.168 (0.018) | 0.307 (0.030) | <0.001 ** | 0.904 | 0.231 (0.025) | 0.210 (0.023) | 0.271 (0.031) | 0.014 * | 0.279 | 0.360 |
| Speed | 0.160 (0.021) | 0.297 (0.031) | <0.001 ** | 0.883 | 0.207 (0.031) | 0.216 (0.028) | 0.217 (0.037) | 0.258 | 0.099 | 0.306 |
| Course | 0.152 (0.017) | 0.251 (0.031) | 0.001 * | 0.640 | 0.184 (0.026) | 0.207 (0.021) | 0.213 (0.023) | 0.060 | 0.226 | 0.026 * |
| Average pupil diameter (mm) | ||||||||||
| 40.300 (0.109) | 40.529 (0.113) | <0.001 ** | 0.593 | 40.432 (0.108) | 40.502 (0.112) | 40.309(0.113) | <0.001 ** | 0.424 | 0.830 | |
Publisher’s Note: MDPI stays neutral with regard to jurisdictional claims in published maps and institutional affiliations. |
© 2021 by the authors. Licensee MDPI, Basel, Switzerland. This article is an open access article distributed under the terms and conditions of the Creative Commons Attribution (CC BY) license (https://creativecommons.org/licenses/by/4.0/).
Share and Cite
Chen, H.; Pang, L.; Wanyan, X.; Liu, S.; Fang, Y.; Tao, D. Effects of Air Route Alternation and Display Design on an Operator’s Situation Awareness, Task Performance and Mental Workload in Simulated Flight Tasks. Appl. Sci. 2021, 11, 5745. https://0-doi-org.brum.beds.ac.uk/10.3390/app11125745
Chen H, Pang L, Wanyan X, Liu S, Fang Y, Tao D. Effects of Air Route Alternation and Display Design on an Operator’s Situation Awareness, Task Performance and Mental Workload in Simulated Flight Tasks. Applied Sciences. 2021; 11(12):5745. https://0-doi-org.brum.beds.ac.uk/10.3390/app11125745
Chicago/Turabian StyleChen, Hao, Liping Pang, Xiaoru Wanyan, Shuang Liu, Yufeng Fang, and Da Tao. 2021. "Effects of Air Route Alternation and Display Design on an Operator’s Situation Awareness, Task Performance and Mental Workload in Simulated Flight Tasks" Applied Sciences 11, no. 12: 5745. https://0-doi-org.brum.beds.ac.uk/10.3390/app11125745