Article

Rapid Analysis of Chemical Composition and Physical Properties of Gemstones Using LIBS and Chemometric Technique

1
Department of Physics, University of Allahabad, Prayagraj 211002, India
2
Department of Earth and Planetary Sciences, Nehru Science Centre, University of Allahabad, Prayagraj 211002, India
3
Engineering Thermodynamics, University of Bremen, Badgasteiner Str. 1, 28359 Bremen, Germany
*
Authors to whom correspondence should be addressed.
Submission received: 28 May 2021 / Revised: 24 June 2021 / Accepted: 28 June 2021 / Published: 2 July 2021
(This article belongs to the Special Issue Laser Induced Plasma/Breakdown Spectroscopy)

Abstract

:

Featured Application

Laser-induced breakdown spectroscopy is applied to a variety of gemstones for classification and characterization purposes.

Abstract

Laser-induced breakdown spectroscopy (LIBS), accompanied by chemometric data analysis, is used to identify and classify gemstones of various hardness. The study involves several gemstones: amethyst, aquamarine beryl, bloodstone citrine, diopside, and enstatite. Their hardness is determined through a correlation utilizing the spectral intensity ratio of the ionic to atomic spectral lines of an identified element in the LIB spectrum. The result of the relative hardness obtained from the LIBS analysis is in good agreement with the hardness measured from Mohs’s scale of hardness, a popular qualitative method to determine hardness. In this work, a linear relationship has been established between the Mohs’s hardness and the plasma excitation temperature. Thus, the hardness of the gemstones can be determined with the help of plasma excitation temperature. Moreover, the analysis of trace elements in LIB spectral data reveals that a particular element is responsible for the colors of gemstones. Therefore, the relative concentration of constituents is calculated for all gemstones and compared. Principal component analysis (PCA) is successfully applied to all gemstone spectra for rapid classification and discrimination based on their variable elemental concentrations and respective hardness.

Graphical Abstract

1. Introduction

Gem-quality minerals have been very significant throughout human history. Due to desirable attributes of beauty, rarity, durability, and portability, as well as the transient appeal of fashion, gemstones have attained a valuable status in human life. Due to these factors, the provenance of gemstones is a widely discussed topic for geologists, historians, gemmologists, and others in the gem industry. The identification and characterization of minerals/materials is important from an analytical point of view. Therefore, mineralogists, petrologists, and gemmologists use a wide range of simple to sophisticated methods to identify and characterize minerals [1,2].
Gemstones can be characterized by several analytical methods. The characterization of gemstones is generally performed using different methods like the measurement of the index of refraction [3], UV–visible spectroscopy [4], analysis of fluid and mineral inclusions [5], infrared and Raman spectroscopy [6], and the characterization of crystallographic features typical of specific minerals or mineraloids [7,8]. For example, particle-induced x-ray emission (PIXE) and energy-dispersive X-ray fluorescence (ED-XRF) analytical methods are applied to ruby and sapphire with the aim of obtaining their qualitative and quantitative chemical analyses and determining their provenance. The application of multivariate analysis on the PIXE data of ruby samples allowed the identification the trace elements V, Cr, Fe, Ti, and Ga [9,10]. The recent development of laser ablation–inductively coupled plasma mass spectrometry (LA-ICP-MS) was used for trace element analysis in gems, although this technique causes marginal sample destruction [11,12]. Metamorphic and magmatic blue sapphire samples from various locations could be discriminated utilizing the Ga/Mg ratio obtained from LA-ICP-MS analyses [13]. In another study, the provenance of sapphires from different locations was determined by applying multivariate statistics to LA-ICP-MS data of Mg, Si, Ti, V, Cr, Fe, and Ga [14,15]. Electron paramagnetic resonance (EPR), X-ray diffraction (XRD), nuclear magnetic resonance (NMR), neutron activation analysis (NAA), particle-induced X-ray emission (PIXE), scanning electron microscopy (SEM), electron microprobe analysis (EPMA), and transmission electron microscopy (TEM) are used for the analysis of gemstones, but due to high cost, sample destruction, and further limitations, these techniques cannot be used for all the different gemmological investigations [16]. The ideal method for gem analysis should be simple, quick, cost-effective, reliable, and involve minimal to no sample damage.
Therefore, to study gemstones and other minerals, a marginally destructive quick and multi-element spectroscopic technique is imperative. LIBS is an innovative technique that has proven its suitability over the last few decades in various fields of academic and applied research [17,18,19,20,21,22]. This technique is advantageous over many other spectroscopic methods due to its cost-effective, precise, and fast multi-elemental identification capability that can be applied online and in situ. In this technique, all the elements present in any type of material can simultaneously be detected without significant destruction of the sample. Moreover, with a single laser shot, this technique is cumulatively sensitive to all atomic species/elements, even those present in small (as trace elements) amounts, including lighter species such as C, B, Be, H, and Li [17]. In just a few micro-seconds, with a single laser shot, the LIB spectrum appears on the screen that can be comprehended as a chemical “fingerprint” of the sample [18]. Hence, the LIB spectrum can be used for qualitative, semi-quantitative, and quantitative analyses of the sample. The point detection capability of LIBS offers the potential for determining the spatial distribution of different minerals in gemstones. The use of LIBS to investigate minerals containing lighter elements (H, Li, N, and C) can be particularly useful for studying gemstones.
LIBS, coupled with multivariate data analysis, is frequently used to classify different samples with elusive changes in their relative elemental concentrations or other variables [19,20,21,22]. In numerous studies, LIBS enabled the differentiation of many geological materials, even if they were chemically similar and optically indistinguishable [19,20]. In work by Kochelek et al. [21], 569 rough sapphire and ruby specimens from 21 localities in 11 countries were analyzed through LIBS and multivariate data analysis. They demonstrated that the quantitative measure is related to the deposit of origin. The potential of LIBS was also used to recognize beryl (Be3Al2Si6O18) from the three beryl-bearing zones in the Palermo#1 pegmatite (New Hampshire). Principal component analysis (PCA) has been applied to the broadband LIB spectra of 39 beryl specimens from 11 pegmatite mines in New Hampshire, Connecticut, and Maine (USA) to successfully determine sample provenance [22].
The present work aims at advancing the analytical capabilities of LIBS in the field of gem mineral characterization. The elemental composition and the surface hardness are key parameters in this context. LIB spectra of six different gemstone samples have been analyzed using univariate and multivariate techniques. Trace elements responsible for the coloration of the gemstones were examined. Moreover, the potential of determining the surface hardness of the samples using LIB spectral data was tested based on a comparison with the relative hardness values using Mohs’s scale.

2. Materials and Methods

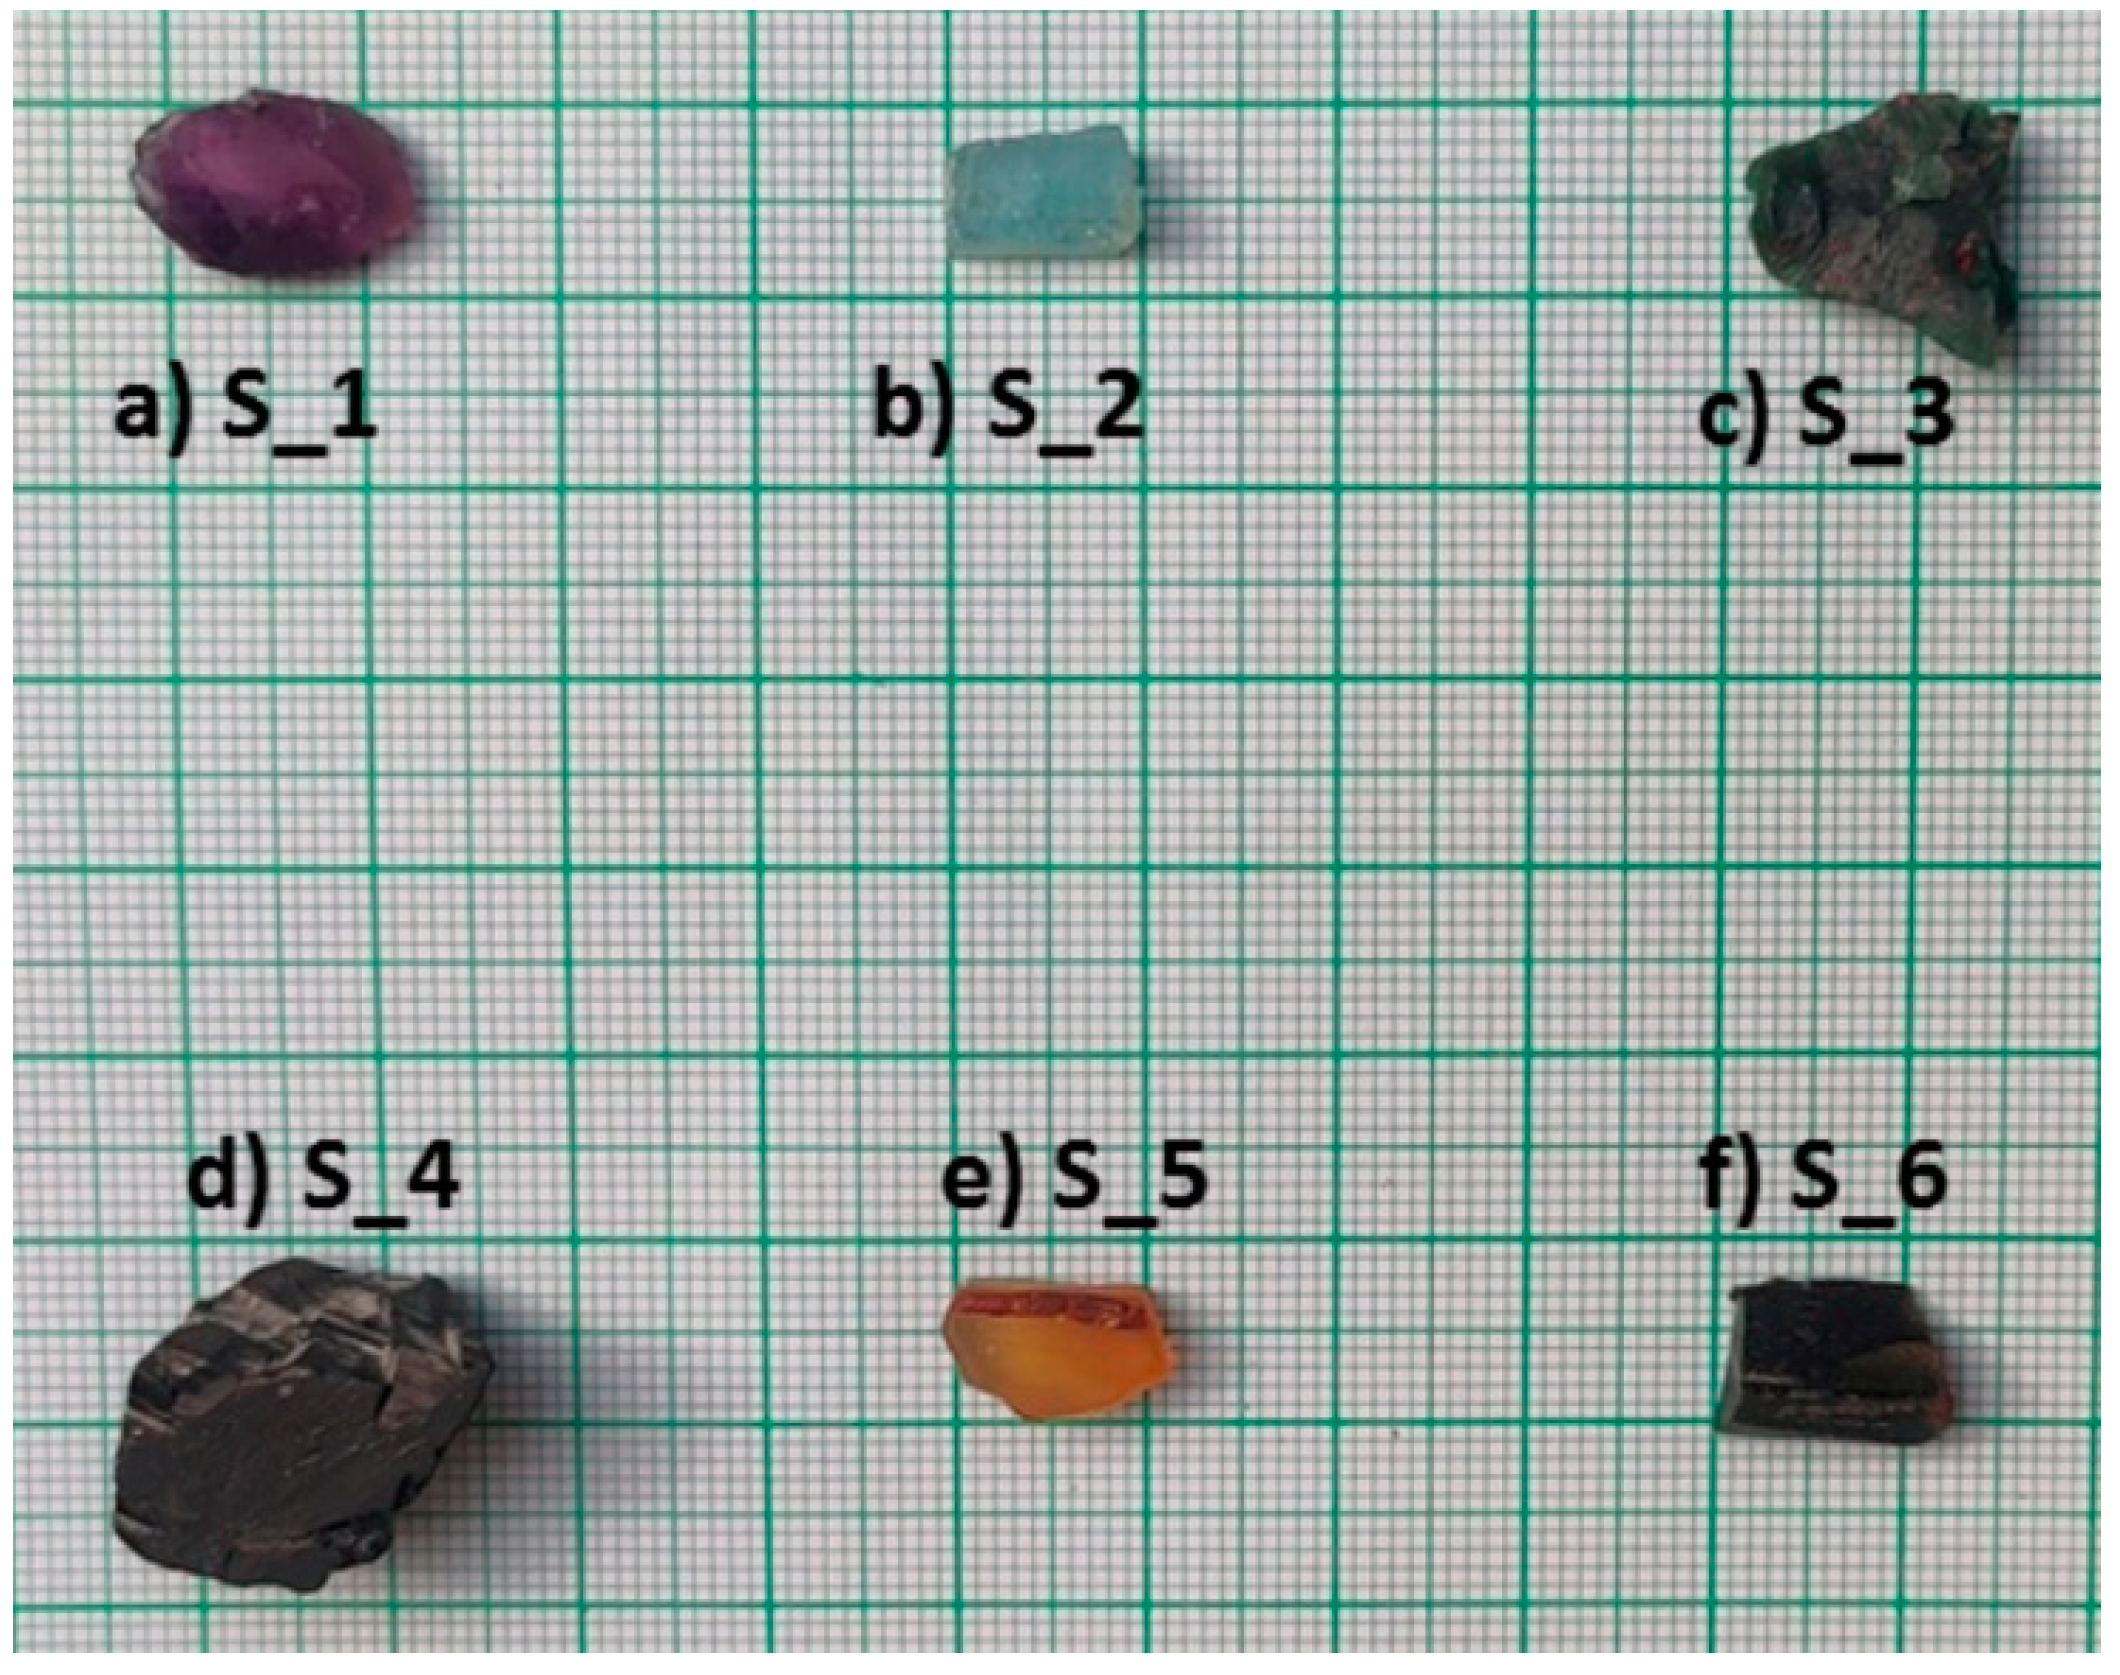
2.1. Sample Description

The gemstone samples used in the present study (Figure 1) were purchased from the open market with labels. Their broad nomenclature did not pinpoint precise mineral chemistry, amount and nature of impurities, or the extent of the solid solution, if any. Hence, the samples were analyzed based on some characteristic physical properties (specific gravity, refractive index, and relative hardness using Mohs’s scale) to examine their commercial nomenclature and retained in the present study sensu lato (Table 1).
The dimensions of the samples were measured by Vernier calipers and are given in Table 1. Furthermore, the color of the samples was determined using the Munsell® Colour Chart, Geological Society of America, Boulder, CO, USA. Sample S_1 shows a grayish purple color (5P 4/2; Munsell® Colour Chart), sample S_2 shows a very pale blue color (7.5B 8/2). The color of sample S_3 is dusky yellowish-green (10GY 3/2), and that of sample S_4 is greyish olive green (5GY 3/2). Sample S_5 shows a dark yellowish-orange color (10YR 6/6) and the color of sample S_6 is grayish olive green (5GY 3/2).

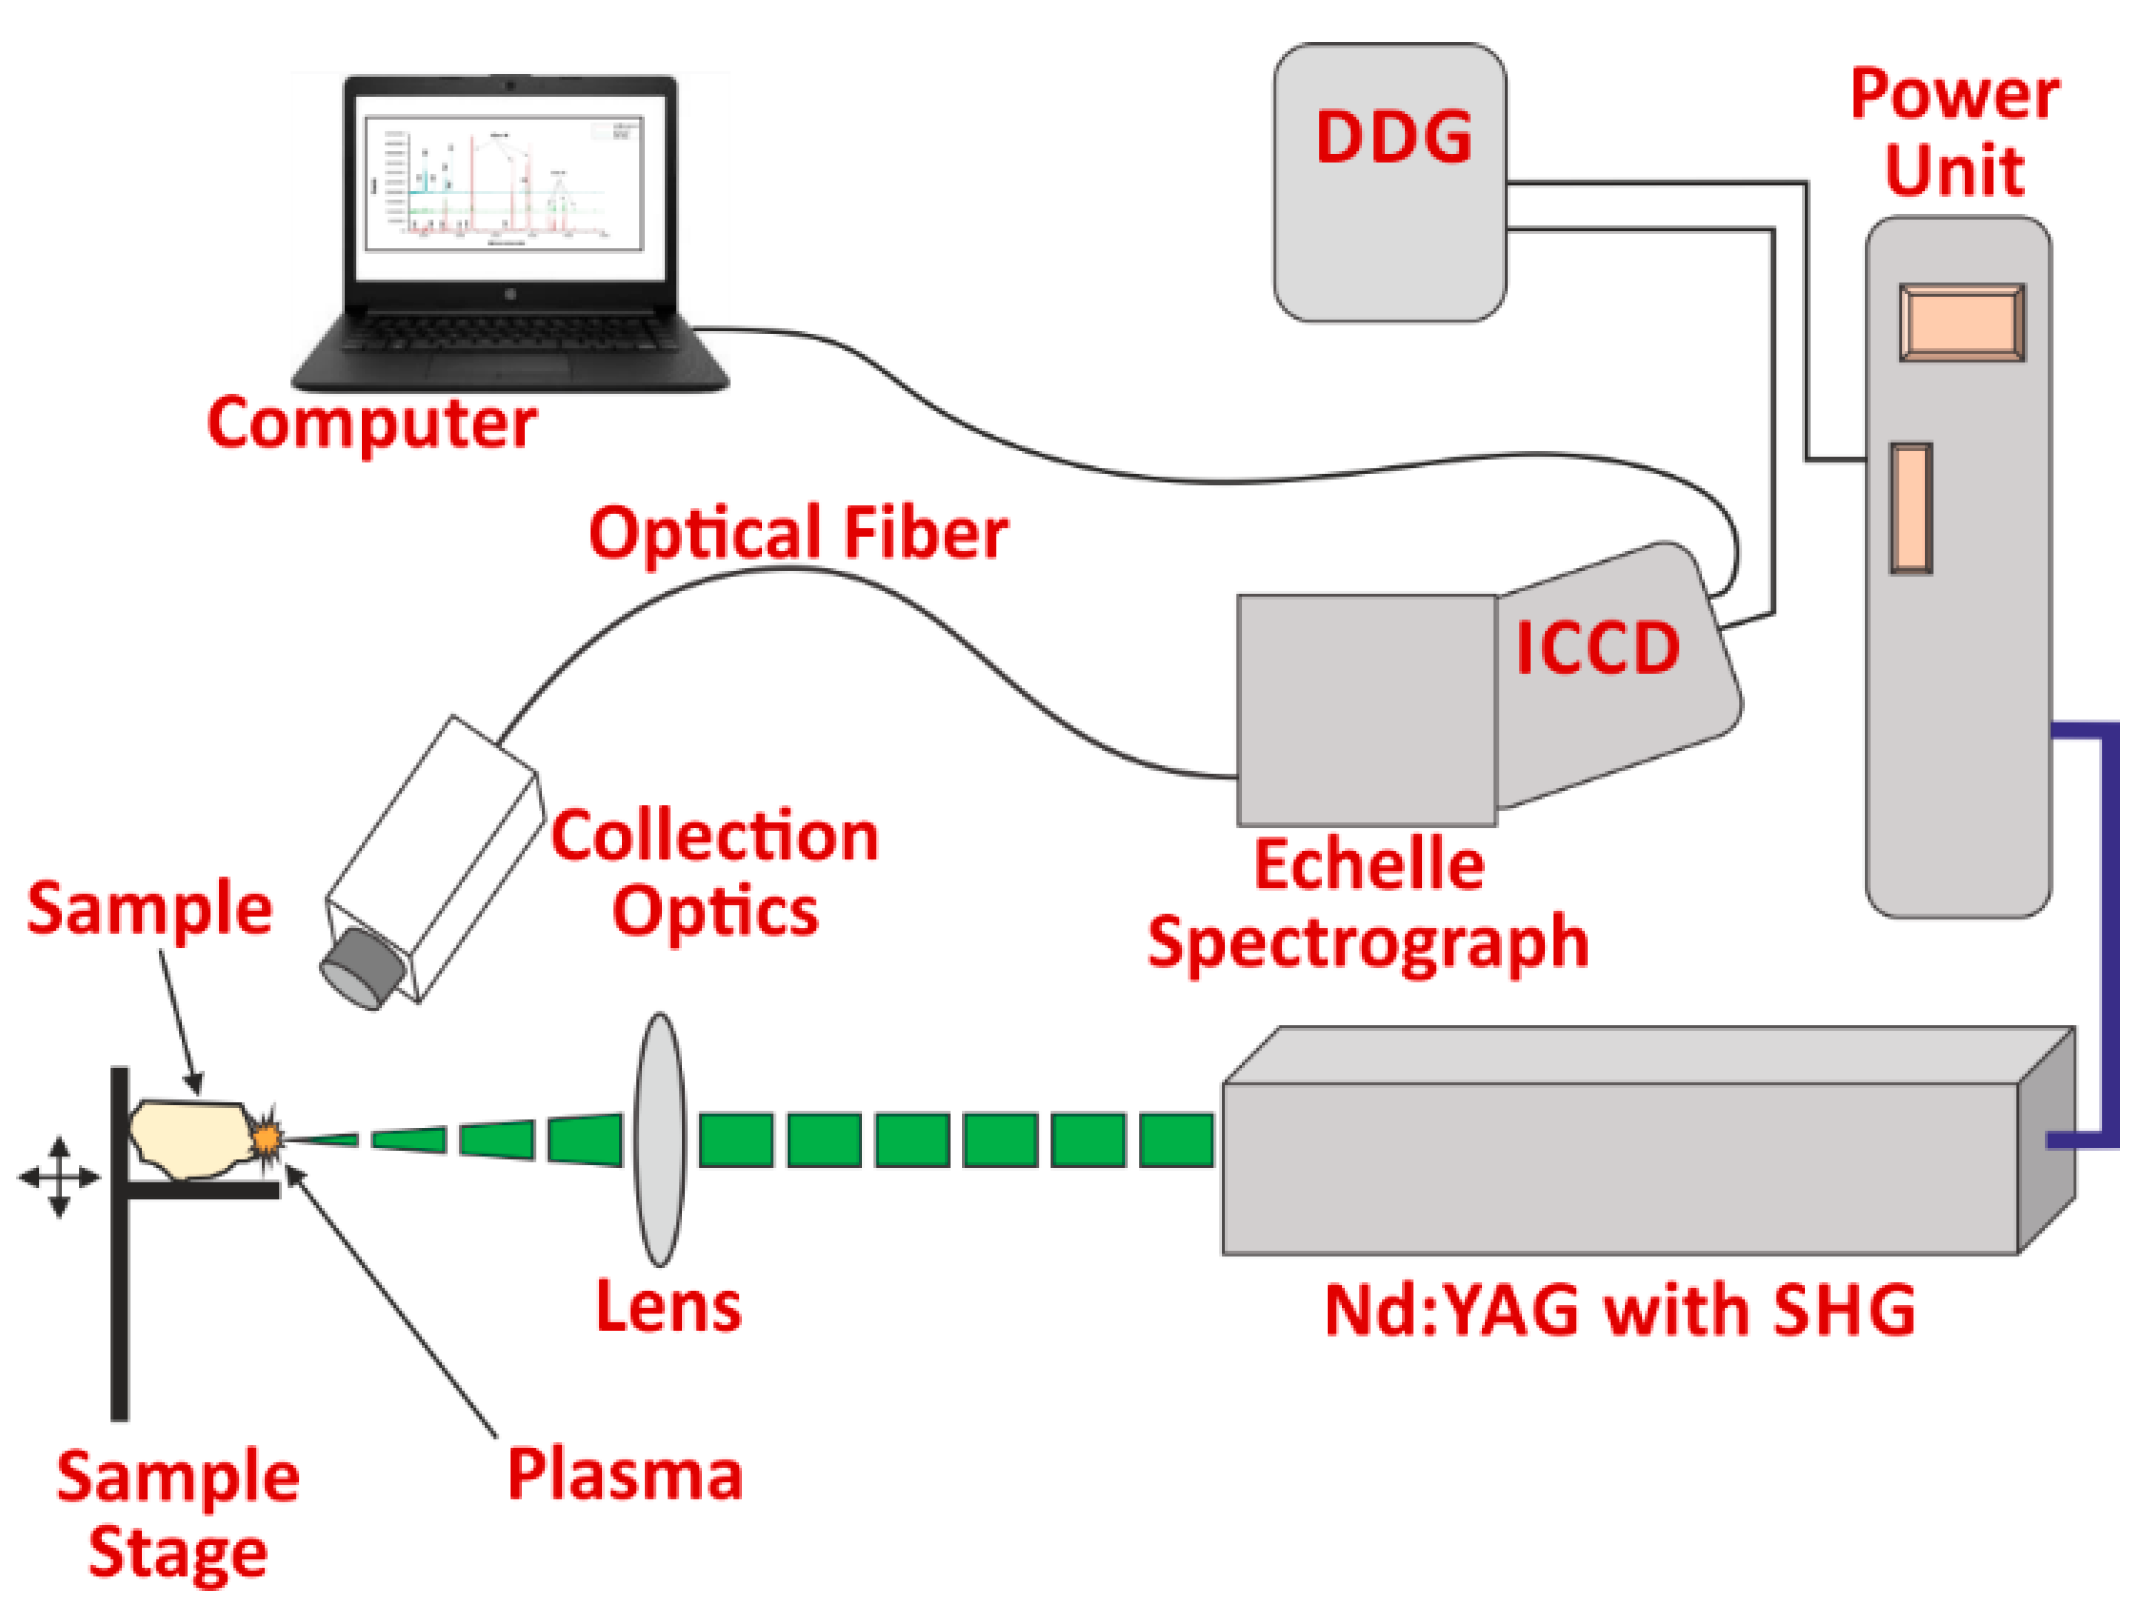
2.2. Experimental Setup

The LIB spectra of the gemstone samples were recorded using the setup shown in Figure 2. The setup consists of a frequency-doubled (532 nm) Nd:YAG laser (Continuum, SureliteIII-10, USA) with a maximum deliverable energy of 425 mJ, a pulse duration of 4 ns (FWHM), and a variable repetition rate of 1–10 Hz. The laser beam was focused on the flat surface of a gemstone using a converging lens with a 15 cm focal length. Crater formation through multiple pulse impact is a big issue in LIBS analysis, and it can destroy the precious gemstone samples. Thus, the sample was placed on a translational stage, and after each laser shot, a new position was chosen by continuously moving the sample during the experiment. Emitted photons from the laser-induced plasma were collected at an angle of 45° to the incident beam using a set of collection optics (UV NIR light collector ME Opt 0007, Andor Technology). An optical fiber fed it to the spectrograph (Mechelle5000, Andor Technology: spectral resolution (λ/∆λ) 6000, slit width 10 μm). The spectrograph was coupled with an ICCD detector (iStar 334, Andor Technology) with a microchannel plate (MCP) with the gain set to 1500.
The experimental setup was optimized, and these optimized parameters were maintained throughout the whole experiment. The optimization of parameters was performed in order to get better signal to noise ratio and signal to background ratio, and to avert the background continuum. The best signal to background ratio and signal to noise ratio were obtained at a laser pulse energy of 10 mJ/pulse. The laser pulse energy was measured with an energy meter (Genetec-e model UP19K-30 H-VM-DO). The optimized gate delay and gate width were 1 µs and 2 µs, respectively. One LIB spectrum is an average of fifty laser shots, and fifteen such LIB spectra for each gemstone sample were recorded.

2.3. Multivariate Data Analysis

The LIB spectral data of the gemstone samples were analyzed using chemometrics. The spectra acquired from different samples were systemized, and several data sets were arranged in a 90 × 20,538 matrix with 20,538 features. Unscrambler-X software (CAMO Software India Pvt. Ltd.) was used for PCA. It solved the data matrix and generated the score and loading plot. PCA is a multivariate technique used to discern similar samples based on small variations in the variables (i.e., the wavelength). PCA eliminates the noise and reduces the dimensionality of spectral data while calculating principal components (PCs) by maximizing the variation in variables (wavelength). Principal components are vectors with a combination of linear variables. The first PC contains the most data variation while the second PC is perpendicular to the first and includes the remaining data variability; this is similar for the higher PCs. The three-dimensional PCA score plot is a significant feature of the analysis. In the score plot, spectra of samples sharing certain similarities cluster together and form numerous groups according to their similarities, whereas spectra with different elemental compositions or concentrations are separated. On the other hand, the loading plot, which is another output of the PCA analysis, is helpful to see the contributions of the individual variables. The loading graphs are used to identify which elements are responsible for the differentiation of the observed clusters. The loadings appear as a spectrum when plotted against wavelength and exhibit characteristic negative and positive signatures.

3. Results and Discussion

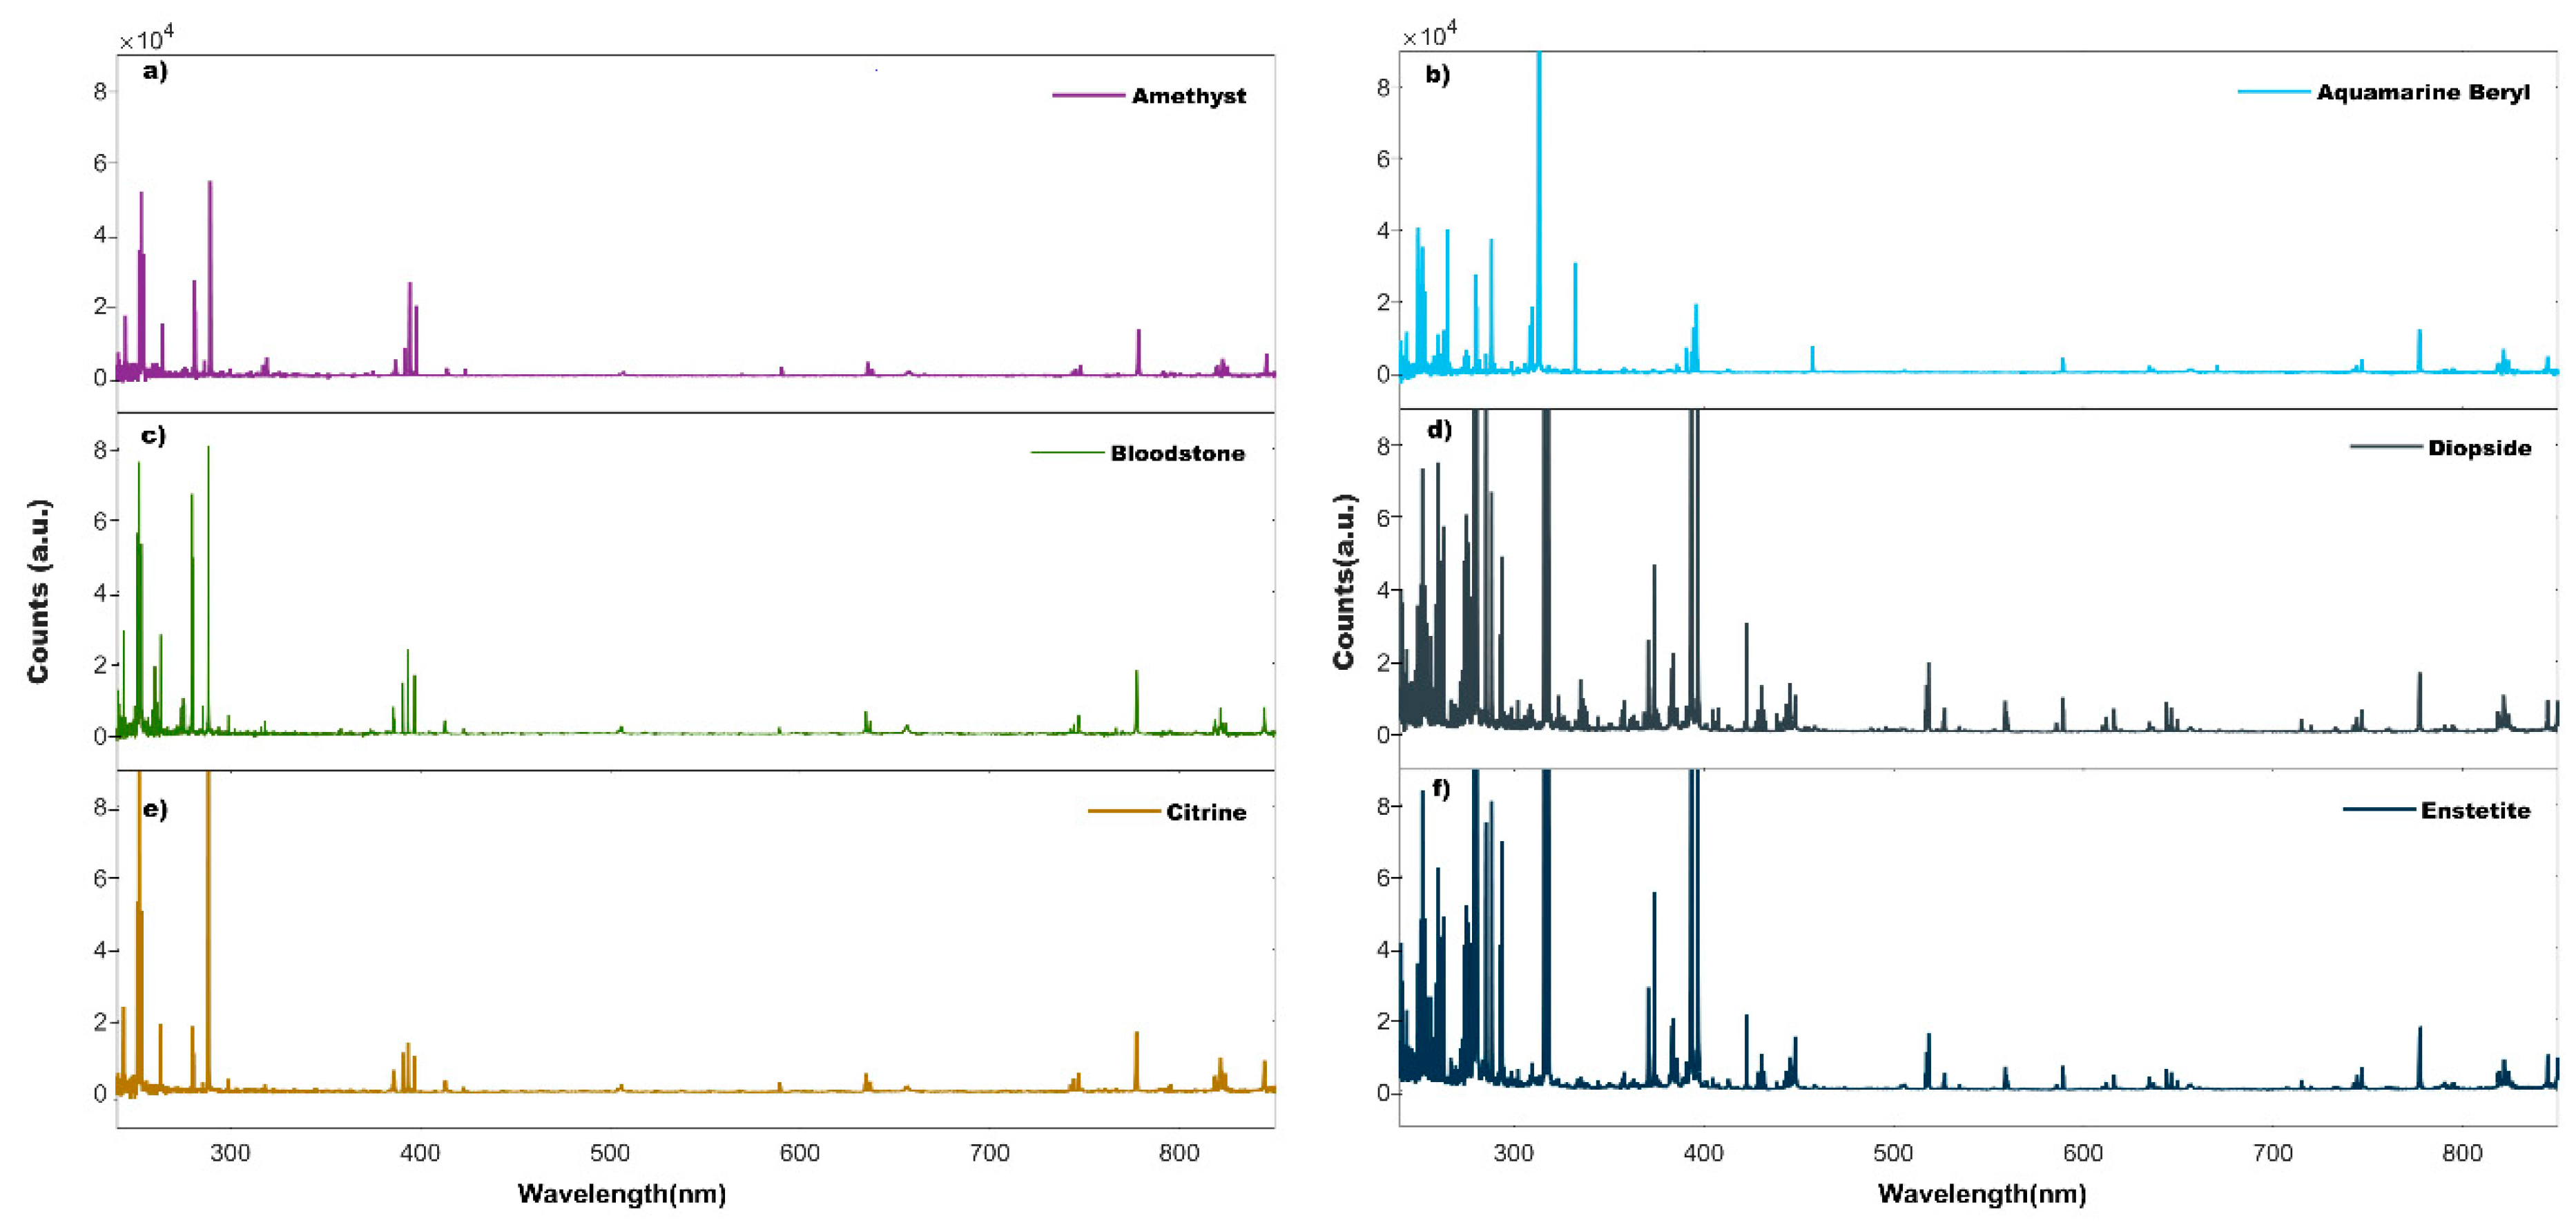
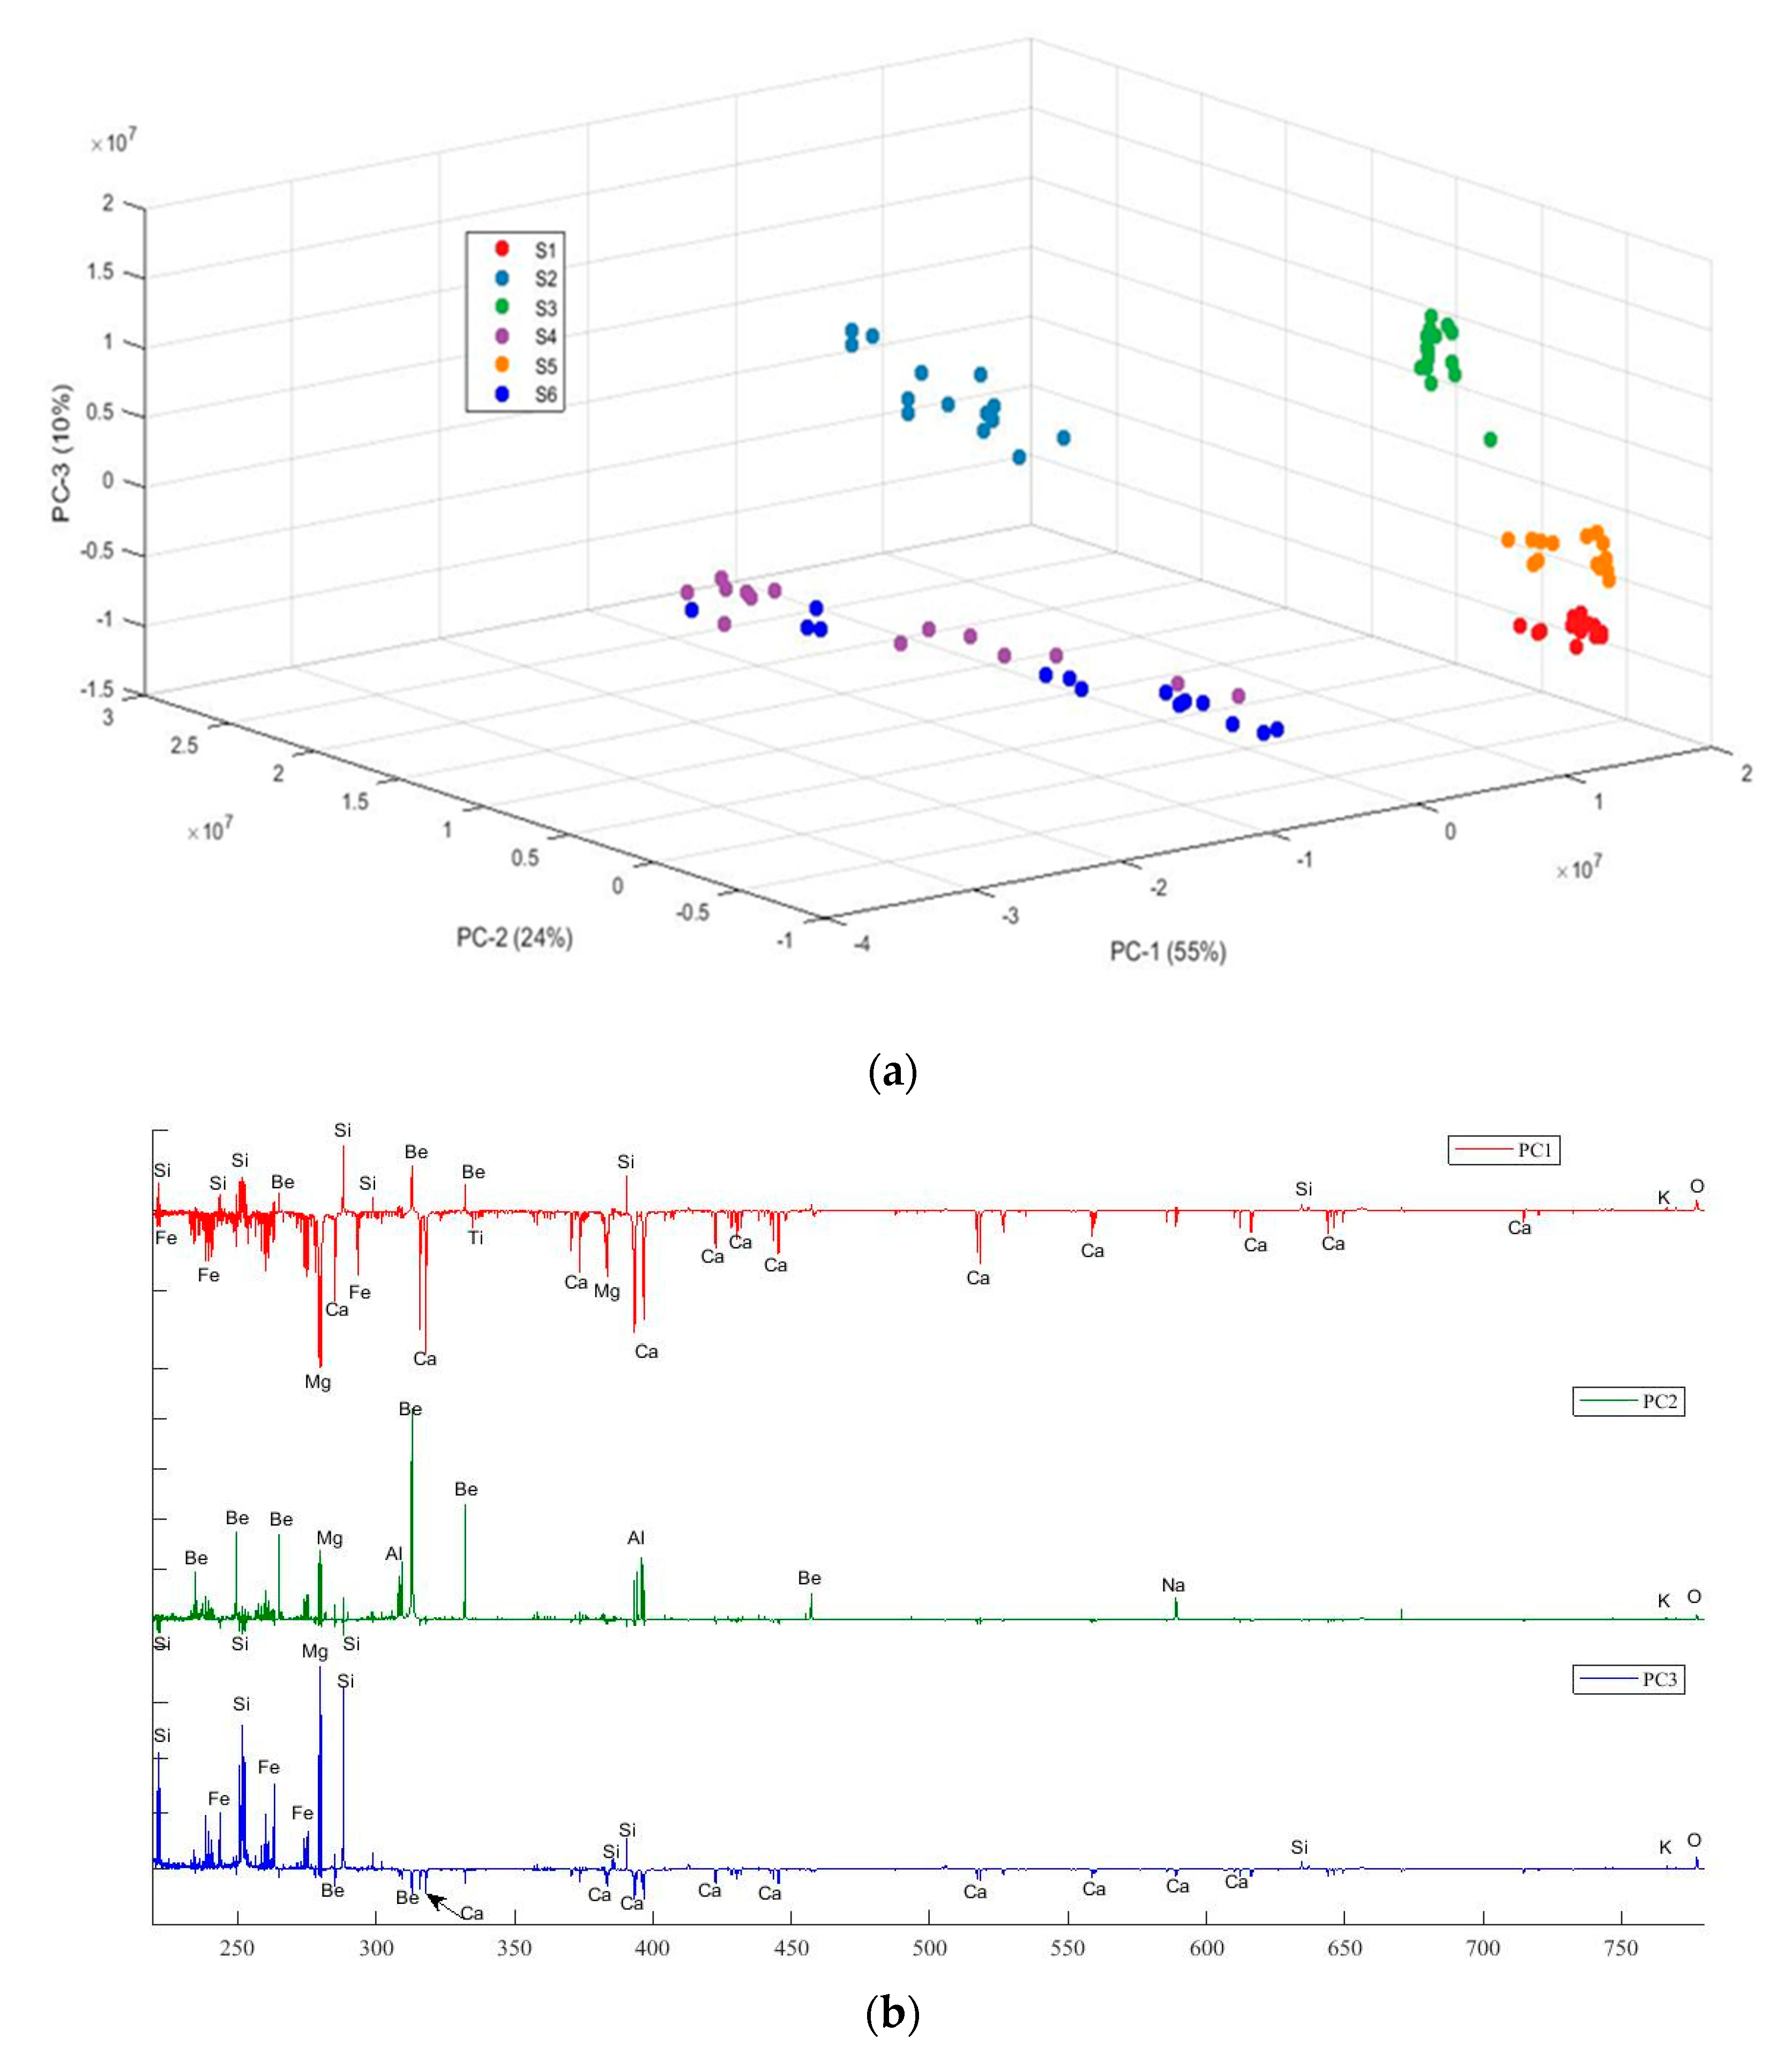
3.1. Qualitative Analysis of Gemstones Using LIB Spectra

The average of fifteen LIB spectra of each sample is presented in Figure 3. The observed spectral signatures of elements in the different samples and their corresponding wavelengths are summarized in Table 2 together with an elemental assignment.
Considering the general chemical formula and the corresponding spectral lines observed in the LIB spectra of the gemstones, it is clear that every LIB spectrum contains spectral lines of constituent elements of the respective gemstone. Sample S_1 represents an amethyst with a purple color. The corresponding LIB spectrum shows lines of Fe, Al, and Be. Previous studies revealed that Al, Fe, Be, and K are present in amethyst as trace elements [23]. Klemme et al. [24] used electron microprobe analysis to study amethyst and found that traces of iron may be responsible for amethysts’ coloration. Cox et al. [25] and Fritsch et al. [26] suggested that amethyst is colored by an O2−→Fe4+ charge transfer. Sample S_2 is aquamarine beryl with a pale blue color. In its LIB spectrum, spectral lines of Fe are also observed, along with Si, O, Al, and Be. Viana et al. [27] used Mössbauer spectroscopy for the characterization of similar samples and found that the pale blue color of aquamarine beryl can be attributed to iron in the crystal structure. Others, especially Goldman et al. [28] and Rossman [29], explained that blue, green, and yellow tones are the result of different Fe2+/Fe3+ ratios.
Sample S_3 is a variety of agate (cryptocrystalline silica), possibly a bloodstone. It is dark green to dark bluish-green in color and dotted with red or brown spots. It has been suggested that heliotrope bloodstone is an opaque green jasper with inclusions of chlorite, amphibole, and pyroxene that contribute to its green color and has red spots of hematite. [30,31]. Gliozzo et al. [32] analyzed a heliotrope (also known as bloodstone) sample by synchrotron radiation X-ray diffraction (SR-XRD) and PIXE techniques and detected the presence of Si, O, Al, Ca, Pb, K, Fe, P, Cu, and Zn. Another study involved the SR-XRF technique to investigate Si and Fe as major elements, while Ti, Mn, Cu, Zn, Rb, Y, Sr, and Zr were identified as impurity elements in bloodstone samples. Zhang et al. [33] suggested that the Fe distribution is not homogeneous over the sample and that the green color is related to Fe2+ while the red spots correspond to hematite (Fe2O)3.
The commercial nomenclature of Sample S_4 is given as diopside (CaMgSi2O6). This nomenclature is retained as the sample (S_4) broadly defines an end member of the clinopyroxene group of minerals but may not strictly adhere to its ideal composition, similar to all naturally occurring minerals stabilized under varied physico-chemical conditions. The LIB spectrum reveals the presence of Fe and Ti, along with Si, Ca, and Mg. Earlier work showed that diopside contains elements such as Fe, Al, Ti, etc. Another study coined Al-diopside for diopside with a high concentration of aluminum [34,35]. Al and Ti are generally substituted for Si at interstitial sites of clinopyroxenes, a chain silicate.
The citrine (sample S_5) is usually has a yellow color. In addition to the spectral signatures of Si, O, Mg, and Ca, which are constituents of quartz, the LIB spectra show the presence of Al. Earlier studies suggested that the color of citrine is induced and related to hole centers associated with Al impurities [36,37]. Thus, this work shows a good correlation with the work of Samoilovich et al. [36]. The spectrum of enstatite (sample S_6) suggests the presence of the elements Si, O, Al, Ca, Fe, and Ti.
The qualitative analysis of the LIB spectra of different gemstones reaffirmed the presence of chromophore elements despite their meager concentrations in gemstones analyzed during the present study. The presence of minor elements such as Fe and Al is responsible for the purple, yellow, and green colors, respectively.

3.2. Semi-Quantitative Analysis of Different Elements in LIB Spectra of Gemstones

The relative concentrations of the elements in the different samples were evaluated by measuring the intensity of the spectral lines that appeared in their LIB spectrum. Before using the intensities of the spectral lines to estimate the concentration of constituents (as the intensity of the spectral line of the element is proportional to the elemental concentration [38,39,40]), it was ensured that the spectral lines from the plasma were not self-absorbed. Therefore, it can be assumed that the elemental stoichiometry of the samples can be deduced from the plasma emission and that the plasma was in local thermal equilibrium. These three points are discussed one by one in the following paragraphs.

3.2.1. Stoichiometric Ablation

The laser energy is responsible for the formation of a stoichiometric plasma, i.e., the plasma is really representative of the composition of the sample. For the ablation to be stoichiometric, laser flux density at the sample surface must be higher than the breakdown threshold of the sample. It is believed that if the laser irradiance at the focal spot is in the order of GW cm−2, the laser-induced plasma will be stoichiometric [38]. Above this energy value, the underlying material reaches its vaporization temperature, causing the surface to explode before the surface layer can vaporize. In the present study, the calculated laser spot size was as D = 4λf/πd (where λ = wavelength of laser light, f = focal length of focusing lens, and d = laser beam width) to be 12 µm. The energy per pulse was ≈10 mJ. Consequently, the calculated laser irradiance was 2.2 × 10¹² Wcm−2; thus, the produced plasma was assumed to be stoichiometric [38,40].

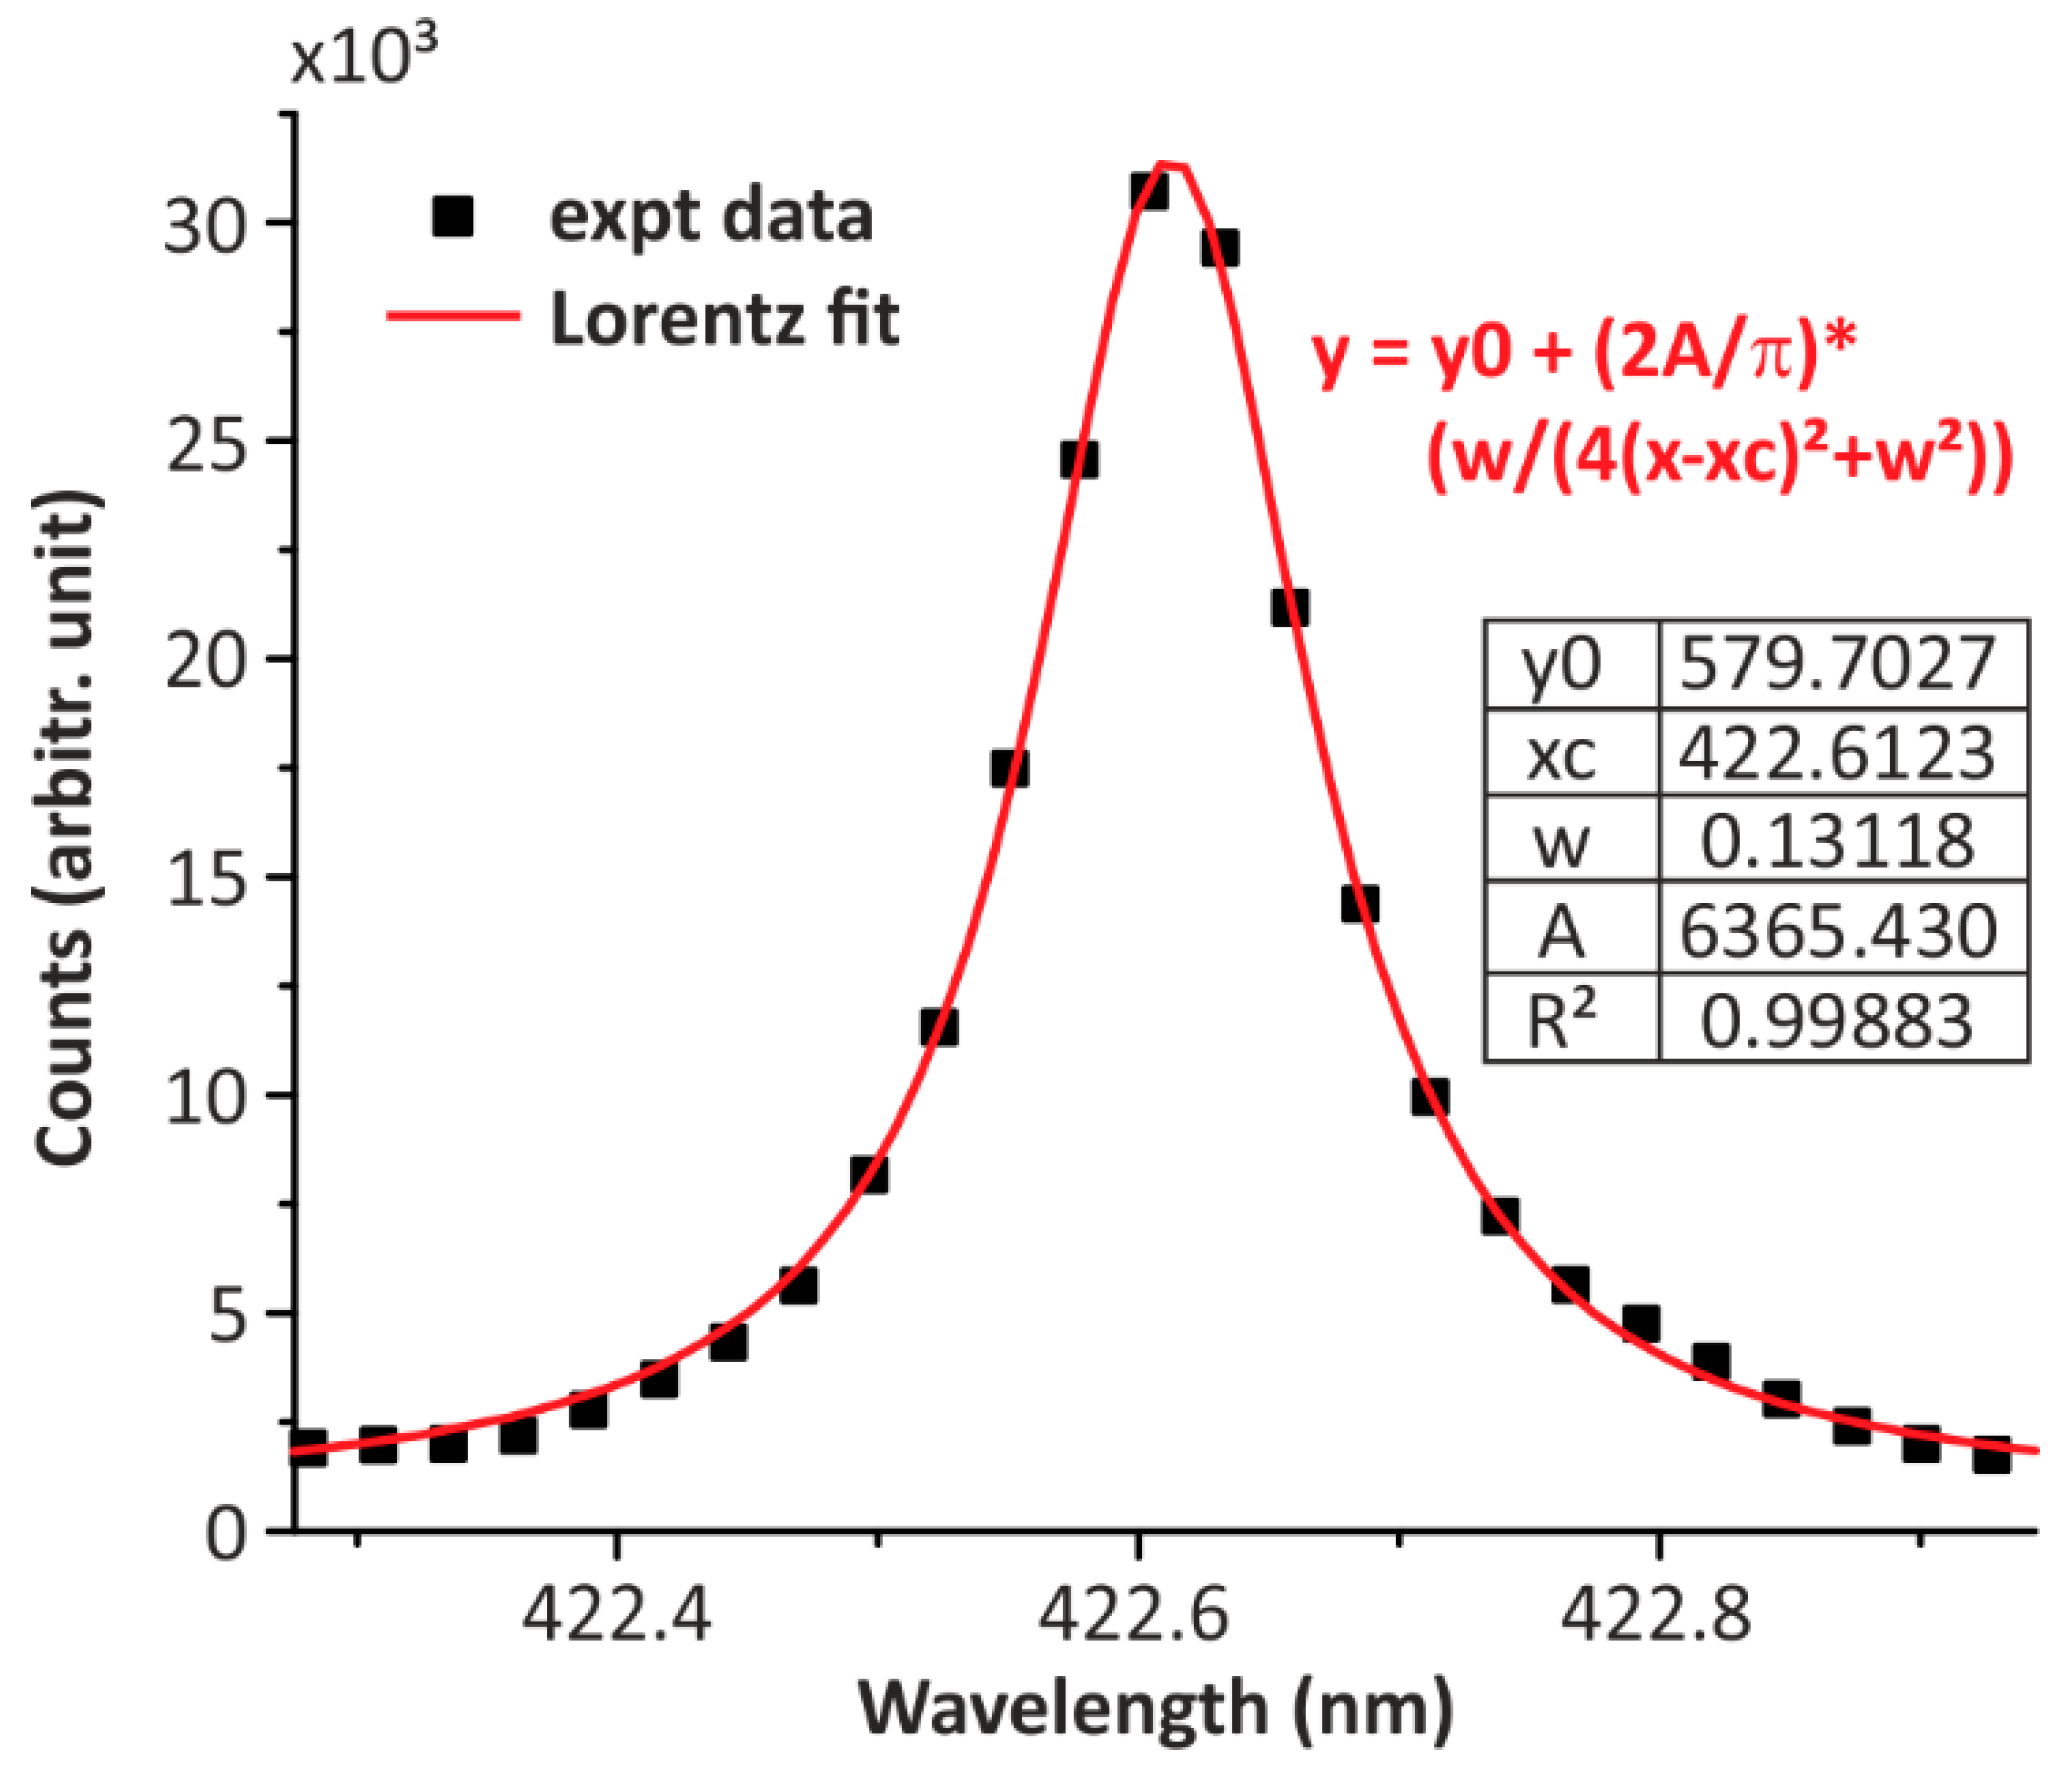
3.2.2. Optically Thin Plasma

The laser-induced plasma must be optically thin to obtain a reliable measurement; otherwise, the photons emitted in the inner core of the plasma can be absorbed into the plasma itself. This would result in a self-absorbed spectral line appearing in the LIB spectrum. The spectral intensity ratio of two spectral lines having similar upper energy levels was compared with the ratio of their Aki, gk, and λ−1 to ensure the optical thinness of the plasma. For two spectral lines, the intensity ratio (I/I’) should be nearly the same as {(Akigkλ′)/(A′kig′kλ)} [39,40]. In the present experiment, this was verified for the spectral lines of different elements for all the samples. The results for elemental Si for all samples are summarized in Table 3. It is therefore clear that the laser-induced plasma in the present experiment was optically thin in nature.

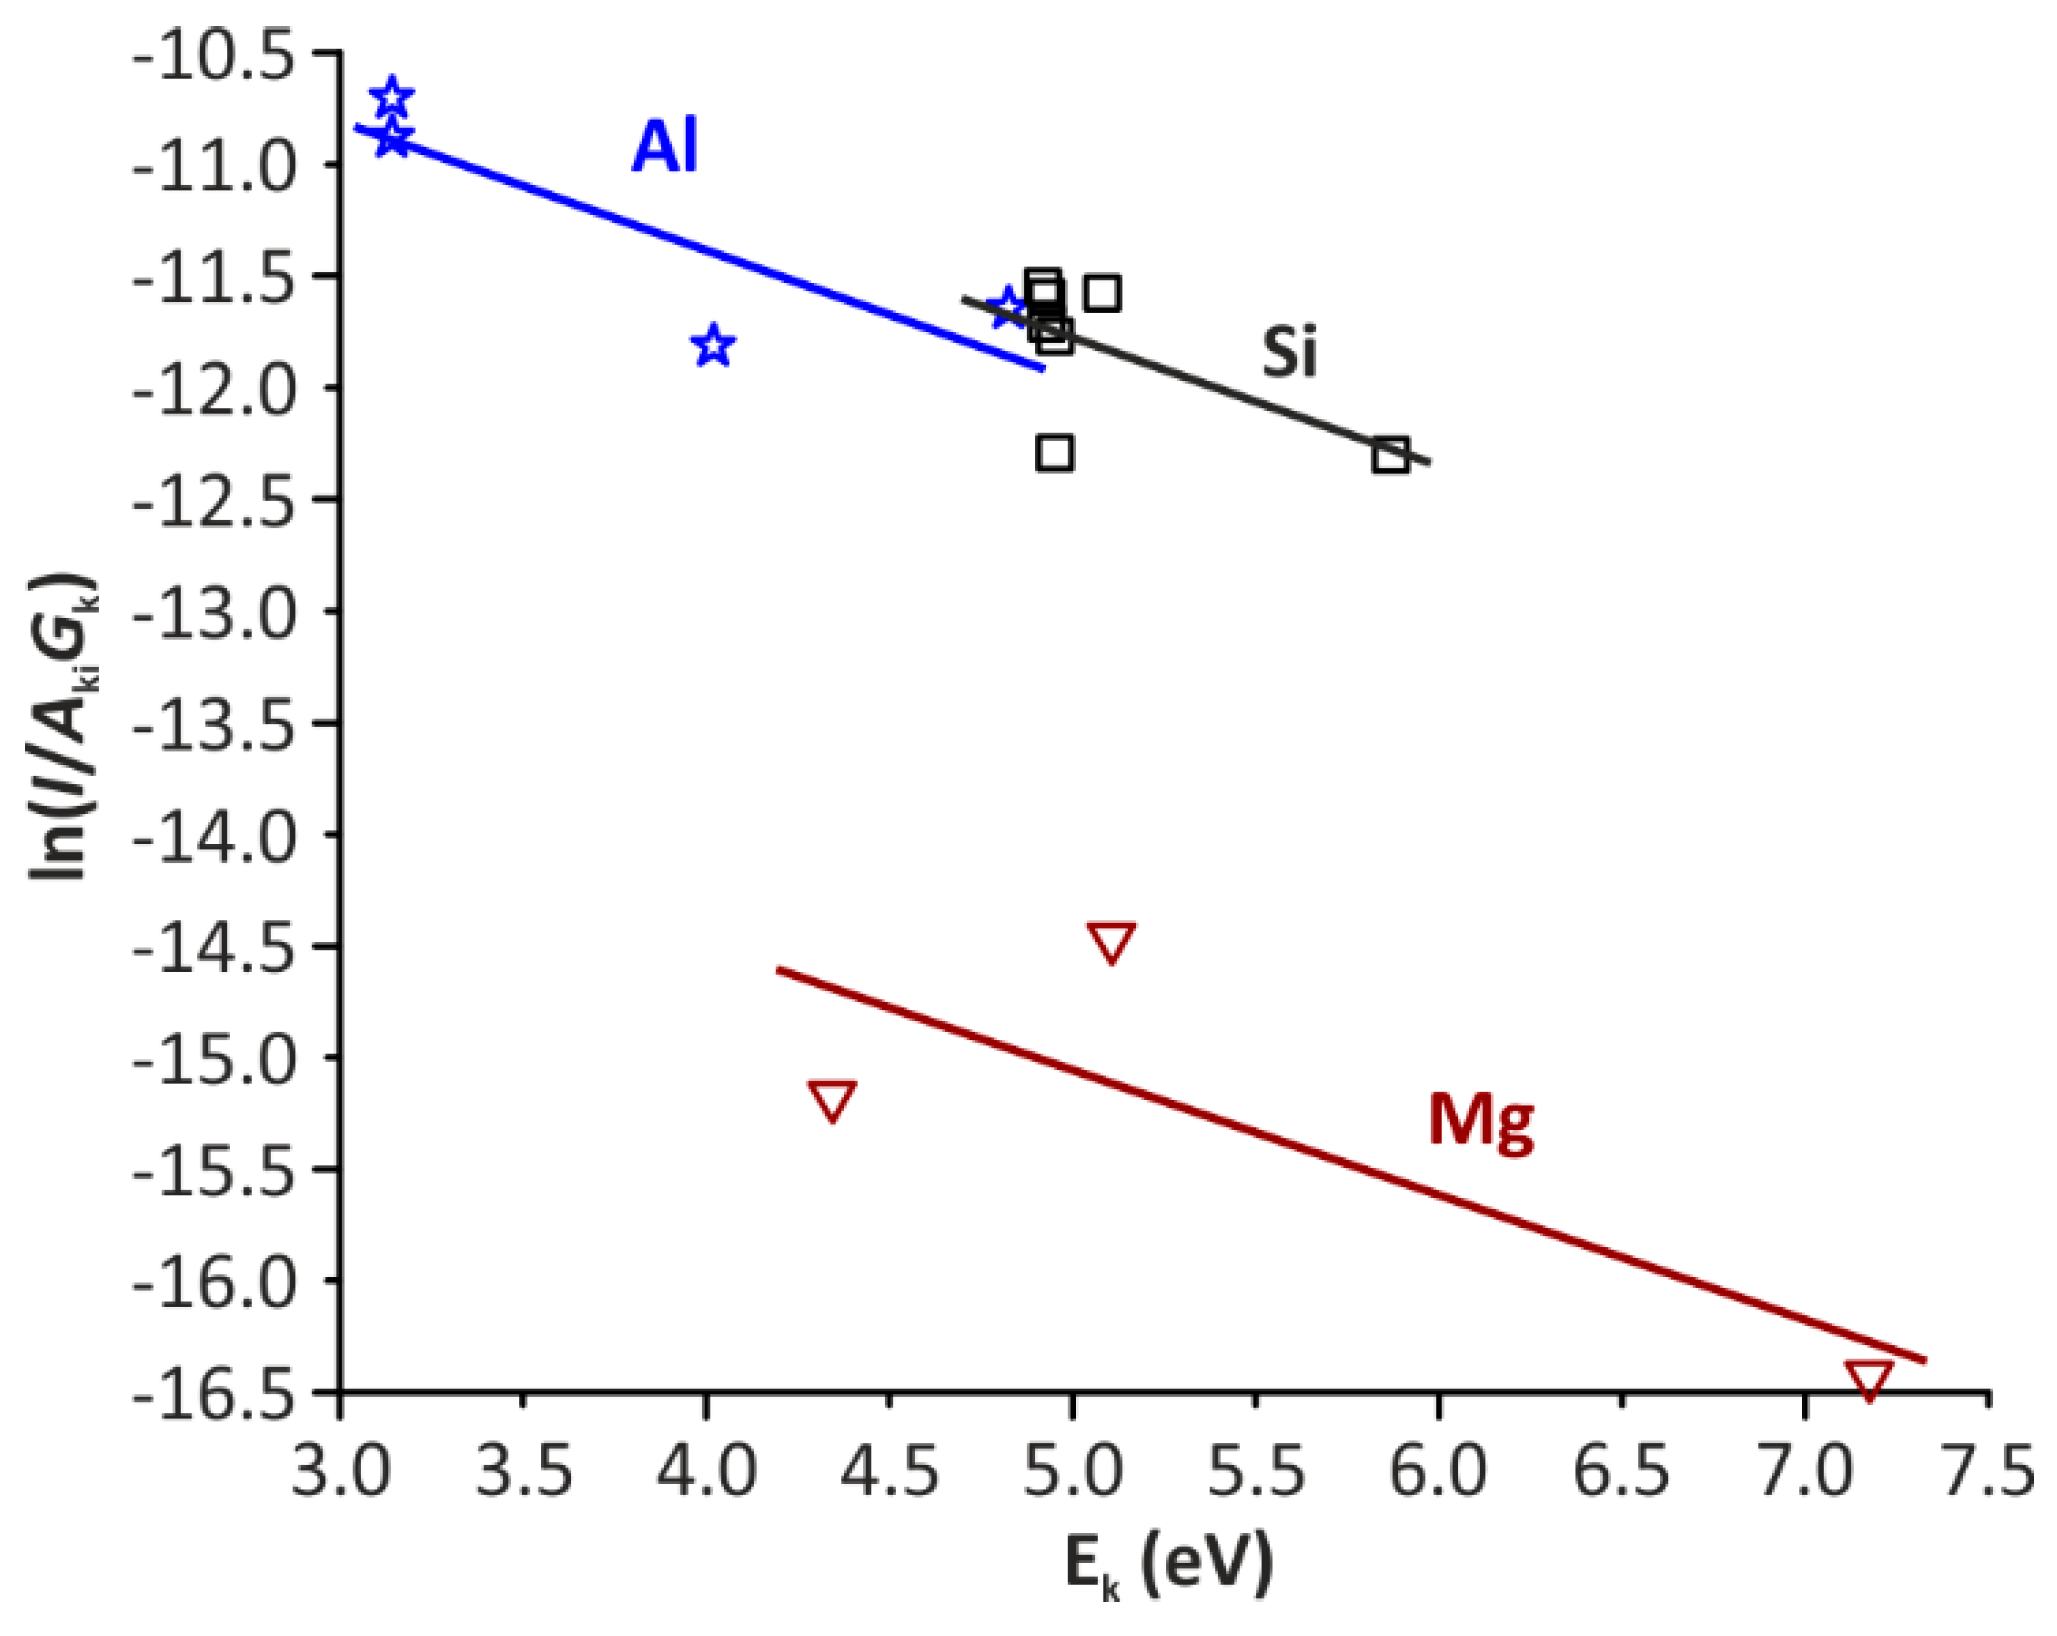
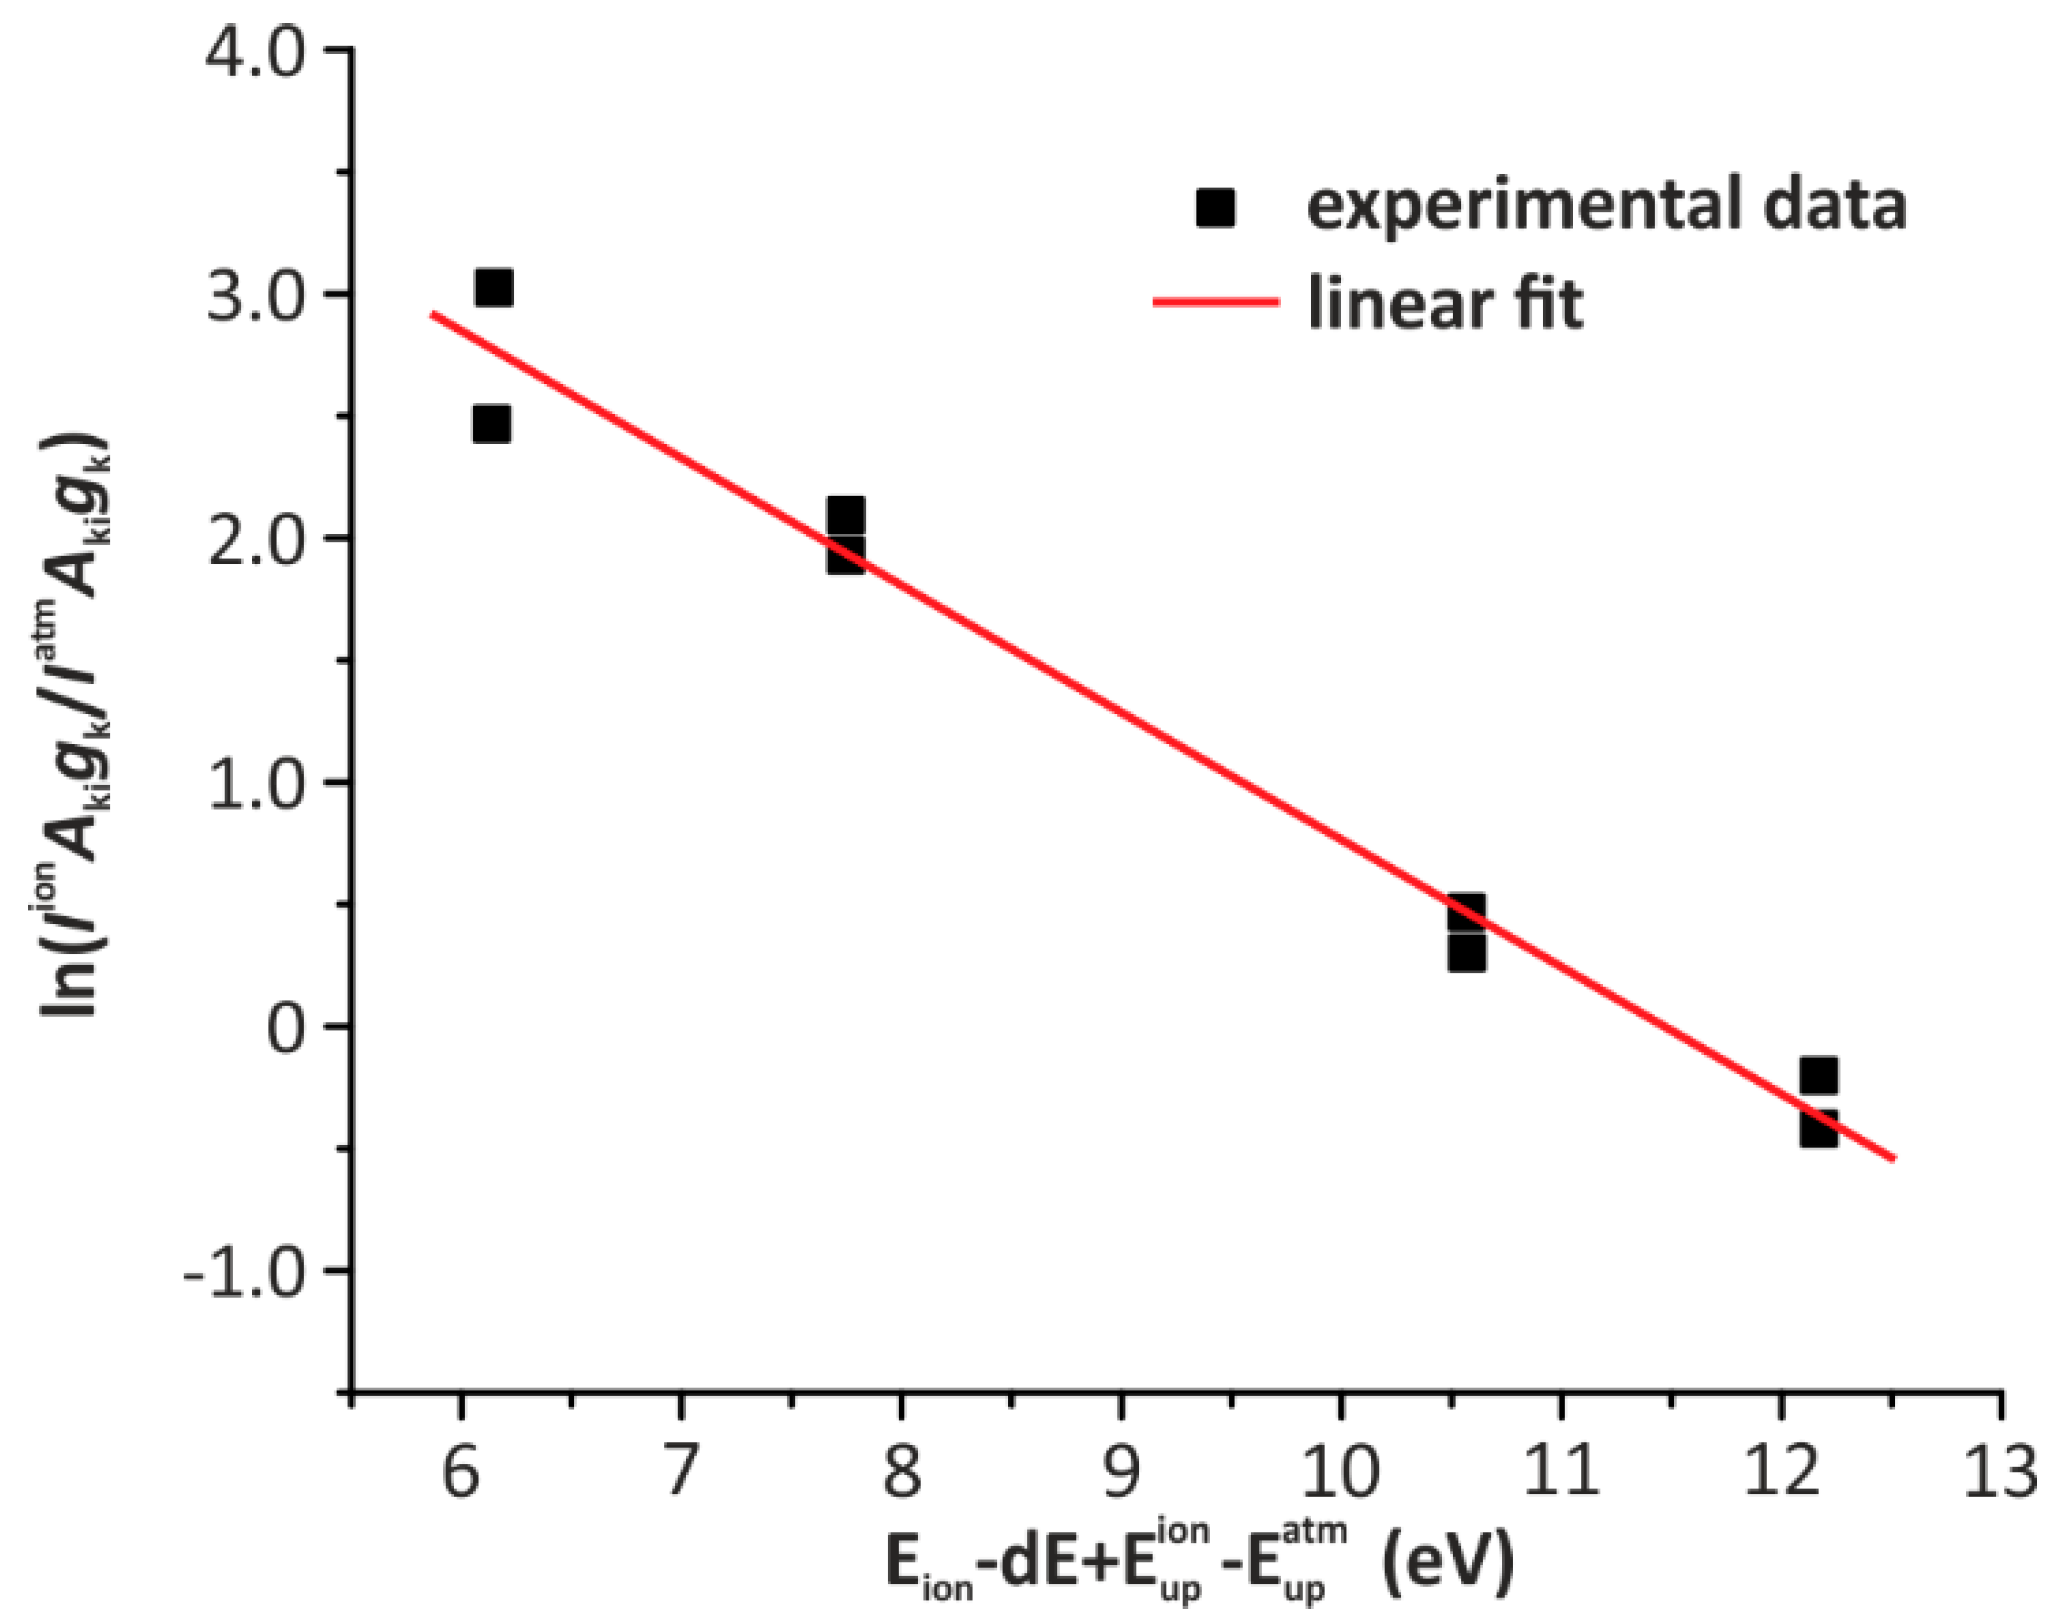
3.2.3. Local Thermal Equilibrium

The local thermal equilibrium (LTE) is one of the most critical parameters to be verified in the laser-induced plasma. For LTE, some necessary and sufficient conditions must be met.
Necessary condition: The electron number density should be higher than the minimum limit given by the McWhirter relation. The relation is shown below:
Ne > 1.6 × 10¹² [T]1/2 [ΔE]3,
where Ne is the electron density, ΔE is the maximum energy difference between two states of an atom in eV, and T is the plasma temperature in Kelvin [38]. To obtain the plasma temperature, the Boltzmann relation, given in Equation (2), can be used:
I λ k i = C s   F   A k i   g k e ( E k / k B T ) U ( T ) ,
where Aki (s−1) is the transition probability, gk is the statistical weight, F is the experimental factor, Cs is the concentration of species of elements present in the sample, kB is the Boltzmann constant, and U(T) is the partition function [39,40]. Taking the logarithm of Equation (2) and rearranging it yields
l n [ I λ k i A k i * g k ] = E k k B T + l n [ C s F U ( T ) ] .
The partition function for the emitting species is defined as U(T) = Σgkexp(−Ek/kBT). To calculate the experimental parameter F, it is assumed that the sum of all relative species concentration is one, i.e., ΣCi = 1. Equation (3) can be graphically represented by ln (I/Akigk) vs. Ek in two-dimensional space known as the Boltzmann plot as shown in Figure 4. In this diagram, the slope (−1/kBT) is related to the plasma temperature, and the intercept is related to the species concentration Cs and the experimental parameter F. Similarly, a graph has been plotted for the remaining samples. The temperature values calculated for all the samples are given in Table 4. The lower limit of the electron number density has been calculated using this plasma temperature and Equation (1). The lower limit of electron number density is listed in Table 5.
The electron density can be calculated by measuring the full width at half maximum (FWHM) (Δλ) of the Stark broadened line given by the expression:
Ne ≈ 1016 Δλ/2w.
Here, w is the electron impact parameter whose value is 9.25 × 10⁻⁴ nm for the Ca (422.6 nm) spectral line obtained from the reference [41], and Δλ is obtained using the relation ΔλTrue = (Δλ2Observed − Δλ2Spectrometer)1/2. The parameter ΔλObserved is FWHM of the Stark broadened line, and ΔλSpectrometer is the instrumental line width. The FWHM calculated for the spectral line of CaI at 422.6 nm is 0.13 nm. It was determined from a Lorentzian fit of the line, as illustrated in Figure 5. A similar procedure has been followed for the remaining samples. The lower value of Ne for McWhirter criteria using Equation (1) and the value of Ne has been calculated using Equation (4) and is listed in Table 5. It is clear from Table 5 that for all the samples, the electron number density is greater than the lower limit. Thus, the necessary condition is satisfied.
Sufficient condition: The ionization temperature must be within 15% of the excitation temperature. The Saha–Eggert [38] equation given by Equation (5) is used to obtain ionization temperature:
ln   I m n   I I A k i I g k I λ I I I k i I A m n I I g m I I λ I = ln ( 2 ( 2 π k T m e ) 2 3 N e h 3 ) ( V + + E I I + E I ) k T i o n ,
where me is the electron mass, h is Planck’s constant, V + is the first ionization potential of the element, EII and EI are the upper energy levels of the ionic and atomic species of the element having transition probabilities AmnII and AkiI and statistical weights gmII and gkI [38,39]. We have plotted the Saha–Boltzmann curve for the element Si of all the samples and calculated the ionization temperature. Figure 6 shows the plot for sample S_1. The calculated ionization and excitation temperatures for all the samples are summarized in Table 4. It shows that for all the samples, both calculated temperatures are in good agreement and remain within a range of 15%. Thus, the sufficient condition is also verified.

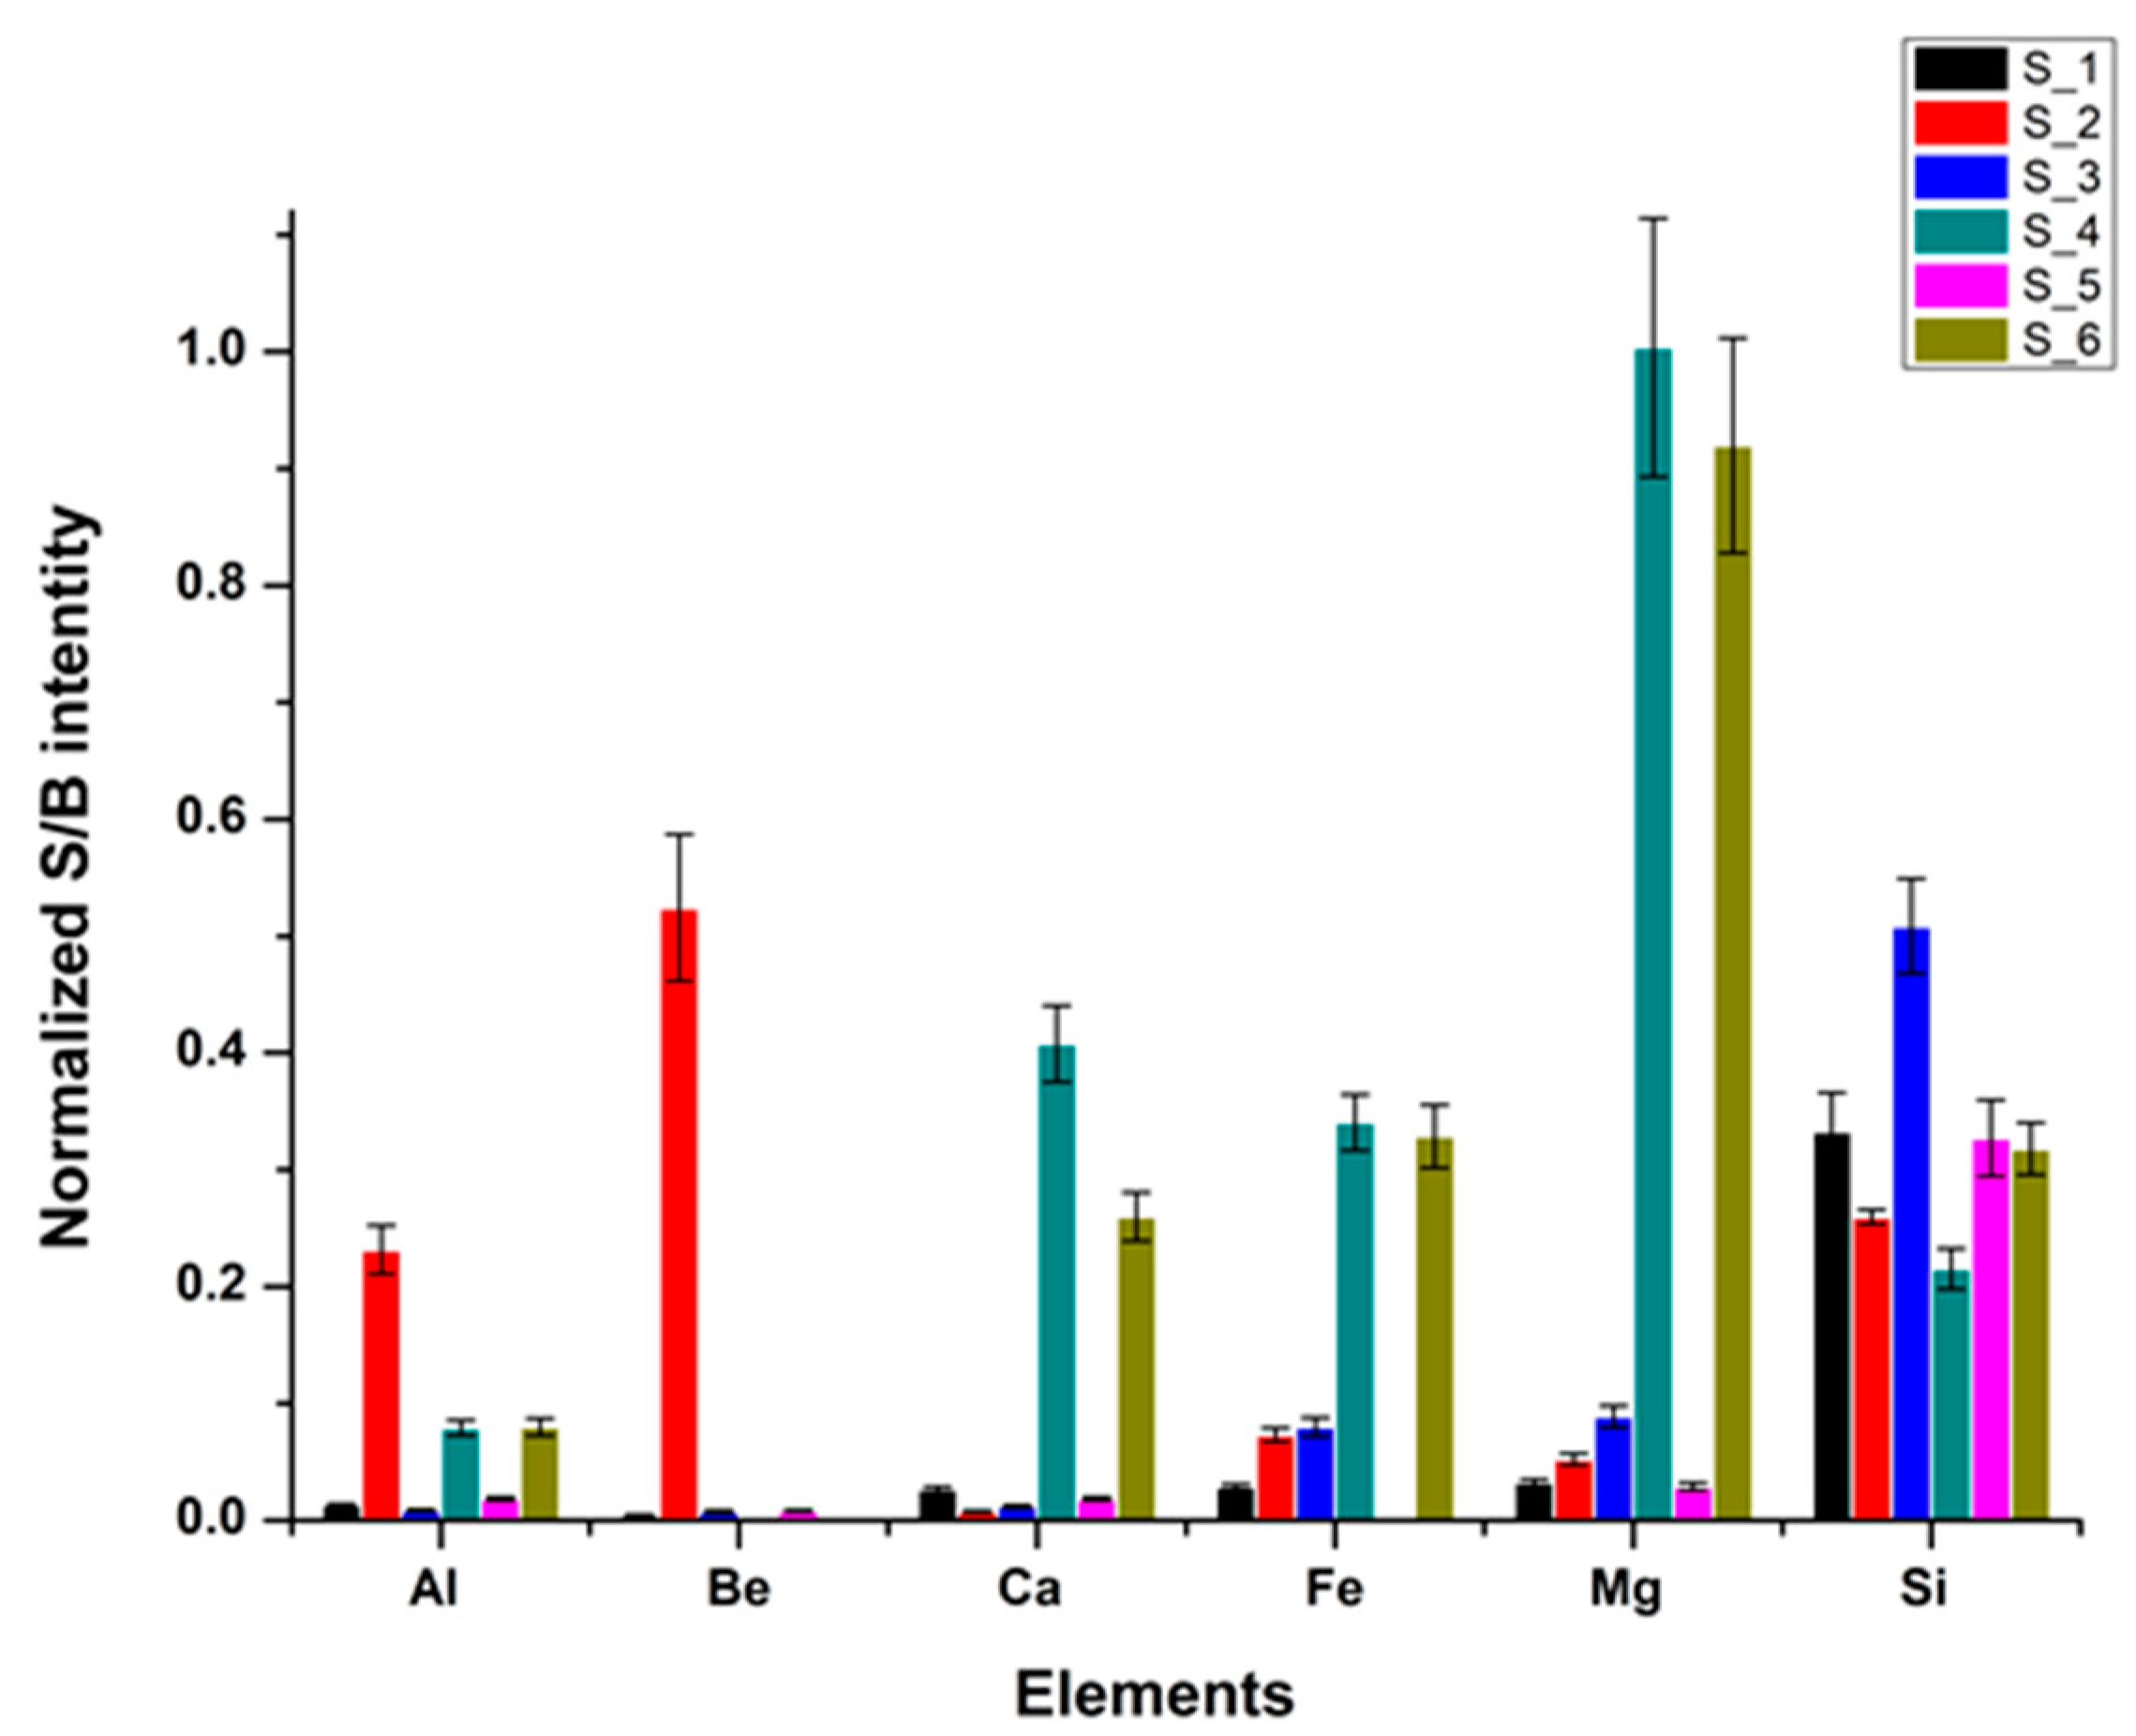
3.2.4. Comparative Study of the Elemental Composition of Gemstones

As in LIBS, the spectral intensity is directly proportional to the concentration of the constituent in the sample and therefore the variation of the spectral intensity represents the variation in the concentration of the constituents in the different samples [38,39,40]. Therefore, the intensities of spectral lines have been used to evaluate the relative concentration of the elements present in different gemstones. Instead of calculating the absolute spectral intensity, the signal-to-background (S/B) intensity ratio has been calculated to avoid any experimental parameter variation. A comparative bar graph of (S/B) is shown in Figure 7. The uncertainties shown here are the standard deviations obtained from the spectral lines present in multiple spectra. If one looks for Si intensity, the comparison graph plot shows that the quartz samples (S_1, S_3, and S_5) contains a larger quantity of Si than the other minerals. The quartz is a pure silica mineral with approximately 47% (mineral formula) of Si while the other three gemstones, aquamarine beryl (S_2), diopside (S_4), and enstatite (S_6), have approximately 31%, 26%, and 28%, respectively. If we consider only the three quartz samples, it can be observed that heliotrope (S_3) shows the greatest quantity of Si. SR-XRD analysis of a heliotrope gemstone from Palantine hill, Rome (Italy) reveals that it contains 94% quartz and 1.6 % hematite. PIXE analysis of the same sample shows 46% Si concentration and 0.56% Fe concentration [32]. The LIBS results of the present study are in agreement with mineral formulas. At this point, however, it would be important to know the characteristics of the other samples. Sample S_2 (aquamarine beryl; Be3Al2Si6O18) may have approx. 5% Be and 16% Al. In an earlier study, the EPMA technique was used for the quantitative analysis of beryls from Zealand Station, Canada. It suggested that the average Fe concentration ranges from 0.83 to 1.22 wt.%, with a maximum iron content of 1.4 wt.%, whereas the aluminum concentration ranged from 16.98 to 17.78 wt.% Al2O3 [42]. The highest reported concentration of iron in aquamarine beryl is 5.94% from Yukan, Canada, found by Turner et al. [43]. The amounts of Al and Be in the S_2 sample are larger than in the other gemstone samples since they contain these elements only as impurities.
Diopside and enstatite are inosilicates and belong to the group of pyroxenes. They represent end members of pyroxene quadrilateral (diopside–hedenbergite–enstatite–ferrosilite). Diopside is a clinopyroxene while enstatite is an orthopyroxene. The composition of clinopyroxenes ranges between that of diopside and (MgCaSi2O6) and hedenbergite (FeCaSi2O6), whereas orthopyroxenes are a series between enstatite (MgSiO3) and ferrosilite (FeSiO3). LIB spectral data show that the Mg level in the S/B intensity ratio is higher for diopside and enstatite than for the other gemstones investigated. The LIB spectral analysis for the diopside sample investigated in this work differs significantly from that of the ideal diopside. The level of Al and Fe is high in diopside. Previous studies [34,35,44] suggest that in high-temperature and low-pressure conditions, diopside forms a solid-solution series with the Ca-Al-Tschermak’s molecule (CATS–CaAl2SiO6). Aluminian-diopside can be considered as an intermediate member of this series. In the aforementioned natural conditions, Al-diopside can form through the reaction of diopside and anorthite (CaAl2Si2O8). Grave et al. [35] stated that significant ionic substitution is common in pyroxene solid solutions. An investigation of pyroxene crystals from the region of Andranondambo in southern Madagascar was carried out with different techniques [45], and EPMA and Mössbauer data showed a significant amount of Fe. Other studies investigated the inter-diffusion of Fe-Mg in diopside crystal at high temperatures (900 °C to 1240 °C) and suggested Fe as a major impurity Fe/(Fe+Mg) = 6 at.% [46].
LIB spectral data reveal that the intensity levels of Ca and Fe in the enstatite sample are as high as those in which these elements are minor impurity. Orthopyroxene can contain small amounts of Ca (approximately 10%). The sample investigated by the LIBS technique may have Ca in solid solution. The comparative graph shown in Figure 7 suggests that Ca in enstatite lattice is much depleted compared to diopside, and there might be a possibility that the composition of sample S_6 may be closer to the hypersthene end member, which has a higher Fe content than enstatite. The semi-quantitative analysis of LIB spectral data demonstrates a good agreement with different literature data. Hence, the analysis of gemstones by the LIBS technique can be successfully applied for their characterization, identification, and quantification simultaneously.

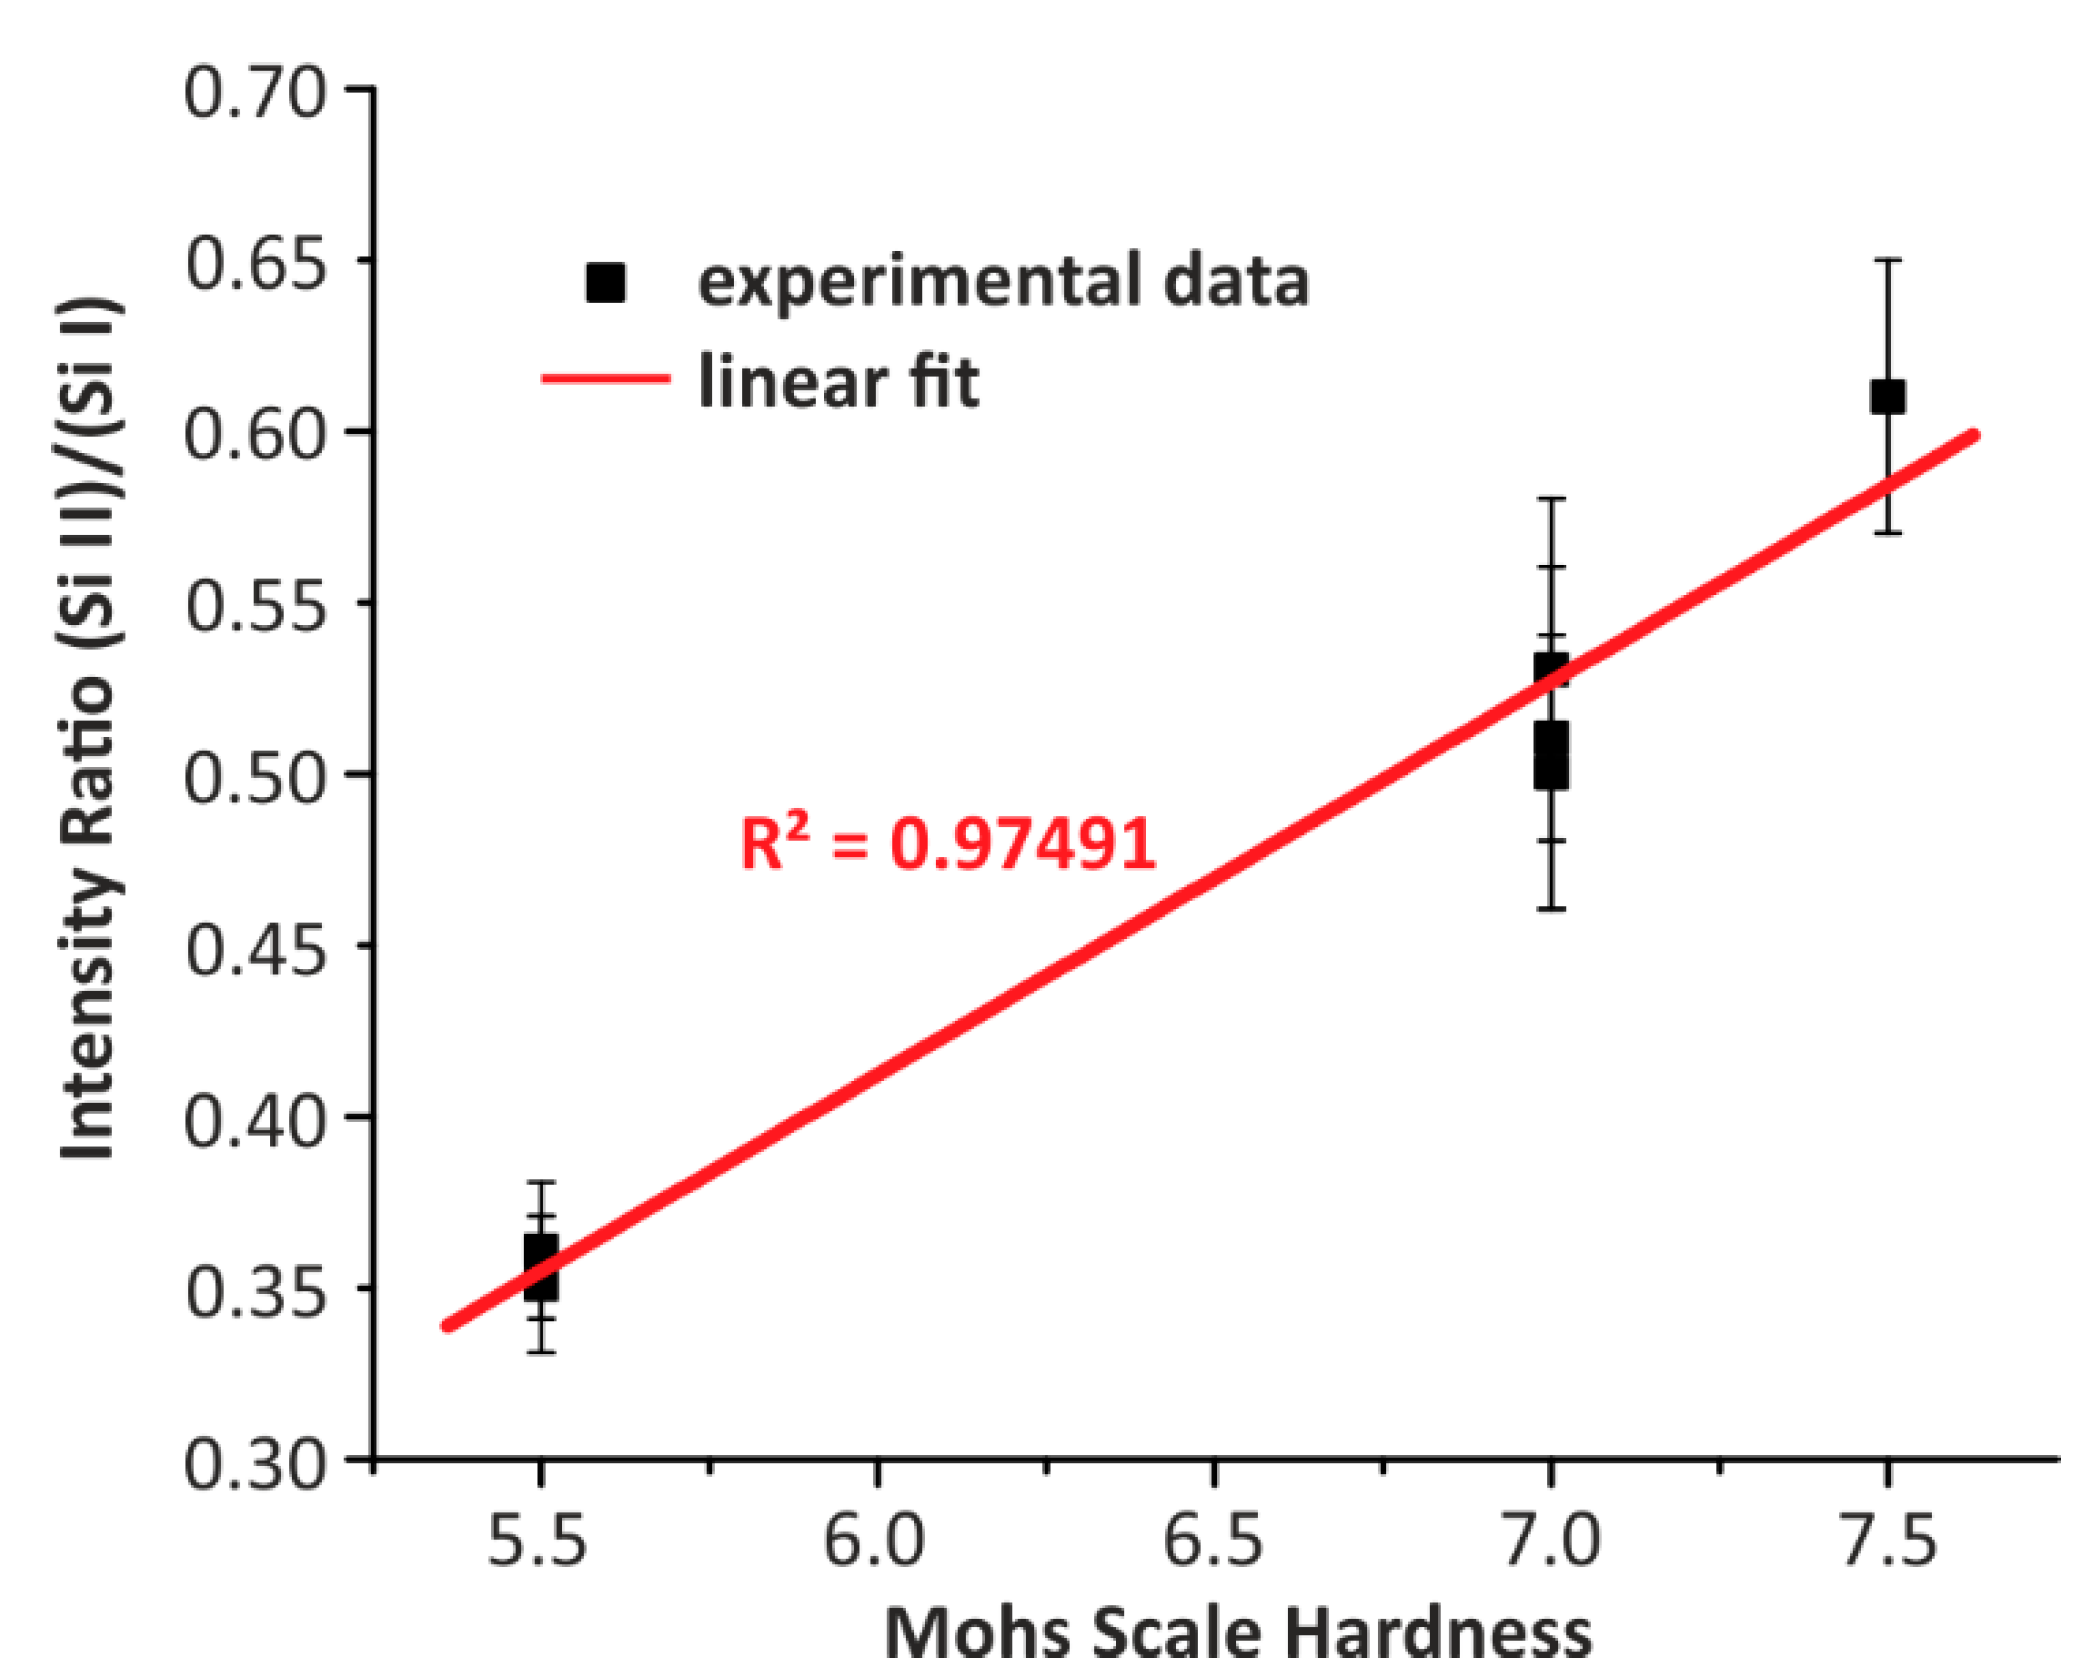
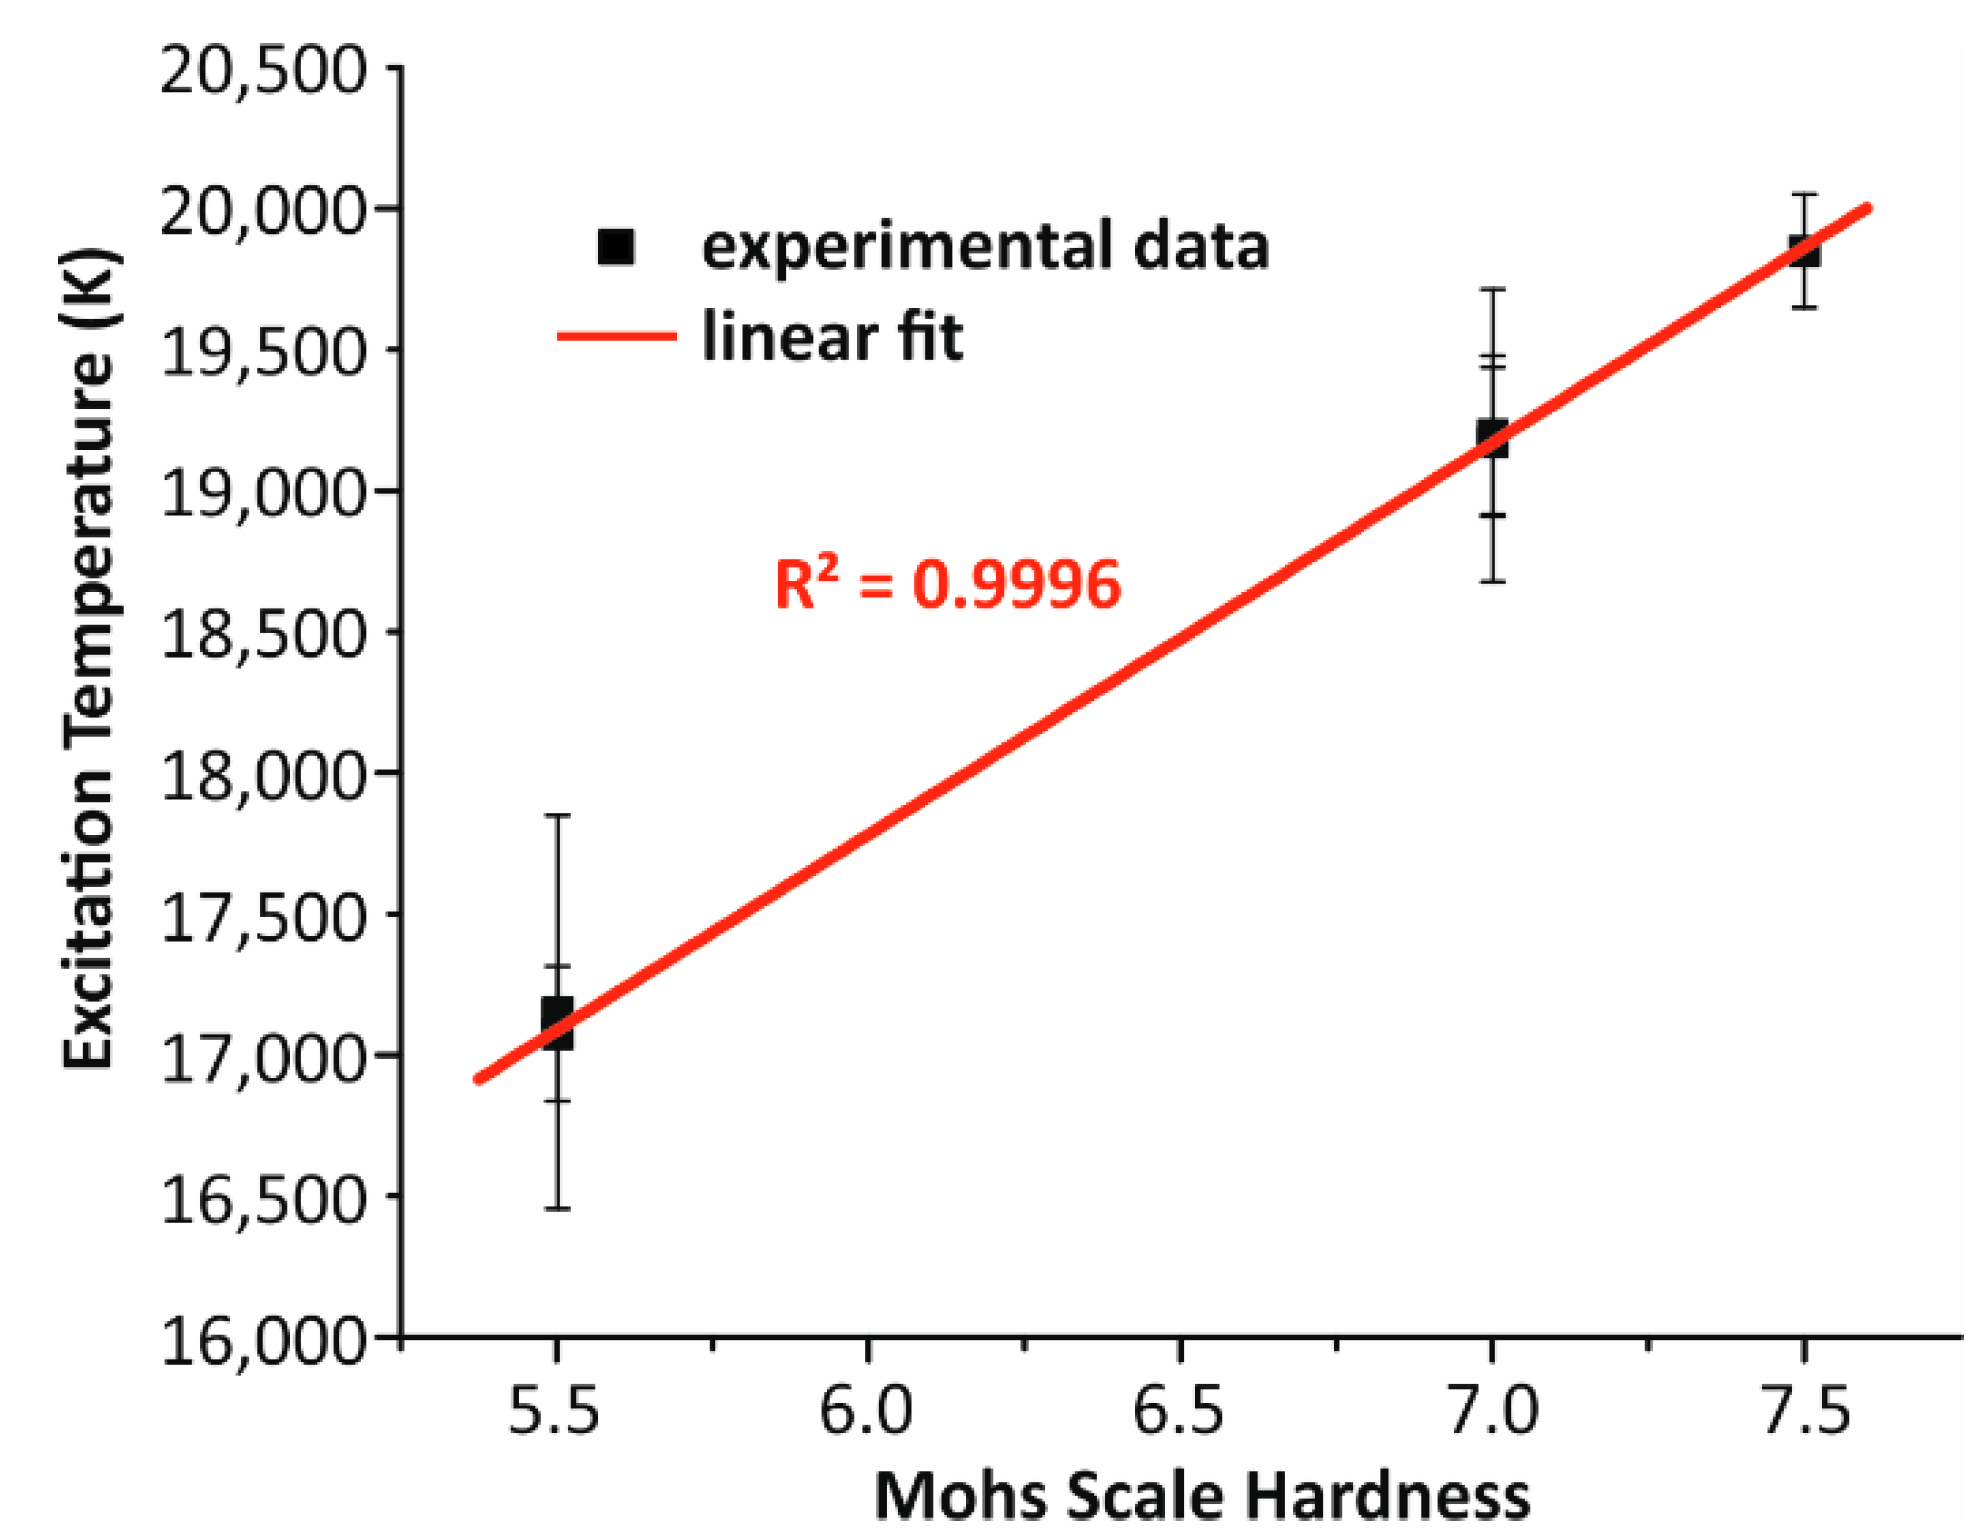
3.3. Correlation between Relative Hardness of Gemstones by LIBS Analysis to Mohs’s Scale of Hardness

To identify and assess the properties of minerals and metallic substances as a basic tool, geologists use the scratch hardness test, which was created nearly two centuries ago by Mohs [47]. The Mohs’s hardness scale is a relative scale consisting of ten arbitrary minerals (1: talc, 2: gypsum, 3: calcite, 4: fluorite, 5: apatite, 6: orthoclase, 7: quartz, 8: topaz, 9: corundum, and 10: diamond) arranged in an increasing order of hardness such that each mineral will scratch the one on the scale below it, but will not scratch the one above it. There are also some minerals with a hardness in between two consecutive whole numbers [48]. The relative Mohs’s hardness values of the gemstone samples are listed in Table 6, together with the SiII/SiI intensity ratio determined from the LIB spectra. Table 6 shows that the Mohs’s hardness of sample S_4 and S_6 is the same value, 5.5, whereas the hardness of the samples S_1 and S_5 is 7, and hardness of S_3 ranges from 6.5–7. The scale is a relative scale consisting of ten arbitrary minerals.
Previous works proposed that the surface hardness can be measured by the LIBS technique [49,50,51]. Tsuyuki et al. [49] reported that the intensity ratio of ionic to the neutral line of calcium is proportional to the compressive strength of target concrete samples. Later, this method was used by Pathak et al. [50] and Cowpe et al. [51] to study the surface hardness. The phenomenon is explained as an effect produced by the laser-induced shock wave. The speed of the shock wave of a hard target sample will be higher than that of a soft target sample, resulting in an increment in the ionization’s effectiveness [50]. Thus, to investigate the hardness of gemstones, separated and resolved spectral lines of Si have been used in this work. The spectral line intensity ratios for Si II at 634.7 nm to Si I at 250.67 nm of all samples were calculated and the results are listed in Table 6. The values given represent the averages of fifteen acquired spectra for each of the six gemstone samples.
It is clear from Table 6 that the ratios for samples S_1, S_3, and S_5 are approximately 0.5, for S_4 and S_6 it is 0.35, and for S_2 it is 0.61. This shows a clear trend with the Mohs’s hardness values. Figure 8 shows a plot of the relative hardness forecasted through LIBS versus the Mohs’s hardness. The values obtained by the two methods have a good correlation (regression coefficient R2 = 0.97). The increase in the ionic to atomic line intensity ratio with increasing the Mohs’s hardness is related to the competition between the ionization and recombination mechanisms in the plasma.
This method of hardness determination using the intensity ratio of ionic to atomic lines of LIB spectral data is based on the measurement of the relative intensity of two lines. It is highly critical to choose a resolved and separate spectral line for all the samples. To avoid this complication, plasma temperature can be used to estimate relative hardness as an alternative approach. Since the temperature is calculated from multiple spectral lines, it is more reliable. Figure 9 shows the correlation between the plasma excitation temperature and the Mohs’s hardness. It shows a nearly perfect linear relationship such that harder samples are characterized by a higher excitation temperature. As in the harder sample, a concise part of the laser pulse is used for the formation of the plasma, and the remainder is used to heat the plasma because hard samples have a lower breakdown threshold; thus, the spectral line intensity of ionic lines is higher.

3.4. Classification of Gemstones by Principal Component Analysis of LIBS Data

To summarize the assembly of the data in a lower-dimensional space, principal component analysis, an established chemometric data analysis tool, has been applied to the data in the 220–800 nm LIB spectral range for the robust identification and classification of these gemstones. To compute the PCs, a mean vector is computed in the first step, and a mean adjusted matrix is formed. A covariance matrix is calculated for this mean matrix which contains the redundant information, and it explains how the variables of the input data relate to the mean [52,53]. Further eigenvectors of the covariance matrix are computed to find the principal components. Principal components are basically a linear combination of the initial variables. Principal components are constructed in such a way that the first principal component accounts for the maximum possible variance; further, the second principal component, which is perpendicular to the first PC, accounts for the next highest variance; the next PCs are calculated similarly. Figure 10a illustrates the 3-D score plot obtained from the PCA of LIB spectral data of gemstones in the 230–800 nm spectral range. The 3-D score plot demonstrating three PCs (PC1, PC2, and PC3) represents an overall variance of 89% (PC-1: 55%, PC-2: 24%, PC-3: 10%) as shown in Figure 10a. Figure 10b illustrates the loadings of the three principal components (PCs) PC1, PC2, and PC3, in the analysis of LIB spectra of gemstones.
In the score plot (Figure 10a), each data point represents one spectrum. Spectra clustered together have a similar composition; similarly, spectra that are different from each other are clustered in different groups. Four gemstone samples, amethyst, aquamarine beryl, citrine, and bloodstone, can be simply distinguished by PC1. Replicates/spectra of samples S_1, S_2, S_3, and S_4 formed different groups. These specimens are on the right side of PC1 in the plot, while the other two samples, S_4 and S_6, are on the left side. Considering the qualitative and quantitative analysis of LIB spectra, it can be seen that the three samples S_1, S_3, and S_5 have almost similar compositions but PCA successfully discerned these samples on the basis of intensities of major elements. Samples S_4 and S_6 are jumbled together, validating the results discussed in Section 3.1 and Section 3.2 that these two samples have almost similar compositions and similar relative concentrations of constituents, respectively. To thoroughly explain the scattering and clustering observed in the score plot, the loading coefficient in Figure 10b was utilized. PC1 constitutes the spectral features from the atomic transitions of Si, Be, Ca, Mg, Fe, Al, Na, O, and K. Further, Si, Be, K, and O are responsible for the positive correlation of PC1 and Ca, Mg, Fe, and Ti are responsible for the negative correlation. In agreement with the results of Section 3.1 and Section 3.2, the samples with high intensity of Si and Be are positioned on the positive side and samples with high intensity of Ca and Mg are positioned on the negative side. Loadings of PC2 contain the Be, Al, Na, O, Si, Ca, and K transitions. The loading plot of PC2 (Figure 10b) shows that Si is amenable for the negative correlation of S_1, S_3, S_5, and S_6, whereas Be, Mg, and Al are responsible for the positive correlation. It can be anticipated by PCA that S_1, S_3, S_5, and S_6 have a greater relative concentration of Si as compared to S_2 and S_4, whereas Be and Al are higher in sample S_2, and Mg is high in S_4 [52]. The same results have been obtained by the quantitative analysis of the spectral data of the gemstones. As in Figure 10b, the sample with the highest intensity of Si is located on the positive side of PC3. This supports the results of Section 3.2 that sample S_3 has a high intensity of Si as compared to the others. The present result differentiates the above six samples without analyzing the spectral line and their intensity as acquired in the sections on qualitative analysis and semi-quantitative analysis. Moreover, it can also be seen from the score plot (Figure 10a) that the samples are also arranged according to their hardness. Samples S_1, S_3, and S_5 with same hardness are closely arranged and situated at the right side of PC1 while samples S_4 and S_6 with same hardness are mixed together and positioned at the left side of PC1. The hardest sample among all studied in this work, sample S_2, is found in a different place.

4. Conclusions

A compositional analysis based on the spectral signature of gemstones was performed with minimal destruction. The relative hardness of six gemstones was estimated for the first time using the LIBS technique. The relative hardness measured by LIBS shows a good correlation with the Mohs’s hardness values. In the present work, we established that the excitation temperature and hardness on Mohs’s scale exhibit a linear correlation. Instead of an ionic to atomic spectral line ratio, the excitation temperature can be used to estimate the hardness of gemstones.
LIBS can also detect trace elements responsible for the coloration in gemstones. Fe is responsible for the purple color of amethyst while Al is for the pale yellow color of citrine. With the help of LIBS accompanied by chemometrics, one can classify the different types of samples on the basis of clustering in the score plot, and the corresponding loading plot can give the information about the elements responsible for the classification. If there are large numbers of unknown samples with a similar composition, LIBS analysis alone may take a longer time to differentiate, but with the help of the multivariate analysis of the LIB spectral data, the classification can be performed quickly. If a library of known gemstone samples is available, then any type of unknown gemstone can be identified easily and quickly by using PCA of the LIB spectral data.

Author Contributions

Conceptualization, Methodology, Formal analysis, Investigation, Writing—original draft preparation, S.D.; Investigation, Writing—review and editing, R.K.; Writing—review and editing, A.K.R. (Abhishek K. Rai); Resources, Writing—review and editing, J.K.P., J.K.; Figure editing, J.K.; Writing—review and editing, Supervision, A.K.R. (Awadhesh K. Rai), J.K. All authors have read and agreed to the published version of the manuscript.

Funding

This research did not receive any specific grant from funding agencies in the public, commercial, or not-for-profit sectors.

Institutional Review Board Statement

Not applicable.

Informed Consent Statement

Not applicable.

Data Availability Statement

All of the data reported in the paper are presented in the main text. Any other data will be provided on request.

Acknowledgments

One of the authors, S. Dubey, is grateful to the University Grants Commission (UGC) for providing a D.Phil. Fellowship.

Conflicts of Interest

The authors declare no conflict of interest.

References

  1. Shigley, J.E. A review of current challenges for the identification of gemstones. Geologija 2008, 50, 227–236. [Google Scholar] [CrossRef]
  2. McClure, S.F.; Smith, C.P. Gemstone enhancement and detection in the 1990s. Gems Gemol. 2000, 36, 336–359. [Google Scholar] [CrossRef]
  3. Gübelin, E.J. Inclusion as a Means of Gemstone Identification; Gemological Institute of America: Carlsbad, CA, USA, 1953. [Google Scholar]
  4. Gübelin, E.J.; Koivula, J.I. Photoatlas of Inclusions in Gemstones; ABC Edition: Zurich, Switzerland, 1986. [Google Scholar]
  5. Ward, F. Rubies and Sapphires; Gem Book Publishers: Bethesda, MD, USA, 1995. [Google Scholar]
  6. Hughes, R.W. Ruby and Sapphire; RWH Publishing: Boulder, CO, USA, 1997. [Google Scholar]
  7. Abduriyim, A.; Kitawaki, H. Determination of the origin of blue sapphire using laser ablation inductively coupled plasma mass spectrometry (LA-ICP-MS). J. Gemmol. 2006, 30, 23–36. [Google Scholar] [CrossRef]
  8. Devouard, A.; Notari, F. The identification of faceted gemstones; from the naked eye to laboratory. Elements 2009, 5, 163–168. [Google Scholar] [CrossRef]
  9. Muhlmeister, S.; Fritsch, E.; Shigley, J.E.; Devouard, B.; Laurs, B.M. Separating natural and synthetic rubies on the basis of trace-element chemistry. Gems Gemol 1998, 43, 80–101. [Google Scholar] [CrossRef]
  10. Calligaro, T.; Piorot, J.P.; Querré, G. Trace element fingerprinting of jewelry rubies by external beam PIXE. Nucl. Instrum. Meth. B 1999, 150, 628–634. [Google Scholar] [CrossRef]
  11. Gray, A.L. Solid sample introduction by laser ablation for inductively coupled plasma source mass spectrometry. Analyst 1985, 110, 551–556. [Google Scholar] [CrossRef]
  12. Günther, D.; Kane, R.E. Laser ablation-inductively coupled plasma-mass spectrometry: A new way of analyzing gemstones. Gems Gemol. 1999, 35, 160–161. [Google Scholar]
  13. Peucat, J.J.; Ruffault, P.; Fritsch, E.M.; Le Coz, B.; Simonet, C.; Lasnier, B. Ga/Mg ratio as a new geochemical tool to differentiate magmatic from metamorphic blue sapphire. Lithos 2007, 98, 261–274. [Google Scholar] [CrossRef]
  14. Guillong, M.; Günther, D. Quasi “non-destructive” laser ablation-inductively coupled plasma-mass spectrometry fingerprinting of sapphires. Spectrochim. Acta Part B At. Spectrosc. 2001, 56, 1219–1231. [Google Scholar] [CrossRef]
  15. Pornwilard, M.M.; Hansawek, R.; Shiowatana, J.; Siripinyanond, A. Geographical origin classification of gem corundum using elemental fingerprint analysis by laser ablation inductively coupled plasma mass spectrometry. Int. J. Mass Spectrom. 2011, 306, 57–62. [Google Scholar]
  16. Breeding, C.M.; Shen, A.H. Developments in gemstone analysis techniques and instrumentation during the 2000s. Gems Gemol. 2010, 46, 241–257. [Google Scholar] [CrossRef]
  17. Cremers, D.A.; Radziemski, L.J. Handbook of Laser-Induced Breakdown Spectroscopy; Wiley: New York, NY, USA, 2006. [Google Scholar]
  18. Harmon, R.S.; Remus, J.; McMillan, N.J.; McManus, C.; Collins, L.; Gottfried, J.L., Jr.; de Lucia, F.C.; Miziolek, A.W. LIBS analysis of geomaterials: Geochemical fingerprinting for the rapid analysis and discrimination of minerals. J. Appl. Geochem. 2009, 24, 1125–1141. [Google Scholar] [CrossRef]
  19. Pagnotta, S.; Lezzerini, M.; Campanella, B.; Legnaioli, S.; Poggialini, F.; Palleschi, V. A new approach to non-linear multivariate calibration in laserinduced breakdown spectroscopy analysis of silicate rocks. Spectrochim. Acta Part B At. Spectrosc. 2020, 166, 105–804. [Google Scholar] [CrossRef]
  20. Ytsma, C.R.; Knudson, C.A.; Dyar, M.D.; McAdam, A.C.; Michaud, D.D.; Rollosson, L.M. Accuracies and detection limits of major, minor, and trace element quantification in rocks by portable laser-induced breakdown spectroscopy. Spectrochim. Acta Part B At. Spectrosc. 2020, 171, 105946. [Google Scholar] [CrossRef]
  21. Kochelek, K.A.; McMillan, N.J.; McManus, C.E.; Daniel, D.L. Provenance determination of sapphires and rubies using laser-induced breakdown spectroscopy and multivariate analysis. Am. Mineral. 2015, 100, 1921–1931. [Google Scholar] [CrossRef]
  22. McManus, C.E.; McMillan, N.J.; Harmon, R.S.; Whitmore, R.C.; De Lucia, F.C., Jr.; Miziolek, A.W. Use of laser induced breakdown spectroscopy in the determination of gem provenance: Beryls. Appl. Opt. 2008, 47, G72–G79. [Google Scholar] [CrossRef]
  23. Suastika, K.G.; Suyanto, H.; Gunarjo, S. Characterization of amethysts from Sukamara, central Kalimantan, using laser-induced breakdown spectroscopy (LIBS). J. Phys. Soc. Indones. 2019, 1, 9–12. [Google Scholar]
  24. Klemme, S.; Berndt, J.; Mavrogonatos, C.; Flemetakis, S.; Baziotis, I.; Voudouris, P.; Xydous, S. On the color and genesis of prase (green Quartz) and amethyst from the island of Serifos, Cyclades, Greece. Minerals 2018, 8, 487. [Google Scholar] [CrossRef] [Green Version]
  25. Cox, R.T. Optical absorption of the d4 ion Fe4+ in pleochroic amethyst quartz. J. Phys. Conf. Ser. 1977, C10, 4631–4643. [Google Scholar]
  26. Fritsch, E.; Rossman, G.R. An update on color in gems—Part 2: Colors involving multiple atoms and color centers. Gems Gemol. 1988, 24, 3–15. [Google Scholar] [CrossRef] [Green Version]
  27. Viana, R.R.; da Costa, G.M.; de Grave, E.; Evangelista, H.J.; Stern, W.B. Characterization of Beryl (aquamarine variety) by Mossbauer spectroscopy. Phys. Chem. Miner. 2002, 29, 78–86. [Google Scholar] [CrossRef]
  28. Goldman, D.S.; Rossman, G.R.; Parkin, K.M. Channel constituents in beryl. Phys. Chem. Miner. 1978, 3, 225–235. [Google Scholar] [CrossRef]
  29. Rossman, G.R. Origin of Color in Pegmatite Minerals. In The Mineralogy of Pegmatites, Proceedings of the Mineralogical Society of America—Friends of Mineralogy Symposium, Tuscon, AZ, USA, 15–16 February 1981; Brown, G.E., Ed.; Mineralogical Society of America: Chantilly, VA, USA, 1981; pp. 1–6. [Google Scholar]
  30. Heaney, P.J.; Prewitt, C.T.; Gibbs, G.V. Reviews in mineralogy, silica physical behaviour. Geochem. Mater. Appl. 1994, 29, 1–40. [Google Scholar]
  31. Schlegel, D.M. Gem Stones of the United States; Issue 1042; U.S. Government Printing Office: Washington, DC, USA, 1957. [Google Scholar]
  32. Gliozzo, E.; Grassi, N.; Bonanni, P.; Meneghini, C.; Tomei, M.A. Gemstones from vignabarberini at the palatine hill (Rome, Italy). Archaeometry 2011, 53, 469–489. [Google Scholar] [CrossRef]
  33. Jhang, Y.P.; Sakurai, K. Inter-correlation of impurity trace elements in bloodstone rock: X-ray fluorescence mapping studies. J. Anal. At. Spectrom. 2009, 24, 1579–1583. [Google Scholar]
  34. Deer, W.A.; Howie, R.A.; Zussman, J. Rock-Forming Minerals: Single-Chain Silicates, 2nd ed.; Wiley: New York, NY, USA, 1978. [Google Scholar]
  35. Grave, J.D.; Paepe, P.D.; Grave, E.D.; Vochten, R.; Eeckhout, S.G. Mineralogical and Mössbauer spectroscopic study of a diopside occurring in the marbles of Andranondambo, southern Madagascar. Am. Mineral. 2002, 87, 132–141. [Google Scholar] [CrossRef]
  36. Samoilovich, M.I.; Tsinober, L.I.; Kreiskop, V.N. The nature of radiation- produced citrine coloration in Quartz. Sov. Phys. Crystallogr. 1969, 13, 626–628. [Google Scholar]
  37. Maschmeyer, D.; Lehmann, G. New Hole Centers in Natural Quartz. Phys. Chem. Miner. 1983, 10, 84–88. [Google Scholar] [CrossRef]
  38. Singh, J.P.; Thakur, S.N. Laser-Induced Breakdown Spectroscopy, 1st ed.; Elsevier: Amsterdam, The Netherlands, 2007. [Google Scholar]
  39. Kumar, R.; Tripathi, D.K.; Devanathan, A.; Chauhan, D.K.; Rai, A.K. In-situ monitoring of chromium uptake in different parts of the wheat seedling (triticumaestivum) using laser-induced breakdown spectroscopy. Spectrosc. Lett. 2014, 47, 554–563. [Google Scholar] [CrossRef]
  40. Maurya, G.S.; Kumar, R.; Kumar, A.; Rai, A.K. Analysis of impurities on contaminated surface of the tokamak limiter using laser induced breakdown spectroscopy. Spectrochim. Acta Part B At. Spectrosc. 2016, 126, 17–22. [Google Scholar] [CrossRef]
  41. Griem, H.R. Plasma Spectroscopy; McGraw-Hill: New York, NY, USA, 1964. [Google Scholar]
  42. Beal, K.; Lentz, D.R. Aquamarine beryl from Zealand Station, Canada: A mineralogical and stable isotope study. J. Geosci. 2010, 55, 57–67. [Google Scholar] [CrossRef] [Green Version]
  43. Turner, D.; Groat, L.E.; Hart, C.J.R.; Mortensen, J.K.; Linnen, R.L.; Giuliani, G.; Wengzynowski, W. Mineralogical and geochemical study of the True-Blue aquamarine showing, southern Yukon, Canada. Mineralogist 2007, 45, 203–227. [Google Scholar] [CrossRef]
  44. Huckenholz, H.G.; Lindhuber, W.; Springer, J. The join CaSiO3-Al2O3-Fe2O3 of the CaO-Al2O3-Fe2O3-SiO2 quaternary system and its bearing on the formation of granditic garnets and fassaitic pyroxenes. Neues Jahrbuch für Mineralogie 1974, 121, 160–207. [Google Scholar]
  45. Wood, B.J. Mixing properties of tschermakitic pyroxenes. Am. Miner. 1976, 61, 599–602. [Google Scholar]
  46. Dimanov, A.; Sautter, V. “Average” interdiffusion of (Fe, Mn)-Mg in natural diopside. Eur. J. Miner. 2000, 12, 749–760. [Google Scholar] [CrossRef]
  47. Tabor, D. The hardness of solids. Rev. Phys. Technol. 1970, 1, 145–179. [Google Scholar] [CrossRef]
  48. Tabor, D. Mohs’s Hardness Scale—A Physical Interpretation. Proc. Phys. Soc. Sect. B 1954, 67, 249–257. [Google Scholar] [CrossRef]
  49. Tsuyuki, K.; Miura, S.; Idris, N. Measurement of concrete strength using the emission intensity ratio between Ca (II) 396.8 nm and Ca (I) 422.6nm in a Nd: YAG laser-induced plasma. Appl. Spectrosc. 2006, 60, 61–64. [Google Scholar] [CrossRef]
  50. Pathak, A.K.; Singh, A.; Kumar, R.; Rai, A.K. Laser-induced breakdown spectroscopy coupled with PCA study of human tooth. Natl. Acad. Sci. Lett. 2019, 42, 87–90. [Google Scholar] [CrossRef]
  51. Cowpe, S.; Moorehead, R.D.; Moser, D.; Astin, J.S.; Karthikeyan, S.; Kil-Coyne, H.; Crofts, G.; Pilkington, R.D. Hardness determination of bio-ceramics using laser-induced breakdown spectroscopy. Spectrochim. Acta Part B At. Spectrosc. 2011, 66, 290–294. [Google Scholar] [CrossRef] [Green Version]
  52. Awasthi, S.; Kumar, R.; Rai, G.K.; Rai, A.K. Study of archaeological coins of different dynasties using libs coupled with multivariate analysis. Opt. Lasers Eng. 2016, 79, 29–38. [Google Scholar] [CrossRef]
  53. Rai, A.K.; Pati, J.K.; Parigger, C.G.; Rai, A.K. Plasma Spectroscopy of Various Types of Gypsum: An Ideal Terrestrial Analogue. Atoms 2019, 7, 72. [Google Scholar] [CrossRef] [Green Version]
Figure 1. The gemstones analyzed during the present study are shown here. (a) Amethyst (S_1), (b) aquamarine beryl (S_2), (c) bloodstone (S_3), (d) diopside, (e) citrine (S_5), (f) enstatite (S_6).
Applsci 11 06156 g001
Figure 2. Experimental setup to record LIB spectra of gemstone samples.
Applsci 11 06156 g002
Figure 3. Average LIB spectra of gemstone samples. (a) Amethyst, (b) aquamarine beryl, (c) bloodstone, (d) diopside, (e) citrine, and (f) enstatite in the wavelength range of 230–850 nm.
Applsci 11 06156 g003
Figure 4. Boltzmann plot for LIB spectra of sample S_1.
Applsci 11 06156 g004
Figure 5. Lorentzian plot of the atomic line of Ca present in the LIB spectra of sample S_1.
Applsci 11 06156 g005
Figure 6. Saha–Boltzmann plot for calculating ionization temperature from the data of sample S_1.
Applsci 11 06156 g006
Figure 7. Normalized S/B ratio of the different elements present in all the investigated samples.
Applsci 11 06156 g007
Figure 8. Silicon ionic to atomic ratio vs. Mohs’s hardness of gemstone samples.
Applsci 11 06156 g008
Figure 9. Excitation temperature vs. Mohs’s hardness.
Applsci 11 06156 g009
Figure 10. (a) 3-D score plot of PCA plotted for LIB spectral data of gemstone samples; (b) loading plot of the first three PCs from PCA applied to LIB spectral data of gemstone samples.
Applsci 11 06156 g010
Table 1. Characteristics of the gemstone samples.
Sample NameGemstone TypeHardness (Mohs’s Scale)Refractive IndexSpecific GravitySize (l, b, h) (in cm)Weight (in gm)Chemical Composition(Ideal Elemental Concentrations in wt.%)
S_1Amethyst71.54–1.552.65(1.39, 0.98, 0.48)0.8010SiO2(Si = 47%, O = 53%)
S_2Aquamarine beryl7.51.57–1.582.68–2.71(0.92, 0.58, 0.31)0.4758Be3Al2Si6O18(Si = 31%, Al = 10%, Be = 5%, O = 54%)
S_3Bloodstone71.53–1.552.62–2.64(1.11, 1.17, 0.81)0.6738SiO2(Si = 47%, O = 53%)
S_4Diopside5.51.67–1.703.29(1.75, 1.14, 0.91)4.0850CaMgSi2O6(Ca = 18.5%, Mg = 11%, Si = 26%, O = 44%)
S_5Citrine71.54–1.552.65(1.23, 0.74, 0.48)0.7285SiO2(Si = 47%, O = 53%)
S_6Enstatite5.51.66–1.673.26–3.28(1.15, 0.78, 0.64)1.1273MgSiO3(Mg = 24%, Si = 28% O = 48%)
Table 2. Elements observed and their corresponding wavelengths in gemstone samples. Wavelengths are given in nm.
SpeciesS_1S_2S_3S_4S_5S_6
H656.3 (I)656.3 (I)656.3 (I)656.3 (I)656.3 (I)656.3 (I)
Be313.0, 313.1 (II)234.9, 265.0, 332.1, 457.2 (I), 313.0 (II)313.0, 313.1 (II)-313.0, 313.1 (II)-
N742.5, 744.3, 746.9 (I)742.2, 744.2, 746.7 (I)742.3, 744.1, 746.7 (I)742.3, 744.1, 746.7 (I)742.3, 744.1, 746.7 (I)742.3, 744.1, 746.7 (I)
O777.2, 844.6 (I)777.1, 844.6 (I)777.2, 844.5 (I)777.2, 844.5 (I)777.2, 844.5 (I)777.2, 844.5 (I)
Na589.0, 589.6 (I)588.9, 589.5 (I)588.9, 589.5 (I)588.9, 589.5 (I)588.9, 589.5 (I)588.9, 589.5 (I)
Mg279.1, 279.5, 280.3 (II), 285.21 (I)279.0, 279.5, 280.2 (II), 285.2 (I)279.0, 279.5, 280.2 (II), 285.2, 516.7, 517.2, 518.3 (I)277.9, 278.0, 285.2, 383.2, 383.9, 516.7, 517.2, 518.3 (I), 279.0, 279.5, 280.2, 448.1 (II)279.1, 279.5, 279.8, 280.2 (I), 285.2279.1, 279.5, 279.8, 280.(II), 285.2, 383.2, 383.(I)
Al308.2, 309.3, 394.4, 396.1 (I)281.58 (II), 308.2, 309.3, 394.4, 396.1 (I)394.4, 396.0 (II)308.2, 309.3, 394.4, 396.1 (I)308.2, 309.3, 394.4, 396.1 (I)308.2, 309.3, 394.4, 396.1 (I)
Si250.7, 251.4, 251.6, 251.9, 252.4, 252.9, 288.1 (I), 385.6, 386.2, 412.8, 413.0, 504.1, 505.6, 634.6, 637.0 (II)250.6, 251.38, 251.6, 251.9, 252.4, 252.8, 288.11 (I), 504.1, 505.6, 634.6, 637.0 (II)250.65, 251.41, 251.6, 251.9, 252.4, 252.8, 288.1 (I), 385.5, 386.2, 412.9, 504.1, 505.6 (II)250.6, 251.4, 251.6, 251.9, 252.4, 252.8, 288.1 (I), 385.5,250.7, 251.4, 251.6, 251.9, 252.32, 252.8, 288.1 (I), 385.5, 386.2, 412.8, 504.1, 505.6, 634.6, 637.0 (II)250.7, 251.4, 251.6, 251.9, 252.32, 252.8, 288.1 (I), 385.5, 386.2, 412.8, 504.1, 505.6, 634.6, 637.0 (II)
K766.3, 769.8 (I)~766.3, 769.8 (I)~~~
Ca315.9, 317.9, 370.6, 373.7, 393.33, 396.8 (II), 422.6 (I)393.3, 396.8 (II)315.8, 317.9, 393.3, 396.8 (II), 422.6 (I)315.8, 317.9, 370.6, 373.7, 393.3, 396.8 (II), 422.6, 442.5, 443.5, 445.6 (I)315.9, 317.9, 393.3, 396.8 (II), 422.6 (I)315.9, 317.9, 370.6, 373.7, 393.3, 396.8, 854.2 (II), 422.6, 442.5, 443.5, 445.6 (I)
Ti~~ 323.4, 323.6, 323.9 (II)~334.9, 336.0, 337.23, 338.3 (II)
Fe238.2, 239.6, 258.6, 259.4, 259.9 (II)238.2, 239.5, 240.4, 257.5, 258.5, 259.9, 260.7, 261.2 (II)238.2, 239.5, 240.4, 258.5, 259.9, 260.6, 261.1, 273.9, 274.9, 275.5 (I), 358.05, 373.4, 373.7, 382.0, 404.5, 438.3 (I)234.3, 238.2, 239.5, 240.5, 249.3, 252.3, 252.5, 258.5, 260.6, 261.1 (II), 358.1, 371.9, 438.4 (I)~234.3, 238.2, 239.5, 240.5, 252.8, 258.6, 259.9, 260.7, 261.2, 273.9, 274.9, 275.6 (II)
Table 3. Ratio of I/I′ and (Akigkλ′)/(A′kig′kλ) for persistent lines of Si at 250.60 and 251.44 nm for the different samples.
SampleAkigkλ′/A′kig′kλIntensity Ratio I/I′
S_11.241.10 ± 7%
S_21.241.05 ± 5%
S_31.241.02 ± 3%
S_41.241.09 ± 5%
S_51.241.05 ± 6%
S_61.241.02 ± 5%
Table 4. Excitation temperature and ionization temperature calculated by Boltzmann and Saha–Boltzmann plot.
SampleExcitation Temperature (in Kelvin)Ionization Temperature(in Kelvin)
S_119,375 ± 2%23,055 ± 1%
S_220,063 ± 1%24,469 ± 1%
S_320,406 ± 3%22,574 ± 1%
S_417,215 ± 4%18,850 ± 1%
S_519,348 ± 2%22,465 ± 1%
S_617,135 ± 2%18,437 ± 1%
Table 5. Table for the lower limit and the calculated value of electron density.
SampleLower Limit of Electron Density ×1015 (for McWhirter Criteria)Calculated Electron Density×1017
S_15.6 ± 1%5.3 ± 1%
S_25.7 ± 1%4.9 ± 1%
S_35.8 ± 2%5.4 ± 1%
S_45.3 ± 2%7.0 ± 1%
S_55.6 ± 1%5.0 ± 1%
S_65.3 ± 1%8.0 ± 1%
Table 6. Mohs’s scale hardness and LIBS SiII/SiI intensity ratio for all the gemstone samples.
SamplesMohs’s Scale HardnessSi II/Si IIntensity Ratio
S_17.00.51 ± 10%
S_27.50.61 ± 7%
S_36.5–7.00.50 ± 8%
S_45.50.36 ± 6%
S_57.00.53 ± 9%
S_65.50.35 ± 6%
Publisher’s Note: MDPI stays neutral with regard to jurisdictional claims in published maps and institutional affiliations.

