
Spectroscopic Studies of Laser-Based Far-Ultraviolet Plasma Light Source

1
Department of Sciences, Valencia College, Orlando, FL 32825, USA
2
Laser Plasma Laboratory, Center for Directed Energy Systems, College of Optics and Photonics, University of Central Florida, Orlando, FL 32816, USA
*
Author to whom correspondence should be addressed.
Appl. Sci. 2021, 11(15), 6919; https://0-doi-org.brum.beds.ac.uk/10.3390/app11156919
Submission received: 30 June 2021
/
Revised: 22 July 2021
/
Accepted: 26 July 2021
/
Published: 27 July 2021
(This article belongs to the Special Issue Laser-Driven Accelerators, Radiations, and Their Applications)
Abstract
:A series of experiments is described which were conducted to measure the absolute spectral irradiances of laser plasmas created from metal targets over the wavelength region of 123–164 nm by two separate 1.0 μm lasers, i.e., using 100 Hz, 10 ns, 2–20 kHz, 60–100 ns full-width-at-half-maximum pulses. A maximum radiation conversion efficiency of ≈3%/2sr is measured over a wavelength region from ≈125 to 160 nm. A developed collisional-radiative solver and radiation-hydrodynamics simulations in comparison to the spectra detected by the Seya–Namioka-type monochromator reveal the strong broadband experimental radiations which mainly originate from bound–bound transitions of low-ionized charges superimposed on a strong continuum from a dense plasma with an electron temperature of less than 10 eV.
1. Introduction
The vacuum-ultraviolet (VUV, with the wavelength ≈ 10–200 nm) [1], the extreme-ultraviolet (EUV, ≈ 10–121 nm) and X-ray (XR, ≈ 0.01–10 nm) spectral bands of the electromagnetic radiation have the potential for important applications, especially in the semiconductor industry for high volume manufacturing lithography (HVML) [2,3,4,5], metrology tools [6,7,8,9,10,11], and material sciences [12,13,14]. Usually, for laboratory applications, a part of the VUV radiation, the so-called far-ultraviolet (FUV), in the energy range from ≈6 to 10 eV (the corresponding wavelength region of ≈ 122–200 nm) is obtained from discharge lamps or excimer lasers. The former has drawbacks regarding achievable irradiances, whereas the latter are restricted to a few specific wavelengths. Nowadays, the pulsed-power generator-based Z-pinch type plasmas and the laser-produced plasmas (LPPs) are practical high-power radiation sources in the EUV to XR spectrum regions. LPPs have been increasingly considered as bright, broadband light sources, due to their intense radiative emission and their small plasma sizes. Particularly, LPPs generate spectral emission that includes both various line radiations due to bound–bound transitions of ion charge states and continuum components, extending from the visible to the XR regions and can be selected by the choice of the target material and laser irradiation conditions. To date, the most industrial development of LPPs sources has concentrated on microlithography applications in the EUV and XR regions.
In this study, we present calibrated spectral irradiances and the measured radiation conversion efficiencies (CEs) over the wavelength region from ≈123 to 164 nm created by a LPP source with a few solid planar targets. Additionally, a relativistic configuration-interaction flexible atomic code (FAC) [15], a developed non-local thermodynamic equilibrium (non-LTE) population kinetics code, the so-called collisional-radiative (CR) model [16,17,18], and two-dimensional radiation-hydrodynamics FLASH code [19] were used to investigate the silicon (Si) plasma dynamics created by a 1.064 μm, 10 ns full-width-at-half-maximum (FWHM) laser pulse with planar solid target. This study enabled investigating the plasma spectral features of low-ionized charge states of various elements and the CEs, especially in a high-repetition rate low-laser irradiance LPP source, as well as to benchmark the computational model.
2. Experimental Setup
We described the experimental setup employed in this study, as done in previous publications, which can be seen for example in Refs. [4,6,17,20,21]. Briefly, in the present study, two 1.0 μm lasers were used separately, a Q-switched Nd:YAG solid-state laser producing 10 ns FWHM pulses at 100 Hz repetition rate and a fiber laser operating with adjustable pulse width and repetition rate, e.g., 60–100 ns FWHM and 2–20 kHz, respectively. The output of these laser pulses was focused in vacuum by a 25.4 mm diameter, 60 mm focal length lens onto fast moving planar solid targets to create plasmas. The laser spot size diameters on the target for the 10 ns and 60–100 ns FWHM pulses were measured to be ≈120 μm ( width ≈200 μm for an ideal Gaussian pulse) and 80 μm ( width ≈135 μm), respectively. The focused beam of these two lasers generated plasmas in a pressure of ≈1.3 × Pa vacuum chamber from a rotating target having a rotational speed of ≈5 RPM. The surface of each target was aligned to the focal plane of the laser with a combination of translation and rotation stages. Linear and rotational motion was in the plane of the target surface to provide a new target surface for each laser shot. However, the target rotational speed was not fast enough to provide a fresh sample in each laser shot for the 60–100 ns beam having a 2–20 kHz repetition rate. The plasma spectral features recorded at an angle ≤15 from the target’s normal were characterized using an aberration corrected 234/302 McPherson Seya–Namioka style spectrometer, with a 1200 groove/mm grating, 200 mm focal length, 0.1 nm achievable spectral resolution (tested at the wavelength of ≈185 nm with the 10 μm wide slit), and 4 nm/mm dispersion. The spectrometer was customized with a fiber optic face plate, coupled micro-channel plate (MCP), with a cesium iodide (CsI) photocathode at the output image plane. This photocathode limits the spectral response of the spectrometer to the wavelengths shorter than ≈164 nm. A chilled charged-couple-device (CCD) array (169 μm 1024-pixel detector) with a fiber optic face plate was coupled to the MCP’s fiber optic face plate.
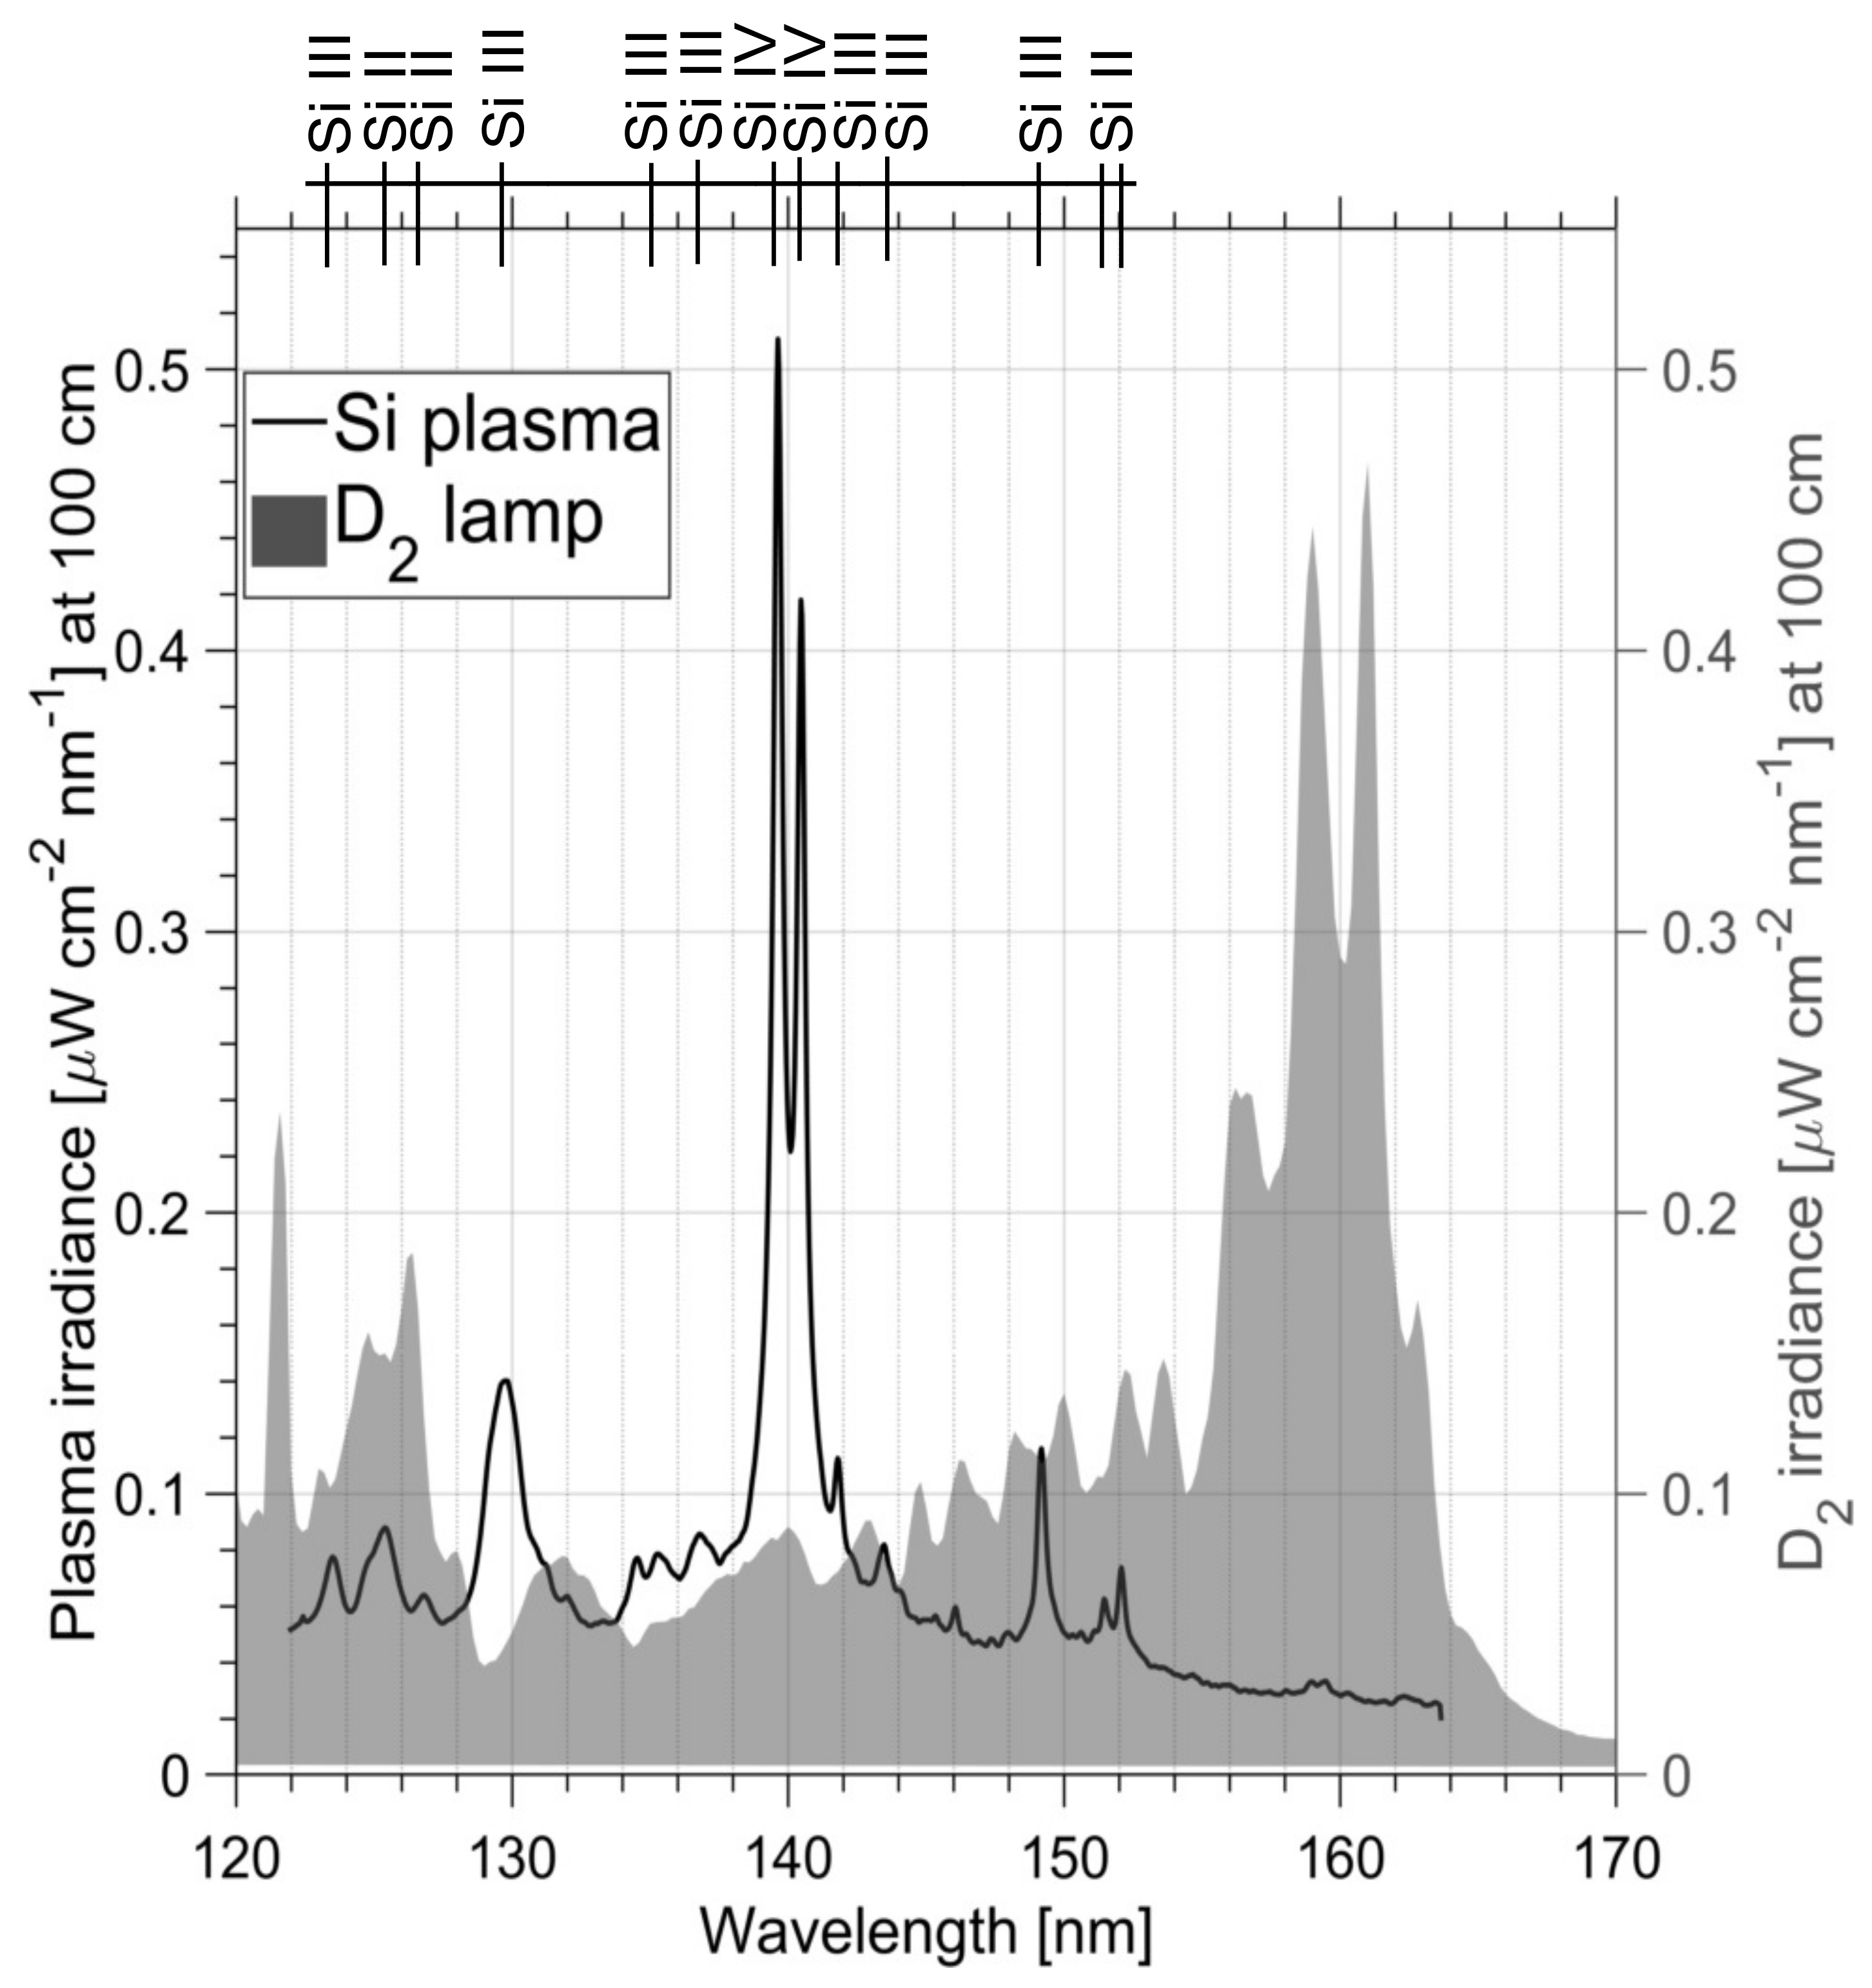
The spectrometer and its optical system were calibrated with a standard Deuterium (D) lamp (X2D2, L9841 Hamamatsu) over an equivalent distance between the source and the slit. The lamp provides the absolute calibrated irradiance data 100 cm from the lamp over the wavelength region from ≈115 to 300 nm. Furthermore, the wavelength of the spectrometer is calibrated using the spectral features of the standard D lamp. The spectral irradiance of the standard lamp is shown in Figure 1 (right ordinate in units of μW ) over the wavelength region of 120–170 nm. Using the lamp data, the instrument response correction, the so-called, “absolute radiometric response correction curve” is tabulated. An absolutely calibrated Si plasma radiation created by the 10 ns FWHM, 100 Hz laser pulse at the irradiance (I) of ≈2.5 W cm is also shown in Figure 1 (left ordinate in units of μW ). The Si spectra were obtained by accumulating 12,000 laser shots, each on a fresh target, i.e., the acquisition time was 120 s. In all calibration processes and laser plasma experiments, the background noise signal is subtracted from the real data. It should be emphasized that the background noise signal was recorded for each experiment over the same acquisition time. This means that the noise signal is recorded over the same acquisition time in the absence of plasma. The spectral features of the calibrated Si spectrum may be identified (Figure 1 and Table 1) using the atomic database on the National Institute of Standards and Technology (NIST) website [22]. It has to be noted that the resolution of the spectrometer was not enough to resolve all weak spectral features as listed in the NIST database. The main spectral features of Si plasma emission mainly originated from doubly and triply ionized charge states (Si III–Si IV). Particularly, two strong spectral peaks about the wavelength of 140 nm are produced by two resonance transitions between the ground and singly excited states of (J = 1/2) − (J = 3/2) (the wavelength of ≈ 140 nm) and (J = 1/2) − (J = 1/2) (≈140.5 nm) in Si IV. Here, the is the total angular momentum.
3. Computational Model
To theoretically investigate the spectral characteristics of plasma radiation, we constructed a CR balance-rate equation, including excited states in a detail-level accounting approach [6,16,18,21]. The CR model includes all of the important atomic processes in a typical LPP light source, such as the auto-ionization from the doubly excited states and dielectronic recombination, electron impact ionization and three-body recombination, electron impact excitation and deexcitation, photo-ionization and radiative recombination, photo-excitation and photo-deexcitation. The effect of photo-absorption on a level population is calculated by reducing the radiative decay rate by a factor equal to the escape probability factor. A frequency-averaged escape probability formalism is employed for the Voigt spectral line radiation. Due to the lack of public and validated atomic physics data necessary for solving the CR model, see for example, the NIST database [22], the calculations of the atomic cross-sections and rates for any chosen element were performed using the FAC code [15]. The FAC solves the relativistic Dirac equation, using a single central parametric potential to compute the orbitals. Radiative decay, collisional excitation, and ionization, auto-ionization and photo-ionization cross sections, and rates are computed within the distorted wave approximation. To study the plasma dynamics in LPPs, a radiation-hydrodynamics code FLASH, is used [19]. The FLASH is a three-temperature (electron, ion, and radiation) state-of-the-art radiation-hydrodynamics solver, including the thermal conduction, multi-group radiation diffusion, tabulated equations-of-states (EOS), and laser ray-tracing model. For a given target material, the constructed CR is used to calculate a necessary non-LTE EOS database, including the spectral emissivity and spectral absorption coefficients on a density–temperature grid. In the present study, the calculations were carried only out for an Si plasma. To identify the Si ion charge states responsible for the experimental Si spectral emission in Figure 1 and also to verify the calculated spectral line positions by the FAC code, calculations were done using the CR solver for a homogeneous plasma. In this work, the CR model for Si includes a total of 1050 levels of the neutral to fully ionized Si charge states as listed in Table 2. For simplicity, the CR solver includes main spectral transitions among responsible low-ionized charge states for plasma FUV emission.
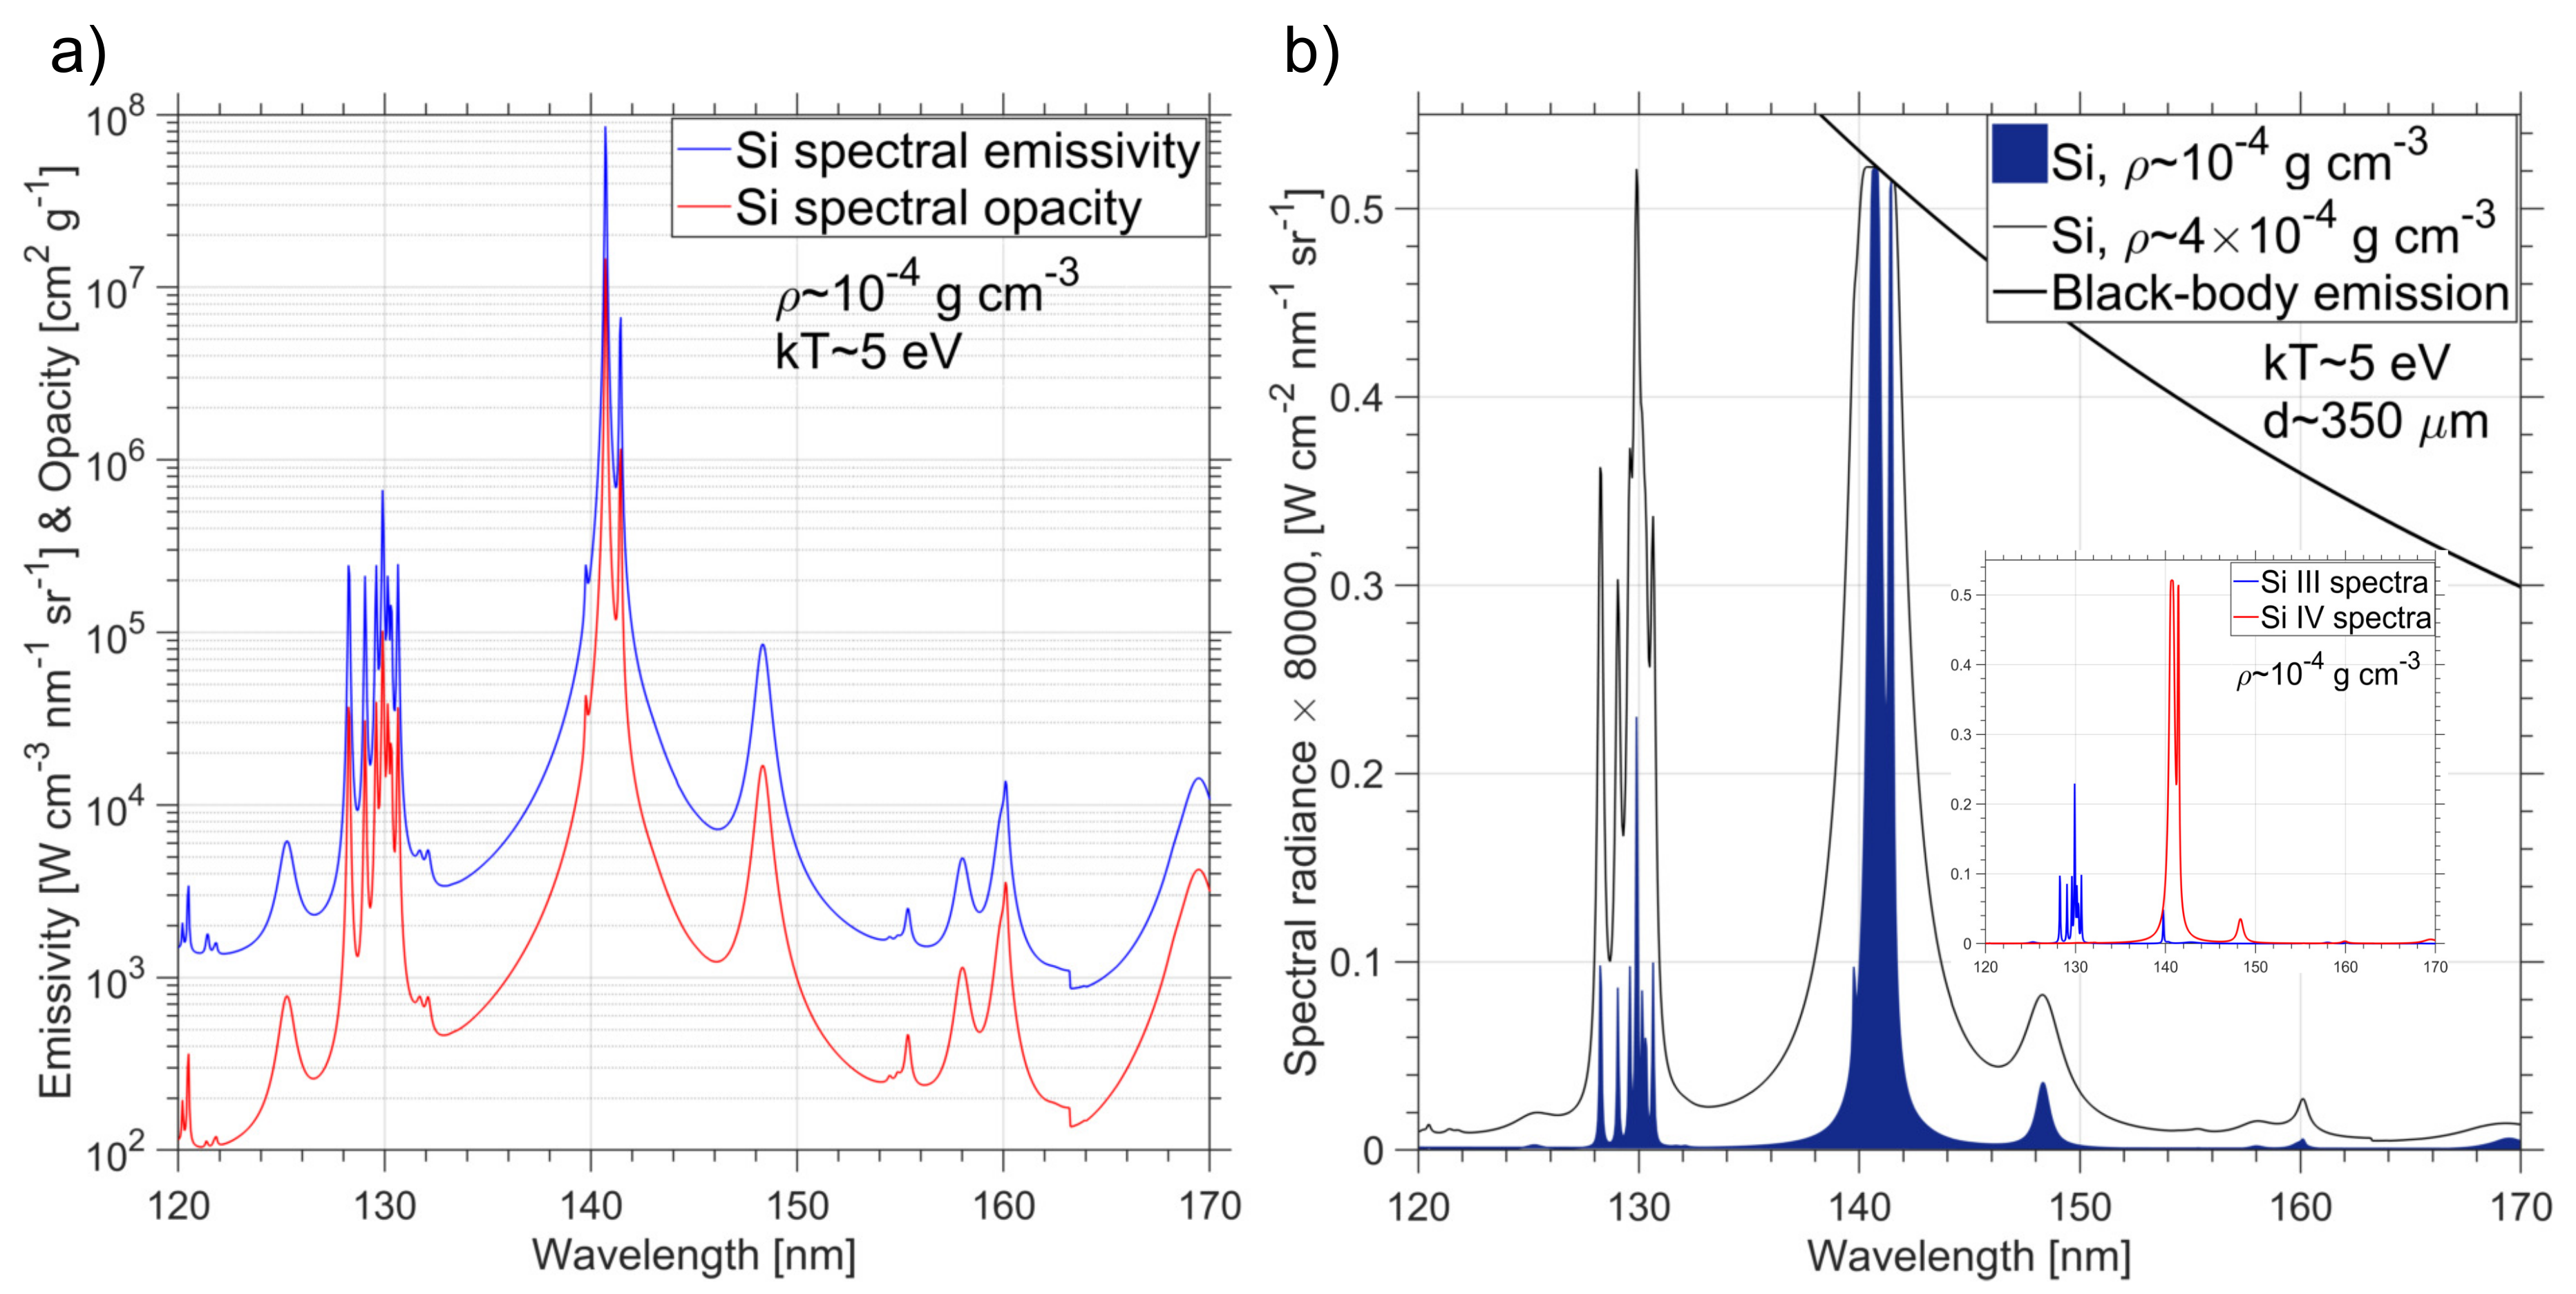
Figure 2a presents a typical non-LTE spectral emissivity (in units of W ) and the opacity coefficients (=, where is the spectral absorption coefficient in units of and is the density in units of ) in the tabulated EOS Si database over the wavelength region of 120–170 nm for an artificial homogeneous plasma at ≈ and a temperature of ≈ 5 eV. The CR model depends on three different temperatures for the electron (), ion (), and the radiation field (). Here, it is assumed that = = ≈ 5 eV and = 0.2 . It is found that the effect of on the spectral emissivity and opacity coefficient (Figure 2a) is negligible at this condition. Throughout this study, the spectral emissivity and opacity coefficients include the bound–bound, bound–free and free–free processes. Figure 2b presents the spectral radiance (in units of W ) of an artificial homogeneous Si plasma at ≈ and ≈ 4, ≈ 5 eV, and the photon path length (e.g., the plasma radius) of ≈ 350 μm. An inspection of Figure 1 and Figure 2b reveal the calibrated Si spectra is more and less in agreement with the calculated spectral radiance, especially at ≈ . Note that in the FAC code, the accuracy of the wavelengths and transition rates for VUV and visible lines that usually result from the transitions within the same configurations from near-neutral ions can be limited, especially for transition metals with incomplete d-shell. Although it is possible to adjust the energy levels, however, the detailed investigation on the spectral line positions was beyond the scope of the present study. The calculations in Figure 2b demonstrate the spectral radiations from two Si III and Si IV charge states are main contributors for measured calibrated FUV emission in Figure 1. Note that the time-space integrated spectral irradiance (Figure 1) can be estimated using the CR solver coupled to hydrodynamics code. However, a very crude approximation may be made as follows. The spectral irradiance (, in units of W ) is linked to the spectral radiance (, in units of W ) by the Lambert’s cosine law [23], i.e., = . This irradiance is inversely proportional to the square of the distance from the plasma, that is, the inverse square law. Suppose a spherical plasma with a radius ≈ 350 μm (somewhat larger than the laser spot size), a plasma emission duration ≈ 20 ns (i.e., 2 × FWHM laser pulse), and the laser repetition-rates = 100 Hz. With these assumptions, Figure 2b gives approximately the measured irradiance in Figure 1. For example, for strong spectral lines about the wavelength 140 nm (with the radiance of ≈4 × W in Figure 2b), the irradiance at 100 cm from the target is ≈(4 × × ) / ≈ 0.4 μW . Here, the is the plasma area. Indeed, in transient, non-LTE plasmas with strong temperature and density gradients generated in LPP sources, the plasma parameters such as the temperature and density, plasma size, and the integrated spectral emission are space- and time-dependent and cannot be simulated under the assumption of the perfect homogeneity of the plasma (e.g., Figure 2b). Consequently, there are a few discrepancies between the calculated spectral radiance (Figure 2b) and measured spectral irradiance (Figure 1). For example, the calculation cannot reproduce the measured intensity ratio of two strong Si IV lines around 140 nm. In addition, a comparison among the corresponding spectral emissivities and opacities of these lines (Figure 2a), the spectral radiance (Figure 2b) and the measured spectral irradiance reveals that the ratio approaches the black-body limit due to the opacity effect. Thus, the calculation may reproduce the measured Si IV line intensity ratio at different plasma conditions, e.g., from an optically thinner plasma.
4. Results and Discussion
Under the LTE hypothesis, the radiation of thermal light sources is governed by the fundamental laws of thermodynamics. Their intensity and spectral distribution, which depend on temperature, can be determined with the Kirchhoff’s law of absorption–emission and Planck’s equation, respectively, [23]. For a truly black-body over the wavelength range from zero to infinity, the radiation power emitted by the surface is given by the Stefan–Boltzmann’s law. When the temperature of a black-body radiator increases, the overall radiated energy increases and the peak of the radiation curve moves to shorter wavelengths according to the Wien’s displacement law. In this framework, the peak of the radiation curve (i.e., ≈ 250, where and are the peak of black-body radiation curve and its temperature, respectively) varies in the wavelength range of ≈170–120 nm for a black-body temperature (i.e., the radiation temperature) of ≈1.5–2 eV, respectively. Typical radiation-hydrodynamic calculations for the laser irradiance relevant to the LPP EUV/XR source experiments (not shown here) show that a maximum of the local radiation temperature in the plasma core is much less than local electron temperature. Thus, to produce an efficient pulsed plasma FUV light source, it is expected that the electron temperature should be higher than . On the other hand, the measured plasma threshold fluences () for the various metal targets in the air at atmospheric pressure are reported to be in the region of 0.9 ≤ ≤ 8.5 for a Q-switched 1.0 μm, ns Nd:YAG solid-state laser [24]. For example, the measured is ≈0.9, 3, and 8.5 for the zinc (Zn), molybdenum (Mo) and tungsten (W) metal targets, respectively. Therefore, the necessary plasma threshold laser irradiances for 10 ns, 60 ns, and 100 ns FWHM pulses are approximately in the range of ≈(0.9–9) , (0.2–2) , and (0.1–0.9) W for Zn, Mo and W metal targets, respectively. Note that the plasma threshold fluence is defined using the emission of a given spectral resonance lines of neutral element, e.g., the strong radiation originated from transitions among - of Zn I in the wavelength region of 320–340 nm [22]. Our calculations show, using the FAC code, low-ionized charge states, e.g., Zn III–Zn IV radiate strongly over the wavelength region of 120–170 nm. Thus, a somewhat higher laser fluence (or irradiance) than is needed to produce an efficient FUV plasma light source.
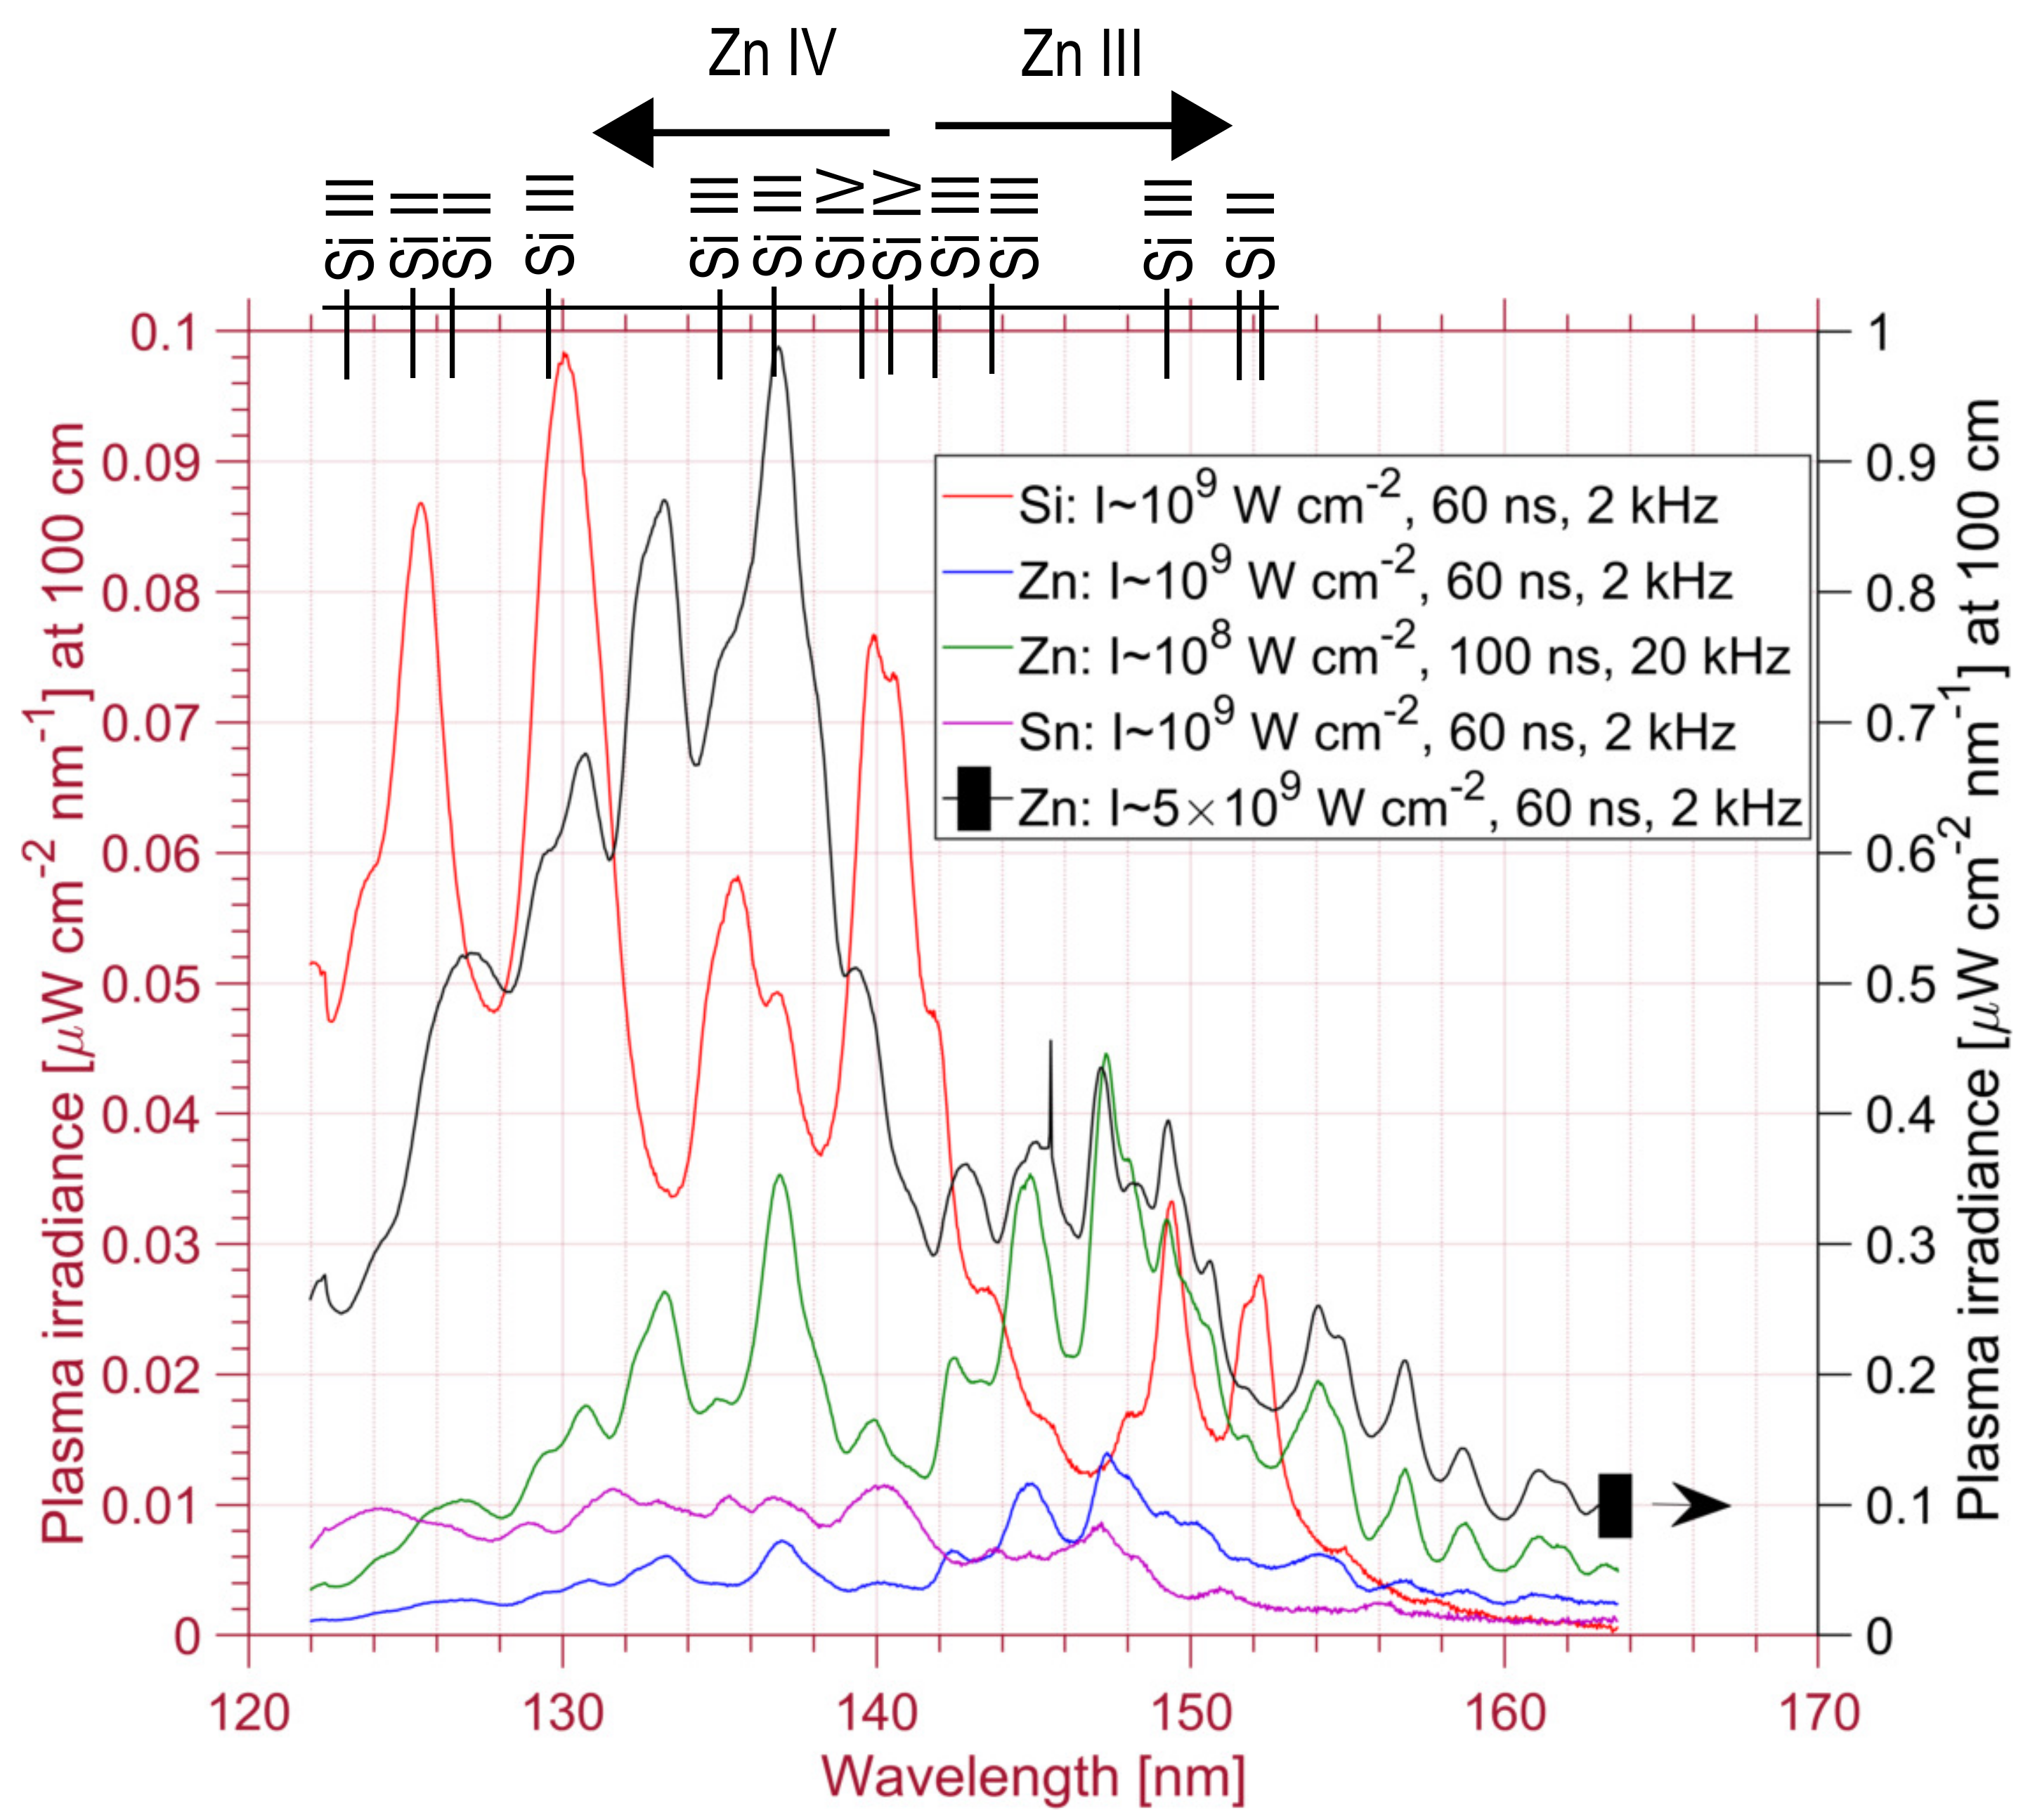
The spectral features of various gases, liquid metal droplets [20] (not shown here), and metal targets were generated by a 1.0 μm fiber laser with 60–100 ns FWHM and 2–20 kHz repetition rates at a low laser irradiance region of ≈ to 5 . Typical calibrated FUV spectral irradiances (in units of μW ) of the Si (Z = 14), Zn (Z = 30), and tin (Sn, Z = 50) plasmas at a distance of 100 cm from the target over a wavelength region of ≈123 to 164 nm are shown in Figure 3. The laser irradiance is estimated using the measurement of the average laser power for each experiment by an OPHIR laser power meter (serial number 517845). We recorded the plasma FUV emission (e.g., using the Zn solid target) for the laser irradiance as low as ≈5 using 100 ns FWHM and 20 kHz pulses. A high repetition rate of 20 kHz enables improving the signal-to-noise ratio at this low laser irradiance, i.e., to detect a clear FUV spectral emission over the wavelength region of ≈123–165 nm. This laser irradiance gives a ≈ 0.5 . This value is equal to the calculated theoretical plasma threshold fluence for the Zn metal target, as can be seen in Ref. [24]. It is worth mentioning that the previous report [24] shows that there is approximately no significant difference in using single-shot irradiation with each pulse hitting a fresh sample spot or accumulating ten pulse shots on the same target surface. Our experimental and atomic physics calculations [6,17,21] show that the Zn plasma radiates strong FUV spectral band with a CE as high as ≈3%/2sr at a laser irradiance of ≈5 for 2 kHz, 60 ns pulse. The corresponding Zn spectrum is shown in Figure 3 (right ordinate: the spectrum is marked with a rectangle). The unresolved transitions arrays from - and - orbitals in Zn III and Zn IV ions produce an efficient Zn plasma FUV light source. Here, and are the orbital quantum numbers (i.e., , , , ,...). An inspection of Figure 1, Figure 2b and Figure 3 reveals the main charge states responsible for the Si and Zn plasma FUV radiations are the Si III, Si IV and Zn III, Zn IV ions, respectively. Furthermore, our study shows that the Sn III, Sn IV, and Sn V ions are major contributors to the FUV emission in Sn plasma. Figure 3 shows the Si spectra is somewhat more powerful (with a CE ≈ 1%/2sr) than the emission from Zn and Sn plasmas at the laser irradiance of ≈ for 60 ns pulse at 2 kHz operation. A reason may come from the fact that the spectral lines of Si plasma are strong resonance lines in Si III and Si IV ions that are radiatively coupled to the ground states, whereas for Zn III and Zn IV ions, the transitions are generated among the singly excited states. Additionally, the low-ionized Si III–Si IV charge states remain stable over a wider electron temperature region than Zn III–Zn IV and Sn III–Sn V ions. For example, the average ionic charge states of Si and Sn are ≈3.9 and ≈6.2 at the electron temperature of ≈10 eV, respectively. Thus, a plasma over-ionization effect is less severe for the Si than Zn and/or Sn plasmas. Comparison of the Si spectra in Figure 1 and Figure 3 show the two strong spectral lines around 140 nm (i.e., transitions of - in Si IV) are broadened and merged in the plasma created by the longer pulse of 60 ns width at a lower laser irradiance of ≈ . The reason may be understood based on the calculation using the CR solver for an artificial homogeneous plasma. Figure 2b shows the spectral lines of Si IV around 140 nm can become optically thick (i.e., no object at a given temperature can emit more than black-body emission limit) at a high density region or a long photon path length owing to a larger plasma size for the 60 ns than 10 ns pulse. Thus, in the case of a collision-dominated plasma or an optically thick medium [25], it is expected that these two resonance spectral lines broadened and merged together at a typical areal density of Si plasma ≈ ≥ and a temperature of 5 eV. Note that, in the CR calculation, we used the Voigt spectral line shape that includes the collisional (i.e., the impact pressure) and Doppler broadening mechanisms (Figure 2b) [23]. It is worth noting that the instrumental broadening is not taken into account in the calculation. There are a few discrepancies between the calculated and the measured Si spectral emission. Particularly, the calculated continuum emission is much less than the measured spectra. Figure 3 shows the Si spectral lines around 130 nm and at shorter wavelengths are stronger than the corresponding lines in Figure 1. The reason is due to the lower temperature of Si plasma in conditions relevant to Figure 3 compared to Figure 1 owing to the lower laser irradiance. Thus, the spectral radiations originated from the lower charge state of Si III are stronger than Si IV. Moreover, the calculations using the CR solver show (Figure 2b) the ratio of spectral lines around 130–140 nm increases by raising the plasma opacity, i.e., by increasing the plasma density or the photon path length.
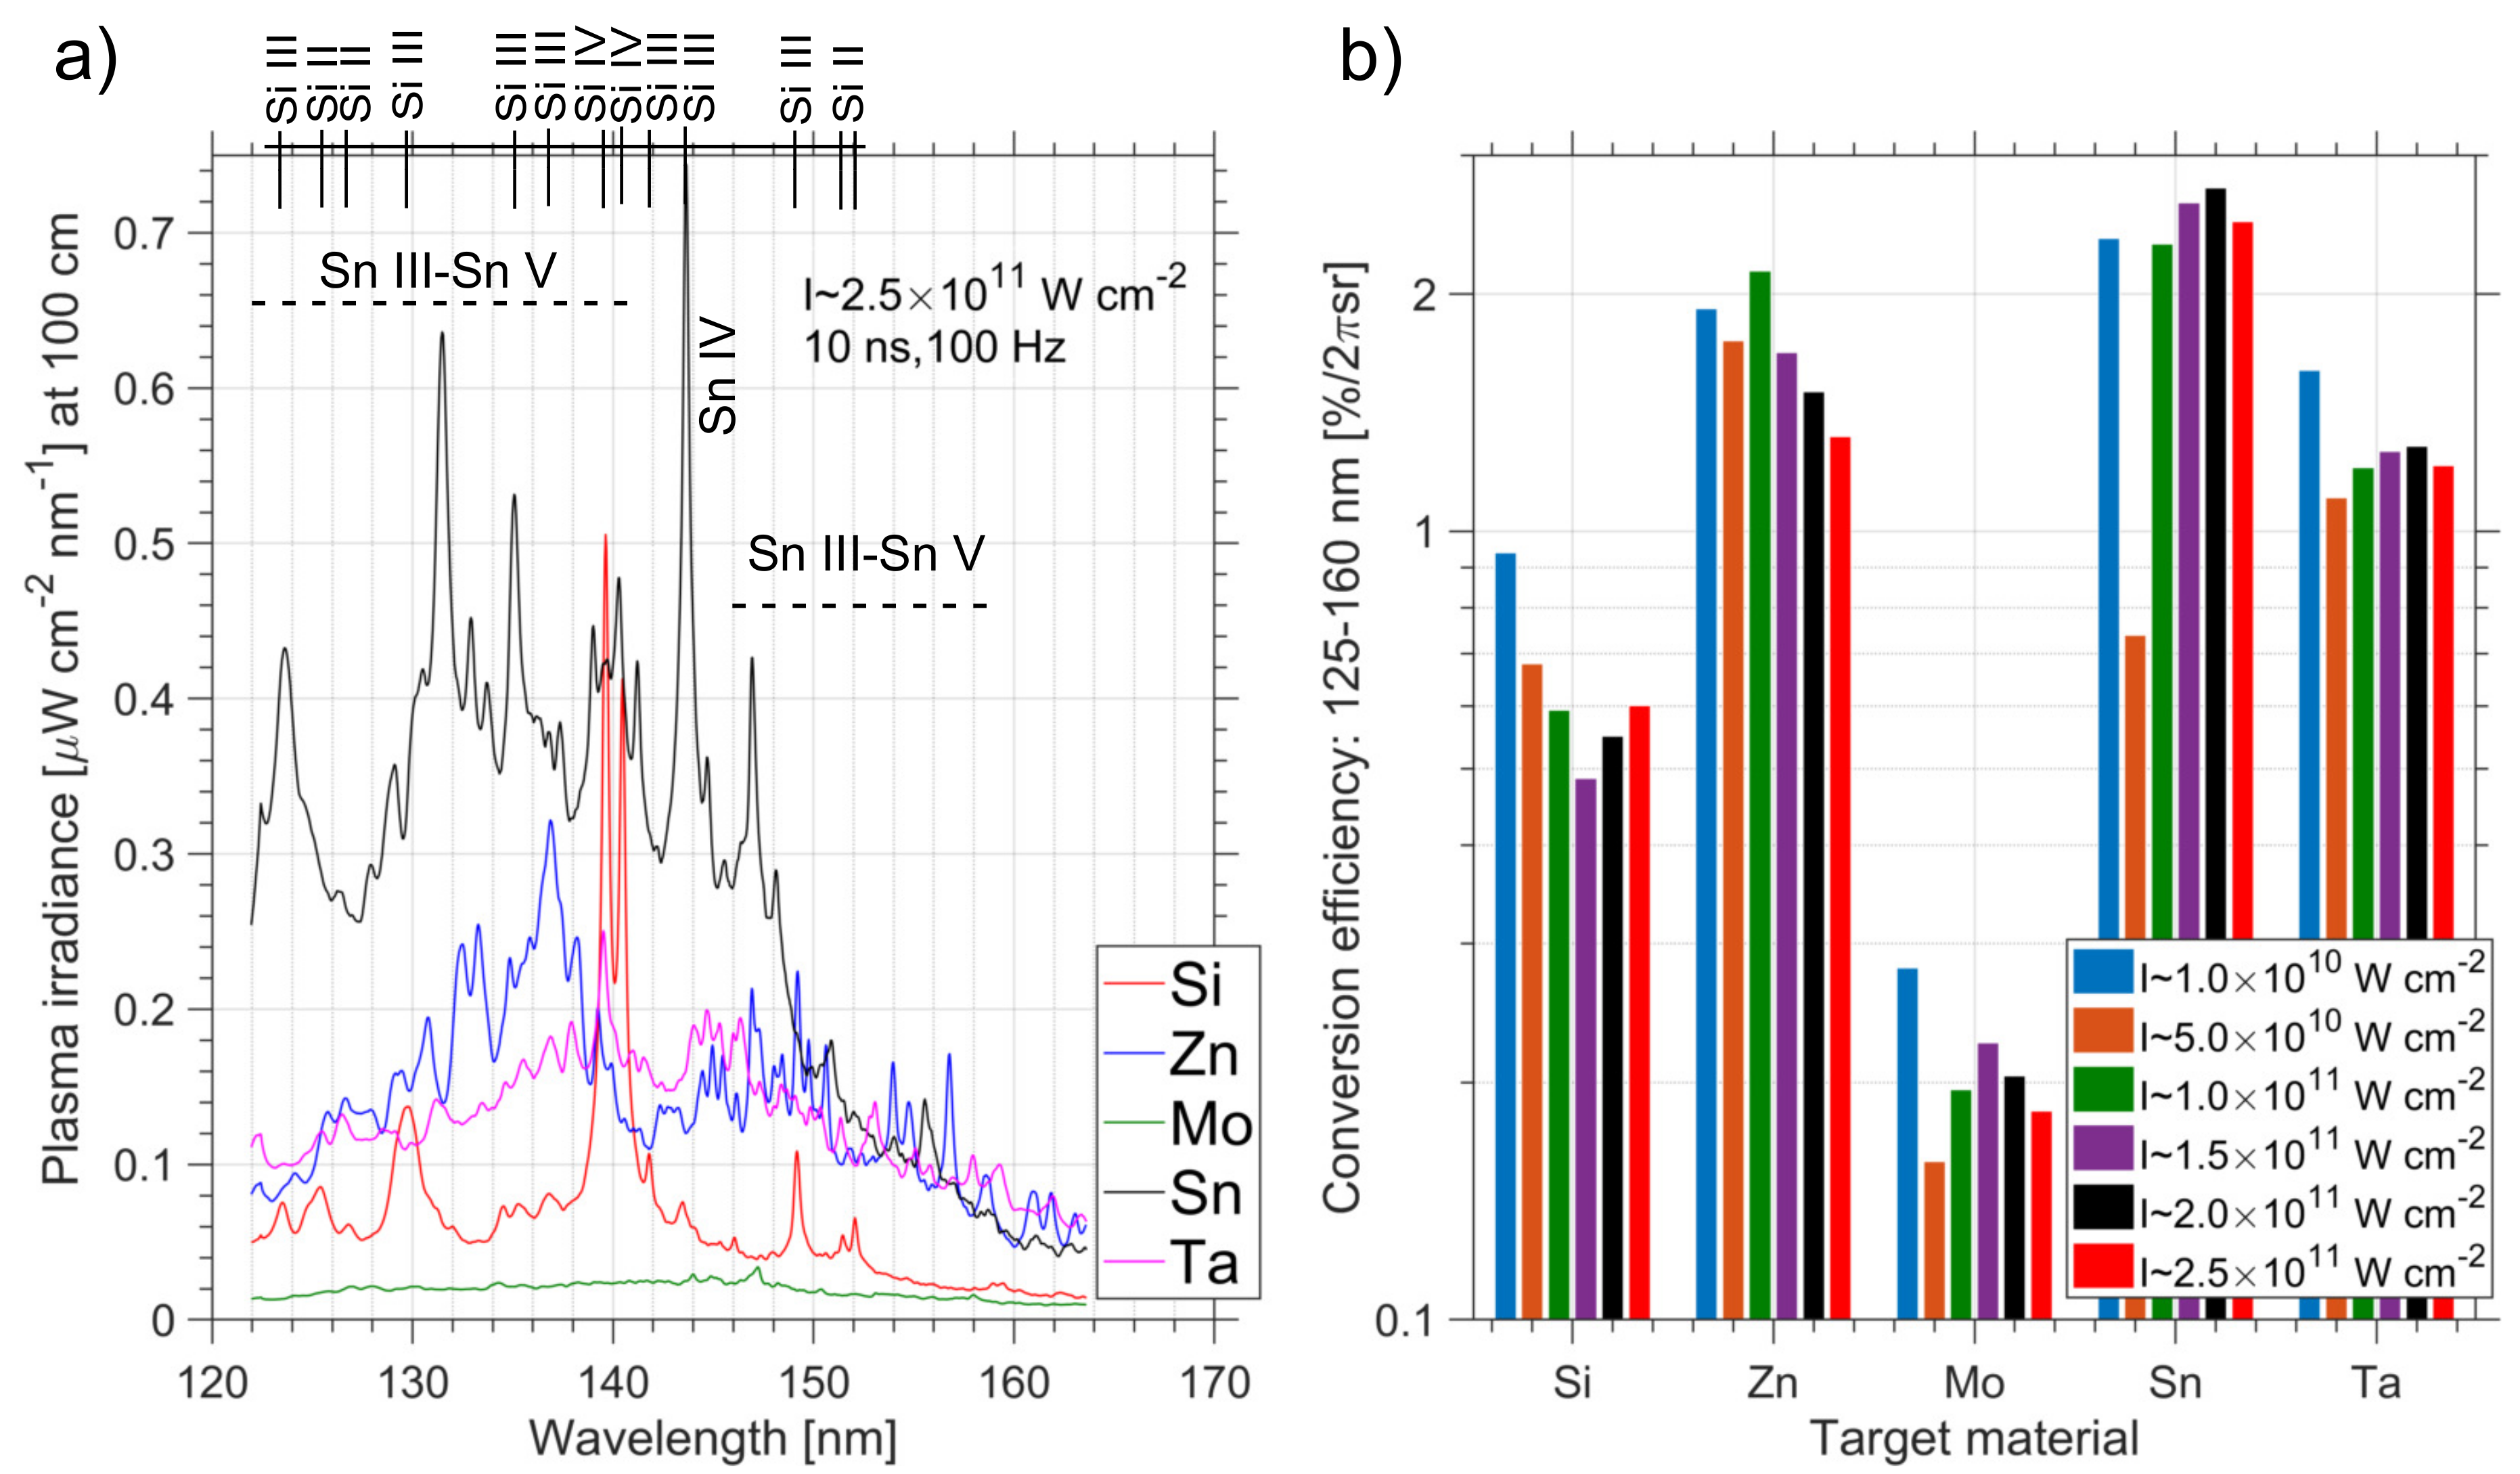
The spectral features of several targets were also generated with 10 ns FWHM, 100 Hz laser at different laser irradiances in the range of I ≈ to 2.5 × . Note that at this laser condition, the target rotated fast enough to provide a fresh sample in each laser shot. Figure 4a presents the calibrated spectral plasma irradiances (in units of W ) of the Si, Zn, Mo, Sn and tantalum (Ta, Z = 73) planar targets at a distance of 100 cm from the target over the wavelength region of ≈123–164 nm. Here, the laser irradiance was ≈2.5 . This irradiance is well beyond the plasma threshold fluence of all refractory metals. At this laser irradiance, all spectra were calculated after averaging ≈3000 pulses. As previously discussed, the main spectral features of the Si and Zn plasmas were mainly created from the low-ionized charge states of Si III–Si IV and Zn III–Zn IV ions, respectively. Inspection of Figure 3 and Figure 4a reveals the main spectral lines of Si IV (around ≈140 nm) and Zn IV (≤140 nm) are brighter than Si III (around ≈130 nm) and Zn III (≥140 nm) in plasma generated by a 10 ns pulse than 60 ns due to the higher laser irradiance, consequently, a higher temperature. Additionally, as stated before, the low-ionized Sn III, Sn IV, and Sn V ions are main contributors in the measured Sn spectra (Figure 4a). Figure 4a shows that the Mo and Ta plasmas generate a weaker spectral FUV emission compared to the Zn and Sn ions. The reason may be due to plasma over-ionization, i.e., the Mo and Ta plasma radiations may be increased at the lower laser irradiance region. Figure 4a shows that all of the measured plasma spectral radiations have a continuum on which the emission lines are superimposed.
Figure 4b presents the measured radiation conversion efficiencies (in units of % into 2sr) over the wavelength region of 125–160 nm versus the peak laser irradiances in the range of ≈ to 2.5 . For these experimental conditions, maximum radiation conversion efficiencies in the range of 1–3%/2sr were measured. All conditions that are known were kept constant during the experiments. However, note that at the low laser irradiance in contrast to the high region, around 60,000 pulses were accumulated to obtain each spectrum. All of the emission signals were corrected by the subtraction of the noise (dark) signal of the detector, which were separately measured for the same corresponding exposure time. Figure 4b shows the Si, Mo and Ta plasmas generate higher conversion efficiencies at the lowest laser irradiance of ≈ . We expect that low-ionized charge states of the heavy elements with the open d-sub-shell, for example, Mo (with the neutral ground configuration ), Ta (with the neutral ground configuration ) and tungsten (with the neutral ground configuration [26]) generate a strong continuum-like FUV spectra at the lower laser irradiance than ≈ . In particular, it is predicted through preliminary calculations that an optically thick Ta (or the tungsten) plasma radiates a strong broad quasi-flat FUV emission at a temperature region less than 5 eV. Indeed, more experiments needed to investigate the best target condition by considering the debris issue. Previous experiments demonstrated that a low-debris LPP plasma source is possible by using, e.g., gas [8] or droplet targets. For example, George et al. [4] demonstrated that the realization of a high CE low-debris LPP Sn EUV source is possible by reducing the mass of tin target, which is accomplished by using tin-doped droplet targets. These features are now under investigation, especially the debris issue in high repetition-rates experiments at a low laser fluence region.
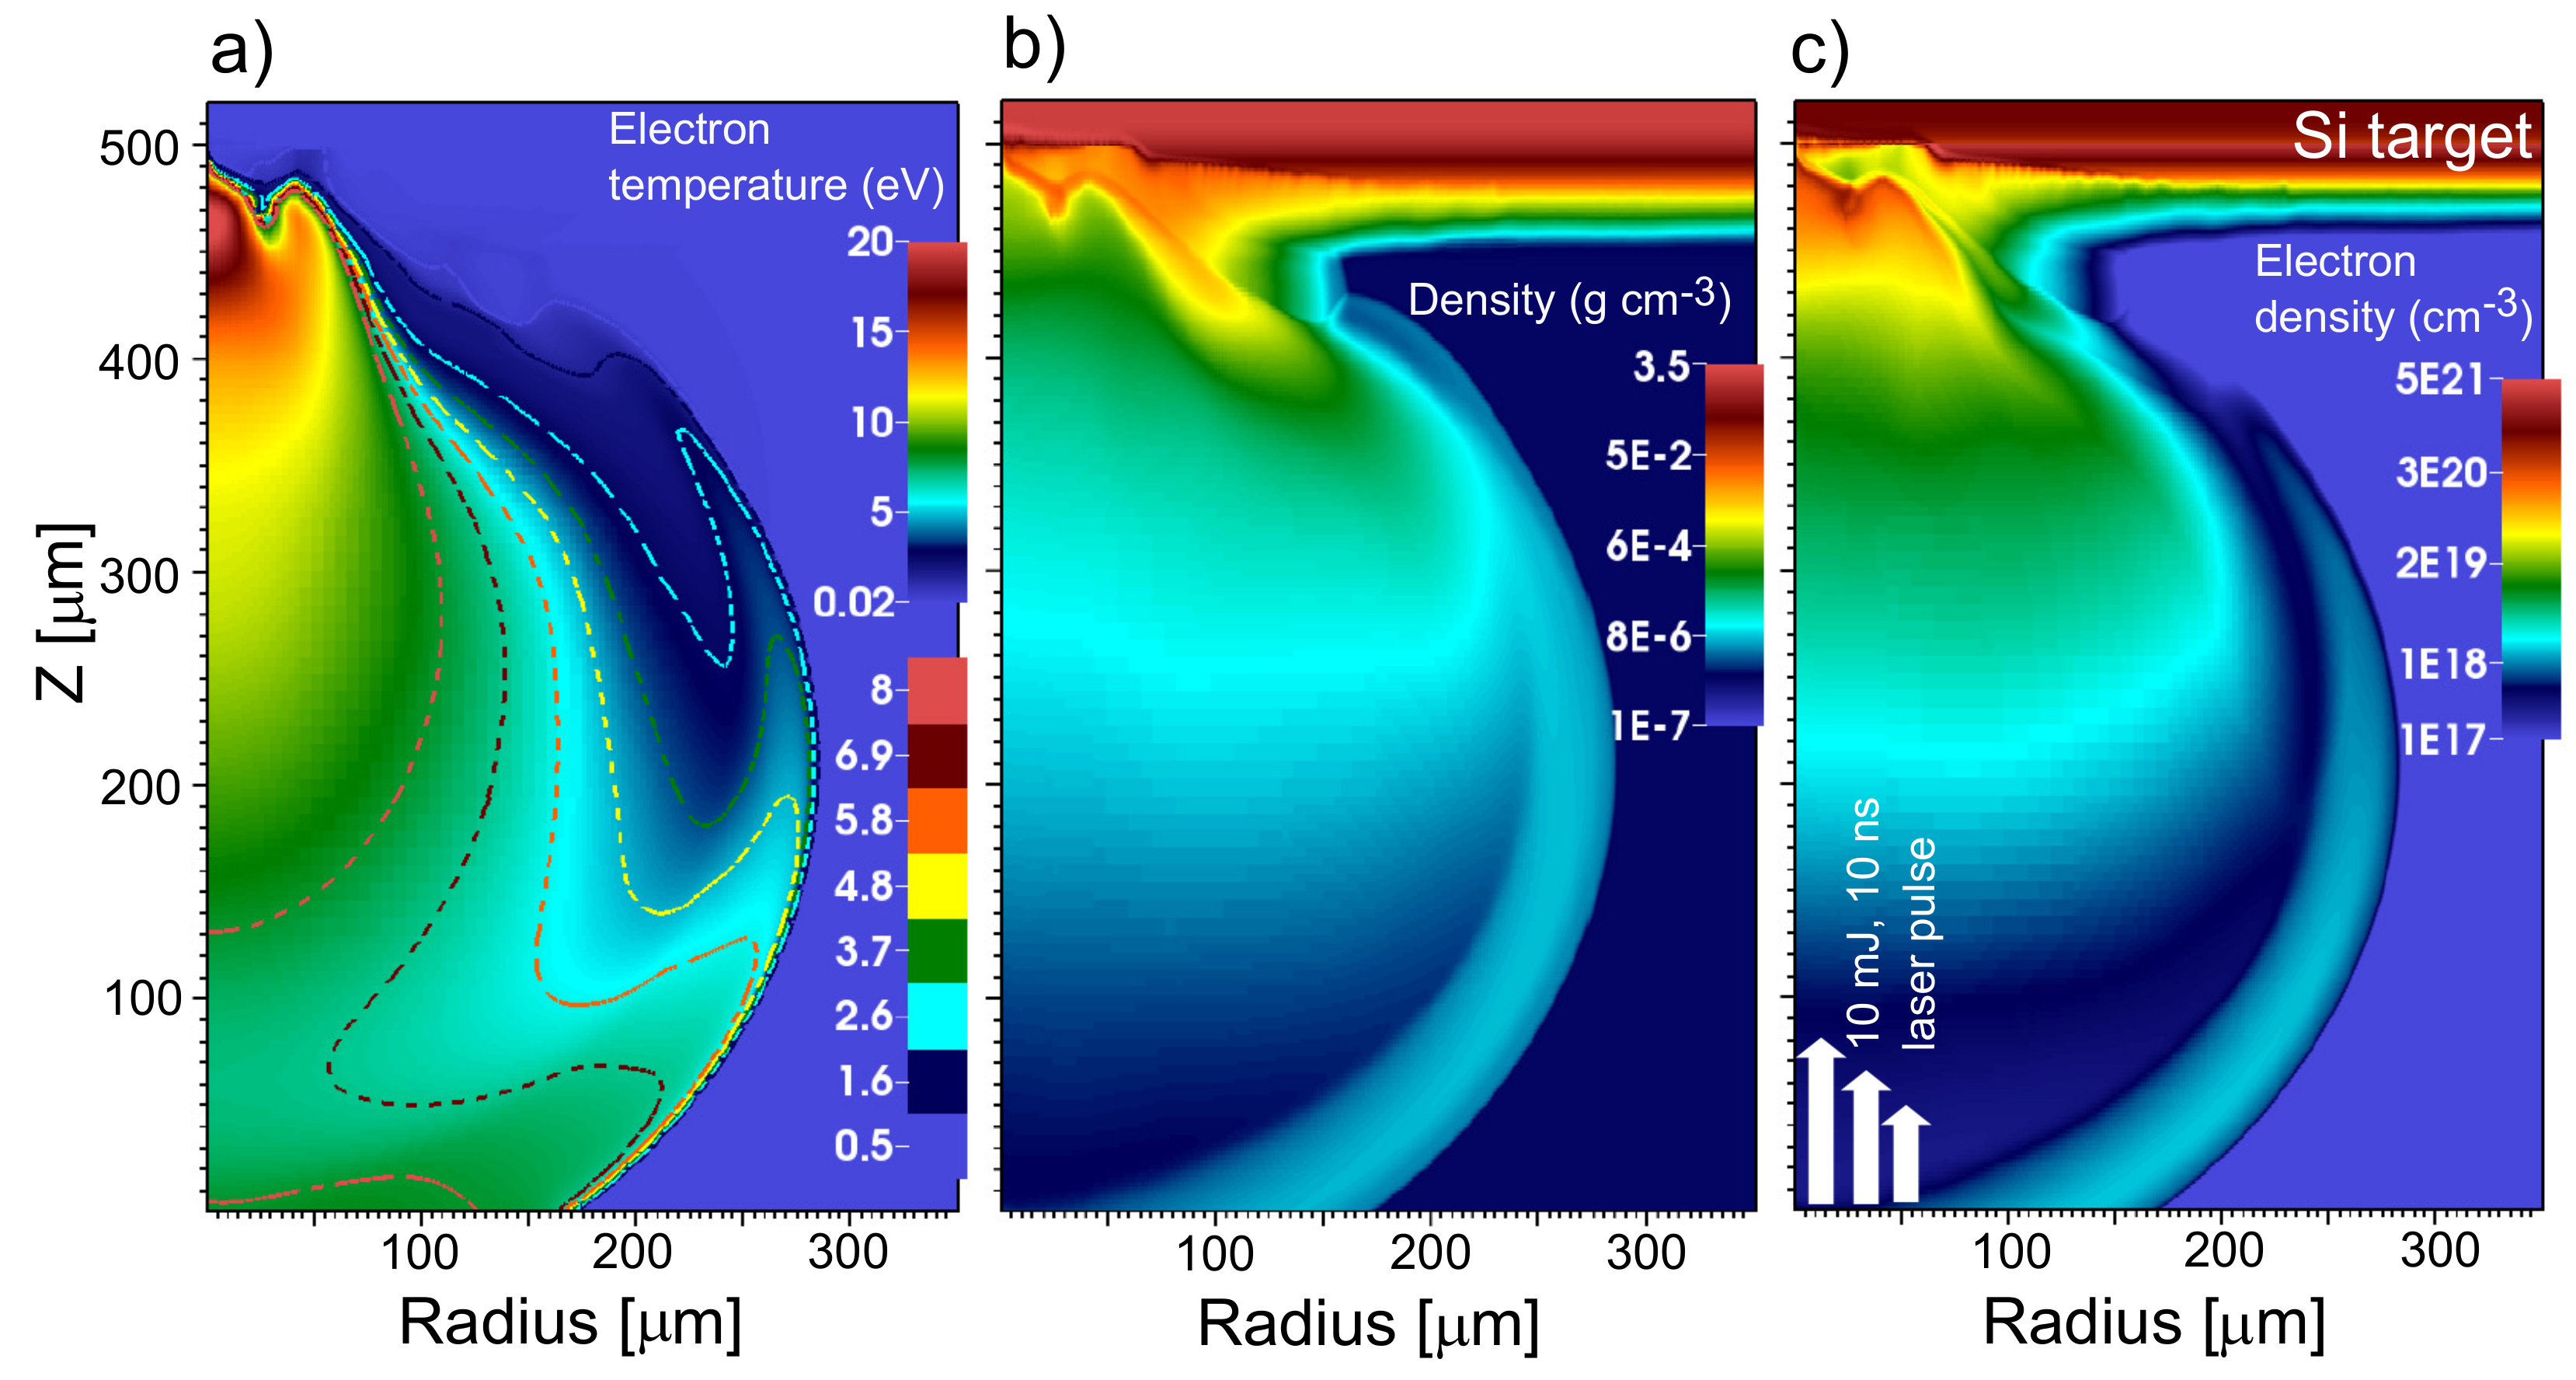
Due to the lack of experimental information on the evolution of plasma parameters, a picture of the plasma dynamics may be obtained using the radiation-hydrodynamics model. Here, a radiation-hydrodynamics code, FLASH is used to investigate the plasma temperature and density at a given peak laser irradiance of ≈ . Figure 5a–c present typical 2D spatial distributions of the electron temperature, the plasma density, and electron density near the peak laser irradiance, respectively. Here, this code is employed to study the plasma dynamics for the case of a planar solid Si target (with the initial density of ≈2.33) irradiated by a 1.06 μm, 10 ns FWHM Gaussian-temporal-spatial-shaped laser pulse with a peak irradiance of ≈ . In the simulation model, a single laser beam illuminates a planar target in the radius-Z (R-Z) cylindrical geometry. The laser is focused on the Z axis and enters the domain at a 90-degree angle, i.e., laser beam is normal to the target. It is assumed that the Si target is in a low-density air environment related to the pressure of 1.3 × Pa at the vacuum chamber. The laser spot size diameter is assumed to be ≈120 μm ( width ≈200 μm). The FLASH code predicts a maximum of electron temperature ≈20 eV for the plasma core at the peak laser irradiance. This plasma temperature is high enough to produce an average ionic charge state higher than ≈4, especially for elements with a high atomic number such as Mo or Ta. Our calculations (not shown here) predict that at such a high temperature, the plasma should also strongly emit at the wavelengths shorter than 120 nm. The calculation also shows at the maximum laser irradiance, this dense high-temperature plasma close to the target radiates intense continuum emission. Figure 5a also presents a dashed-lines contour to emphasize plasma regions with the electron temperatures in the range of 0.5–8 eV. Our study reveals that the dense low-temperature plasma, especially close to the target (as can be seen in Figure 5b for the region of ≥ ), strongly radiates in the FUV region. The reason may be understood based on a comparison between the calculated Si spectral radiance (Figure 2b) and measured signal (Figure 4a). Due to the lack of experimental information, an effective plasma size may be estimated by the simulation as ≈300 μm. Indeed, more experiments and the radiation-hydrodynamic calculations coupled to the CR solver are required to investigate the conversion efficiency versus the laser spot diameter, pulse width and emission angle (angle-resolved spectra) in the laser plasma FUV light source. These features are now under investigation.
5. Conclusions
We discussed in detail the analysis of short-wavelength data obtained from a laser plasma light source, characterized with an aberration-corrected McPherson Seya–Namioka type monochromator sensitive to the vacuum-ultraviolet spectral range. Absolute spectral irradiance calibration of laser plasmas for a wavelength FUV band from ≈123 to 164 nm was performed using a standard Deuterium lamp. Plasmas were created from fast rotating solid targets (Si, Zn, Mo, Sn and Ta) by two 1.0 μm lasers, separately; a Q-switched Nd:YAG solid-state laser producing 10 ns FWHM pulses at 100 Hz repetition rates and a fiber laser operating with pulse widths (60–100 ns FWHM) and repetition rates (2–20 kHz). Plasma FUV emission is detected for the laser irradiance as low as ≈5 using 100 ns FWHM and 20 kHz pulses. It was demonstrated that high-density laser plasmas created by nanosecond laser pulses radiate strongly over the FUV wavelength region. Calculations using a developed collisional-radiative solver and radiation-hydrodynamic code reveal that the FUV spectral radiation mainly consists of a strong continuum emission due to a dense plasma core close to the target, which was superimposed by a vast spectral lines of low-ionized charge states. We measured a maximum conversion efficiency of ≈(1–3)%/2sr of the laser light to the FUV spectral band from a few selected targets by both lasers, i.e., 10 and 60 ns FWHM pulses. Particularly, the calculation and experimental results show emission from specific wavelength regions can be enhanced by proper optimization of target and laser parameters. These results are valuable for the lithography and metrology tools in the semiconductor industry as well as to design a high-power incoherent point-like FUV light sources driven by Q-switched mJ infrared laser pulses.
Author Contributions
Project administration, M.R.; supervision and analyzing measurements, M.M., M.R.; software-computational modeling, M.M.; writing—review and editing, M.M., M.R. All authors have read and agreed to the published version of the manuscript.
Funding
This work was supported in part by the State of Florida.
Data Availability Statement
All the data generated and analyzed that support the findings of this study are available from the corresponding author upon request.
Acknowledgments
The authors gratefully acknowledge the University of Chicago for making the FLASH code available.
Conflicts of Interest
The authors declare that they have no known competing financial interests or personal relationships that could have appeared to influence the work reported in this paper.
References
- ISO21348 Definitions of Solar Irradiance Spectral Categories. Archived from Space Weather (spacewx.com). 2013. Available online: https://web.archive.org/web/20131029233428/http://www.spacewx.com/pdf/SET_21348_2004.pdf (accessed on 27 July 2021).
- Rice, B. Extreme Ultraviolet (EUV) Lithography. In Nanolithography: The Art of Fabricating Nanoelectronic and Nanophotonic Devices and Systems; Feldman, M., Ed.; Woodhead Publishing: Cambridge, UK, 2014; pp. 1–80. [Google Scholar]
- Fomenkov, I. EUV Source for High Volume Manufacturing: Performance at 250 W and Key Technologies for Power Scaling. EUV Source Workshop, Dublin, Ireland. 2017. Available online: https://www.euvlitho.com/2017/S1.pdf (accessed on 27 July 2021).
- George, S.A.; Silfvast, W.T.; Takenoshita, K.; Bernath, R.T.; Koay, C.-S.; Shimkaveg, G.; Richardson, M.C. Comparative Extreme Ultraviolet Emission Measurements for Lithium and Tin Laser Plasmas. Opt. Lett. 2007, 8, 997–999. [Google Scholar] [CrossRef] [PubMed]
- O’Sullivan, G. The Origin of Line-Free XUV Continuum Emission From Laser-Produced Plasmas of The Elements 62 ≤ Z ≤ 74. J. Phys. B At. Mol. Phys. 1983, 16, 3291–3304. [Google Scholar] [CrossRef]
- Szilagyi, J.; Parchamy, H.; Masnavi, M.; Richardson, M. Spectral Irradiance of Singly and Doubly Ionized Zinc in Low-Intensity Laser-Plasma Ultraviolet Light Sources. J. Appl. Phys. 2017, 121, 033303–033309. [Google Scholar] [CrossRef]
- Di Palma, T.M.; Borghese, A. Characterization of a UV-VUV Light Source Based on a Gas-Target ns-Laser-Produced Plasma. Nucl. Instr. Meth. B 2007, 254, 193–199. [Google Scholar] [CrossRef]
- Arikkatt, A.J.; Wachulak, P.; Fiedorowicz, H.; Bartnik, A.; Czwartos, J. Wideband Spectral Emission Measurements from Laser-Produced Plasma EUV/SXR Source Based on a Double Gas Puff Target. Metrol. Meas. Syst. 2020, 27, 701–719. [Google Scholar]
- Xu, Q.; Deng, X.; Tian, H.; Zhao, Y.; Wang, Q. Influence of Pre-Ionized Plasma on the Dynamics of a Tin Laser-Triggered Discharge-Plasma. Appl. Sci. 2019, 9, 4981. [Google Scholar] [CrossRef] [Green Version]
- Bezel, I.; Derstine, M.; Gross, K.; Shchemelinin, A.; Szilagyi, J.; Shortt, D. High Power Laser-Sustained Plasma Light Sources for KLA-Tencor Broadband Wafer Inspection Tools. EUV Source Workshop, Dublin, Ireland. 2017. Available online: https://www.euvlitho.com/2017/S63.pdf (accessed on 27 July 2021).
- Beckers, J.; Van De Ven, T.; Van Der Horst, R.; Astakhov, D.; Banine, V. EUV-Induced Plasma: A Peculiar Phenomenon of a Modern Lithographic Technology. Appl. Sci. 2019, 9, 2827. [Google Scholar] [CrossRef] [Green Version]
- Sinha, H.; Ren, H.; Nichols, M.T.; Lauer, J.L.; Tomoyasu, M.; Russell, N.M.; Jiang, G.; Antonelli, G.A.; Fuller, N.C.; Engelmann, S.U.; et al. The Effects of Vacuum Ultraviolet Radiation on Low-k Dielectric Films. J. Appl. Phys. 2012, 112, 111101–111121. [Google Scholar] [CrossRef] [Green Version]
- Takahashi, A.; Okada, T.; Hiyama, T.; Maeda, M.; Uchino, K.; Nohdomi, R.; Mizoguchi, H. Ar2 Excimer Emission From a Laser-Heated Plasma in a High-Pressure Argon Gas. Appl. Phys. Lett. 2000, 77, 4115–4117. [Google Scholar] [CrossRef]
- Kogelschatz, U.; Esrom, H.; Zhang, J.-Y.; Boyd, I.W. High-Intensity Sources of Incoherent UV and VUV Excimer Radiation for Low-Temperature Materials Processing. Appl. Surf. Sci. 2000, 168, 29–36. [Google Scholar] [CrossRef]
- Gu, F.M. The Flexible Atomic Code. Can. J. Phys. 2008, 86, 675–696. [Google Scholar] [CrossRef]
- Masnavi, M.; Nakajima, M.; Hotta, E.; Horioka, K. Estimation of the Lyman-α Line Intensity in a Lithium-Based Discharge-Produced Plasma Source. J. Appl. Phys. 2008, 103, 013303–013311. [Google Scholar] [CrossRef]
- Masnavi, M.; Szilagyi, J.; Parchamy, H.; Richardson, M. Laser-Plasma Source Parameters for Kr, Gd, and Tb Ions at 6.6 nm. Appl. Phys. Lett. 2013, 102, 164102–164105. [Google Scholar] [CrossRef] [Green Version]
- Parchamy, H.; Szilagyi, J.; Masnavi, M.; Richardson, M. Ultraviolet Out-of-Band Radiation Studies in Laser Tin Plasma Sources. J. Appl. Phys. 2017, 122, 173303–173310. [Google Scholar] [CrossRef]
- Fu, W.; Liang, E.P.; Fatenejad, M.; Lamb, D.Q.; Grosskopf, M.; Park, H.-S.; Remington, B.; Spitkovsky, A. Increase of the Density, Temperature and Velocity of Plasma Jets Driven by a Ring of High Energy Laser Beams. High Energy Density Phys. 2013, 9, 336–340. [Google Scholar] [CrossRef] [Green Version]
- Richardson, M.C.; Koay, C.-S.; Takenoshita, K.; Keyser, C. High Conversion Efficiency Mass-Limited Sn-Based Laser Plasma Source for EUV Lithography. J. Vac. Sci. Technol. B 2004, 22, 785–790. [Google Scholar] [CrossRef]
- Parchamy, H.; Szilagyi, J.; Masnavi, M.; Richardson, M. Quantitative Analysis of Vacuum-Ultraviolet Radiation From Nanosecond Laser-Zinc Interaction. Opt. Laser. Technol. 2018, 103, 1–7. [Google Scholar] [CrossRef]
- Atomic Spectra Database. Available online: https://physics.nist.gov/PhysRefData/ASD/levels_form.html (accessed on 27 July 2021).
- Masnavi, M.; Nakajima, M.; Hotta, E.; Horioka, K.; Niimi, G.; Sasaki, A. Estimation of Optimum Density and Temperature for Maximum Efficiency of Tin Ions in Z Discharge Extreme Ultraviolet Sources. J. Appl. Phys. 2007, 101, 033306–033317. [Google Scholar] [CrossRef]
- Cabalin, L.M.; Laserna, J.J. Experimental Determination of Laser Induced Breakdown Thresholds of Metals Under Nanosecond Q-Switched Laser Operation. Spectrochim. Acta Part B 1998, 53, 723–730. [Google Scholar] [CrossRef]
- Fujimoto, T. Plasma Spectroscopy; Clarendon Press; Oxford University Press: New York, NY, USA, 2004; pp. 236–256. [Google Scholar]
- Abdallah, J., Jr.; Colgan, J.; Clark, R.E.H.; Fontes, C.J.; Zhang, H.L. A Collisional-Radiative Study of Low Temperature Tungsten Plasma. J. Phys. B At. Mol. Phys. 2011, 44, 075701–075707. [Google Scholar] [CrossRef] [Green Version]
Figure 1.
Comparison of the spectral irradiance of the standard Deuterium () lamp (gray shaded area, right-hand scale) with a typical recorded calibrated spectral irradiance of a Si plasma at a distance of 100 cm from the target over the ≈123–164 nm wavelength region generated by 1.064 μm laser, 10 ns FWHM pulses at 100 Hz repetition rates (black line, left-hand scale). The laser irradiance was ≈2.5 W (the laser energy ≈230 mJ). The strong Si spectral lines are identified using the NIST atomic database [22] as listed in Table 1.

Figure 2.
(a): Calculated spectral emissivity and opacity coefficients versus the wavelength at ≈ and ≈ 5 eV; (b): the calculated spectral radiance for an artificial homogeneous Si plasma at ≈ (blue shaded area) and ≈ 4 (dark solid line), ≈ 5 eV, and ≈ 350 m. The black-body emission curve versus the wavelength at the same temperature is also shown. The spectral contributions of the main individual Si ions (i.e., Si III and Si IV) are also presented. Note that the ordinates of (a,b) are not in the same scale.

Figure 3.
Measured FUV spectral irradiances of the Si, Zn and Sn plasmas at a distance of 100 cm from the target over the ≈123–164 nm wavelength region. Plasmas were generated by a 1.0 μm laser at two operation regimes: with pulse widths of 60 and 100 ns FWHM and the repetition rates of 2 and 20 kHz. Note that the right ordinate is used for one of the Zn spectra (marked with a filled rectangle) for better view. Here, the laser irradiances (pulse energies) for 2 and 20 kHz rep-rates are ≈ W (≈3 mJ), ≈5 W (≈15 mJ), and ≈ W (20 kHz, 100 ns FWHM laser pulse energy ≈0.6 mJ), respectively. Positions of Si spectral lines are shown (on top) using the NIST atomic database [22].

Figure 4.
(a) Measured spectral irradiances of the Si, Zn, Mo, Sn and Ta plasmas at a distance of 100 cm from the target over the wavelength region of ≈123–164 nm. Here, a plasma generated by a 1.0 μm, 100 Hz, 10 ns pulse at the laser irradiance of ≈2.5 (pulse energy ≈ 230 mJ). The observed Si spectral lines are shown (on top) using the NIST database [22]; (b) measured radiation conversion efficiency (in units of % into 2sr) over the wavelength spectral band of 125–160 nm for various laser irradiances (pulse energies) of ≈ (≈10 mJ), 5 (≈44 mJ), 1.0 (≈90 mJ), 1.5 (≈140 mJ), 2 (≈190 mJ) and 2.5 (≈230 mJ).

Figure 5.
(a) The spatial distributions of the plasma electron temperature (in units of eV); (b) the plasma density (in units of ); and (c) the plasma electron density (in units of ) for a 10 ns LPP near the peak irradiance of ≈ over the Radius-Z space calculated using a 2D Eulerian FLASH code. The laser beam propagates along the Z direction as shown in (c). Here, a dashed-lines contour in Figure 5a shows the locations with the electron temperatures in the range of ≈0.5–8 eV.


| States | Transitions (Lower–Upper Levels) | Observed Wavelengths (nm) | Transition Probabilities (1/s) |
|---|---|---|---|
| Si II | − | 125.1–126.5 | (0.47–3) × |
| − | 152.6–153.3 | (0.4–0.8) × | |
| Si III | − | 123.5 | 2.77 × |
| − | 128–130.3 | (0.5–2.1) × | |
| − | 134–134.3 | (0.7–0.9) × | |
| − | 136.1–136.7 | (0.8–1) × | |
| − | 141.7 | 2.2 × | |
| − | 143.3–143.6 | (0.4–0.9) × | |
| − | 150–150.2 | (1.7–2.1) × | |
| Si IV | − | 139.4 | 0.88 × |
| − | 140.3 | 0.86 × |
Table 2.
The CR model for Si plasma includes all of the ground states from the neutral (Si I) through fully ionized charge states, and particularly, the important transitions from Si I through Si IX. Here, and are, respectively, the principal and orbital quantum numbers. The total levels in the CR is 1050.
| States | Configurations |
|---|---|
| Si I | , , |
| , , | |
| Si II | , , , |
| , , | |
| Si III | , , , |
| , , | |
| Si IV | , , , |
| Si V | , , |
| Si VI | , , |
| Si VII | , , |
| Si VIII | , , |
| Si IX | , , |
Publisher’s Note: MDPI stays neutral with regard to jurisdictional claims in published maps and institutional affiliations. |
© 2021 by the authors. Licensee MDPI, Basel, Switzerland. This article is an open access article distributed under the terms and conditions of the Creative Commons Attribution (CC BY) license (https://creativecommons.org/licenses/by/4.0/).
Share and Cite
MDPI and ACS Style
Masnavi, M.; Richardson, M. Spectroscopic Studies of Laser-Based Far-Ultraviolet Plasma Light Source. Appl. Sci. 2021, 11, 6919. https://0-doi-org.brum.beds.ac.uk/10.3390/app11156919
AMA Style
Masnavi M, Richardson M. Spectroscopic Studies of Laser-Based Far-Ultraviolet Plasma Light Source. Applied Sciences. 2021; 11(15):6919. https://0-doi-org.brum.beds.ac.uk/10.3390/app11156919
Chicago/Turabian StyleMasnavi, Majid, and Martin Richardson. 2021. "Spectroscopic Studies of Laser-Based Far-Ultraviolet Plasma Light Source" Applied Sciences 11, no. 15: 6919. https://0-doi-org.brum.beds.ac.uk/10.3390/app11156919
Note that from the first issue of 2016, this journal uses article numbers instead of page numbers. See further details here.