Article

The Montreal Experience: A Retrospective Study Part I—Basic Principles and Treatment Algorithm

1
École d’optométrie, Université de Montréal, Montréal, QC H3T 1P1, Canada
2
Département de Physique, Section Sciences et Techniques, Faculté Sciences Exactes et Appliquées, Université d’Oran 1, Oran 31000, Algeria
3
College of Optometry, The Ohio State University, Columbus, OH 43210, USA
*
Author to whom correspondence should be addressed.
Submission received: 1 June 2021 / Revised: 14 July 2021 / Accepted: 7 August 2021 / Published: 13 August 2021
(This article belongs to the Special Issue Light and Optical Devices for Myopia Management)

Abstract

:
CONTEXT: Authors have refined myopia control strategies (MCS) from their experience treating more than 800 children who were followed at the Montreal School of Optometry Clinic (CUV). They developed a treatment algorithm known as the Montreal Experience (ME). Contrary to many other MCS, treatment modalities are selected after careful evaluation of a patient’s parameters (rate of progression, age of myopia onset, corneal parameters, pupil area), the risk factors for ocular pathology (growth charts), and taking into account the patient’s lifestyle and potential compliance. This represents a customized approach for each patient. PURPOSE: To evaluate the efficacy of MCS used following ME algorithm; the primary outcome relates to axial length progression over 24 months. METHODS: This is a retrospective study, conducted after approval of University IRB. Data were extracted from the file of each patient who: (1) consulted CUV between January 2017 and December 2018 and (2) were kept under the same MCS (same design/concentration). Clinical population is composed of 298 patients (35% Caucasian; 45% Asian; 20% others), with a median age of 11 (range 5–18). The treatment options were orthokeratology (OK-4 designs; N = 140), multifocal soft contact lenses (SMCL; 5 designs; N = 128), and low-dose atropine (LDA 0.01% to 0.25%; N = 42). RESULTS: Results are analyzed through sophisticated statistical models, designed for this purpose. At the end of a stepwise selection process that sequentially removed model terms that were not statistically significant, nine model terms remained: month, modality, the interaction of month and modality, refraction (SEQ), the interaction of SEQ and modality, gender, age, the interaction of age and month, and the interaction of age and modality. A total of 298 files were kept for analysis. Participant age varied from 9.7 to 12.5 years old. Baseline AL varied from 24.9 to 25.3 mm and SE refraction was −3.7 + 1.7 D on average. This study population was divided between Caucasian (34%), Asian (44%), and other ethnic origins (22%). Overall results indicate that results vary according to modality and months only. There is no statistical difference based on age, gender, and SEQ. All methods used were effective to slow the natural AL growth. Evolution was the lowest when using smaller treatment zones OK lenses (0.249 mm) and the highest (0.376 mm) for those treated with LDA. This OK advantage was statistically significant versus other modalities at 1 and 2 years. CONCLUSION: The Montreal Experience reveals that personalized MCS may be effective to manage myopia efficiently. It shows AL evolution comparable to the documented natural evolution of emmetropes, especially when using customized or smaller treatment zone OK lens design. Future work on other populations will confirm this tendency.

1. Introduction

It is known that myopia is becoming epidemic. High myopia is associated with a higher risk of developing significant ocular pathologies, which may lead to visual impairment at an older age. This is why the World Health Organization has identified myopia and high myopia as a public health issue [1] and has challenged governments, public agencies, eyecare professionals, and other stakeholders to develop strategies to reduce the burden of this avoidable blindness.
Moreover, the World Council of Optometry has adopted a resolution advising myopia management, mitigation and measurement to be incorporated as a standard of care for optometrists [2]. More specifically, mitigation implies that eye care practitioners (ECP) must educate and counsel parents and children, during early and regular eye exams, on lifestyle, dietary, and other factors to prevent or delay the onset of myopia. Measurement means that ECP must evaluate the status of a patient during regular comprehensive vision and eye health exams, such as measuring refractive error and axial length whenever possible. Finally, management asks ECP to address patients’ needs of today by correcting myopia, while also providing evidence-based interventions (e.g., contact lenses, spectacles, pharmaceuticals) that slow the progression of myopia, for improved quality of life and better eye health today and into the future.
If this position seems innovative, it is not new for experts at the Clinique Universitaire de la Vision, Université de Montréal (CUV). Indeed, for more than 15 years, CUV professionals have been practicing myopia control techniques which have been proven. With time and experience, they have refined their methods. Their clinical approach is now known as the Montreal Experience (ME), based on three pillars [3]. This approach differs from others because it is highly customized to the patient, takes into account binocular vision status, and relies on the pupil area and the myopic defocus generated to establish a dose response strategy.

1.1. The First Pillar: Environmental Control

The first pillar is that of environmental control. While it is known that myopia can be explained in a small part (20–30%) by genetics, epigenetics has more influence on progression and the level of final refractive error [4]. It is therefore essential to consider elements from the environment influencing the onset and progression of myopia.
There is consensus on the positive impact of exposure to daylight before the onset of myopia [5]. Patients are advised to get a minimum of one hour, and preferably two hours, of outdoor activities each day. The pandemic brought greater attention to factors such as reading distance, screen time [6], and surrounding lighting during this type of work.
Consequently, recommendations are given on leisure time spent on screens, following the World Health Organization guidelines [7]: no exposure before the age of 2 years, a limit of 1 h per day of screen time between 2 and 5 years old, and of 2 h per day for those aged 5 to 18. Obviously, frequent pauses are recommended, i.e., 10 min per hour [8]. The reading distance is measured from where oculomotor responses are tested. In general, computers are seen at 55 cm, but reading on a tablet brings the working distance to 33 cm and smartphones to 18–20 cm. Evaluating a patient’s condition at these different distances makes it possible to highlight problems of convergence and accommodation that might otherwise go unnoticed [9]. We recommend that children and parents respect at least the good old Harmon distance at all times, regardless of the electronic medium used. Light environment can also play a role [10]. It is obvious that it is recommended never to use screens in half-light or in darkness. Likewise, especially in adolescents, it is strongly recommended to stop using phones and screens at least one hour before sleeping. Indeed, such use can disrupt the sleep cycle. However, it is recognized that young patients who sleep late tend to see their myopia evolving at a faster rate [11]. Finally, the aspect of nutrition is discussed. Indeed, a diet rich in carbohydrates is associated with greater myopia evolution [12]. Likewise, a poorly balanced diet and/or obesity can be associated with insulin resistance, which disrupts the ability of the crystalline lens to adapt during the process of emmetropization, therefore leading to myopisation [13].

1.2. The Second Pillar: Binocular Vision Assessment

There are numerous factors to convince practitioners to pay attention to in binocular vision assessment in light of myopia onset and development. Kids who may become myopic are show a higher accommodative lag versus those who may remain emmetropic [14]. Children with higher AC/A ratios are 20 times more at risk to develop myopia [15]. If a practitioner sees a young patient showing esophoria at near and a high lag, still being hyperopic, one of the only ways to prevent myopia onset is to control their binocular function. Red flags for myopic evolution are raised in the presence of negative relative accommodation (NRA) = +2D, positive relative accommodation (PRA) < −2D and rock flips (+2/−3) less than 13 cycles per minute.
From the recent literature, it is possible to associate accommodation and convergence problems with progressive myopia [16]. Thus, accommodation modifies the quality of the optical signal received by the retina and can therefore influence the response to a given defocus. Normal accommodation is necessary for emmetropization, as well as for effective control of its evolution.
The ME approach aims to treat the binocular vision problems identified at baseline before undertaking myopic control treatment. Likewise, the presence of binocular dysfunctions may also dictate the strategy used when myopia is developed [17]. Thus, patients with a strong exo deviation at near will be better served with anti-myopia glasses, with or without prisms, than with contact lenses. A combination of both contact lenses and prismatic glasses may work even better.

1.3. The Third Pillar: Control of the Blur

Much has been written around the theory of peripheral defocus [18] as the main suspected cause of myopic evolution. Things have to be put into perspective here. What periphery are we talking about? When we see studies measuring peripheral refraction at 20 and 30 degrees nasally and temporally, this does not correspond to the area that actually influences the eye’s response to defocus. The sensitive zone, on the periphery, concerns the 15 degrees on each side of the macula [19]. Beyond that, it is noise for the eye, with no effect on the evolution of the refractive error.
This implies that the ophthalmic lenses used to control axial length growth must induce a myopic defocus relatively close to the central zone reserved for far vision. This convex power must also be calibrated according to the entrance gate, which is the pupil [20]. This is another debate for which the final answer has not been obtained, but some studies point in the direction of proving that the best results are obtained when the central zone and the zone providing the myopic defocus are in equilibrium within the pupillary zone [21].
Recent studies also tend to confirm the dose–response effect [22] that has been observed in animals [23]. It would seem, in fact, that the strongest convex powers, at the periphery, lead to better results. Here again it is necessary to calibrate the aspects of powers and of diameter of the zones, otherwise the use of strong convex powers will be accompanied by a loss of clarity in distance vision [24]. This will require an over-correction of the refractive power [25]. This over-correction may generate an effect on accommodation and convergence, factors that we consider important in effective myopic control.
If peripheral refraction is considered more important than central vision to drive the ocular response to any defocus, this does not mean that central vision has no effect on the onset and development of myopia. Thus, any significant central vision blur is difficult to interpret and results in myopic progression [26]. This is why under-correction techniques are ineffective and encourage the progression of refractive error. This also implies that young patients must be monitored regularly to ensure that their visual correction is always optimal. It is quite common to see patients with a monocular astigmatism, compensated in spherical equivalent, progressing on this side while the other eye remains stable. The importance of addressing refractive astigmatism is crucial in myopia control [27].
Considering all of these elements, ME is based on the use of lenses that provide the highest convex power, within the pupil area, without inducing blur at distance. It also implies the full correction of any significant astigmatism (>0.75 D). These goals are achieved most of the time with customization of orthokeratology lenses. In the case of multifocal soft lens usage, the highest add possible is selected, with full correction of astigmatism, as part of the lens power, or with glasses to be worn on top of the lenses.

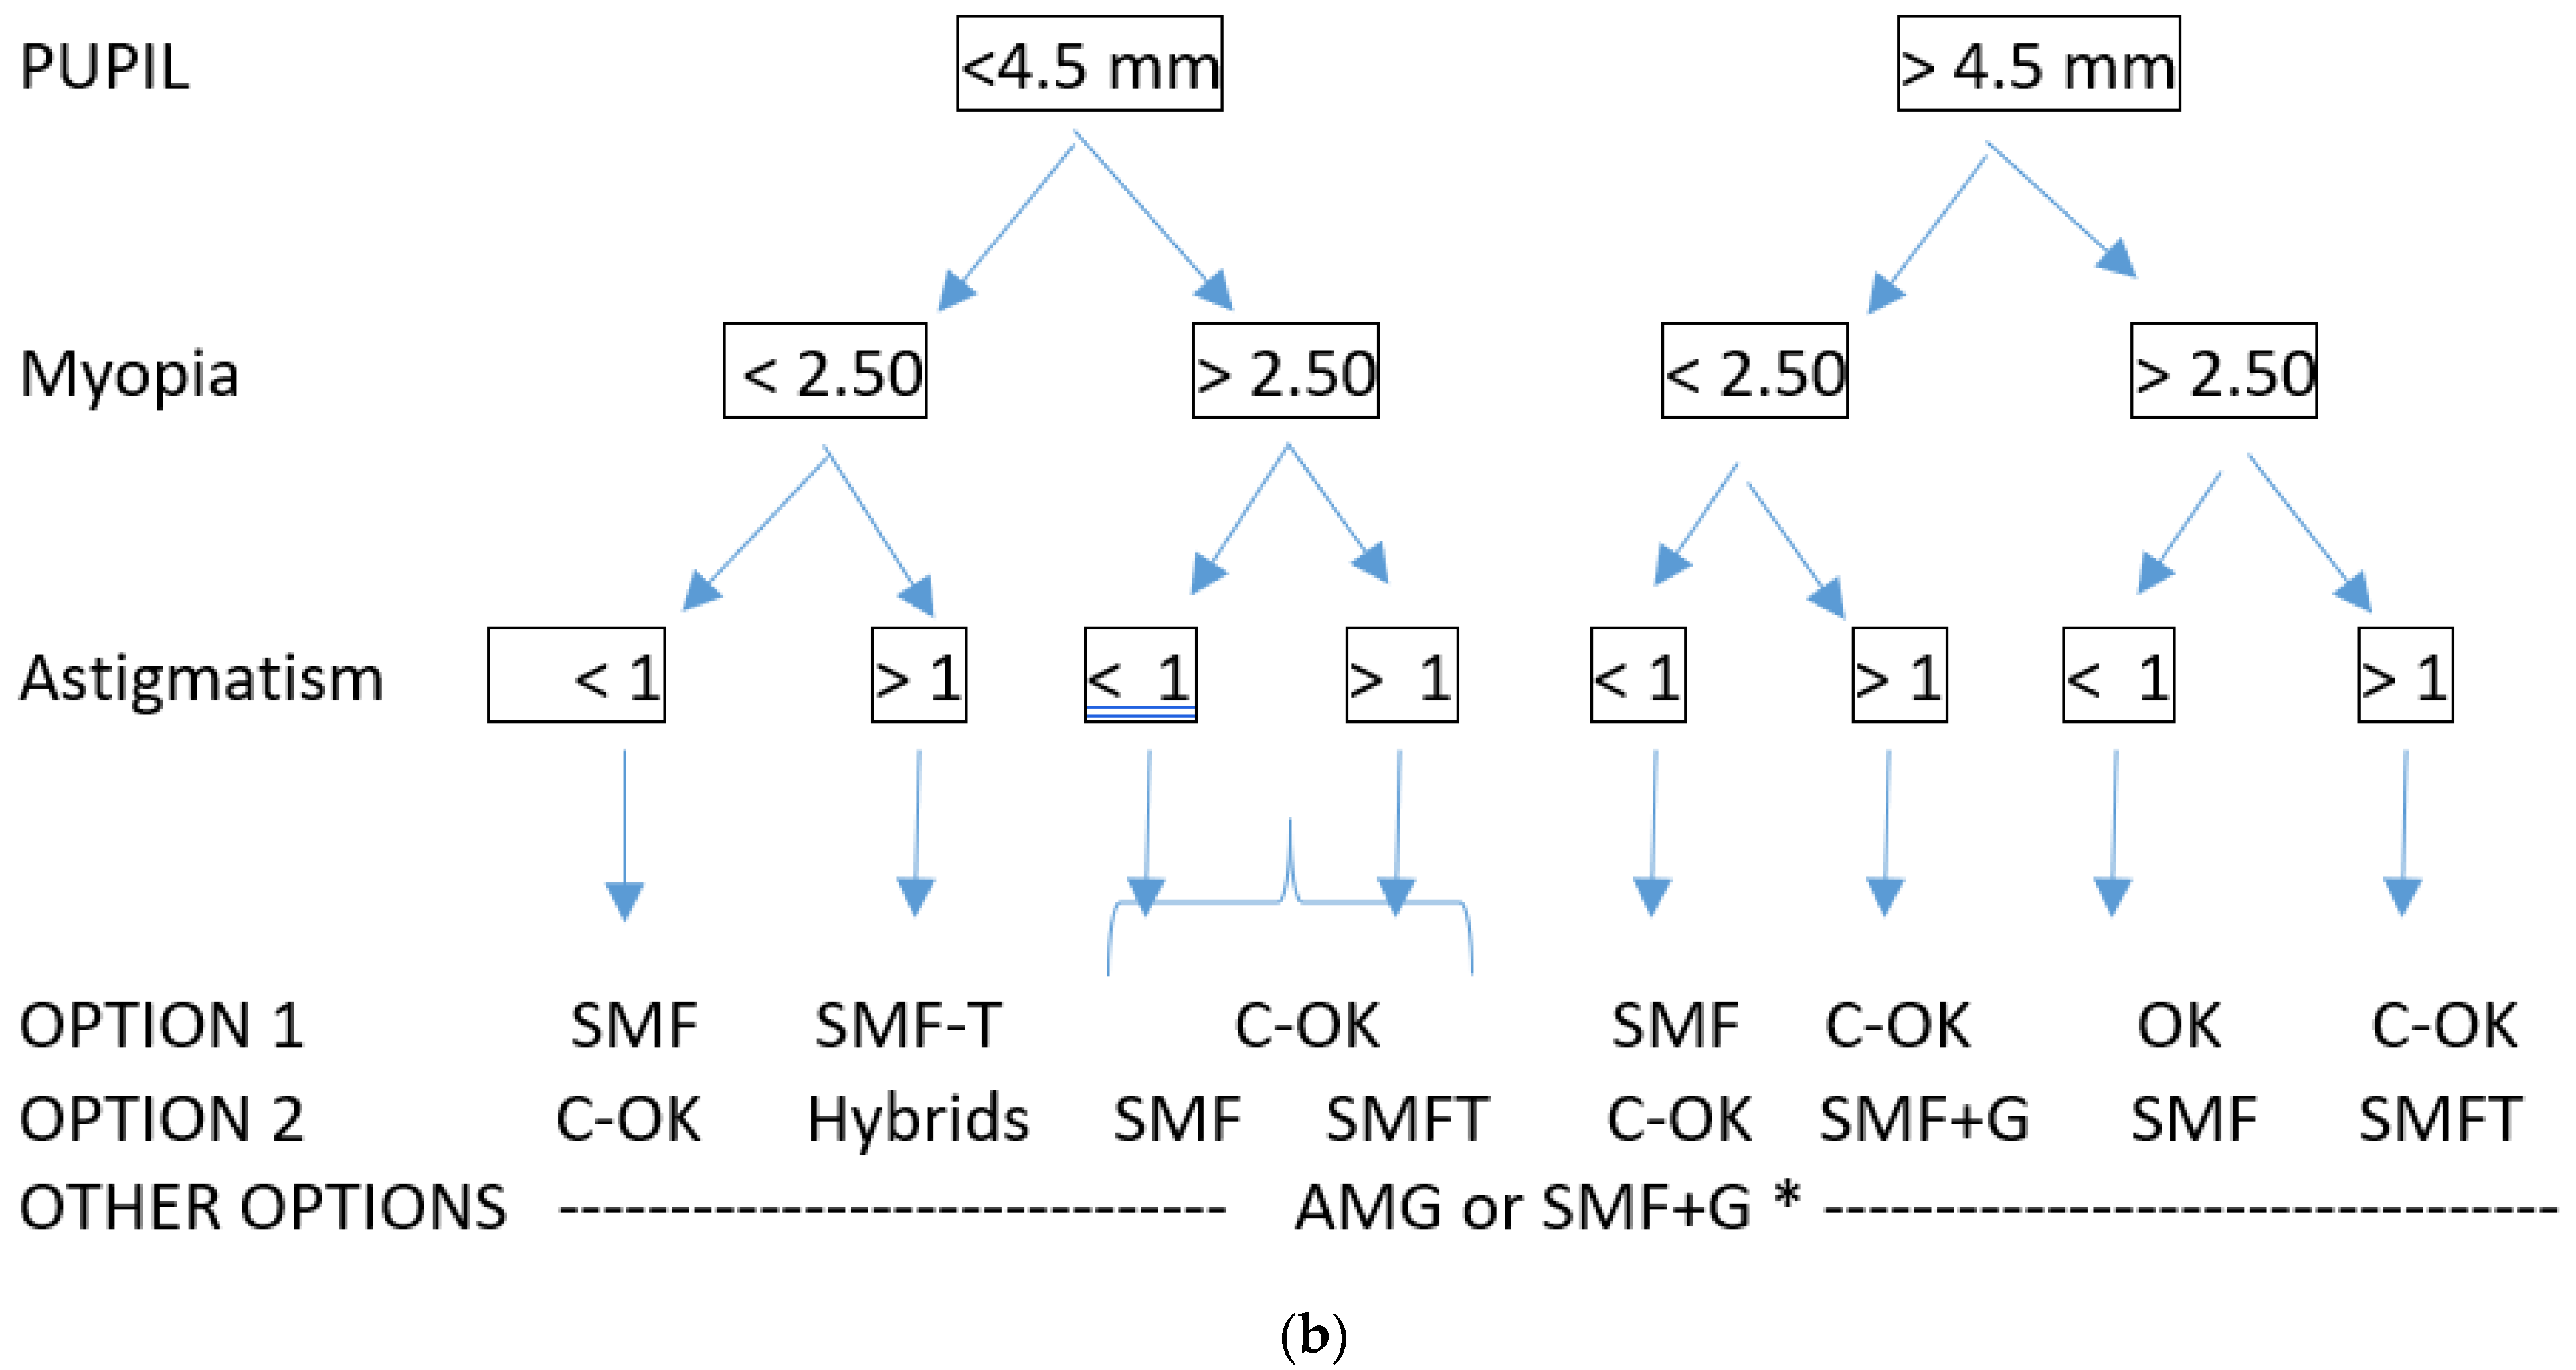
1.4. Selection of the Right Strategy

It is one thing to adopt these principles, but it is important to translate them into practice. This means selecting the right strategy for the patient. It is important to remember that ECP have a lot of tools in their hands to achieve successful control. Customization is the right word here also.
The following decision tree (Figure 1a) illustrates the rationale behind the selection of the strategy, at the heart of the Montreal Experience. It starts with confirmation of the myopic status, conducting cycloplegic subjective refraction (cyclopentolate 1% (2 drops spaced 5 min) at baseline and tropicamide (1%, 2 drops spaced 5 min) during follow-ups), to be confirmed with automated refraction thereafter. Once confirmed as a myopic patient, evaluation of the binocular vision represents the next step (at another visit, not under cycloplegia). Depending on the results, vision therapy may be initiated as needed. Once BV is restored, and if the patient is over 6 years old, contact lenses are considered as the preferred option to control myopia and axial length growth. Some types of anti-myopia glasses can be effective but are subject to centration issues if they slip on the nose. Frame selection is important to ensure proper distribution of the lenses around the eyes, especially in case of higher refractive error [28]. Contact lenses remain in front of the optical system all the time, which may represent a benefit.
The type of contact lens is selected based on the patient’s profile (see Figure 1b). In general, lower myopes (<2.50 D) with smaller pupils (4.5 mm) are better managed with soft multifocal lenses than with orthokeratology, except if the latter is fully customized [29]. OrthoK lenses are preferred for higher myopes, and for any myopic children with significant central corneal astigmatism (>0.75 D). Low-dosage atropine may be prescribed as a monotherapy but more often as an adjunct therapy if the growth chart indicates that AL will go over 26 mm, or when evolution is not under control as expected.

1.5. Importance of the Follow-Ups

Myopia management implies that the patient is followed closely to ensure that the condition progresses as expected, that the patient is still compliant with the prescribed treatment, and that eye health remains normal. The recent COVID pandemic has proven the importance of such follow-ups, every 3 to 6 months. Indeed, several patients had not been seen during these months due to public health restrictions. A number of these children were staying at home and wore only their regular glasses, taking a break from contact lenses. When they were seen again, their myopia had evolved from 0.4 to 0.6 mm AL growth in a single year. The Montreal Experience implies that the evolution of the patient is evaluated according to the variation of the axial length and not according to the dioptric changes. This confirms the trends seen in China, where the youngest cohorts appeared to be the most visually affected during home confinement [30].

1.6. Aim of the Study

It is one thing to develop a systematic approach, and it is quite another to measure its effectiveness in the field. This is why a retrospective study was needed to assess whether the application of strategies based on personalization of treatments, which is the Montreal Experience, were effective.

2. Methods

This retrospective study was conducted in accordance with the tenets of the Declaration of Helsinki and was approved by the Université de Montréal Ethical Committee Review Board (CERC 19-036-June 2019). Data were extracted from the file of each patient, aged 5–18 who: (1) consulted CUV myopia control clinic between January 2017 and December 2018 and (2) were kept under the same myopia management (same design/concentration) during that time. Elements considered for analysis were: age, gender (male, female), ethnicity (Asian, Caucasian), spherical refractive error, photopic pupil size, strategy employed to control myopia, and their variants (4 OK lens designs, 4 soft multifocal lenses, 2 dosages of atropine 0.01% or 0.025% and axial length). Details about lens designs are described in Table 1 andTable 2. Data were collected at baseline and every 6 months, for both eyes, during the study period (2 years).

Statistical Analysis

The data were used to fit models of axial length. Linear mixed models were fit using the SAS procedure MIXED. The goal of modeling was (1) to assess whether myopia control type, which we will refer to as modality, had a statistically significant effect on AL progression over time, and, if so, (2) to estimate the 12 and 24 month progression differences between modality alternatives. To assess whether modality had a statistically significant effect, the initial model included month (0, 6, 12, 18 and 24 months), modality (Atropine, OrthoK1, OrthoK234, and SMCL), and the interaction of month and modality, along with gender, baseline age, ethnicity, baseline spherical equivalent (SEQ), and eye (OD, OS); and the interactions of gender, baseline age, ethnicity, baseline spherical equivalent, and eye with month and modality. At the end of a stepwise selection process that sequentially removed model terms that were not statistically significant, nine model terms remained: month, modality, the interaction of month and modality, baseline SEQ, the interaction of SEQ and modality, gender, baseline age, the interaction of age and month, and the interaction of age and modality. The statistical significance of model predictors are shown in Table 3.
The repeated within-subject measures of axial length for each eye (OD, OS) over time (0, 6, 12, 18 and 24 months) resulted in clusters of possibly correlated data. Correlation between the ten repeated measures was modeled using a method described by Glynn and Rosner [31]. Part of the within-subject correlation was modeled by including a subject-level random effect. In addition, the two-eye-at-each-visit pattern of a subject’s 10 measures was modeled by assuming that the model’s error had a UN@CS covariance structure. UN@CS is the SAS designation for the Kronecker product of two matrices, an unstructured (UN) 5 × 5 matrix associated with month and a 2 × 2 compound symmetry (CS) matrix associated with eye.
All of the analyses were done using SAS version 9.4 for Windows.

3. Results

3.1. Study Population

Based on the inclusion criteria, the files of 298 participants were kept for analysis. Among them, 140 were fitted with various OK designs and 116 with one of the soft multifocal lens available for myopia management. Finally, low-dose atropine (0.01% and 0.02%) was the treatment selected for 42 participants. Table 4 andTable 5 give the baseline characteristics of these various clinical populations.

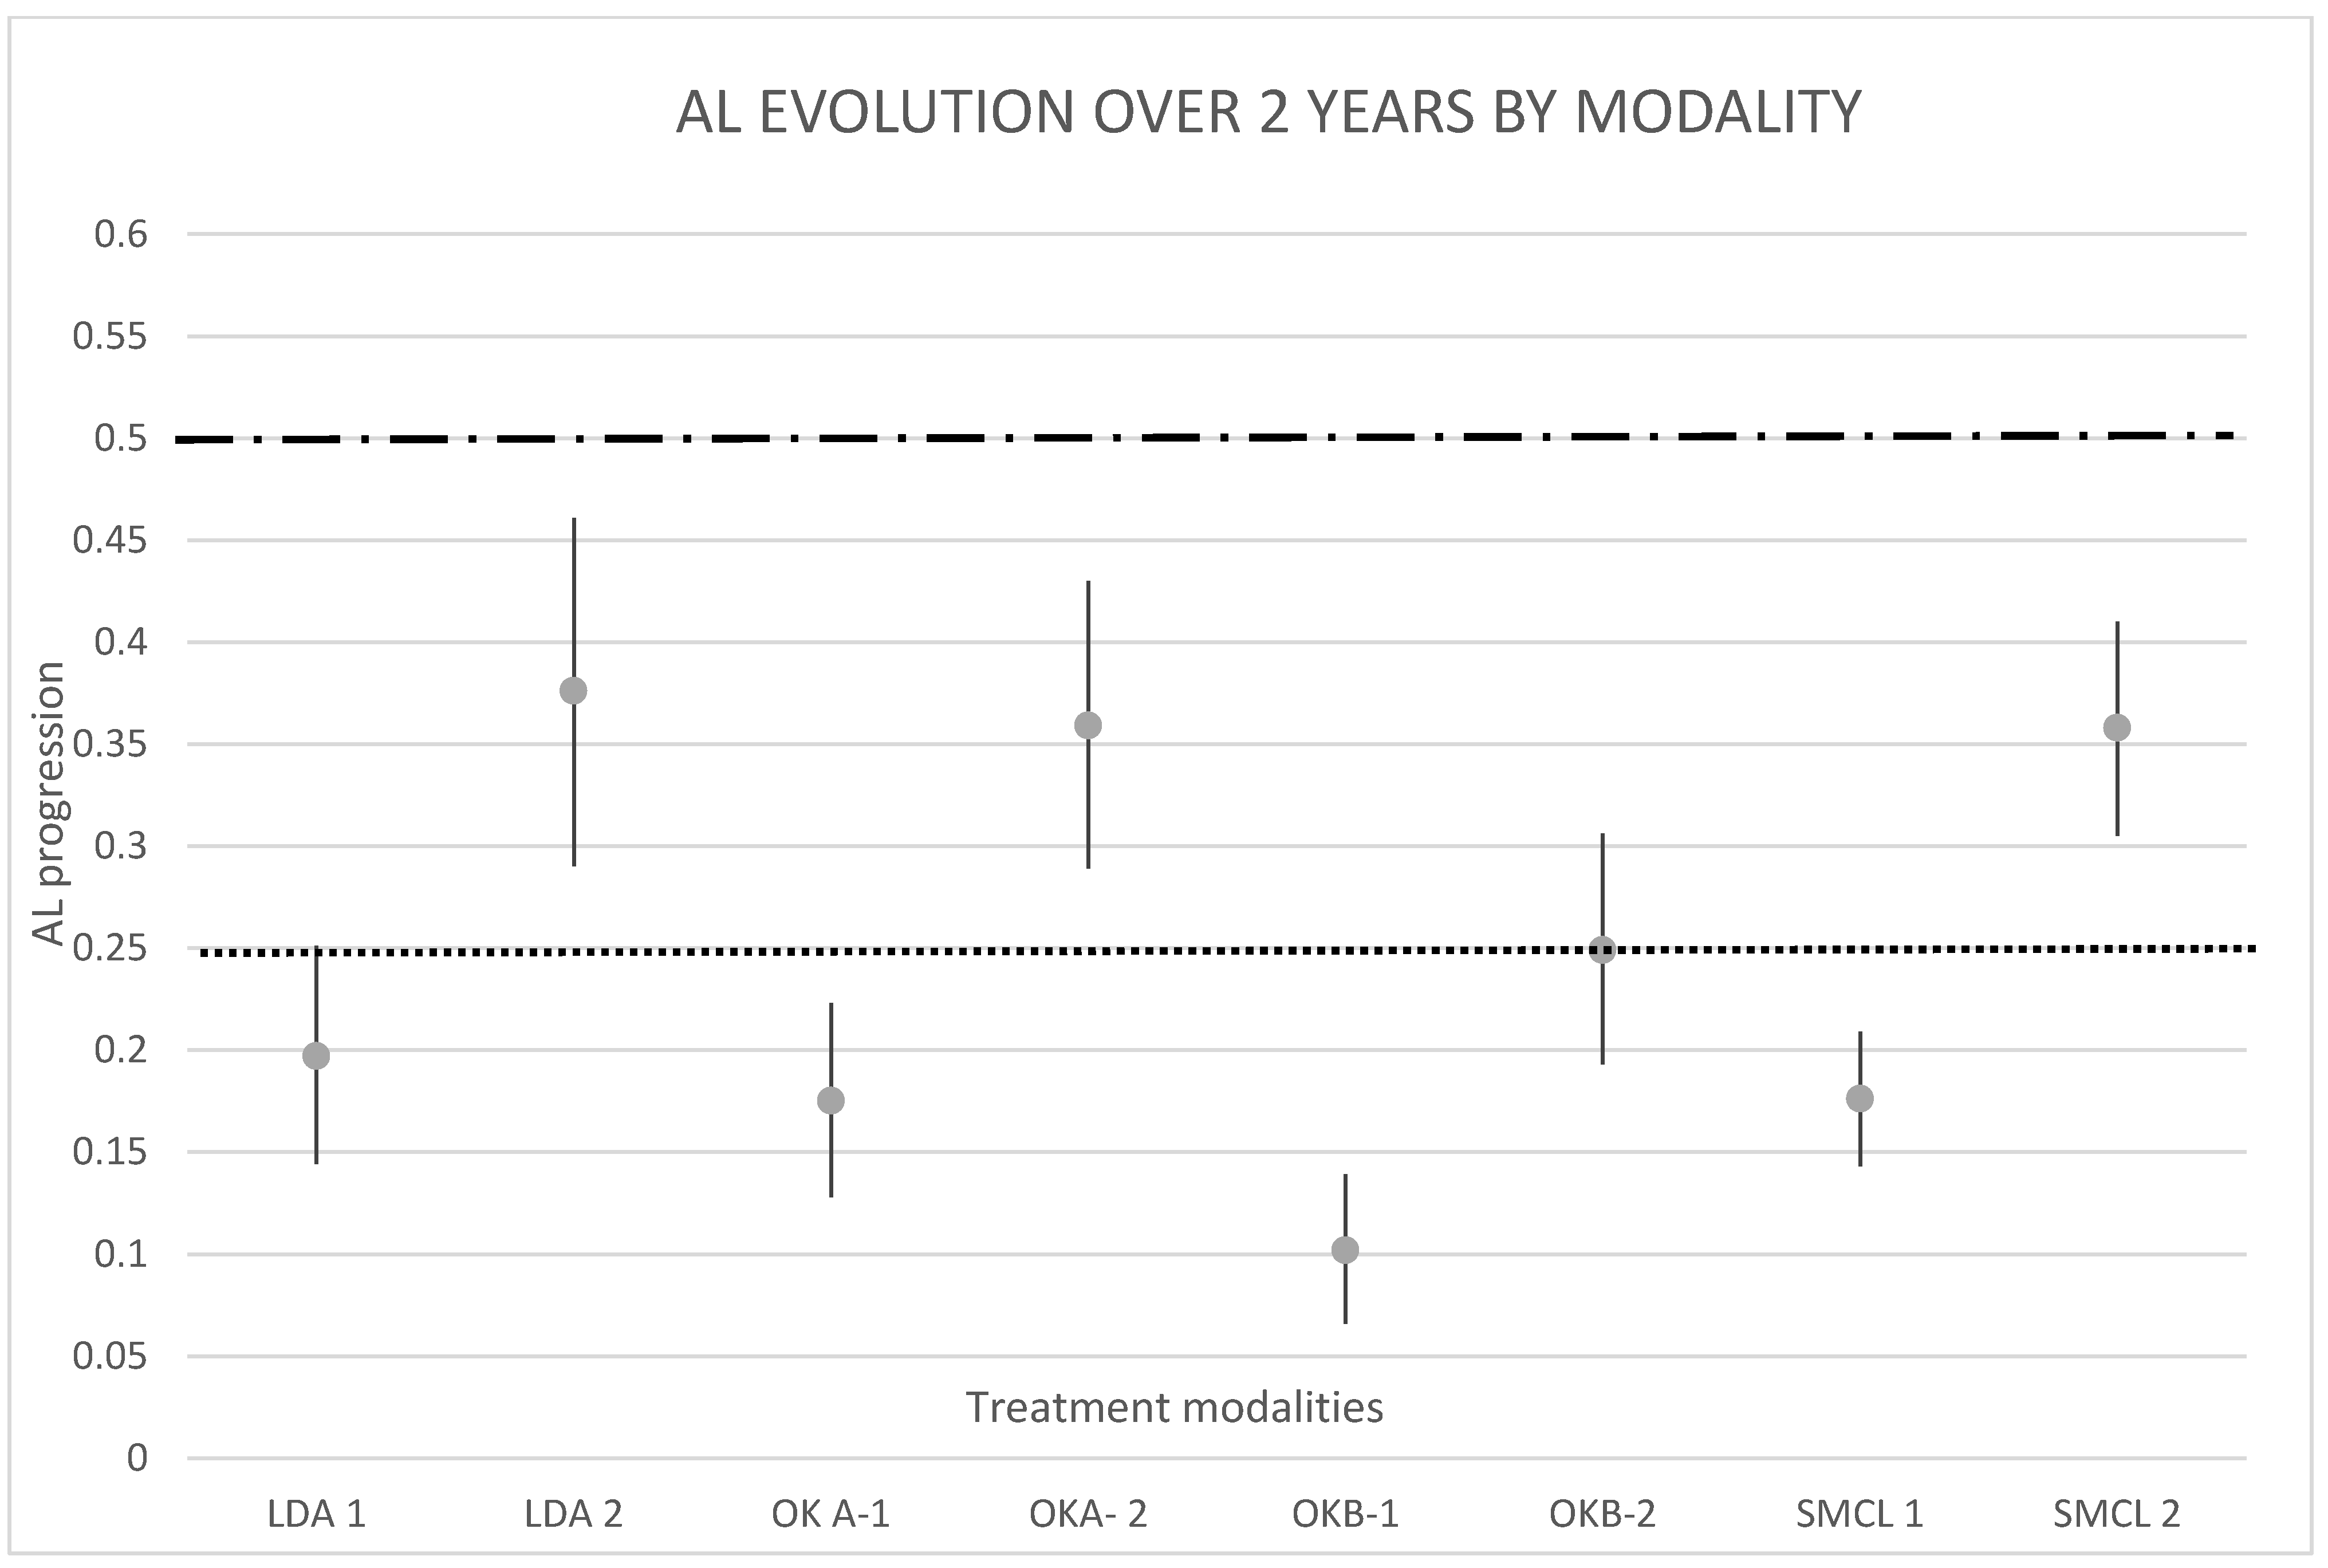
3.2. Axial Length Evolution over Time

At baseline, AL varied from 24.9 to 25.3 mm. Considering that participants were aged 9.7 to 12.5 years old, they were classified at the 95th percentile of the growth curve [32,33], with a significant risk of 31% to develop high myopia. Average AL progression is habitually 0.2 mm/year [34] to 0.3 mm/year for the myopic Asian population [35] and 0.22 mm/year for Caucasians [36]. It is reasonable to estimate higher values for fast progressors, such as 0.6 in an Asian population [37].
As for the studied population, detailed results are presented in Table 6. OrthoK 1 and OrthoK 2–3 and 4 were analyzed as separate groups based on the design differences (to be detailed in a future article, i.e., Part 2). In summary, OrthoK 1 offers a larger treatment zone (6 mm) vs. a customized-to-the pupil one (OK2) or a reduced diameter for OK3 and 4. Habitually, smaller treatment zones in OrthoK are associated with a larger and more powerful mid-peripheral ring [38].
Summaries of key model findings, at years 1 and 2, are presented in Table 7 and Table 8. Axial elongation varied from 0.102 mm with OrthoK 2-3-4 to 0.197 when atropine was used during the first year. The total evolution over 2 years varied from 0.249 mm with OK 2-3-4 to 0.376 mm with low-dose atropine. These results represent 50.2% and 24.8% control versus expected AL growth, based on theoretical progression for similar populations.
It appears that the amount of progression is a function of modality. There is statistical evidence of a progression difference between OrthoK 2,3,4 and all of the other modalities, over both the first and second year of treatment (Table 8). The interaction of month and modality was statistically significant (p = 0.006), providing evidence that modality moderated the effect of time on AL.

4. Discussion

This retrospective study aimed to explore if the Montreal Experience approach is working in slowing myopia evolution over time. Results proved that it is, at least if we compare the cumulative progression against theoretical models for control. These good results were obtained regardless of the modality prescribed to the patients with the exception of low-dose atropine, especially during the first year of treatment. As expected, control efficacy during the second year is slightly less effective than during the first year of treatment [39]. Overall, the results indicate a cumulative axial length growth of 0.249 to 0.376 mm over 2 years, which is similar to the natural evolution of an emmetropic child of a matching cohort age. Considering OrthoK lenses (#2-3-4), the 2 years outcome matches a single year of evolution for control.
The Montreal Experience is based on three pillars. This study was not powered to isolate the efficacy of each of these factors, but looked at them as an integrated approach.
The first pillar relates to the control of the environment. At every visit, participants and parents are reminded of the importance of limiting screen time, to increase time spent outdoors, etc. However, it is not possible to certify that every child treated at CUV had been fully compliant regarding these issues. Data extracted from the files do not include questionnaires or objective measurements of these elements. On the other hand, this represents the real-life scenarios that many ECP are facing in their office on a day-to-day basis.
The second pillar relates to the binocular vision management. Every patient showing significant BV dysfunction is referred to the BV clinic, at the Université de Montréal, prior to myopia management. On average, this represents 10 to 15% of the patients seen, which is comparable to the prevalence in a general population [40]. BV management occurs prior to implementing myopia control strategies. This means that all of the participants in this study were considered to have normal BV function at baseline. This represents one reason why it was not possible to isolate BV function as a factor in our analysis.
The third pillar relates to the control of the blur, centrally and peripherally. Central vision plays a minor role in myopia management but it still important to consider, knowing that under-correction leads to myopia progression. Participants were seen at 6-month intervals, following the recommended schedule of visits at CUV clinic. This does not mean that all of the participants enrolled at baseline were seen precisely every 6 months. Some follow-up visits may had been delayed due to agenda issues, compliance, availability, etc.
Control of the central blur means that full correction of myopia is prescribed and adjustments are made whenever necessary. Control of the peripheral blur is based on the presence of a dose–response effect in the system. To maximize the dose, we aim to generate the highest convex power possible (high add or customized peripheral ring power for OK lenses) and the relationship between the central and peripheral zones is calibrated based on the pupil area. This will be detailed in a future article (Part 2). Consequently, it is not only the level of the convex power that matters, but also its distribution in front of the visual system.
Because OrthoK lenses 2, 3 and 4 adopted smaller treatment zones, and they are then providing a higher dosage, it was expected the lenses would achieve a better outcome. This is confirmed by the overall results presented here: smaller treatment zone designs were more effective than the larger ones (see Table 8).
Soft multifocal lenses are preferred habitually (see Figure 1b) when myopia is lower but more when the pupil area is limited. As mentioned, it may be difficult to design a customized OK lens with a very small central treatment zone without impacting its overall behavior. It is then associated with a loss of suction effect and consequently lower convex power is generated.
Our results do not support this theoretical approach and may express the personal preference of CUV experts. In fact, there was little observed difference in the average refractive error and pupil diameter between our groups. We found that SMCL provided similar control when compared to the OrthoK 1 lens, and, with no surprise, was less effective than other OK designs (Table 8). This is true for the first and the second year of treatment. Detailed analysis about SMCL performance will be given in another manuscript (Part 2).
Low-dose atropine treatment was the least effective among the strategies prescribed to this cohort of participants. (See Figure 2). The difference with OrthoK 1 or SMCL is not statistically significant but, again here, OrthoK 2-3-4 were significantly more effective than LDA. What is concerning is the fact that participants treated with LDA as a standalone therapy were not so well controlled versus the theoretical control. This may be explained by the fact that, in 2017, a concentration of 0.01% was prescribed, as it was standard practice around the world. This is highlighted in the first year of the treatment. Later on, higher concentrations were used (0.025%) in light of more recent data [41] reporting the reduced efficacy of the smallest dosage of atropine on AL elongation. This increased dosage seemed to be more effective based on the results obtained during the second year. In the practice of the Montreal Experience, it is not common that atropine is used as a standalone therapy. It is more often used as an adjunct therapy with contact lenses when more aggressive control is necessary (fast progressors, those evolving more than anticipated, AL predicted to go over 26 mm, etc.). These cases of combined therapy were not included in our primary data collection, and we were unable to discriminate which factor influenced AL progression.
As with other retrospective studies, this one has several biases. The first one is the fact that participants were not seen at the exact same time for follow-up. This impacted the number of files kept for analysis at each step. Ideally, the same number of participants would have been analyzed at each time point. This discrepancy may influence the final outcomes, but careful statistical analysis took account for this factor.
The second bias is comparing our results to a virtual and historical control group. This is done to put the study data in perspective. Ideally, a prospective randomized control study would be necessary to draw more solid conclusions about the relative and comparative efficacy of the strategies used.
A third bias is coming from the fact that many clinicians are involved, at the CUV myopia clinic, in determining the strategy that will be used during the lens fitting process and follow-ups. All clinicians are trained similarly but it is not possible to exclude minor variations in the application of the decision tree (Figure 1a,b). These variations may influence the evolution of specific cases but the authors do not believe that it impacted the overall conclusions of this study.
Future work is needed to improve the ME model suggested here. With the help of artificial intelligence tools, it will be possible to include choroidal thickness response to visual stimuli as a way to predict efficacy of a particular device applied to a particular eye. This would be an ultimate customization of treatment management. User personality and mood recognition recommendations have also shown promising results [42] and warrant further investigations to evaluate how they can be applied to complement the ME approach. Studies on other populations may also provide elements to consider, the goal being to get the optimal management strategy for myopia.

5. Conclusions

Study results indicate that the Montreal Experience may be considered as a valid approach. Customization of the optical strategies used to control AL lead to encouraging results versus documented natural evolution. In particular, using OrthoK lenses with smaller central zones led to better outcomes for AL control over time.

Author Contributions

Conceptualization L.M., P.S., and R.M.-C.; methodology, L.M., P.S. and R.M.-C.; formal analysis, L.M., P.S., R.M.-C., M.O., L.T.S.; writing—original draft preparation, L.M.; writing—review and editing, L.M., P.S., R.M.-C., M.O. and L.T.S. All authors have read and agreed to the published version of the manuscript.

Funding

This research received no external funding.

Institutional Review Board Statement

The study was conducted according to the guidelines of the Declaration of Helsinki, and approved by the Institutional Review Board (or Ethics Committee) of Universite de Montreal (protocol code 19-036-P, approved 12 June 2019).

Informed Consent Statement

Patient consent was waived due to approval of the study by the Commission d’Accès à l’Information du Québec.

Data Availability Statement

Data can be available by addressing a written demand to the corresponding author.

Conflicts of Interest

The authors declare no conflict of interest.

References

  1. Resnikoff, S.; Jonas, J.B.; Friedman, D.; He, M.; Jong, M.; Nichols, J.J.; Ohno-Matsui, K.; Smith, E.L., III; Wildsoet, C.F.; Taylor, H.R.; et al. Myopia-A 21st Century Public Health Issue. Investig. Ophthalmol. Vis. Sci. 2019, 60. [Google Scholar] [CrossRef] [PubMed] [Green Version]
  2. Optometry, W.C. Resolution: The Standard of Care for Myopia Management by Optometrists. 2021. Available online: https://worldcouncilofoptometry.info/resolution-the-standard-of-care-for-myopia-management-by-optometrists/ (accessed on 10 May 2021).
  3. Michaud, L.; Simard, P.; Marcotte-Collard, R. The Three pillars of Myopia Control in Practice. July 2020. Available online: https://www.pointsdevue.com/article/three-pillars-myopia-control-practice (accessed on 10 May 2021).
  4. Tedja, M.S.; Haarman, A.E.; Meester-Smoor, M.A.; Kaprio, J.; Mackey, D.A.; Guggenheim, J.A.; Hammond, C.J.; Verhoeven, V.J.; Klaver, C.C.; CREAM Consortium. IMI-Myopia Genetics Report. Investig. Ophthalmol. Vis. Sci. 2019, 60, M89–M105. [Google Scholar] [CrossRef] [PubMed] [Green Version]
  5. Xiong, S.; Sankaridurg, P.; Naduvilath, T.; Zang, J.; Zou, H.; Zhu, J.; Lv, M.; He, X.; Xu, X. Time spent in outdoor activities in relation to myopia prevention and control: A meta-analysis and systematic review. Acta Ophthalmol. 2017, 95, 551–566. [Google Scholar] [CrossRef] [PubMed] [Green Version]
  6. Zhao, Y.; Guo, Y.; Xiao, Y.; Zhu, R.; Sun, W.; Huang, W.; Liang, D.; Tang, L.; Zhang, F.; Zhu, D. The Effects of Online Homeschooling on Children, Parents, and Teachers of Grades 1–9 during the COVID-19 Pandemic. Med. Sci. Monit. 2020, 26, e925591. [Google Scholar] [CrossRef]
  7. WHO. Guidelines on Physical Activity, Sedentary Behaviour and Sleep; World Health Organization: Geneva, Switzerland, 2019; p. 36. [Google Scholar]
  8. Kozeis, N. Impact of computer use on children’s vision. Hippokratia 2009, 13, 230–231. [Google Scholar]
  9. Rosenfield, M. Refractive error. Still the heart of optometry. Ophthalmic. Physiol. Opt. 2021, 41, 211–212. [Google Scholar] [CrossRef]
  10. Jiang, X.; Kurihara, T.; Torii, H.; Tsubota, K. Progress and Control of Myopia by Light Environments. Eye Contact Lens 2018, 44, 273–278. [Google Scholar] [CrossRef]
  11. Liu, X.N.; Naduvilath, T.J.; Wang, J.; Xiong, S.; He, X.; Xu, X.; Sankaridurg, P.R. Sleeping late is a risk factor for myopia development amongst school-aged children in China. Sci. Rep. 2020, 10, 17194. [Google Scholar] [CrossRef]
  12. Berticat, C.; Mamouni, S.; Ciais, A.; Villain, M.; Raymond, M.; Daien, V. Probability of myopia in children with high refined carbohydrates consumption in France. BMC Ophthalmol. 2020, 20, 337. [Google Scholar] [CrossRef] [PubMed]
  13. Mahto, H. Natural Ways of Myopia Control: A Public Health Approach for the Prevention of Myopia in College of Optometry; Pacific: Forest Grove, OR, USA, 2016. [Google Scholar]
  14. Mutti, D.O.; Mitchell, G.L.; Hayes, J.R.; Jones, L.A.; Moeschberger, M.L.; Cotter, S.A.; Kleinstein, R.N.; Manny, R.E.; Twelker, J.D.; Zadnik, K.; et al. Accommodative Lag before and after the Onset of Myopia. Investig. Ophthalmol. Vis. Sci. 2006, 47, 837–846. [Google Scholar] [CrossRef] [Green Version]
  15. Mutti, D.O.; Jones, L.A.; Moeschberger, M.L.; Zadnik, K. AC/A ratio, age, and refractive error in children. Investig. Ophthalmol. Vis. Sci. 2000, 41, 2469–2478. [Google Scholar] [CrossRef]
  16. Cheng, X.; Xu, J.; Brennan, N.A. Accommodation and its role in myopia progression and control with soft contact lenses. Ophthalmic. Physiol. Opt. 2019, 39, 162–171. [Google Scholar] [CrossRef] [PubMed]
  17. Gwiazda, J.; Hyman, L.; Hussein, M.; Everett, D.; Norton, T.T.; Kurtz, D.; Leske, M.C.; Manny, R.; Marsh-Tootle, W.; Scheiman, M.; et al. A randomized clinical trial of progressive addition lenses versus single vision lenses on the progression of myopia in children. Investig. Ophthalmol. Vis. Sci. 2003, 44, 1492–1500. [Google Scholar] [CrossRef]
  18. Smith, E.L., 3rd; Hung, L.F.; Huang, J.; Arumugam, B. Effects of local myopic defocus on refractive development in monkeys. Optom. Vis. Sci. 2013, 90, 1176–1186. [Google Scholar] [CrossRef] [Green Version]
  19. Smith, E.L., 3rd; Hung, L.F.; Huang, J.; Blasdel, T.L.; Humbird, T.L.; Bockhorst, K.H. Effects of optical defocus on refractive development in monkeys: Evidence for local, regionally selective mechanisms. Investig. Ophthalmol. Vis. Sci. 2010, 51, 3864–3873. [Google Scholar] [CrossRef]
  20. Bradley, A.; Nam, J.; Xu, R.; Harman, L.; Thibos, L. Impact of contact lens zone geometry and ocular optics on bifocal retinal image quality. Ophthalmic. Physiol. Opt. 2014, 34, 331–345. [Google Scholar] [CrossRef] [PubMed] [Green Version]
  21. Pauné, J.; Fonts, S.; Rodríguez, L.; Queirós, A. The Role of Back Optic Zone Diameter in Myopia Control with Orthokeratology Lenses. J. Clin. Med. 2021, 10, 336. [Google Scholar] [CrossRef] [PubMed]
  22. Walline, J.J.; Walker, M.K.; Mutti, D.O.; Jones-Jordan, L.A.; Sinnott, L.T.; Giannoni, A.G.; Bickle, K.M.; Schulle, K.L.; Nixon, A.; Pierce, G.E.; et al. Effect of High Add Power, Medium Add Power, or Single-Vision Contact Lenses on Myopia Progression in Children: The BLINK Randomized Clinical Trial. JAMA 2020, 324, 571–580. [Google Scholar] [CrossRef]
  23. Tse, D.Y.; To, C.H. Graded competing regional myopic and hyperopic defocus produce summated emmetropization set points in chick. Investig. Ophthalmol. Vis. Sci. 2011, 52, 8056–8062. [Google Scholar] [CrossRef] [Green Version]
  24. Kang, P.; McAlinden, C.; Wildsoet, C.F. Effects of multifocal soft contact lenses used to slow myopia progression on quality of vision in young adults. Acta Ophthalmol. 2017, 95, e43–e53. [Google Scholar] [CrossRef] [Green Version]
  25. Schulle, K.L.; Berntsen, D.A.; Sinnott, L.T.; Bickle, K.M.; Gostovic, A.T.; Pierce, G.E.; Jones-Jordan, L.A.; Mutti, D.O.; Walline, J.J.; Bifocal Lenses in Nearsighted Kids (BLINK) Study Group. Visual Acuity and Over-refraction in Myopic Children Fitted with Soft Multifocal Contact Lenses. Optom. Vis. Sci. 2018, 95, 292–298. [Google Scholar] [PubMed]
  26. Chung, K.; Mohidin, N.; O’Leary, D.J. Undercorrection of myopia enhances rather than inhibits myopia progression. Vision Res. 2002, 42, 2555–2559. [Google Scholar] [CrossRef] [Green Version]
  27. Fan, D.S.P.; Rao, S.K.; Cheung, E.Y.Y.; Islam, M.; Chew, S.; Lam, D.S.C. Astigmatism in Chinese preschool children: Prevalence, change, and effect on refractive development. BMJ 2004, 88, 938–941. [Google Scholar] [CrossRef] [PubMed] [Green Version]
  28. Franchi, C.; Longo, A.; Meslin, D. High Myopia: The specificities of refraction and optical equipment. Point. Int. Rev. Opht. Optics. 2016, 73, 34. [Google Scholar]
  29. Michaud, L.; Simard, P.; Marcotte-Collard, R. Defining a Strategy for Myopia Control. A systematic approach can help practitioners more effectively implement myopia control into practice. Contact Lens Spectr. 2016, 31, 36–42. [Google Scholar]
  30. Wang, J.; Li, Y.; Musch, D.C.; Wei, N.; Qi, X.; Ding, G.; Li, X.; Li, J.; Song, L.; Zhang, Y.; et al. Progression of Myopia in School-Aged Children After COVID-19 Home Confinement. JAMA Ophthalmol. 2021, 139, 293–300. [Google Scholar] [CrossRef]
  31. Glynn, R.J.; Rosner, B. Regression methods when the eye is the unit of analysis. Ophthalmic. Epidemiol. 2012, 19, 159–165. [Google Scholar] [CrossRef] [PubMed]
  32. Tideman, J.W.L.; Polling, J.R.; Vingerling, J.R.; Jaddoe, V.W.V.; Williams, C.; Guggenheim, J.A.; Klaver, C.C.W. Axial length growth and the risk of developing myopia in European children. Acta Ophthalmol. 2018, 96, 301–309. [Google Scholar] [CrossRef]
  33. McCullough, S.; Adamson, G.; Breslin, K.M.; McClelland, J.F.; Doyle, L.; Saunders, K.J. Axial growth and refractive change in white European children and young adults: Predictive factors for myopia. Sci. Rep. 2020, 10, 15189. [Google Scholar] [CrossRef]
  34. Wong, H.B.; Machin, D.; Tan, S.B.; Wong, T.Y.; Saw, S.M. Ocular component growth curves among Singaporean children with different refractive error status. Investig. Ophthalmol. Vis. Sci. 2010, 51, 1341–1347. [Google Scholar] [CrossRef] [Green Version]
  35. Cho, P.; Cheung, S.W.; Boost, M.V. Categorisation of myopia progression by change in refractive error and axial elongation and their impact on benefit of myopia control using orthokeratology. PLoS ONE 2020, 15, e0243416. [Google Scholar] [CrossRef] [PubMed]
  36. Jones, L.A.; Mitchell, G.L.; Mutti, D.O.; Hayes, J.R.; Moeschberger, M.L.; Zadnik, K. Comparison of ocular component growth curves among refractive error groups in children. Investig. Ophthalmol. Vis. Sci. 2005, 46, 2317–2327. [Google Scholar] [CrossRef] [Green Version]
  37. Cho, P.; Cheung, S.W. Retardation of myopia in Orthokeratology (ROMIO) study: A 2-year randomized clinical trial. Investig. Ophthalmol. Vis. Sci. 2012, 53, 7077–7085. [Google Scholar] [CrossRef] [PubMed]
  38. Carracedo, G.; Espinosa-Vidal, T.M.; Martínez-Alberquilla, I.; Batres, L. The Topographical Effect of Optical Zone Diameter in Orthokeratology Contact Lenses in High Myopes. J. Ophthalmol. 2019, 2019, 1082472. [Google Scholar] [CrossRef]
  39. Bullimore, M.A.; Richdale, K. Myopia Control 2020: Where are we and where are we heading? Ophthalmic. Physiol. Opt. 2020, 40, 254–270. [Google Scholar] [CrossRef] [PubMed]
  40. Christian, L.W.; Nandakumar, K.; Hrynchak, P.K.; Irving, E.L. Visual and binocular status in elementary school children with a reading problem. J. Optom. 2018, 11, 160–166. [Google Scholar] [CrossRef]
  41. Yam, J.C.; Li, F.F.; Zhang, X.; Tang, S.M.; Yip, B.H.; Kam, K.W.; Ko, S.T.; Young, A.L.; Tham, C.C.; Chen, L.J.; et al. Two-Year Clinical Trial of the Low-Concentration Atropine for Myopia Progression (LAMP) Study: Phase 2 Report. Ophthalmology 2020, 127, 910–919. [Google Scholar] [CrossRef] [PubMed]
  42. Moscato, V.; Picariello, A.; Sperli, G. An emotional recommender system for music. IEEE Intell. Syst. 2020. [Google Scholar] [CrossRef]
Figure 1. (a) Myopia control strategy Decision tree. (b) Contact lens selection decision tree. SMF: Soft multifocal, distance-centered, high add. SMF-T: Soft multifocal toric, distance-centered, high add. C-OK: Custom OrthoK (or OK with smaller central zone). OK: OK regular design (4–5 curves/standard central zone). G: Regular glasses (single vision). AMG: Anti-myopia glasses (lenses designed to control myopia). Hybrids: Duette progressive, distance-centered: customizable zone + add power (>+3D). * In some countries, customized soft MF lenses may be also an option (zones + add power customizable).
Applsci 11 07455 g001aApplsci 11 07455 g001b
Figure 2. LDA: low dose atropine, year 1 (LDA1) and 2 (LDA2). OKA: large treatment zone (OrthoK1 lens), year 1 (OKA-1) and 2 (OKA-2). OKB: smaller treatment zone (OrthoK2-3-4 lenses), year 1 (OKB-1) and 2 (OKB-2). All soft multifocal contact lens combined, year 1 (SMCL1) and 2 (SMCL2). Reference lines: points: average 1 year progression-control; bar/points: 2 years progression-control.
Applsci 11 07455 g002
Table 1. Lens variants description, OrthoK.
Lens TypeBrand NameTreatment Zone (mm)Jessen Factor (D)Overall Diameter (mm)
OrthoK 1Paragon CRT (Cooper Vision)6.00.5010.5
OrthoK 2U de M design (custom; RGP designer software)Variable vs. pupil
Between 5.4 and 6.0
Average 5.6
Variable. Average 0.75Variable. Covers 95% of the visible cornea, average 10.6
OrthoK 3DRL (Precilens)Variable vs. refraction
Between 5.0 and 6.0
Average 5.5
1.5Variable. Covers 95% of the visible cornea, average
10.8
OrthoK 4DreamLens (Bausch & Lomb)5.0 to 6.0
Average 5.0
0.7510.6
Table 2. Lens variants description, soft multifocal lenses.
BrandAdd PowerDesign
Soft MF 1Oasys for presbyopia (Johnson & Johnson)High add (= +1.75 D)Concentric rings—alternating powers
Soft MF 2Biofinity D (Cooper Vision)+2.00 D or +2.50 DCentered distance—with 2 distinct zones. Central: 2.3
Soft MF 3Proclear D (Cooper Vision)+2.00 D or +2.50 DCentered distance—with 2 distinct zones. Central: 2.3
Soft MF 4Mi Sight (Cooper Vision)+1.75Concentric rings—alternating powers
Table 3. Effect p values for a model of axial length. Modalities included in the modality effect were Atropine, OrthoK1, OrthoK234, and SMCL. The OrthoK 2, 3 and 4 variants and SMCL 1, 2, 3, and 4 variants were grouped to form the OrthoK234 and SMCL modalities. Only the OrthoK 1 variant is included in OrthoK1.
MonthModalityInteraction of Month and ModalityBaseline SEQInteraction of Modality and SEQGenderAgeInteraction of Month and AgeInteraction of Modality and Age
<0.0010.8520.006<0.0010.008<0.0010.002<0.0010.040
Table 4. Background statistics for the OrthoK and atropine groups at baseline.
OrthoK 1 2
(N = 51)
OrthoK 2
(N = 49)
OrthoK 3
(N = 18)
OrthoK 4
(N = 22)
Atropine 3
(N = 42)
Overall
(N = 182)
Age (Mean ± SD)11.2 ± 2.011.6 ± 2.412 ± 2.211.7 ± 1.99.7 ± 2.311.1 ± 2.3
Gender (N (%))
Male27 (52.9%)11 (22.4%)7 (38.9%)12 (54.5%)17 (40.5%)74 (40.7%)
Female24 (47.1%)38 (77.6%)11 (61.1%)10 (45.5%)25 (59.5%)108 (59.3%)
Ethnicity (N (%))
Caucasian17 (33.3%)13 (26.5%)5 (27.8%)9 (40.9%)19 (45.2%)63 (34.6%)
Asian25 (49%)25 (51%)12 (66.7%)10 (45.5%)9 (21.4%)81 (44.5%)
Other 19 (17.6%)11 (22.4%)1 (5.6%)3 (13.6%)14 (33.3%)38 (20.9%)
SEQ—Averaged across eyes (Mean ± SD)
in Diopters
−3.2 ± 1.0−3.5 ± 1.4−4.2 ± 2.3−3.8 ± 1.2−4.3 ± 2.3−3.7 ± 1.7
Pupil size—Averaged across eyes (Mean ± SD)
in mm
5.0 ± 0.65.2 ± 0.74.9 ± 0.85.3 ± 0.75.4 ± 0.95.1 ± 0.7
1 Other ethnical origin relates to Latin-American, Afro-American or Haitian origin. 2 OrthoK 1: Paragon CRT; OK2: Custom Design (U de M); OK3: DRL (Precilens); OK4: Dreamlens (B&L). 3 Atropine: 0.01%, (mostly in 2017) or 0.025% (toward the end of 2018).
Table 5. Background statistics for the soft multifocal contact lens (SMCL) groups at baseline.
SMCL 1 1
(N = 52)
SMCL 2
(N = 26)
SMCL 3
(N = 22)
SMCL 4
(N = 16)
Overall
(N = 116)
Age (Mean ± SD)11.6 ± 2.612.5 ± 2.011.8 ± 2.212.2 ± 2.011.9 ± 2.3
Gender (N (%))
Male15 (28.8%)14 (53.8%)5 (22.7%)5 (31.3%)39 (33.6%)
Female37 (71.2%)12 (46.2%)17 (77.3%)11 (68.8%)77 (66.4%)
Ethnicity (N (%))
Caucasian14 (26.9%)12 (46.2%)5 (22.7%)8 (50%)39 (33.6%)
Asian25 (48.1%)4 (15.4%)7 (31.8%)6 (37.5%)42 (36.2%)
Other13 (25%)10 (38.5%)10 (45.5%)2 (12.5%)35 (30.2%)
SEQ—Averaged across eyes (Mean ± SD) in Diopters−3.7 ± 2.0−4.5 ± 1.4−5.4 ± 2.2−3.2 ± 1.9−4.1 ± 2.0
Pupil size—Averaged across eyes (Mean ± SD) in mm5.1 ± 0.84.7 ± 0.75 ± 0.75.4 ± 0.85 ± 0.8
1 SMCL1: Oasys for Presbyopia (J&J); SMCL2: Biofinity D (Cooper Vision); SMCL3: Proclear Toric MF (Cooper Vision); SMCL4: MiSight (Cooper Vision).
Table 6. Summary statistics for axial length measurements.
Eye Eye
DatasetTimeRightLeftDatasetRightLeft
Ortho1Baseline24.97 ± 0.71
(N = 49)
24.94 ± 0.75
(N = 51)
SMCL125.18 ± 1.03
(N = 50)
25.19 ± 1.04
(N = 50)
6 months25.10 ± 0.76
(N = 17)
25.1 ± 0.82
(N = 17)
25.03 ± 1.13
(N = 31)
25.07 ± 1.14
(N = 30)
12 months25.15 ± 0.72
(N = 40)
25.11 ± 0.76
(N = 41)
25.27 ± 1.00
(N = 43)
25.28 ± 1.12
(N = 42)
18 months25.31 ± 0.66
(N = 31)
25.24 ± 0.68
(N = 33)
25.43 ± 1.11
(N = 23)
25.40 ± 1.06
(N = 25)
24 months25.26 ± 0.75
(N = 36)
25.20 ± 0.79
(N = 37)
25.64 ± 1.08
(N = 22)
25.64 ± 1.08
(N = 24)
Ortho2Baseline24.98 ± 0.77
(N = 49)
25.02 ± 0.81
(N = 46)
SMCL225.18 ± 0.90
(N = 25)
25.22 ± 0.88
(N = 25)
6 months25.05 ± 0.75
(N = 40)
25.02 ± 0.78
(N = 40)
25.21 ± 1.08
(N = 13)
25.38 ± 1.02
(N = 13)
12 months25.00 ± 0.80
(N = 44)
25.07 ± 0.81
(N = 42)
25.09 ± 0.93
(N = 16)
25.13 ± 0.89
(N = 16)
18 months25.12 ± 0.83
(N = 46)
25.16 ± 0.83
(N = 44)
25.60 ± 0.93
(N = 10)
25.72 ± 0.88
(N = 10)
24 months25.20 ± 0.98
(N = 19)
25.42 ± 0.90
(N = 17)
25.54 ± 0.97
(N = 10)
25.74 ± 0.93
(N = 10)
Ortho3Baseline25.13 ± 0.94
(N = 17)
25.20 ± 1.04
(N = 18)
SMCL325.32 ± 1.03
(N = 22)
25.38 ± 1.23
(N = 22)
6 months25.26 ± 0.82
(N = 7)
25.29 ± 0.86
(N = 7)
25.49 ± 1.3
(N = 8)
25.59 ± 1.68
(N = 8)
12 months25.27 ± 0.90
(N = 16)
25.34 ± 1.04
(N = 16)
25.46 ± 1.06
(N = 18)
25.48 ± 1.16
(N = 18)
18 months25.45 ± 0.92
(N = 10)
25.63 ± 1.07
(N = 10)
25.76 ± 0.99
(N = 10)
25.72 ± 1.17
(N = 10)
24 months25.21 ± 0.88
(N = 11)
25.27 ± 1.05
(N = 11)
26.04 ± 1.39
(N = 9)
26.23 ± 1.59
(N = 9)
Ortho4Baseline25.38 ± 0.69
(N = 21)
25.35 ± 0.66
(N = 22)
SMCL425.05 ± 1.13
(N = 15)
24.89 ± 1.13
(N = 16)
6 months25.44 ± 0.74
(N = 4)
25.39 ± 0.59
(N = 5)
25.00 ± 0.94
(N = 9)
24.92 ± 0.99
(N = 9)
12 months25.72 ± 0.79
(N = 13)
25.73 ± 0.76
(N = 13)
25.30 ± 1.41
(N = 8)
25.06 ± 1.39
(N = 9)
18 months25.30 ± 0.40
(N = 5)
25.23 ± 0.42
(N = 6)
24.66 ± 0.72
(N = 7)
24.57 ± 0.92
(N = 7)
24 months25.52 ± 0.74
(N = 15)
25.61 ± 0.72
(N = 15)
25.30 ± 1.76
(N = 5)
25.34 ± 1.75
(N = 5)
AtropineBaseline24.90 ± 1.11
(N = 42)
24.88 ± 1.15
(N = 42)
6 months25.14 ± 1.06
(N = 32)
25.17 ± 1.12
(N = 32)
12 months25.09 ± 1.07
(N = 34)
25.04 ± 1.12
(N = 33)
18 months25.18 ± 1.06
(N = 24)
25.22 ± 1.11
(N = 24)
24 months25.31 ± 1.12
(N = 19)
25.39 ± 1.08
(N = 19)
Table 7. Model estimated first and second year average AL progression (with 95% confidence interval) by modality.
Change (mm)OrthoK 1OrthoK 2-3-4SMCLAtropineVirtual Control
1 year0.175 [0.128, 0.223]0.102 [0.066, 0.139]0.176 [0.143, 0.209]0.197 [0.144, 0.251]0.250
2 year0.359 [0.289, 0.430]0.249 [0.193, 0.306]0.358 [0.305, 0.410]0.376 [0.290, 0.461]0.500
All data are associated with a p < 0.01 value. The p value is for a test of the hypothesis of no progression over the time interval. Virtual control values come from SCORM and OSLM studies.
Table 8. Comparative efficacy of modalities used to manage axial length at 1 and 2 years.
Time IntervalModality 1Modality 2Mean Difference
[95% CI]
p Value
One year changeOrtho K 1Atropine−0.022 [−0.094, 0.050]0.543
One year changeOrtho K 2,3,4Atropine−0.095 [−0.161, −0.029]0.005
One year changeSMCLAtropine−0.022 [−0.086, 0.043]0.505
One year changeOrtho K 2,3,4Ortho K 1−0.073 [−0.133, −0.013]0.017
One year changeSMCLOrthoK 10.023 [−0.057, 0.058]0.988
One year changeSMCLOrtho K 2,3,40.073 [0.025, 0.122]0.003
Two years changeOrthoK 1Atropine−0.016 [−0.128, 0.095]0.776
Two years changeOrtho K 2,3,4Atropine−0.126 [−0.230, −0.022]0.018
Two years changeSMCLAtropine−0.018 [−0.121, 0.085]0.730
Two years changeOrtho K 2,3,4Ortho K 1−0.11 [−0.203, −0.021]0.017
Two years changeSMCLOrtho K 1−0.002 [−0.093, 0.086]0.967
Two years changeSMCLOrtho K 2,3,40.108 [0.032, 0.184]0.005
Model estimated mean differences between modalities in first- and second-year AL progression. For the difference estimate, Modality 2 change is subtracted from Modality 1 change. The p value is for a test of the hypothesis of no difference between the modalities in average progression over the time interval. p value adjusted for multiple comparisons.
Publisher’s Note: MDPI stays neutral with regard to jurisdictional claims in published maps and institutional affiliations.

