Article

Does the Mass Public Transport System Cover the Social Transport Needs? Targeting SDG 11.2 in Guadalajara, Mexico

by
Gabriela Ochoa-Covarrubias
1,
Alejandro Luis Grindlay
2,* and
Carmen Lizarraga
3
1
Department of Habitat and Urban Development, ITESO, The Jesuit University of Guadalajara, Anillo Perif. Sur Manuel Gómez Morin 3838, Tlaquepaque, Jalisco 45604, Mexico
2
Department of Urban and Regional Planning, Campus de Fuentenueva, University of Granada, s/n., 18071 Granada, Spain
3
Applied Economics Department, Campus Cartuja, University of Granada, s/n., 18011 Granada, Spain
*
Author to whom correspondence should be addressed.
Submission received: 29 July 2021 / Revised: 17 August 2021 / Accepted: 18 August 2021 / Published: 21 August 2021

Abstract

:
This paper analyses how SITEUR, the Mass Public Transport System (MPTS) in the Guadalajara Metropolitan Area (GMA), covers transport social needs, contributing to achieve Sustainable Development Goals (SDG) 11.2. In order to facilitate this, an Index of Mass Transport Provision (IMTP) was measured through proximity, frequency, and capacity. Then, an Index of Social Transport Needs (ISTN) was calculated by means of transport disadvantage indicators. Finally, the Index of Social Transport Needs Covered (ICSTN) was calculated. The calculations used geographic information systems and principal component analysis in 1834 geographic sections. Findings highlight that 50.3% of the inhabitants have a very high level of social transport needs, while only 6.8% of the population have very low social transport needs. Results show that SITEUR promotes advancement in public transport systems within the GMA relative to quality, security, and reliability and it also contributes to tackling social exclusion in the GMA. A proposal related to transport systems integration is included, to address an important aspect of social exclusion in the city.

1. Introduction

The role of transport in sustainable development has been widely recognized since the 1992 United Nations Earth Summit and Agenda 21 document. Further, at the 2002 World Summit on Sustainable Development and at the 2012 United Nations Conference on Sustainable Development (Rio +20) transportation and mobility were considered central to sustainable development. Sustainable transport achieves better integration in the economy when it respects the environment; it improves social equity, health, the resilience of cities, urban-rural linkages and productivity of rural areas [1]. In the 2030 Agenda for Sustainable Development, sustainable transport is mainstreamed across several Sustainable Development Goals (SDGs) and targets. Specifically, target 11.2 is aimed at providing “access to safe, affordable, accessible and sustainable transport systems for all, improving road safety, notably by expanding public transport, with special attention to the needs of those in vulnerable situations, women, children, persons with disabilities and older persons” [2]. In this sense, studying transport social needs served by public transportation is an essential matter to evaluate target 11.2.
In recent decades, the expansive urban development model of the Guadalajara Metropolitan Area (GMA) has increased individual motorized journeys. The kilometres travelled by private vehicle increased by more than 942% between 1980 and 2017 [3]. Despite this growing trend of private vehicle use, 34% of daily trips are made by public transport. In this context, the transport policy focused on the mass public transport system (MPTS), known as SITEUR, to increase multimodal choices, reduce air pollution and improve the quality of journeys [4]. SITEUR mainly serves the center of the metropolis. Specifically, it serves four of the nine municipalities with a multimodal system: light rail transit, bus rapid transit, and buses. A considerable proportion of people living in the suburbs travel on conventional buses operated by private carriers. Even though the fare is the same for SITEUR and conventional buses, the latter have poor regulation and make inefficient attempts to improve the quality of travel [3].
Besides the private carriers over the last mile to access the mass transport system and reduce transport related exclusion, other features, such as Park and Ride, are designed to support the successful operation of the system. Park and Ride are parking areas located in the vicinity of mass transport peripheral stations. People can leave their private vehicles there and use public transportation to travel to central areas. Unfortunately, the Park and Ride paradigm is not as well-established in the GMA, as it is in many cities. For instance, the Park and Ride system in Warsaw reduces social exclusion as cars, bikes and motorcycles can be parked in interchange nodes [5,6].
Despite the fact that transport-related social exclusion has been studied in Latin American cities [7,8], empirical and quantitative in-depth socio-spatial research is needed to identify whether transport systems include or exclude the people with transport disadvantages [9]. The analysis of the spatial and social contribution of SITEUR in the context of metropolitan mobility is relevant, given its quality service, contribution to multimodality and to the environmental quality of the city. This is even more pertinent, considering that the infrastructure of SITEUR has incurred great costs, a public debt that will be paid throughout future decades [10]. In this context, the aim of this research was to calculate the level of coverage of the provision of SITEUR with regard to the social needs of transport to find out whether SITEUR contributes to achieving 11.2 SDG target. In order to facilitate this, three indexes were conceived, calculated, and mapped with geographic information system and principal component analysis methodologies. First, an Index of Mass Transport Provision (IMTP) was measured through proximity, frequency, and capacity. Then, an Index of Social Transport Needs (ISTN) was calculated by means of transport disadvantage indicators considered in the existing literature. Finally, the Index of Social Transport Needs Covered (ISTNC) was calculated.
Related work is described in the next section. Then the study area and the research object are described. The third section explains the methodology for all indexes, i.e., IMTP, ISTN, and ISTNC. Scientific and technological methods are applied through integration and analysis of statistical and spatial data. The results and discussions described in the fourth section highlight the spatial dimension of the social exclusion covered by the SITEUR. The final section shows the main conclusions of the research and presents some proposals for tackling social exclusion related to transport.

2. Literature Review

The mass public transport system (MPTS) including light rail transit (LRT) and bus rapid transit (BRT), promotes sustainable mobility, with regard to environmental, economic, and social dimensions. Regarding environmental improvements, the MPTS contributes to the reduction of the number of private trips, therefore, they reduce greenhouse gas emissions. This is especially true in the current context of the promotion of electricity as clean energy for LRT [11]. In addition, the urban quality is usually improved when integrating LRT or BRT, especially in the vicinity of the stations [4]. In some cases, the MPTS even reduces crime [12]. In contrast, new conventional bus routes rarely promote improvements in urban environments or promote safer areas.
With respect to the economic dimension, at least two general perspectives support the relevance of analysing MPTS. Firstly, when MPTS is conceived within the development oriented transport paradigm, they drive neighbourhood revitalization, generate economic growth and development, promote the growth of affordable housing, and increase land values, rents, and real estate yields [13,14,15]. Secondly, the journey time is usually shorter with MPTS. Users recognize that LRT and BRT are more punctual and provide a faster overall journey time than conventional buses [16]. LRT or BRT stations are well established and respected: although the bus stops are officially designated in many Latin-American cities, buses usually stop randomly, whenever users call or flag so the journey time on conventional buses is hard to predict.
From the social dimension, it has been shown that the MPTS contributes to addressing transport social needs. This perspective deals with the reduction of disadvantages in transportation, largely explained by socioeconomic factors. The social needs of transport are the requirements to access jobs, goods, services and other essential activities by people whose motives and mode of transportation are determined, to a large extent, by their socioeconomic characteristics. Poor transport services can compound the problems of living on a low income [17,18,19,20,21]. Transport disadvantage has a greater impact on particular groups whose condition of social exclusion is often reinforced by non-existent or low-quality public transport services [22,23,24,25,26]. In this respect, the MPTS offers higher quality services than conventional buses [4]. Safe access for individuals to work, education, healthcare services and sociocultural activities is easier in areas with adequate public transport facilities. In particular, BRT improves mobility to low-income residents [27].
Poor and low-income households in outlying locations have more difficulty accessing opportunities and services [26,28,29,30,31]. These areas are usually far away from primary routes or corridors and have little or no public transport provision. In this regard, even though the MPTS mainly serves the central areas, where most of these activities occur, they connect these opportunities and services with the periphery via buses, usually through private services.

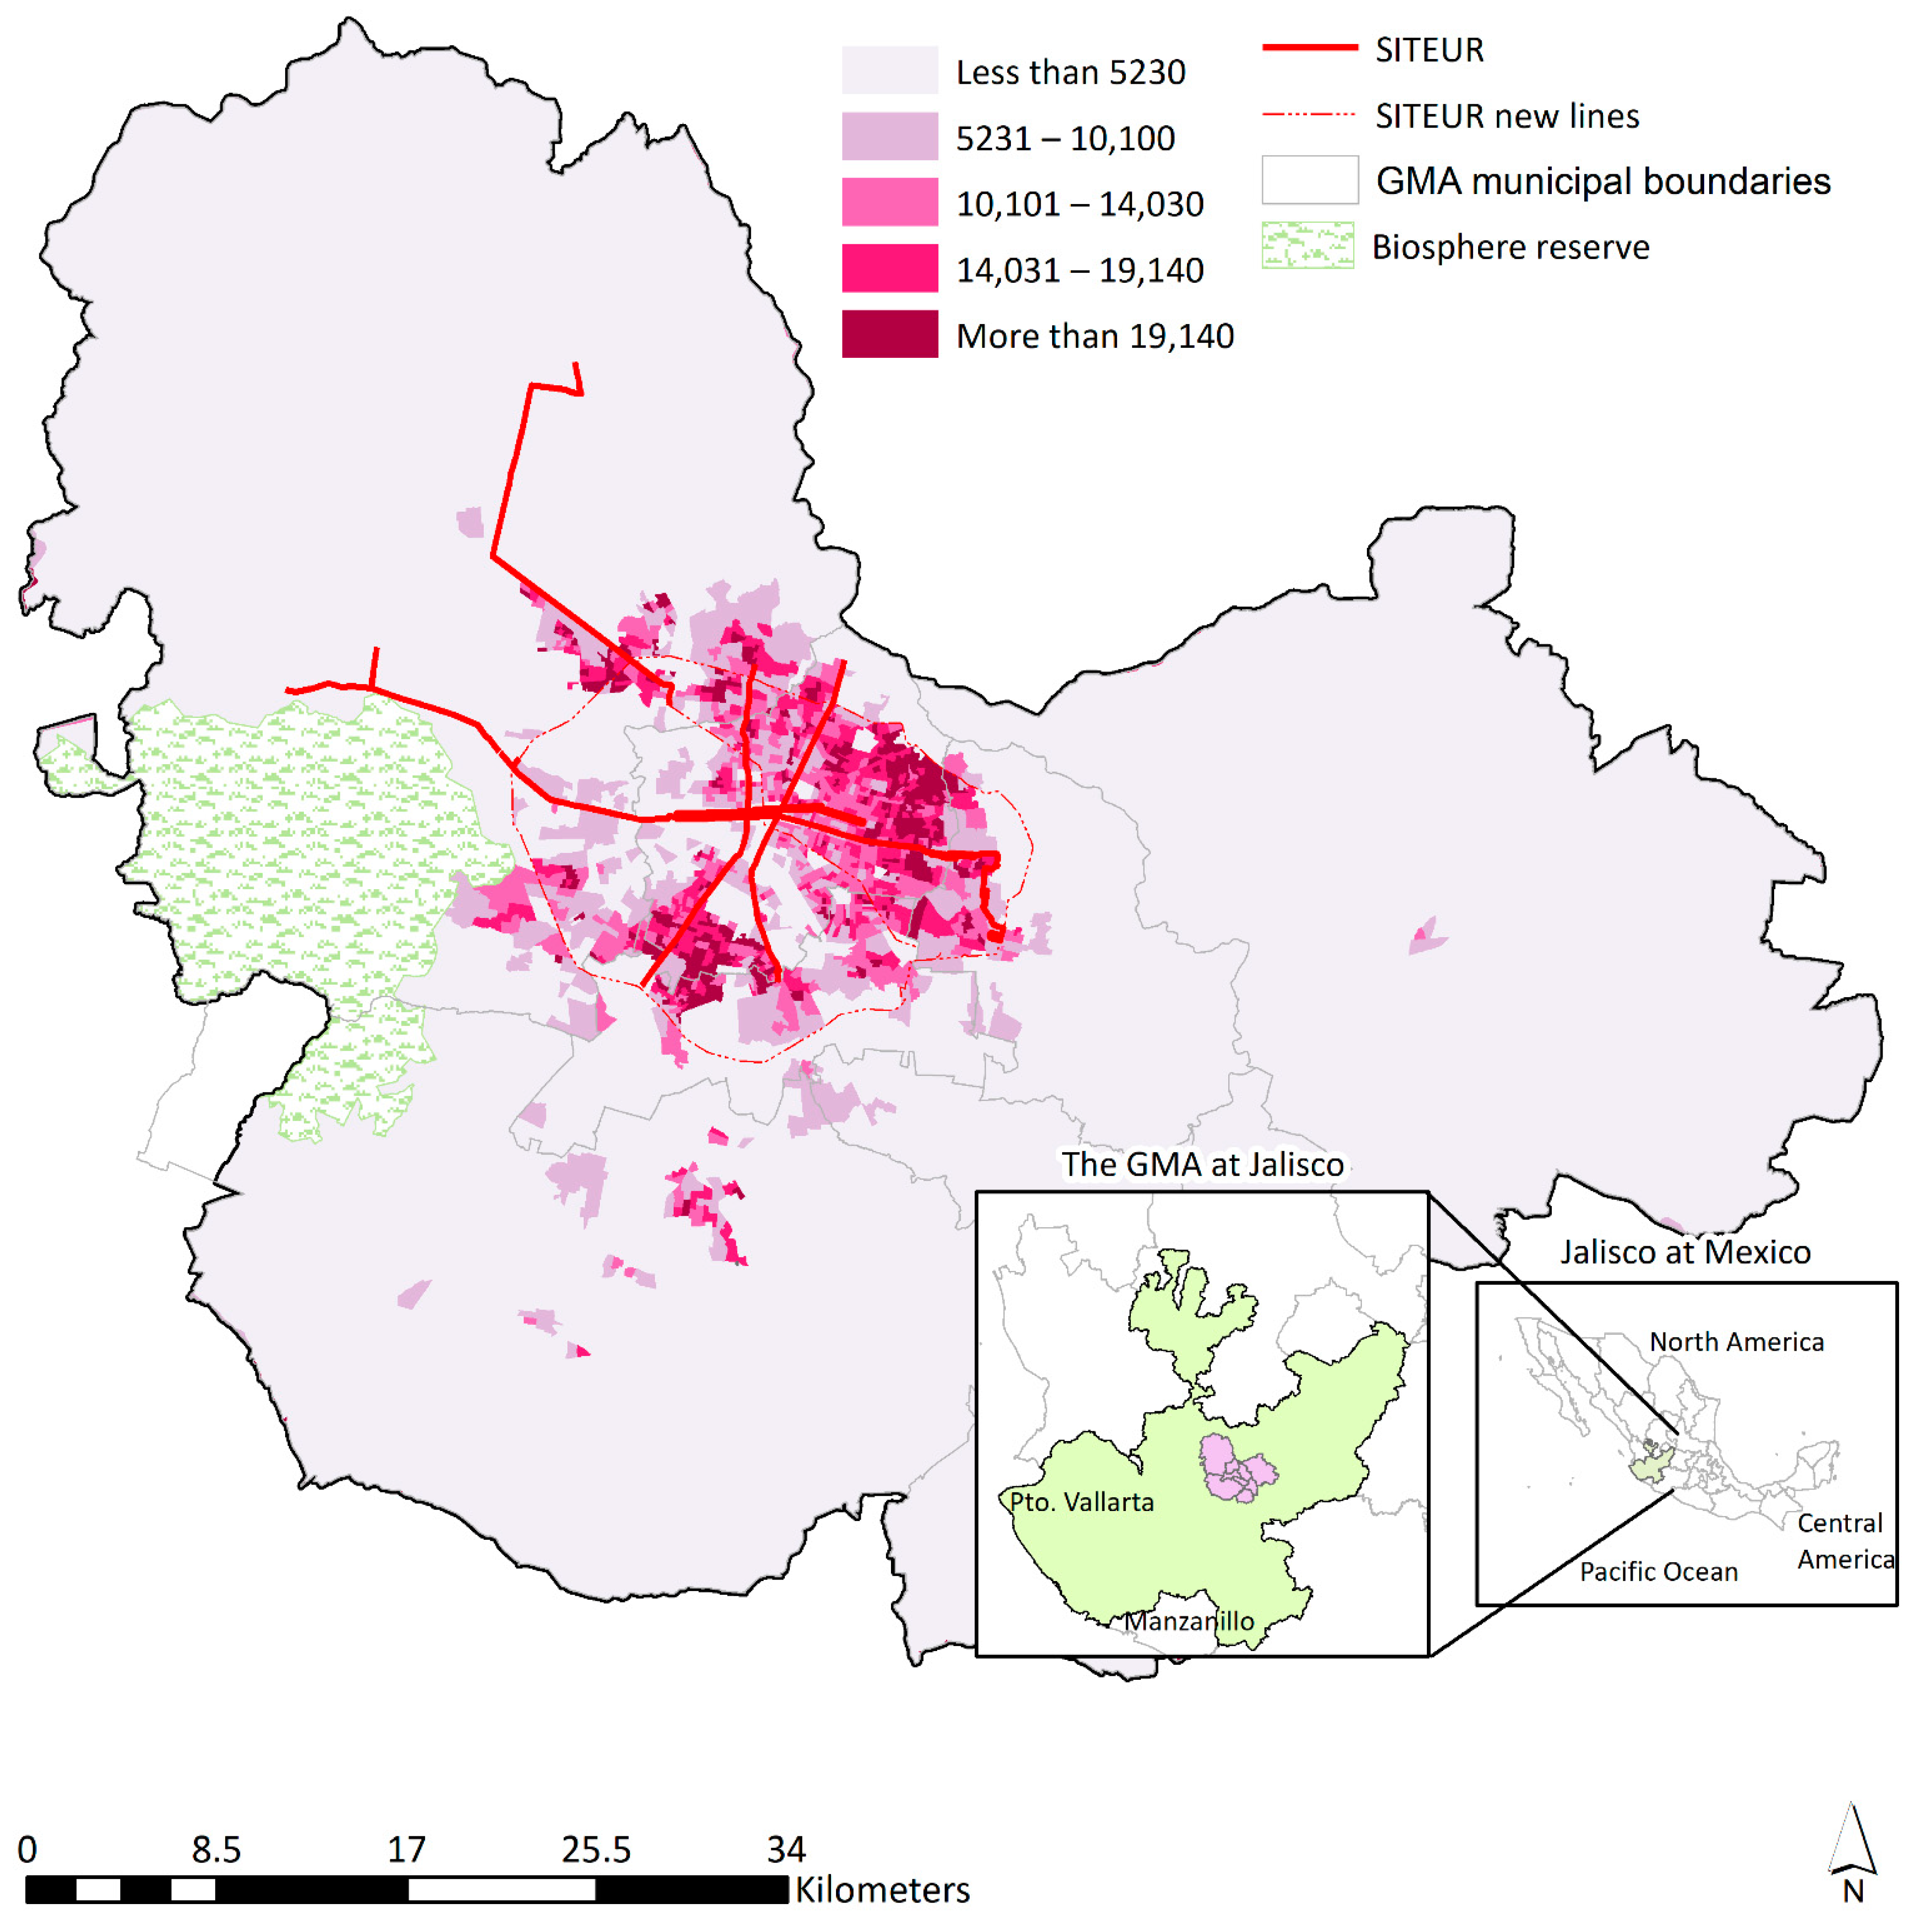
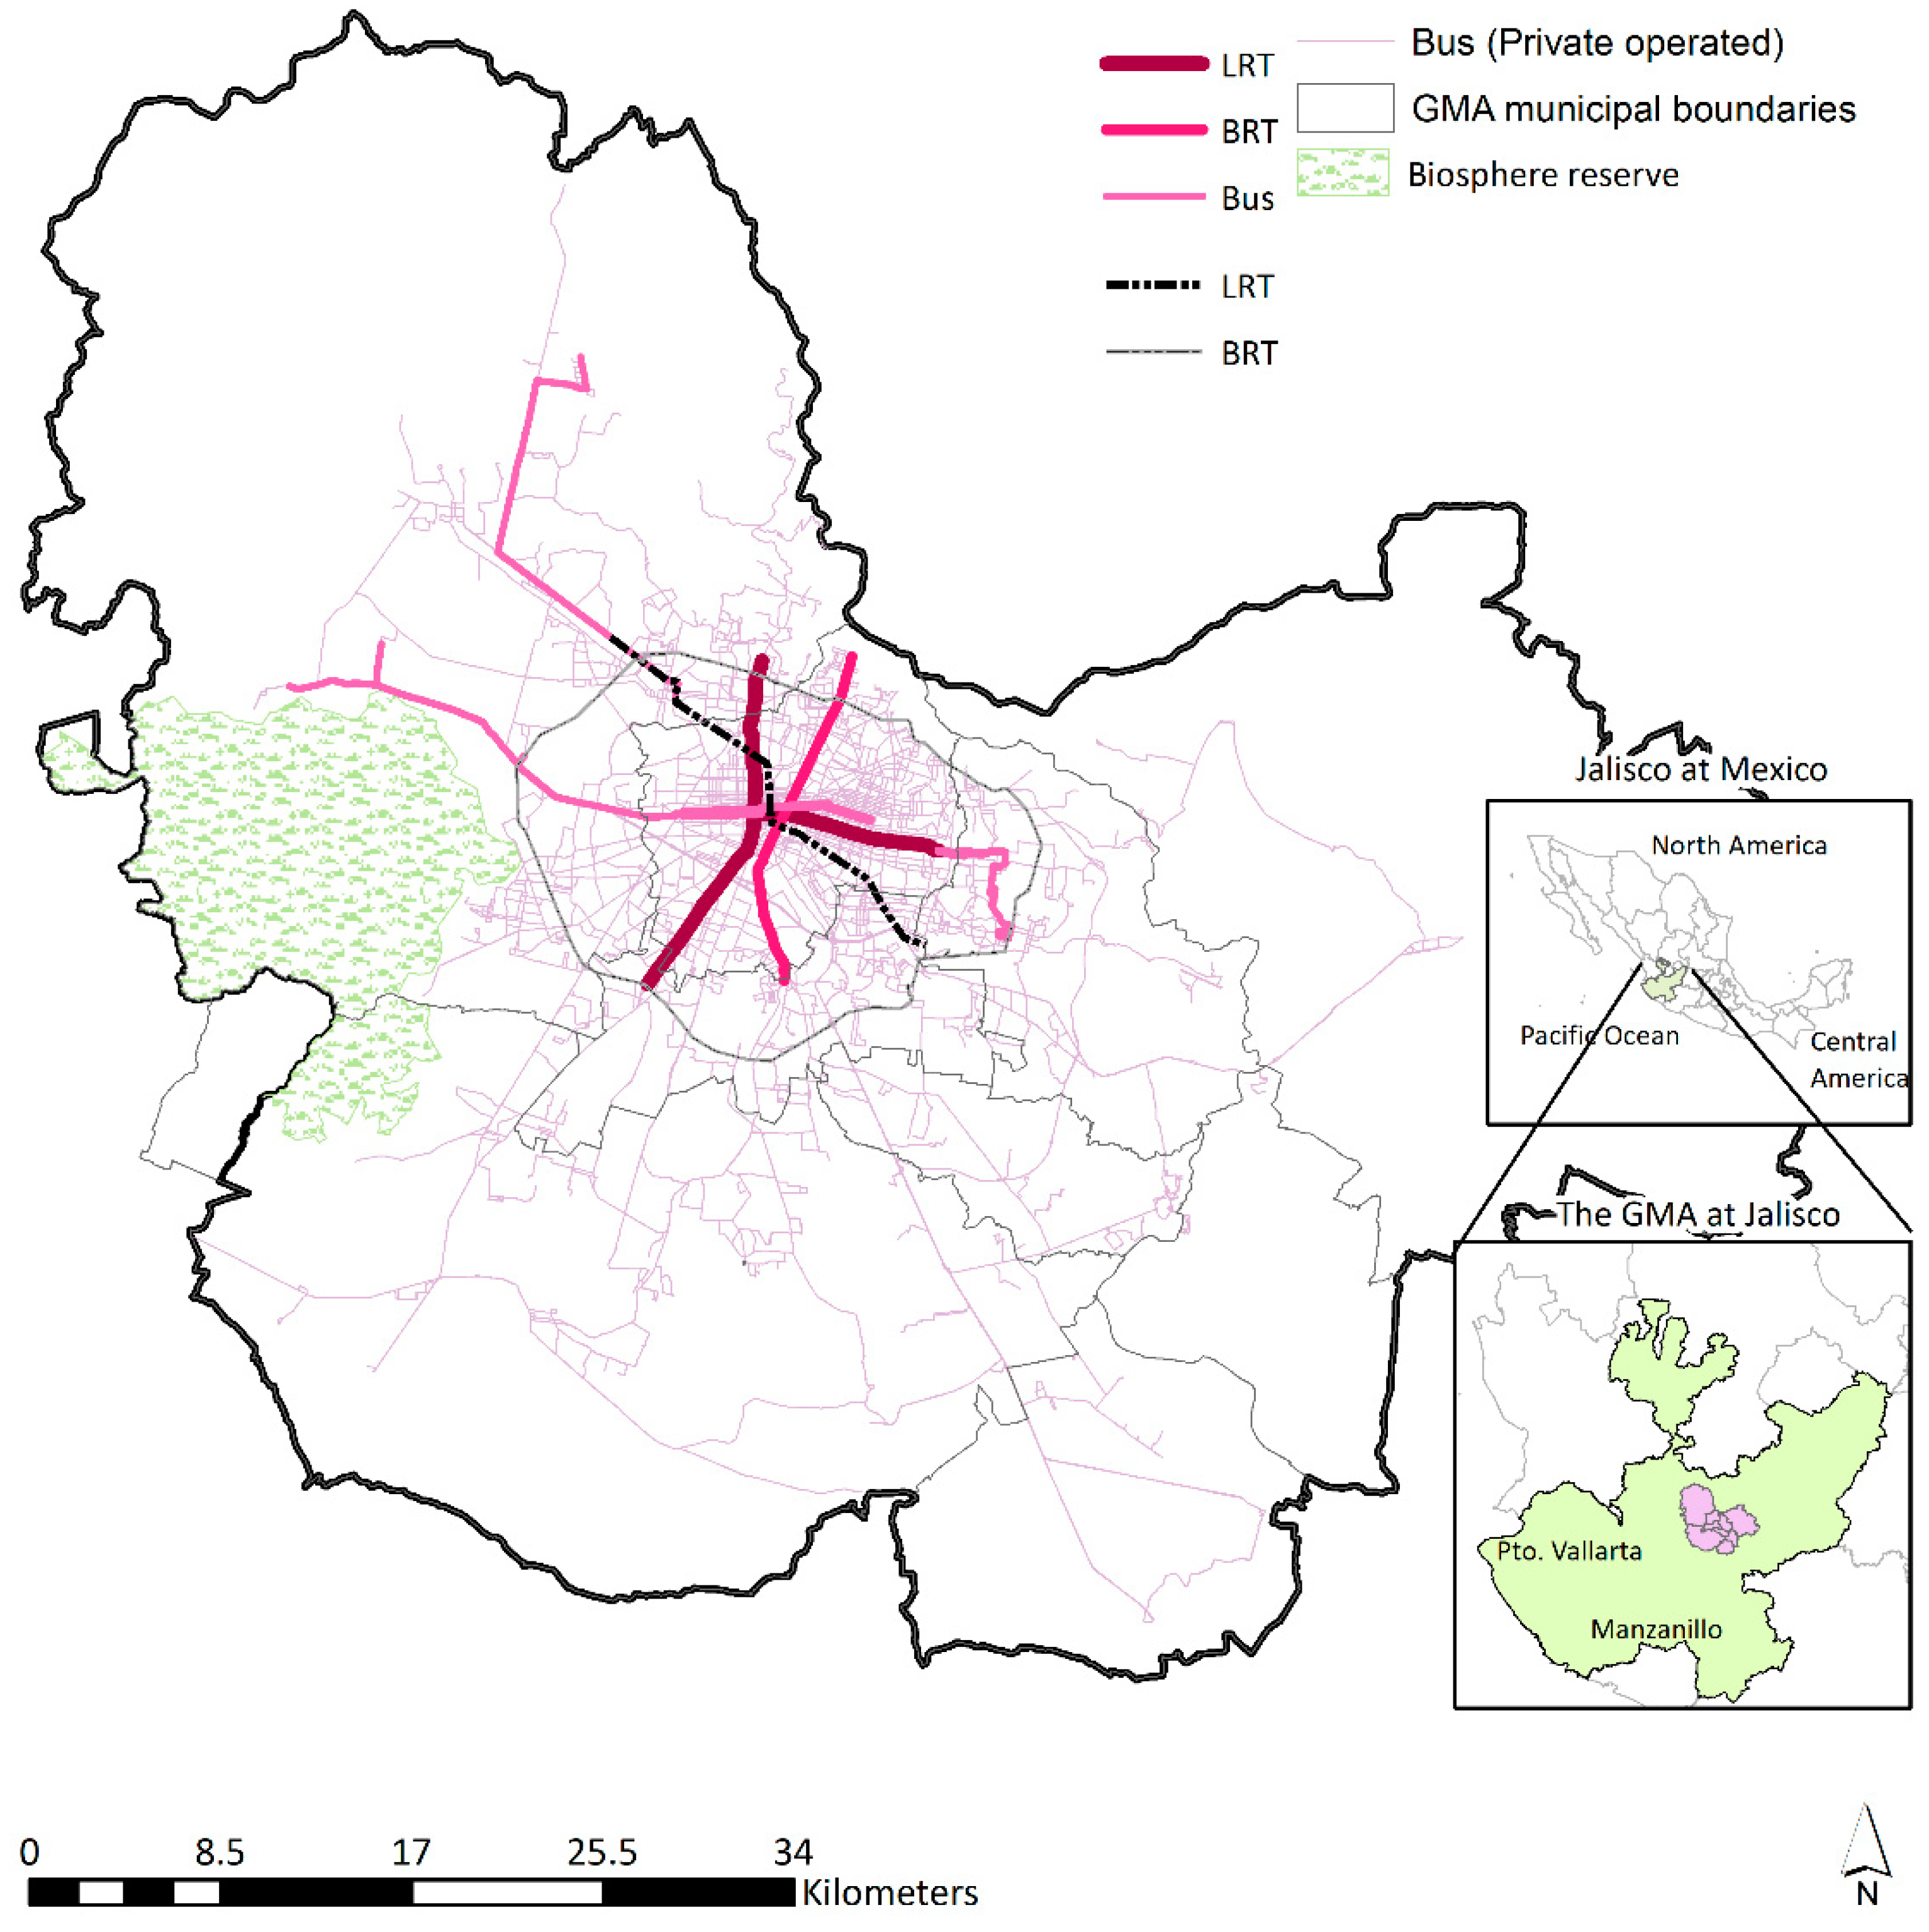
3. Guadalajara Metropolitan Area and SITEUR

The GMA is a conurbation in western Mexico with 4.8 million inhabitants spread over 2700 square kilometres. It is made up of nine municipalities: four central and five peripherals. An anarchic urbanization process and a metropolitan concentration has produced a scattered and fragmented city with a wide range of population density [32,33]. Figure 1 illustrates that density is very high in the northwest and southwest urban areas, in addition to the central eastern area.
With respect to socioeconomic characteristics, more than 15% of the GMA inhabitants live in high and very high levels of urban exclusion, and 40% of the inhabitants live in conditions of poverty [34,35,36]. The fact of not owning a refrigerator is an indicator of low household income, according to CONAPO [37]. Remarkably, 30.9% of households do not own a refrigerator in the GMA. The poorest people must allocate more than 35% of the total income to transport [38].
The mass public transport system (MPTS) in the Guadalajara Metropolitan Area (GMA) is operated by the urban electric train system, known as SITEUR. It is a public institution created in 1987. By 1992, the SITEUR operated the first light rail transit (LRT) in the area, connecting the north and south of the city. The second LRT line started operation in 1994 and travelled from the centre to the east through the densest areas of the GMA. The MPTS was complemented by a line of bus rapid transit (BRT), known as the Macrobús in 2006, running almost parallel to LRT Line 1 [10]. Then four lines with high quality buses, known as Sitren, were integrated into the system. Finally, a third line of the LRT was included in SITEUR by September 2020. The SITEUR promotes advancement for public transport systems in the GMA in terms of quality, security and reliability.
Several more lines were contemplated in the metropolitan plans. In 2020, the construction of a second BRT line was started. It is aligned with a large avenue that links the central municipalities with those of the periphery. The improvement in the mobility within the city created by this line, will be assessed as soon as operational data is available. In general, SITEUR provides an improvement to the public transport system in the GMA in terms of quality and reliability. A study sponsored by UN-HABITAT refers to the good condition of vehicles, the attitude of the drivers and, in general, to the pleasant perception of the journey in SITEUR [39]. In addition, SITEUR’s LRT lines contribute to good air quality, as they run on electricity and reduce trips by private motorized vehicles. Figure 1 shows a bus network service in the non-central areas of the GMA. There are also low-quality transport services such as motorcycle taxis, minibuses and other unregulated alternatives that are not still integrated into SITEUR [38].
Just as the highest population density is concentrated in the four central municipalities, almost 95% of the generators of journeys on work-days are also located in that area [40]. As illustrated in Figure 1, the three modes of SITEUR serve the urban area of these municipalities and the highest density areas, while the buses also serve the lowest density areas with microbuses and minivans. This kind of transport is slow, unreliable, and irregular [41]. Notwithstanding, they cover a lot of transport needs that are not reachable by SITEUR.
Figure 1. Population Density in the Guadalajara Metropolitan Area (inhab/sqkm). Source: Authors based on [42,43].
Applsci 11 07709 g001
While the modal split of GMA has not been recently assessed, government estimates are shown in Figure 2. A third of the daily journeys are made by public transport, while less than a third of them are made by private motorized vehicle and almost half of the trips are made by non-motorized vehicles [3]. From the 40% of non-motorized users, the 37% of the inhabitants who go by foot do so mainly for financial reasons [44].
Within the public transport system, SITEUR serves nearly one tenth of the journeys, i.e., nearly four hundred thousand trips on work-days [45,46,47]. Due to the large investments that a mass public transport system (MPTS) implies, SITEUR should increase its contribution to the modal split. In addition to SITEUR, private enterprises operate public transport services in the GMA. Although the fare is the same for SITEUR as it is for buses, the privately licensed operators provide poor transport services by bus and microbus and are not fare-integrated to the SITEUR.
As illustrated in Figure 3, SITEUR mainly serves the centre of the GMA. It represents an improvement in the intermodal transport in the GMA, through LRT, BRT, and high-quality bus services. Two of the higher capacity lines are north-south oriented through the centre of the city. The second LRT line and high-quality bus routes are east-west oriented. These buses serve some areas in the periphery of the city, where the lower socioeconomic dwellings are concentrated [41,48,49,50]. As shown in Table 1, there is a large difference between mode capacities of SITEUR vehicles. Nonetheless, the peak-time frequency (a.m.) does not differ greatly among the different modes, except for one bus line [48].

4. Methodology

In order to assess how SITEUR covers transport social needs in the Guadalajara Metropolitan Area (GMA), three indexes were proposed, calculated, mapped, and analysed. Firstly, an Index of Mass Transport Provision (IMTP) was measured through proximity, frequency, and capacity. Secondly, an Index of Social Transport Needs (ISTN) was calculated by means of transport disadvantage indicators considered in the existing literature and listed in Table 2. Thirdly, a Social Transport Needs Covered (STNC) was calculated.
Data used were the newest available for the thematic and geographical scale that the methodology required [42,48,51,52,53,54]. Social data were obtained from 2010 due to their geographically detailed scale, not available for later years. Thus, all indexes were calculated and mapped in 1834 geographic sections (GS). Scientific and technological methods, e.g., principal components analysis (PCA) and geographic information systems (GIS), supported the integration and analysis of statistical and spatial data through SPSS and ArcMap software.

4.1. Index of Mass Transport Provision

The Index of Mass Transport Provision (IMTP) was based on frequency, capacity, and proximity [25,55]. Table 2 describes data sources. Frequency used was at peak-time when most people commute to/from work [21]. The vehicle capacity was used for the index calculations. Proximity was calculated through walking time from each of the GS centroids to the nearest stop/station. The distances were modelled by means of advanced spatial analysis (e.g., street network and nearest facility) and involved time as an innovative variable instead of traditional Euclidian distance. In accordance with Fransen et al. [55], the distances were classified in ranges and normalized.
Table 2. Factors, Indicators, and Data Sources Used to Assess the Index of Mass Transport Provision and the Index of Transport Social Needs.
DimensionIndicatorVariableSource
TransportProximityWalking minutes to reach the nearest stop/stationAuthors, based on the Statistical and Geographic Information Institute of the State of Jalisco (IIEGJal) [50] and the National Institute of Statistics and Geography (INEGI) [53]
FrequencyPeak-time frequency, in minutesSITEUR [43,44,45,46] and Metropolitan Planning Institute (IMEPLAN) [49]
CapacityPassenger per vehicle
SocialDisabilityPeople with motor, visual and auditory handicapINEGI: Census Information Consultation System (SCINCE, from its initials in Spanish) [52]
Educational levelPeople from 3 to 24 years assisting to an educational centre
ElderlyPeople of 65 years and over
ChildhoodPeople of 5 years and under
UnemploymentUnemployed people
IlliteracyPeople of 15 years and over without ability to read
Low incomeDwelling without refrigerator
Vehicle ownershipDwelling without privately-owned vehicle
GenderDwelling with female-headed household
As described in Table 2, the geometry of the road network was generated from two data sources. Given the differences in data generation criteria, the construction of the road network implied significant technical efforts. Finally, the resulting network achieved an acceptable topological quality for a metropolitan scale. Walking time was based on the street network distance assuming a speed of four kilometre per hour, since Mexican authorities recognize that children, the elderly and the motion-impaired walk at this speed [56]. In addition, when two or more stops/stations were less than 50 m apart, this research assumed that users preferred the one that had a higher frequency or capacity in the following order: LRT, BRT, and then bus. This hierarchy served to eliminate the duplicated stops of 284 SITEUR stops/stations. Table 3 describes the general characteristics of SITEUR considered for the IMTP calculations.
The Index of Mass Transport Provision (IMTP) was calculated as shown in Equation (1) and normalized through Equation (2).
Equation (1).
Index of Mass Transport Provision (IMTP)
IMTP j = (1 − FMj) × Twj × CMj
where IMTPj = Index of Mass Transport Provision at GSj; j = The GS analysed. Values are 1–1834; FMj = Frequency of mode M at the nearest stop/station from GSj (minutes); M = {LRT-line1, LRT-line2, BRT, bus-line1, bus-line1B, bus-line2, bus-line3, bus-line4}; Twj = Walking time to the nearest stop/station from GSj (minutes); CMj = Capacity of the vehicle of mode M at the nearest stop from GSj (passengers/vehicle).
Equation (2).
Index of Mass Transport Provision Normalized (IMTP_N)
IMTP _ N j = IMTP j IMTP j min IMTP j max IMTP j min × 100

4.2. Index of Social Transport Needs

Based on previous methodologies [25,54,57,58], the Index of Social Transport Needs (ISTN) incorporated socioeconomic and housing dimensions, following the wide evidence that social transport needs are different according to income, age, vehicle ownership, gender or education [37,59,60,61,62]. Transport disadvantage has a greater impact on particular categories that include the elderly, people with health problems, low incomes groups, those living in conditions of poverty, unemployed or disabled people [9,25,31,59,63,64,65,66,67,68]. The ISTN incorporated nine transport disadvantage indicators with their variables: disability; educational level; elderly; childhood; unemployment; illiteracy; low income; vehicle ownership and gender. The combination of the variables of these indicators provides an index of social transport needs, produced with the most important explanatory factors of transport disadvantage.
Interestingly, gender was incorporated through the variable “female-headed households”. Gender has a decisive influence on possibilities for moving through the non-central regions of the metropolis, as well as on ways of linking with the main metropolitan activities [55,57,63]. In the case of the metropolis in developing countries, Calonge and Aceves [41] showed that female-headed households make less use of the car and spend less on transportation than male-headed households, due to the prevailing conditions of poverty and the greater deficiencies in the public transport systems.
The ISTN were calculated as the weighted sum of these variables within the GS. Equation (3) shows the algorithm used to compute this. It was normalized adapting Equation (2).
Equation (3).
Index of Social Transport Needs (ISTN)
ISTN j = i = 1 8 S ij × W i
where ISTNj = Index of Social Transport Needs at GS j; Sij = Social indicator i at GSj; Wi = Weight of the social indicator i.
The weighted values of socioeconomic and dwelling variables are listed in Table 3.
Principal component analysis (PCA) is a statistical technique usually used in academic studies concerning the social dimension of transport [68,69,70,71], as well as in the evaluation of social public policies in Mexico [72]. The PCA describes correlations between a set of variables by creating new components that propose weights for the original variables. The purpose of the PCA is to obtain a small number of linear combinations of the dataset that account for most of the variability in the data. Each component can be interpreted as one part of the social transport needs. A negative value means that this variable negatively affects the phenomenon. The variability of the original data is an indicator of the analysis performance. The higher the variability, the better the components account for the phenomenon. The component calculated in this study accounted for 76% of the social transport needs. Table 3 shows the factors which better explain transport-related social needs (TSN) in the city.
Principal component analysis (PCA) was inputted with 214 socioeconomic and dwelling variables for the 1834 GS [73]. The PCA reduced the dimensionality of the social data set. The fraction of variance explained by the first principal component accounted for 76%. The weights of the first principal component rotated matrix of PCA referred to transport disadvantage. The weights of the main component variables shown in Table 3 totaled 1.0, as they were previously normalized to be included in subsequent calculations. The weight values represent the contribution of each indicator to the social needs of transport in the GMA. These are valid only for the analyzed data set.
As shown in Table 3, the weight assigned to “vehicle ownership” represents only 6% of the indicators related to the disadvantage of transport for each GS. The number of inhabitants in the groups of “childhood”, “elderly” and “educational level” comprises 38% of the weight, while the other five socioeconomic indicators make up the remaining 56%. According to the social indicator weights used for the ISTN, results confirmed that in this case, the socioeconomic factors are much more relevant than the “vehicle ownership” indicator, which is consistent with other studies for Latin American cities [25].

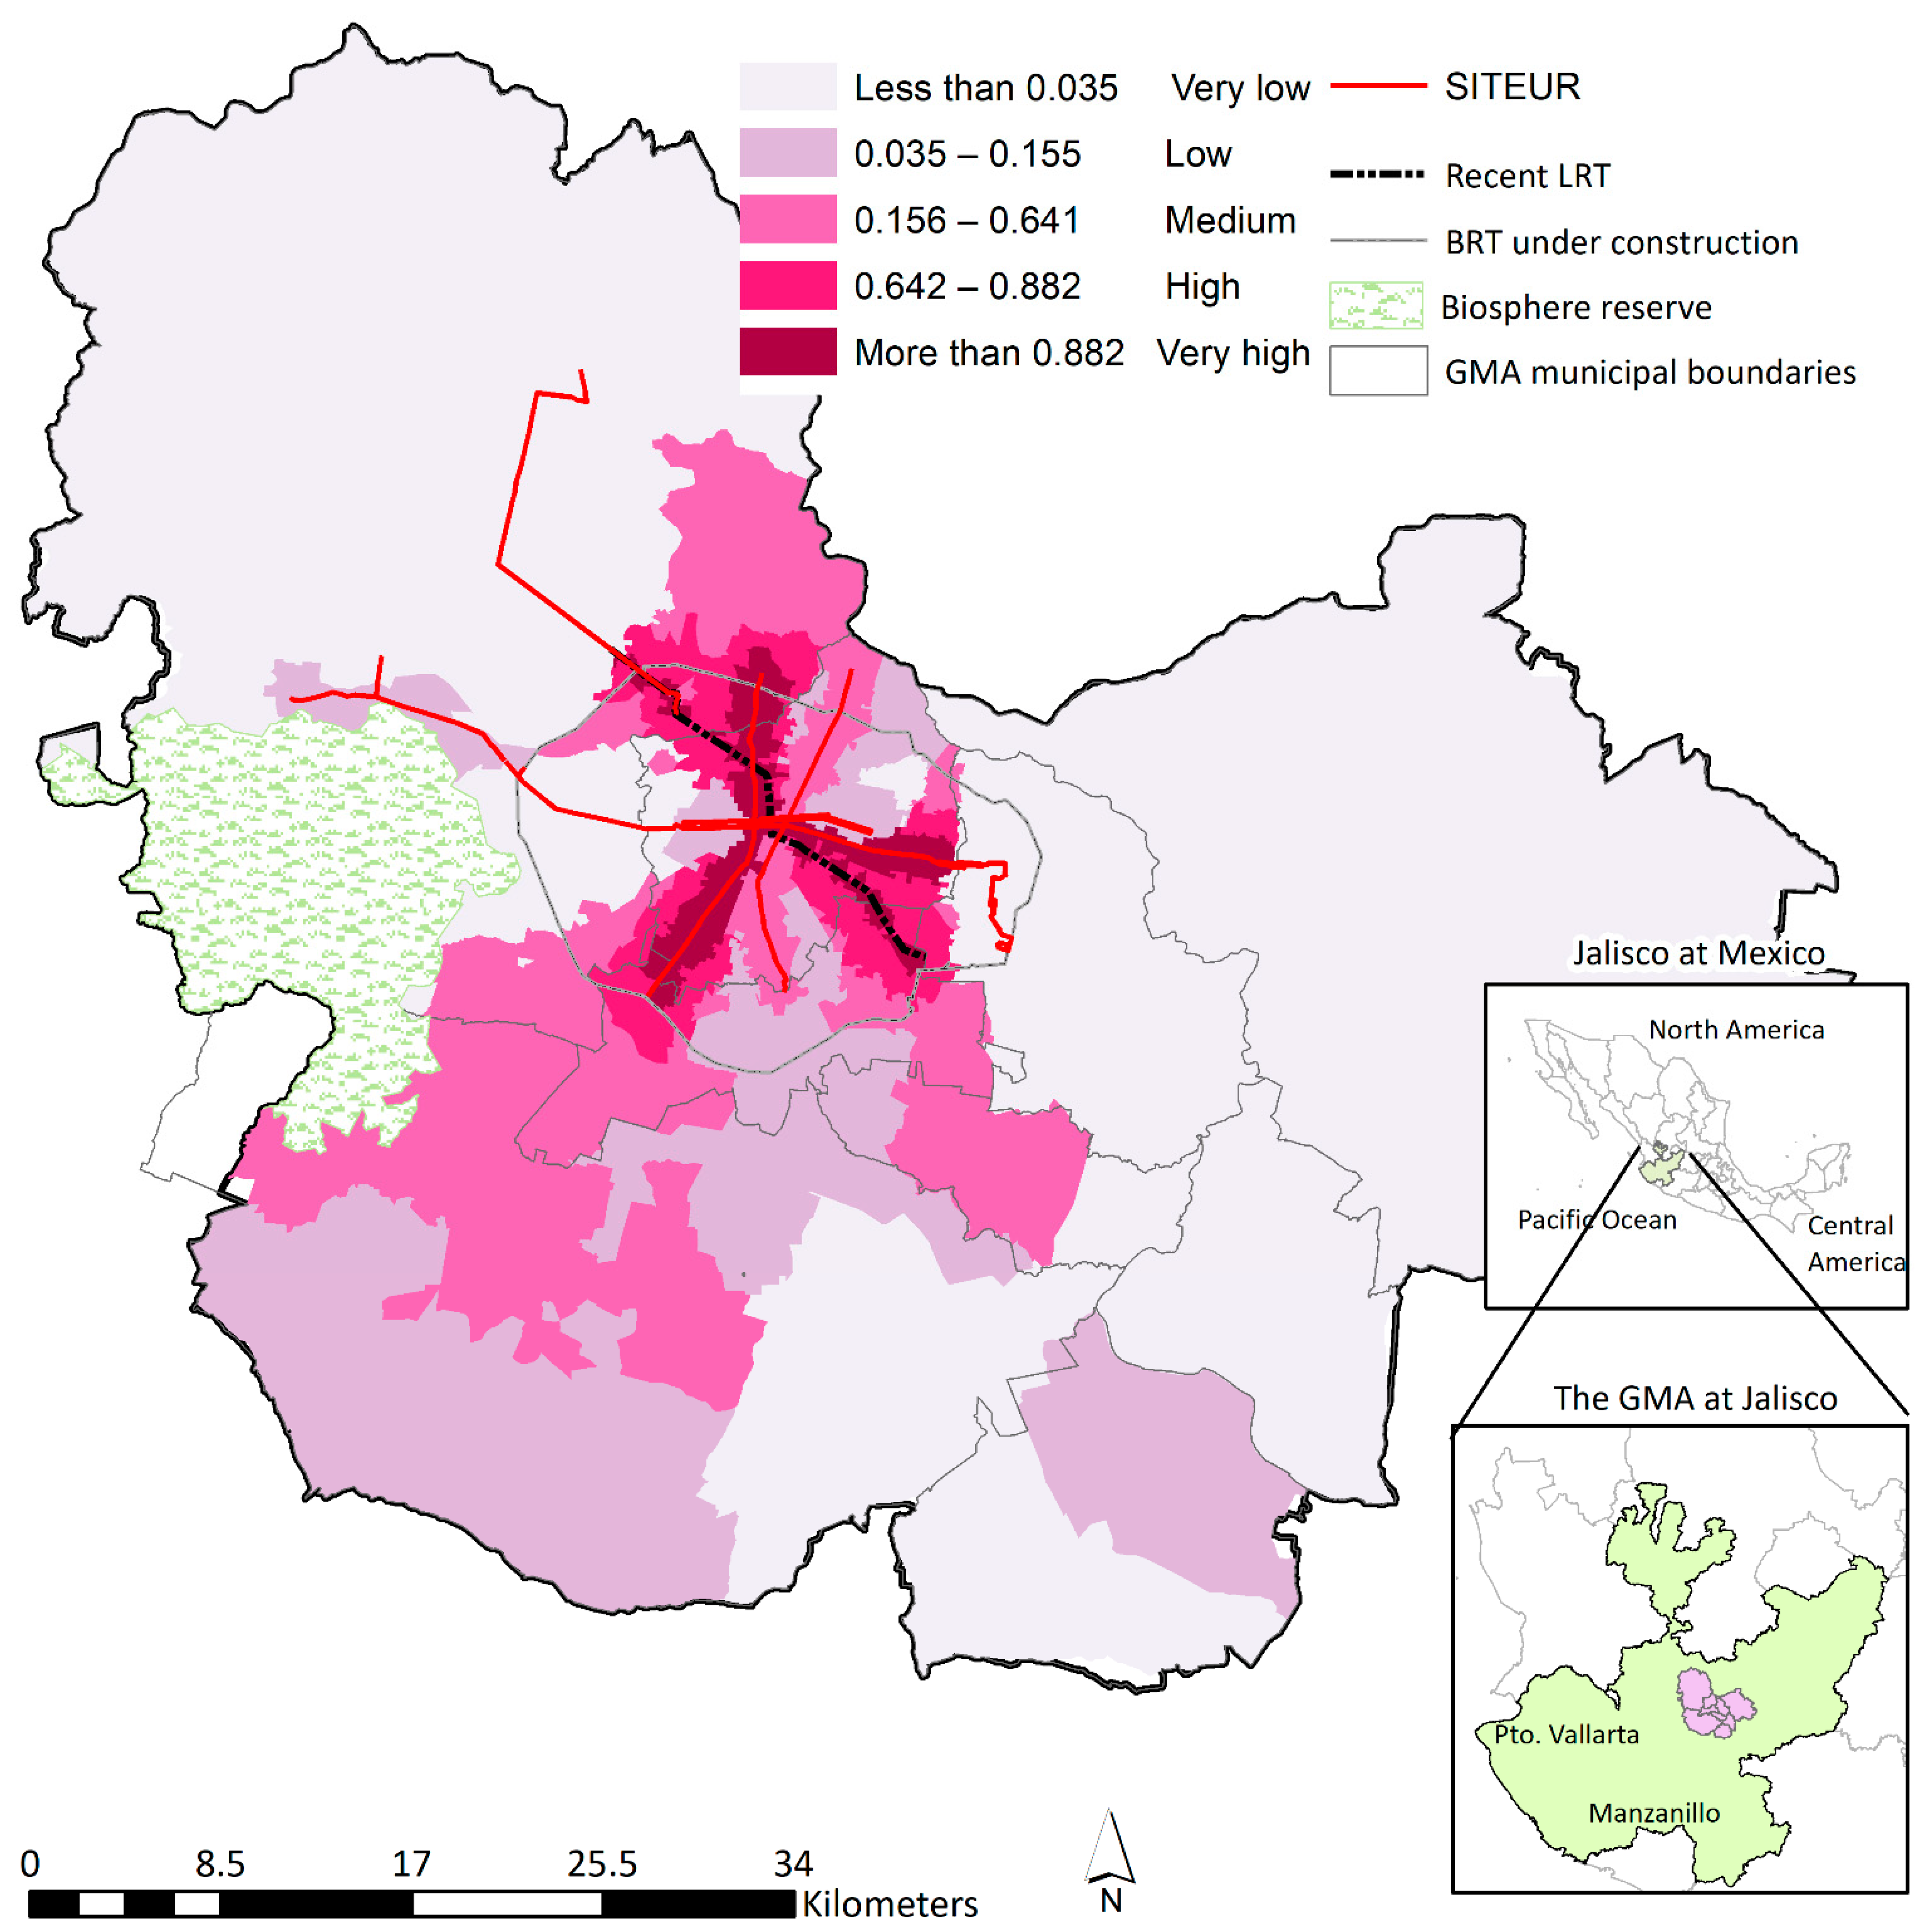
4.3. Index of Social Transport Needs Covered

The calculation of the spatial differences of the two indices mentioned above allowed us to understand the contribution of SITEUR to address the social needs of transport. The Index of Social Transport Needs Covered (ISTNC) is the difference between SITEUR’s transport provision and the social needs. It was calculated for every GS by means of Equation (4).
Equation (4).
Index of Social Transport Needs Covered (ISTNC)
I S T C N j = I M T P _ N j I S T N _ N j
where ISTNCj = Provision–needs gap at GSj; ITMPNj = Index of Mass Transport Provision normalized at GSj; ISTN_Nj = Index of Social Transport Needs normalized at GSj.

5. Results and Discussion

Spatial and statistical analyses were performed to calculate the level of coverage of the provision of SITEUR with respect to the social needs of transport in the Guadalajara Metropolitan Area (GMA). The use of geographic information systems (GIS) highlighted not only the geographic dimension of SITEUR, but the social transport needs (STN) and their spatial patterns. The indexes calculated were the Index of Mass Transport Provision (IMTP), the Index of Social Transport Needs (ISTN) and the Index of Social Transport Needs Covered (ISNTC). All indexes were mapped with five graduated symbols calculated using quintiles of the geographic sections (GS) to create cut-off index levels: very low, low, medium, high, and very high.

5.1. Index of Mass Transport Provision

The IMTP spatially illustrates the SITEUR transport supply. As shown in Figure 4, results confirm that the higher provision is naturally concentrated at the three main axes of the mass transport modes of SITEUR. The SITEUR high quality buses, known as Sitren, barely influence IMTP, since they have a very low capacity compared with LRT and BRT (Table 1).

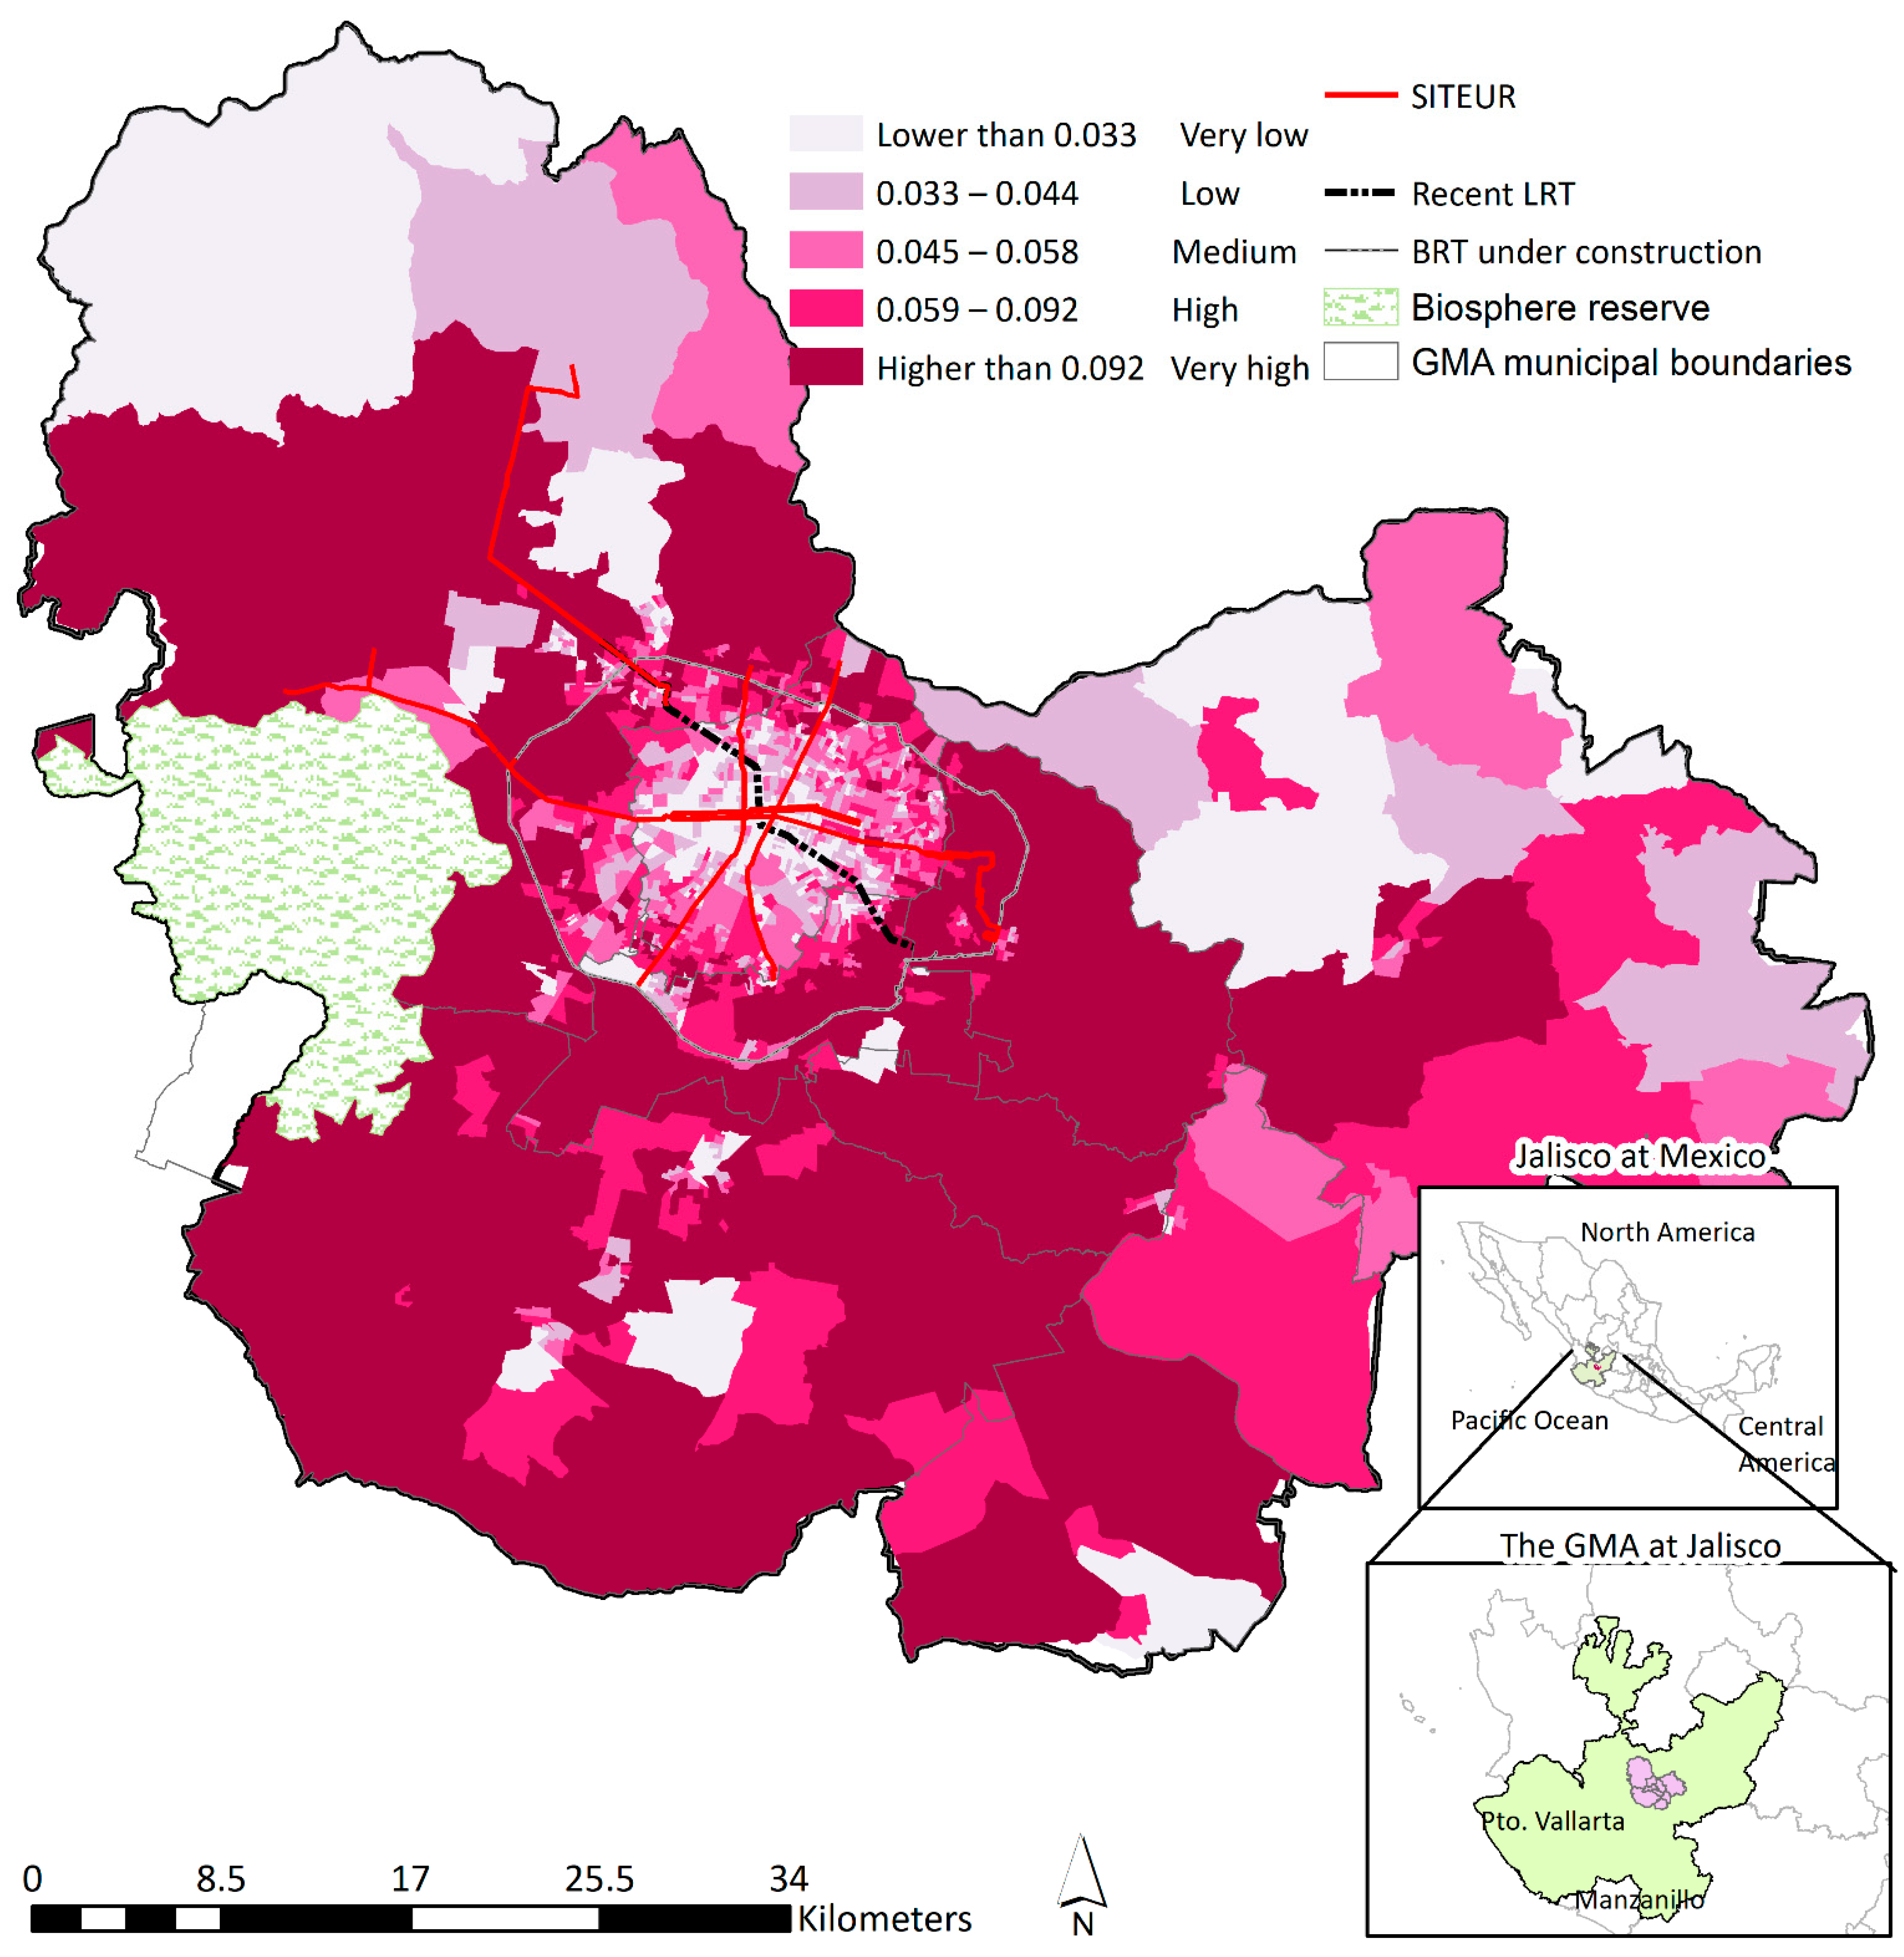
5.2. Index of Social Transport Needs

The Index of Social Transport Needs (ISTN) describes the spatial pattern of areas with higher social transport needs, as described in the methodology. Results mapped in Figure 5 show that higher STN are concentrated in the periphery, as in other Latin America cities [25,68,74], although the results also identified some areas in the centre of the metropolis with high social needs for transportation. Fortunately, the BRT under construction will largely serve areas with high and very high STN.

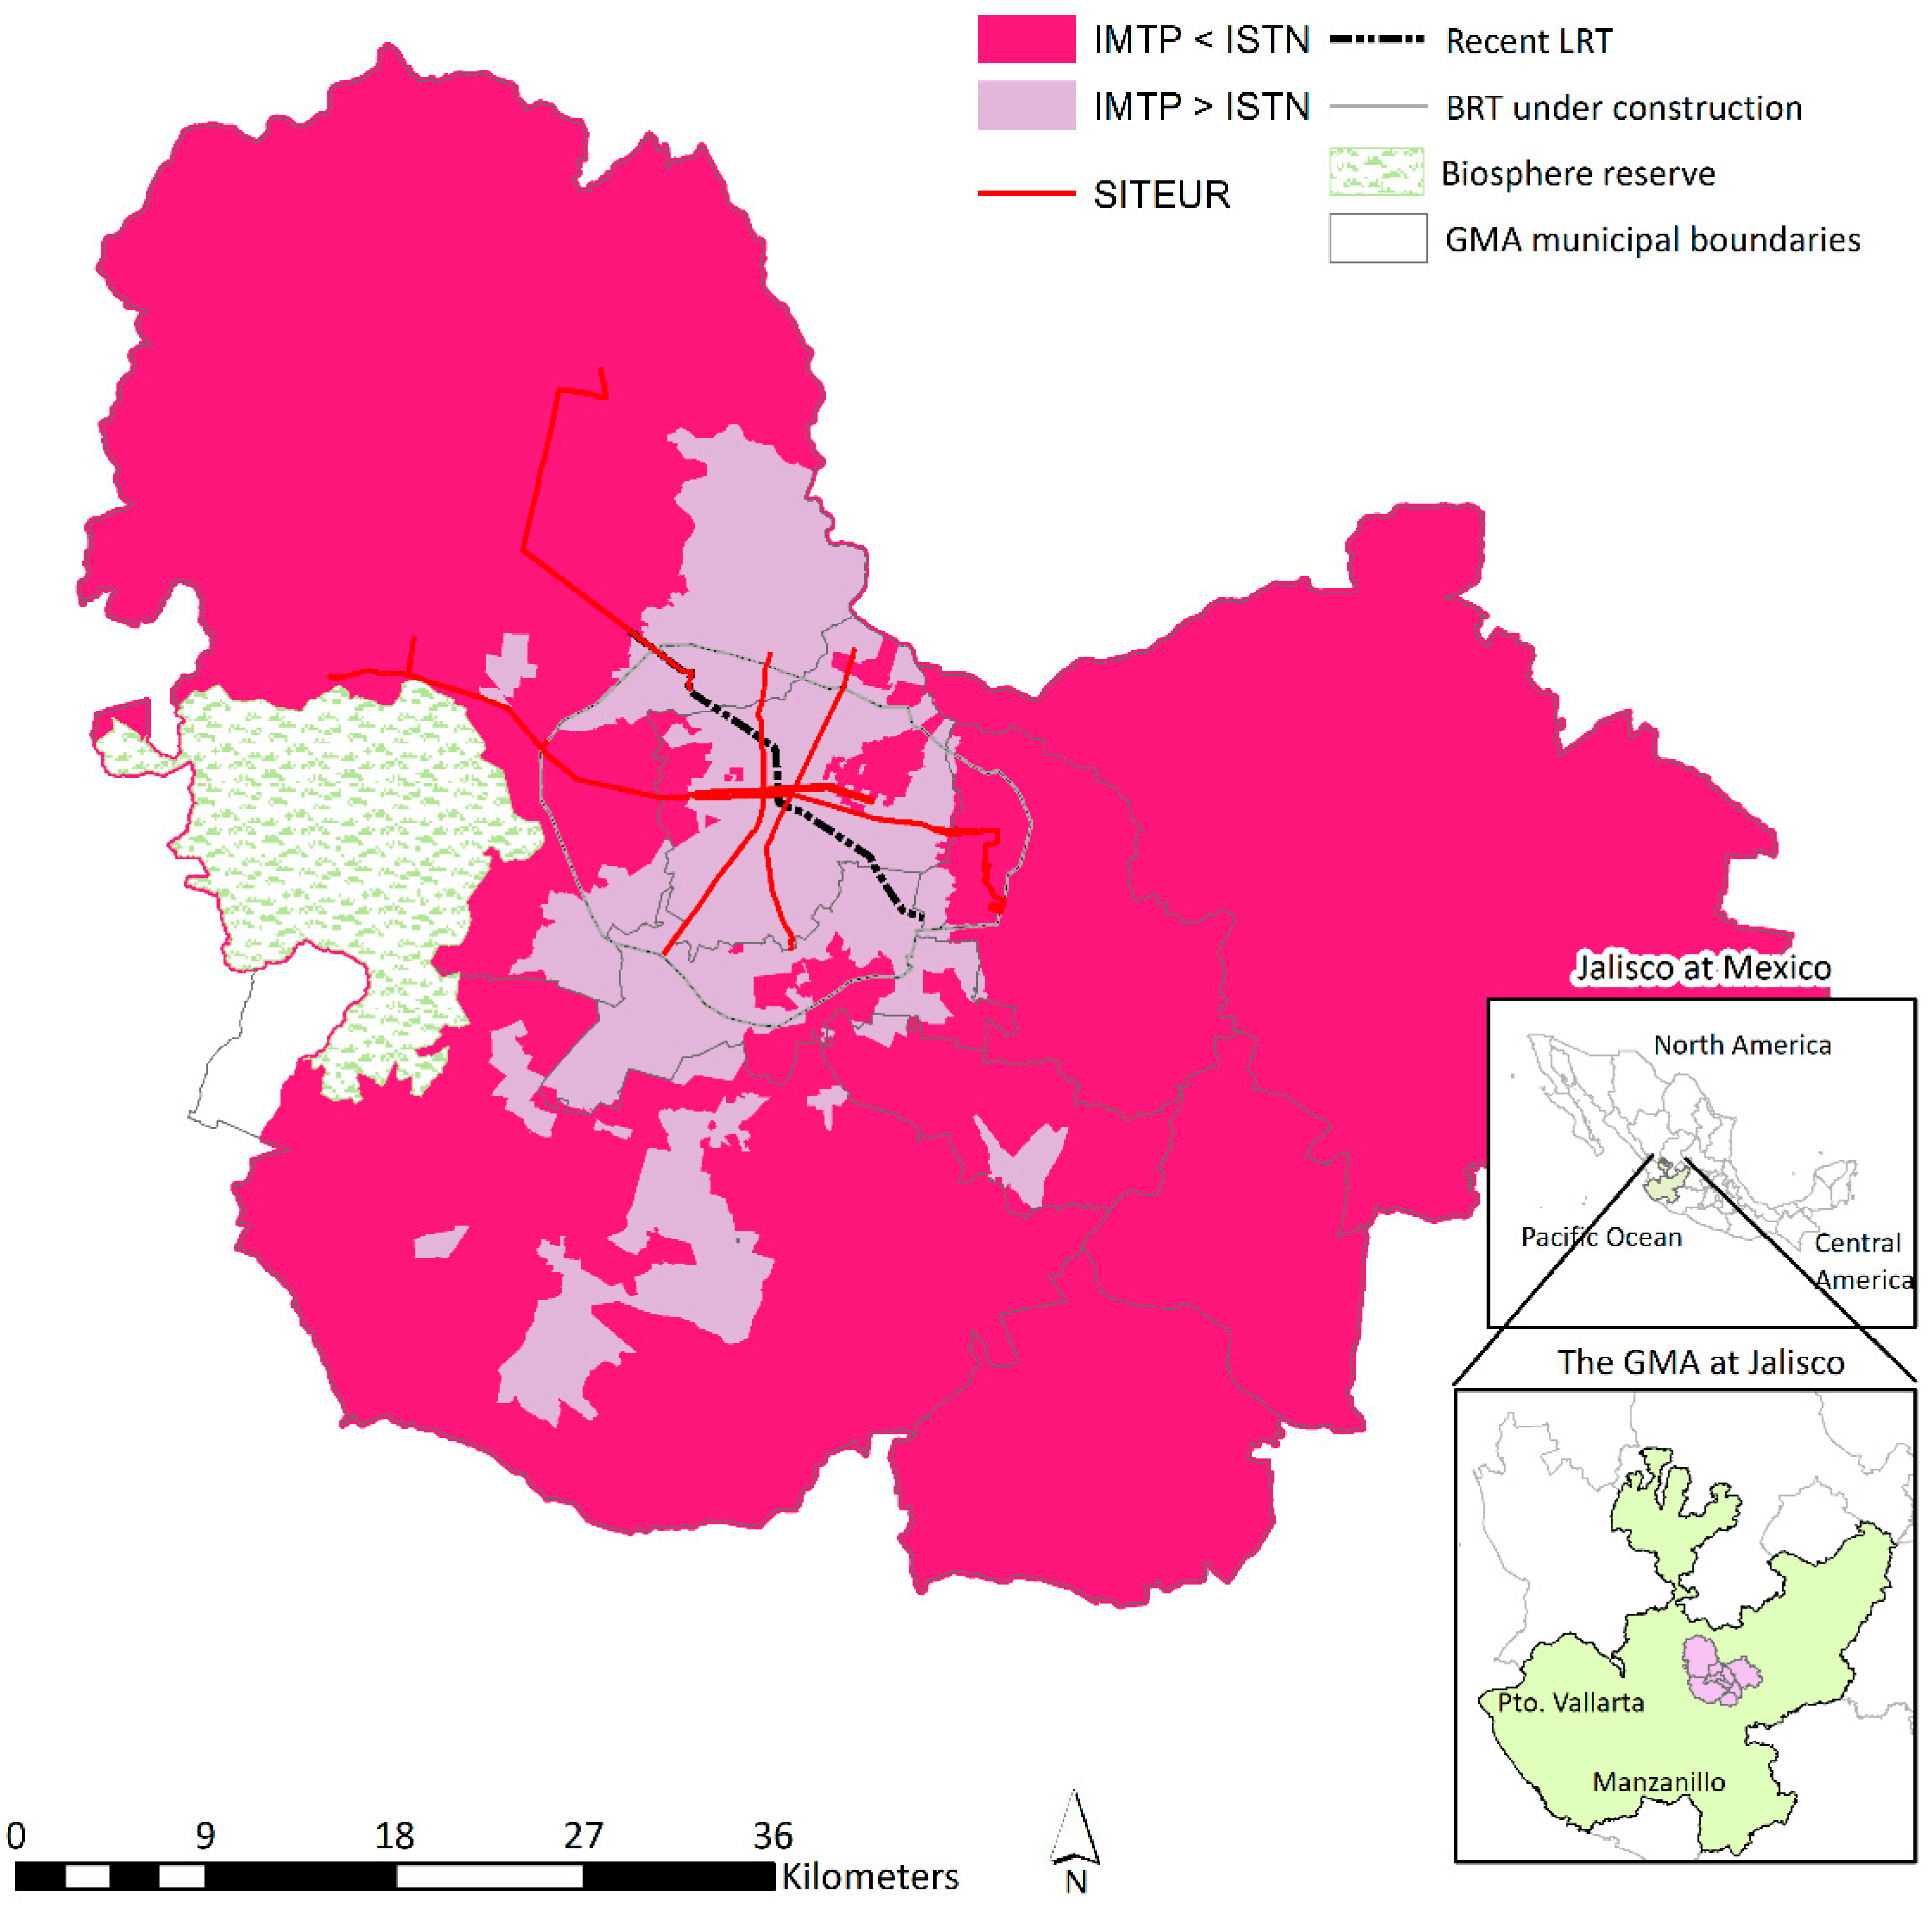
5.3. Index of Social Transport Needs Covered

The Index of Social Transport Needs Covered (ISTNC) was calculated and mapped (Figure 6) to assess how adequately SITEUR covers or not social transport needs (STN). Positive values of ISTNC can be interpreted as STN adequately covered by SITEUR in the GS. Negative values refer to GS where STN are not covered by SITEUR. As stated by Calonge and Aceves [41], most of the population in the periphery of the GMA have a limited choice of quality means of transport. According to current mobility public policy [75], results highlight areas where mass transport lines should address STN, e.g., the BRT line, MiMacro Periferico, currently under construction. This future line may serve some of the west and eastern areas identified in this study as not covered by SITEUR.
As shown in Table 4, the proportion of the area where SITEUR exceeds the social needs of transportation is very small. This is due to the scarcity of the mass transportation lines within the system. Despite SITEUR addressing social transport needs in areas where more than half of the GMA population live, it contributes to only 3% of the total modal split. One possible reason is the lack of fare-integration between private buses and SITEUR. The bus network is closer than MPTS to most of the dwellings with higher STN (Figure 3 and Figure 5). It can be assumed that users will prioritize their economy and will sacrifice journey quality and duration, thus not choosing to switch their mode of transport. In this context, target 11.2 SDG is far from being achieved.
After analysing data with and without the recent LRT Line 3, results show that it barely increases provision by 2% for the number of inhabitants with high transport needs living in areas already served by the SITEUR. The alignment of the line mainly overlaps areas already over-provided by SITEUR. Surprisingly, the new LRT Line 3 will contribute very little to the difference between SITEUR coverage and the enormous social transportation needs. This is regrettable, given the large public investment and the social and economic construction costs, i.e., costs of Line 1 exceeded more than one hundred million dollars [76].
Figure 7 describes the percentage of the population with social transport needs. It shows the distribution of the levels of SITEUR’s provision and of social transport needs in the 1834 GS, ranged by GS quintiles. Ideally, the transport provision curve is proportional, showing a high percentage of the population at the “very high” provision level. In contrast, the ideal curve of the STN starts with a high percentage of the population for the lower levels of the index and a decreasing percentage of the population as it approaches the high levels of the index. However, the findings of this research reveal that the curve of the STN is almost inverse to the ideal. Furthermore, it presents a sharp slope in the last segment. This means that the highest STN are concentrated in the last quintile of geographic sections. These findings confirm the high inequality of the distribution of social transport needs and transport provision in the GMA.
Figure 7 also shows that the percentage of inhabitants with less than adequate transport provision is almost double that of people served with very high values of the index. Results show that the transport need of less than a quarter of the population are covered by the SITEUR. It is worth noting that 50.3% of the inhabitants have a very high level of STN, while only 6.8% of the population have very low social transport needs. Despite this, SITEUR only contributes 3% of the city’s modal split (Figure 2). Furthermore, the SITEUR does not adequately serve more than half of the population. Notwithstanding that mass transport is scarce in the city, this population ratio is striking, given the high construction and operation costs of SITEUR.

6. Conclusions

The mass public transport system (MPTS) impacts the environmental, economic and social dimensions and is directly related to target 11.2 SDG aimed at providing access to sustainable public transport systems for all, with special attention to social needs. This paper contributes to the comprehension of public transport relationships with the spatial and social dimensions in the complexity of metropolitan areas. This study analysed how SITEUR, the MPTS, addresses social transport needs (STN) in the Guadalajara Metropolitan Area (GMA) and targets 11.2 SDG. In order to understand the complex multivariable phenomenon of STN, three indexes were designed, i.e., the Index of Mass Transport Provision (IMTP), the Index of Social Transport Needs (ISTN), and the Index of Social Transport Needs Covered (ISTNC). They were calculated for 1834 geographic sections (GS).
The IMTP was calculated with geographic information systems, using real walking distances and open access data, such as network geometry, capacity, and frequency. The ISTN used social transport indicators assessed with principal component analysis, based on existing literature. The difference between IMTP and ISTN was used to assess the ISTNC, giving a positive or negative value, concerning the coverage or the disparity of STN in a GS.
It can be concluded that there is high inequality in the distribution of social transport needs and transport provision in the GMA. SITEUR does not meet the social transport needs in the peripheral areas. Results highlight that SITEUR mainly serves the central areas of the metropolis, as in other Latin American cities. Social transport needs do not match the spatial pattern that the mass transportation infrastructure provides in the city. The calculations reveal that the social needs are distributed, mainly, in the periphery, especially in the south-eastern municipalities.
The care of STN demands actions within both social and transport dimensions. The decrease of social transport disadvantages requires attention to the most significant social indicators, e.g., elderly and disabled, and the essential coordination of the public and private sectors. Addressing 11.2 SDG will not be solved solely with the increase of more mass transport lines, but by the reinforcement of connections and the improvement of transportation in the periphery [77]. Public and private carriers cannot turn their backs, as they have done in recent decades. They must work towards a common sustainable goal: the improvement of mobility in the GMA, with special attention to social needs. This cooperation and integration must go beyond a simple homologation of bus/SITEUR fares. Carriers should reduce the gap between STN and the public transport provision with improved structural strategies. Although this integration implies the removal of long-standing political and economic handicaps, the public-private dialogue should address the important aspect of social exclusion in the city taking into consideration the SDG.
Although the methodology provides a quantitative approximation of a complex problem due to a considerable number of variables, the SITEUR transport supply is limited, so there is still room for improvement in the knowledge of social exclusion linked to public transport. The spatial analysis shows that SITEUR could have a great impact on the modal distribution of the city. However, this contradicts reality. Therefore, future research will integrate other modes of transport to the model to explore further the social needs of transport in the city from a more multimodal perspective. In particular, future research will include a new public transport supply index that considers, not only mass transport, but also the bus network managed by private carriers. This will support social dimension arguments to promote greater cooperation between all carriers with better integration of a more holistic approach to the transport system. This will facilitate social dimension arguments for decision makers to promote a more holistic approach to the transport provision in the GMA and to achieve transport-related SDGs.

Author Contributions

Conceptualization, G.O.-C., C.L. and A.L.G.; methodology, G.O.-C. and C.L.; validation, C.L. and A.L.G.; formal analysis, G.O.-C. and C.L.; investigation, G.O.-C.; resources, C.L. and A.L.G.; data curation, G.O.-C.; writing—original draft preparation, G.O.-C.; writing—review and editing, C.L. and A.L.G.; visualization, G.O.-C.; supervision, C.L. and A.L.G.; project administration, G.O.-C.; funding acquisition, A.L.G. All authors have read and agreed to the published version of the manuscript.

Funding

This research was funded by FEDER/Junta de Andalucía-Consejería de Economía y Conocimiento/Project “Design of Strategists to Face the Impact of COVID-19 on Compliance with the SDGs in Andalusia” Ref. CV20- 01172.

Institutional Review Board Statement

Not applicable.

Informed Consent Statement

Not applicable.

Data Availability Statement

Data available under request.

Acknowledgments

The authors recognize the financial support of the National Council of Science and Technology (CONACYT), of the Development Trust of Mexico (FIIDEM) and of ITESO, the Jesuit University of Guadalajara.

Conflicts of Interest

The authors declare no conflict of interest. The funders had no role in the design of the study; in the collection, analyses, or interpretation of data; in the writing of the manuscript, or in the decision to publish the results.

References

  1. Miller, P.; de Barros, A.G.; Kattan, L.; Wirasinghe, S.C. Public transportation and sustainability: A review. Ksce J. Civ. Eng. 2016, 20, 1076–1083. [Google Scholar] [CrossRef]
  2. UN. Sustainable Development Goals. Available online: https://www.un.org/sustainabledevelopment (accessed on 1 June 2021).
  3. Gobierno del Estado de Jalisco (Government of the State of Jalisco). Plan Estatal de Gobernanza y Desarrollo de Jalisco 2018–2024. Visión 2030. Diagnostico. Gobierno del Estado de Jalisco. 2019. Available online: https://plan.jalisco.gob.mx/sites/default/files/2019-09/Diagnostico.pdf (accessed on 15 May 2020).
  4. Vuchic, V. Transportation for Livable Cities; Routledge: London, UK; New York, NY, USA, 2017; ISBN 9781138517479. [Google Scholar]
  5. Macioszek, E.; Kurek, A. The Use of a Park and Ride System—A Case Study Based on the City of Cracow (Poland). Energies 2020, 13, 3473. [Google Scholar] [CrossRef]
  6. Macioszek, E.; Kurek, A. The Analysis of the Factors Determining the Choice of Park and Ride Facility Using a Multinomial Logit Model. Energies 2021, 14, 203. [Google Scholar] [CrossRef]
  7. Hernandez, D. Uneven Mobilities, Uneven Opportunities: Social Distribution of Public Transport Accessibility to Jobs and Education in Montevideo. J. Transp. Geogr. 2018, 67, 119–125. [Google Scholar] [CrossRef]
  8. Vecchio, G.; Tiznado-Aitken, I.; Hurtubia, R. Transport and Equity in Latin America: A Critical Review of Socially Oriented Accessibility Assessments. Transp. Rev. 2020, 40, 1–28. [Google Scholar] [CrossRef]
  9. Lucas, K. A New Evolution for Transport-Related Social Exclusion Research? J. Transp. Geogr. 2019, 81, 102529. [Google Scholar] [CrossRef]
  10. Córdoba España, M. 2 Décadas En El Desarrollo De JALISCO; 1990–2010; Gobierno del Estado de Jalisco: Guadalajara, Mexico, 2010; ISBN 9688325813. [Google Scholar]
  11. UITP, International Association of Public Transport. Zero Emission Mobility for All: How to Achieve Carbon Neutrality. 2020. Available online: https://www.uitp.org/news/zero-emission-mobility-for-all-how-to-achieve-carbon-neutrality/ (accessed on 15 September 2020).
  12. Cerda, M.; Morenoff, J.D.; Hansen, B.B.; Tessari Hicks, K.J.; Duque, L.F.; Restrepo, A.; Diez-Roux, A.V. Reducing Violence by Transforming Neighborhoods: A Natural Experiment in Medellin, Colombia. Am. J. Epidemiol. 2012, 175, 1045–1053. [Google Scholar] [CrossRef] [Green Version]
  13. Medina, S.; Patlán, M. Modelo de implementación de DOT en la Zona Metropolitana de Guadalajara. México: Secretaría de Desarrollo Agrario, Territorial y Urbano, Secretaría de Medio Ambiente y Recursos Naturales, ISAID e ITDP. 2016. Available online: https://go.itdp.org/download/attachments/45449662/Modelo-de-implementacio%CC%81n-de-DOT-en-la-Zona-Metropolitana-de-Guadalajara.pdf?api=v2 (accessed on 15 May 2020).
  14. Schlickmann, M.P.; Martínez, L.M.; Pinho de Sousa, J. A Tool for Supporting the Design of BRT and LRT Services. In Proceedings of the Transportation Research Procedia, 20th EURO Working Group on Transportation Meeting, EWGT; ElSevier: Oxford, UK, 2017; Volume 27, pp. 1171–1178. [Google Scholar] [CrossRef]
  15. Quintero-González, J.R. Sustainable Transit-Oriented Development (STOD). A prospective for Colombia. Bitácora Urbano Territ. 2019, 29, 59–68. [Google Scholar] [CrossRef]
  16. Hensher, D.A.; Ho, C.; Mulley, C. Identifying Preferences for Public Transport Investments under a Constrained Budget. Transp. Res. Part A Policy Pract. 2015, 72, 27–46. [Google Scholar] [CrossRef]
  17. Clichevsky, N. Informalidad y Segregación Urbana en América Latina: Una Aproximación. Medio Ambiente y Desarrollo 28. Santiago de Chile: ECLAC. 2000. Available online: https://repositorio.cepal.org//handle/11362/5712 (accessed on 8 March 2021).
  18. Figueroa, O. Transporte urbano y globalización: Políticas y efectos en América Latina. Eure (Santiago) 2005, 31, 41–53. [Google Scholar] [CrossRef] [Green Version]
  19. Lazo, A. Transporte, movilidad y exclusión. El caso de Transantiago en Chile. Scr. Nova. Rev. Electrón. Geogr. Cienc. Soc. 2008, Vol. XII, num. 270 (45), 15. Available online: http://www.ub.es/geocrit/sn/sn-270/sn-270-45.htm (accessed on 2 December 2019).
  20. Giraldo, G.; Morales, J.; Granada Vahos, J. Territorial Public Politics As Networks of Public Policies and Local Governance: The Experience of the Design and Formulation of the Public Policies on Forced Displacement in the Department of Antioquia and the City of Medellín. Estud. Políticos 2009, 35, 81–105. Available online: https://papers.ssrn.com/abstract=2947883 (accessed on 10 March 2019).
  21. Vasconcellos, E.A.; Mendoca, A. CAF Observatorio de Movilidad Urbana: Informe. 2016, Caracas: Banco de Desarrollo de América Latina. Available online: https://www.caf.com/es/conocimiento/datos/observatorio-de-movilidad-urbana/ (accessed on 15 May 2020).
  22. SEU, Social Exclusion Unit. Making the Connections: Final Report on Transport and Social Exclusion; Office of the Deputy Prime Minister: London, UK, 2003; Available online: https://www.ilo.org/wcmsp5/groups/public/---ed_emp/---emp_policy/---invest/documents/publication/wcms_asist_8210.pdf (accessed on 15 March 2019).
  23. Currie, G. Australian Urban Transport and Social Disadvantage. Aust. Econ. Rev. 2009, 42, 201–208. [Google Scholar] [CrossRef]
  24. Bocarejo, S.J.P.; Oviedo, H.D.R. Transport Accessibility and Social Inequities: A Tool for Identification of Mobility Needs and Evaluation of Transport Investments. J. Transp. Geogr. 2012, 24, 142–154. [Google Scholar] [CrossRef]
  25. Jaramillo, C.; Lizárraga, C.; Grindlay, A.L. Spatial Disparity in Transport Social Needs and Public Transport Provision in Santiago de Cali (Colombia). J. Transp. Geogr. 2012, 24, 340–357. [Google Scholar] [CrossRef]
  26. Hine, J.; Mitchell, F. Transport Disadvantage and Social Exclusion: Exclusionary Mechanisms in Transport in Urban Scotland; Transport and Society; Routledge: Aldershot, UK, 2016; ISBN 1-138-26393-1. [Google Scholar]
  27. Ferbrache, F. (Ed.) The Value of Bus Rapid Transit in Urban Spaces. Social and Political Science; Edward Elgar Publishing: Oxford, UK, 2019; Available online: https://www.elgaronline.com/view/edcoll/9781788110907/9781788110907.00005.xml (accessed on 19 September 2019).
  28. Hine, J. In Integrated Futures and Transport Choices: Uk Transport Policy beyond the 1998 White Paper and Transport Acts. In Social Inclusion and Transport; Hine, J., Preston, J., Eds.; Ashgate: Aldershot, UK, 2003; pp. 41–54. ISBN 9780754619918. [Google Scholar]
  29. Mackett, R.L.; Achuthan, K.; Titheridge, H. AMELIA: A Tool to Make Transport Policies More Socially Inclusive. Transp. Policy 2008, 15, 372–378. [Google Scholar] [CrossRef]
  30. Yigitcanlar, T.; Rashid, K.; Dur, F. Sustainable Urban and Transport Development for Transportation Disadvantaged: A Review. Open Transp. J. 2010, 4, 1–8. Available online: https://eprints.qut.edu.au/38639/ (accessed on 29 December 2019). [CrossRef] [Green Version]
  31. Schwanen, T.; Lucas, K.; Akyelken, N.; Cisternas Solsona, D.; Carrasco, J.A.; Neutens, T. Rethinking the Links between Social Exclusion and Transport Disadvantage through the Lens of Social Capital. Transp. Res. Part A Policy Pract. 2015, 74, 123–135. [Google Scholar] [CrossRef]
  32. Cruz Solís, H.; Jiménez Huerta, E.R.; Palomar Anguas, M.P.; Corona Medina, J.P. La expansión metropolitana de Guadalajara en el Municipio de Tlajomulco de Zúñiga (México). Serie Geogr. 2007–2008 2008, 14, 223–234. Available online: https://ebuah.uah.es/dspace/handle/10017/2086 (accessed on 27 December 2019).
  33. Harner, J.; Jiménez Huerta, E.R.; Cruz Solís, H. Housing and Urban Growth in Guadalajara, Mexico. Dialogues Urban Reg. Plan. 2017, 6, 105–133. [Google Scholar] [CrossRef]
  34. Téllez Vázquez, Y.; López Ramírez, J.; Romo Viramontes, R. Índice de Marginación Urbana 2010. Consejo Nacional de Población CONAPO. 2010. Available online: http://www.conapo.gob.mx/en/CONAPO/Indice_de_marginacion_urbana_2010 (accessed on 15 March 2019).
  35. Calonge Reillo, F. Neoliberal governance. Challenges to organise urban mobilities. Transp. Y Territ. 2017, 16, 184–200. [Google Scholar] [CrossRef]
  36. ECLA, Economic Commission for Latin America and the Caribbean 2019. CEPALSTAT Perfil Social MEX. 2019. Available online: http://estadisticas.cepal.org/cepalstat/Perfil_Nacional_Social.html?pais=MEX&idioma=spanish (accessed on 8 March 2020).
  37. CONAPO, Consejo Nacional de Población, México (National Population Council, Mexico). Índice de Marginación por Entidad Federativa y Municipio 2015. Mexico: National Population Council. 2016. Available online: http://www.gob.mx/conapo/documentos/indice-de-marginacion-por-entidad-federativa-y-municipio-2015 (accessed on 15 March 2019).
  38. Quevedo García, F.; Asprilla Lara, Y.; González Pérez, M.G. Entropías de la movilidad urbana en el espacio metropolitano de Guadalajara: Transporte privado y calidad del aire. Tecnura: Tecnol. Cult. Afirmando Conoc. 2017, 21, 138–140. [Google Scholar] [CrossRef]
  39. Castañón Reyes, H.E. Caracterizacion del Ciudadano Metropolitano. Guadalajara, México: ONU-Hábitat (UN-Habitat)- Gobierno del Estado de Jalisco (Government of the State of Jalisco). 2016. Available online: https://seplan.app.jalisco.gob.mx/biblioteca/archivo/descargarArchivo/2485 (accessed on 15 March 2019).
  40. Institute for Mobility and Transport of the State of Jalisco. Programa General de Transporte del Estado de Jalisco; El Estado de Jalisco Periódico Oficial: Guadalajara, Mexico, 2016; Volume CCCLXXXV. [Google Scholar]
  41. Calonge Reillo, F.; Aceves Arce, R.H. Viajando por sectores no centrales del área metropolitana de Guadalajara, México. La escasez de recursos y de alternativas de transporte como condicionantes de la exclusión social. Sociológica (México) 2019, 34, 137–168. Available online: http://www.sociologicamexico.azc.uam.mx/index.php/Sociologica/article/view/1419 (accessed on 27 May 2019). [CrossRef]
  42. INEGI, Instituto Nacional de Estadística y Geografía (National Institute of Statistics and Geography, Mexico). National Survey of Population and Housing, INEGI. 2010. Available online: https://en.www.inegi.org.mx/programas/ccpv/2010/ (accessed on 15 March 2021).
  43. CONANP, Comisión Nacional de Áreas Naturales Protegidas (National Protected Natural Areas Comission). Información espacial de las Áreas Naturales Protegidas |CONANP. 2017. Available online: http://sig.conanp.gob.mx/website/pagsig/info_shape.htm (accessed on 15 March 2019).
  44. Aguirre Quezada, J.P. Movilidad Urbana en México. Cuaderno De Investigación 30; Dirección General de Análisis Legislativo. México: Senado de la República Instituto Belisario Domínguez. 2017. Available online: http://bibliodigitalibd.senado.gob.mx/bitstream/handle/123456789/3391/Cuaderno%20de%20investigacio%CC%81n%2030%20%281%29.pdf?sequence=1&isAllowed=y (accessed on 15 March 2019).
  45. SITEUR. BRT_Informe_Indicador-2020; SEPLAN: Guadalajara, Mexico, 2020. [Google Scholar]
  46. SITEUR. LRT_Informe_Indicador-2020. Guadalajara, México: SEPLAN. 2020. Available online: https://seplan.app.jalisco.gob.mx/mide/panelCiudadano/detalleIndicador/1432. (accessed on 8 March 2021).
  47. SITEUR. SITREN_Ficha_Indicador-2020. Guadalajara, México: SEPLAN. 2020. Available online: https://seplan.app.jalisco.gob.mx/mide/panelCiudadano/detalleIndicador/1607?dimension=&tema=&dependencia=&nivel=&periodo=&sentido=&sortBusqueda=1&vista=1&palabraClave=sitren&format=&max=10&offset=0&subsistema=1&accionRegreso=busqueda. (accessed on 8 March 2021).
  48. SITEUR Sistema de Tren Eléctrico Urbano (Urban Electric Train System, Guadalajara). INFOMEX 04124919. Datos Técnicos de Transporte; Gobierno del Estado: Guadalajara, Mexico, 21 June 2019. [Google Scholar]
  49. IMEPLAN, Instituto Metropolitano de Planeación (Metropolitan Planning Institute, Guadalajara, Mexico). Área Metropolitana de Guadalajara. Expansión urbana. Análisis y prospectiva: 1970–2045, IMEPLAN: Guadalajara. 2015. Available online: https://www.researchgate.net/profile/Viacheslav_Shalisko/publication/282657516_Expansion_urbana_Area_Metropolitana_de_Guadalajara_Analisis_y_prospectiva_1970-2045/links/561670dc08ae2467f68640fa/Expansion-urbana-Area-Metropolitana-de-Guadalajara-Analisis-y-prospectiva-1970-2045.pdf (accessed on 15 March 2019).
  50. IMEPLAN, Instituto Metropolitano de Planeación (Metropolitan Planning Institute, Guadalajara, Mexico). Bus Network Geometry in the Guadalajara Metropolitan Area; IMEPLAN: Guadalajara, Mexico, 2020. [Google Scholar]
  51. IEGJal, Instituto de Informaión Territoral del Estado de Jalisco (Institute of Statistical and Geographic Information of the State of Jalisco, Mexico). Road and Highway Atlas of the State of Jalisco; Gobierno del Estado de Jalisco: Guadalajara, Mexico, 2012. [Google Scholar]
  52. INEGI, Instituto Nacional de Estadística y Geografía (National Institute of Statistics and Geography, Mexico). SCINCE Web. Available online: http://gaia.inegi.org.mx/scince2/viewer.html (accessed on 24 September 2019).
  53. INEGI, Instituto Nacional de Estadística y Geografía (National Institute of Statistics and Geography, Mexico). National Road Network. 2017. Available online: https://datos.gob.mx/busca/dataset/red-nacional-de-caminos-rnc (accessed on 15 March 2021).
  54. IMEPLAN, Instituto Metropolitano de Planeación (Metropolitan Planning Institute, Guadalajara, Mexico). INFOMEX 04124919. Datos Técnicos de Transporte. 12 June 2019. Available online: https://www.secciones.hacienda.gob.mx/work/models/sci/cartera_publica/#/busqueda (accessed on 15 March 2021).
  55. Fransen, K.; Neutens, T.; Farber, S.; De Maeyer, P.; Deruyter, G.; Witlox, F. Identifying Public Transport Gaps Using Time-Dependent Accessibility Levels. J. Transp. Geogr. 2015, 48, 176–187. [Google Scholar] [CrossRef] [Green Version]
  56. SEDATU, Secretaría de Desarrollo Agrícola, Territorial y Urbano, México (Ministry of Agrarian, Territorial and Urban Development, Mexico). Manual De Calles. Diseño Vial Para Ciudades Mexicanas; SEDATU: Ciudad de Mexico, Mexico, 2017. [Google Scholar]
  57. Currie, G. Quantifying Spatial Gaps in Public Transport Supply Based on Social Needs. J. Transp. Geogr. 2010, 18, 31–41. [Google Scholar] [CrossRef]
  58. Lizárraga, C. Metropolitan expansion and mobility: The case of Caracas. Eure-Rev. Latinoam. Estud. Urbano Reg. 2012, 38, 99–125. [Google Scholar] [CrossRef] [Green Version]
  59. Hine, J. Transport and Social Exclusion. In International Encyclopedia of Human Geography; Kitchin, R., Thrift, N., Eds.; Elsevier: Oxford, UK, 2009; pp. 429–434. [Google Scholar] [CrossRef]
  60. Taylor, B.D.; Miller, D.; Iseki, H.; Fink, C. Nature and/or Nurture? Analyzing the Determinants of Transit Ridership across US Urbanized Areas. Transp. Res. Part A Policy Pract. 2009, 43, 60–77. [Google Scholar] [CrossRef] [Green Version]
  61. UN-Habitat. Planning and Design for Sustainable Urban Mobility; Routledge: London, UK, 2013. [Google Scholar] [CrossRef]
  62. Graglia, A.D. Finding Mobility: Women Negotiating Fear and Violence in Mexico City’s Public Transit System. Gend. Place Cult. 2016, 23, 624–640. [Google Scholar] [CrossRef]
  63. Ricciardi, A.M.; Xia, J.; Currie, G. Exploring Public Transport Equity between Separate Disadvantaged Cohorts: A Case Study in Perth, Australia. J. Transp. Geogr. 2015, 43, 111–122. [Google Scholar] [CrossRef]
  64. El-Geneidy, A.; Buliung, R.; Diab, E.; van Lierop, D.; Langlois, M.; Legrain, A. Non-Stop Equity: Assessing Daily Intersections between Transit Accessibility and Social Disparity across the Greater Toronto and Hamilton Area (GTHA). Environ. Plan. B Plan. Des. 2016, 43, 540–560. [Google Scholar] [CrossRef]
  65. Xia, J.; Nesbitt, J.; Daley, R.; Najnin, A.; Litman, T.; Tiwari, S.P. A Multi-Dimensional View of Transport-Related Social Exclusion: A Comparative Study of Greater Perth and Sydney. Transp. Res. Part A Policy Pract. 2016, 94, 205–221. [Google Scholar] [CrossRef] [Green Version]
  66. Özkazanç, S.; Özdemir Sönmez, F.N. Spatial Analysis of Social Exclusion from a Transportation Perspective: A Case Study of Ankara Metropolitan Area. Cities 2017, 67, 74–84. [Google Scholar] [CrossRef]
  67. Grindlay, A.L.; Jaramillo, C.; Lizárraga, C. Spatial Relationships between Mobility Opportunities and Constraints of Transport Disadvantages: The Case of Santiago de Cali, Colombia. WIT Trans. Build Environ. 2017, 176, 119–129. [Google Scholar] [CrossRef] [Green Version]
  68. Jirón, P. Unravelling Invisible Inequalities in the City through Urban Daily Mobility. The Case of Santiago de Chile. Swiss J. Sociol. 2007, 33, 45–68. [Google Scholar]
  69. Delbosc, A.; Currie, G. Using Lorenz Curves to Assess Public Transport Equity. J. Trans. Geogr. 2011, 19, 1252–1259. [Google Scholar] [CrossRef]
  70. Jiang, L.; Hagen-Zanker, A.; Kumar, P.; Pritchard, J. Equity in Job Accessibility and Environmental Quality in a Segmented Housing Market: The Case of Greater London. J. Trans. Geogr. 2021, 90, 102908. [Google Scholar] [CrossRef]
  71. Preston, J.; Rajé, F. Accessibility, Mobility and Transport-Related Social Exclusion. J. Trans. Geogr. 2007, 15, 151–160. [Google Scholar] [CrossRef]
  72. Tahmasbi, B.; Mansourianfar, M.H.; Haghshenas, H.; Kim, I. Multimodal Accessibility-Based Equity Assessment of Urban Public Facilities Distribution. Sustain. Cities Soc. 2019, 49, 101633. [Google Scholar] [CrossRef]
  73. CONEVAL. Consejo Nacional de Evaluación de la Política de Desarrollo Social (National Council for the Evaluation of Social Development Policy, Mexico); Metodologia-medicion-multidimensional-3er-edicion.pdf; CONEVAL: Ciudad de México, Mexico, 2019; ISBN 978-607-9384-12-8. [Google Scholar]
  74. Jirón, P.; Mansilla, P. Atravesando La Espesura de La Ciudad: Vida Cotidiana y Barreras de Accesibilidad de Los Habitantes de La Periferia Urbana de Santiago de Chile. Rev. De Geogr. Norte Gd. 2013, 56, 53–74. [Google Scholar] [CrossRef] [Green Version]
  75. IMEPLAN, Instituto Metropolitano de Planeación (Metropolitan Planning Institute, Guadalajara, Mexico). Programa de Desarrollo Metropolitano del Área Metropolitana 2.0 Guadalajara, 2042. 2016. Available online: http://imeplan.mx/sites/default/files/IMEPLAN/PDM-Vjunta_2.pdf (accessed on 15 March 2019).
  76. Herrera, L. El tren que arrolló a la ONU. El Proyecto de Ampliación de la Línea 1 del Tren de Guadalajara que Vigiló en su Gasto Naciones Unidas, Terminó con un Sobrecosto Millonario. 2018. Available online: https://www.reporteindigo.com/reporte/el-tren-que-arrollo-a-la-onu-vigilancia-gasto-sobrecosto-obras/ (accessed on 15 March 2019).
  77. Duarte, F.; Rojas, F. Intermodal Connectivity to BRT: A Comparative Analysis of Bogotá and Curitiba. J. Public Transp. 2012, 15, 1–18. [Google Scholar] [CrossRef] [Green Version]
Figure 2. Modal Split in the Guadalajara Metropolitan Area (Percentage of Work-Day Journeys). Source: Authors based on [3,45,46,47,48].
Applsci 11 07709 g002
Figure 3. Mass Public Transport System in the Guadalajara Metropolitan Area. Source: Authors based on [42,43,45,46,47,48,49,50].
Applsci 11 07709 g003
Figure 4. Index of Mass Transport Provision. Source: Authors, based on [42,43,45,46,47,48,49,50].
Applsci 11 07709 g004
Figure 5. Index of Social Transport Needs. Source: Authors, based on [42,43,45,46,47,48,49,50].
Applsci 11 07709 g005
Figure 6. Index of Social Transport Needs Covered. Source: Authors, based on [42,43,45,46,47,48,49,50].
Applsci 11 07709 g006
Figure 7. Distribution of the Levels of MTP and of STN in the 1834 GS Source: Authors.
Applsci 11 07709 g007
Table 1. Characteristics of Modes in the SITEUR.
ModeNameLength [Km]Number of Stops/StationsPeak-Time
Frequency
[Minutes]
Capacity
[Passenger/
Vehicle]
LRT116205.33684
29104600
321187500
BRTMacrobús16276164
MiMacro Periférico *No dataNo dataNo dataNo data
BusSitren 11229647
Sitren 1 B1230880
Sitren 21326747
Sitren 31854780
Sitren 422881580
* This BRT line was not included. It was under construction when the analysis was performed. Source: Authors based on [45,46,47,48].
Table 3. Social Indicators Weights.
Social Indicator (Si)Weight (Wi)
S1- DisabilityW1 = 0.137
S2- Educational levelW2 = 0.125
S3- ElderlyW3 = 0.143
S4- ChildhoodW4 = 0.113
S5- UnemploymentW5 = 0.128
S6- IlliteracyW6 = 0.129
S7- Low incomeW7 = 0.036
S8- Vehicle ownershipW8 = 0.066
S9- GenderW9 = 0.123
Table 4. Population and Surface related to Social Transport Needs Covered by SITEUR.
ISTNCInhabitantsArea
Value%GSHa%
IMTP < ISTN1,910,20342%511293,26587%
IMTP > ISTN2,588,75158%132345,03213%
Publisher’s Note: MDPI stays neutral with regard to jurisdictional claims in published maps and institutional affiliations.

