
A Hybrid Data-Fusion System by Integrating CFD and PNN for Structural Damage Identification


1
School of Civil Engineering, Liaoning Petrochemical University, Fushun 113001, China
2
College of Civil Engineering, Fuzhou University, Fuzhou 350108, China
*
Author to whom correspondence should be addressed.
Appl. Sci. 2021, 11(17), 8272; https://0-doi-org.brum.beds.ac.uk/10.3390/app11178272
Submission received: 29 June 2021
/
Revised: 28 August 2021
/
Accepted: 31 August 2021
/
Published: 6 September 2021
(This article belongs to the Section Civil Engineering)
Abstract
:Recently, a variety of intelligent structural damage identification algorithms have been developed and have obtained considerable attention worldwide due to the advantages of reliable analysis and high efficiency. However, the performances of existing intelligent damage identification methods are heavily dependent on the extracted signatures from raw signals. This will lead to the intelligent damage identification method becoming the optimal solution for actual application. Furthermore, the feature extraction and neural network training are time-consuming tasks, which affect the real-time performance in identification results directly. To address these problems, this paper proposes a new intelligent data fusion system for damage detection, combining the probabilistic neural network (PNN), data fusion technology with correlation fractal dimension (CFD). The intelligent system consists of three modules (models): the eigen-level fusion model, the decision-level fusion model and a PNN classifier model. The highlight points of this system are these three intelligent models specialized in certain situations. The eigen-level model is specialized in the case of measured data with enormous samples and uncertainties, and for the case of confidence level of each sensor is determined ahead, the decision-level model is the best choice. The single PNN model is considered only when the data collected is somehow limited, or few sensors have been installed. Numerical simulations of a two-span concrete-filled steel tubular arch bridge in service and a seven-storey steel frame in laboratory were used to validate the hybrid system by identifying both single- and multi-damage patterns. The results show that the hybrid data-fusion system has excellent performance of damage identification, and also has superior capability of anti-noise and robustness.
1. Introduction
Structural damage identification is an essential approach to prevent a sudden collapse of structures and avoid casualties and heavy economic losses [1,2,3]. A series of damage detection methods have been proposed [4,5,6,7,8], and health monitoring systems have been developed and installed in a number of large-scale engineering structures.
It has been found that feature extraction is very crucial in a structural health monitoring system (SHM) [9,10]. Usually, we can use the change of features extracted from the pre- and post-damage of structure to diagnose structural damage. However, conventional feature extraction methods are powerless for extracting from non-linear signals. In recent years, several new theories, such as wavelet transform [11] and fractal dimension (FD) [12], have been used to identify features of damage. In particular, FD analysis has attracted more and more attention in the field of structural damage detection.
FD is powerful to describe the non-linear behavior of vibration signals quantitatively, and thus it is suitable for the field of fault diagnosis and damage detection [12,13,14,15,16]. Previous studies have found that if the structure has damage, the parameters that determine the state of structure will change, and the FD will also change. Thus, FD can be used as the feature, which can reflect structural damage and state, and diagnose the structural damage according to the change of FD. This is the theoretical basis of applying FD for structural damage detection. It has also been found that fractal method does not depend on the mathematical system model, and also can comprehensively extract the state information of system. In addition, FD is simple and intuitive. Thus, FD is an important and ideal index for structural damage identification. Recently, FD has become a research hotspot for SHM, in view of its flexibility and extensive applicability. Although fractal geometry has been applied to structural damage detection and diagnosis widely, which has wonderful adaptability and agility, and has a nice application foreground, it also has some problems. For example, considering that structural damage detection belongs to dynamic indirect problem, it is difficult for high-nonlinear complex cases to detect damage by use of a dynamics mathematic model. Furthermore, in real practice, a single damage index is generally impossible to reflect all types of damage for real structures, and it may also have some uncertainties of modeling and observation errors in practical measurement [13,14]. Although statistical theory and approaches can reduce the effect of observation error and uncertain factors, it is essential and urgent to develop a comprehensive damage detection method to solve the above-mentioned problems.
Since neural network (NN) possess powerful abilities, such as nonlinear processing, self-organizing, self-learning and self-adaption, it had obtained good results in the structural damage detection by integrating NN with fractal theory [17,18,19,20]. Most of these existing studies focused on the application of FD in extracting features, fault diagnosis and damage identification. However, it is still a concerning issue how to make full use of the large volume of nonlinear characteristic data and integrate FD for damage detection and state assessment [17,18,19].
In recent years, as a complex machine learning algorithm, Deep Learning(DL) [17,21,22] has been widely applied in the field of artificial intelligence; especially Convolutional Neural Network (CNN) has been of wide concern and application, such as in image and sound recognition, machine vision and data mining. However, as a machine learning algorithm emerging in recent years, the application of CNN in engineering structural damage diagnosis is still in the initial stage. Network training is time-consuming and also has a lot of work that needs to be further carried out, such as the processing of the variety of structural damage, massive data and the application in practical engineering. At the same time, the traditional neural network technology has the advantages of short training time and high recognition accuracy as long as the feature extraction is effective.
In order to make full use of the massive nonlinear characteristic data and integrate FD, this paper focuses on the integration of correlation fractal dimension and PNN with the data fusion technique to detect structural damage, presenting a novel hybrid damage detection system which contains three intelligent models and is exactly powerful for large-scale and complex structures. The three models are a single PNN classifier model (without data fusion), an eigen-level data fusion model and a decision-level data fusion model. It has excellent performance of damage detection, especially for a complex structure with measurement data that is enormous and has uncertainties. Practice has shown that the proposed system can obtain three kinds of reasonable damage detection results under the case of noises, and it also further proved the anti-noise capabilities and robustness of the system. Finally, this paper is organized as follows. The hybrid data-fusion system for damage detection is described in Section 2. A numerical example and a laboratorial seven-storey steel frame of both single- and multi-damage patterns are validated with the proposed system in Section 3 and Section 4. Section 5 presents the conclusion.
2. Novel Hybrid Data-Fusion System
2.1. Hybrid System Structures
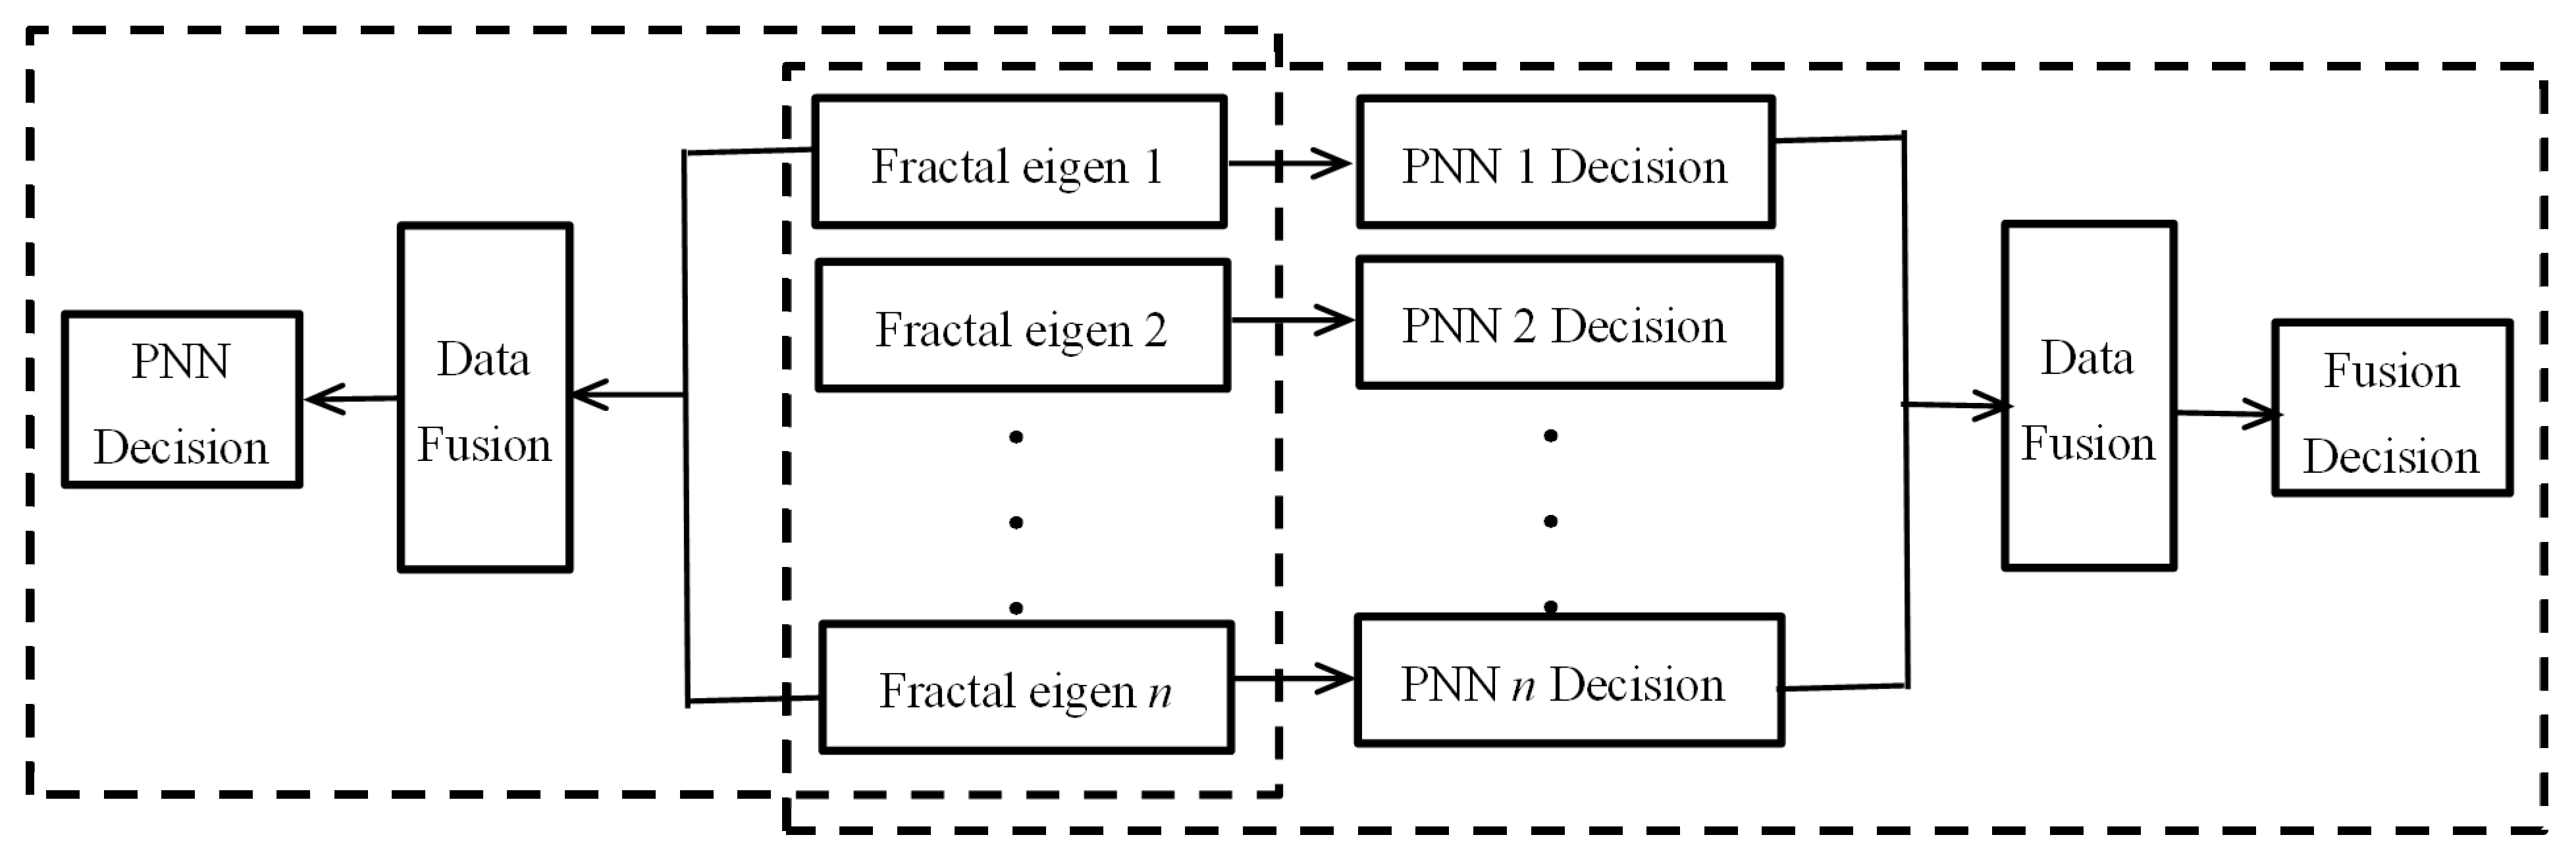
Figure 1 shows the interior structure of the hybrid damage detection system, which reveals the technology of combining FD and PNN models with the data fusion. The system contains three models, namely, a single PNN classifier model, an eigen-level fusion model and a decision-level fusion model and the system can get three kinds of reasonable detection results correspondingly, according to the different cases of structures to choose the suitable model. Furthermore, the proposed system can realize three damage identification functions simultaneously.
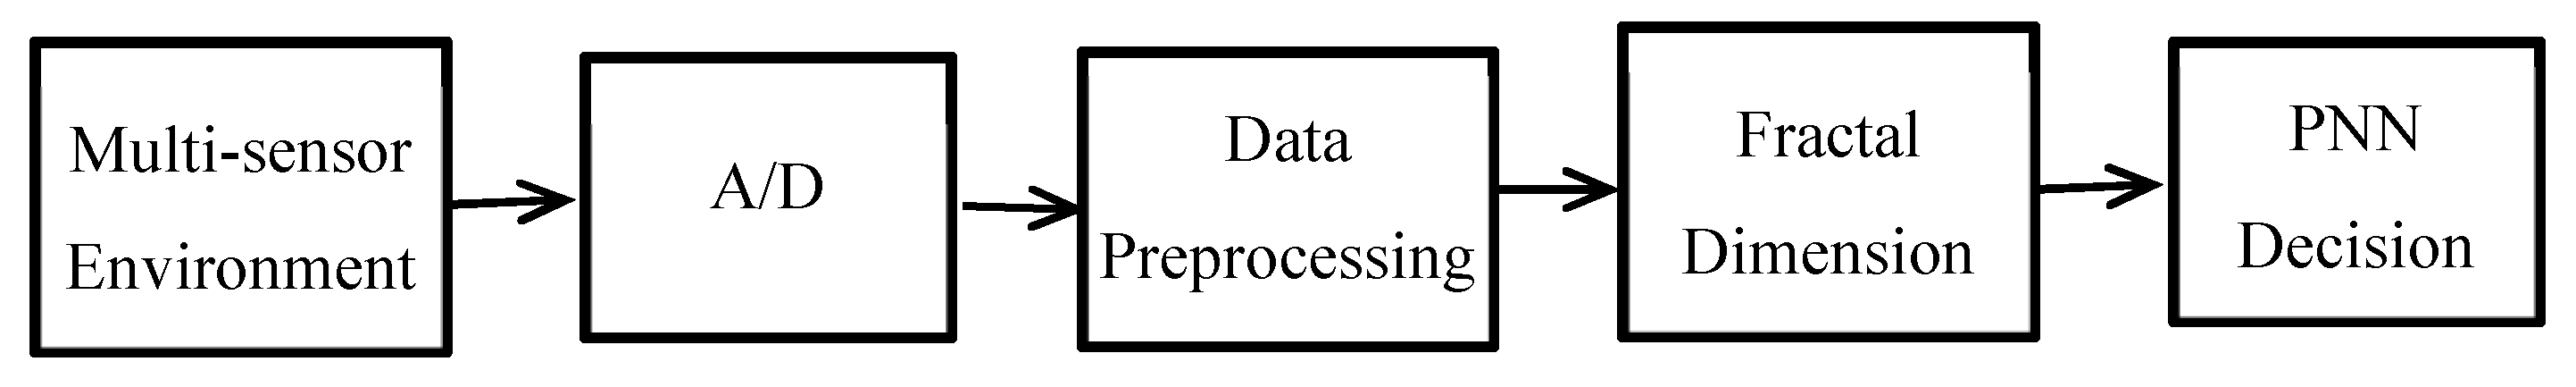
The left side of Figure 1 includes two models: a single PNN classifier model (namely, without data-fusion tactics, after fractal features extraction to make PNN decision directly, as shown in Figure 2) and an eigen-level data-fusion model. The essential difference between them is the process of having data fusion or not. Meanwhile, on the right of Figure 1, it shows the details of decision-level data-fusion model. This makes decisions based on data fusion of multiple single-PNN classifiers, as the eventual damage detection results output.
The proposed system has three damage identification functions and can even detect damage simultaneously. However, if the characteristics of the data to be detected are clearly understood, it would be a wise choice to select one of them for damage detection, as a single PNN is more suitable for the situation where the limited data of a few sensors are collected; when the reliability of each sensor in the multi-sensor system is known, a decision-level data fusion damage detection model would be the most appropriate choice; otherwise, an eigen-level data fusion damage detection model can be adopted.
2.2. Single PNN Damage Detection Model
The details of the single PNN classifier are illustrated in Figure 2 for damage detection. The model is mainly composed of three parts, data preprocessing, obtaining correlation fractal dimensions (CFD) and PNN damage detection decision.
2.2.1. Data Preprocessing
Before features extraction, data preprocessing is necessary. The reason for this is that collecting signals from raw measurement inevitably contain noises, measurement errors and even are influenced by imprecision of measurement facility, etc. First of all, the measured signals are converted from analog to digital form. Subsequently, with the help of either basic or advanced data preprocessing techniques, the digitized data are processed, such as threshold, filtering, averaging, etc. For better results, some advanced data processing techniques, such as wavelet transform (WT) and wavelet packet analysis, Hilbert-Huang transform (HHT) and principal component analysis (PCA), can also be used for data de-noising and compressing. Here, the filtering and averaging method were used for data preprocessing.
2.2.2. G-P Algorithm of Correlation Dimension
There are different kinds of approaches to define FD (Fractal Dimension) in fractal geometry; the most recognized is Hausdorff’s dimension. Correlation fractal dimension was used as the feature parameter in this paper for damage detection.
For an N-point time series the method of delays reconstructs the attractor dynamics by using delay coordinates to form multiple state-space vectors,
where stands for the reconstructed state space vector, is the embedding dimension, is lag time measured in units of sampling interval.
Following reconstruction, the correlation integral is defined in the -dimensional reconstructed space as the probability of finding a pair of vectors whose distance is not larger than
Moreover:
where is the Heaviside Step function for and for and is the distance parameter, is the distance between two reconstructed vectors, which is computed using the Euclidean norm:
The correlation dimension is defined as:
Particularly worth mentioning is that the computational precision of correlation dimension is influenced by lag time and embedding, but beyond that, data length and noise levels can also influence it. A detailed discussion can be found in Reference [23].
2.2.3. PNN Decision
It is well known that neural network is a kind of machine learning method that imitates the human brain. A neural network usually consists of an input layer, a hidden layer and an output layer. In this paper, PNN is chosen to detect damage. PNN as a feed-forward neural network was first proposed by Specht [24]. The PNN implements the Bayesian decision rule by representing the probability density functions (PDFs) of the known data sets with a non-parametric estimator, then judges which set of known data is most likely the source of the unknown datum. PNN uses Bayesian probabilistic approach to describe measurement data, which fundamentally determines that PNN has prominent merits among neural network models in noisy condition and pattern recognition.
The essence of the PNN classifier for damage identification is to judge the pattern class of damage types into which the testing vectors of unknown source could be categorized. For the above-mentioned PNN, assume the input vector X = {x1, x2…xn}T in the input layer consists of p eigenvectors. In the pattern layer, there are s pattern classes, each representing a possible damage type. The number s of pattern classes depends on a specific structure. After entering training vectors of all pattern classes as weights between the input and pattern layers, the PNN for damage type is configured. If ni training vectors are prepared for the kth pattern class, the total number of neurons in the pattern layer is , where s is the total number of pattern classes. When given a new input vector (testing vector) X consisting of measured data of unknown source, the configured PNN outputs the PDF estimates for each pattern class at the testing vector point. The pattern class with the largest PDF implies the class of the current input (testing) vector and indicates the damage class.
2.3. Eigen-Level Damage Detection Model
A proposed three-stage eigen-level data fusion model for damage detection is shown in Figure 3, which illustrates the architecture of this fusion model. As mentioned above, processing the initial data is necessary. Just as explained in Section 2.2, some relevant preprocessing techniques are used for de-noising. The key stage is the second stage, namely, to extract correlation dimensions (CD), then fuse them extracted from multiple sensors. In the last stage, the fused feature groups are to be input into a PNN classifier then make a damage detection decision. Since feature-level data fusion fully considers the importance of individual features and multi-sensor mutual information features, it is convinced beyond doubt that the eigen-level damage detection model can obtain more accurate identification results than any individual feature can.
2.4. Decision-Level Data Fusion Model for Damage Detection
On the right side of Figure 1 is the decision-level data-fusion damage detection model. After data pre-processing, feature extraction and single PNN decision, the decision fusion was carried out. It is noted that the decision fusion based on single PNN classifier model is shown in Figure 2. Thus, this section focuses on the process of fusion computation for the decision level. Based on the contribution of single PNN model, we can obtain an initial decision for every given feature (sensor), then the weighted-average fusion algorithm is employed for fusion computation. Based on the conditional PDF fq(X) corresponding to each class from PNN classifier of the test vector X, weighted average method was used to fuse computation; assuming the class-conditional PDF fq,j(X) for class θq and jth sensor is known, a fused class-conditional PDF for class θq can be written as:
where wq,j stands for the normalized coefficient for class θq and jth sensor, which depends on the recognition accuracy of PNN classifiers in the PNN network training stage, and .
Decision results of X assigned to class θq according to maximal fused probability density functions were defined as Equation (7). This majority voting technique adopts the winner-take-all principle.
For different damage, different classifiers may have different recognition results, then the maximal fused probability density function is employed to make the final decision results.
3. Simulation Validation
3.1. Structural Model and Damage Simulation
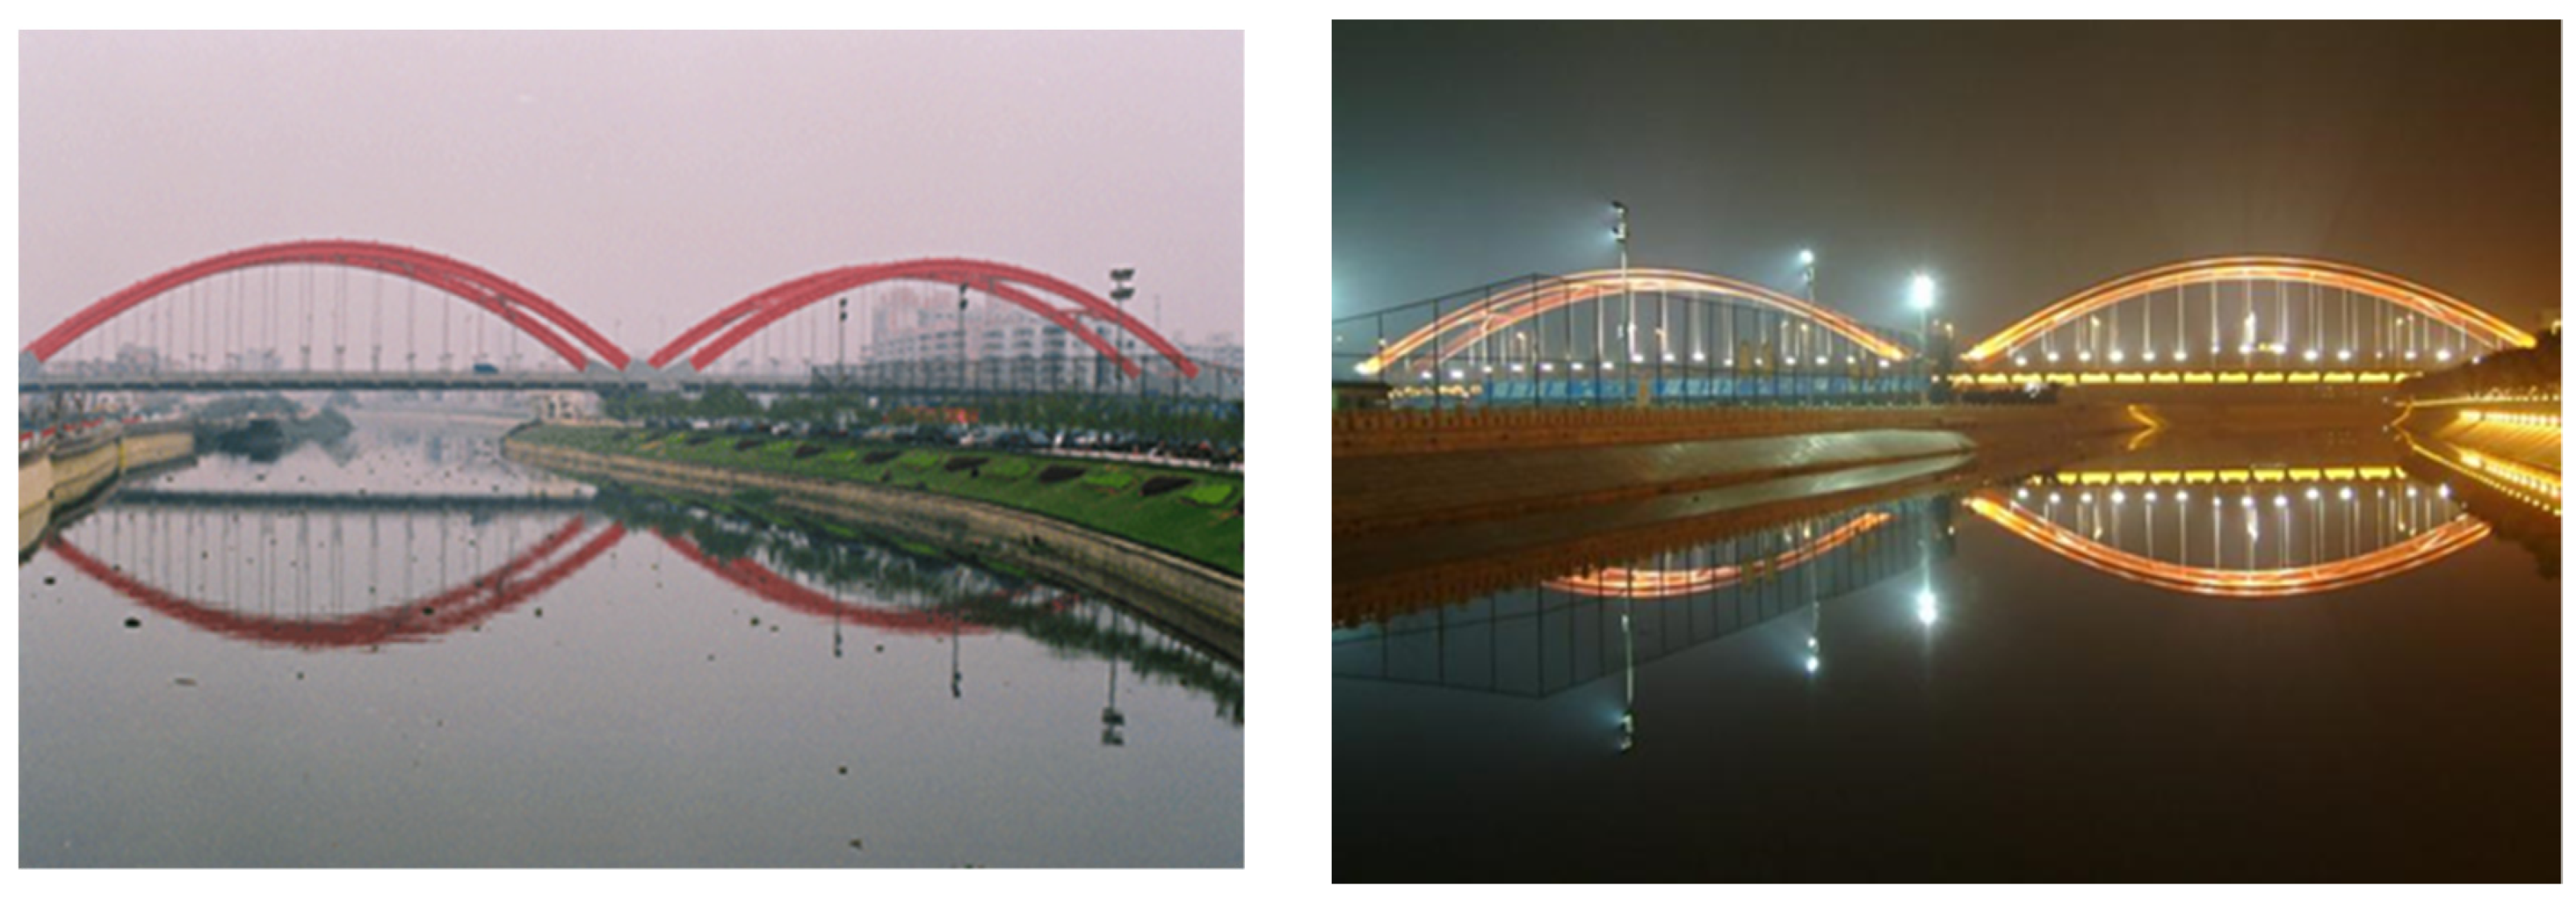
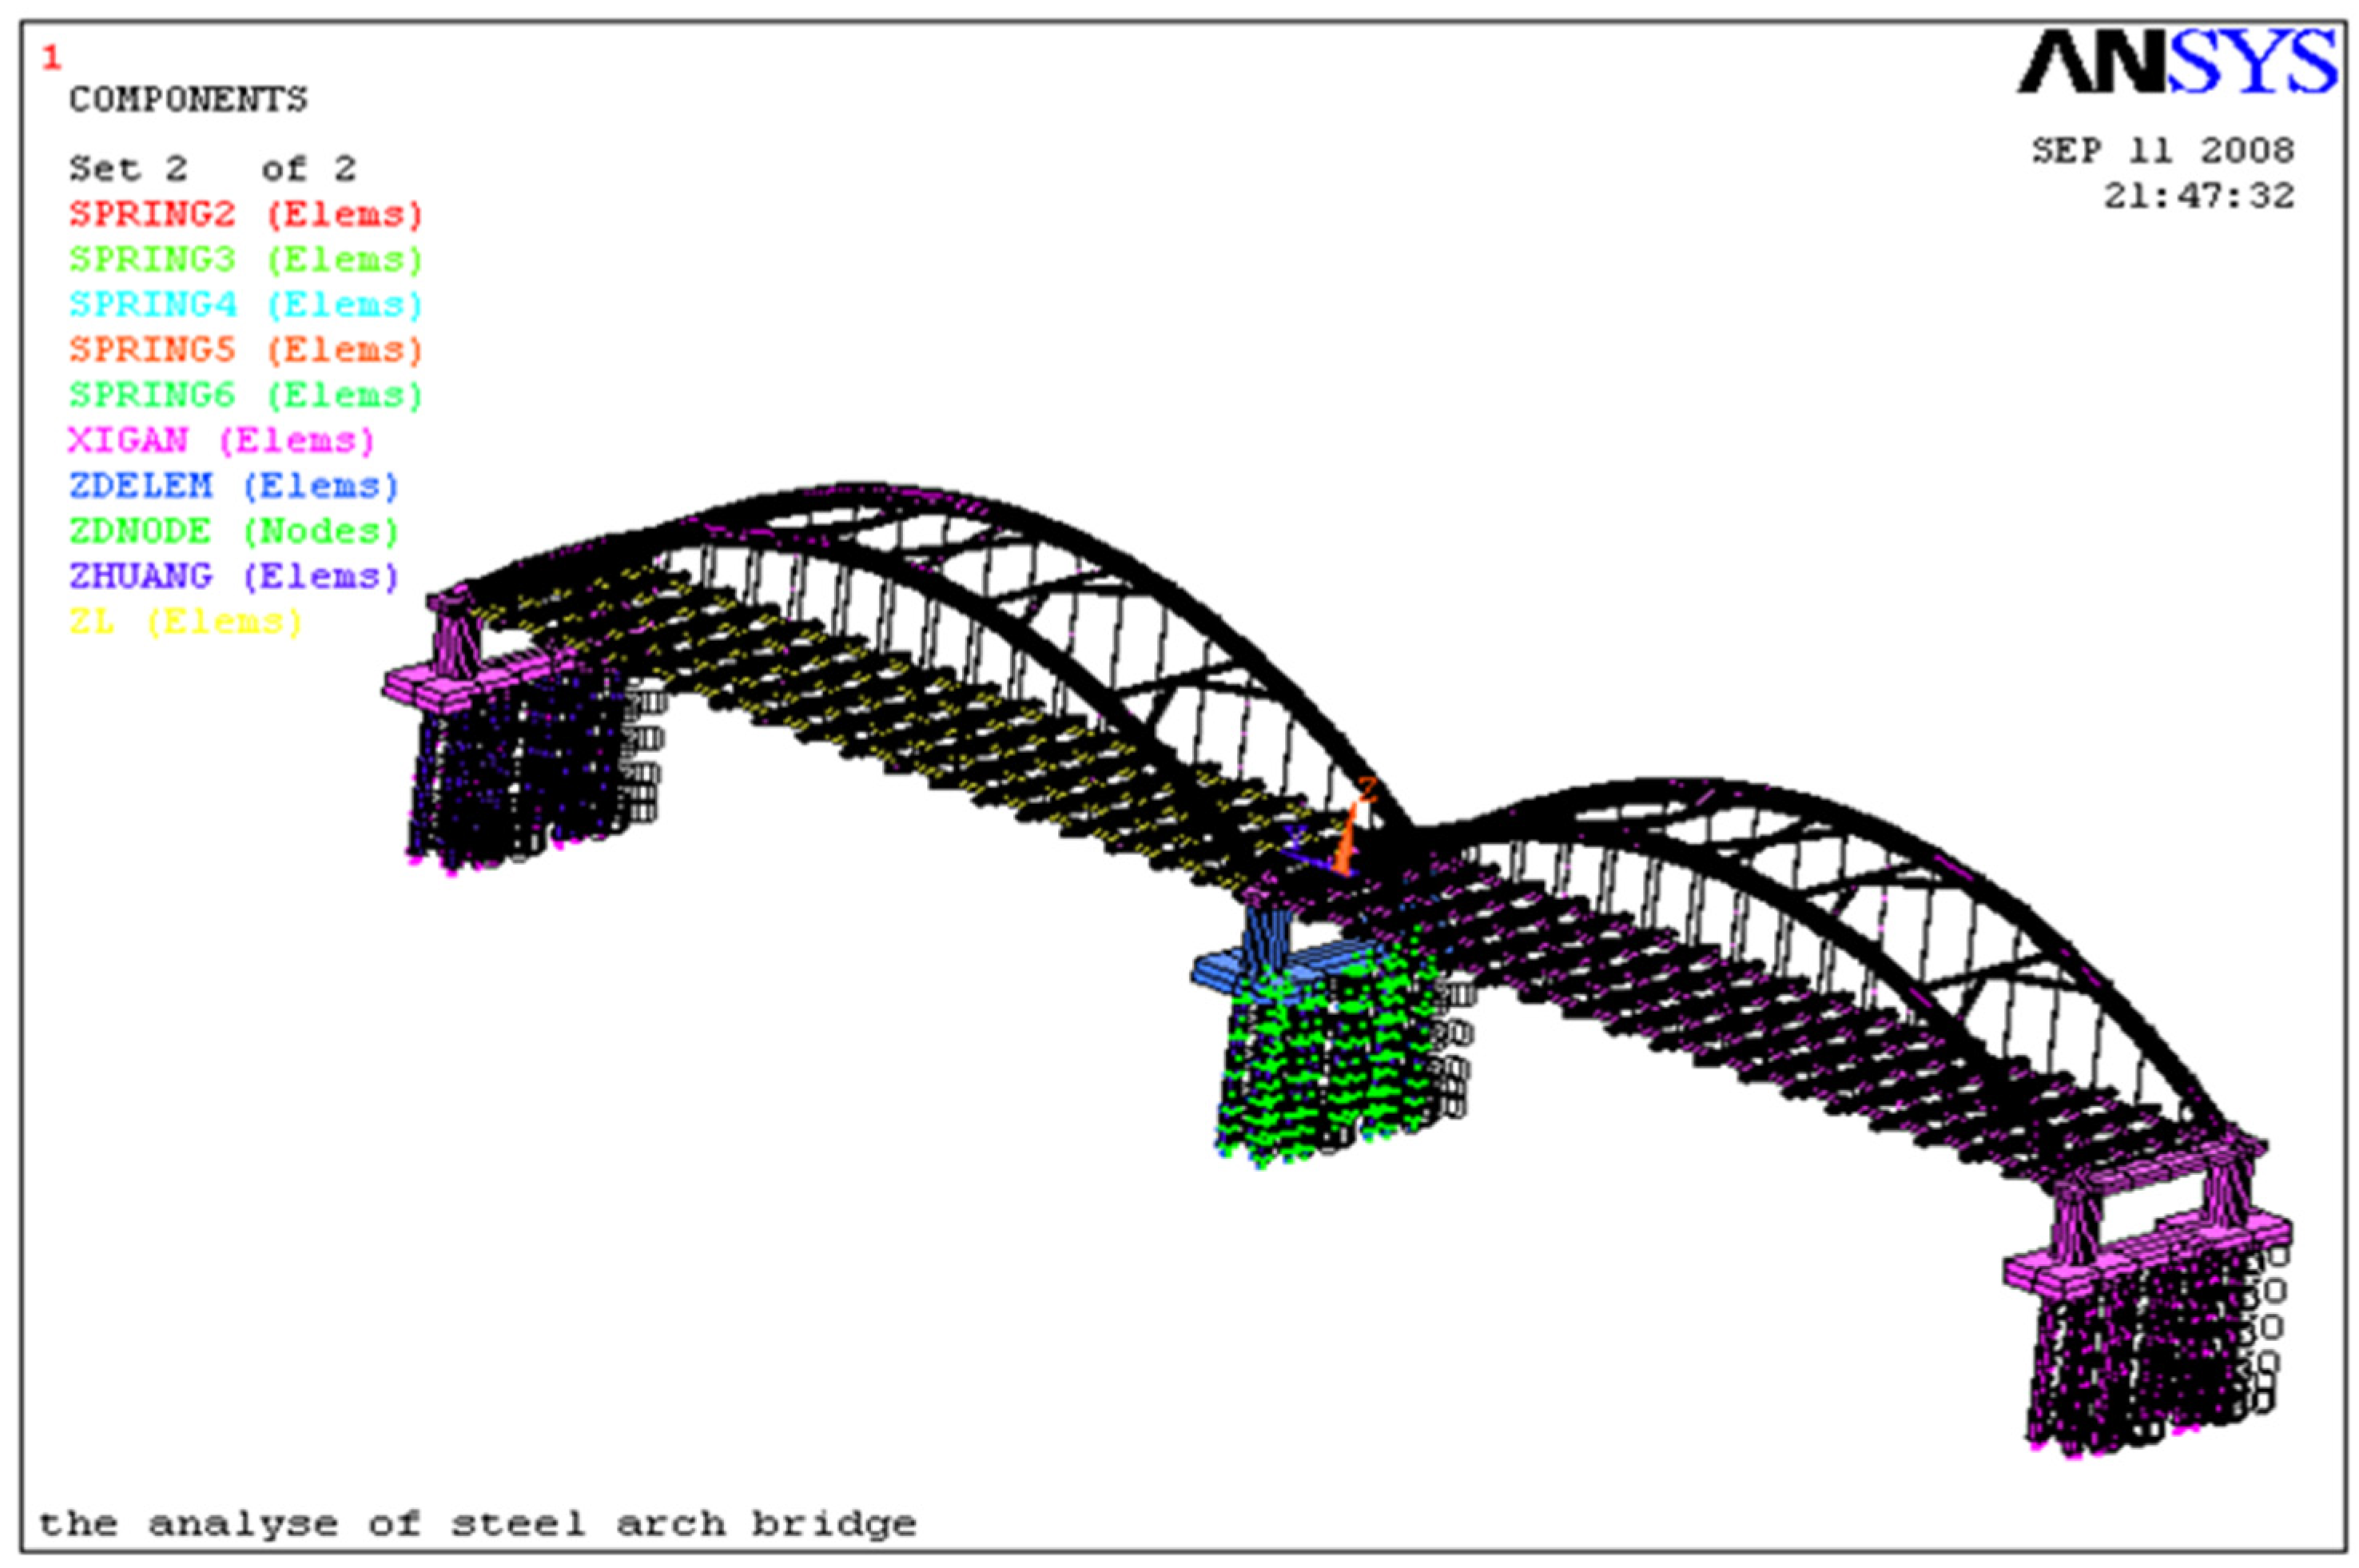
In order to prove the proposed hybrid system, a two-span concrete-filled steel tubular arch bridge in service as shown in Figure 4 was employed. Here, ANSYS 10.0 (Finite Element Software) was used to build this arch bridge model (as shown in Figure 5). First of all, we inputted the health condition command flow of this bridge to ANSYS software, then used complete method to calculate dynamic response of this bridge under given loads. Considering that noise is inevitable, we then added noise to dynamic response, and this mixed-signal model is used to simulate the real dynamic response of the bridge.
Then, we inputted the damage condition command flow with different damage location and different damage degree respectively based on the health condition of bridge model. Finally, transient dynamic analysis of ANSYS was used to calculate the structural response under arbitrary change of load with time, namely, time-history of structural response. Transient dynamic analysis was used to determine the change rule of structural displacement, stress and strain under steady-state load, composite action of transient load and harmonic load. A weight of 10 t vehicle load was used as dynamic load, and the car went through the bridge with a speed of 12.5 m/s, and then we calculated the displacement response of the arch rib nodes of the arch bridge.
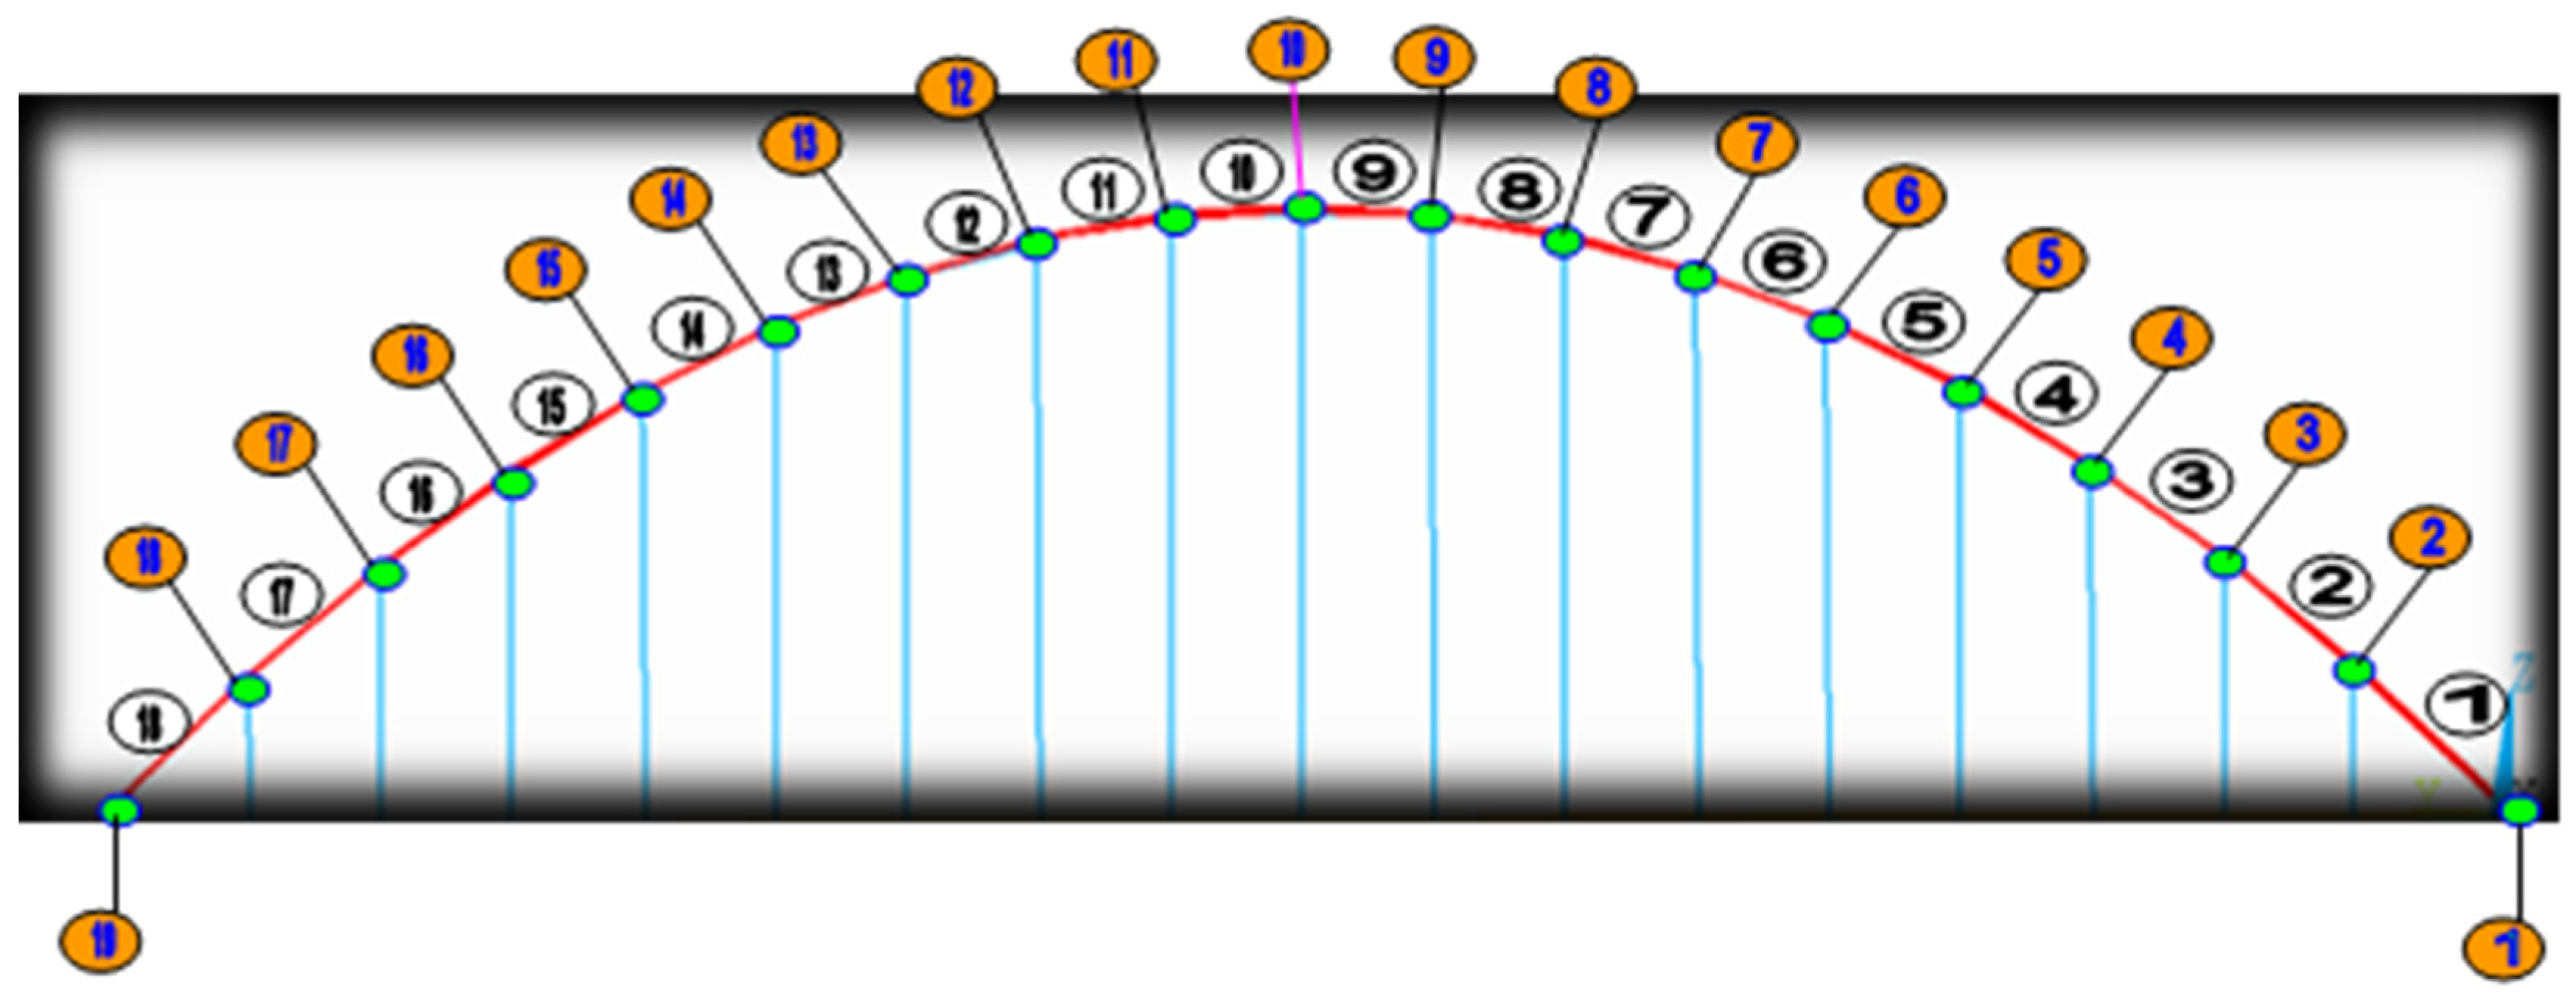
Considering the symmetry of the bridge, we used a rib of the arch bridge for research (as shown in Figure 6), hollow digital stands for rib element, solid digital stands for rib node, and the rib is divided into 18 elements and 19 nodes (as shown in Figure 6); ①–⑱ are the number of elements and 1–19 are the node numbers.
In general, there are two ways to simulate element damage: changing the cross-section and reducing the element stiffness. In reality, the stability problems of arch bridge are quite conspicuous; the arch rib mainly bears axial force, the stiffness decline of it can reduce directly the stability of the local components even overall structure. In fact, the damage of structure, such as cracks, and reducing of material elastic modulus all can cause the decline of the structural stiffness. On the contrary, the impact on quality is little. So, during the analysis process, the quality was assumed constant, and the decline of elastic modulus was used to simulate the decline of element stiffness. In this paper, there were four damage cases, i.e., a single damage, multiple damage, different damage locations and degrees. The damages were located in the arch rib elements. Considering the complexity of this large bridge, relatively big damage was chosen in the simulating the four damage conditions. It is shown in the Table 1.
In the actual signal measurement, there is a lot of noise. In order to simulate measured data, each set of the analytical computed correlation dimension added by a random sequence for each damage, i.e.,
where yi and yia stand for the noise-polluted measured correlation dimension and the analytically computed values for each damage simulation respectively; R is a normally distributed random variable with zero mean and deviated with 1; is an index representing the noise degree, here is set 1%, 2%, and 3%, respectively [25].
Here, 200 sets of damage case were produced at every noise level, namely, 200 sets of measured data. The first 100 sets were used as training samples, and the rest of them were used as test samples. For four damage cases, a total of 100 × 4 = 400 measured data sets were created for training, along with the same numbers measured data sets for the test.
3.2. Single PNN Damage Detection Model
The effects of input features on damage detection were investigated for the above arch bridge model. Before constructing the single PNN classifier model, some work such as extracting feature parameters and producing training and test samples had to be done in advance [24]. Here, PNN classifier 1 was chosen as an example to elaborate the process of damage detection.
Before constructing a PNN classifier, calculating the correlation dimension was necessary. Equation (5) was chosen to calculate the correlation dimension. From the raw measurement, the following 6-dimensional feature vector was formed, whose elements were related to the CD, then they were divided into three groups, i.e., NC1, NC2 and NC3, as input vectors for classifier 1, 2 and 3, respectively, which then made PNN decisions respectively.
For classifier 1, when the noise level = 1%, the NC1, which contains two groups of correlation dimensions, were taken to the input vectors of classifier 1. Each training sample was set as one neuron in the pattern layer; thus, the number of neurons was 400 in the pattern layer. Neurons in the summation layer corresponded to four damage patterns, thus the number of neurons was four. The structure of classifier 1 was represented with 2-400-4. Here the -parameter was set to 0.25. Then the PNN was configured or trained. When presenting on the PNN new input vectors (testing samples), each neuron in the summation layer outputted the PDF estimates for each pattern at the testing sample point. The pattern class with the largest PDF indicated the damage class of the current testing sample.
Allowing for the effect of noise on identification accuracy of classifier, training and testing samples noise-polluted with = 2% and 3% were also produced in the same way as those with = 1%, and the structure of the classifier was also represented with 2-400-4. It should be noted that in each classifier, testing samples were with the same noise level as training samples, respectively. Table 2 shown the identification results of total of 400 testing samples by use of classifiers for the noise levels = 1%, 2% and 3%, respectively. It is noted that the IAs (Identification Accuracy) of the training phase are 100% for all four classifiers.
As predicted, the total IA decreases with the increase of the noise level for the same input feature vector; when ε = 1%, the detection results were more than 80% of all three classifiers (input features vectors were different). This indicates that the damage identification using the correlation dimension as the eigenvector can obtain a better recognition effect, and it was proven that correlation dimension is sensitive to the damage of the structure.
3.3. Eigen-Level Damage Detection Model
The PNN classifier in the eigen-level fusion model was constructed as same as the above single PNN classifier model. To test the eigen-level data-fusion model, the three fusion feature groups involved were NC1 + NC2, NC2 + NC3 and NC1 + NC3. The IAs of training phase is 100% for all three classifiers. Table 3 shows the identification results of totally 1200 testing samples from the eigen-level model for noise levels ε = 1%, 2% and 3%, respectively. It can be seen that the identification accuracy all improved effectively with the different noise level. It is noted that the average IA is up to 73.8% when the noise level is 3%, which indicates that feature-level data fusion has improved the effectiveness of damage detection, and also has more robustness than the single PNN classifier, which uses only individual features.
It can be found that, after the eigen-level data fusion processing, the average IAs improved remarkably at every noise levels; particularly for patterns 2 and 3, the IA was improved significantly at different noise levels. The average IA is up to 86.9% when the noise level is 2%, but the average IA was only 83.5% for single PNN classifier models, even when ε = 1%. These is further evidence that the eigen-level data fusion model, after data fusion processing, had a better damage detection capability. Because of the existence of redundant and complementary information in the eigen-level data fusion, the noise-tolerance and robustness of the eigen-level fusion model are consequently better than that of single PNN classifiers.
3.4. Damage Detection with Decision-Level Fusion Model
As described in Section 2.4, the results obtained from the single PNN models can provide subset information for the decision-level data-fusion model. After the PDFs for each pattern class at the test sample point were obtained, four fusion models were chosen to fuse the identification results of classifiers 1, 2 and 3 from the single PNN classifier models by Equation (5), and then the fused class-conditional PDFs for each pattern were attained, the final damage decision results of test samples were made by Equation (6) finally. As all training samples were set as the training patterns (link weights) for single-PNN classifiers, they were all correctly identified for all three classifiers in the training phase. Thus wq, j was set to 0.5 for models 1, 2 and 3, and 0.333 for fusion model 4. Table 4 showed the results of damage detection with three decision-level fusion models.
It is observed that all four decision-level multi-classifier data fusion models perform very well in detecting damage, and the average IA for all four fusion models exceeds 82% when ε ≤ 0.2%. The decision-level data-fusion model is superior to the single PNN classifier model in the damage detection of a structure owing to the data-fusion processing of redundant and complementary information. Just as expected, the IAs for all four fusion models decrease with the increase of noise level. In addition, there is no apparent change in total IAs for four different fusion models, namely, fusion models 1, 2, 3 and 4, as shown in Table 4. The fact shows that all four decision-level data-fusion models are feasible and effective in damage detection of a structure under noise conditions.
3.5. Comparison and Discussion
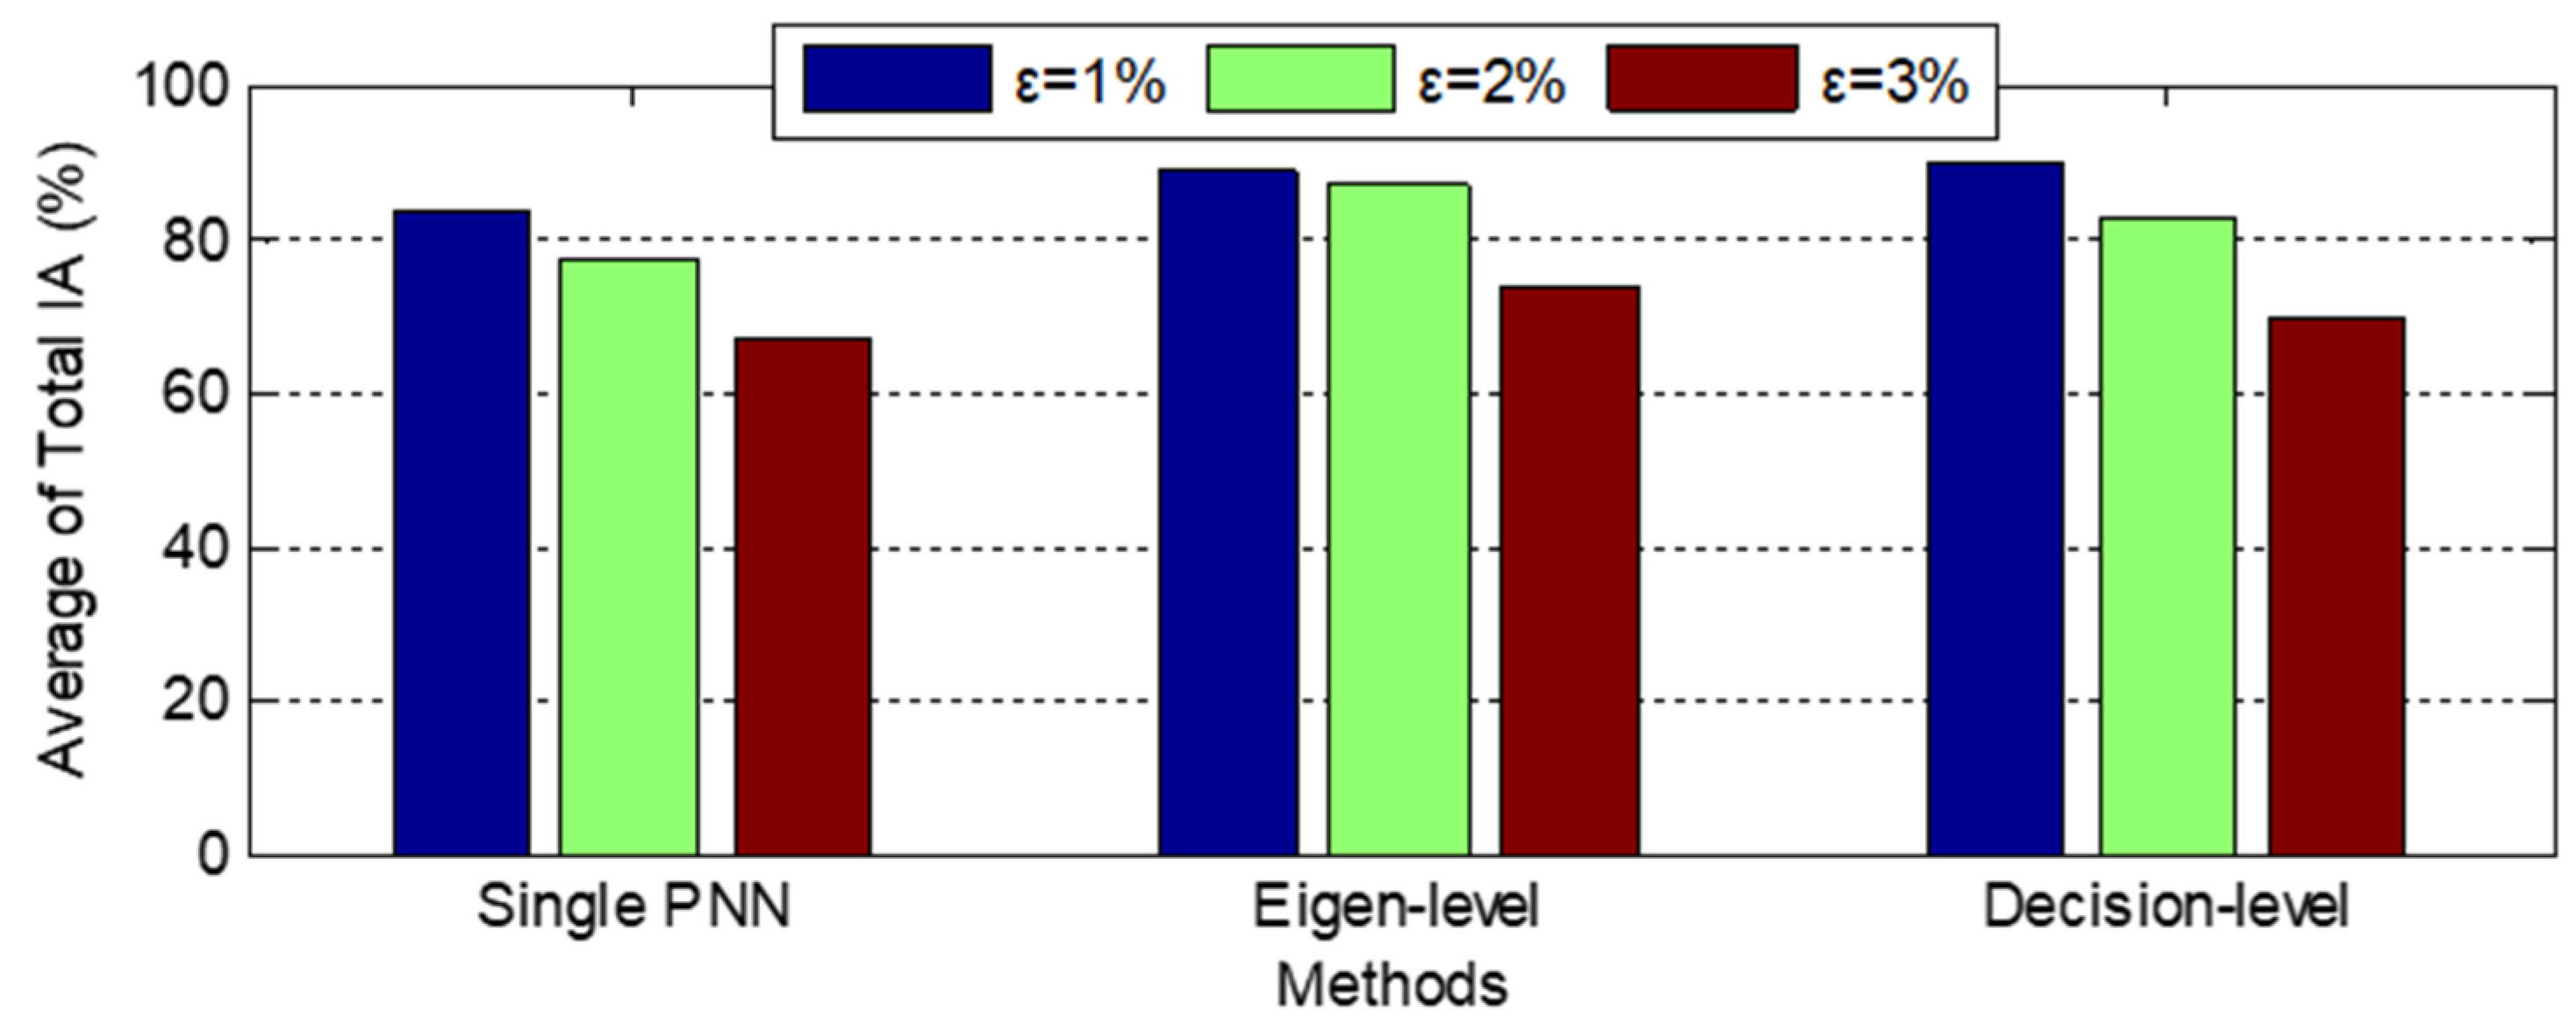
To clarify the efficiency and robustness of the proposed system, a comparison among the three models was necessary (as shown in Table 2, Table 3 and Table 4 and Figure 7), and some phenomena and deduction are found.
First, when noise level ε = 1%, it can be found that the average IA exceeds 80% for all three models of the system. Furthermore, benefiting from data-fusion processing of redundant and complementary information, the average IAs of both the eigen-level and decision-level models exceed 80% when ε = 2%, and higher than those of the single PNN model, and the maximum of average IA is as high as 89.9% in the decision-level fusion model. The comparison of identification accuracy also showed that the eigen-level fusion model is the best; on the other hand, the single PNN classifier is the worst. This conclusion confirmed again that, especially when a large structural health monitoring system contains measured data with enormous samples and uncertainties, it is very sensible to choose a fusion model of the proposed system for damage detection, because of its good damage detection capability, noise tolerance and robustness.
Second, as shown in Figure 7, it is quite clear that the IA decreases with the increase of noise levels. Nevertheless, by using of data fusion, both eigen-level and decision-level models had better performance than single PNN models. Compared with single PNN models, the increase average IA of the eigen-level fusion model are 5.2%, 9.4% and 6.7% when ε = 1%, 2% and 3%, respectively. Then, the increase values are 6.4%, 5.3% and 2.1% correspondingly for the decision-level fusion model. This confirmed that both data-fusion models have good performance at different noise levels, even with the influence of noises and a great volume. In summary, the comparison results showed that the proposed hybrid system was effective and suitable for structural damage detection.
Third, the performance of single PNN classifiers was improved remarkably in the proposed system by data-fusion. For example, among these three single classifiers, the total IA of PNN Classifier 2 was the lowest, namely, 81.5%, 73.5% and 64.25% when ε = 1%, 2% and 3%, respectively. Moreover, through the processing of data-fusion, the IA were enhanced for eigen-level fusion models at different noise levels. The same conclusions were also found in the decision-level models.
In addition, based on eigen-level and decision-level fusion, the IA values of all four patterns improve remarkably at every noise level, especially for pattern 1. Table 2, Table 3 and Table 4 showed that the minimum IAs of pattern 1 belong to different models of the proposed system. It can be found that, for pattern 1, the increment of average IA amounts to 4.4%, 7.7% and −7.3% when ε = 1%, 2% and 3%, respectively, for the eigen-level model; correspondingly, the average IA increment is 2.95%, 7.2% and 9.25%, respectively, for the decision-level model. These facts proved again that the data fusion models were suitable for damage detection, because of its good noise tolerance and robustness.
In summary, this novel proposed hybrid system is very effective for damage detection, and the highlight points are its good noise tolerance and robustness. These three intelligent models are specialized in some certain situations. The eigen-level model is specialized in the case of measured data with enormous samples and uncertainties, and for the case of confidence level of each sensor is determined ahead, the decision-level model is the best choice; the single PNN model is considered only when the data collected is somehow limited, or few sensors have been installed.
4. Experimental Validation
In order to further verify the damage identification performance and robustness of the proposed system, considering the noise and measurement errors are inevitable in actual measurement process, a seven-story steel frame structure in laboratory was selected for damage identification. Here, two damage magnitudes and three damage locations were set up for examining the capability of proposed system.
4.1. Structural Model and Damage Cases
An experimental seven-storey shear-beam type building model was employed to validate the hybrid system proposed as shown in Figure 8. The stiffness of each storey unit is k1 =…K7 = 375 KN/m; meanwhile, the mass of each storey unit is m1 =…m6 = 3.78 kg, m7 = 3.31 kg, respectively.
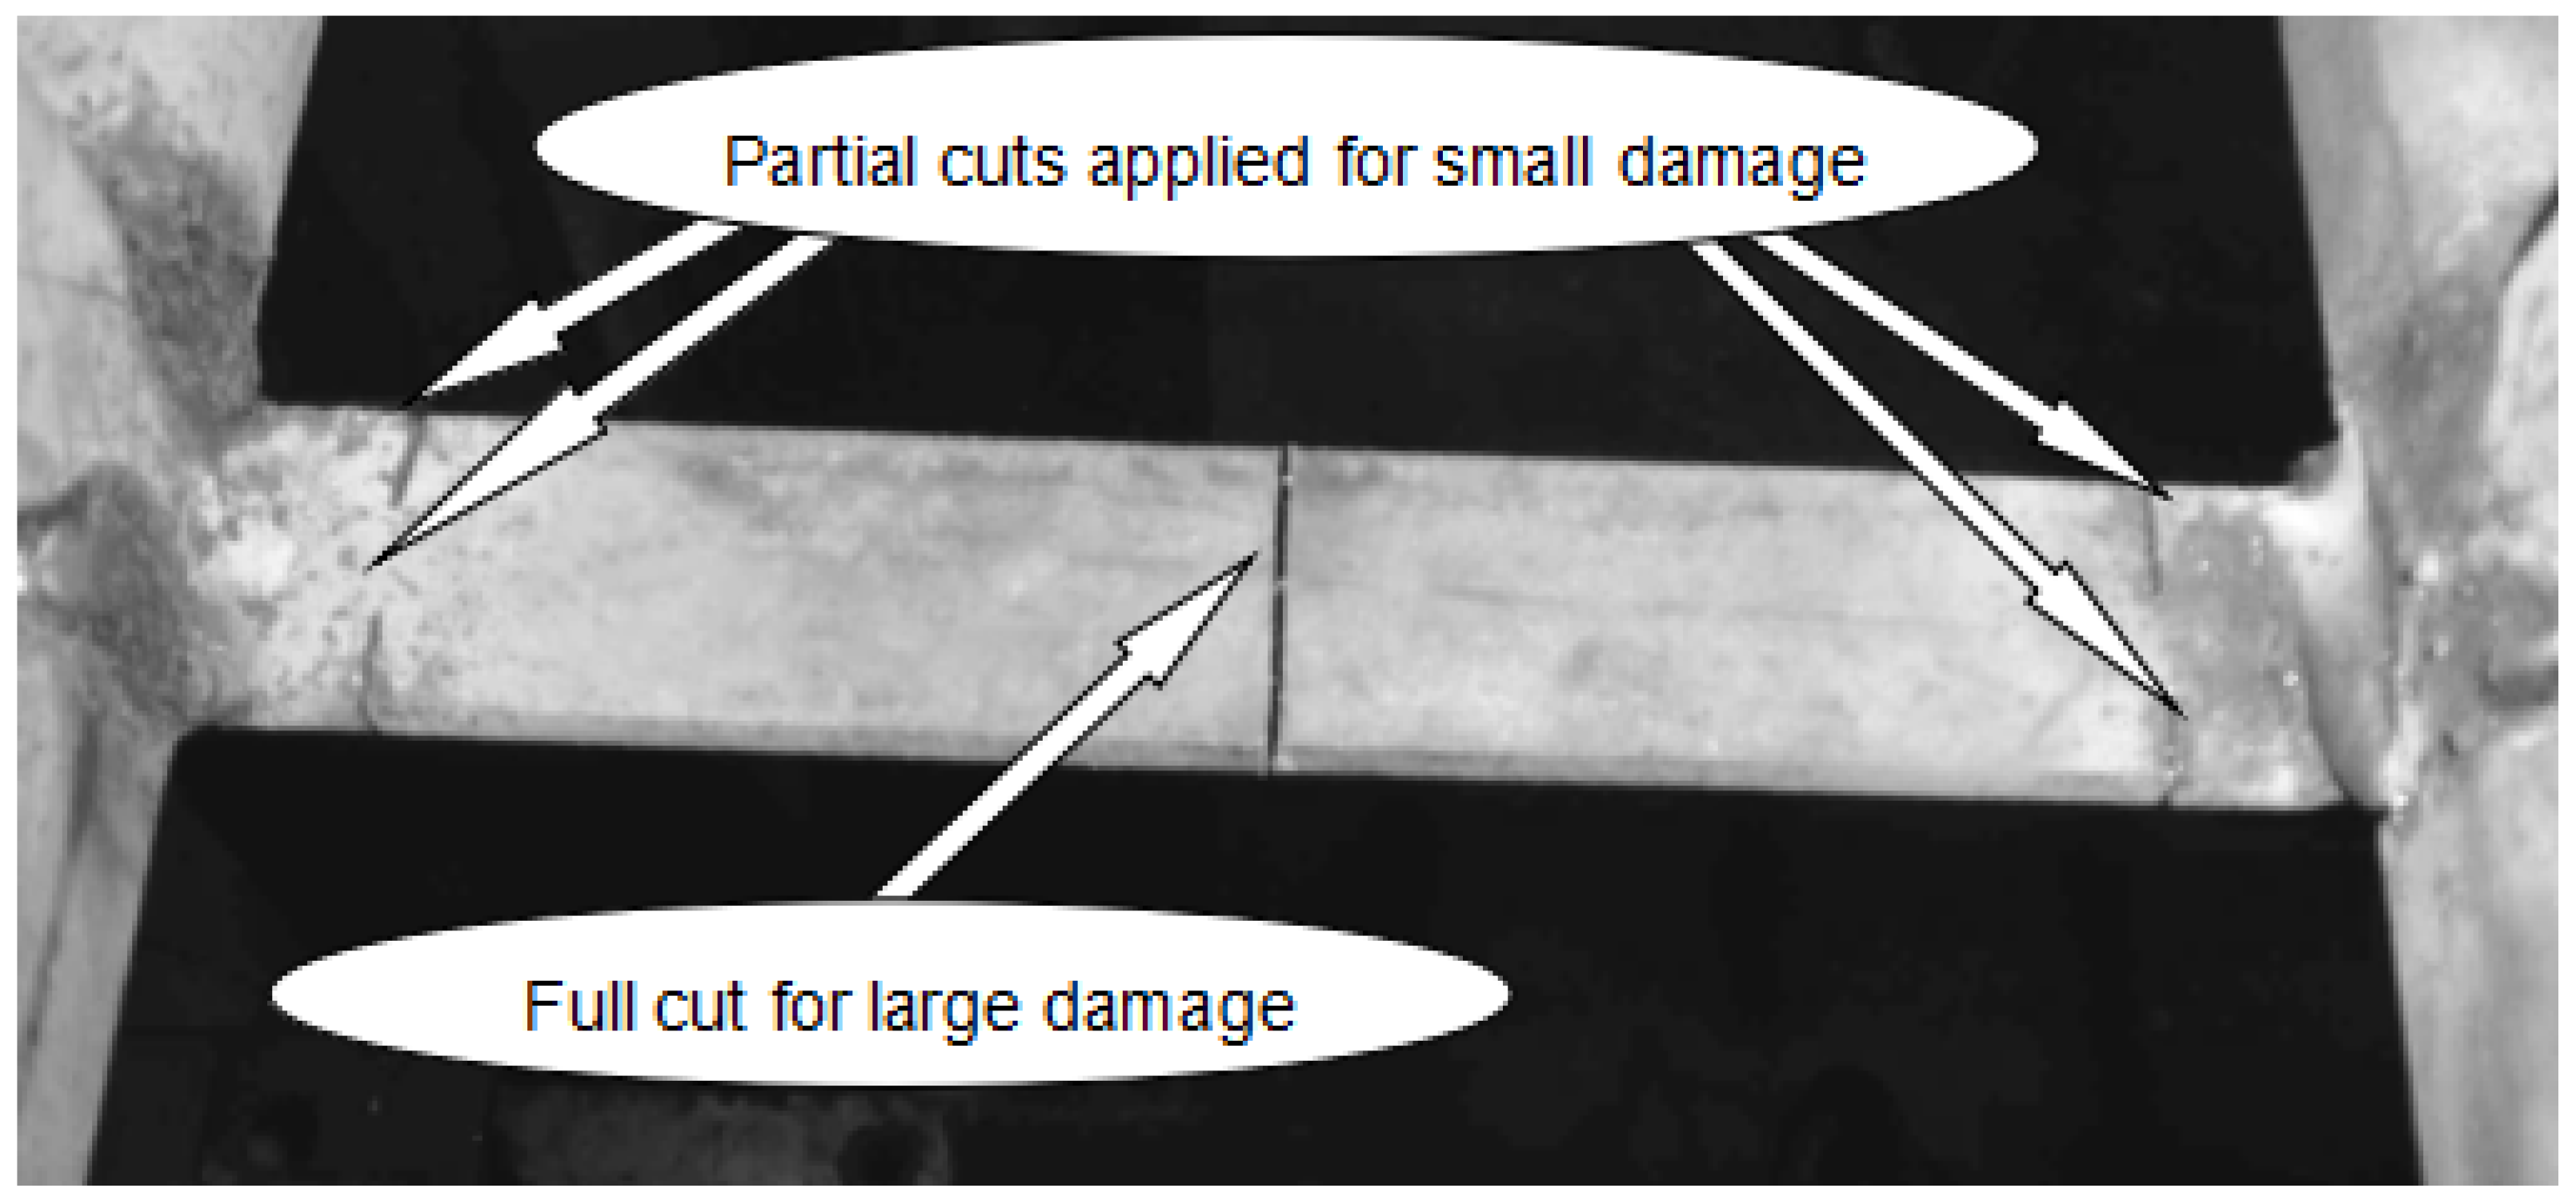
The stiffness reduction in each storey unit was used for simulating the structural damage. Here, two damage magnitudes and three damage locations were set up for examining the capability of proposed system. The damage magnitude contains two types, small damage and large damage, while the damage location was designated corresponding to storey number. The stiffness reduction of 4.1% was defined for small damage, and 16.7% for large damage (shown in Figure 9). Thus, four damage patterns are described in Table 5.
4.2. Results Analysis
Similar to the numerical simulation, calculating the correlation dimension is the first step. Equation (5) was employed to calculate the correlation dimension. Here, each storey raw measurement was used to extract the correlation dimension, so that it can obtain 200 correlation dimensions for each storey and each damage pattern, and in total obtain 1200 data sets for each damage pattern. Then 200 samples were produced (200 × 6); the first 100 sets were used to create training samples, and the others were used to create test samples, with each sample containing a six-column correlation fractal dimension. So, three PNN input vectors were obtained through dividing the six-column correlation fractal dimension into three groups, named NC1, NC2 and NC3, where each of them contains two columns, as inputs for classifier 1, 2 and 3, respectively. The process of damage identification was the same as in Section 3, so it will not be reiterated here. The identification results of the hybrid system which contains three damage identification models are shown in Table 6, Table 7 and Table 8.
Comparing Table 6, Table 7 and Table 8, it can be found that average IA was remarkably improved with the different damage identification models, which proved that the proposed hybrid system can identify the damage successfully. The total IAs have no apparent change when using four different classifiers fusion in the decision-level model. This is also proves again that, for the different feature vectors, the proposed model was insensitive. Namely, the proposed model has better robustness.
It also can be found that the IA of the three models in the hybrid system are all not very high, which may be because of the influence of noise in the measurement and measurement error, the error in the process of obtaining the correlation fractal dimension and so on. Therefore, in future study, it also needs to be improved the method of damage identification, and decrease the influence the error may have on the measurement and calculation and so on. Another study direction should be on how to eliminate the measurement noise, how to improve the IA and so on. Through these studies, good identification results will be obtained.
5. Conclusions
This paper proposed a novel hybrid data-fusion damage detection system which contained three intelligent models. The study shows that the integration of FD and PNN based on data fusion has great potential in the structural damage detection. An arch bridge model and experimental test were used to validate the efficiency and robustness of the proposed system.
The two main conclusions of the study are:
- (1)
- The proposed system has excellent damage detection capability, noise-tolerance and robustness. Its highlight is that it can offer three intelligent models, which can be selected according to a variety of actual situations.
- (2)
- The numerical simulation and experimental results show that, after the data-fusion process, both the eigen-level model and decision-level model in the proposed system can offer more precise and reliable detection results than that of a single PNN classifier.
However, the comparison between the work and SVM (support vector machine), decision tree, random forest, as well as deep learning-based method, should be done in the future. Moreover, multi-type-sensor system, multi-source information fusion algorithm and multi-signature extraction technology should also be investigated in real civil engineering in the future.
Author Contributions
Both authors took part in the discussion of the work described in this paper. C.F. wrote the paper; S.J. revised and finalized the paper. Both authors have read and agreed to the published version of the manuscript.
Funding
The work is supported by PhD Start-up Fund of Natural Science Foundation of Liaoning Province, China (Grant No. 20170520246), National Thirteenth Five-Year Key Research Projects of China (Grant No. 2020YFD1100403), and Fujian Science and Technology Planning Project (Grant No. 2017Y0412).
Institutional Review Board Statement
Not applicable.
Informed Consent Statement
Not applicable.
Data Availability Statement
The data presented in this study are available on request from the corresponding author.
Acknowledgments
The authors would also like to thank the anonymous referees for their constructive comments and suggestions.
Conflicts of Interest
The authors declare no conflict of interest.
References
- Chieffo, N.; Formisano, A. Induced seismic-site effects on the vulnerability assessment of a historical centre in the molise Region. of Italy: Analysis method and real behaviour calibration based on 2002 earthquake. Geosciences 2020, 10, 21. [Google Scholar] [CrossRef] [Green Version]
- Fan, W.; Qiao, P. Vibration-based damage identification methods: A review and comparative study. Struct. Health Monit. 2011, 10, 83–111. [Google Scholar] [CrossRef]
- Sajid, S.; Taras, A.; Chouinard, L. Defect detection in concrete plates with impulse-response test and statistical pattern recognition. Mech. Syst. Signal. Process. 2021, 161, 107948. [Google Scholar] [CrossRef]
- Cha, Y.-J.; Buyukozturk, O. Structural damage detection using modal strain energy and hybrid multiobjective optimization. Comput.-Aided. Civ. Inf. 2015, 30, 347–358. [Google Scholar] [CrossRef]
- Cha, Y.-J.; Choi, W.; Büyüköztürk, O. Deep Learning-based crack damage detection using convolutional neural networks. Comput.-Aided. Civ. Inf. 2017, 32, 361–378. [Google Scholar] [CrossRef]
- Yu, Y.; Subhani, M.; Hoshyar, A.-N. Automated health condition diagnosis of in-situ wood utility poles using an intelligent non-destructive evaluation(NDE) framework. Int. J. Struct. Stab. Dynam. 2020, 1–19. [Google Scholar] [CrossRef]
- Geng, X.-Y.; Lu, S.-Z.; Jiang, M.-S.; Sui, Q.-M.; Lv, M.-M.; Xiao, H.; Jia, Y.-X.; Jia, L. Research on FBG-Based CFRP structural damage identification using BP neural network. Photon. Sens. 2018, 8, 168–175. [Google Scholar] [CrossRef] [Green Version]
- Salehi, H.; Das, S.; Chakrabartty, S.; Biswas, S.; Burgueño, R. Structural damage identification using image-based pattern recognition on event-based binary data generated from self-powered sensor networks. Struct. Control Health Monit. 2018, 25, e2135. [Google Scholar] [CrossRef]
- Yu, Y.; Wang, C.-Y.; Gu, X.-Y.; Li, J.-C. A novel deep learning-based method for damage identification of smart building structures. Struct. Health Monit. 2019, 18, 143–163. [Google Scholar] [CrossRef] [Green Version]
- Yu, Y.; Subhani, M.; Dackermann, U.; Li, J.-C. Novel hybrid method based on advanced signal processing and soft computing techniques for condition assessment of timber utility poles. J. Aerosp. Eng. 2019, 32, 04019032. [Google Scholar] [CrossRef]
- Wu, J.D.; Kuo, J.M. An automotive generator fault diagnosis system using discrete wavelet transform and artificial neural network. Expert Syst. Appl. 2009, 36, 9776–9783. [Google Scholar] [CrossRef]
- Pentland, A.P. Fractal-based description of natural scenes. IEEE Trans. Pattern Anal. Mach. Intel. 1984, PAMI-6, 661–674. [Google Scholar] [CrossRef]
- Bai, R.B.; Ostachowicz, W.; Cao, M.S.; Su, Z. Crack detection in beams in noisy conditions using scale fractal dimension analysis of mode shapes. Smart Mater. Struct. 2014, 23, 065014. [Google Scholar] [CrossRef]
- Li, H.; Huang, Y.; Ou, J.-P.; Bao, Y.-Q. Fractal dimension-based damage detection method for beams with a uniform cross-section. Comput.-Aided Civ. Inf. 2011, 26, 190–206. [Google Scholar] [CrossRef]
- Cao, M.-S.; Ostachowicz, W.; Bai, R.-B.; Radzienski, M. Fractal mechanism for characterizing singularity of mode shape for damage detection. Appl. Phys. Lett. 2013, 103, 221906. [Google Scholar] [CrossRef]
- Asvestas, P.; Matsopoulos, G.K.; Nikita, K.S. A power differentiation method of fractal dimension estimation for 2-D signals. J. Vis. Commun. Image R. 1998, 9, 392–400. [Google Scholar] [CrossRef] [Green Version]
- Nisa, M.; Shah, J.H.; Kanwal, S.; Raza, M.; Khan, M.A.; Damasevicius, R.; Blazauskas, T. Hybrid. malware classification method using segmentation-based fractal texture analysis and deep convolution neural network features. Appl. Sci. 2020, 10, 4966. [Google Scholar] [CrossRef]
- Lei, Y.; Zhang, Y.-X.; Mi, J.-N.; Liu, W.-F.; Liu, L.-J. Detecting structural damage under unknown seismic excitation by deep convolutional neural network with wavelet-based transmissibility data. Struct. Health Monit. 2021, 20, 1583–1596. [Google Scholar] [CrossRef]
- Yao, Y.; Wang, N. Fault diagnosis model of adaptive miniature circuit breaker based on fractal theory and probabilistic neural network. Mech. Syst. Signal. Process. 2020, 142, 106772. [Google Scholar] [CrossRef]
- Mohammed, M.-A.; Al-Khateeb, B.; Rashid, A.-N.; Ibrahim, D.A.; Ghani, M.K.A.; Mostafa, S.A. Neural network and multi-fractal dimension features for breast cancer classification from ultrasound images. Comput. Electr. Eng. 2018, 70, 871–882. [Google Scholar] [CrossRef]
- Lecun, Y.; Bengio, Y.; Hinton, G. Deep Learning. Nature 2015, 521, 436–444. [Google Scholar] [CrossRef] [PubMed]
- Guo, Y.; Liu, Y.; Oerlemans, A.; Lao, S.-Y.; Lew, M.S. Deep learning for visual understanding: A review. Neurocomputing 2016, 187, 27–48. [Google Scholar] [CrossRef]
- Broock, W.A.; Scheinkman, J.-A.; Dechert, W.-D.; Lebaron, B. A test for independence based on the correlation dimension. Economet. Rev. 1996, 15, 197–235. [Google Scholar] [CrossRef]
- Specht, D.F. Probabilistic neural networks. Int. J. Neural Netw. 1990, 3, 109–118. [Google Scholar] [CrossRef]
- Jiang, S.-F.; Fu, C.; Zhang, C.-M.; Wu, Z.-Q. A revised counter-propagation network model integrating rough set for structural damage detection. Int. J. Distrib. Sens. Netw. 2013, 9, 850712. [Google Scholar] [CrossRef]
Figure 1.
Architecture of the hybrid data-fusion system.

Figure 2.
Single PNN classifier model for damage detection.

Figure 3.
Eigen-level data fusion model for damage detection.

Figure 4.
Hong Fu bridge in Dong Wan.

Figure 5.
The element model of the arch bridge.

Figure 6.
The number of an arch rib element.

Figure 7.
Performance comparison of three models.

Figure 8.
Seven-storey steel frame model.

Figure 9.
Schematic diagram of damage magnitude.


Table 1.
Four damage conditions of arch bridge.
| Damage Conditions | Damage Location | Damage Levels |
|---|---|---|
| 1 | Arch rib element 5 | 50% |
| 2 | Arch rib element 5 | 80% |
| 3 | Arch rib element 5 and 13 | 50% |
| 4 | Arch rib element 5 and 13 | 80% |
Table 2.
Single PNN classifier identification results.
| Noise Level ε (%) | PNNClassifier | IA of Testing Samples for Each Pattern (%) | Total IA (%) | Average of Total IA (%) | |||
|---|---|---|---|---|---|---|---|
| Pattern 1 | Pattern 2 | Pattern 3 | Pattern 4 | ||||
| 1 | 1 (NC1) | 82 | 95 | 87 | 68 | 83 | 83.5 |
| 2 (NC2) | 79 | 93 | 86 | 68 | 81.5 | ||
| 3 (NC3) | 83 | 91 | 89 | 81 | 86 | ||
| 2 | 1 (NC1) | 85 | 91 | 75 | 83 | 83.5 | 77.5 |
| 2 (NC2) | 70 | 82 | 77 | 65 | 73.5 | ||
| 3 (NC3) | 74 | 78 | 79 | 71 | 75.5 | ||
| 3 | 1 (NC1) | 53 | 71 | 70 | 75 | 67.25 | 67.1 |
| 2 (NC2) | 37 | 71 | 67 | 82 | 64.25 | ||
| 3 (NC3) | 48 | 79 | 65 | 87 | 69.75 | ||
Table 3.
Identification results of eigen-level fusion model.
| Noise Level ε (%) | Eigen Fusion Method | IA of Testing Samples for Each Pattern (%) | Total IA (%) | Average of Total IA (%) | |||
|---|---|---|---|---|---|---|---|
| Pattern 1 | Pattern 2 | Pattern 3 | Pattern 4 | ||||
| 1 | 1 (NC1 + NC2) | 82 | 94 | 96 | 71 | 85.75 | 88.7 |
| 2 (NC2 + NC3) | 88 | 98 | 96 | 78 | 90 | ||
| 3 (NC1 + NC3) | 87 | 97 | 93 | 84 | 90.25 | ||
| 2 | 1 (NC1 + NC2) | 85 | 88 | 86 | 83 | 85.5 | 86.9 |
| 2 (NC2 + NC3) | 81 | 86 | 90 | 81 | 84.5 | ||
| 3 (NC1 + NC3) | 86 | 93 | 96 | 88 | 90.75 | ||
| 3 | 1 (NC1 + NC2) | 26 | 89 | 82 | 75 | 68 | 73.8 |
| 2 (NC2 + NC3) | 57 | 90 | 87 | 82 | 79 | ||
| 3 (NC1 + NC3) | 33 | 92 | 91 | 81 | 74.25 | ||
Table 4.
Identification results of decision-level fusion models.
| Noise Level ε (%) | Classifiers Fusion Method | IA of Testing Samples for Each Pattern (%) | Total IA (%) | Average of Total IA (%) | |||
|---|---|---|---|---|---|---|---|
| Pattern 1 | Pattern 2 | Pattern 3 | Pattern 4 | ||||
| 1 | 1 (Classifiers 1 + 2) | 83 | 98 | 88 | 86 | 88.75 | 89.9 |
| 2 (Classifiers 2 + 3) | 85 | 97 | 91 | 88 | 90.25 | ||
| 3 (Classifiers 1 + 3) | 83 | 96 | 87 | 91 | 89.25 | ||
| 4 (Classifiers 1 + 2 + 3) | 86 | 98 | 88 | 94 | 91.5 | ||
| 2 | 1 (Classifiers 1 + 2) | 84 | 87 | 82 | 71 | 81 | 82.8 |
| 2 (Classifiers 2 + 3) | 76 | 82 | 89 | 72 | 79.5 | ||
| 3 (Classifiers 1 + 3) | 85 | 85 | 90 | 79 | 84.75 | ||
| 4 (Classifiers 1 + 2 + 3) | 89 | 88 | 91 | 75 | 85.75 | ||
| 3 | 1 (Classifiers 1 + 2) | 57 | 75 | 66 | 75 | 68.25 | 69.2 |
| 2 (Classifiers 2 + 3) | 47 | 73 | 65 | 79 | 66 | ||
| 3 (Classifiers 1 + 3) | 64 | 78 | 71 | 81 | 73.5 | ||
| 4 (Classifiers 1 + 2 + 3) | 53 | 78 | 71 | 74 | 69 | ||
Table 5.
Magnitudes and locations of damage.
| Pattern Class | Small Damage | Large Damage |
|---|---|---|
| Pattern 1 | 4th storey | |
| Pattern 2 | 6th storey | 4th storey |
| Pattern 3 | 3rd and 6th storeys | 4th storey |
| Pattern 4 | 3rd, 4th and 6th storeys |
Table 6.
Identification results of using single PNN classifier model.
| PNN Classifier | IA of Testing Samples for Each Pattern (%) | Total IA (%) | Average of Total IA (%) | |||
|---|---|---|---|---|---|---|
| Pattern 1 | Pattern 2 | Pattern 3 | Pattern 4 | |||
| 1 (NC1) | 69 | 74 | 83 | 94 | 80 | 79.2 |
| 2 (NC2) | 71 | 71 | 81 | 93 | 79 | |
| 3 (NC3) | 68 | 73 | 82 | 91 | 78.5 | |
Table 7.
Identification results of eigen-level fusion model.
| Eigen Fusion Method | IA of Testing Samples for Each Pattern (%) | Total IA (%) | Average of Total IA (%) | |||
|---|---|---|---|---|---|---|
| Pattern 1 | Pattern 2 | Pattern 3 | Pattern 4 | |||
| 1 (NC1 + NC2) | 77 | 79 | 89 | 97 | 85.5 | 84.0 |
| 2 (NC2 + NC3) | 75 | 77 | 89 | 93 | 83.5 | |
| 3 (NC1 + NC3) | 76 | 77 | 84 | 95 | 83 | |
Table 8.
Identification results of decision-level with fractal correlation dimension.
| Classifiers Fusion Method | IA of Testing Samples for Each Pattern (%) | Total IA (%) | Average of Total IA (%) | |||
|---|---|---|---|---|---|---|
| Pattern 1 | Pattern 2 | Pattern 3 | Pattern 4 | |||
| 1 (Classifiers 1 + 2) | 87 | 85 | 96 | 99 | 91.75 | 89.9 |
| 2 (Classifiers 2 + 3) | 83 | 81 | 94 | 97 | 88.75 | |
| 3 (Classifiers 1 + 3) | 83 | 86 | 91 | 97 | 89.25 | |
| 4 (Classifiers 1 + 2 + 3) | 85 | 83 | 93 | 98 | 89.75 | |
Publisher’s Note: MDPI stays neutral with regard to jurisdictional claims in published maps and institutional affiliations. |
© 2021 by the authors. Licensee MDPI, Basel, Switzerland. This article is an open access article distributed under the terms and conditions of the Creative Commons Attribution (CC BY) license (https://creativecommons.org/licenses/by/4.0/).
Share and Cite
MDPI and ACS Style
Fu, C.; Jiang, S. A Hybrid Data-Fusion System by Integrating CFD and PNN for Structural Damage Identification. Appl. Sci. 2021, 11, 8272. https://0-doi-org.brum.beds.ac.uk/10.3390/app11178272
AMA Style
Fu C, Jiang S. A Hybrid Data-Fusion System by Integrating CFD and PNN for Structural Damage Identification. Applied Sciences. 2021; 11(17):8272. https://0-doi-org.brum.beds.ac.uk/10.3390/app11178272
Chicago/Turabian StyleFu, Chun, and Shaofei Jiang. 2021. "A Hybrid Data-Fusion System by Integrating CFD and PNN for Structural Damage Identification" Applied Sciences 11, no. 17: 8272. https://0-doi-org.brum.beds.ac.uk/10.3390/app11178272
Note that from the first issue of 2016, this journal uses article numbers instead of page numbers. See further details here.