
Fast UHPLC-MS/MS for the Simultaneous Determination of Azithromycin, Erythromycin, Fluoxetine and Sotalol in Surface Water Samples


Abstract
:1. Introduction
2. Materials and Methods
2.1. Chemicals and Reagents
2.2. Preparation of Stock Solutions and Samples
2.3. Instrumental Analysis
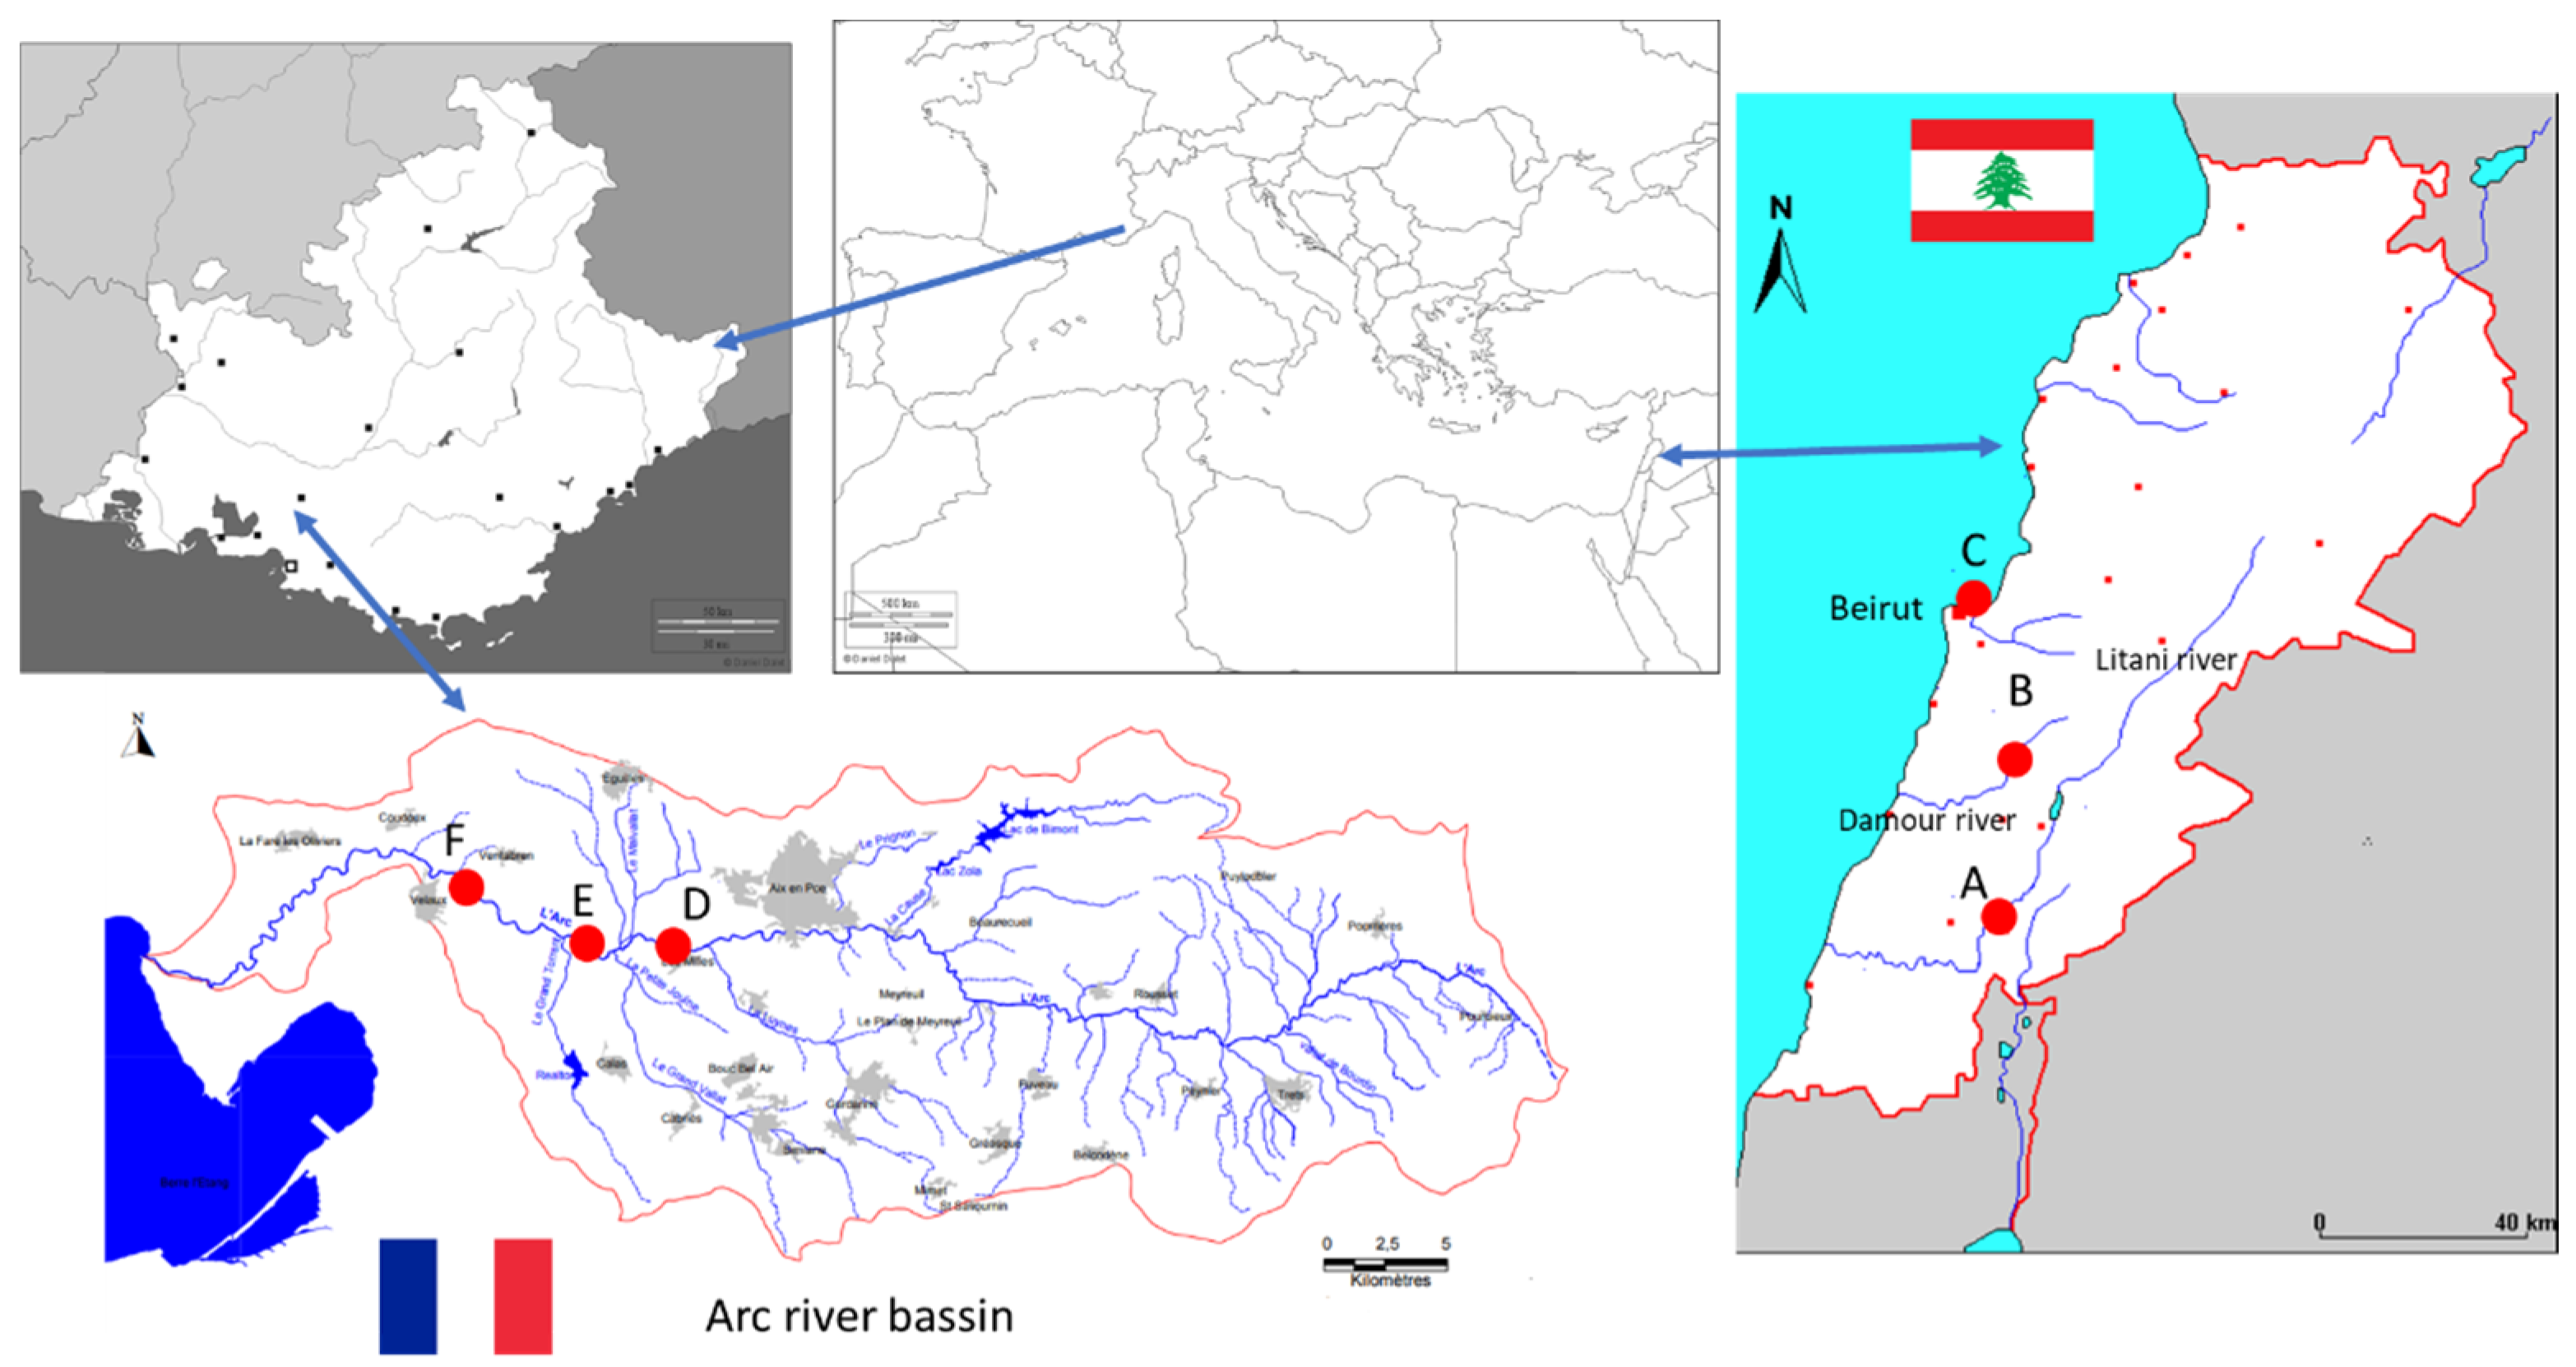
2.4. Sampling Sites and Sample Collection
3. Results and Discussions
3.1. Method Development
3.2. Analytical Features
3.3. Application to Real Field Samples
4. Conclusions
Author Contributions
Funding
Institutional Review Board Statement
Informed Consent Statement
Acknowledgments
Conflicts of Interest
Appendix A

| Column | CORTECS C-18 | BEH C-18 | Luna Omega C-18 | ||||||
|---|---|---|---|---|---|---|---|---|---|
| Compound | RS | RT (min) | Width (min) | RS | RT (min) | Width (min) | RS | RT (min) | Width (min) |
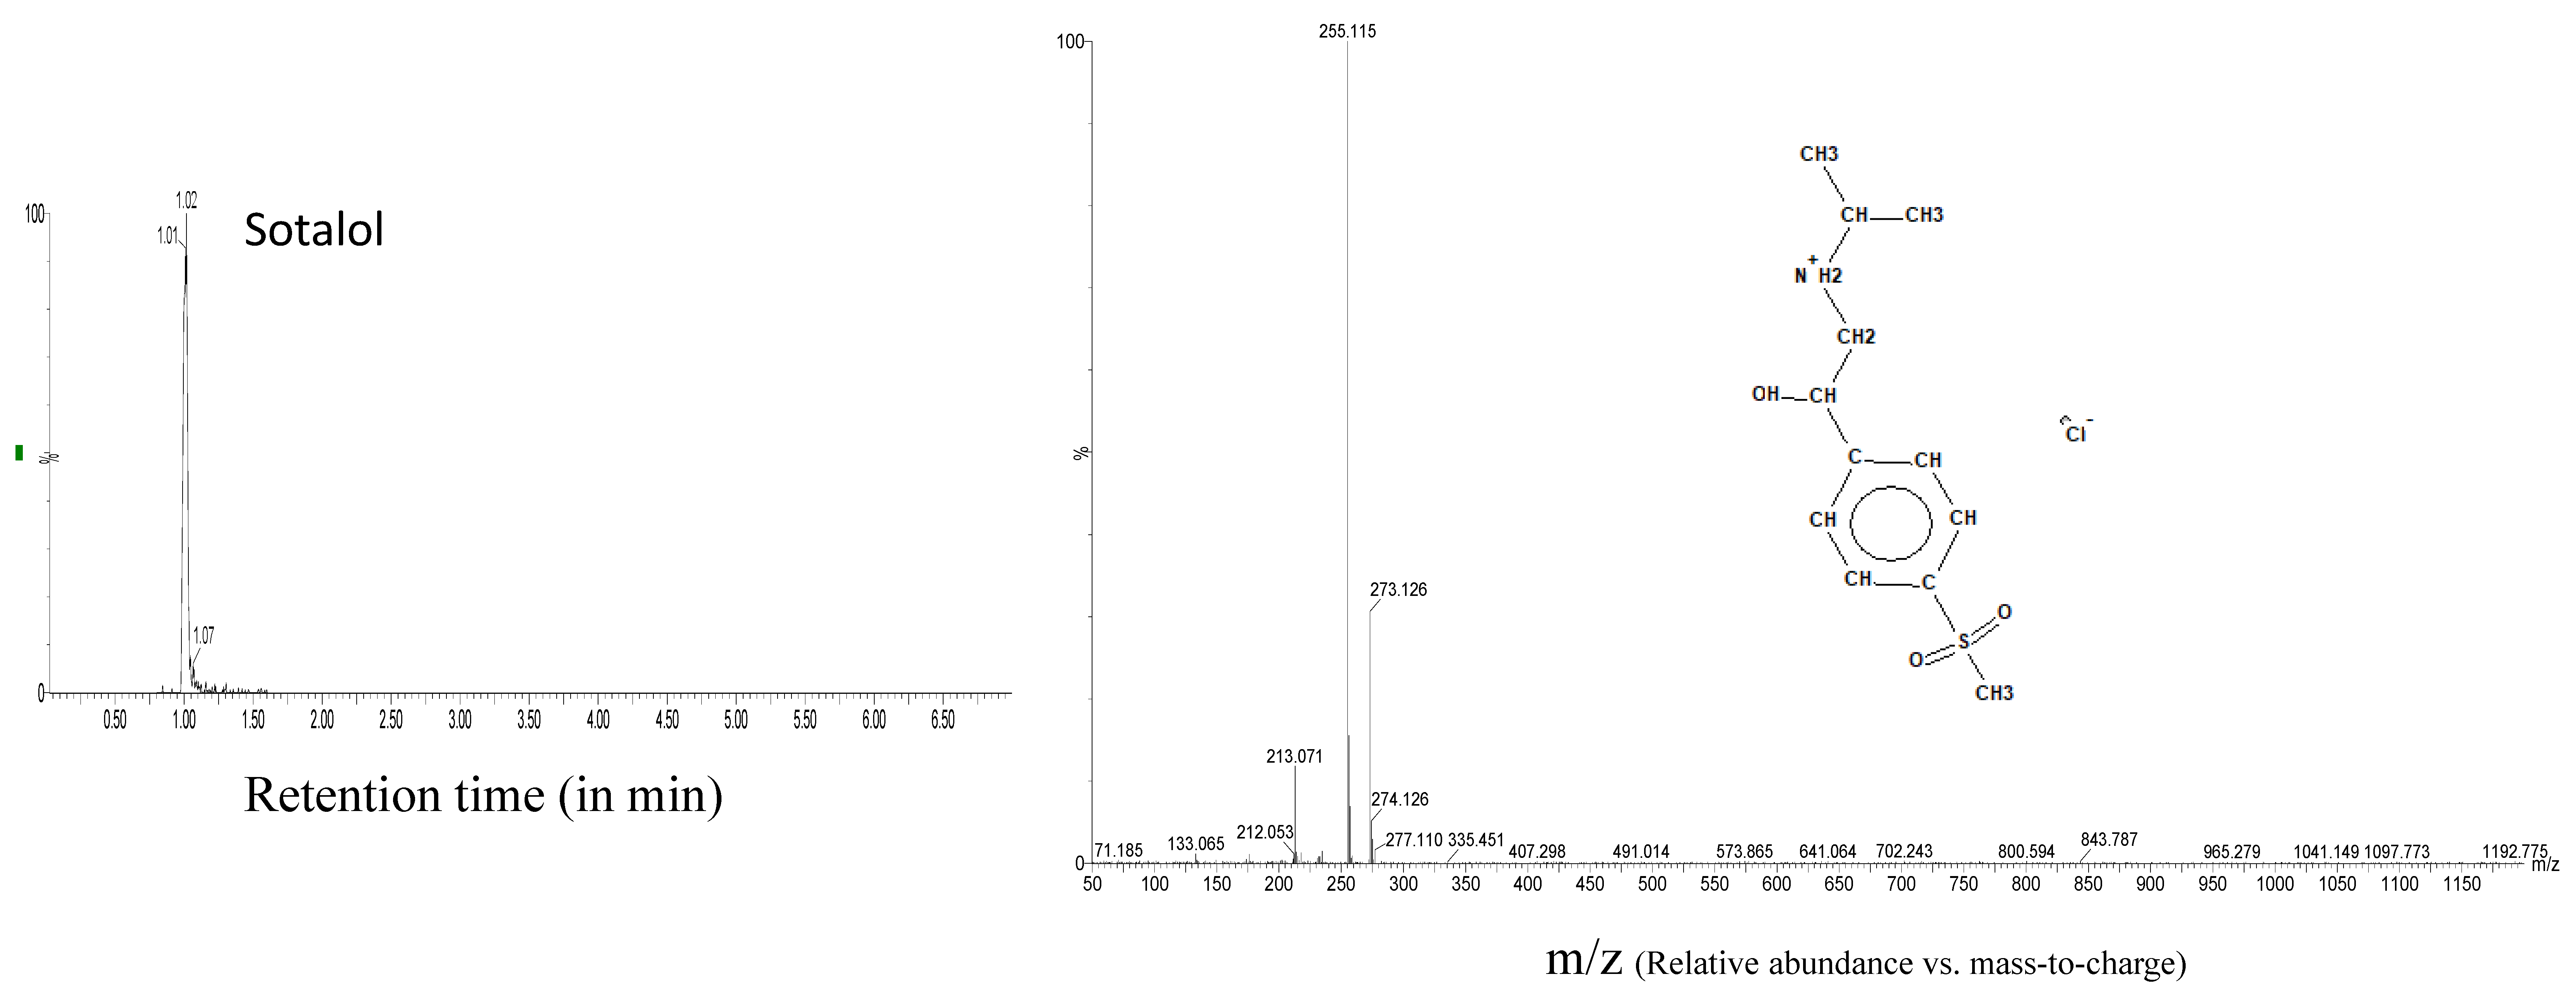
| Sotalol | 5.2 | 0.02 | 6.8 | 0.03 | 1.02 | 0.01 | |||
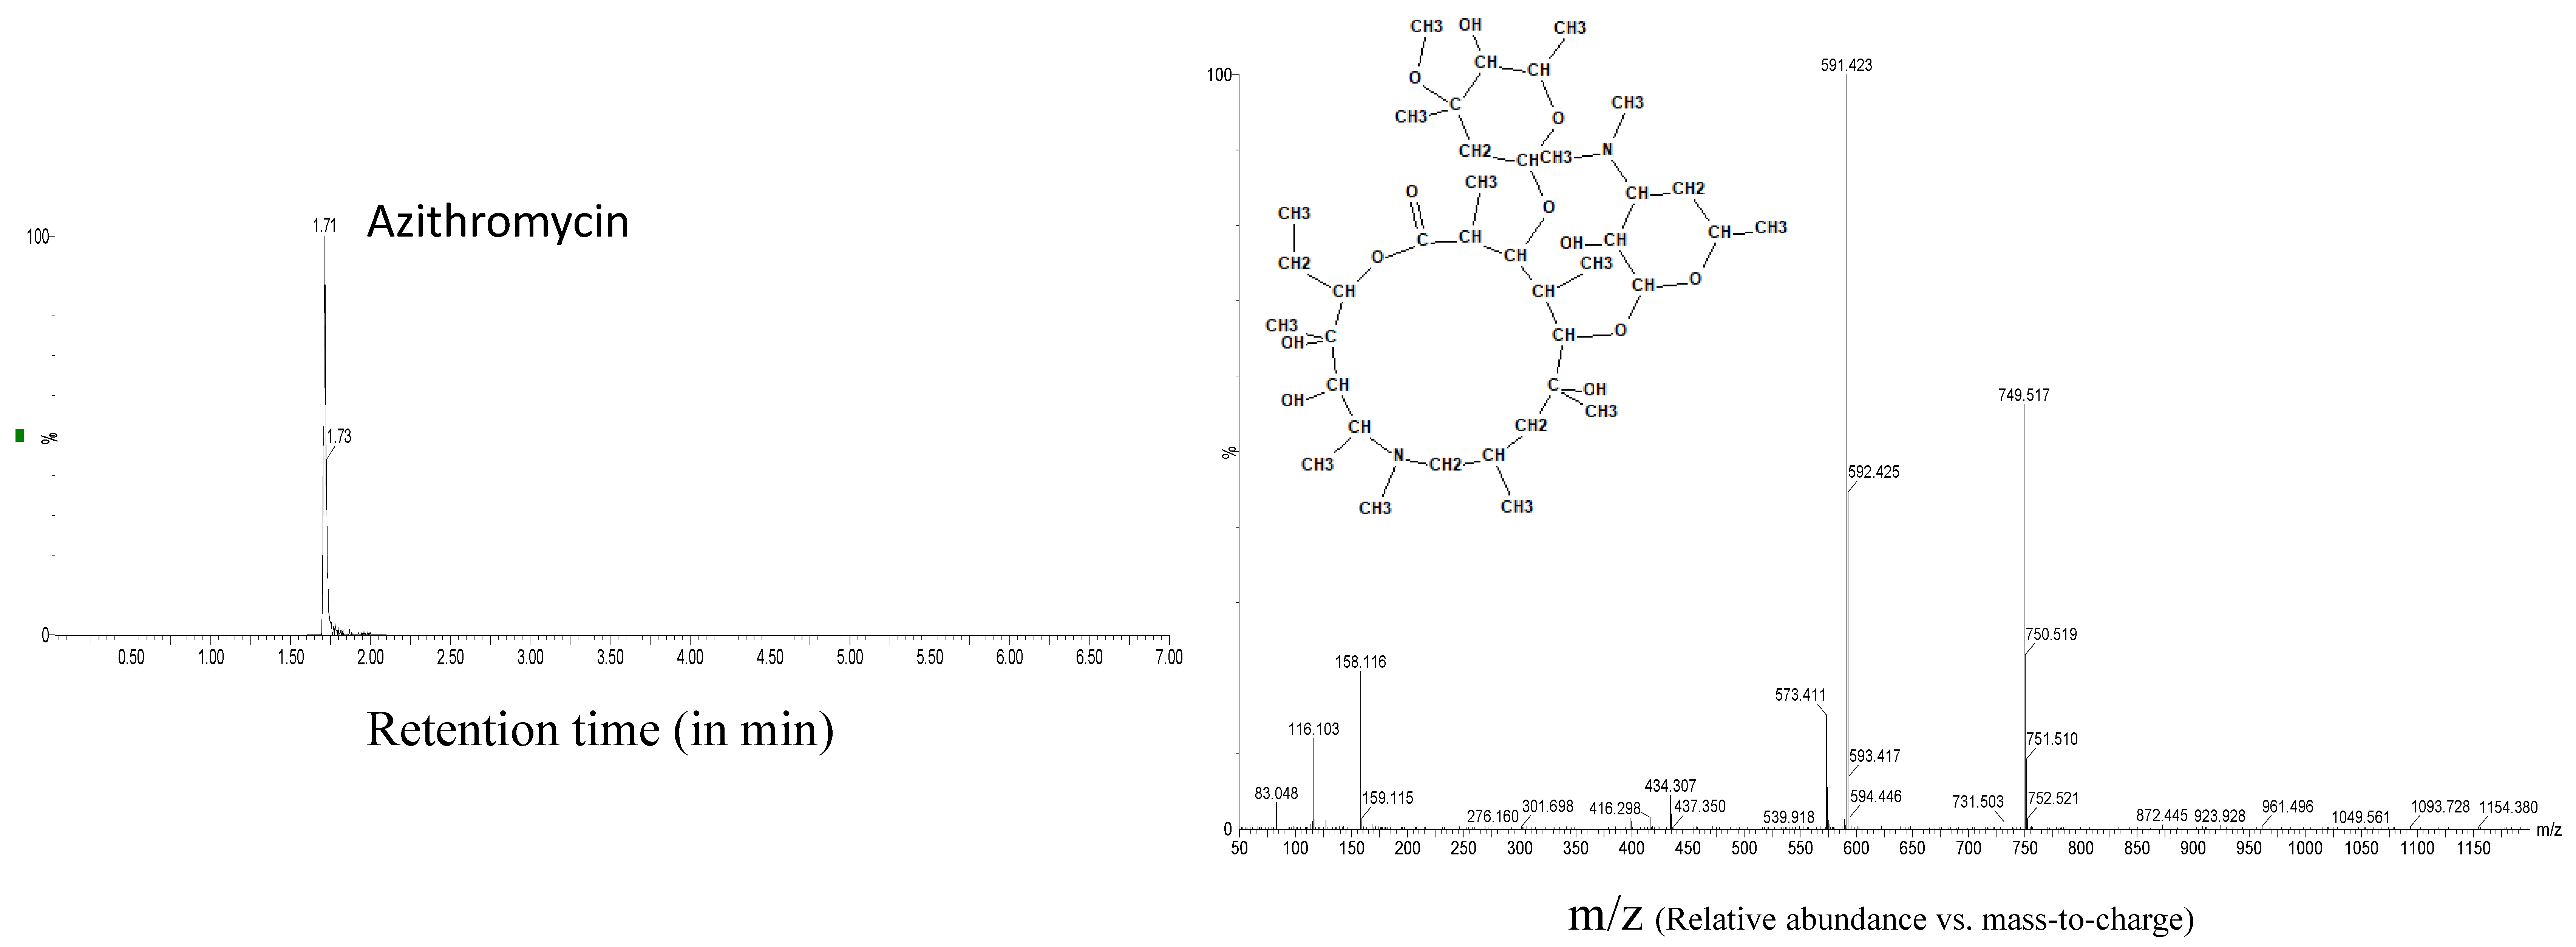
| Azithromycin | 6.9 | 6.3 | 0.30 | 4.6 | 7.9 | 0.45 | 8.6 | 1.71 | 0.15 |
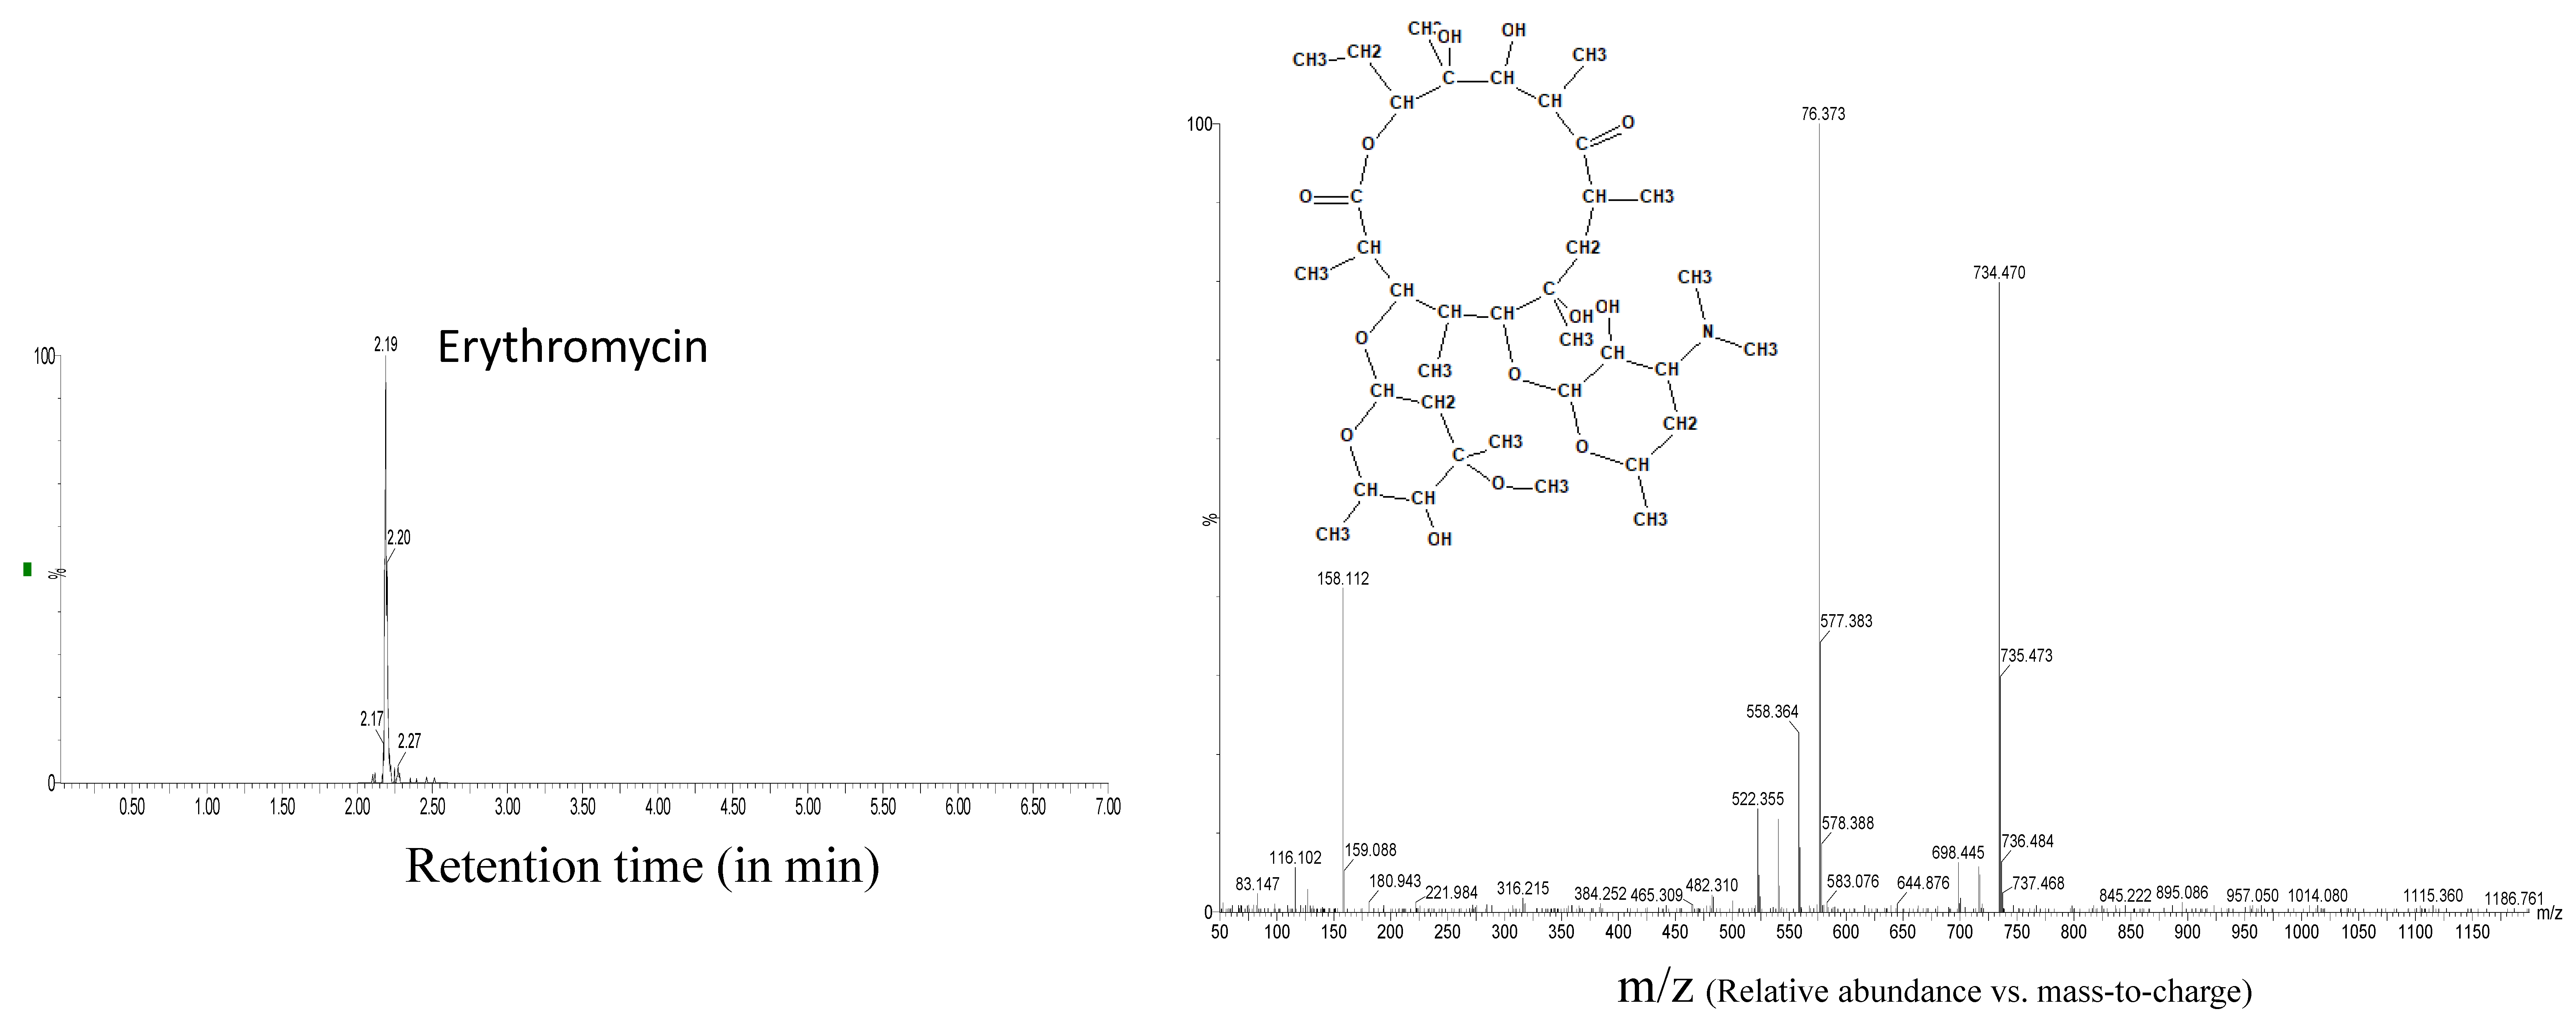
| Erythromycin | 2.6 | 7.2 | 0.40 | 0.8 | 8.3 | 0.57 | 5.0 | 2.19 | 0.04 |
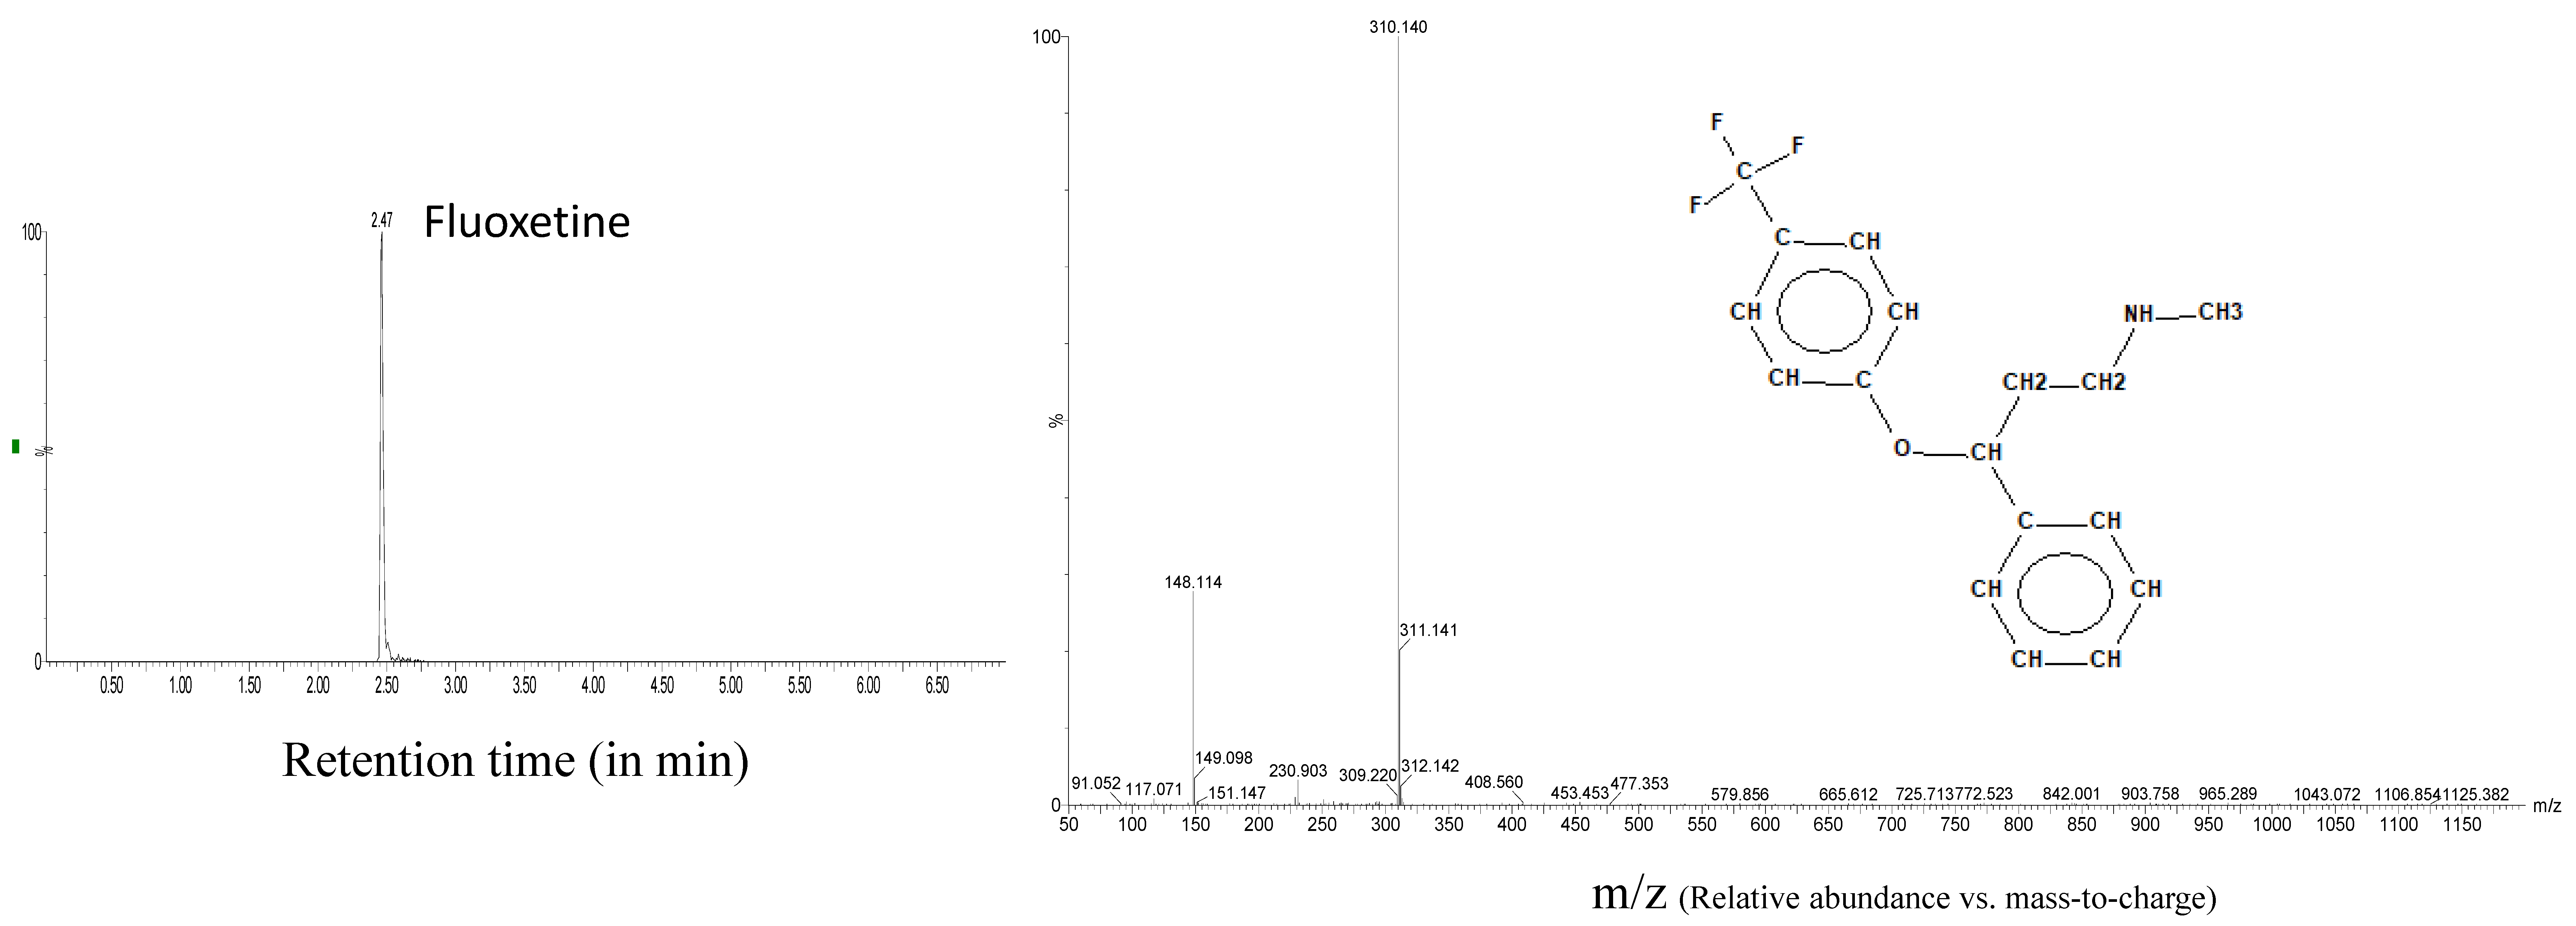
| Fluoxetine | 3.5 | 8 | 0.05 | 9.6 | 12 | 0.2 | 11.2 | 2.47 | 0.01 |
Appendix B


References
- Richardson, S.D.; Kimura, S.Y. Emerging environmental contaminants: Challenges facing our next generation and potential engineering solutions. Environ. Technol. Innov. 2017, 8, 40–56. [Google Scholar] [CrossRef]
- Beckers, L.M.; Brack, W.; Dann, J.P.; Krauss, M.; Müller, E.; Schulze, T. Unraveling longitudinal pollution patterns of organic micropollutants in a river by non-target screening and cluster analysis. Sci. Total Environ. 2020, 727, 138388. [Google Scholar] [CrossRef]
- Müller, M.E.; Werneburg, M.; Glaser, C.; Schwientek, M.; Zarfl, C.; Escher, B.I.; Zwiener, C. Influence of Emission Sources and Tributaries on the Spatial and Temporal Patterns of Micropollutant Mixtures and Associated Effects in a Small River. Environ. Toxicol. Chem. 2020, 39, 1382–1391. [Google Scholar] [CrossRef]
- Tosun, J.; Schaub, S.; Fleig, A. What determines regulatory preferences? Insights from micropollutants in surface waters. Environ. Sci. Policy 2020, 106, 136–144. [Google Scholar] [CrossRef]
- Zahn, D.; Neuwald, I.J.; Knepper, T.P. Analysis of mobile chemicals in the aquatic environment-current capabilities, limitations and future perspectives. Anal. Bioanal. Chem. 2020, 412, 4763–4784. [Google Scholar] [CrossRef]
- Arlos, M.J.; Schürz, F.; Fu, Q.; Lauper, B.B.; Stamm, C.; Hollender, J. Coupling river concentration simulations with a toxicokinetic model effectively predicts the internal concentrations of wastewater-derived micropollutants in field gammarids. Environ. Sci. Technol. 2020, 54, 1710–1719. [Google Scholar] [CrossRef] [Green Version]
- Gros, M.; Petrović, M.; Barceló, D. Development of a multi-residue analytical methodology based on liquid chromatography-tandem mass spectrometry (LC-MS/MS) for screening and trace level determination of pharmaceuticals in surface and wastewaters. Talanta 2006, 70, 678–690. [Google Scholar] [CrossRef]
- Roig, B.; Greenwood, R.; Barcelò, D. An international conference on pharmaceuticals in the environment in a frame of EU Knappe project. Environ. Int. 2009, 35, 763–765. [Google Scholar] [CrossRef] [PubMed]
- Pal, A.; Gin, K.Y.H.; Lin, A.Y.C.; Reinhard, M. Impacts of emerging organic contaminants on freshwater resources: Review of recent occurrences, sources, fate and effects. Sci. Total Environ. 2010, 408, 6062–6069. [Google Scholar] [CrossRef] [PubMed]
- Guardabassi, L.; Petersen, A.; Olsen, J.E.; Dalsgaard, A. Antibiotic resistance in Acinetobacter spp. isolated from sewers receiving waste effluent from a hospital and a pharmaceutical plant. Appl. Environ. Microbiol. 1998, 64, 3499–3502. [Google Scholar] [CrossRef] [PubMed] [Green Version]
- Michael, I.; Rizzo, L.; McArdell, C.S.; Manaia, C.M.; Merlin, C.; Schwartz, T.; Dagot, C.; Fatta-Kassinos, D. Urban wastewater treatment plants as hotspots for the release of antibiotics in the environment: A review. Water Res. 2013, 47, 957–995. [Google Scholar] [CrossRef] [Green Version]
- Fent, K.; Weston, A.A.; Caminada, D. Ecotoxicology of human pharmaceuticals. Aquat. Toxicol. 2006, 76, 122–159. [Google Scholar] [CrossRef] [PubMed]
- Huerta-Fontela, M.; Galceran, M.T.; Ventura, F. Illicit drugs in the urban water cycle. In Xenobiotics in the Urban Water Cycle; Fatta-Kassinos, D., Bester, K., Kümmerer, K., Eds.; Springer: Berlin/Heidelberg, Germany, 2010; pp. 51–71. [Google Scholar]
- Cao, J.; Fu, B.; Zhang, T.; Wu, Y.; Zhou, Z.; Zhao, J.; Yang, E.; Qian, T.; Luo, J. Fate of typical endocrine active compounds in full-scale wastewater treatment plants: Distribution, removal efficiency and potential risks. Bioresour. Technol. 2020, 310, 123436. [Google Scholar] [CrossRef]
- Monson, C.; Young, G.; Schultz, I. In vitro exposure of vitellogenic rainbow trout ovarian follicles to endocrine disrupting chemicals can alter basal estradiol-17β production and responsiveness to a gonadotropin challenge. Aquat. Toxicol. 2019, 217, 105346. [Google Scholar] [CrossRef]
- Godoy, A.A.; de Oliveira, A.C.; Silva, J.G.M.; Azevedo, C.C.d.J.; Domingues, I.; Nogueira, A.J.A.; Kummrow, F. Single and mixture toxicity of four pharmaceuticals of environmental concern to aquatic organisms, including a behavioral assessment. Chemosphere 2019, 235, 373–382. [Google Scholar] [CrossRef]
- Oliveira, T.S.; Murphy, M.; Mendola, N.; Wong, V.; Carlson, D.; Waring, L. Characterization of pharmaceuticals and personal care products in hospital effluent and wastewater influent/effluent by direct-injection LC-MS-MS. Sci. Total Environ. 2015, 518–519, 459–478. [Google Scholar] [CrossRef] [PubMed]
- Neto, J.B.A.; Josino, M.A.A.; da Silva, C.R.; Campos, R.S.; do Nascimento, F.B.S.A.; Sampaio, L.S.; Valente Sá, L.G.d.A.; Carneiro, I.S.; Barroso, F.D.D.; da Silva, L.J.; et al. A mechanistic approach to the in-vitro resistance modulating effects of fluoxetine against meticillin resistant Staphylococcus aureus strains. Microb. Pathog. 2019, 127, 335–340. [Google Scholar] [CrossRef] [PubMed]
- Mansour, F.; Al-Hindi, M.; Saada, W.; Salamb, D. Environmental risk analysis and prioritization of pharmaceuticals in a developing world context. Sci. Total Environ. 2016, 557–558, 31–43. [Google Scholar] [CrossRef] [PubMed]
- Al Aukidy, M.; Verlicchi, P.; Voulvoulis, N. A framework for the assessment of the environmental risk posed by pharmaceuticals originating from hospital effluents. Sci. Total Environ. 2015, 493, 54–64. [Google Scholar] [CrossRef] [PubMed]
- Li, Y.; Zhang, L.; Ding, J.; Liu, X. Prioritization of pharmaceuticals in water environment in China based on environmental criteria and risk analysis of top-priority pharmaceuticals. J. Environ. Manag. 2020, 253, 109732. [Google Scholar] [CrossRef] [PubMed]
- Kümmerer, K. Antibiotics in the aquatic environment—A review—Part II. Chemosphere 2009, 75, 435–441. [Google Scholar] [CrossRef]
- Sangion, A.; Gramatica, P. PBT assessment and prioritization of contaminants of emerging concern: Pharmaceuticals. Environ. Res. 2016, 147, 297–306. [Google Scholar] [CrossRef]
- Paíga, P.; Santos, L.H.M.L.M.; Delerue-Matos, C. Development of a multi-residue method for the determination of human and veterinary pharmaceuticals and some of their metabolites in aqueous environmental matrices by SPE-UHPLC–MS/MS. J. Pharm. Biomed. Anal. 2017, 135, 75–86. [Google Scholar] [CrossRef] [Green Version]
- Primel, E.G.; Caldas, S.S.; Escarrone, A.L.V. Multi-residue analytical methods for the determination of pesticides and PPCPs in water by LC-MS/MS: A review. Cent. Eur. J. Chem. 2012, 10, 876–899. [Google Scholar] [CrossRef]
- Gurke, R.; Rossmann, J.; Schubert, S.; Sandmann, T.; Rößler, M.; Oertel, R.; Fauler, J. Development of a SPE-HPLC-MS/MS method for the determination of most prescribed pharmaceuticals and related metabolites in urban sewage samples. J. Chromatogr. B Anal. Technol. Biomed. Life Sci. 2015, 990, 23–30. [Google Scholar] [CrossRef] [PubMed]
- Orfanidis, A.; Gika, H.; Theodoridis, G.; Mastrogianni, O.; Raikos, N. Development of a UHPLC-MS/MS method for the determination of 84 pharmaceuticals and drugs of abuse in human liver. J. Chromatogr. B Anal. Technol. Biomed. Life Sci. 2020, 1151, 122192. [Google Scholar] [CrossRef] [PubMed]
- Feng, Z.; Yu, S.; Liu, W.; Yang, L.; Liu, Y.; Zhai, S.; Wang, F.; Zhang, X. A simple and sensitive LC-MS/MS method for the determination of sotalol in rat plasma. Biomed. Chromatogr. 2015, 29, 1167–1172. [Google Scholar] [CrossRef] [PubMed]
- Alves, V.; Gonçalves, J.; Conceição, C.; Teixeira, H.M.; Câmara, J.S. An improved analytical strategy combining microextraction by packed sorbent combined with ultra-high pressure liquid chromatography for the determination of fluoxetine, clomipramine and their active metabolites in human urine. J. Chromatogr. A 2015, 1408, 30–40. [Google Scholar] [CrossRef] [PubMed]
- Jank, L.; Martins, M.T.; Arsand, J.B.; Motta, T.M.C.; Hoff, R.B.; Barreto, F.; Pizzolato, T.M. High-throughput method for macrolides and lincosamides antibiotics residues analysis in milk and muscle using a simple liquid–liquid extraction technique and liquid chromatography–electrospray–tandem mass spectrometry analysis (LC–MS/MS). Talanta 2015, 144, 686–695. [Google Scholar] [CrossRef] [PubMed]
- Yu, K.; Li, B.; Zhang, T. Direct rapid analysis of multiple PPCPs in municipal wastewater using ultrahigh performance liquid chromatography–tandem mass spectrometry without SPE pre-concentration. Anal. Chim. Acta 2012, 738, 59–68. [Google Scholar] [CrossRef] [PubMed]
- Borova, V.L.; Gago-Ferrero, P.; Pistos, C.; Thomaidis, N.S. Multi-residue determination of 10 selected new psychoactive substances in wastewater samples by liquid chromatography–tandem mass spectrometry. Talanta 2015, 144, 592–603. [Google Scholar] [CrossRef] [Green Version]
- Senta, I.; Krizman-Matasic, I.; Terzic, S.; Ahel, M. Comprehensive determination of macrolide antibiotics, their synthesis intermediates and transformation products in wastewater effluents and ambient waters by liquid chromatography–tandem mass spectrometry. J. Chromatogr. A 2017, 1509, 60–68. [Google Scholar] [CrossRef]
- Guichard, N.; Fekete, S.; Guillarme, D.; Bonnabry, P.; Fleury-Souverain, S. Computer-assisted UHPLC–MS method development and optimization for the determination of 24 antineoplastic drugs used in hospital pharmacy. J. Pharm. Biomed. Anal. 2019, 164, 395–401. [Google Scholar] [CrossRef] [PubMed]
- Poirier-Larabie, S.; Houde, M.; Gagnon, C. Determination of the bioavailability of selected pharmaceutical residues in fish plasma using liquid chromatography coupled to tandem mass spectrometry. J. Chromatogr. A 2017, 1522, 48–55. [Google Scholar] [CrossRef] [PubMed]
- Campos-Manas, M.C.; Plaza-Bolanos, P.; Sánchez-Pérez, J.A.; Malato, S.; Agüera, A. Fast determination of pesticides and other contaminants of emerging concern in treated wastewater using direct injection coupled to highly sensitive ultra-high performance liquid chromatography-tandem mass spectrometry. J. Chromatogr. A 2017, 1507, 84–94. [Google Scholar] [CrossRef]
- Desbiolles, F.; Malleret, L.; Tiliacos, C.; Wong-Wah-Chung, P.; Laffont-Schwob, I. Occurrence and ecotoxicological assessment of pharmaceuticals: Is there a risk for the Mediterranean aquatic environment? Sci. Total Environ. 2018, 639, 1334–1348. [Google Scholar] [CrossRef]
- Mokh, S.; El Khatib, M.; Koubar, M.; Daher, Z.; Al Iskandarani, M. Innovative SPE-LC-MS/MS technique for the assessment of 63 pharmaceuticals and the detection of antibiotic-resistant-bacteria: A case study natural water sources in Lebanon. Sci. Total Environ. 2017, 609, 830–841. [Google Scholar] [CrossRef] [PubMed]
| Pharmaceutical/CAS Number a | Chemical Structure | Molecular Formula | Molecular Weight/Exact Mass (g mol−1) | Solubility in Water b (mg L−1) | Log Kow c | pKa d | Log BCF e | STP Removal f (%) | PNEC g (µg L−1) | Excretion Factor h (%) |
|---|---|---|---|---|---|---|---|---|---|---|
| Erythromycin/114-07-8 |  | C37H67NO13 | 733.9/733.461241 | 4.2 | 3.06 | 8.38;12.44 | 1.68 | 6.23 | 0.02 | 5 |
| Azithromycin/83905-01-5 |  | C38H72N2O12 | 749/748.508526 | 2.37 | 4.02 | 9.57;12.43 | 2.32 | 30.99 | 0.02 | 6 |
| Fluoxetine/54910-89-3 |  | C17H18F3NO | 309.33/309.134049 | 1.7 | 4.05 | 9.8 | 2.18 | 22.58 | 0.024 | 80 |
| Sotalol/959-24-0 |  | C12H20N2O3S | 272.37/272.119464 | 780 | 0.24 | 9.43;10.07 | 0.5 | 1.85 | 13 | 75 |
| Analyte | RT (min) | Parent Ion [M + H]+ | Cone Voltage (V) | Fixed CE Value (V) | Fragments |
|---|---|---|---|---|---|
| Azithromycin | 1.71 | 749.5164 | 45 | 25 | 591.422 |
| Erythromycin | 2.19 | 734.4691 | 20 | 14 | 576.374 |
| Fluoxetine | 2.47 | 310.1419 | 20 | 4 | 148.113 |
| Sotalol | 1.02 | 273.1273 | 20 | 4 | 255.117 |
| 213.07 |
| Compound | Precision (%) | Linearity (r2) | Range (ng L−1) | LOD (ng L−1) | LOQ (ng L−1) | Recovery (%) |
|---|---|---|---|---|---|---|
| Fluoxetine | 16 | 0.994 | 1–1000 | 2 | 7 | 87 |
| Sotalol | 13 | 0.993 | 2–1000 | 2 | 6.8 | 105 |
| Azithromycin | 14 | 0.993 | 2–1000 | 2 | 8 | 92 |
| Erythromycin | 8 | 0.990 | 5–1000 | 7 | 23 | 98 |
| Azithromycin | Erythromycin | Fluoxetine | Sotalol | |
|---|---|---|---|---|
| Lebanon | ||||
| Station A | 377.7 ± 22.2 | 268.3 ± 32 | 28.4 ± 4.2 | 44.8 ± 4.3 |
| Station B | 161.6 ± 21.7 | 121 ± 12.3 | 12.6 ± 2.4 | |
| Station C | 10.8 ± 6.4 | |||
| France | ||||
| Station D | 3.75 ± 0.20 | 2.35 ± 0.27 (*) | ||
| Station E | 4.99 ± 0.83 | 2.15 ± 0.86 (*) | ||
| Station F | 17 ± 2.3 | 5.07 ± 1.01 (*) |
Publisher’s Note: MDPI stays neutral with regard to jurisdictional claims in published maps and institutional affiliations. |
© 2021 by the authors. Licensee MDPI, Basel, Switzerland. This article is an open access article distributed under the terms and conditions of the Creative Commons Attribution (CC BY) license (https://creativecommons.org/licenses/by/4.0/).
Share and Cite
Azzi, M.; Ravier, S.; Elkak, A.; Coulomb, B.; Boudenne, J.-L. Fast UHPLC-MS/MS for the Simultaneous Determination of Azithromycin, Erythromycin, Fluoxetine and Sotalol in Surface Water Samples. Appl. Sci. 2021, 11, 8316. https://0-doi-org.brum.beds.ac.uk/10.3390/app11188316
Azzi M, Ravier S, Elkak A, Coulomb B, Boudenne J-L. Fast UHPLC-MS/MS for the Simultaneous Determination of Azithromycin, Erythromycin, Fluoxetine and Sotalol in Surface Water Samples. Applied Sciences. 2021; 11(18):8316. https://0-doi-org.brum.beds.ac.uk/10.3390/app11188316
Chicago/Turabian StyleAzzi, Mira, Sylvain Ravier, Assem Elkak, Bruno Coulomb, and Jean-Luc Boudenne. 2021. "Fast UHPLC-MS/MS for the Simultaneous Determination of Azithromycin, Erythromycin, Fluoxetine and Sotalol in Surface Water Samples" Applied Sciences 11, no. 18: 8316. https://0-doi-org.brum.beds.ac.uk/10.3390/app11188316