Article

Application of Combined In Situ Chemical Reduction and Enhanced Bioremediation to Accelerate TCE Treatment in Groundwater

1
Department of Environmental Engineering and Management, Chaoyang University of Technology, 168, Jifeng E. Rd., Wufeng District, Taichung 413310, Taiwan
2
Clean EnviroEngineering Technology Co., Ltd., Xitun District, Taichung 407608, Taiwan
*
Author to whom correspondence should be addressed.
Submission received: 31 July 2021 / Revised: 3 September 2021 / Accepted: 7 September 2021 / Published: 9 September 2021

Abstract

:
Groundwater at trichloroethylene (TCE)-contaminated sites lacks electron donors, which prolongs TCE’s natural attenuation process and delays treatment. Although adding electron donors, such as emulsified oil, accelerates TCE degradation, it also causes the accumulation of hazardous metabolites such as dichloroethylene (DCE) and vinyl chloride (VC). This study combined in situ chemical reduction using organo-iron compounds with enhanced in situ bioremediation using emulsified oil to accelerate TCE removal and minimize the accumulation of DCE and VC in groundwater. A self-made soybean oil emulsion (SOE) was used as the electron donor and was added to liquid ferrous lactate (FL), the chemical reductant. The combined in situ chemical reduction and enhanced in situ bioremediation achieved favorable results in a laboratory microcosm test and in an in situ biological field pilot test. Both tests revealed that SOE+FL accelerated TCE degradation and minimized the accumulation of DCE and VC to a greater extent than SOE alone after 160 days of observation. When FL was added in the microcosm test, the pH value decreased from 6.0 to 5.5; however, during the in situ biological pilot test, the on-site groundwater pH value did not exhibit obvious changes. Given the geology of the in situ pilot test site, the SOE+FL solution that was injected underground continued to be released for at least 90 days, suggesting that the solution’s radius of influence was at least 5 m.

Graphical Abstract

1. Introduction

The remediation of sites contaminated by dense nonaqueous phase liquid (DNAPL) is extremely difficult, which is why the development of economic and effective remediation technologies for DNAPL-contaminated sites is crucial. Trichloroethylene (TCE), a common DNAPL, is used in textile processing, refrigeration, vapor degreasing, metal washing, dry wash facilities, lubricants, and adhesives [1]. TCE is a common pollutant in sites with contaminated groundwater. The International Agency for Research (IARC) on Cancer listed TCE as “carcinogenic to humans” [2,3]. Thus, TCE is one of the most common and hazardous pollutants.
Microbes can convert chlorinated pollutants into hazard-free final products through dechlorination under an anaerobic state. However, the lack of electron donors in the environment often prolongs the time required for microbes to degrade chlorinated pollutants. Adding a commercial emulsified vegetable oil (CEVO) as an electron donor to accelerate reductive dechlorination of contaminated groundwater is a frequently adopted in situ bioremediation technology [4,5,6]. Direct injection of edible oil into the contamination plume does not yield favorable remediation results because edible oil has poor transmissibility; therefore, large amounts of groundwater must be drawn and replaced continuously to enable the oil to diffuse into soil pores [7]. Emulsified edible oil (emulsified vegetable oil) has fine and evenly distributed droplets, and can thus more easily diffuse into the pores of different types of soil [8,9,10]. Emulsified edible oil releases carbon sources and fatty acid, which can stimulate anaerobic reductive dechlorination. In addition, microbes can be applied to facilitate the complete removal of chlorine to form nontoxic chlorinated ethenes (CEs) [11,12,13]. Previous studies have injected emulsified oil into contaminated aquifers to form a bioreactor system. Through the slow release of a CEVO, microbial activity in the aquifer is stimulated over a long period of time to achieve complete dichlorination [14] and remove heavy metal and organic pollutants in groundwater [15,16].
Although CEVOs are favorable hydrogen-releasing substrates [17], in situ bioremediation using CEVOs to stimulate anaerobic reductive dechlorination of contaminated groundwater has a few defects. Biodegradation of a CEVO generates organic acid, which decreases the environment’s pH value and causes soil acidification problems. In anaerobic environments, sulfates may form hydrogen sulfide and generate odors. Moreover, when vinyl chloride (VC), the metabolite of reductive dechlorination of tetrachloroethylene (PCE) and TCE, accumulates to a certain level, microbial activity may decline [18] or the growth of microbes that can degrade VC may be partially inhibited [19]. Subsequently, the VC degradation rate decreases and prolongs the time required for bioremediation of the contaminated site. Adding zerovalent iron can effectively overcome these defects. Zerovalent iron has three main mechanisms in water: (1) in anaerobic environments, it releases electrons from its surface to facilitate the reductive dechlorination of chlorinated organic compounds (RCl); (2) Fe2+ is oxidated into Fe3+ and releases electrons to facilitate the reductive dechlorination of RCl; and (3) zerovalent iron is oxidated in aqueous solutions to reduce water to H2 and OH, and H2 can be used as the electron donor to facilitate catalyzed hydrogenolysis with RCl, thereby achieving the goal of dechlorination [20]. Additionally, as a zerovalent iron solution added into sulfide can generate sulfides and iron oxides, many scholars have added zerovalent iron to biosludge from husbandry wastewater containing high concentrations of sulfides, and found that the generation of hydrogen sulfide was significantly controlled [21,22]. This indicates that the addition of zerovalent iron could resolve the odorous water problem caused by hydrogen sulfide. Furthermore, a study by Herrero et al. showed the benefits of zerovalent iron on bioremediation of PCE [23]. The study conducted remediation tests in four groups: (a) natural attenuation, (b) addition of lactic acid, (c) addition of zerovalent iron, and (d) addition of lactic acid integrated with zerovalent iron. The results revealed that, in the group with lactic acid added, when the microbes degraded PCE to cis-1,2-dichloroethene (DCE), the concentration of cis-1,2-DCE could not be reduced effectively and the generation of VC was not observed. In the zerovalent iron group, decreases in PCE and TCE concentrations were observed; however, the cis-1,2-DCE concentration continued to increase and could not be effectively reduced. In the group with lactic acid integrated with zerovalent iron, PCE was gradually degraded into VC and the concentration of VC gradually decreased. Therefore, the addition of zerovalent iron also helps overcome the bottleneck of in situ bioremediation in degrading compounds into VC through reductive dechlorination.
Although the addition of zerovalent iron can promote the degradation of VC derivatives and solve many in situ bioremediation-derived problems, such as acidification and odors, zerovalent iron is a solid that may, after injection, be synthesized with environmental substances and precipitate, thereby limiting the distance of transmission. Su et al. used pneumatic injection and direct injection methods and observed the distance of transmission of emulsified zerovalent iron after injection [24]. The results revealed that the transmission distance through pneumatic injection was approximately 2.1 m and the maximal transmission distance through direct injection was 0.89 m. The majority of the nano-iron contained in the chemical was converted into magnetite after 2.5 years and the particle size varied from 35–140 nm to 0.1–1 µm. The results suggested that zerovalent iron reacts in underground environments over time and forms coordination complexes, which have enlarged particle sizes and might affect the distance of transmission. Ferrous lactate (FL) can be dissolved in water to form aqueous solutions for injection, which is convenient for in situ operation and may have a longer distance of transmission than solid zerovalent iron.
This study evaluated the feasibility of using two types of self-made emulsions combined with FL in the bioremediation of TCE-contaminated sites. First, a microcosm test was conducted to evaluate the differences between the two types of self-made emulsions and commercial emulsion and to evaluate if remediation effectiveness increased after the addition of FL. Then, in situ biological field tests were conducted to understand the steps required to implement bioremediation with self-made emulsion combined with FL. The results can serve as a reference for in situ remediation.

2. Materials and Methods

2.1. Materials and Analytical Methods

The first emulsion used in this study was soybean oil emulsion (SOE), which was mainly comprised of soybean oil (69.5%), sodium lactate (4%), sodium bicarbonate (1%), simple green (10.5%), sucrose fatty acid ester (4.5%), and water (10.5%). The emulsion was blended using a 10,000 rpm homogenizer for 30 min. The second emulsion was fatty acid ester (FAE), which was mainly composed of oleic acid (10.4%), glycerol (5%), ethyl lactate (5.9%), buffer solution (1%), and water (77.7%). The emulsion was blended using a 10,000 rpm homogenizer for 5 min. The FL selected was a commercial product from Henan Jindan Lactic Acid Technology Co., Ltd., Dancheng County, Henan, China. During the experiment, in situ groundwater sampling and water quality analysis were performed in accordance with the standard analysis methods of Taiwan. Volatile organic compounds in water were detected with a gas chromatograph/mass spectrometer; total organic carbon in water was detected with a method of peroxide pyrosulfate thermal oxidation/infrared spectrometry; and nitrate, nitrite, and sulfate were detected by ion exchange chromatography. The analytical methods used in the article follow National Institute of Environmental Analysis, Taiwan EPA [25,26,27,28].

2.2. Microcosm Test

The microcosm test consisted of five test sample groups. The five test sample groups were blank, self-made SOE, FAE, CEVO, and self-made SOE+FL (1%). Each of the groups used 250 mL serum vials to prepare six vials of isolated microcosms. When the predetermined time for analysis was up, the vials were opened one by one for analysis. Except for the blank group, which did not have any emulsion added, each serum vial consisted of 60 g of soil (sifted through a #20 mesh net), 15 mL of emulsion, a small amount of nutrients, and 2 mg/L of TCE. Subsequently, groundwater samples from the in situ field test location were added to the vials until no headspace was left; then, the vials were sealed. The vial bodies were wrapped with aluminum foil to minimize light irradiation. The total duration of the microcosm test was 90 days. Multiple samples were prepared for each of the five test groups using the jar test method. On days 0, 10, 25, 45, 60, and 90, a serum vial from each group was opened for pH, oxidation-reduction potential (ORP), dissolved oxygen (DO), electrical conductivity (EC), total organic carbon (TOC), and volatile organic compounds (VOCs) analyses. On days 0, 10, 45, and 90, additional nitrate, nitrite, and sulfate analyses were performed. On days 0 and 90, the blank group and the test group with the greatest effectiveness to date were selected for real-time polymerase chain reaction analysis [29] to evaluate the variation in the amount of representative strains of Dehalococcoides (DHC) and Dichloroeliminans (DCA1), which are microbes that can facilitate reductive dechlorination.

2.3. In Situ Biological Field Test

The in situ field test was conducted at a metal processing plant in central Taiwan. The plant had used TCE for surface processing without proper contamination control measures, resulting in TCE contamination at the site. The site’s geological structure consisted of 0–1.5 m of sandy silt, 1.5–2 m of silty sand with sporadic clay, 2–4 m of silty clay with sandy clay, 4–5.5 m of silty medium-to-fine sand, 5.5–6 m of silty clay, and 6–10 m of silty medium-to-fine sand with sporadic thin layers of silt. The interbedded geologic structure was frequently observed at the site and the groundwater level was from 4 m to 5 m below the ground surface. The groundwater flow direction was mainly in the northeast to southwest direction. The hydraulic conductivity of the site was approximately 2.8 × 10⁻⁵ to 1.6 × 10⁻⁶ m/s. The injection well and monitoring well distribution is presented in Figure 1. At the upstream spot 1 m away from the injection well (IW), an observation well (OW1) was established. OW2 and OW3 were established at downstream spots 3 m and 5 m away from the IW, respectively. In addition, a contaminated monitoring well was selected as the control well (CW) within the contamination range of the site. The CW was approximately 30 m away from the in situ biological field test site and was free from the effects of the in situ chemical injection.
Given that the geologic structures were silty fine sand and interbedded silt and clay, the double packer injection method was adopted. The double packer injection well structure is depicted in Figure 2b. The outer layer of the Manchette tube was Bentonite cement slurry. On the Manchette tube, injection holes were designed at 50 cm intervals. During injection of the chemicals at the target depth, the double packer system was extended to the predetermined injection depth and filled with water in the water bag at both ends to ensure chemical exposure at each contamination depth. During injection, the injection pressure was controlled at 2–4 bar to avoid cracks on soil pores and the formation of short-circuiting flows. During the testing period, chemicals were injected once every 2 months. The amount injected was adjusted according to the TOC detection results during the testing period. During the entire testing period, water quality characteristics including TOC, VOCs, nitrate, nitrite, ammonia nitrogen, sulfate, sulfides, total iron, and iron (II) were periodically monitored.

3. Results and Discussion

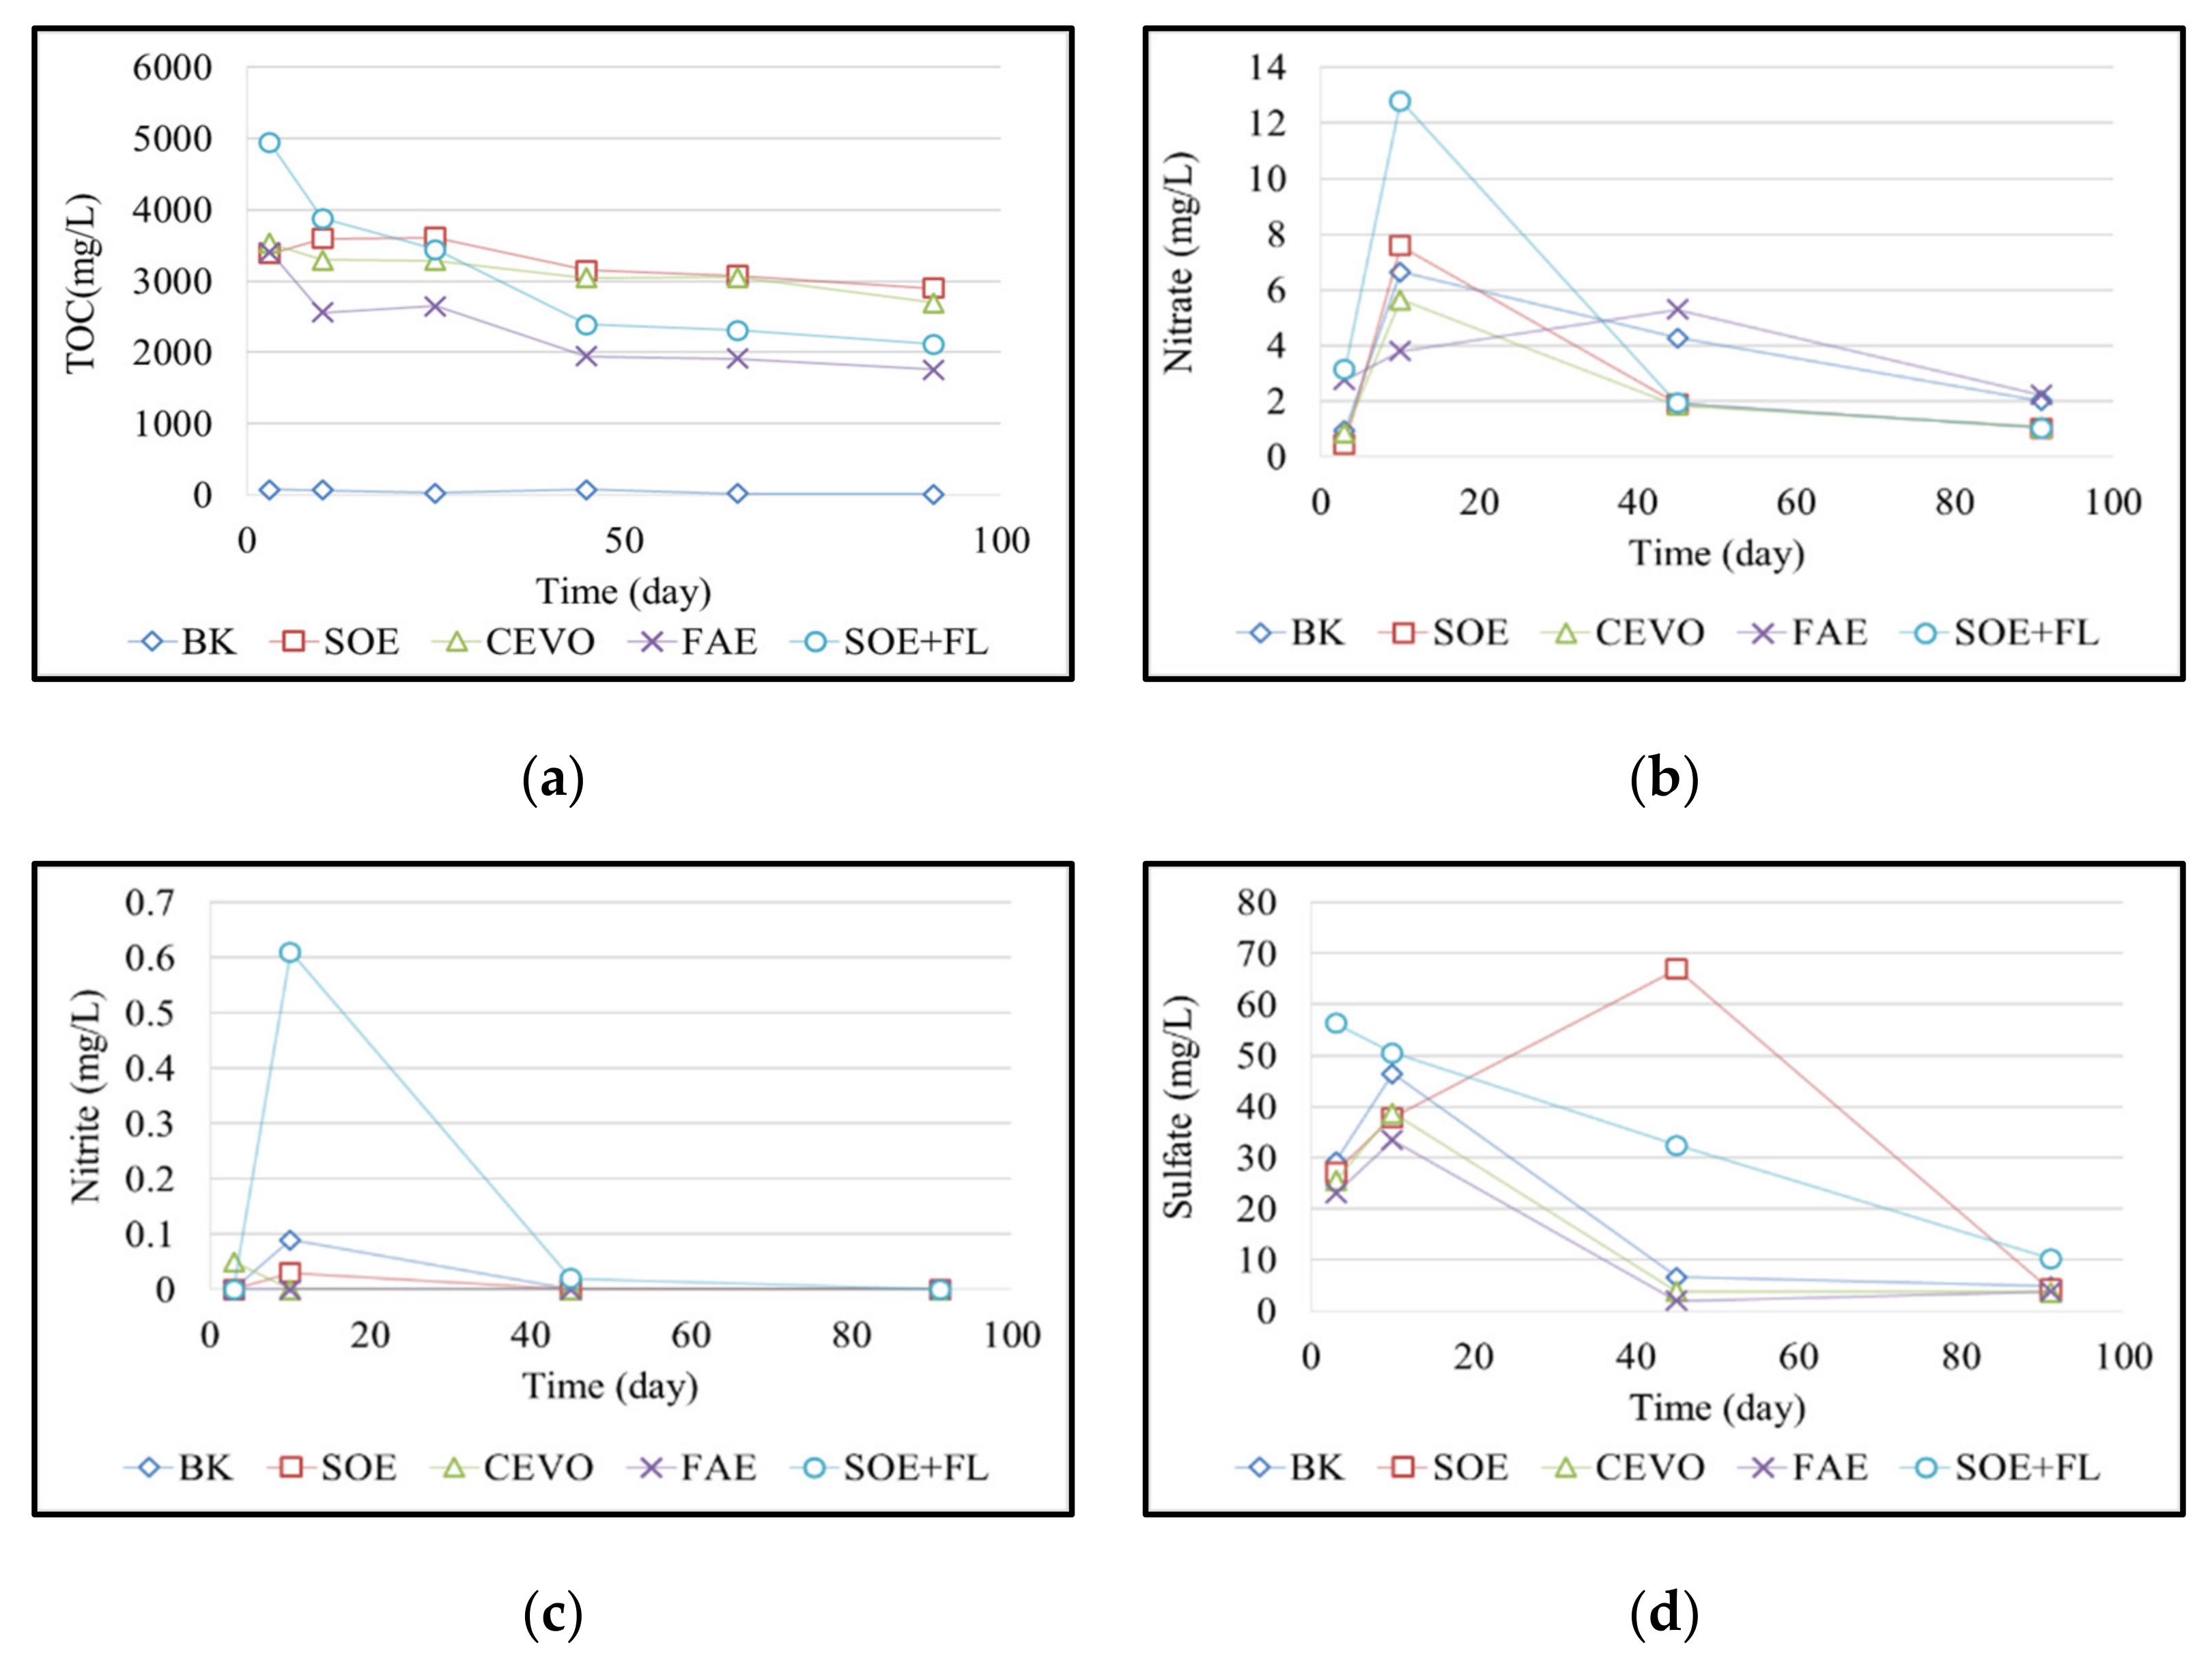
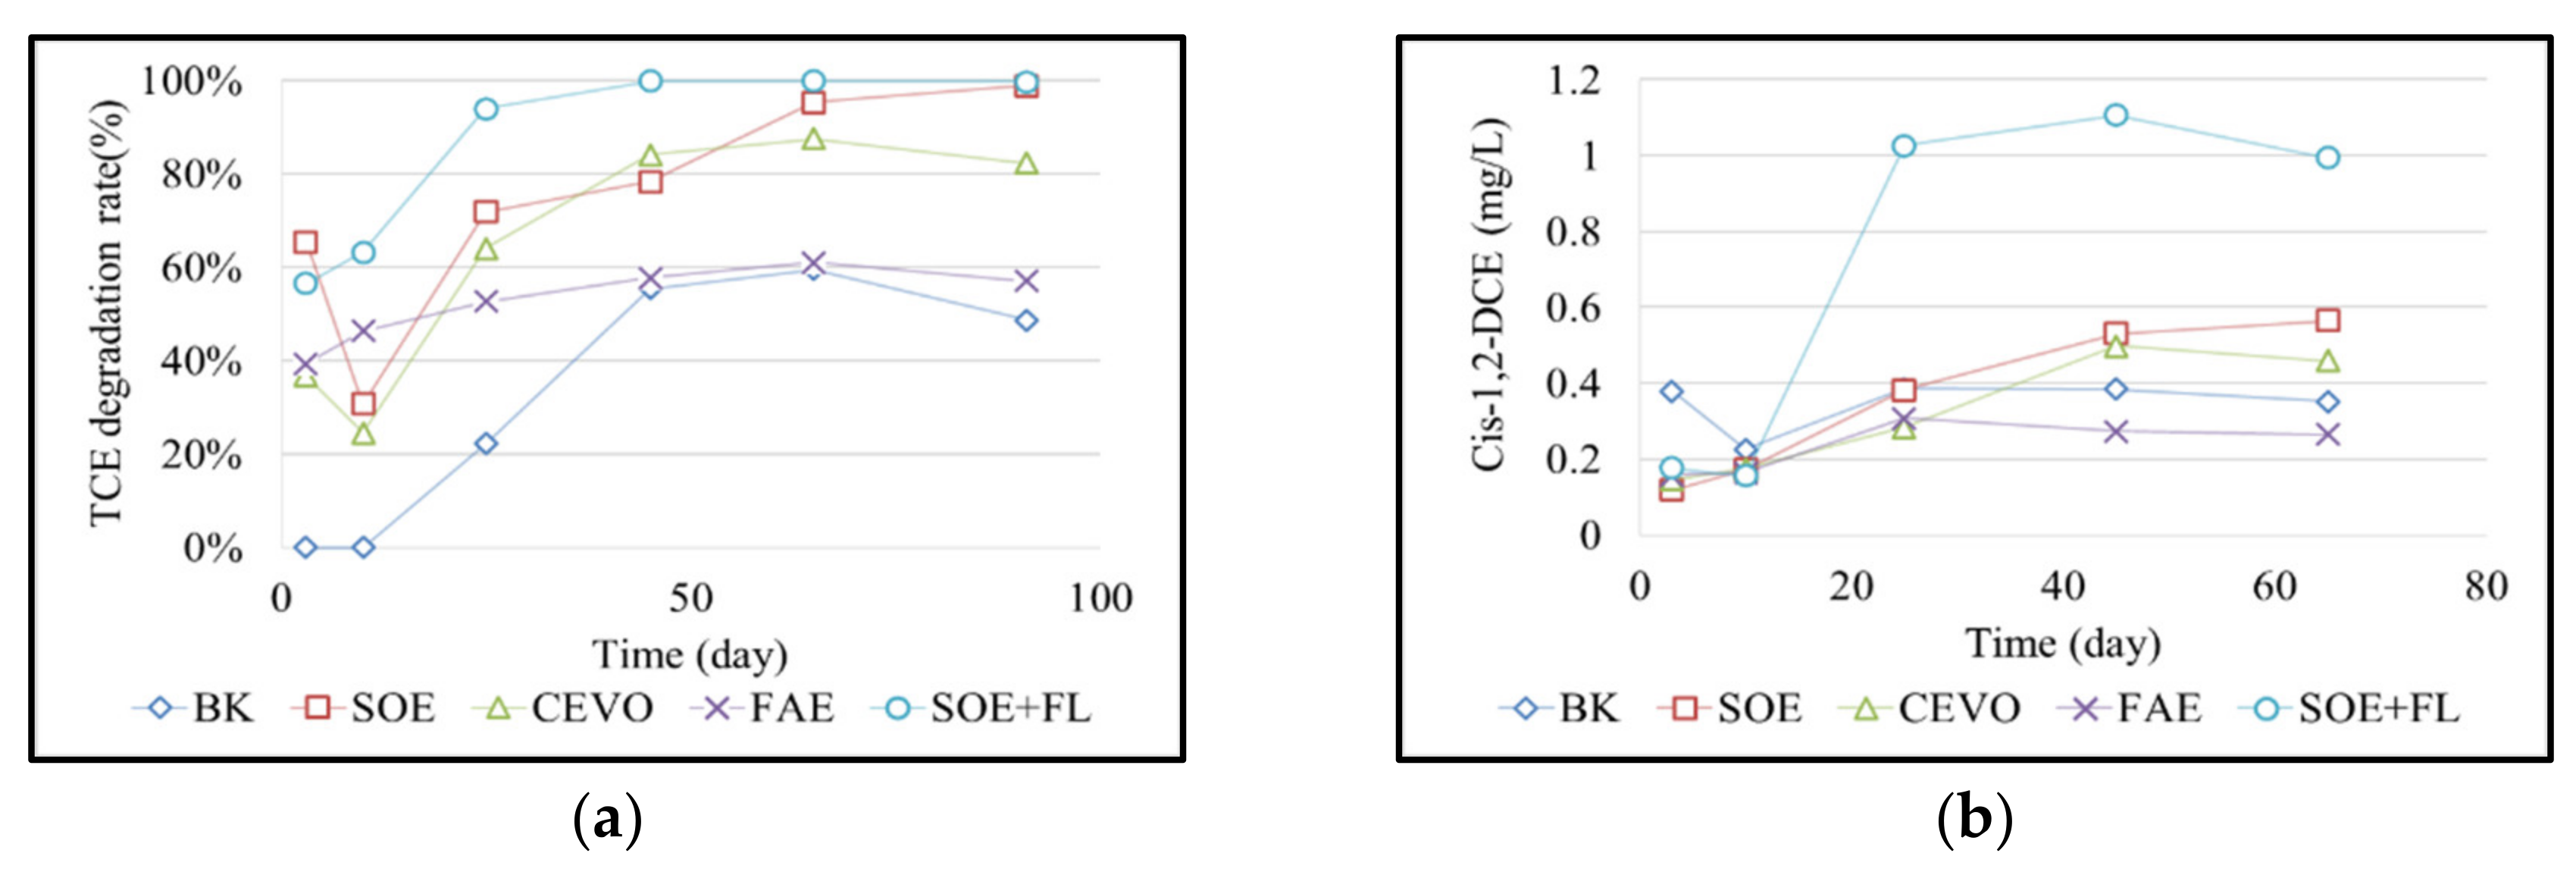
3.1. Microcosm Testing Results

The effects of the addition of different slow-release substrates on environmental parameters are depicted in Figure 3. The testing results revealed that the use of emulsion products may accumulate organic acid, thus decreasing the pH in groundwater. The effect was particularly substantial with the addition of SOE+FL. The microcosm was an enclosed nonflowing space, which further increased the likelihood of acid accumulation. Regardless, the pH value in each of the groups was higher than 5.5, falling into a range suitable for microbial growth. The initial ORP of each group was approximately 200 mV. After the addition of different chemicals, the ORPs were reduced to 0 mV or lower. The greatest decrease was observed in the SOE+FL group. Because the in situ groundwater originally contained approximately 70 mg/L TOC, the blank group (BK) also exhibited a decreasing trend in ORP. However, the ORP of the BK group remained higher than 0 mV for the duration of the test, which was different from that of the other groups with emulsions added. The initial DO of each group was 6.48 mg/L. The results revealed that the CEVO and SOE+FL test groups showed lower DO levels compared with the other groups. Moreover, the groups with emulsions added (CEVO, SOE, and SOE+FL) had higher EC values, with the SOE + FL group having the highest EC. The higher EC in these groups was assumed to be caused by the electron donors provided by FL. The overall results indicated that the addition of FL accelerated ORP and DO reduction; however, the addition of FL also caused lower pH values.
The water quality variation of each group during the testing period is depicted in Figure 4. The initial TOC of the groundwater used in this test was 76.8 mg/L. After the addition of various slow-release substrates, the TOC concentration in each of the non-BK test groups was higher than 3000 mg/L. The TOC concentrations following the addition of CEVO and self-made SOE were similar (approximately 3500 mg/L). The addition of FL further increased the TOC concentration to 4936 mg/L, suggesting that carbon sources in FL increased the electron donor content in emulsions. Additionally, on day 45 of the test, the chemical consumption rate of the SOE+FL group was faster than the consumption of the pure SOE or CEVO groups. It is possible that adding FL accelerated the environmental reduction, thereby increasing the chemical consumption rate. The nitrate concentration in each testing group increased in the initial period of the testing, possibly because nutrients were added in all groups. The nitrogen, phosphorous, vitamin B12, and other substances included in the nutrients reacted with residual DO in the vials, causing increased concentrations of nitrate. The sulfate content in each group exhibited an overall decreasing trend, suggesting that the later stages of the test entered an environment for sulfate reduction.
The TCE removal rates and derivative concentration variations in each group of the microcosm test are depicted in Figure 5. The BK group exhibited a TCE removal rate of approximately 22% on day 45 because the groundwater used contained TOC. The TCE removal rate of the self-made SOE, CEVO, FAE, and SOE+FL groups was approximately 71%, 64%, 52%, and 94%, respectively. The results indicated that adding FL accelerated environmental reduction and increased biodegradation efficiency. The TCE removal rates of the self-made SOE and CEVO were similar, suggesting that the self-made SOE was as stable as the commercial product. Moreover, the self-made SOE reached 95% and 99% TCE removal on days 65 and 90, respectively, which were higher than the 87% and 82% TCE removal rates, respectively, of the CEVO. According to the CEVO degradation tendency and the approximately 2500 mg/L TOC in the CEVO group on day 90, the CEVO group might have been able to reach 99% removal of TCE if the testing period had been extended. The FAE group reached approximately 55% TCE removal without any further increase in removal because of its low oil content. In summary, under the same oil content and fixed TCE concentration, only the SOE+FL and SOE test groups could reach an eventual TCE removal rate of 99%. The addition of FL accelerated TCE degradation. The groups with emulsions alone required a longer time for degradation to gradually reach a reducing condition in the environment. Adding FL shortened the time required to achieve the reducing condition, so microbes could start anaerobic reductive dechlorination earlier. Moreover, Figure 5b reveals that the SOE+FL group generated the highest concentration of cis-1,2-DCE, suggesting that the SOE+FL group had the greatest reductive dechlorination efficiency. Therefore, the subsequent in situ biological field test was conducted using SOE+FL. On day 90, the amount of representative strains of DHC and DCA1 in the SOE+FL group was 5.64 × 10³ and 6.17 × 10³ gene copies/L, respectively.

3.2. In Situ Biological Field Test Results

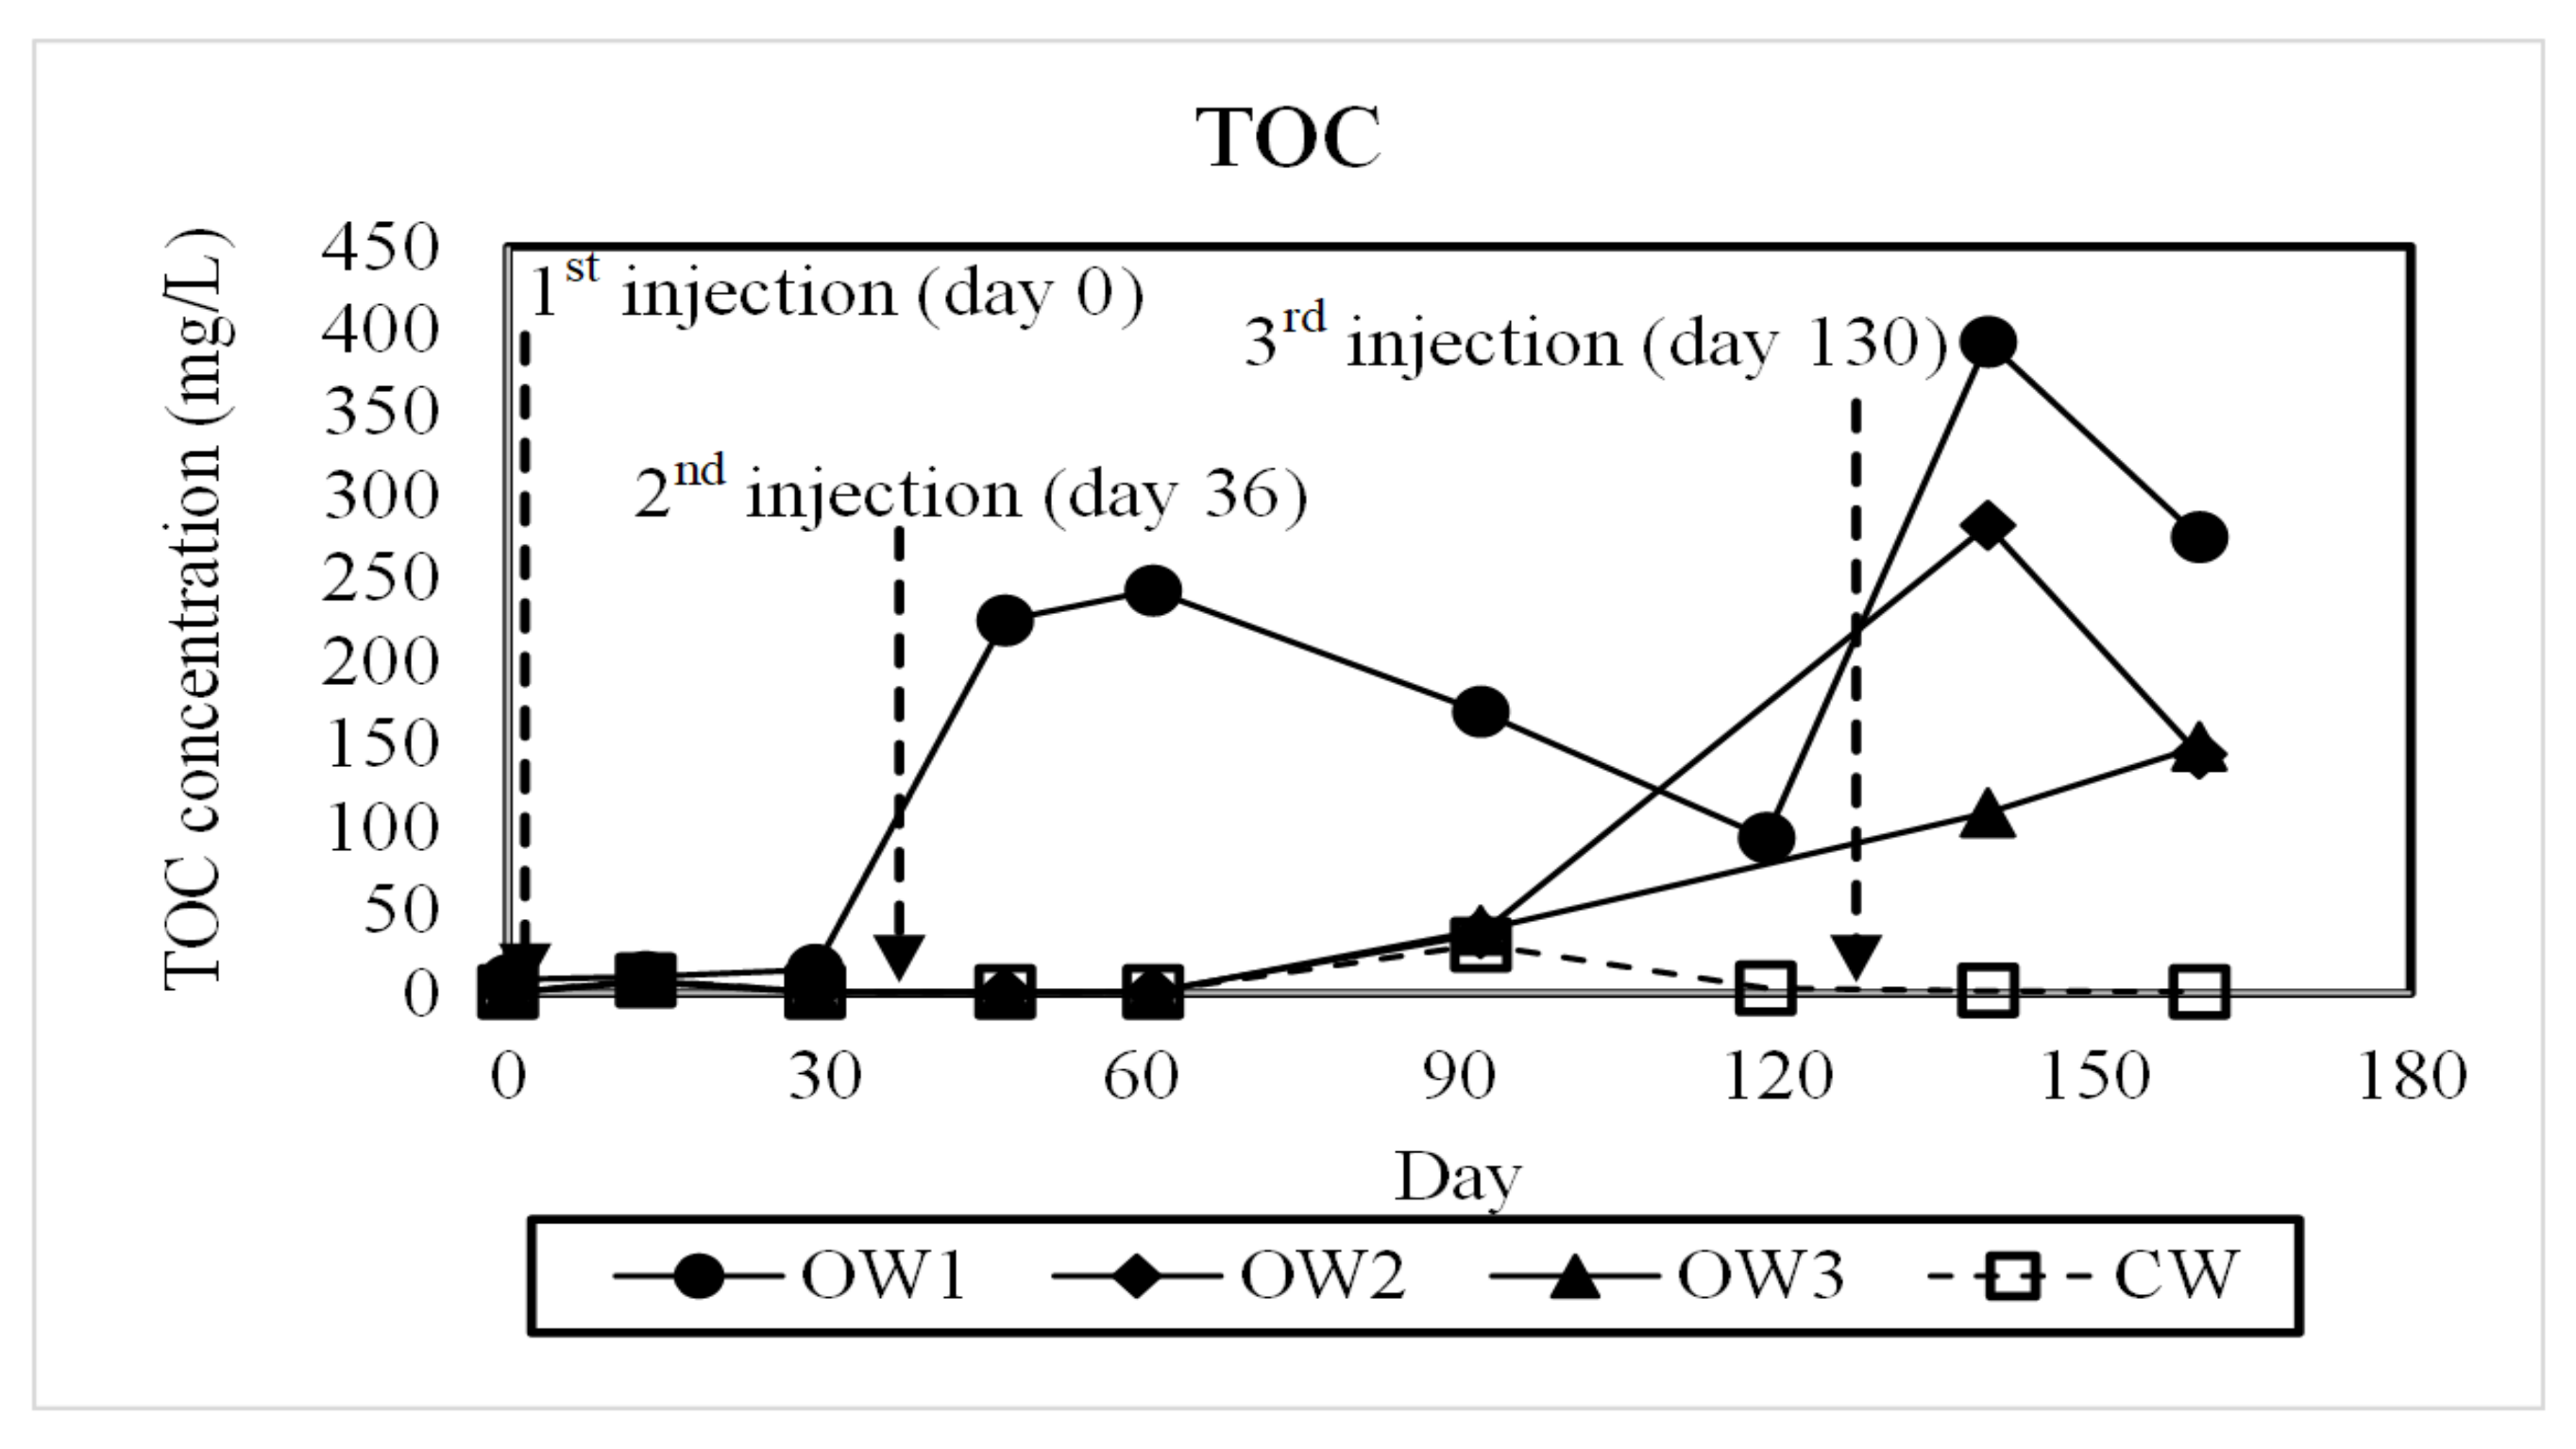
3.2.1. TOC Concentration Variation

On days 0, 36, and 130 of the in situ biological field test, 40 L SOE + 5 kg FL, 230 L SOE + 20 kg FL, and 130 L SOE + 10 kg FL were injected, respectively. The FL was adjusted to 2% concentration with in situ groundwater before being blended with SOE. After each chemical injection, a groundwater volume of three times the chemical volume was injected to propel the chemicals. Layered injection was adopted. Because the TCE contamination depth of the site was 4.5 to 12 m, a double packer system was used to inject the chemicals to 5, 6, 7, 10, 11, and 12 m beneath the surface. The TOC concentration variations in each monitoring well after the chemical injections are presented in Figure 6. The results revealed that, because of the special structure of the Machette tube in the double packer injection system, the IW retained no groundwater or chemicals. Therefore, no water quality data were obtained in the IW. After the first injection, the TOC concentration of each monitoring well exhibited no apparent increase, probably because the first injection calculation underestimated the hydraulic conductivity, causing an insufficient amount of chemicals to be injected. After adjustment, the second injection was conducted on day 36 and TOC concentrations increased in each monitoring well. The CW TOC concentration remained at 1–3 mg/L, suggesting that the study site lacked electron donors, which prevented reductive dechlorination through natural attenuation of TCE. Because OW1 was only 1 m away from the IW, a TOC increase was observed soon after each injection. The TOC concentration in OW1 after the third injection (393 mg/L) was higher than the highest TOC concentration (243 mg/L) observed after the second injection. These results indicated that SOE+FL was effectively adsorbed into soil pores and continued to release electron donors to reach effective reductive dechlorination. In addition, the TOC concentration of 94 mg/L observed at OW1 on day 90 after the SOE+FL injection demonstrated that SOE+FL had at least 90 days of slow-release effect. Because OW2 and OW3 were farther from the IW, their TOC concentrations began to increase on day 90, with the increasing slope greater at OW2 than at OW3. The maximum TOC concentration reached at OW2 and OW3 was 282 mg/L at OW2. On day 160, the TOC concentration at OW2 and OW3 was 144 mg/L. Because the TOC concentration of the IW upstream area was maintained at 200 mg/L or higher, a decrease in OW3’s TOC concentration was not observed. These overall results revealed that the SOE+FL transmission reached at least 5 m when a double packer system under 2 bar pressure of injection was used.

3.2.2. In Situ Water Quality Parameter Variation

Because OW1 was closer to the IW, OW2 and CW were selected for comparing underground environments and water quality parameters before and after injection. The results are presented in Table 1. OW2 had family vegetable gardens in its peripheral areas; thus, the initial nitrate concentration in the groundwater was higher than that at CW. Because the groundwater at the in situ field testing site was flowing, the pH value of OW2 after injection did not decrease at a level comparable to the microcosm test results. The TOC results, as stated previously, indicated that chemicals were transmitted to OW2 only after day 90. Thus, only an ORP decrease was observed before day 90. Prior to day 90, the nitrate and nitrite concentrations did not decrease, and the iron (II) concentration did not increase. On day 140, the nitrate concentration of OW2 decreased substantially, the iron (II) concentration increased to 3.6 mg/L, and sulfide was observed at a concentration of 0.22 mg/L. The results from the CW indicated that the groundwater was originally in an anaerobic state; however, little difference in water quality was observed between day 0 and day 140 because of the lack of electron donors.

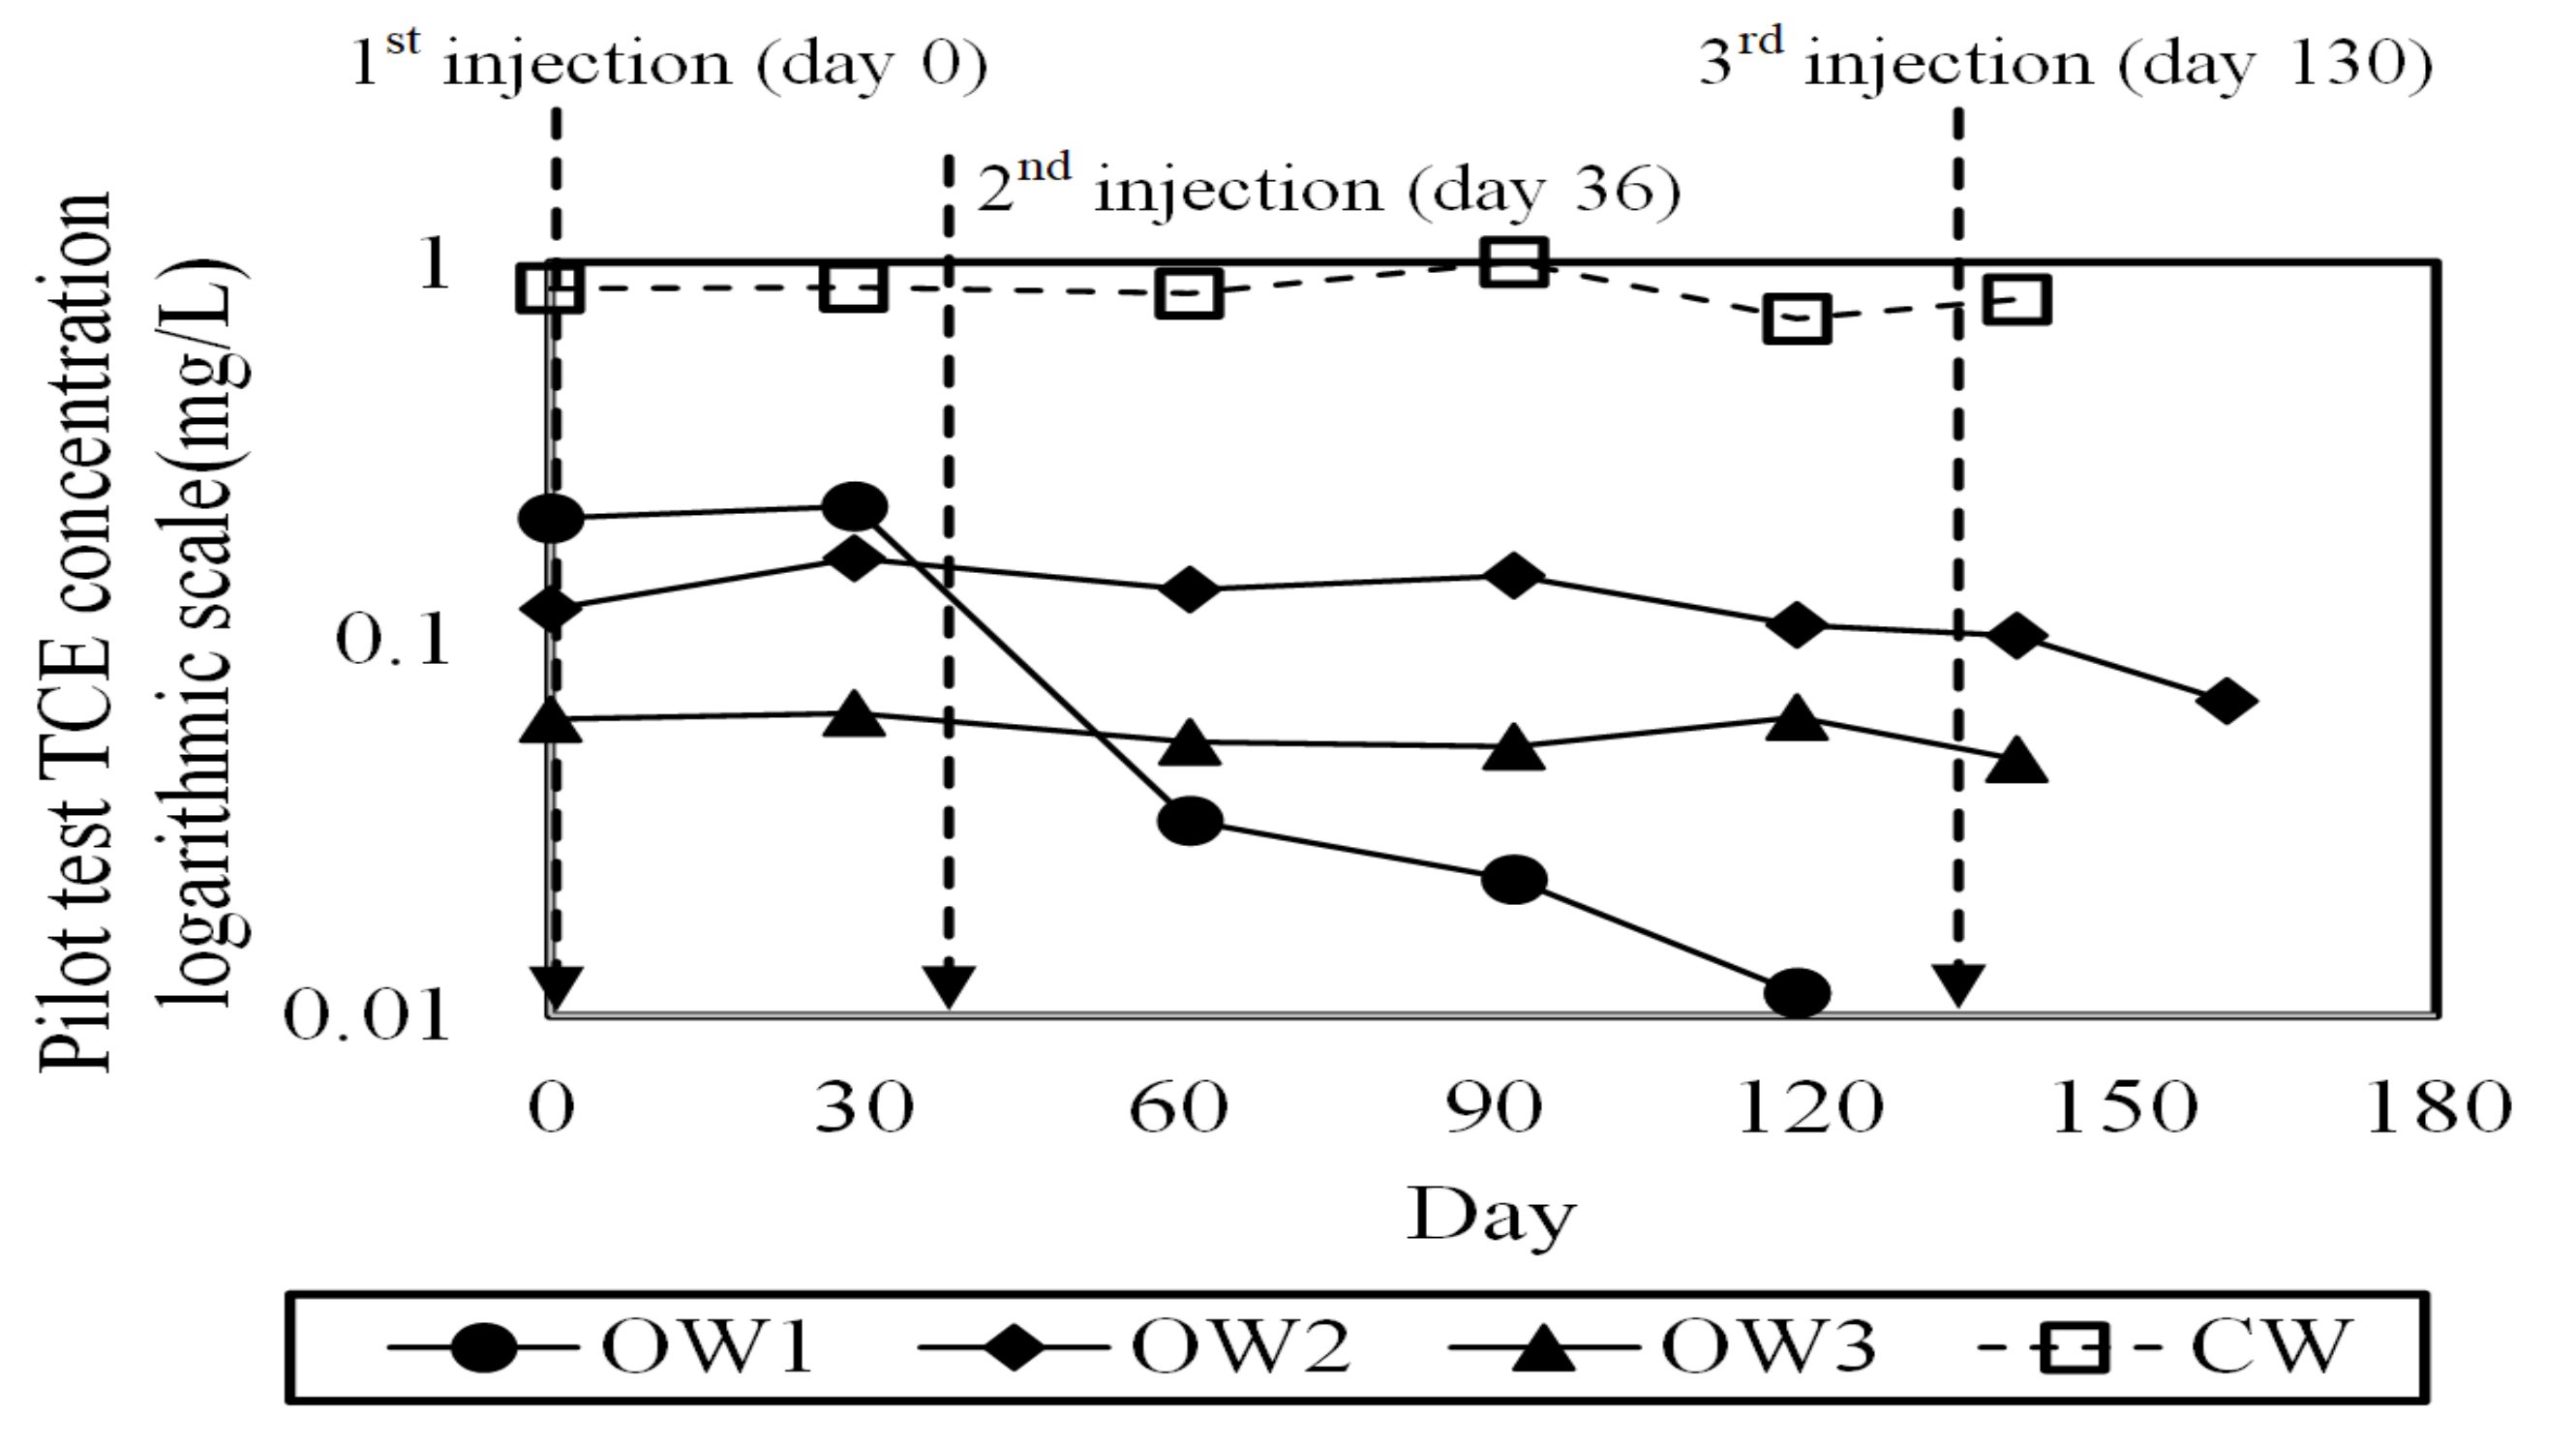
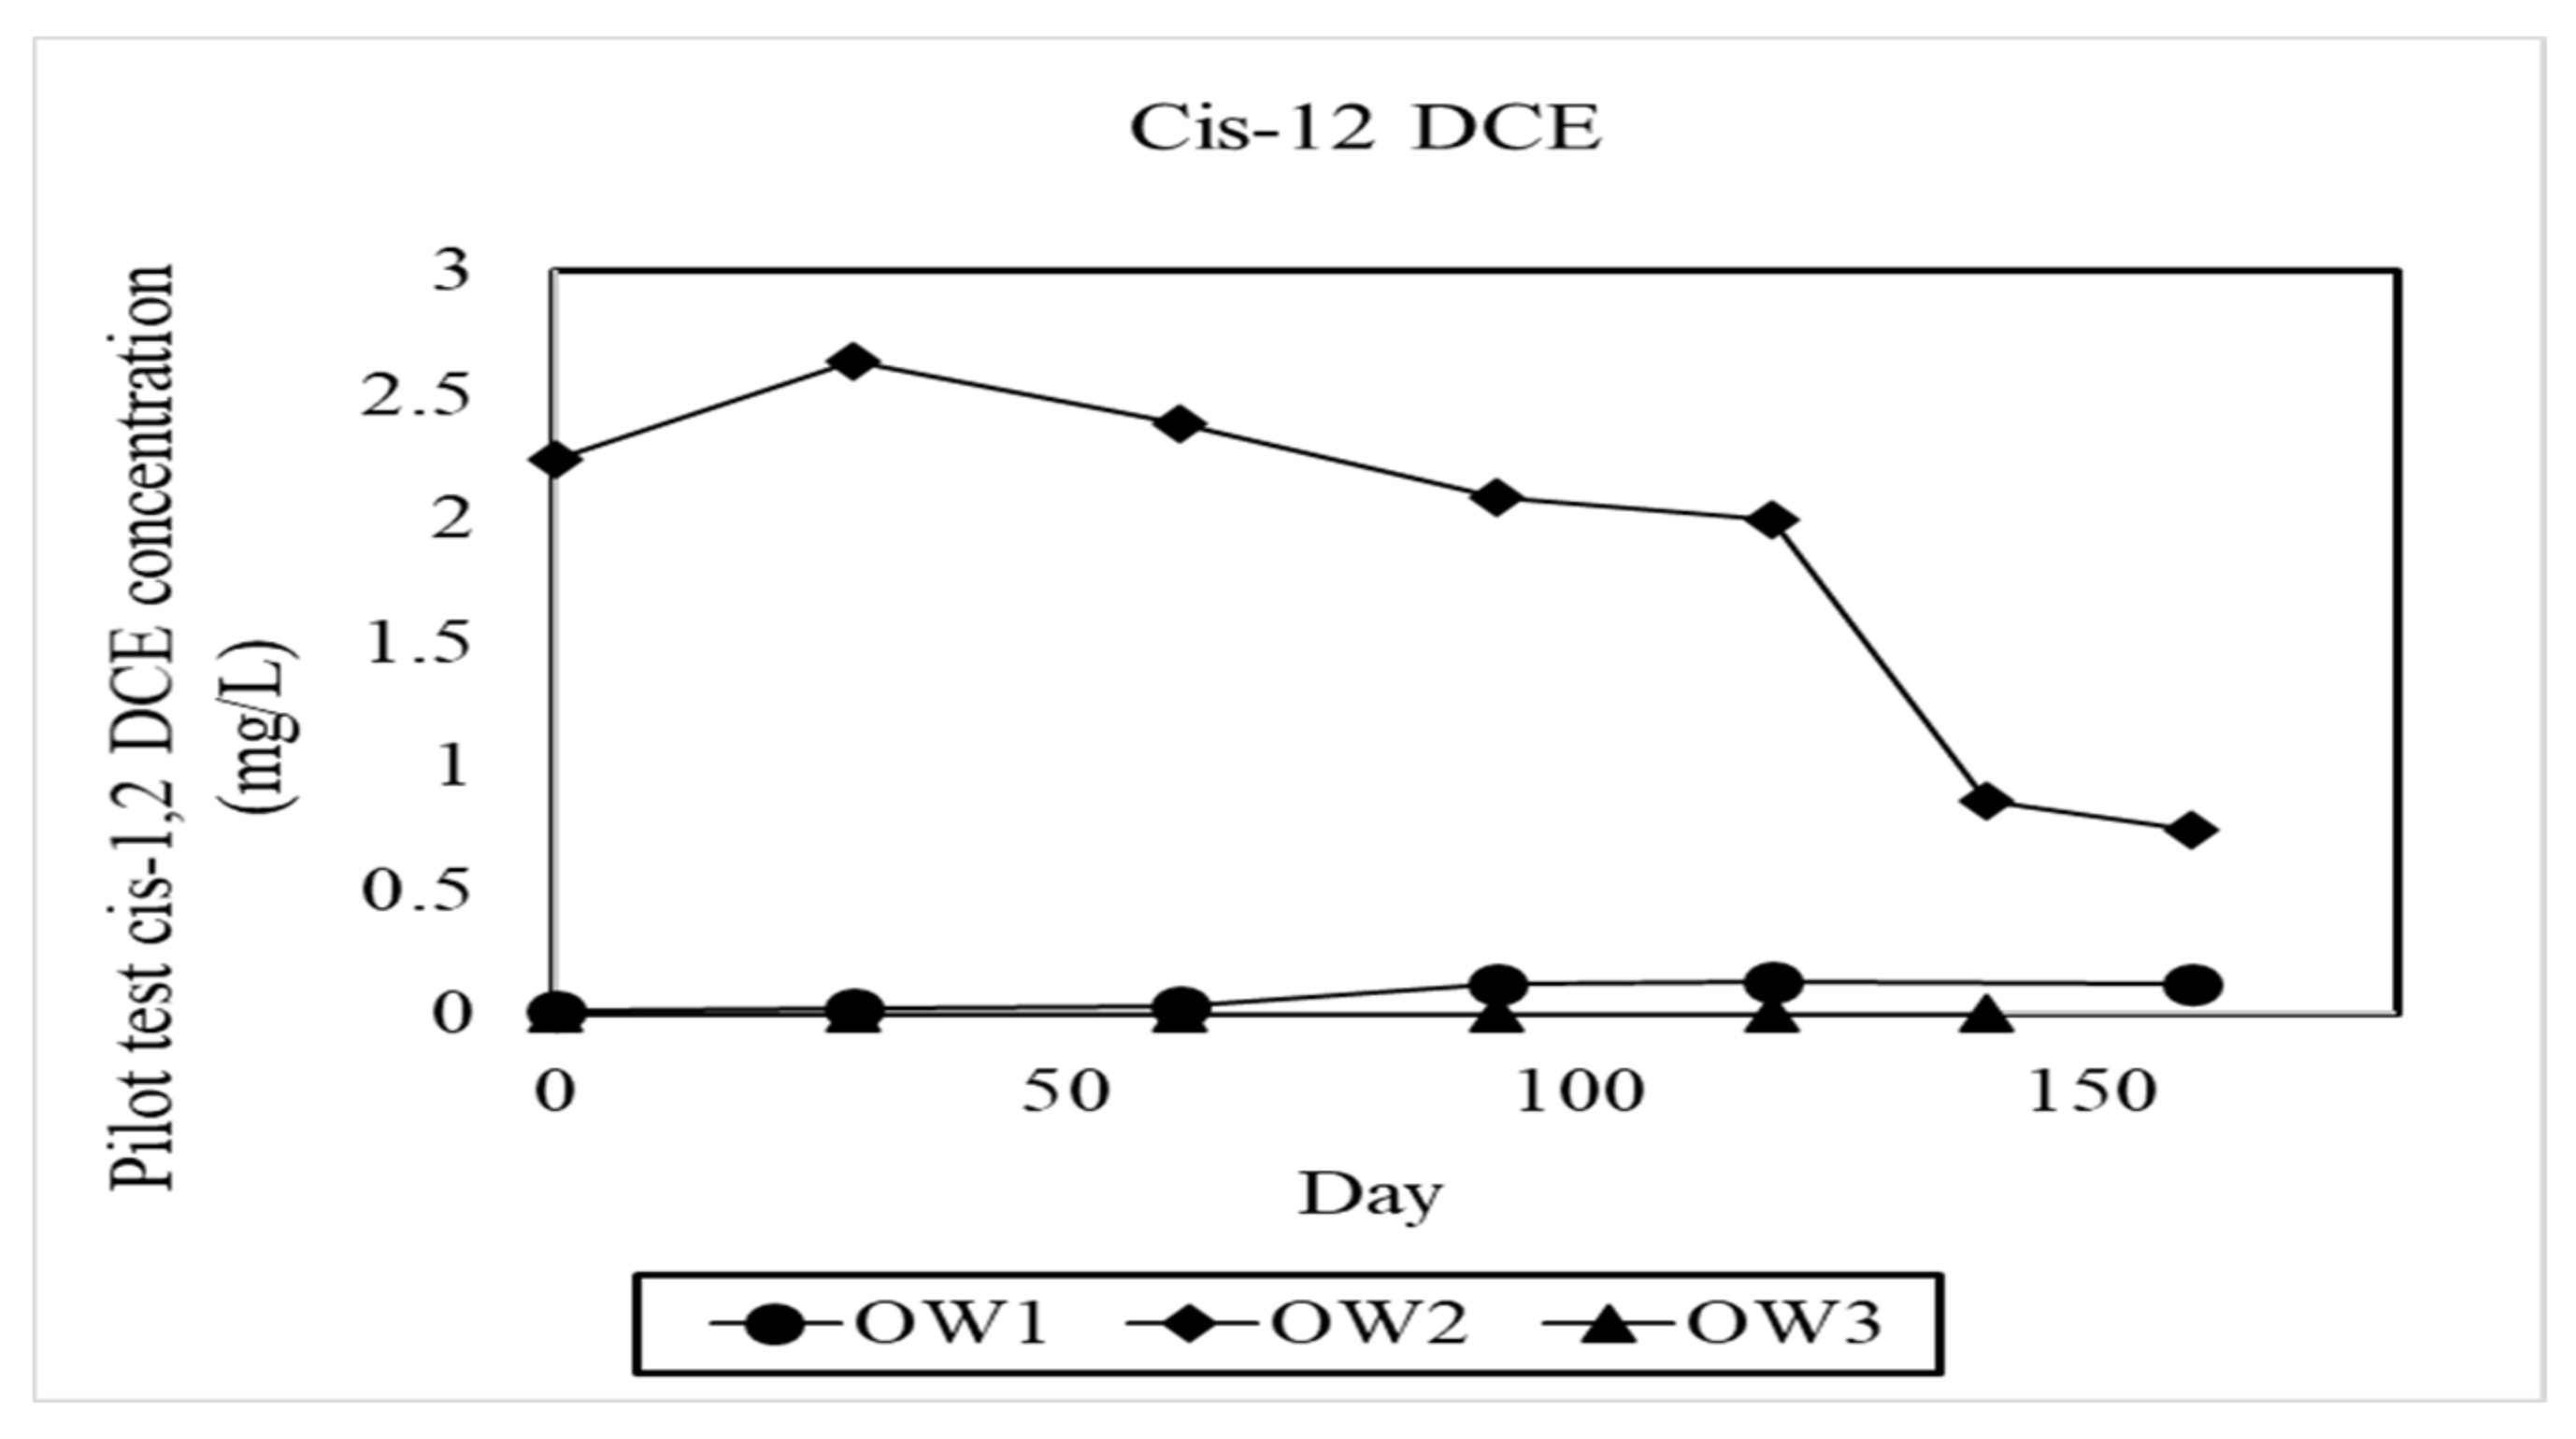
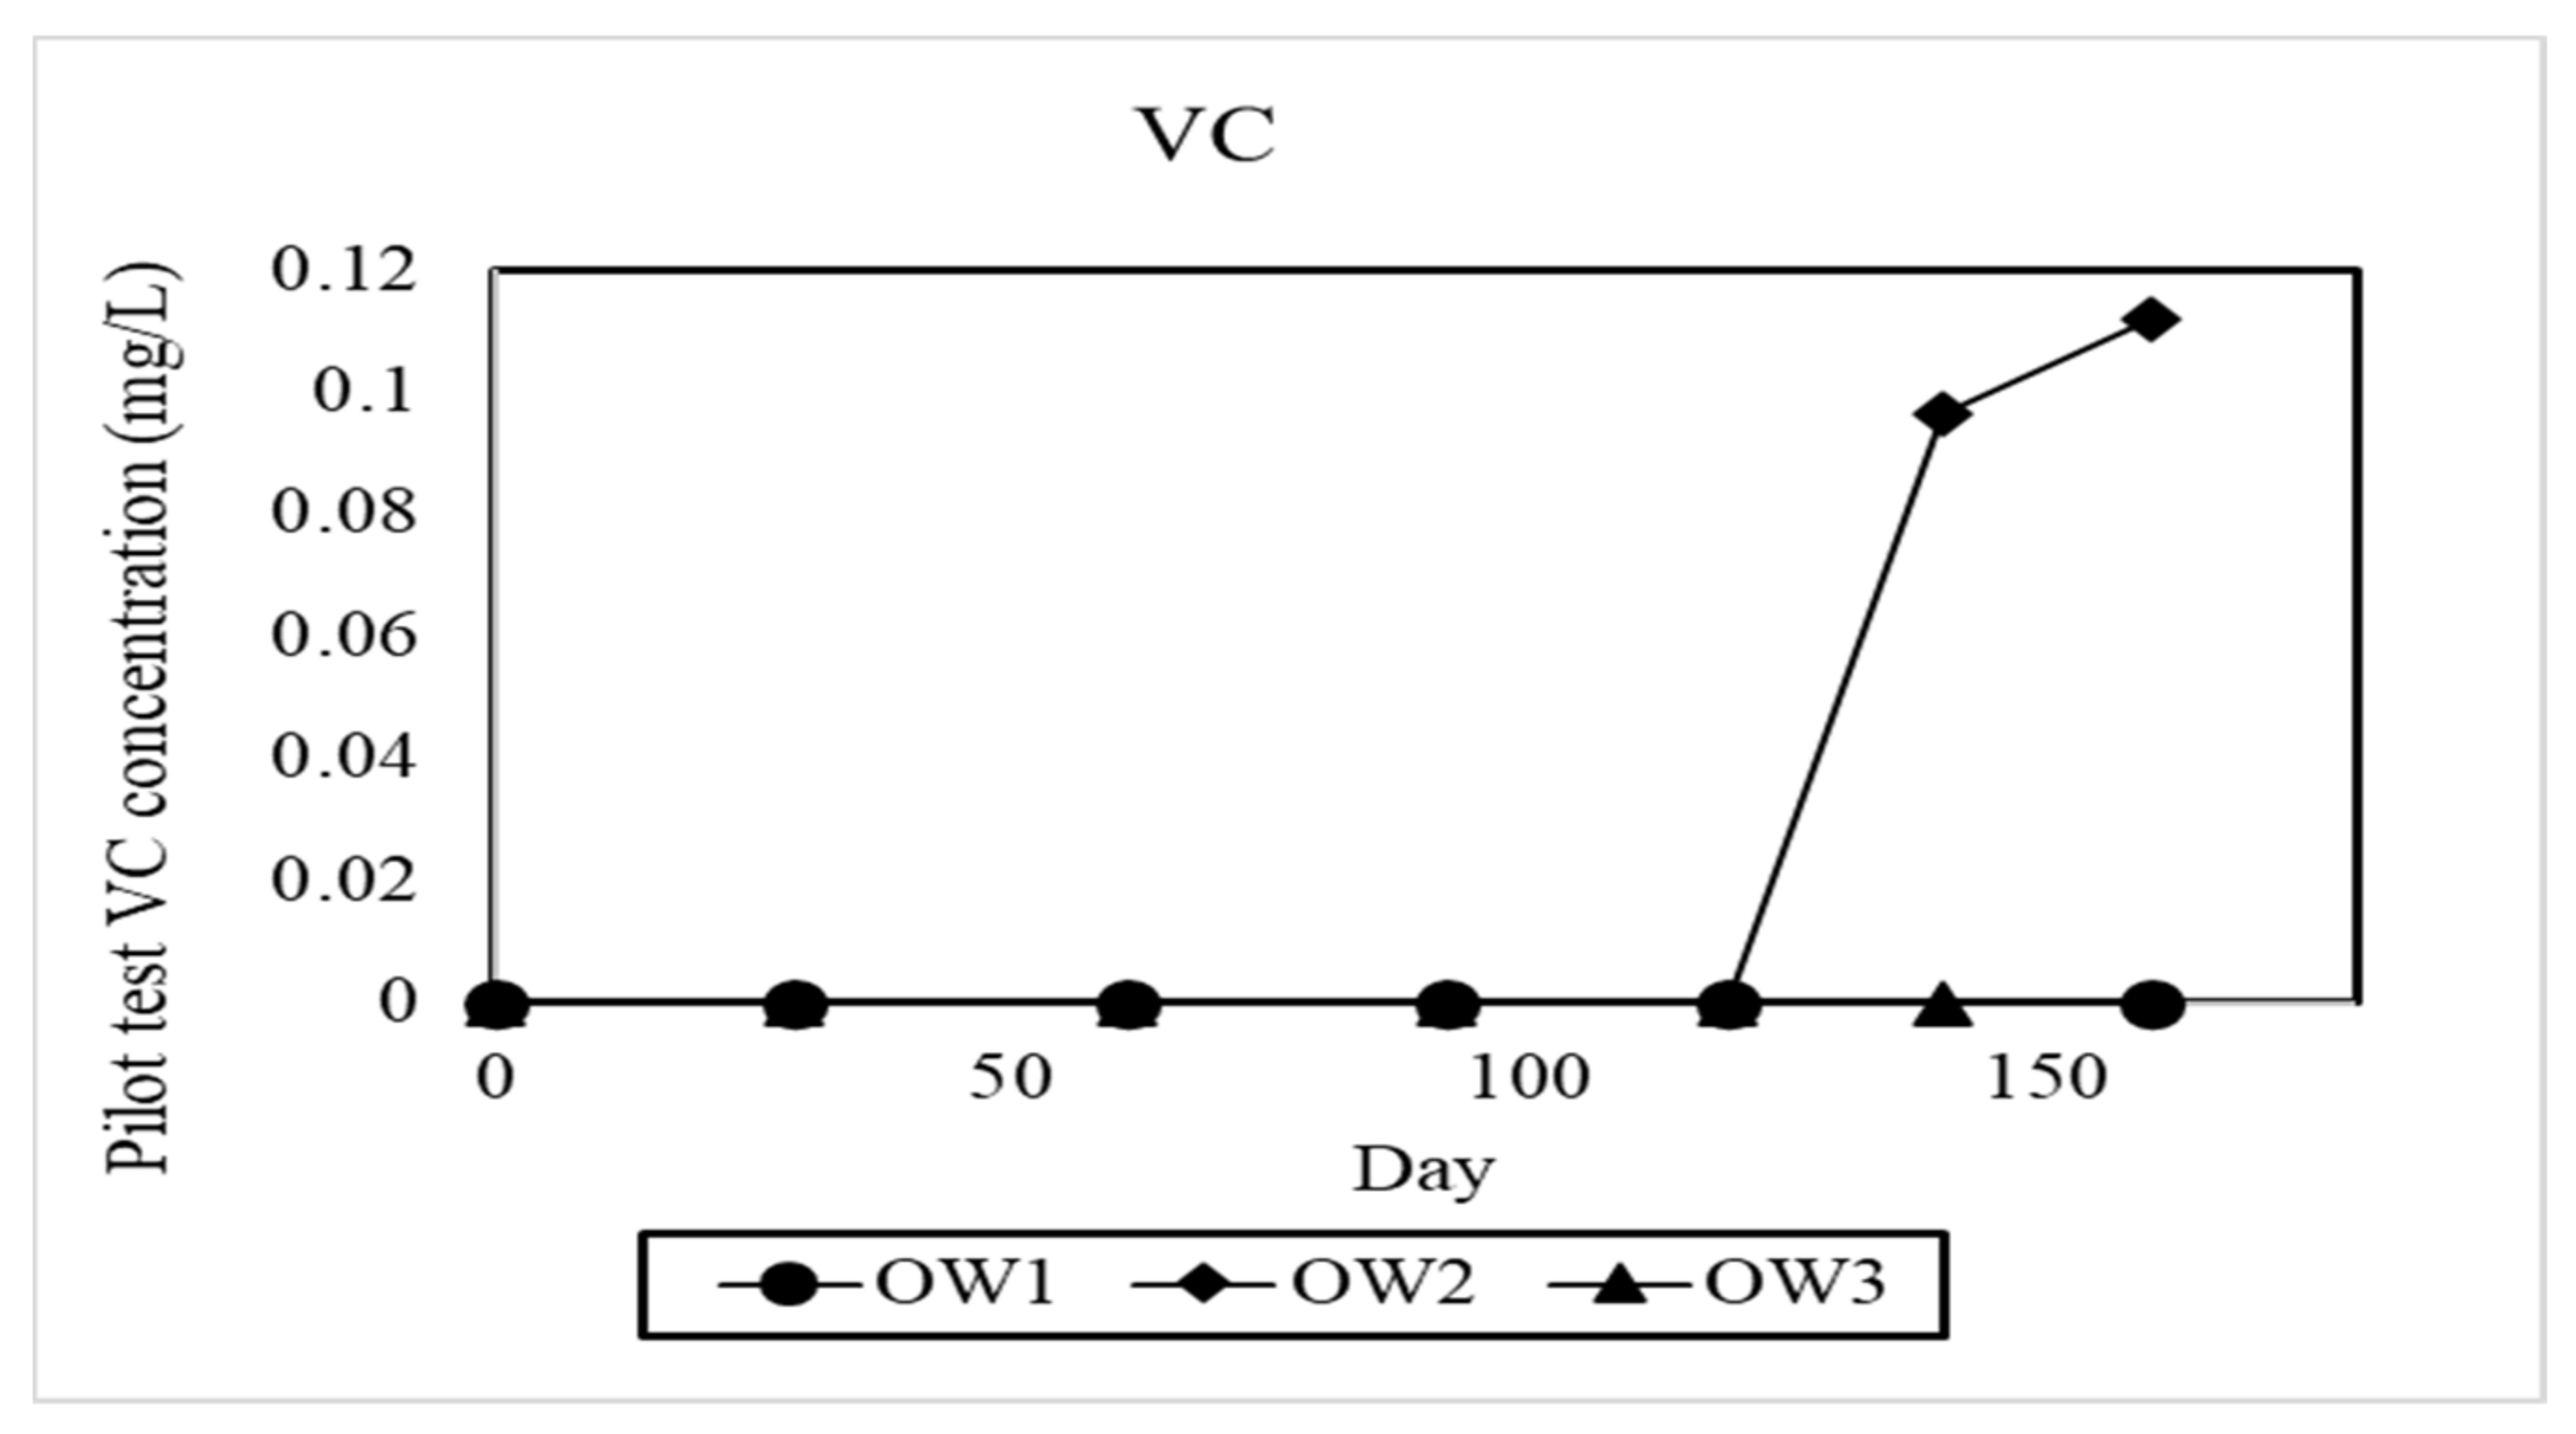
3.2.3. TCE and Derivatives’ Concentration Variations

The TCE concentrations monitored after injection during the in situ biological field test are presented in Figure 7. Following the first injection, because the injection volume was insufficient, the TCE concentrations in OW1, OW2, and OW3 did not decrease in the first 30 days. After the second injection, the TCE concentrations in OW1, OW2, and OW3 decreased. As the CW lacked electron donors, the TCE concentration at CW remained at 0.8–1.0 mg/L, suggesting a low natural attenuation rate of TCE at the site. The distance between OW1 and the IW was the shortest, so TOC concentrations at OW1 were higher than those at OW2 and OW3. TCE concentrations at OW1 decreased from 0.225 mg/L to 0.033 mg/L on day 60, reaching a TCE removal rate of approximately 85%. The results of the microcosm test revealed that SOE+FL accelerated the TCE degradation rate, corresponding to the substantial decrease in TCE concentrations. On day 160 of the in situ field test, TCE concentrations at OW1 were lower than 0.01 mg/L, which is lower than the TCE monitoring standard of groundwater-related regulations. Prior to day 90, TOC concentrations at OW2 and OW3 were already substantially low, so further decreases in concentration were not observed. After day 90, TCE concentrations at OW2 decreased observably. On day 160, TCE concentrations at OW2 decreased from 0.164 mg/L to 0.0685 mg/L, reaching a TCE removal rate of approximately 58%. At OW3, TOC concentrations increased slowly and, as a result, TCE concentrations at OW3 did not decrease in a notable manner. On day 140 (OW3 was not analyzed on day 160), the TCE concentration of OW3 decreased from 0.636 mg/L to 0.048 mg/L, satisfying the groundwater regulation standards of TCE, Taiwan Groundwater Pollution Control Standards, as shown on Table 2 [30]; however, the removal rate was a mere 25%. A possible cause of the low removal rate can be attributed to the long distance between OW3 and the IW, which required a long transmission time for the chemicals to reach OW3, thus shortening the time allotted for stabilizing the groundwater environment. A longer testing time was required for observable effectiveness to be achieved.
Anaerobic reductive dechlorination of TCE derives chlorinated byproducts. Scientific literature has indicated that microbial degradation of soybean oil may generate organic acid and hydrogen atoms, which replace the chlorine atoms. During the reductive dechlorination process, intermediates such as cis-1,2-DCE, VC, and the final product ethene are produced [11,31]. The cis-1,2-DCE and VC concentrations of each monitoring well during the in situ biological field tests are presented in Figure 8 and Figure 9, respectively. The results revealed that, although substantial TCE degradation was observed to begin on day 60 at OW1, no apparent accumulation of cis-1,2-DCE and VC concentrations was observed. On day 160, the cis-1,2-DCE concentration of OW1 increased from 0.012 mg/L to 0.124 mg/L, exhibiting no considerable accumulation. VC concentrations at OW1 were lower than the detection limit (<0.01 mg/L). At OW2, cis-1,2-DCE concentrations varied similarly to the TCE concentration variations observed in the well. The concentrations clearly began to decrease on day 90. The cis-1,2-DCE concentration at OW2 decreased from 2.63 mg/L to 0.742 mg/L on day 160, reaching a removal rate of 72%. The VC concentration at OW2 increased from below the detection limit (<0.01 mg/L) to 0.112 mg/L. The OW1 monitoring results revealed that, although the TCE concentration decreased considerably, the metabolites did not accumulate in a notable manner. DCE concentration even decreased rapidly after day 90. These results suggested that adding FL in emulsions accelerated metabolite degradation and decreased metabolite accumulation. However, as the distance from the IW increased, the FL concentration became insufficient and caused the accumulation of metabolites such as VC, as observed in OW2. Sheu [32] compared PCE and TCE degradation effectiveness in microcosm tests in 2015 using two substrates—a general emulsified oil substrate (EOS) and a long-lasting emulsified colloidal substrate (LECS), a combination of EOS and nanoscale zero-valent iron (nZVI). The test results indicated that the VC concentration was about 0.5 mg/L 130 days after the EOS application. However, VC concentration met Taiwan Groundwater Control Standards 130 days after the LECS application. It was verified that nZVI of LECS did not result in the cumulation of metabolic byproducts compared with EOS. Ferrous lactate used in the test had similar effectiveness as in Sheu’s tests.

4. Summary

This study evaluated the effect of SOE+FL on anaerobic reductive dechlorination of TCE. The following conclusions were drawn: (1) the results of laboratory microcosm test and pilot test revealed that SOE+FL accelerated TCE degradation and minimized the accumulation of DCE and VC more than SOE alone; (2) a double packer injection well, constructed using a Manchette tube, can provide surgical injection of chemicals at contaminated intervals; (3) the in situ bioremediation pilot test results revealed that the SOE+FL solution transported in the underground environment continued to be released for at least 90 days, with a radius of influence of at least 5 m.

Author Contributions

Experiment design and execution, M.-H.L. and C.-M.H.; manuscript writing/review, C.-E.L., M.-H.L., and J.L.; analysis, M.-H.L. and J.L.; project administration, M.-H.L. All authors have read and agreed to the published version of the manuscript.

Funding

This study was funded by the research project supported by the Taiwan EPA (grant number 109GA0006002009). The views or opinions expressed in this article are those of the writers and should not be construed as opinions of the Taiwan EPA. Mention of trade names, vendor names, or commercial products does not constitute endorsement or recommendation by Taiwan EPA.

Institutional Review Board Statement

Not applicable.

Informed Consent Statement

Informed consent was obtained from all subjects involved in the study.

Data Availability Statement

The data presented in this study are available on request from the corresponding author.

Conflicts of Interest

The authors declare no conflict of interest.

References

  1. Morrison, R.D. Application of forensic techniques for age dating and source identification in environmental litigation. Environ. Forensics 2000, 1, 131–153. [Google Scholar] [CrossRef]
  2. International Agency for Research on Cancer. World Cancer Report 2014; Stewart, B.W., Wild, C.P., Eds.; IARC: Lyon Cedex 08, France, 2014; p. 152. ISBN 978-92-832-0443-5. [Google Scholar]
  3. Purdue, M.P.; Stewart, P.A.; Friesen, M.C.; Colt, J.S.; Locke, S.J.; Hein, M.J.; Waters, M.A.; Graubard, B.I.; Davis, F.; Ruterbusch, J.; et al. Occupational exposure to chlorinated solvents and kidney cancer: A case-control study. Occup. Environ. Med. 2017, 74, 268–274. [Google Scholar] [CrossRef] [PubMed]
  4. Yang, Y.; McCarty, P.L. Comparison between donor substrates for biologically enhanced tetrachloroethene DNAPL dissolution. Environ. Sci. Technol. 2002, 36, 3400–3404. [Google Scholar] [CrossRef]
  5. Hunter, W.J. Bioremediation of chlorate or perchlorate contaminated water using permeable barriers containing vegetable oil. Curr. Microbiol. 2002, 45, 287–292. [Google Scholar] [CrossRef] [PubMed]
  6. Hunter, W.J. Injection of innocuous oils to create reactive barriers for bioremediation: Laboratory studies. J. Contam. Hydrol. 2005, 80, 31–48. [Google Scholar] [CrossRef]
  7. Hunter, W.J.; Shaner, D.L. Nitrogen limited biobarriers remove atrazine from contaminated water: Laboratory studies. J. Contam. Hydrol. 2009, 103, 29–37. [Google Scholar] [CrossRef] [PubMed]
  8. Lieberman, M.T.; Borden, R.C.; Zawtocki, C.; May, I.; Casey, C. Long term TCE source area remediation using short term emulsified oil substrate (EOS®) recirculation. In Proceedings of the 21st Annual International Conference on Soils, Sediments, and Water, University of Massachusetts, Amherst, MA, USA, 17 October 2005; pp. 17–20. [Google Scholar]
  9. Borden, R.C. Effective distribution of emulsified edible oil for enhanced anaerobic bioremediation. J. Contam. Hydrol. 2007, 94, 1–12. [Google Scholar] [CrossRef] [PubMed]
  10. Marks, C. Comparison of EHC®, EOS®, and Solid Potassium Permanganate Pilot Studies for Reducing Residual TCE Contaminant Mass; URS Corporation: San Francisco, CA, USA, 2012. [Google Scholar]
  11. Aulenta, F.; Fuoco, M.; Canosa, A.; Papini, M.P.; Majone, M. Use of poly-β-hydroxy-butyrate as a slow-release electron donor for the microbial reductive dechlorination of TCE. Water Sci. Technol. 2008, 57, 921–925. [Google Scholar] [CrossRef]
  12. Fuller, M.E.; Schaefer, C.E.; Steffan, R.J. Evaluation of a peat moss plus soybean oil (PMSO) technology for reducing explosive residue transport to groundwater at military training ranges under field conditions. Chemosphere 2009, 77, 1076–1083. [Google Scholar] [CrossRef]
  13. Hunter, W.J.; Shaner, D.L. Studies on removing sulfachloropyridazine from groundwater with microbial bioreactors. Curr. Microbiol. 2011, 62, 1560–1564. [Google Scholar] [CrossRef]
  14. Chambers, J.; Wilkinson, P.B.; Wealthall, G.P.; Loke, M.H.; Dearden, R.A.; Wilson, R.; White, D.; Ogilvy, R.D. Hydrogeophysical imaging of deposit heterogeneity and groundwater chemistry changes during DNAPL source zone bioremediation. J. Contam. Hydrol. 2010, 118, 43–61. [Google Scholar] [CrossRef] [Green Version]
  15. Boni, M.R.; Sbaffoni, S. The potential of compost-based biobarriers for Cr (VI) removal from contaminated groundwater: Column test. J. Hazard. Mater. 2009, 166, 1087–1095. [Google Scholar] [CrossRef] [PubMed]
  16. Hunter, W.J.; Shaner, D.L. Biological remediation of groundwater containing both nitrate and atrazine. Curr. Microbiol. 2010, 60, 42–46. [Google Scholar] [CrossRef] [PubMed]
  17. Leombruni, A.; Mueller, M.; Seech, A.; Leigh, D. Field application of a reagent for in site chemical reduction and enhanced reductive dichlorination treatment of an aquifer contaminated with tetrachloroethylene (PCE), trichloroethylene, 1,1-dichloroethylene, dichloropropane and 1,1,2,2-tetrachloroethane (R-130). Environ. Eng. Manag. J. 2020, 19, 1791–1796. [Google Scholar]
  18. Philips, J.; Haest, P.J.; Springael, D.; Smolders, E. Inhibition of geobacter dechlorinators at elevated trichloroethene concentrations is explained by a reduced activity rather than by an enhanced cell decay. Environ. Sci. Technol. 2013, 47, 1510–1517. [Google Scholar]
  19. Sleep, B.E.; Seepersad, D.J.; Mo, K.; Heidorn, C.M.; Hrapovic, L.; Morrill, P.L.; McMaster, M.L.; Hood, E.D.; LeBron, C.; Lollar, B.S.; et al. Biological enhancement of tetrachloroethene dissolution and associated microbial community changes. Environ. Sci. Technol. 2006, 40, 3623–3633. [Google Scholar] [CrossRef]
  20. Matheson, L.J.; Tratnyek, P.G. Reductive dehalogenation of chlorinated methanes by iron metal. J. Environ. Sci. Technol. 1994, 28, 2045–2053. [Google Scholar] [CrossRef]
  21. Su, C.; Puls, R.W.; Krug, T.A.; Watling, M.T.; O’Hara, S.K.; Quinn, J.W.; Ruiz, N.E. A two and half-year-performance evaluation of a field test on treatment of source zone tetrachloroethene and its chlorinated daughter products using emulsified zero valent iron nanoparticles. Water Res. 2012, 46, 5071–5084. [Google Scholar] [CrossRef]
  22. Li, X.Q.; Brown, D.G.; Zhang, W.X. Stabilization of biosolids with nanoscale zero-valent iron (nZVI). J. Nanopart. Res. 2007, 9, 233–243. [Google Scholar] [CrossRef]
  23. Herrero, J.; Puigserver, D.; Nijenhuis, I.; Kuntze, K.; Carmona, J.M. Combined use of ISCR and biostimulation techniques in incomplete processes of reductive dehalogenation of chlorinated solvents. Sci. Total Environ. 2019, 648, 819–829. [Google Scholar] [CrossRef]
  24. Su, C.; Puls, R.W.; Krug, T.A.; Watling, M.T.; O’Hara, S.K.; Quinn, J.W.; Ruiz, N.E. Travel distance and transformation of injected emulsified zerovalent iron nanoparticles in the subsurface during two and half years. Water Res. 2013, 47, 4095–4106. [Google Scholar] [CrossRef] [PubMed]
  25. National Institute of Environmental Analysis (NIEA); Taiwan EPA. T, NIEA W785.57B. 2020. Available online: https://www.epa.gov.tw/niea/3617C6A64E37A35A (accessed on 28 July 2021).
  26. National Institute of Environmental Analysis (NIEA); Taiwan EPA. Determination of Total Organic Carbon in Water-Peroxypyrosulfate Heating Oxidation/Infrared Measurement Method, NIEA W532.52C. 2009. Available online: https://www.epa.gov.tw/niea/99FCF9EFD3CB163C (accessed on 28 July 2021).
  27. National Institute of Environmental Analysis (NIEA); Taiwan EPA. Determination of Nitrate Nitrogen and Nitrite Nitrogen in Water-Cadmium Reduction Flow Analysis Method, NIEA W436.52C. 2015. Available online: https://www.epa.gov.tw/niea/C8FB816F3E6542A2 (accessed on 28 July 2021).
  28. National Institute of Environmental Analysis (NIEA); Taiwan EPA. Determination of Inorganic Anions in Drinking Water by Ion Chromatography, NIEA W415.54B. 2018. Available online: https://www.epa.gov.tw/niea/2C82301AFEA0B53A (accessed on 28 July 2021).
  29. Ritalahti, K.M.; Amos, B.K.; Sung, Y.; Wu, Q.; Koenigsberg, S.S.; Löffler, F.E. Quantitative PCR targeting 16S rRNA and reductive dehalogenase genes simultaneously monitors multiple Dehalococcoides strains. Appl. Environ. Microbiol. 2006, 72, 2765–2774. [Google Scholar] [CrossRef] [PubMed] [Green Version]
  30. Taiwan Environmental Protection Administration. Groundwater Pollution Control Standards. In Soil and Groundwater Pollution Remediation Act; Taiwan Environmental Protection Administration: Taipei, Taiwan, 2000. [Google Scholar]
  31. Tarnawski, S.E.; Rossi, P.; Brennerova, M.V.; Stavelova, M.; Holliger, C. Validation of an integrative methodology to assess and monitor reductive dechlorination of chlorinated ethenes in contaminated aquifers. Front. Environ. Sci. 2016, 4, 1–16. [Google Scholar] [CrossRef] [Green Version]
  32. Sheu, Y.T. Application of a Long-Lasting Colloidal Substrate with pH and Hydrogen Sulfide Control Capabilities for TCE-Contaminated Groundwater Remediation. Ph.D. Dissertation, Institute of Environmental Engineering, National Sun Yat-Sen University, Kaohsiung, Taiwan, 2015. [Google Scholar]
Figure 1. In situ biological field test well distribution.
Applsci 11 08374 g001
Figure 2. In situ geological structure and layered formation of the injection well: (a) in situ biological field geologic structure; (b) double packer injection well structure.
Applsci 11 08374 g002
Figure 3. Environmental parameter variation in the microcosm tests: (a) pH; (b) ORP; (c) DO; and (d) EC.
Applsci 11 08374 g003
Figure 4. Water quality parameter variation in the microcosm tests: (a) TOC; (b) nitrate; (c) nitrite; and (d) sulfate.
Applsci 11 08374 g004
Figure 5. Effects of different emulsions on chlorinated pollutants in the microcosm tests: (a) TCE and (b) cis-1,2-DCE.
Applsci 11 08374 g005
Figure 6. TOC concentration variations before and after injection for each monitoring well in the in situ field testing.
Applsci 11 08374 g006
Figure 7. TCE concentration variation of each monitoring well in the in situ field testing.
Applsci 11 08374 g007
Figure 8. cis-1,2-DCE concentration variation of each monitoring well in the in situ field testing.
Applsci 11 08374 g008
Figure 9. VC concentration variation of each monitoring well in the in situ field testing.
Applsci 11 08374 g009
Table 1. Environmental water quality parameter comparison of OW2 and CW in the in situ field testing.
WellSampling DaypHDO
(mg/L)
ORP
(mV)
Nitrate
(mg/L)
Nitrite
(mg/L)
Fe
(Ⅱ)(mg/L)
Sulfate
(mg/L)
Sulfide
(mg/L)
OW206.411.943287.92ND0.0945.7ND
296.422.323168.990.0020.0643.7ND
616.410.52729.49ND0.539.8ND
1196.441.83858.620.0050.1844.1<0.04
1406.261.11-20.84ND3.650.30.22
CW06.781.6-50.02ND0.08122ND
296.671.73230.03ND0.35128ND
616.570.65-80.02ND1.051300.02
926.260.071030.05N.D.0.021220.03
1196.451.382020.080.0030.35127<0.04
1406.161.8640.04ND1.98127ND
Table 2. Taiwan Groundwater Control Standards.
Control ItemControl Standards (mg/L)
Class I
Groundwater
Class II
Groundwater
TCE0.0050.05
cis-1,2-DCE0.070.7
trans-1,2-DCE0.11.0
VC0.0020.02
Note: Class I is for groundwater in drinking water resource protection area; Class II is for groundwater outside the Class I area.
Publisher’s Note: MDPI stays neutral with regard to jurisdictional claims in published maps and institutional affiliations.

