
Optimization of Storage Medium for Hematological Reference Samples in External Quality Assessment


1
Department of Biotechnology, Faculty of Chemical Engineering, Ho Chi Minh City University of Technology (HCMUT), 268 Ly Thuong Kiet Street, District 10, Ho Chi Minh City 700000, Vietnam
2
Vietnam National University Ho Chi Minh City, Linh Trung Ward, Thu Duc District, Ho Chi Minh City 700000, Vietnam
3
Center for Standardization and Quality Control in Medical Laboratory of HCMC, 75A Cao Thang Street, District 3, Ho Chi Minh City 700000, Vietnam
*
Authors to whom correspondence should be addressed.
Appl. Sci. 2021, 11(18), 8777; https://0-doi-org.brum.beds.ac.uk/10.3390/app11188777
Submission received: 5 July 2021
/
Revised: 13 September 2021
/
Accepted: 15 September 2021
/
Published: 21 September 2021
(This article belongs to the Section Biomedical Engineering)
Abstract
:Hematological reference samples for external quality assessment (EQA) in hematology are essential for many laboratories in Vietnam, however, the prices are high along with short storing time. This study attempted to establish an optimal formula for the manufacture of hematological reference samples for hematological EQA programs. Human red blood cells (RBCs) were mixed with goose RBCs (pseudo-leucocytes) and goat RBCs (pseudo-platelets) as alternatives for white blood cells (WBCs) and platelets (PLTs), respectively, in different formulas of storage media. The optimal formula was obtained using response surface methodology–central composite design (RSM-CCD). Three main factors affecting the concentrations of RBCs were determined by Plackett–Burmann matrix. The optimal concentrations determined by RSM-CCD were 46% serum, 0.44 g/L neomycin sulfate, and 2.5% glycerol. The model predicted that the maximum number of human RBCs was 4.1 × 10¹² cells/L, pseudo-leucocytes was 6.4 × 10⁹ cells/L, and pseudo-platelets was 188 × 109 cells/L. The practical concentrations of RBCs, pseudo-leucocytes, and pseudo-platelets were 4.21 × 10¹² cells/L, 6.4 × 10⁹ cells/L, and 187 × 109 cells/L, respectively, which showed 98.93% similarity with theoretical data. This result could be a premise for further study to improve manufacturing of hematological reference samples for hematology EQA programs.
1. Introduction
Hematology testing has been essential in the paraclinical field, contributing greatly to the diagnoses and treatments for hematologic diseases. Hence, hematology test results need to be reliable and standardized with frequent internal control and external evaluations [1,2,3].
The research and manufacture of hematology EQA samples have been conducted on many kinds of hematocyte originating from both human and animals. For instance, a hematology EQA sample based on the use of human and animal red blood cells (RBCs) as alternatives for white blood cells (WBCs) and platelets (PLTs) was generated [4,5]. The RBCs originating from sharks, alligators, and turkeys were readable by automated hematology analyzers from Abbott and Streck [4,5,6]. In Japan, fresh blood samples from patients were used as references for nine laboratories; however, the analyses were suggested to be carried out within 8 h after collecting [7]. In Vietnam, suitable references for ethnic variation are still lacking, and all of them are purchased from foreign countries. Therefore, studies on establishing hematological reference samples in Vietnam could help to facilitate the initiative and to mitigate the expenses. Geese and goats are not only common livestock in Vietnam, their RBC sizes are also similar to human WBCs and PLTs, respectively. Accordingly, they could be utilized as assumed cells for the reference samples. One of the requirements for an appropriate reference sample is stability for at least 3 months at 2–8 °C. Storage media are expected to be isotonic so that they can minimize the hemolysis process [3,8].
The Plackett–Burman designs are known as an efficient way to select key factors from a large pool of variables for screening purposes [9]. Factors affecting the stability of a blood cell preparation include the type of storage medium, antibiotics, antifungal agents, and other stabilizing agents. Response surface methodology–central composite design (RSM-CCD) has been used extensively for choosing optimal values of different factors in a wide variety of experiments. The results of factor selection can be shown on a surface coordinate system, in which the optimal point was the extrema of each system [10].
The current study aimed to examine various factors influencing the stability of hematology reference samples, using a Plackett–Burman matrix. RSM-CCD was used subsequently to optimize the concentrations of the influencing factors.
2. Materials and Methods
2.1. Materials
Human RBCs were from Blood Bank—HCMC Hematology and Transfusion Hospital. Goose RBCs (Anser cygnoides, 5–6 months of age) were used to make stimulated pseudo-leucocytes because of the similarity in size and having a nucleus compared to human white blood cells. Goat RBCs (Capra aegagrus hircus, 3–4 months of age) were used to make stimulated pseudo-platelets because of the similarity in size to human platelets. Both goose and goat whole blood samples were collected in the slaughter-house of food making facilities. Neomycin sulfate, chloramphenicol, sodium azide, cell stabilization buffer, glycerol, formaldehyde, and glutaraldehyde were purchased from Sigma-Aldrich (Burlington, MA, USA).
2.2. RBC Fixation
Human RBC fixation: The RBCs were collected and resuspended in phosphate-buffered saline (PBS). The suspensions were shaken gently for 15–30 min at room temperature, and stored at 2–8 °C overnight. The pellets were collected and then resuspended in Alsever’s solution.
Goose and goat RBC fixation: 100 mL whole blood in CPDA-1 from geese and goats was centrifuged at 2000 rpm for 15 min, to gain the sedimental part including red blood cells The cell pellets were collected and washed three times using PBS to obtain RBCs. The RBCs were fixed with PBS buffer containing 25% glutaraldehyde, 3% ethylenglycol, and 0.033 (g/L) neomycin sulfate. The mixture was shaken for 18 h at 37 °C before being centrifuged at 2000 rpm for 15 min and the supernatant was discarded. The cell pellets were washed 2–3 times with 8.5 g/L sodium chloride until the red color indicating hemolysis disappeared in the suspension. The fixed cells were stored in 8.5 g/L sodium chloride.
2.3. Defining the Stability of Red Blood Cells
The combined cell samples have the ultimate feature of red blood cells (RBCs of humans, geese, and goats). Therefore, the stability of three kinds of RBCs was defined in NaCl liquid diluted from 0.26 to 0.60% (equivalent of osmotic levels from 89 mOsmol/kg to 205 mOsmol/kg). This was the base for osmotic adjustment in order to be suitable with combined 3-cell medium [11].
The experiment was designed for each kind of RBC in every vial with numbers from 1 to 18 following a reduction in the NaCl concentration from 0.60–0.26%, 0.02% at every step, and 20 µL RBC dense liquid. After that, each vial was lightly stirred 2 times, left for 30 min, centrifuged at 200 rpm for 5 min, and the hemolysis of RBCs was observed. Simultaneously, the research also defined the value of hemoglobin (HGB) and mean corpuscular volume (MCV) in 3 RBC samples by using an ABX hematology automatic analyzer (HORIBA, Germany) with the prediction that these RBCs of geese and goats after being stabilized did not affect the hemoglobin and MCV of human RBCs in combined samples.
2.4. Screening of Affecting Factors
The reference samples for hematology diagnostics need to have long shelf life to provide enough time for laboratories to perform the tests, including distribution time. The concentrations of the cells were similar to those in normal blood samples, which were 3.5–4.5 × 10¹² RBCs/L, 4.5–8.5 × 10⁹ WBCs/L, and 150–250 × 109 PLTs/L [8].
A Plackett–Burman design was used to evaluate the level of influence of each factor on the concentrations of blood cells with two levels: low (−1) and high (+1). The factors chosen for this design were the concentrations of serum, neomycin sulfate, chloramphenicol, sodium azide, and glycerol [12]. The concentration ranges of neomycin sulfate and chloramphenicol concentrations were extended to increase the possibility of finding optimal concentrations. Sodium azide and glycerol were added to enhance the antifungal activity and viscosity, and to mitigate the hemolysis in storage media (Table S1) [13,14].
2.5. Optimization of Components in Storage Medium
The concentrations of blood cells in 1000 mL storing buffer were determined at specific values in the normal range of human blood samples, which were 4.12 × 10¹² cells/L, 6.3 × 10⁹ cells/L, and 195 × 109 cells/L for RBCs, pseudo-leucocytes, and pseudo-platelets, respectively. The components in the storage media were set at specific concentration ranges, and the concentrations of blood cells were set at 3.5–4.5 × 10¹² cells/L for RBCs, 4.5–8.5 × 10⁹ cells/L for pseudo-leucocytes, and 150–250 × 109 cells/L for pseudo-platelets. The storing duration in this test was set at 3 months, at a storing temperature of 2–8 °C.
The optimal values of three main factors chosen from the previous test were evaluated using a scale of 5 levels (−α, −1, 0, +1, +α) with CCD for 20 experiments, following the formula 2n + 2n + 6 (n was the number of factors used in RSM-CCD). The RSM-CCD matrix with eight different experiments was conducted using three factors at both high and low levels. Six experiments were then conducted for α hand and another six for the center.
The chosen response functions were RBCs (Y1, A × 109 cells/L), pseudo-leucocytes (Y2, B × 109 cells/L), and pseudo-platelets (Y3, C × 109 cells/L), where A, B, and C were the cell concentrations after 3 months of storage at 2–8 °C. The functions were expressed as a quadratic equation: Y = b0 + b1x1 + b2x2 + b3x3 + b11x12 + b22x22 + b33x32 + b12x1x2 + b23x2x3 + b13x1x3, where b1, b2, and b3 were linear coefficients, b12, b23, b13 were interactive term coefficients, b11, b22, b33 were quadratic term coefficients. The optimal values of the factors were determined as values where maximum cell concentrations were maintained [10].
2.6. Evaluation of the Experimental Model
The optimal storage media conditions for blood cells were chosen based on RSM-CCD analysis and the accuracy of the predictive model was assessed by calculating the percentage of similarity between the results from the model and the actual data. The experiment was repeated three times.
Moreover, the stability and homogeneity of RBCs, WBCs, and PLTs in the storage medium were validated during the storage time of 3 months at 2–8 °C. Firstly, a total of 50 samples were equally divided into two lots and one of them was randomly collected from each lot. Each collected sample was tested for its stability and homogeneity three independent times. A t-test (α = 0.05) and F-test (α = 0.05) were used to evaluate the stability and homogeneity of samples [15,16]. The number of RBCs, WBCs, and PLTs in the stored samples was identified by ABX (Horiba-Franch). Simultaneously, the stability of the stored samples was also validated by other machine models, including CellDyn 1700 and Mindray BC3000 once a month for 3 months.
2.7. Statistical Analysis
A t-test (α = 0.05), F-test (α = 0.05), and ANOVA (α = 0.1), with Excel 2010, Stata 10.0, and Design expert®7.0′ (Stat-Ease, Inc., Minneapolis, MN, USA) were used for the above calculations.
3. Results
3.1. Evaluation of RBC Durability
Hemolysis was monitored to assess the durability of three types of RBCs. Results showed that unfixed human RBCs (control) did not hemolyze in 0.60% and 0.58% NaCl, but started to hemolyze at a concentration of 0.56% (191 mOsmol/kg) and severely broke down at 0.46% (157 mOsmol/kg), evidenced by the increase in color intensity towards lower concentrations. On the other hand, fixed RBCs exhibited significantly higher durability, starting to hemolyze at a lower concentration of NaCl, 0.48% (164 mOsmol/kg), and being severely destroyed at 0.42% (144 mOsmol/kg). The data suggested that the durability of fixed human RBCs was higher than unfixed. In fact, the fixed human RBC samples withstand the osmolality at a concentration of 0.46% NaCl (157 mOsmol/kg), higher than that of unfixed red blood cells, at 0.58% (198 mOsmol/kg).
Results on fixed goose RBCs (pseudo-leucocytes) and goat RBCs (pseudo-platelets) showed that no hemolysis was observed in all 18 concentrations of NaCl. It can be explained that the membrane structures of both cell types were stabilized by the fixation reagents, and therefore unaffected by the external environmental conditions. In the study of Snigdha et al., avian and goat RBCs were completely hemolyzed at 100 mOsmol/kg and 200 mOsmol/kg, respectively. This proved that fixed avian and goat RBCs were more durable than unfixed RBCs. In conclusion, the blood cell durability tests showed that fixed cells were more durable than unfixed ones.
The result of defining the stability of RBCs showed that fixed RBCs are more durable than the unfixed ones. Fixed human RBCs were durable in the osmolality from 157 to 205 mOsmol/kg while goat and goose RBCs could withstand the osmolality at 89 to 205 mOsmol/kg. Values of HGB and MCV in goose and goat fixed RBCs were recorded by an ABX analyzer (Table 1). The results showed that HGB in goose and goat fixed RBCs was almost zero. This proved that there is no an increase in the value of HGB and MCV in the case of combination.
3.2. Investigation of Factors Affecting the Cell Concentrations
As stated above, serum was selected as the storage medium, while neomycin sulfate, chloramphenicol, sodium azide, and glycerol were added to increase the viscosity, limit bacterial and fungal infections, and ensure the stability of blood cells as well as reduce the hemolysis. Five factors were selected for initial screening, including serum, neomycin sulfate, chloramphenicol, sodium azide, and glycerol using a Plackett–Burman matrix (Table S2).
Factors with a positive and high level of influence were selected as affecting factors (Table 2). Results showed all three blood cells (human RBCs, pseudo-leucocytes, pseudo-platelets) were affected mostly and significantly by the three factors serum (%), neomycin sulfate (g/L), and glycerol (%) (p < 0.1). Results of screening of influencing factors showed that the dilution ratio of serum and blood cells, the concentration of antibiotic neomycin sulfate, and the ratio of glycerol were the most influencing factors on the stability of cell concentrations. Therefore, the serum, neomycin sulfate, and glycerol were chosen to expand the range of concentrations for the optimization design using RSM-CCD.
3.3. Optimization of the Components in the Storage Medium
After screening the factors affecting the number of blood cells (RBCs, pseudo-leucocytes, pseudo-platelets), optimization experiment was performed using RSM-CCD. Data was processed using Design expert® 7.0.0 (Table 3).
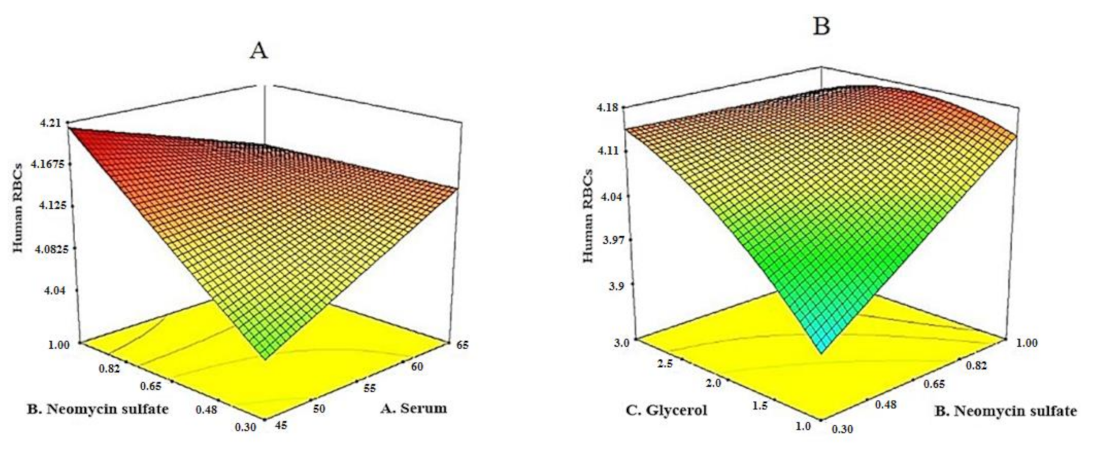
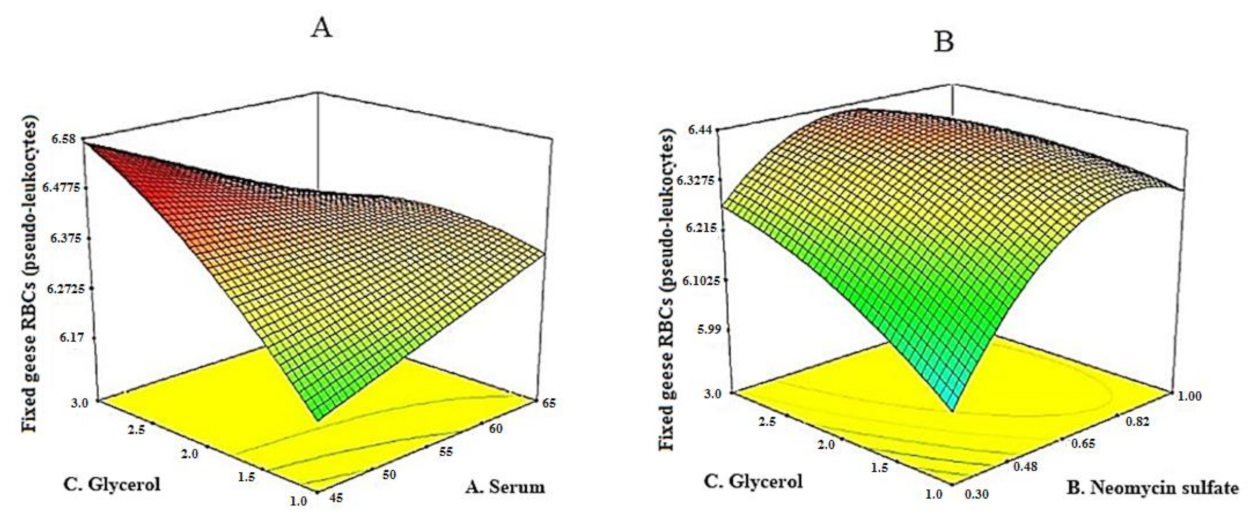
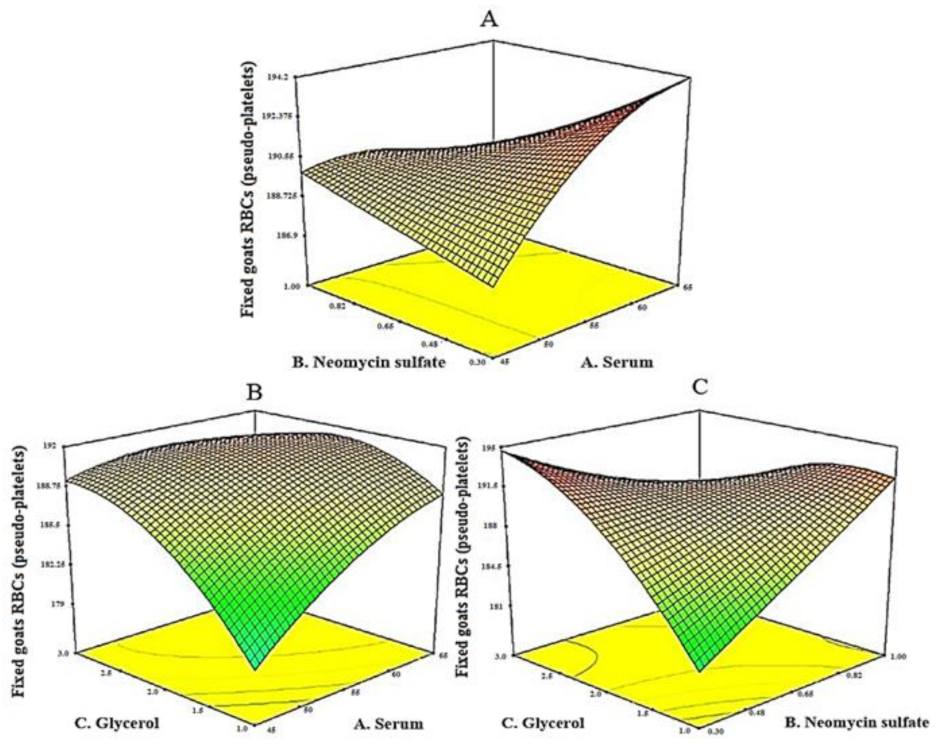
After performing analysis of variance (ANOVA), the values of coefficients calculated by Design expert® 7.0.0 were used as the predictive models of human RBCs (Y1), pseudo-leucocytes (Y2), and pseudo-platelets (Y3). The numbers of blood cells were expressed by the specific equations as follows: Y1 = 4.11 + 0.011x1 + 0.069x2 + 0.061x3 − 0.041x1x2 − 0.059x2x3 − 0.031x32, Y2 = 6.41 − 0.012x1 + 0. 081x2 + 0.096x3 − 0.100x1x3 − 0.075x2x3 − 0.15x22 − 0.041x32, and Y3=190.49 + 2.08x1 + 1.27x2 + 2.45x3 − 2.37x1x2 − 2.37x1x3 − 5.12x2x3 − 1.39x12 − 2.63x32, where, x1, x2, x3 were the concentrations of serum, neomycin sulfate, and glycerol, respectively.
The response surface (Figure 1, Figure 2 and Figure 3) showed the interaction of each pair of factors providing the maximum response function. The concentrations of the three identified variables (serum, neomycin sulfate, and glycerol) were set at the experimental level and the number of blood cells was set as follows: human RBCs from 3.5–4.5 × 10¹² cells/L, pseudo-leucocytes from 4.5–8.5 × 10⁹ cells/L, and pseudo-platelets from 150 and 250 × 109 cells/L. The data were processed using Design expert® 7.0.0, and 30 suspensions were found that could maximize the response function. To select the optimal suspension suitable for our research conditions, the ratio of serum in the storage medium was chosen as the deciding factor as the preparation of serum from plasma is costly. Therefore, the 24th suspension with the lowest serum concentration in comparison to other suspensions was selected. The optimal values of serum, neomycin sulfate, and glycerol were 46%, 0.44 g/L, and 2.5%, respectively. The model predicted that the maximum number of human RBCs would reach 4.1 × 10¹² cells/L, the pseudo-leucocytes 6.4 × 10⁹ cells/L, and the pseudo-platelets 188 × 109 cells/L.
3.4. Evaluation of Experimental Models
To test the results of the model, experiments were conducted according to the set values to obtain the number of blood cells as predicted. The osmosis of the combined sample according to the optimized formula was 200 ± 3 mOsmol/kg, and this osmotic condition was suitable for three kinds of RBCs (Table S3).
The average numbers of blood cells obtained from experimental results were 4.21 × 10¹² cells/L for human RBCs, 6.4 × 10⁹ cells/L for pseudo-leucocytes, 187 × 109 cells/L for pseudo-platelets. The compatibility between experimental and theoretical values was 99.73%, confirming the accuracy of the model and the existence of optimal points.
The results of the homogeneity evaluation of the stored samples from two different lots are shown in Table 4.
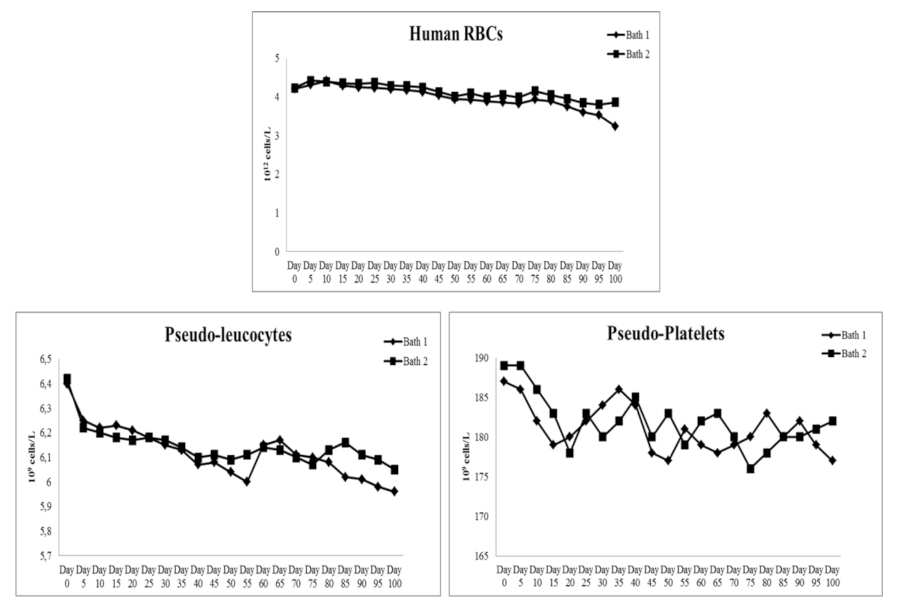
This result indicated that there was no significant difference between storage conditions at α = 0.05. The number of RBCs, WBCs, and PLTs was also identified every 5 days to determine their stability in the stored samples (Figure 4).
It was shown that the |tExperiment| value for RBCs (2.04) was higher than the tTheory value (2.03) on the 100th day. However, this |tExperiment| value was observed to be less than the tTheory value on the 95th testing day. This result indicated that the number of RBCs in the stored samples was stable up to the 95th storing day. Meanwhile, the |tExperiment| value for both WBCs and PLTs was found to be less than tTheory value up to 100th testing day. Collectively, the stability of the samples that were stored at 2–8 °C could be maintained up to the 95th storing day.
In addition, the stability of RBC, WBC, and PLT number was simultaneously tested on different machine models, such as a CellDyn 1700 and Mindray BC 3000. The result was tested once a month for three months and these data are shown in Table 5.
The result of ANOVA at α = 0.05 showed a similar number of RBCs, WBCs, and PLTs in the stored samples when they were tested on three different machine models, including ABX, CellDyn1700 and Mindray BC3000. This result indicated that the hematological reference samples agreed well with different machine models and can maintain their stability up to the 3rd month of storage time.
4. Discussion
To meet the requirements of hematological reference samples for EQAs in hematology, the storage time of samples should be up to 3 months at 2–8 °C and homogeneity and stability both within and between samples were guaranteed. It is necessary to find out the medium containing suitable base liquid, simultaneously optimizing factors that affected the storage of blood cells in this study. The research has found out that serum would be the best base liquid as well as optimized formula with a storage time at least 3 months at 2–8 °C of hematology EQA samples.
Goose and goat RBCs after stabilization with the liquid containing aldehyde would increase the durability of the cell membrane. These RBCs demonstrated durability in a high osmotic rate from 89 to 205 mOsmol/kg. The osmotic rate of the combined sample was 200 ± 3 mOsmol/kg and this concentration was also suitable with three kinds of RBCs in which human RBCs were stable as well as goose and goat RBCs without affecting HGB and MCV value.
Serum with nutritional components, such as minerals, glucose, protein, and enzymes, is the best substrate for preservation and to conduct surveys on stability and consistency. However, to prolong the life of the sample, a combination of chemicals such as neomycin sulfate, chloramphenicol, sodium azide, and glycerol will be added to the serum. Using Plackett–Burman design refinements to the influencing factors, dilution ratios between serum, blood cells, neomycin sulfate antibiotic concentrations, and the rate of glycerol are most influential factors for the stability of blood cells (confidence α = 0.1).
Response surface methodology (RSM) is a statistical method using quantitative data from experiments to determine and interpret multivariate equations. RSM explores the interactive relationship between the variables or multiple response variables. An R2 value of greater than 0.75 indicated that the model is compatible with experimental data, suggesting that there was a strong correlation between the factors and the number of blood cells. Results showed that the experimental data were compatible with the data predicted from the model on all three indexes, with R2 values of 0.9329, 0.9129, and 0.9091 for Y1, Y2, Y3, respectively. The predictive R2 values for the human RBCs, pseudo-leucocytes, and pseudo-platelets were 0.8439, 0.7432, 0.6968, consistent with the adjusted R2 values of 0.9019 (deviation at 0.058 < 0.2), 0.8620 (deviation at 0.1188 < 0.2), and 0.8430 (deviation at 0.1462 < 0.2), respectively. The signal-to-noise ratios for all three indexes were greater than 4 (21.190 for the human RBCs, 12.940 for pseudo-leucocytes, and 15.577 for pseudo-platelets), indicating that the signals were adequate. The response surface showed the interaction of each pair of factors providing the maximum response function. To verify the prediction results of the model, an experiment was conducted to compare between the experimental value and the predicted value. The compatibility results of three kinds of RBCs are greater than 99%, which proves that the model provides good predictive ability about the number of putative human RBCs, pseudo-leucocytes, and pseudo-platelets.
A Plackett–Burman design is an effective way to screen for the main parameters of many elements of the optimization process. The RSM-CCD method was performed to optimize the value of the most influential screening factors. This method is experimental planning with many factors based on mathematical models.
This result has very important significance, and the research will help create hematology EQA samples with the same components as actual blood, with a long storage time (3 months at 2–8 °C) compared with whole blood samples that have a short storage time. This study attempted to establish an optimal formula for manufacturing of hematological reference samples for EQA in hematology, helping hematology laboratories in Vietnam with quality assurance of tests.
5. Conclusions
The result of defining the stability of RBCs showed that fixed RBCs are more durable than unfixed ones. Fixed human RBCs were durable in the osmolality from 157 to 205 mOsmol/kg while goat and goose RBCs could withstand the osmolality at 89 to 205 mOsmol/kg. Results of the screening for influencing factors showed that all three indexes (human RBCs, pseudo-leucocytes, pseudo-platelets) were most affected by three factors: serum (%), neomycin sulfate (g/L), and glycerol (%) with a high confidence level (p < 0.1). The optimal values of serum, neomycin sulfate, and glycerol were 46%, 0.44 g/L, and 2.5%, respectively. The maximum number predicted from the theoretical model of human RBCs was 4.1 × 10¹² cells/L, pseudo-leucocytes 6.4 × 10⁹ cells/L, and pseudo-platelets 188 × 109 cells/L. The compatibility between experimental and theoretical values was 98.93%. The research has found that serum would be the best base liquid as well as the optimized formula with a storage time of at least 3 months at 2–8 °C of hematology EQA samples.
Supplementary Materials
The following are available online at https://0-www-mdpi-com.brum.beds.ac.uk/article/10.3390/app11188777/s1, Table S1: Evaluation factors selected for Plackett-Burmann matrix design. Table S2: Plackett-Burman matrix for samples at average concentration. Table S3: The experimental results and the theoretical results from optimized RSM-CCD.
Author Contributions
Conceptualization, N.N.V.; methodology, N.N.V. and Q.T.T. Truong; validation, T.H.N. and H.T.T.; investigation, N.N.V. and Q.T.T. Truong; writing—original draft preparation, N.N.V.; writing—review and editing, T.H.N. and H.T.T.; visualization, H.T.T.; supervision, T.H.N. and H.T.T. All authors have read and agreed to the published version of the manuscript.
Funding
We research is funded by Department of Science and Technology Ho Chi Minh City under grant number 2018-551.
Institutional Review Board Statement
Not applicable.
Informed Consent Statement
Not applicable.
Data Availability Statement
Not applicable.
Acknowledgments
We acknowledge Center for Standardization and Quality Control in the Medical Lab of Ho Chi Minh City and we acknowledge the support of time and facilities from Ho Chi Minh City University of Technology (HCMUT), VNU-HCM for this study.
Conflicts of Interest
On behalf of all authors, the corresponding authors state that there is no conflict of interest.
References
- Whitehead, T.; Woodford, F. External quality assessment of clinical laboratories in the United Kingdom. J. Clin. Pathol. 1981, 34, 947–957. [Google Scholar] [CrossRef] [PubMed] [Green Version]
- Sciacovelli, L.; Secchiero, S.; Zardo, L.; Zaninotto, M.; Plebani, M. External quality assessment: An effective tool for clinical governance in laboratory medicine. Clin. Chem. Lab. Med. 2006, 44, 740–749. [Google Scholar] [CrossRef] [PubMed]
- Sciacovelli, L.; Secchiero, S.; Zardo, L.; Plebani, M. The role of the external quality assessment. Biochem. Med. 2010, 20, 160–164. [Google Scholar] [CrossRef]
- Kim, Y.R.; Kihara, J.E. Hematology Reference Control and Method of Preparation. U.S. Patent 5,858,790, 12 January 1999. [Google Scholar]
- Samour, J. Diagnostic value of hematology. In Clinical Avian Medicine; Harrison, G.J., Lightfoot, T.L., Eds.; Spix Publishing Inc.: Palm Beach, FL, USA, 2006; pp. 508–609. [Google Scholar]
- World Health Organization. WHO Manual for Organizing a National External Quality Assessment Programme for Health Laboratories and Other Testing Sites; World Health Organization: Geneva, Switzerland, 2016. [Google Scholar]
- Kawai, Y.; Nagai, Y.; Ogawa, E.; Kondo, H. Japanese society for laboratory hematology flow cytometric reference method of determining the differential leukocyte count: External quality assurance using fresh blood samples. Int. J. Lab. Hematol. 2017, 39, 202–222. [Google Scholar] [CrossRef] [PubMed]
- Turgeon, M.L. Clinical Hematology: Theory and Procedures, 6th ed.; Jones & Bartlett Learning: Boston, MA, USA, 2017. [Google Scholar]
- Plackett, R.L.; Burman, J.P. The design of optimum multifactorial experiments. Biometrika 1946, 33, 305–325. [Google Scholar] [CrossRef]
- Myers, R.H.; Khuri, A.I.; Carter, W.H. Response surface methodology: 1966–l988. Technometrics 1986, 31, 137–157. [Google Scholar] [CrossRef]
- Lewis, S.M. Quality Assurance in Haematology; World Health Organization: Geneva, Switzerland, 1998. [Google Scholar]
- World Health Organization. External Quality Assessment of Transfusion Laboratory Practice—Guidelines on Establishing an EQA Scheme in Blood Group Serology; World Health Organization: Geneva, Switzerland, 2004. [Google Scholar]
- Donough, E.S.; Georg, L.K.; Ajello, L.; Brinkman, S. Growth of dimorphic human pathogenicfungi on media containing cycloheximide and chloramphenicol. Mycopathol. Mycol. Appl. 1960, 13, 113–120. [Google Scholar] [CrossRef]
- Dolan, C.T. Optimal combination and concentration of antibiotics in media for isolation of pathogenic fungi and nocardia asteroides. Appl. Microbiol. 1971, 21, 195–197. [Google Scholar] [CrossRef] [PubMed]
- ISO Guide 34. General Requirements for the Competence of Reference Material Proceducers, 2nd ed.; International Organization for Standard (ISO): Geneva, Switzerland, 2000. [Google Scholar]
- ISO Guide 35. Reference Materials—General and Statistical Principles for Certification; International Organization for Standardization (ISO): Geneva, Switzerland, 2006; Volume 64. [Google Scholar]
Figure 1.
The response surface for the number of RBCs according to the ratio of neomycin sulfate and serum (A) and neomycin sulfate and glycerol (B).
Figure 1.
The response surface for the number of RBCs according to the ratio of neomycin sulfate and serum (A) and neomycin sulfate and glycerol (B).

Figure 2.
The response surface for the number of pseudo-leucocytes according to the ratio of glycerol and serum (A) and glycerol and neomycin sulfate (B).
Figure 2.
The response surface for the number of pseudo-leucocytes according to the ratio of glycerol and serum (A) and glycerol and neomycin sulfate (B).

Figure 3.
The response surface of the number of pseudo-platelets according to the ratio of neomycin sulfate and serum (A), glycerol and serum (B), and glycerol and neomycin sulfate (C).
Figure 3.
The response surface of the number of pseudo-platelets according to the ratio of neomycin sulfate and serum (A), glycerol and serum (B), and glycerol and neomycin sulfate (C).

Figure 4.
The stability of samples containing RBCs, WBCs, and PLTs during storage time of 100 days.


Table 1.
Value of hemoglobin and MCV before and after fixing RBCs in geese and goats.
| Notation | Pseudo-Leucocytes | Pseudo-Platelets | ||
|---|---|---|---|---|
| Before Fixing | After Fixing | Before Fixing | After Fixing | |
| WBC (109 cells/L) | 1280 ± 2.65 | 1290 ± 2.15 | 16.50 ± 0.50 | 2.70 ± 0.06 |
| RBC (1012 cells/L) | 1.24 ± 0.02 | 0.02 ± 0.01 | 0.95 ± 0.04 | 0.09 ± 0.02 |
| HGB (mmol/L) | 5.20 ± 0.21 | 0.00 | 8.16 ± 0.02 | 0.00 |
| MCV (fL) | 155.00 ± 2.5 | 0.00 | 0.12 ± 0.01 | 0.00 |
| PLT (109 cells/L) | 0.00 | 0.00 | 2220 ± 3.15 | 2420 ± 1.52 |
Table 2.
Variables in the Plackett–Burman matrix and their influences.
| Factor | Level | Level of Influence | |||||||
|---|---|---|---|---|---|---|---|---|---|
| Human RBCs | Pseudo-Leucocytes | Pseudo-Platelets | |||||||
| Notation | Factor name | Low (−1) | High (+1) | Influence | Prob > F | Influence | Prob > F | Influence | Prob > F |
| X1 | Serum (%) | 45 | 65 | 1.833 × 10⁻⁴ a | 0.0836 | 0.22 a | 0.0592 | 4.50 a | 0.0721 |
| X2 | Neomycin sulfate (g/L) | 0.03 | 0.5 | 2.167 × 10⁻⁴ a | 0.0478 | 0.22 a | 0.0592 | 6.83 a | 0.0137 |
| X3 | Chloramphenicol (g/L) | 0.02 | 0.5 | 8.333 × 10⁻⁵ | 0.4051 | 0.05 | 0.6679 | 1.83 | 0.8008 |
| X4 | Sodium azide (g/L) | 0.5 | 1.5 | −8.333 × 10⁻⁵ | 0.4175 | −0.05 | 0.6785 | 2.17 | 0.7725 |
| X5 | Glycerol (%) | 1 | 3 | 2.167 × 10⁻⁴ a | 0.0478 | 0.25 a | 0.0350 | 7.83 a | 0.0069 |
a Statistically significant at α = 0.1.
Table 3.
Optimization results for storage medium using RSM-CCD.
| No. | Serum | Neomycin Sulfate | Glycerol | Cell Concentration (×109 Cells/L) | |||||
|---|---|---|---|---|---|---|---|---|---|
| Concentration of Serum (%) | Notation of Performance | Concentration of Neomycin Sulfate (g/L) | Notation of Performance | Concentration of Glycerol (%) | Notation of Performance | Human RBCs | Pseudo-leucocytes | Pseudo-platelets | |
| 1 | 45 | −1 | 0.30 | −1 | 1.0 | −1 | 0.00381 | 5.9 | 170 |
| 2 | 65 | 1 | 0.30 | −1 | 1.0 | −1 | 0.00395 | 6.1 | 185 |
| 3 | 45 | −1 | 1.00 | 1 | 1.0 | −1 | 0.00419 | 6.3 | 189 |
| 4 | 65 | 1 | 1.00 | 1 | 1.0 | −1 | 0.00411 | 6.4 | 191 |
| 5 | 45 | −1 | 0.30 | −1 | 3.0 | 1 | 0.00407 | 6.5 | 193 |
| 6 | 65 | 1 | 0.30 | −1 | 3.0 | 1 | 0.00415 | 6.2 | 195 |
| 7 | 45 | −1 | 1.00 | 1 | 3.0 | 1 | 0.00416 | 6.4 | 188 |
| 8 | 65 | 1 | 1.00 | 1 | 3.0 | 1 | 0.00413 | 6.3 | 184 |
| 9 | 38 | −α | 0.65 | 0 | 2.0 | 0 | 0.00413 | 6.4 | 182 |
| 10 | 72 | +α | 0.65 | 0 | 2.0 | 0 | 0.00415 | 6.3 | 190 |
| 11 | 55 | 0 | 0.06 | −α | 2.0 | 0 | 0.00399 | 5.8 | 189 |
| 12 | 55 | 0 | 1.24 | +α | 2.0 | 0 | 0.00419 | 6.1 | 194 |
| 13 | 55 | 0 | 0.65 | 0 | 0.3 | −α | 0.00392 | 6.1 | 180 |
| 14 | 55 | 0 | 0.65 | 0 | 3.7 | +α | 0.00415 | 6.4 | 185 |
| 15 | 55 | 0 | 0.65 | 0 | 2.0 | 0 | 0.00412 | 6.5 | 191 |
| 16 | 55 | 0 | 0.65 | 0 | 2.0 | 0 | 0.00410 | 6.3 | 190 |
| 17 | 55 | 0 | 0.65 | 0 | 2.0 | 0 | 0.00418 | 6.4 | 193 |
| 18 | 55 | 0 | 0.65 | 0 | 2.0 | 0 | 0.00409 | 6.4 | 191 |
| 19 | 55 | 0 | 0.65 | 0 | 2.0 | 0 | 0.00409 | 6.5 | 185 |
| 20 | 55 | 0 | 0.65 | 0 | 2.0 | 0 | 0.00412 | 6.4 | 190 |
Table 4.
The homogeneity of the stored samples containing RBCs, WBCs, and PLTs.
| Tube | Lot 1 | Lot 2 | ||||
|---|---|---|---|---|---|---|
| Human RBCs (1012/L) (Mean ± SD) | Pseudo-Leucocytes (109/L) (Mean ± SD) | Pseudo-Platelets (109/L) (Mean ± SD) | Human RBCs (1012/L) (Mean ± SD) | Pseudo-Leucocytes (109/L) (Mean ± SD) | Pseudo-Platelets (109/L) (Mean ± SD) | |
| 1 (n = 3) | 4.24 ± 0.05 | 6.30 ± 0.10 | 183.67 ± 1.53 | 4,35 ± 0.05 | 6.17 ± 0.03 | 179.33 ± 2.08 |
| 2 (n = 3) | 4.26 ± 0.04 | 6.37 ± 0.14 | 176.67 ± 2.31 | 4,42 ± 0.13 | 6.18 ± 0.05 | 184.67 ± 2.52 |
| 3 (n = 3) | 4.10 ± 0.06 | 6.41 ± 0.05 | 188.67 ± 2.52 | 4,30 ± 0.15 | 6.10 ± 0.03 | 180.33 ± 2.08 |
Table 5.
The stability of the storing samples was read on different machine models.
| Human RBCs (1012/L) (n = 3) | Pseudo-Leucocytes (109/L) (n = 3) | Pseudo-Platelets (109/L) (n = 3) | |||||||
|---|---|---|---|---|---|---|---|---|---|
| ABX | CellDyn1700 | Midray BC3000 | ABX | CellDyn1700 | Midray BC3000 | ABX | CellDyn1700 | Midray BC3000 | |
| 1 month | 4.20 ± 0.08 | 4.15 ± 0.09 | 4.22 ± 0.09 | 6.40 ± 0.10 | 6.45 ± 0.05 | 6.36 ± 0.04 | 189.00 ± 1.00 | 188.33 ± 0.58 | 186.00 ± 1.73 |
| 2 months | 3.88 ± 0.19 | 4.05 ± 0.06 | 4.11 ± 0.07 | 6.15 ± 0.09 | 6.40 ± 0.14 | 6.30 ± 0.10 | 181.67 ± 1.15 | 181.67 ± 2.08 | 184.33 ± 1.53 |
| 3 months | 3.60 ± 0.12 | 3.85 ± 0.09 | 3.95 ± 0.09 | 6.01 ± 0.11 | 6.23 ± 0.06 | 6.23 ± 0.06 | 181.33 ± 1.53 | 181.33 ± 2.65 | 182.67 ± 1.53 |
Publisher’s Note: MDPI stays neutral with regard to jurisdictional claims in published maps and institutional affiliations. |
© 2021 by the authors. Licensee MDPI, Basel, Switzerland. This article is an open access article distributed under the terms and conditions of the Creative Commons Attribution (CC BY) license (https://creativecommons.org/licenses/by/4.0/).
Share and Cite
MDPI and ACS Style
Vo, N.N.; Tran, H.T.; Truong, Q.T.; Nguyen, T.H. Optimization of Storage Medium for Hematological Reference Samples in External Quality Assessment. Appl. Sci. 2021, 11, 8777. https://0-doi-org.brum.beds.ac.uk/10.3390/app11188777
AMA Style
Vo NN, Tran HT, Truong QT, Nguyen TH. Optimization of Storage Medium for Hematological Reference Samples in External Quality Assessment. Applied Sciences. 2021; 11(18):8777. https://0-doi-org.brum.beds.ac.uk/10.3390/app11188777
Chicago/Turabian StyleVo, Ngoc Nguyen, Huu Tam Tran, Quan Thuy Truong, and Thuy Huong Nguyen. 2021. "Optimization of Storage Medium for Hematological Reference Samples in External Quality Assessment" Applied Sciences 11, no. 18: 8777. https://0-doi-org.brum.beds.ac.uk/10.3390/app11188777
Note that from the first issue of 2016, this journal uses article numbers instead of page numbers. See further details here.