1. Introduction
The demand for energy is steadily increasing with respect to the world’s total energy supply by source. In particular, fossil fuels (e.g., oil, coal, and natural gas) represent a large proportion of energy sources; for example, the global share of the total energy supply by fossil fuels was more than 80% in 2018 [
1]. However, fossil fuel use should be reduced because it has negatively impacted the environment, such as the emission of greenhouse gases that cause global warming.
Alternatively, renewable energy resources (e.g., solar energy, bioenergy, wind energy, ocean energy) can alleviate environmental pollution [
2]. Among the many renewable energy sources, solar photovoltaic (PV) power generation is one of the promising renewables, with an infinite supply without additional pollution (e.g., soil contamination, noise pollution), ease of maintenance, and high reliability. Solar PV electricity production has sharply increased by nearly 4.7 times (i.e., 472.981%) between 2008 and 2018 [
3].
To fulfill the increasing PV demand, large areas are needed to install solar power plants. However, South Korea has limited space to install power plants because it has complex terrains, such as mountains. Thus, the analysis of potential sites for installing PV plants should precede the construction of effective, lucrative, and sustainable solar PV plants in limited territories.
Recent studies have focused on investigating optimal sites for PV plants by integrating geographic information systems (GISs) and multiple-criteria decision-making (MCDM) frameworks (e.g., the analytic hierarchy process, AHP) [
4]. MCDM-based solar-site selection involves selecting the best candidates from among several alternatives in various criteria; e.g., geographical (e.g., slope, aspect, land use) [
5], meteorological (e.g., solar irradiation, average temperature) [
6], economic (e.g., land cost, construction cost) [
7], and locational factors (e.g., distance to urban areas, distance to main roads, distance to power lines) [
8]. Then, the candidate site is determined by estimating the weight of each factor.
For example, Garni and Awasthi [
9] presented a GIS-AHP-based solar PV site-selection approach using various criteria (e.g., solar irradiation, air temperature, slope, land aspect, proximity to urban areas, proximity to roads, and proximity to power lines) for Saudi Arabia. They revealed that solar irradiation had the greatest impact on site selection (32.2% of the total). Tahri et al. [
10] also investigated the evaluation of suitable candidates for PV plants using GIS and AHP for Morocco; they reported that climate factors (solar irradiation: 42%, temperature: 22%) are important in site selection.
In previous studies, solar irradiation has been revealed as a critical factor for selecting optimal PV power-plant sites. On the other hand, the direct application of PV power-generation data (e.g., the map-type data in Heo et al. [
11]) to investigate potential candidates can be more useful in terms of energy management and economic feasibility. This is because PV output data may not only be used to explore suitable sites but also to compute the electricity production at the candidate sites and, further, use it for economic analyses, such as marginal profits [
12,
13].
Despite these advantages, research has rarely been conducted on the application of PV power output to site selection, as existing PV power-output estimation is only based on single or a few historical data collected from specific regions (i.e., solar farms) and does not consider topographical effects. Specifically, the insufficient use of historical PV power data may create challenges when geographic or weather patterns differ from the area where the data were collected. For example, the spatial heterogeneity of different terrain types (e.g., plains, mountains, and urban areas) can influence solar-energy estimation. Heo et al. [
14] revealed that the error of the estimation model was relatively higher in mountainous areas, with higher spatial complexity than in plains or urban areas.
Moreover, although GIS and decision-making approaches are suitable for investigating site selection for PV plants at a national scale, the application of PV site-selection techniques to planning infrastructures (e.g., highway networks) and energy management remains unknown. Previous studies on PV-plant site selection have largely focused on investigating candidate sites at a national scale by analyzing the impacts of various factors (e.g., solar irradiation, slope, aspect, proximity to transmission, proximity to the road) on electrical-power production. For instance, Settou et al. [
15] proposed the AHP and GIS-based method for site selection of PV power plants in Algeria. They indicated that geographically suitable area is extracted from analyzing the various factors (e.g., proximity to the electric grid, global solar irradiation, proximity to the major roads network, proximity to cities, distance to land use, soil type, and slope), and estimated the annual potential of electrical energy using an equation proposed by Asakereh et al., 2017 [
16] that multiplies global solar irradiation in horizontal area, the total area of suitable land, the fraction of the active area on the total area (70%), and the efficiency of PV systems converting sunlight into electricity. Although existing approaches have included meaningful results and contributions, not all of the estimated suitable areas for PV plants can be fully utilized because of low economic feasibility, such as additional installations of electrical facilities in areas far from transmission facilities or the high purchase price of land in private areas.
As an alternative, recent studies have applied site-selection approaches to directly evaluate how much power can be produced in civil infrastructure areas, such as unused areas near highway networks (e.g., noise barriers or slopes in highways). For example, Faturrochman et al. [
17] integrated a noise barrier into PV systems located in the vicinity of roadways. This integrated approach has the advantage of collecting direct and reflected radiation from both directions of the road. In addition, Kim et al. [
12] conducted an economic analysis and computation of the solar-power generation resulting from the installation of panels in the unused interchange areas of highways. In particular, the slopes on both sides of the highway have potential benefits; highway slopes are generally unused land, which leads to cost savings, such as purchasing land for power-plant construction [
18]. Proximity to roads can enable the trading of electricity produced from PV plants without installing additional electrical facilities, such as power lines or inverters [
12].
Furthermore, in recent studies, visualization of data in three-dimensional (3D) space is important to support decisions of predicting solar irradiation in realistic 3D objects (e.g., the roofs on buildings) [
19]. For example, Chow et al. [
19] and Kausika and Sark. [
20] presented the assessment of solar potential using 3D models with GIS. They predict the annual [
20] or hourly [
19] solar irradiation map in buildings and surrounding terrain. In particular, Gergelova et al. [
21] represented to search of PV installation on roofs and predict PV generation with GIS and computer-aided design (CAD) software. They segmented suitable areas of roofs that satisfied geographical features (e.g., slope, aspect, hill shade) through a 3D model from the LiDAR data.
Utilizing a site-selection approach for PV plants in highway construction or design leads to efficient energy management and planning for highway projects [
12,
18]. However, for better-informed site selection, a geo-spatial analysis is necessary to capture geographical and topographical features that can vary the solar-power output [
11]. Therefore, to fill this gap in the literature, this study proposes an approach for optimally selecting sites for PV plants using the map-type PV power-estimation model presented in [
11] under a GIS environment and visualizes the proposed sites in building information model (BIM) environments, using the integration of BIM and GIS. This approach is capable of evaluating solar PV power generation in suitable regions while planning and managing both energy and highway infrastructure systems. By doing that, the primary objective of this research is to support the least intrusive site selections of solar PV plants considering existing infrastructure and terrain conditions.
2. Methods
This study conducts a case study to investigate and provide an evaluation method for site selection using a PV power-estimation model [
11] for installing PV plants near highway networks in South Korea. The proposed evaluation method discovers optimal sites that satisfy different constraints and restrictions (e.g., distance to highways, slope, topography conditions) by a geo-spatial analysis with a GIS and computes the potential monthly power output in the candidate areas. Specifically, available installation regions in the study area (i.e., the district of Ucheon-myeon) were transformed and visualized in BIM environments. The energy management could then be considered during the planning stage of highway-infrastructure construction by representing the PV power output to the solar panels as families in the BIM (including the monthly PV power output, shape type, and coordinates).
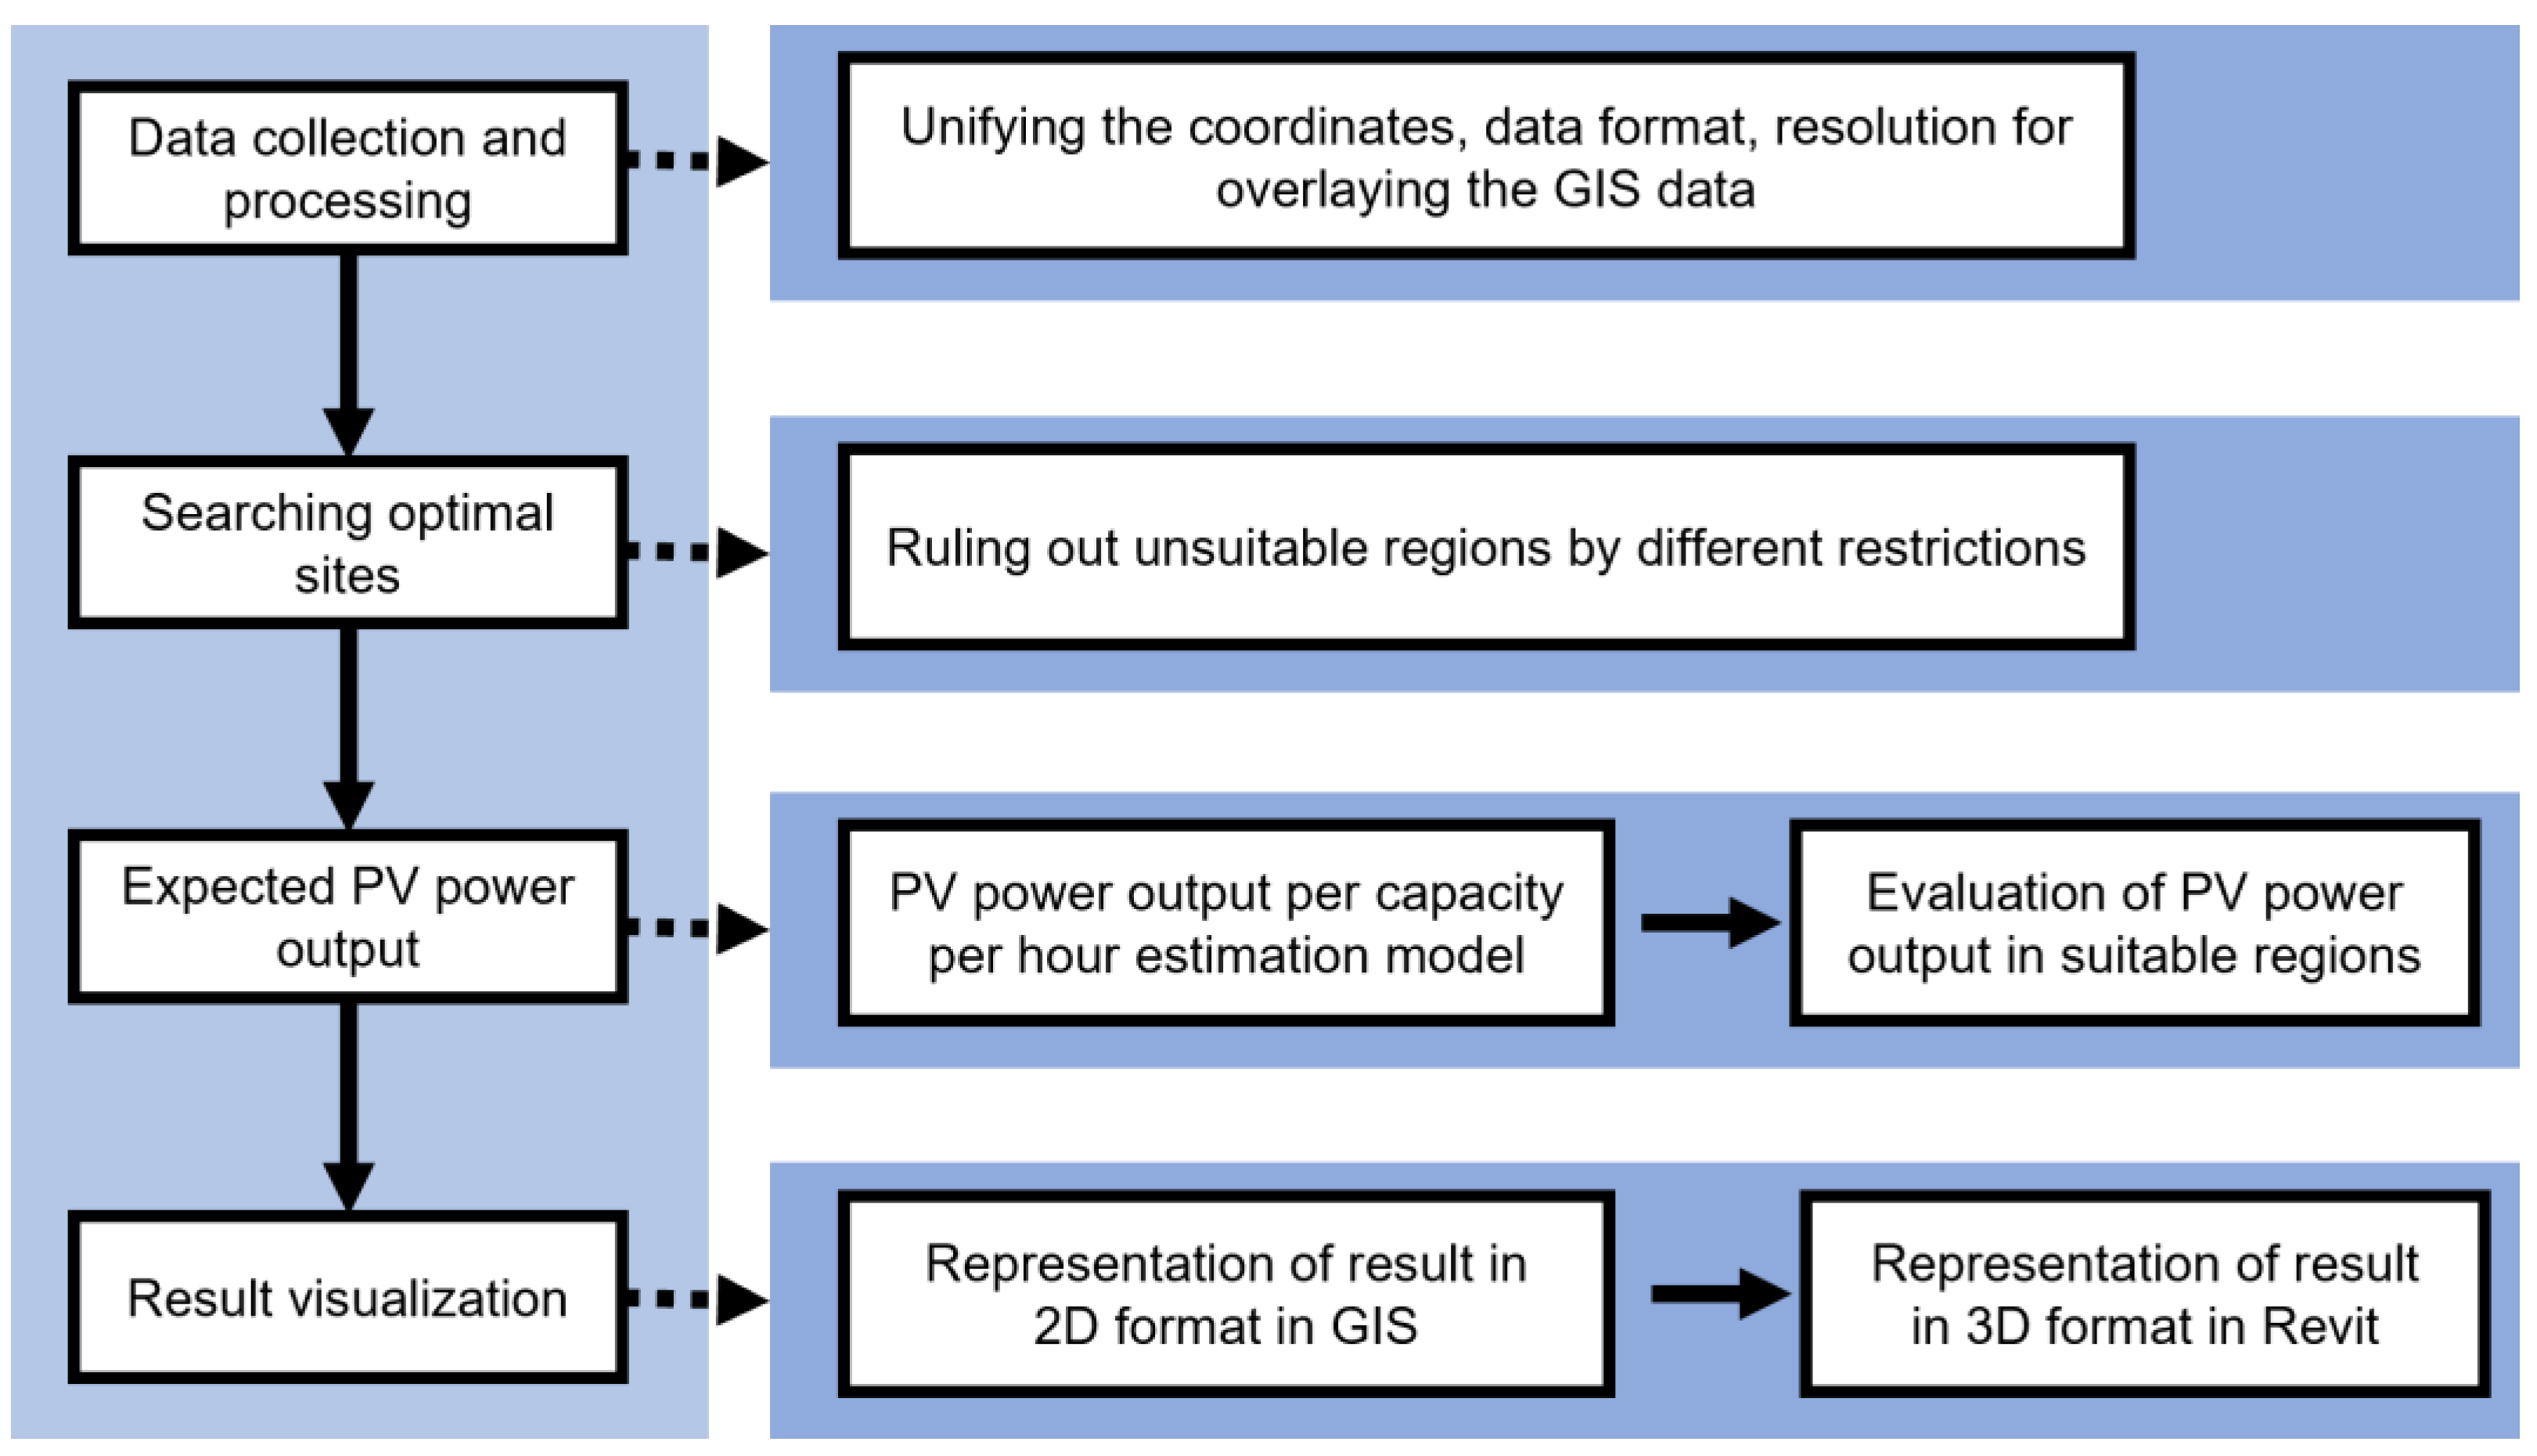
Figure 1 illustrates the overall procedure for selecting the sites of PV plants, which includes four stages: (1) data collection and processing, (2) geo-spatial analysis, (3) evaluation of PV power outputs, and (4) result visualization. In the first stage, the terrain data (a digital elevation map, or DEM) were collected from publicly available numerical maps, and then PV power-generation data were obtained using the terrain data. The weather data (i.e., solar irradiation, temperature, precipitation, and wind speed) were generated using the computational method presented in [
11].
In the second stage, a spatial analysis using a GIS was used to investigate suitable regions near highway networks using different constraints and restrictions (e.g., distance to highway (under 200 m), non-reservoirs, non-rivers, and lower slopes (<15°)) to rule out the regions unsuitable for installing PV plants.
In the third stage, to compute the power generation (MWh) produced in each 30 × 30 m2 area, the potential monthly power output is evaluated by computing the PV plant’s capacity in the suitable regions extracted by the second stage. In particular, the evaluation examines regional differences and monthly trends by comparing national and regional scales. In addition, the distribution map and a heatmap are used to cluster the PV power outputs, where power plants can be built on a large scale among candidate sites extracted from the spatial analysis. Finally, the results are transformed into PV plants, as families of solar panels in the BIM environment.
2.1. Data Collection and Processing
This study uses four terrain data types (e.g., highway networks, slope maps computed from elevation maps, and river and reservoir maps from numerical data) and the PV power-output data presented in [
11]. All data used for site selection were digitalized using a uniform coordinate system (i.e., World Geodetic System 1984 (WGS84) 52N), scaling (i.e., 1/5000), and resolution (i.e., 30 × 30 m
2 resolution). In particular, the PV power output per capacity per hour data [
14] are represented as raster images (i.e., tagged image file format, or TIF), with 30 × 30 pixels, where one pixel is equivalent to 30 × 30 m
2 (i.e., one PV power output per capacity per hour is covered with 810,000 m
2).
The location data (
Table 1) were collected from continuous numerical maps to select suitable regions for PV plants with geo-spatial analyses, where the spatial information (e.g., contours, reservoirs, and rivers) is represented by points, polylines, or polygons (vector format). These location data were collected from the National Spatial Data Infrastructure of Korea (NSDI) as unity coordinates (i.e., geodetic reference system 1980 (GRS80), EPSG: 5181). To unify the coordinate system of the location data, the raw location data’s coordinate is transformed into WGS 84 52N format. In addition, in
Table 1, orography data (i.e., slope map) are extracted using a digital elevation model (DEM) generated from raster image-based elevation maps (i.e., TIF format) transformed from vector-type elevation contours.
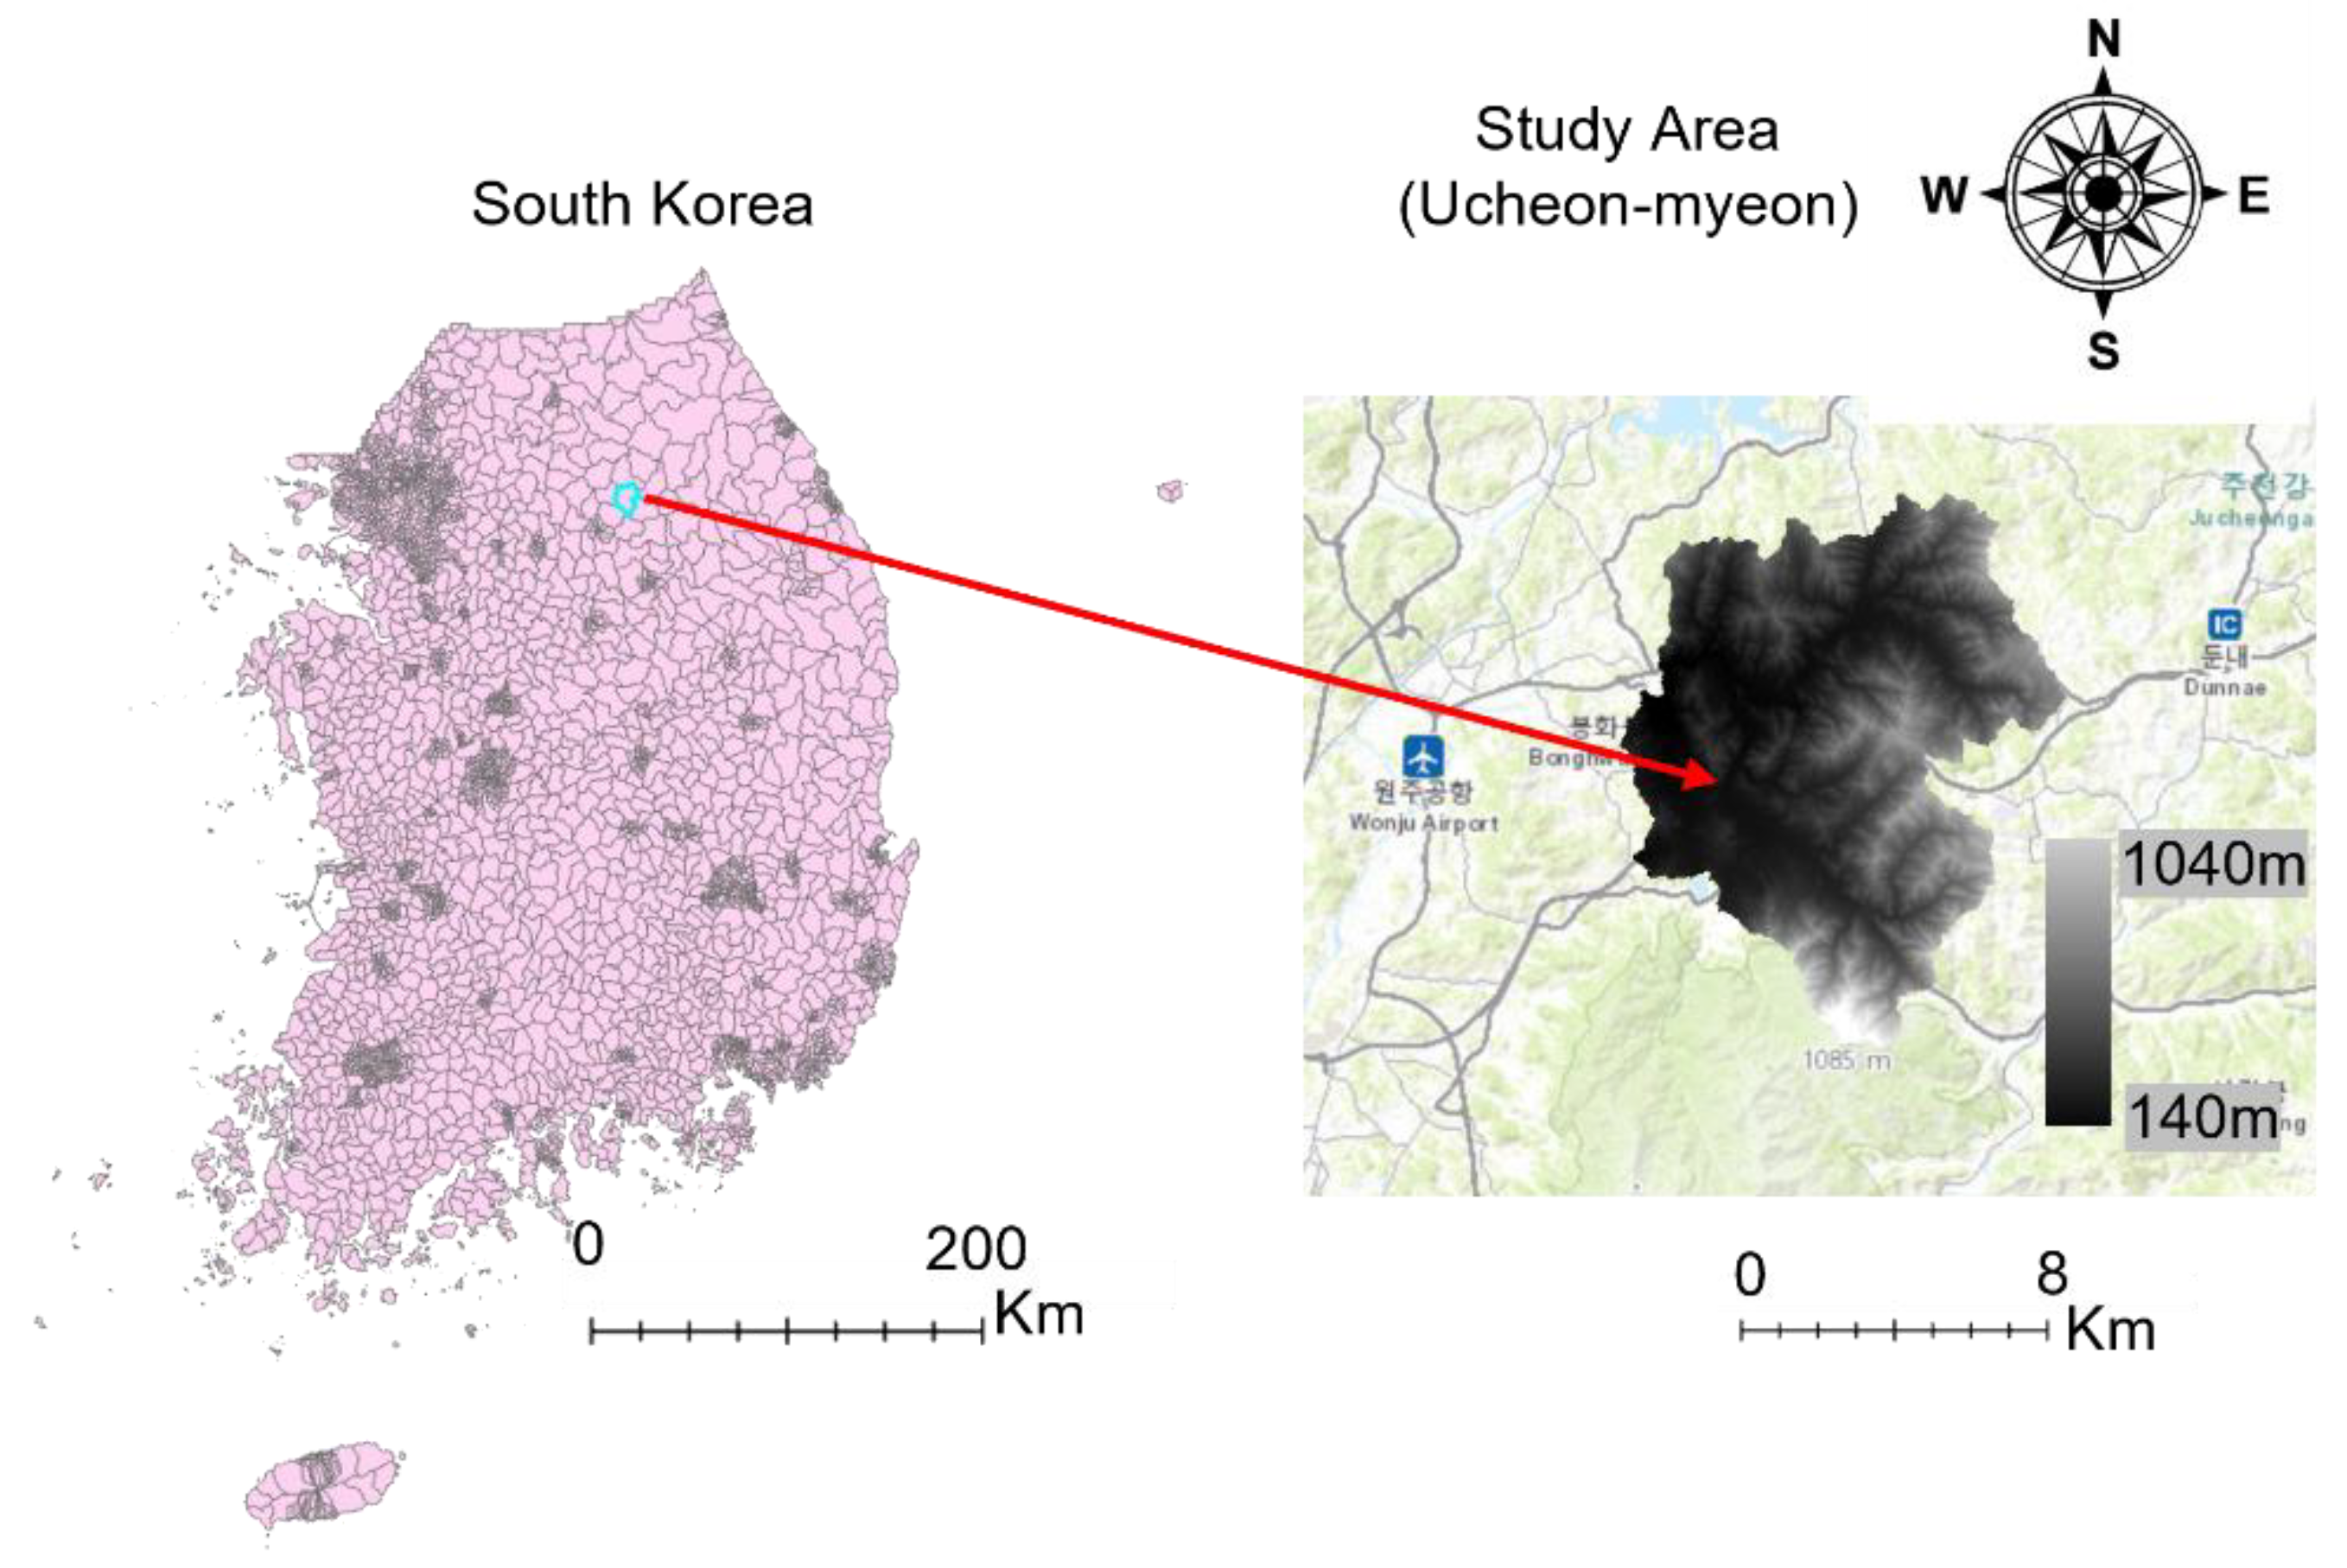
Ucheon-myeon in Gangwon-do, South Korea, was chosen as the case-study area (
Figure 2). The study shows a detailed spatial analysis and visualizes the construction of solar PV power plants in the vicinity of highway networks in 3D BIM environments. The district of Ucheon-myeon is geographically located between the 37.4° and 37.5° north latitudes and 128.0° and 128.1° east longitudes. The case-study area lies at an elevation of 000 m and is located in a mountainous area near a national park (Chiak-mountain). In addition, the study area has an average slope of 17.14°, which is relatively higher than that of urban or plain areas (under 15°) and includes reservoirs and rivers where solar plants cannot be installed. Because this study area contains inappropriate conditions for power plant sites, a delicate spatial analysis is required for identifying installation sites for PV plants.
2.2. Restrictions for Site Selection
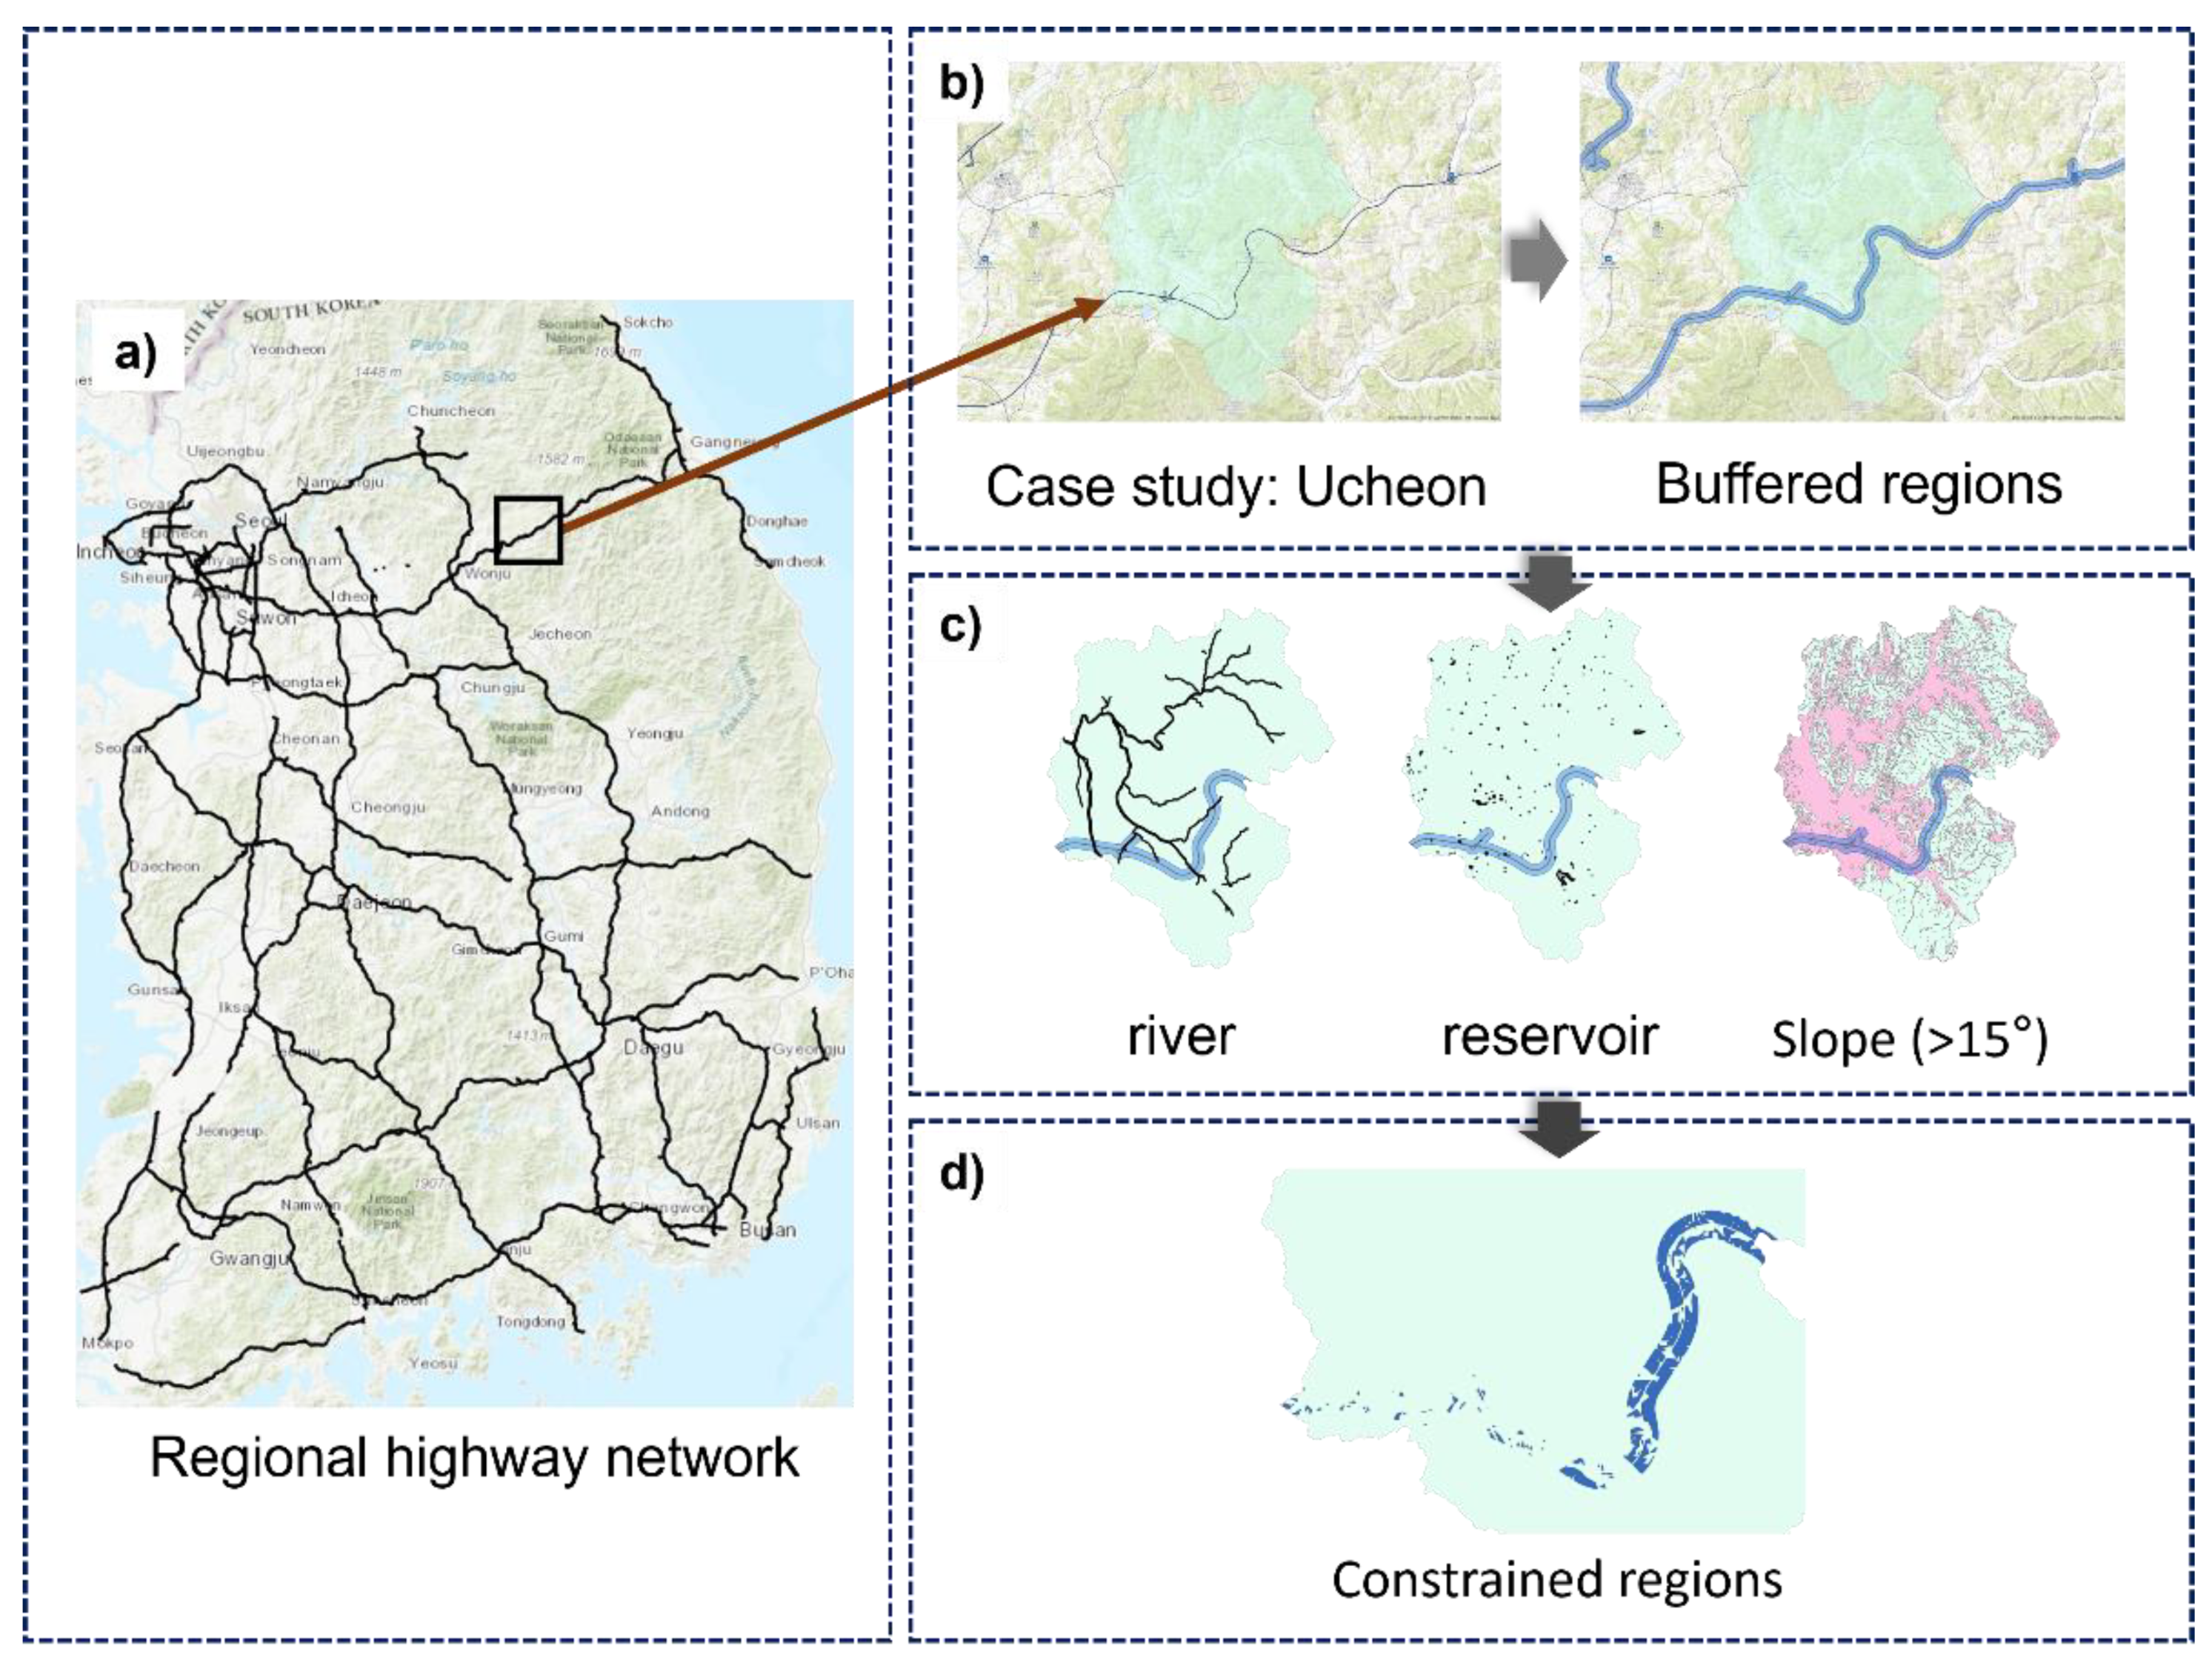
For a suitability analysis, the distance to highway networks (>200 m), higher slope regions (>15°), and non-installable areas (e.g., river and reservoir areas) were considered as constraint factors. First, the highway network data were confined to 200 m to limit the candidate sites for installing solar power plants (
Figure 3b). When the distance between the transmission site and the solar panels exceeds 200 m, a high voltage drop causes a power generation loss. In addition, to prevent such losses, additional costs are often incurred for cable and solar inverter installations and impact the economic feasibility. Thus, this study limited the distance to highways to a maximum of 200 m, using a buffer function in GIS.
Furthermore, this study used three conditions (e.g., river, reservoir, and slope) to limit areas that were not suitable for constructing power plants (
Figure 3c). In South Korea, solar-power facilities are limited to 15° to ensure safety, such as landslide prevention. Therefore, this study constrains the search for candidate sites that satisfy gradients between 0° and 15°. Overall, unsuitable sites are sorted out of the buffered regions representing highway network areas using a map-overlay technique. Multiple dataset layers are overlapped to identify the relationship of each layer, and then suitable areas are determined, as shown in
Figure 3d.
2.3. Evaluation of PV Power Output in Candidate Sites
The PV power output per capacity per hour data (unit: h) are normalized by dividing the PV power output into the PV capacity to minimize the bias caused by collecting from historical measurements in the low capacities. These data are obtained by estimating the monthly available solar power at a raster level, using the computational method of [
11]. The training model for solar power generation is built based on terrain maps (i.e., DEM), solar irradiation, temperature, wind speed, and precipitation: terrain maps were used to consider the effect of reducing solar radiation (e.g., shadow effect) reaching the target terrain by adjacent terrain, solar irradiation (e.g., direct beam, diffuse-sky radiation) that estimates in tilted surfaces generated from terrain maps such as slope and aspect information was used as a major energy source for solar power generation, and three weather components are used to reflect the constantly changing weather requirements. In short, their method used map-type data to consider the meteorological and geographical characteristics of a region adjacent to the PV plant. Their forecasting model achieved a mean absolute percent error (MAPE) of 8.639%.
Between January 2013 and March 2018, the estimation model showed the best performance in March 2017 (i.e., a MAPE of 5.350%). Thus, this study proceeds with the site selection by computing the PV power output (unit of MWh) from the map showing the estimated PV power output per capacity per hour between January and December 2017. The PV power output is calculated by multiplying the PV capacity (i.e., unit of MW) by the power generation per unit capacity per hour (i.e., unit of h).
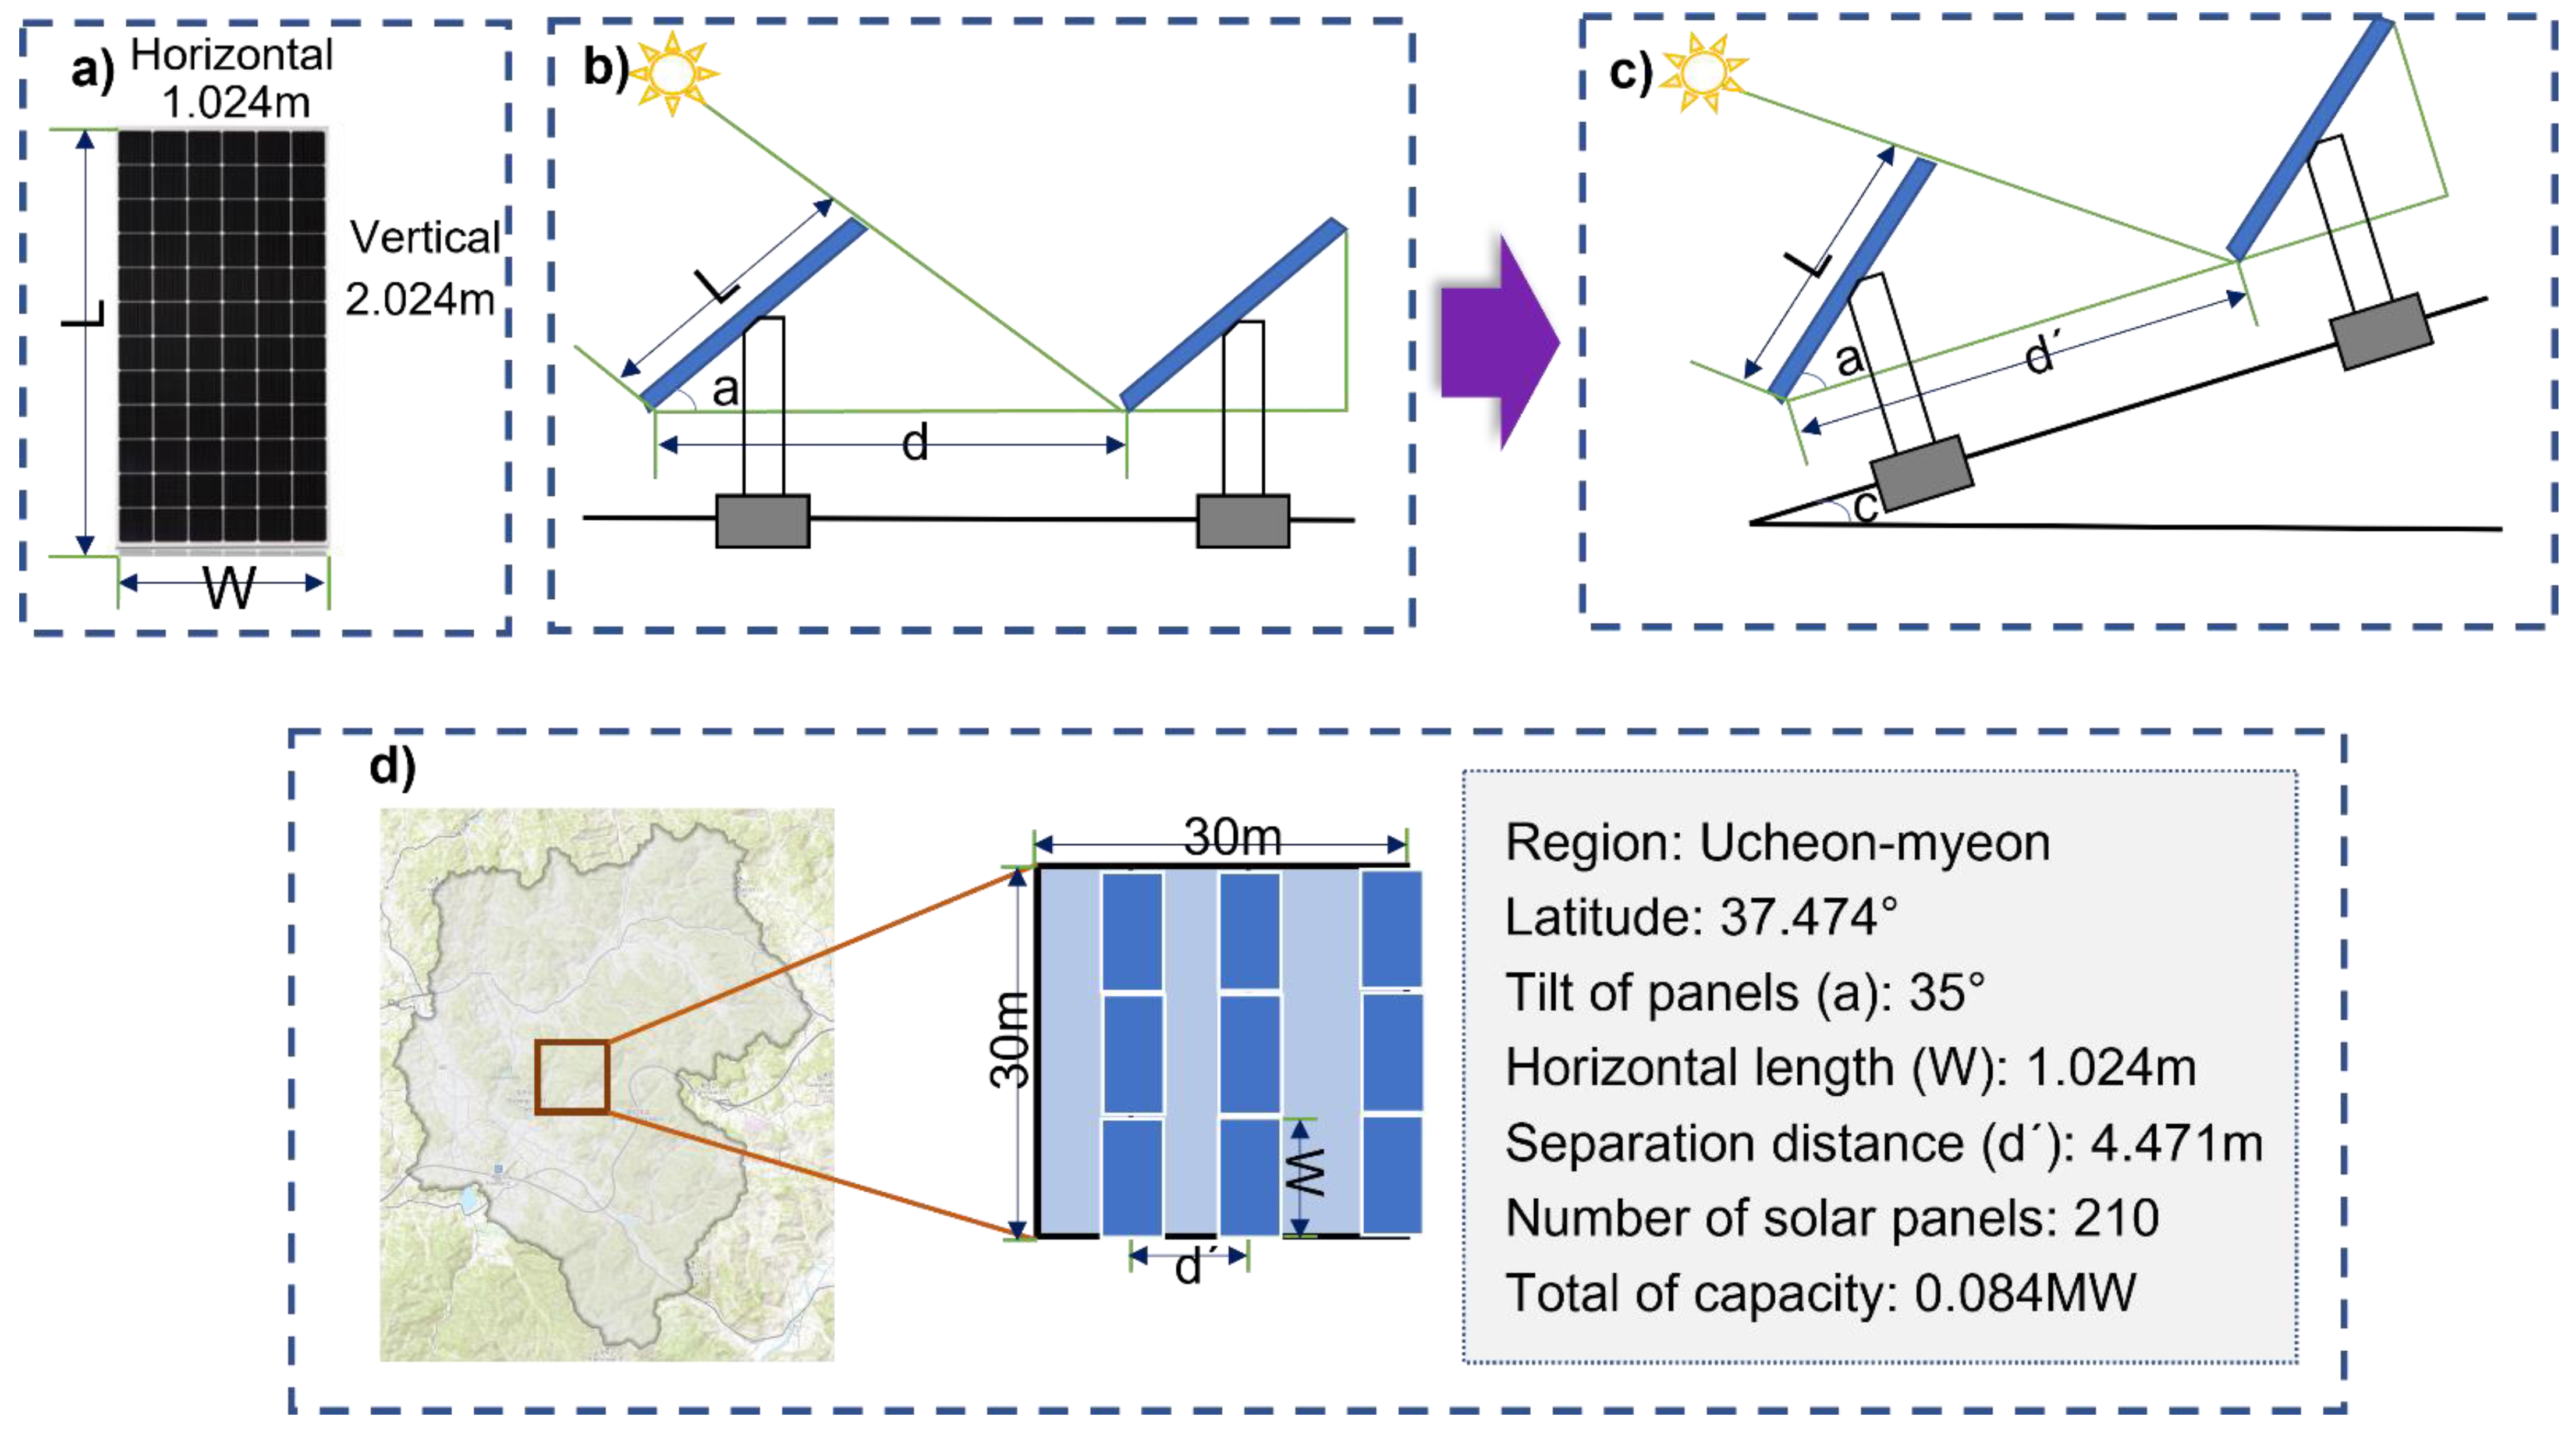
To obtain information on the PV capacity, the number of panels installed in the candidate area (i.e., 30 × 30 m
2) is multiplied by the standard capacity of one solar panel (
Figure 4a). As shown in
Figure 4d, the number of installed panels is computed by multiplying the number of vertical installations (i.e., 30 m/width of solar panels (W) in
Figure 4a) by the number of horizontal installations (i.e., 30 m/separation distance (d) in
Figure 4b,c).
For example, as shown in
Figure 4a, this study assumed that a solar panel has a capacity of 400 W, a width of 1.024 m (W), and a height of 2.024 m (L). Then, the horizontal separation distance (d) (
Figure 4b,c) in the study-area region (37.474° north latitude) can be calculated as 3.75 m, using Equation (1). However, because all candidate sites have gradients, the separation distance is adjusted by considering the gradient (d’ = 4.471 m), as shown in Equation (2).
where d is the separation distance, L is the vertical length of a single panel, a (°) is the angle between the panel and the horizontal surface, c (°) is the gradient of the tilted surface, and d’ is the adjusted separation distance from d for considering the gradient. As a result, the total solar installation capacity in the study area was 210 solar panels, and the PV output capacity installed in 30 × 30 m
2 is 0.084 MWh.
2.4. Visualization of PV Output by Integrating a GIS and a BIM Environment
Visualizing the candidate sites for PV plants in a BIM environment can support the communication and management of energy infrastructure systems. In this visualization stage, the proposed sites and PV array systems are modeled in a BIM platform by integrating the GIS into the BIM environment through two processes: (1) data transformation and (2) model visualization.
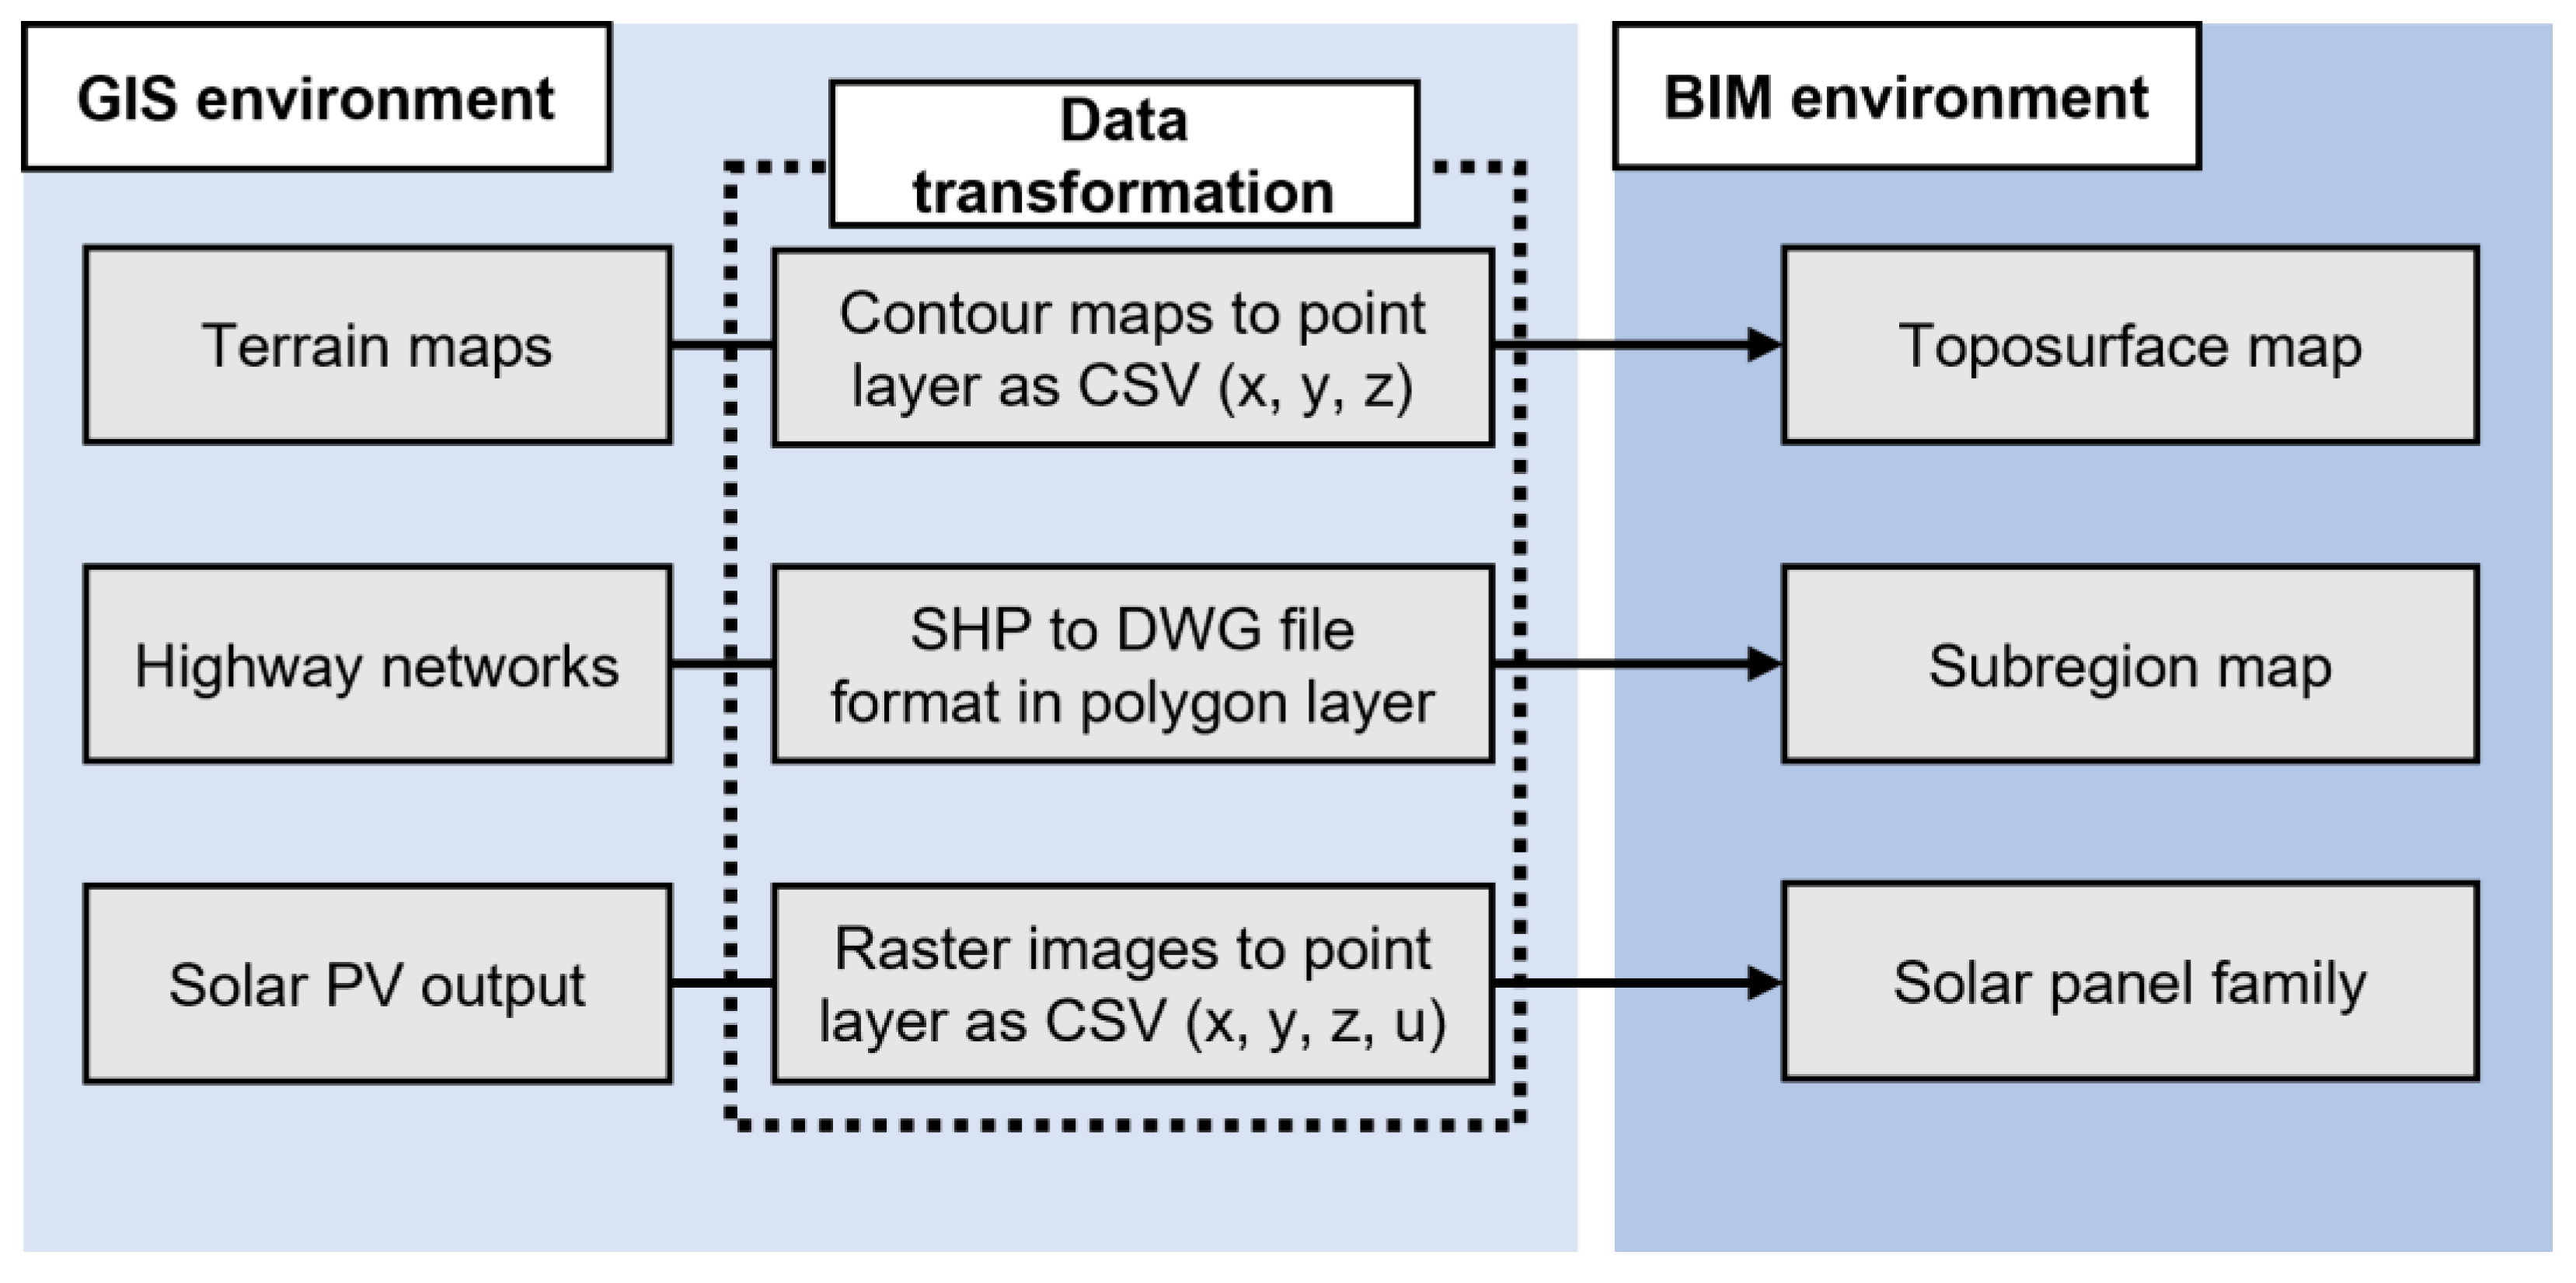
In the data-transformation process (
Figure 5), to integrate the GIS and BIM environment, topographic data (i.e., terrain maps), spatial data (i.e., highway layer), and the result of the PV power output are converted in different manners. The topographic data, represented by a two-dimensional (2D) DEM map on the GIS, are converted into a toposurface map in the BIM, where points containing (x, y, z) coordinates are placed. Specifically, each elevation value included in each grid of DEM map (raster image) is extracted to contour map with an interval of 30 m, and its contour map is converted into a point layer including geometry (x, y) positions from coordinate and its layer is saved as (x, y, z) format in CSV (Comma-separated values) file format. Then, the CSV data, containing elevation data from a certain location, are transformed into a toposurface in the BIM. Furthermore, vector format–based spatial data (highway network) are converted into a DWG (from drawing) file using the GIS function (Export to CAD). Based on Wu et al., 2019 [
24], it was assumed that there are no GIS data loss in the data conversion of this study.
However, the converted highway network data do not contain z values (i.e., elevation), indicating that the highway data are represented by the subregion, which overlays the x–y, based on the highway network layer. In addition, the raster image-based result of the PV power output is converted into a point layer and then saved in CSV file format, including (x, y, z) coordinates and PV power-output values. This CSV file is imported into the BIM using Dynamo, an open-source visual programming language for Revit, to address the limitations of parametric modeling and data-management processes [
25]. In short, the (x, y, z) coordinates are transformed into solar-panel families in the BIM environment.
In the final step, the plan view of the PV plants in a candidate region near the highway network is represented by placing a solar panel family on the same scale (i.e., 1/5000) as the spatial data to the location points in the BIM environment. In particular, to pinpoint the solar-panel families in the 3D environments (i.e., toposurface), which are the same as the position of the expected solar PV power generation computed through the spatial analysis (
Section 2.2) and the evaluation of the PV power output (
Section 2.3) on the GIS, the elevation is set differently, depending on the dimensions of the spatial data (e.g., solar PV power-output data, highway network data) in the BIM environment.
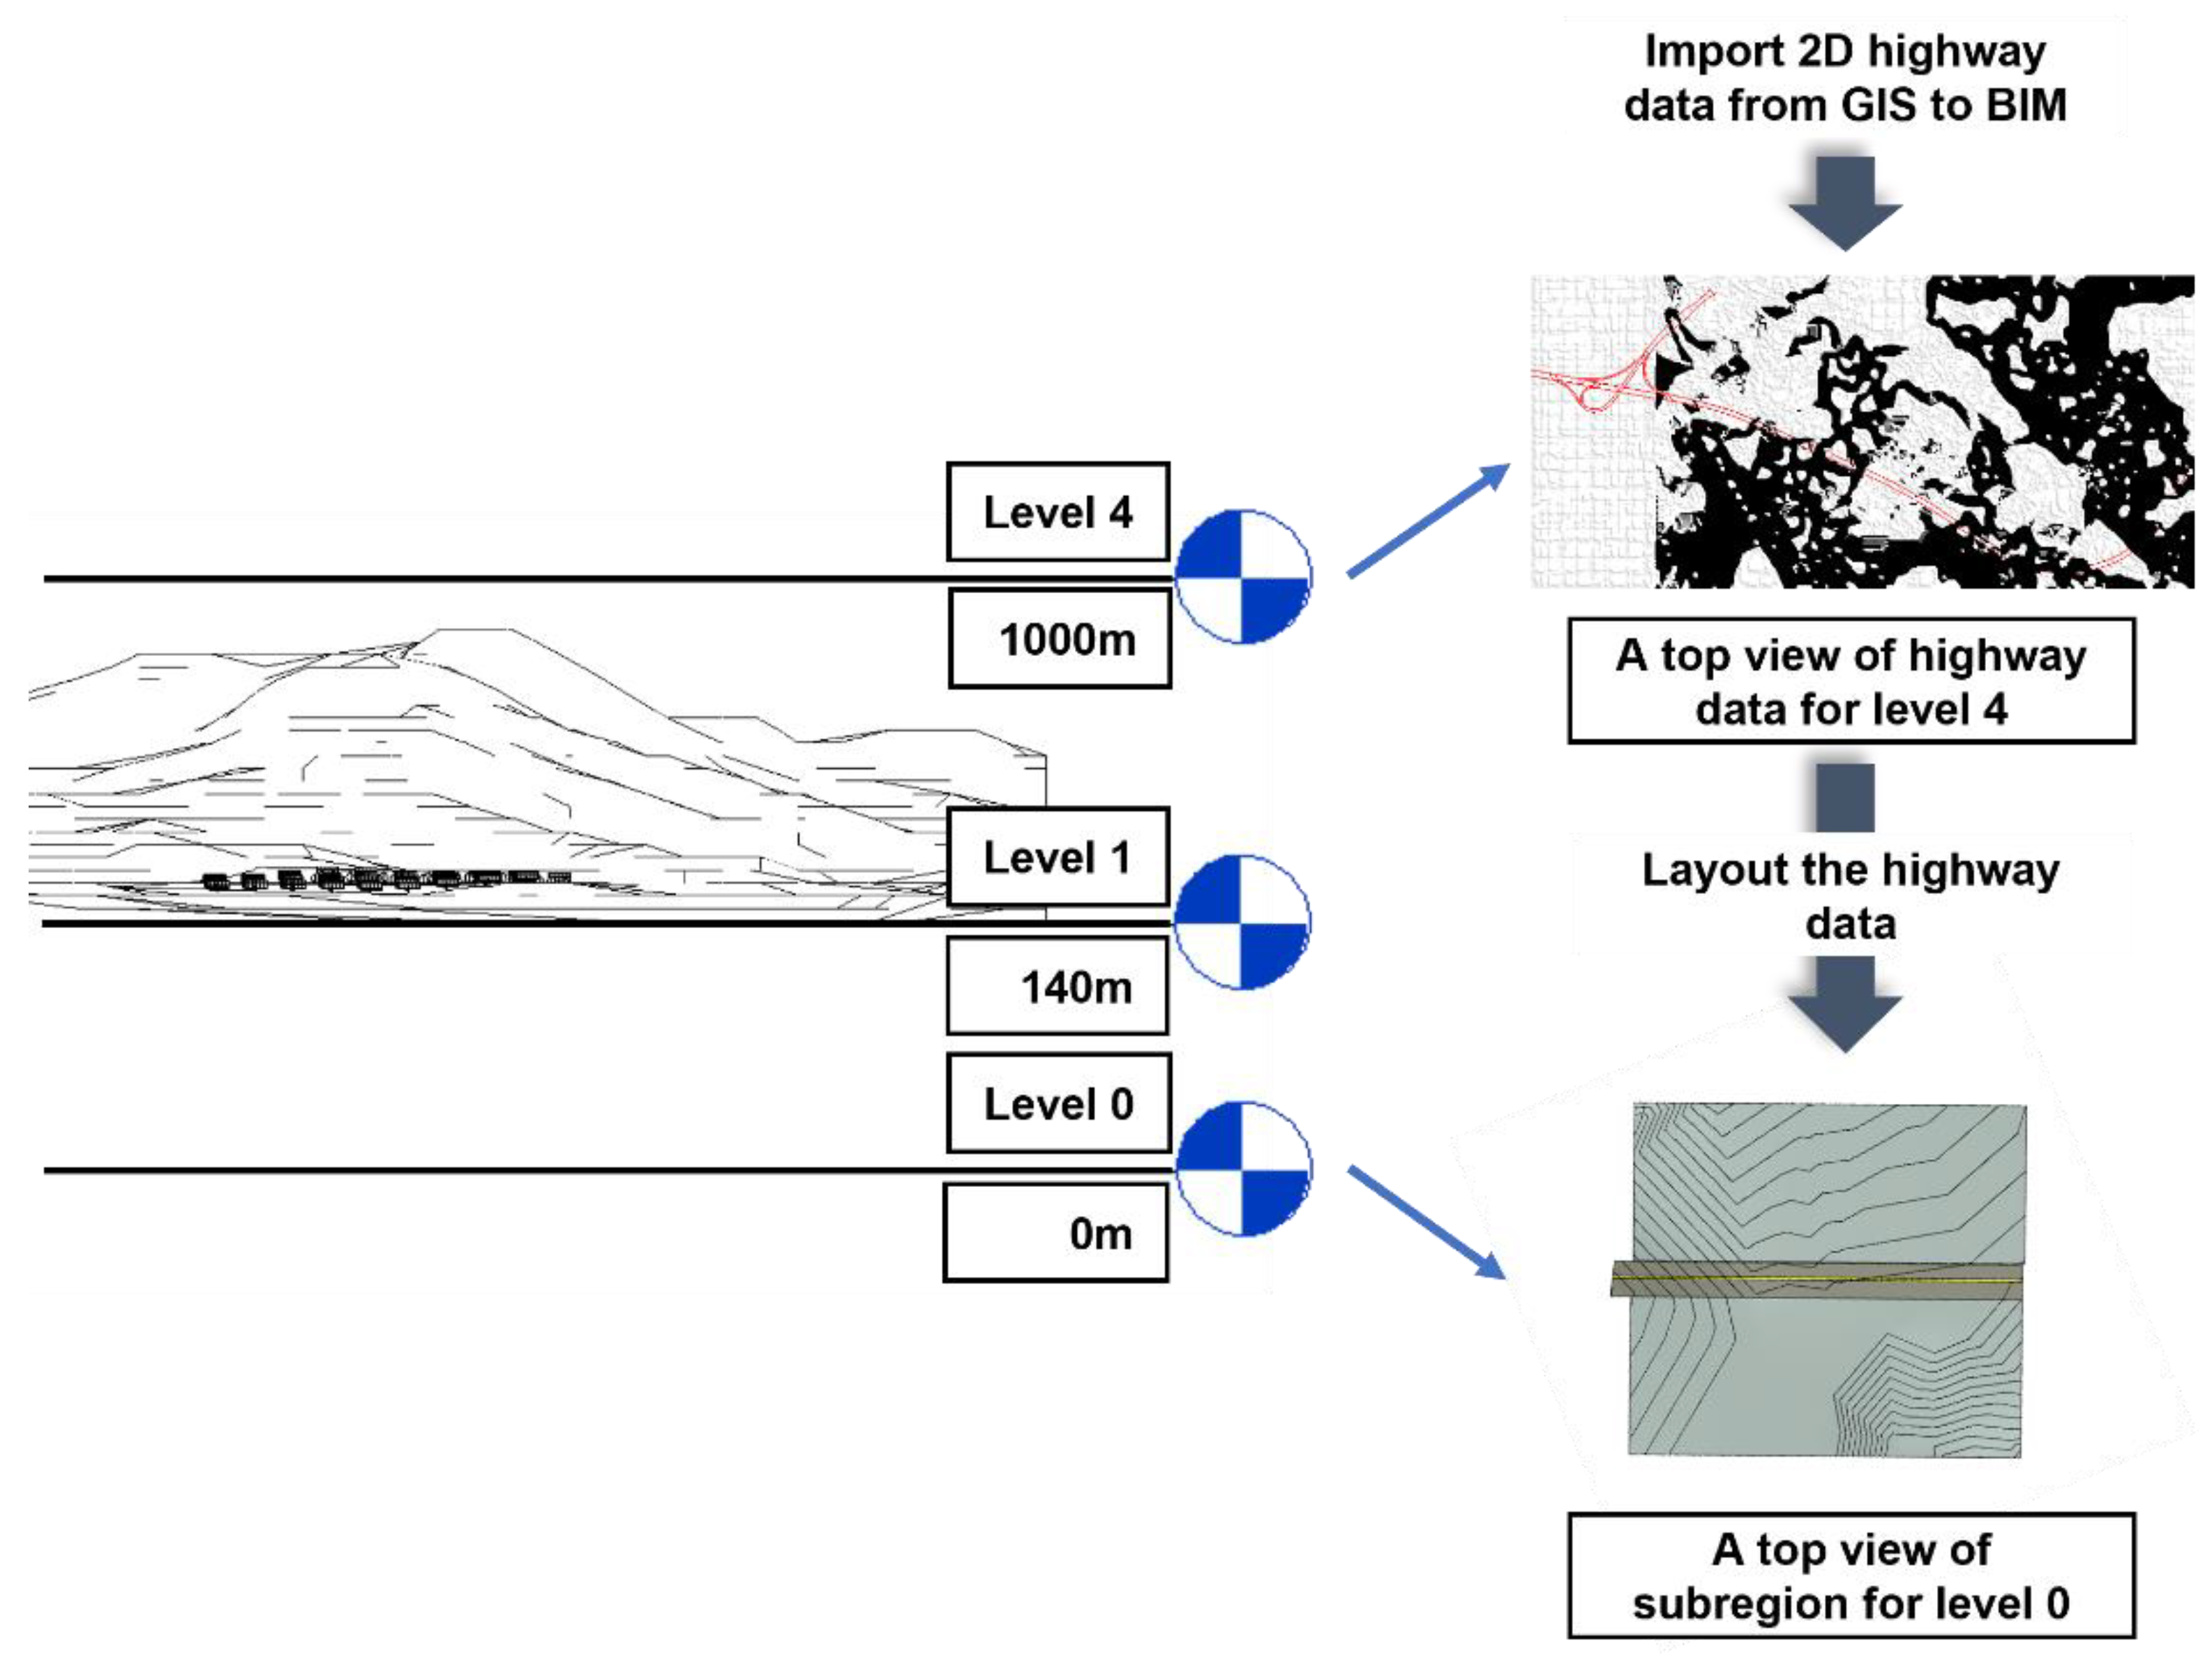
The highway network data are represented in GIS in 2D format and cannot be placed on the 3D toposurfaces. Therefore, as shown in
Figure 6, the highway data are imported 1000 m higher than the toposurface to prevent them from being obscured by the toposurface. Then, its data are converted into a subregion shape, based on 0 m in the building elevation (level). Meanwhile, the solar PV power output data, including 3D coordinates (x, y, z), are placed on a toposurface using the Dynamo function with the solar panel family. For example, because point data (i.e., PV power output) cannot be imported directly into the BIM, the Point.ByCoordinates function from Dynamo is used to position the PV power output as solar-panel families on the toposurface.
3. Results
Overall,
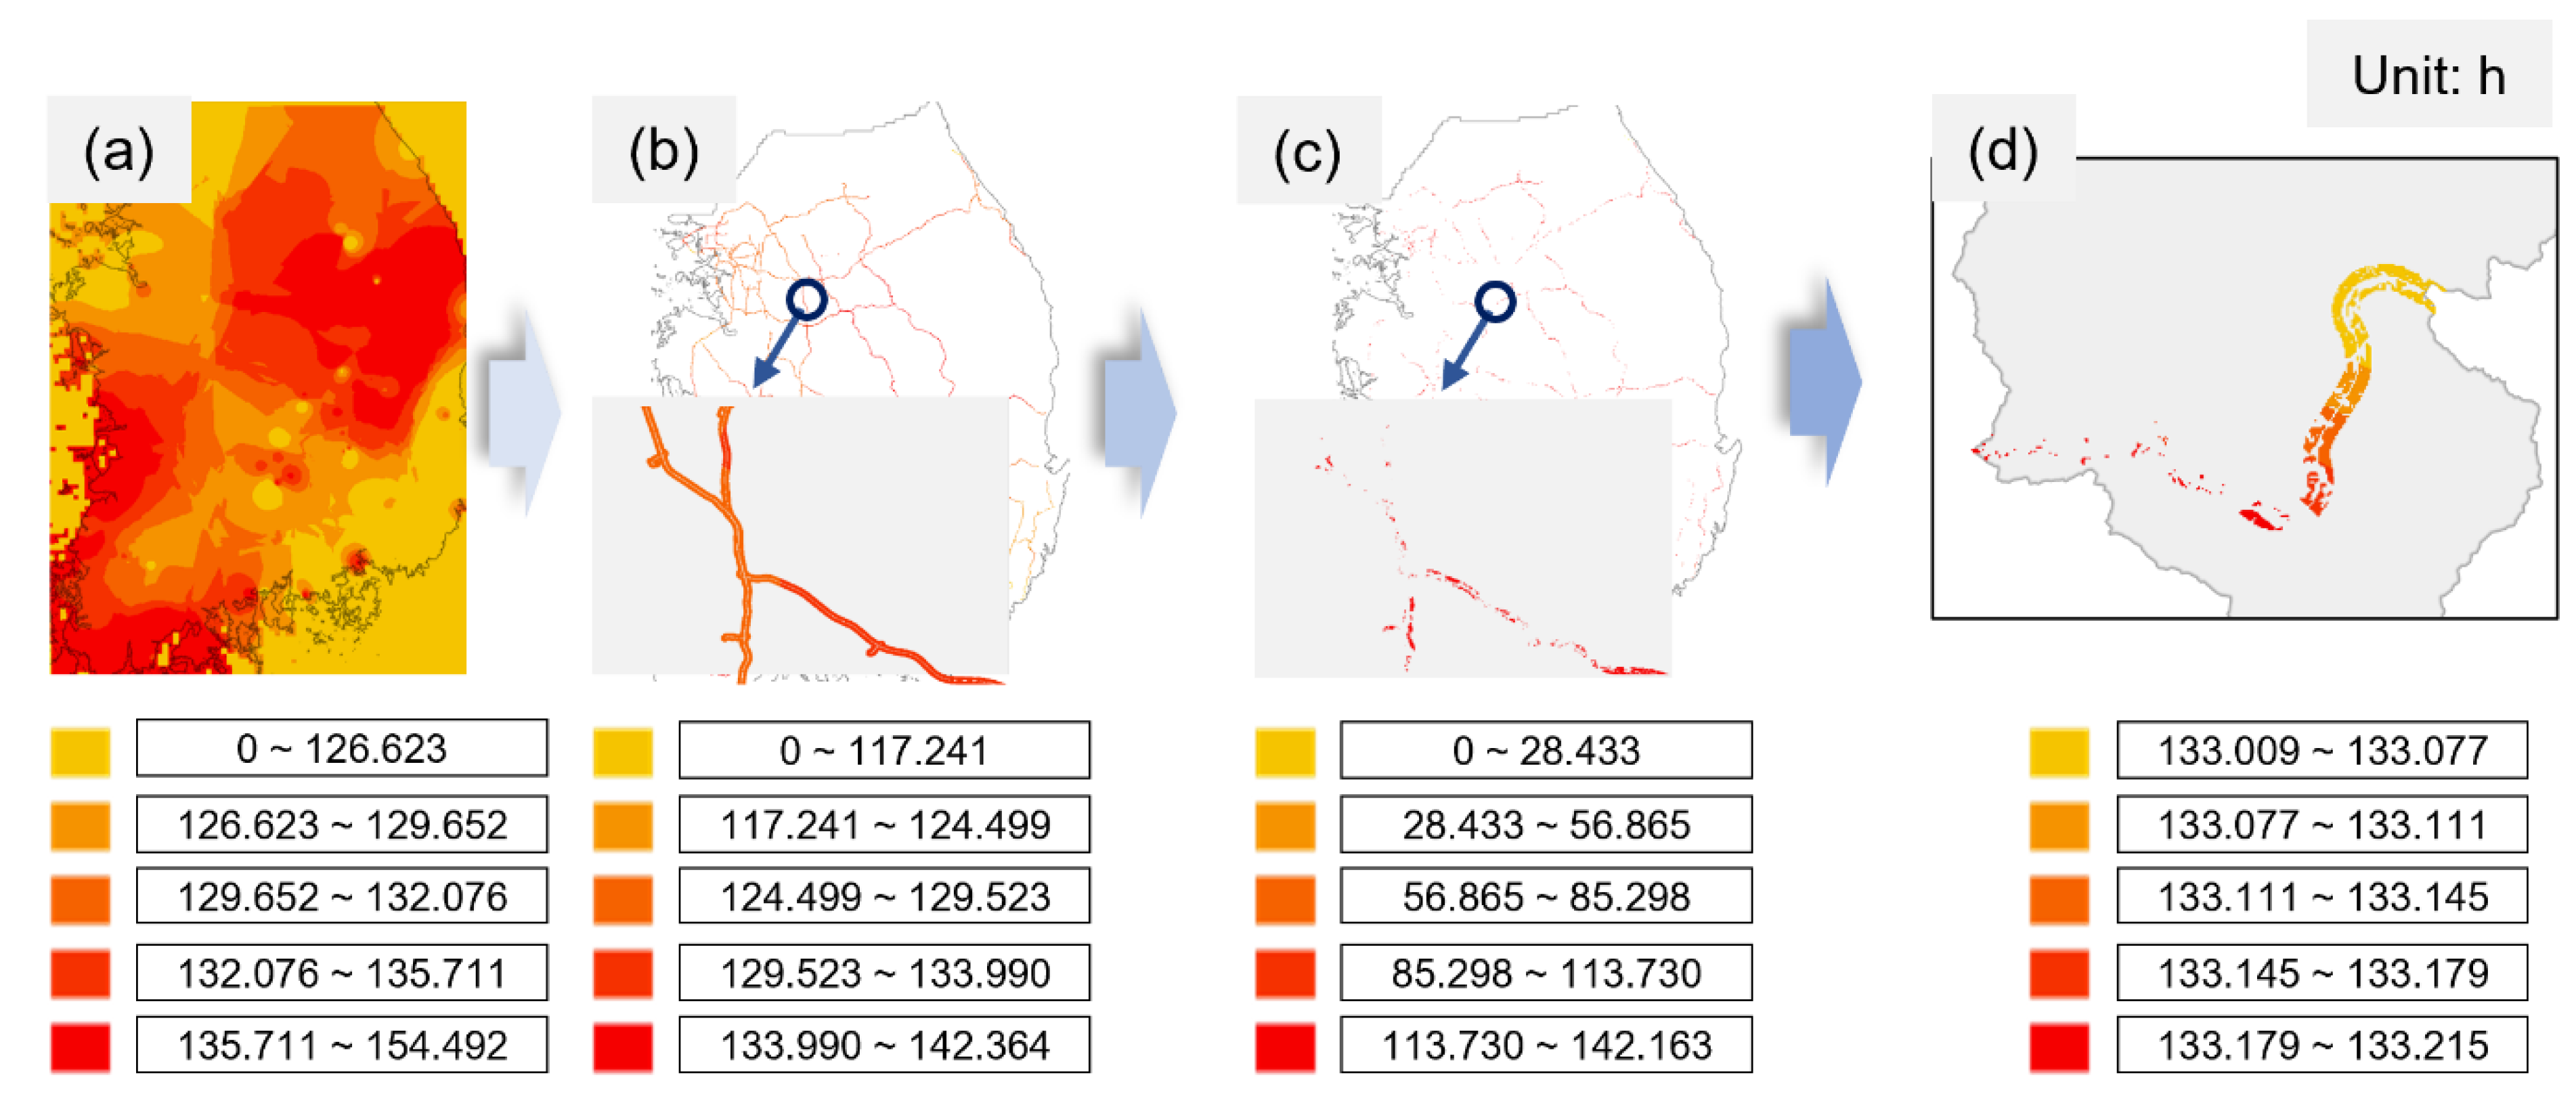
Figure 7 shows that suitable regions for PV plants were found using the maps of PV power output per capacity per hour (unit of h) obtained using the method in [
11], using a geo-spatial analysis of the GIS. In particular, this map (
Figure 7a) represents the distribution of the predicted PV outputs in March 2017, classifying them into five quantile-based classes, with a range of 0 h to 154,492 h. In addition, the national map of the PV power output (unit of h,
Figure 7a) was restricted to regions 200 m from the highway networks, using a buffer function (
Figure 7b). The constrained map of the PV power output is sorted into suitable regions through a geo-spatial analysis (
Section 2.2) at a national scale (
Figure 7c).
Figure 7b,c show that relatively lower PV output regions were excluded by the geo-spatial analysis. In addition, the sorted PV outputs in suitable regions at a national scale were zoomed in to the case area (i.e., district of Ucheon-myeon in South Korea,
Figure 7d).
Figure 7d shows that the range of PV output values (133,009 h to 133,215 h) at a regional scale is unchanged in comparison with the range of the PV output (0 h to 142,163 h) at a national scale (
Figure 7c).
To determine the amount of power that can be generated in the candidate regions, the solar PV power output (MWh) is evaluated by multiplying the PV power per capacity per hour (
Figure 7) with the power-generation capacity (
Section 2.3). The evaluated solar PV power output is represented in the distribution plots through spatial analysis and different map scales. Specifically, the distribution plots (
Table 2) display the range and distribution of the evaluated solar PV power output producible in each 30 × 30 m
2 area within a 200-m radius from the highway network.
The potential production of the PV output within a 200-m radius from the highway networks, without progressing the spatial analysis, at a national scale is computed as 29,002 GWh in an area of 1896.130 km
2. Moreover, the distribution of the PV outputs was within the range of 7.9 MWh to 16.7 MWh, with a mean, median, and standard deviation of 13.667 MWh, 13.967 MWh, and 0.697 MWh, respectively. Furthermore, selected areas within 200 m of the highway networks were sorted into available regions (i.e., the area was reduced from 1896.130 km
2 to 455.063 km
2) while satisfying the spatial analysis (
Section 2.2) to rule out the four factors (distance to road, slope, river, reservoir), that are inappropriate for installing PV plants.
The restricted area that meets the criteria at a national scale is 455.063 km2, and the available PV power output in this area is 6784 GWh (within the range of 9.4 to 15.4 MWh, with a mean, median, and standard deviation of 13.531 MWh, 13.754 MWh, and 0.920 MWh, respectively). Moreover, the evaluated PV power outputs selected at suitable sites at a national scale were sorted into specific regions (district of Ucheon-myeon in South Korea) for a detailed visualization in the BIM environment. The PV output production in the Ucheon-myeon case area (area of 1.669 km2) is computed as a total of 8.227 GWh, within the range of 11.2 MWh to 14.4 MWh, with a mean, a median, and a standard deviation of 13.407 MWh, 12.782 MWh, and 0.827 MWh, respectively.
Based on these results, we may infer that solar-power production can be affected by spatial analyses and changes at the regional scale. For example, the power generation output (29,002 GWh to 6784 GWh) and range of available production (7.9–16.7 MWh to 9.4–15.4 MWh) are reduced by applying the spatial analysis to the sites selected for PV plants. In addition, the power-generation output (6784 GWh to 8.227 GWh) and range of available production (9.4–15.4 MWh to 11.2–14.4 MWh) is reduced by applying the spatial analysis to the sites selected for PV plants. Meanwhile, the mean and median power output per unit area has increased as selecting adequate PV sites using spatial analysis. Mean monthly PV power output per unit area has increased from 7.324 kWh/km2, 29.734 kWh/km2, to 8032.954 kWh/km2 along with site restrictions. In addition, the non-installation areas of power plants at a national scale, which account for 7.196% of all candidate sites, were excluded through the spatial analysis proposed in this study. It implies that the suitable sites to install power plants for more centralized and efficient electricity production are presented.
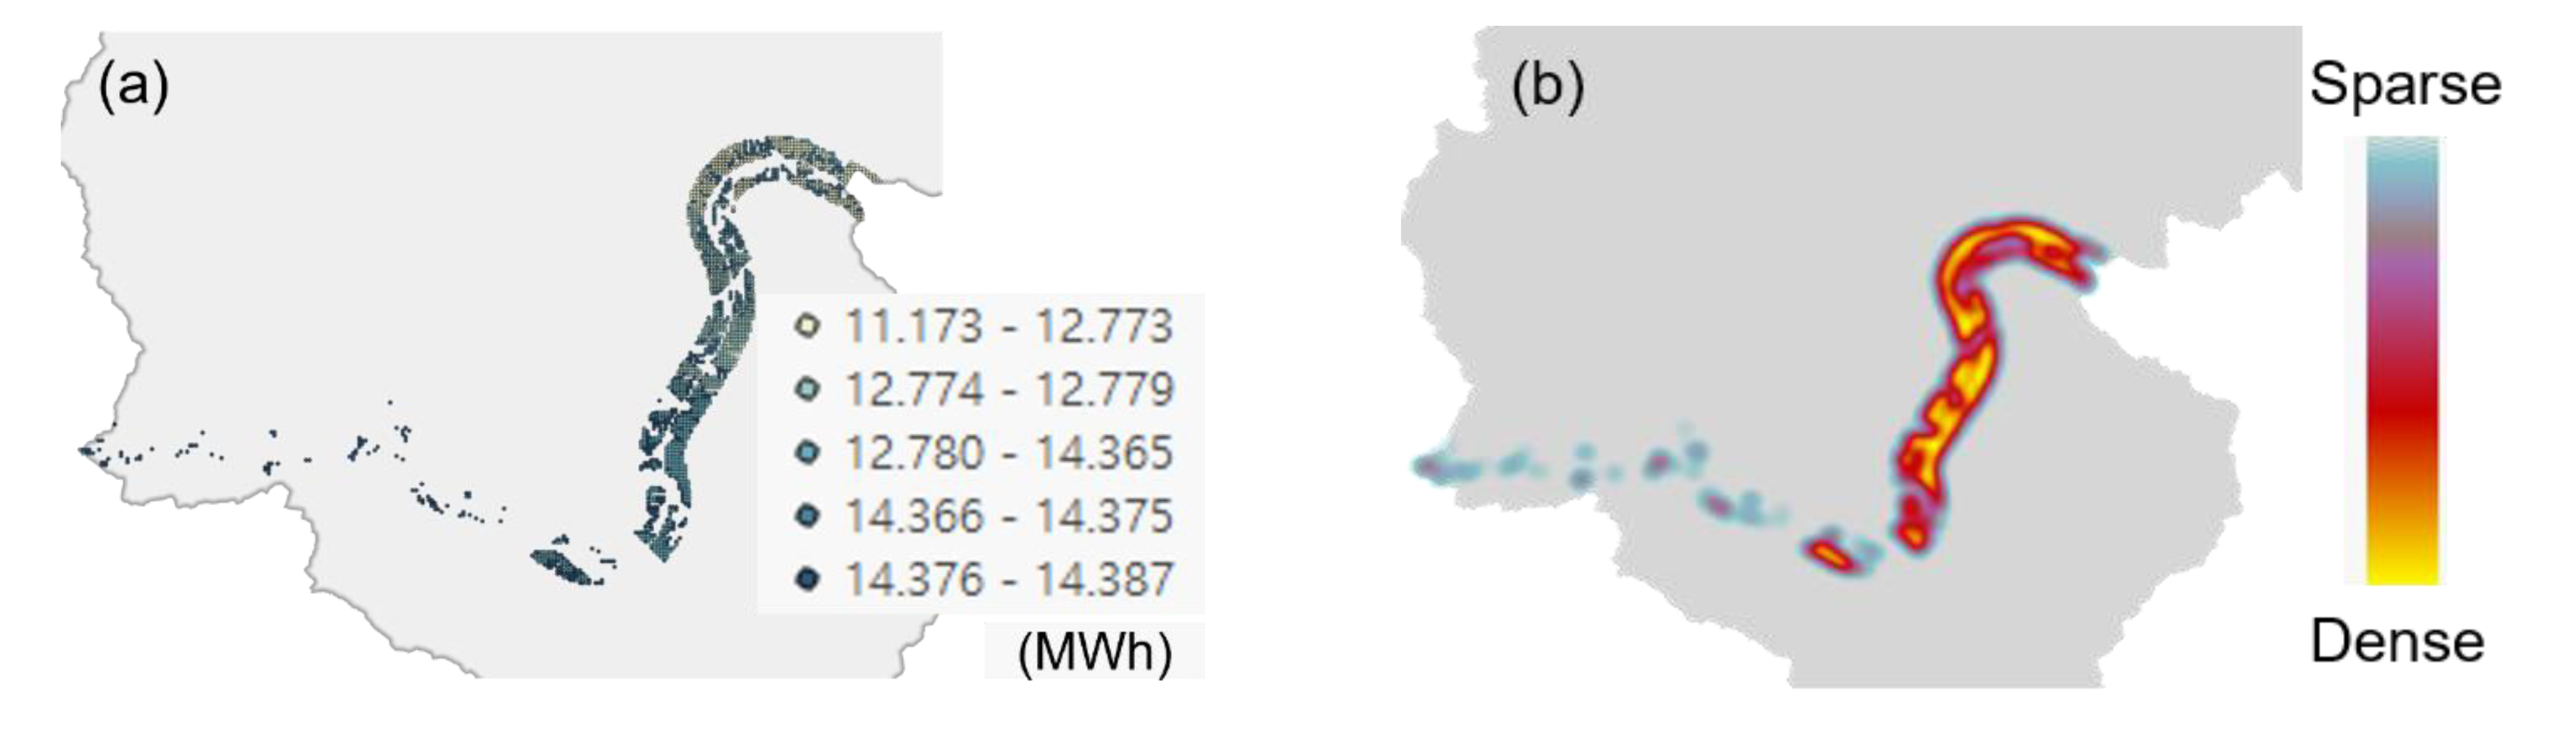
Additionally, to visually explore the geographical patterns of PV power outputs in the case area, the distribution map presented in
Table 2 was generated by classifying it into five classes for visualization, as shown in
Figure 8a.
Figure 8a shows a trend in which energy production is lower in the east. In addition, the heatmap in
Figure 8b, which draws PV power-output features as the representative surface of the relative density (i.e., indicating density values, ranging from cool (i.e., sparse density) to hot (high density), was created, as shown in
Figure 8a. Unlike the PV power-output distribution shown in
Figure 8a, the heatmap tends to cluster in areas with low production. This implies that, although the energy distribution located in the eastern region is lower than that in the western region, the eastern region is considered more suitable for installing PV plants because the candidate sites are densely clustered.
The above results (compared to
Table 2) confirm that regional differences (scale change of the analysis region) can affect the solar-power generation using a specific date of PV output data (i.e., March 2017). Thus, this study also identified the monthly trend of PV power-output production at different scales of candidate sites by computing the average monthly PV power output (
Figure 9). Overall, the monthly PV power output on a national scale (blue line,
Figure 9) achieves a mean, median, and standard deviation of 5,823,123 MWh, 5,793,198 MWh, and 969,678 MWh, respectively.
When investigating the trend of PV power on a monthly basis, the highest power generation of 7,592,664 MWh was observed in May 2017, while the lowest power generation of 4,374,704 MWh was observed in December 2017. In addition, the monthly PV power output in the case area (i.e., Ucheon-myeon district in South Korea) obtained a mean, median, and standard deviation of 20,734 MWh, 20,959 MWh, and 4237 MWh, respectively. When investigating the PV power trend on a monthly basis, the highest power generation of 28,464 MWh was observed in May 2017 (red lines,
Figure 10), whereas the lowest power generation of 14,207 MWh was observed in December 2017. This implies that the similarity of variation in monthly PV power output in the two regions may be affected by seasonal variation, regardless of regional change.
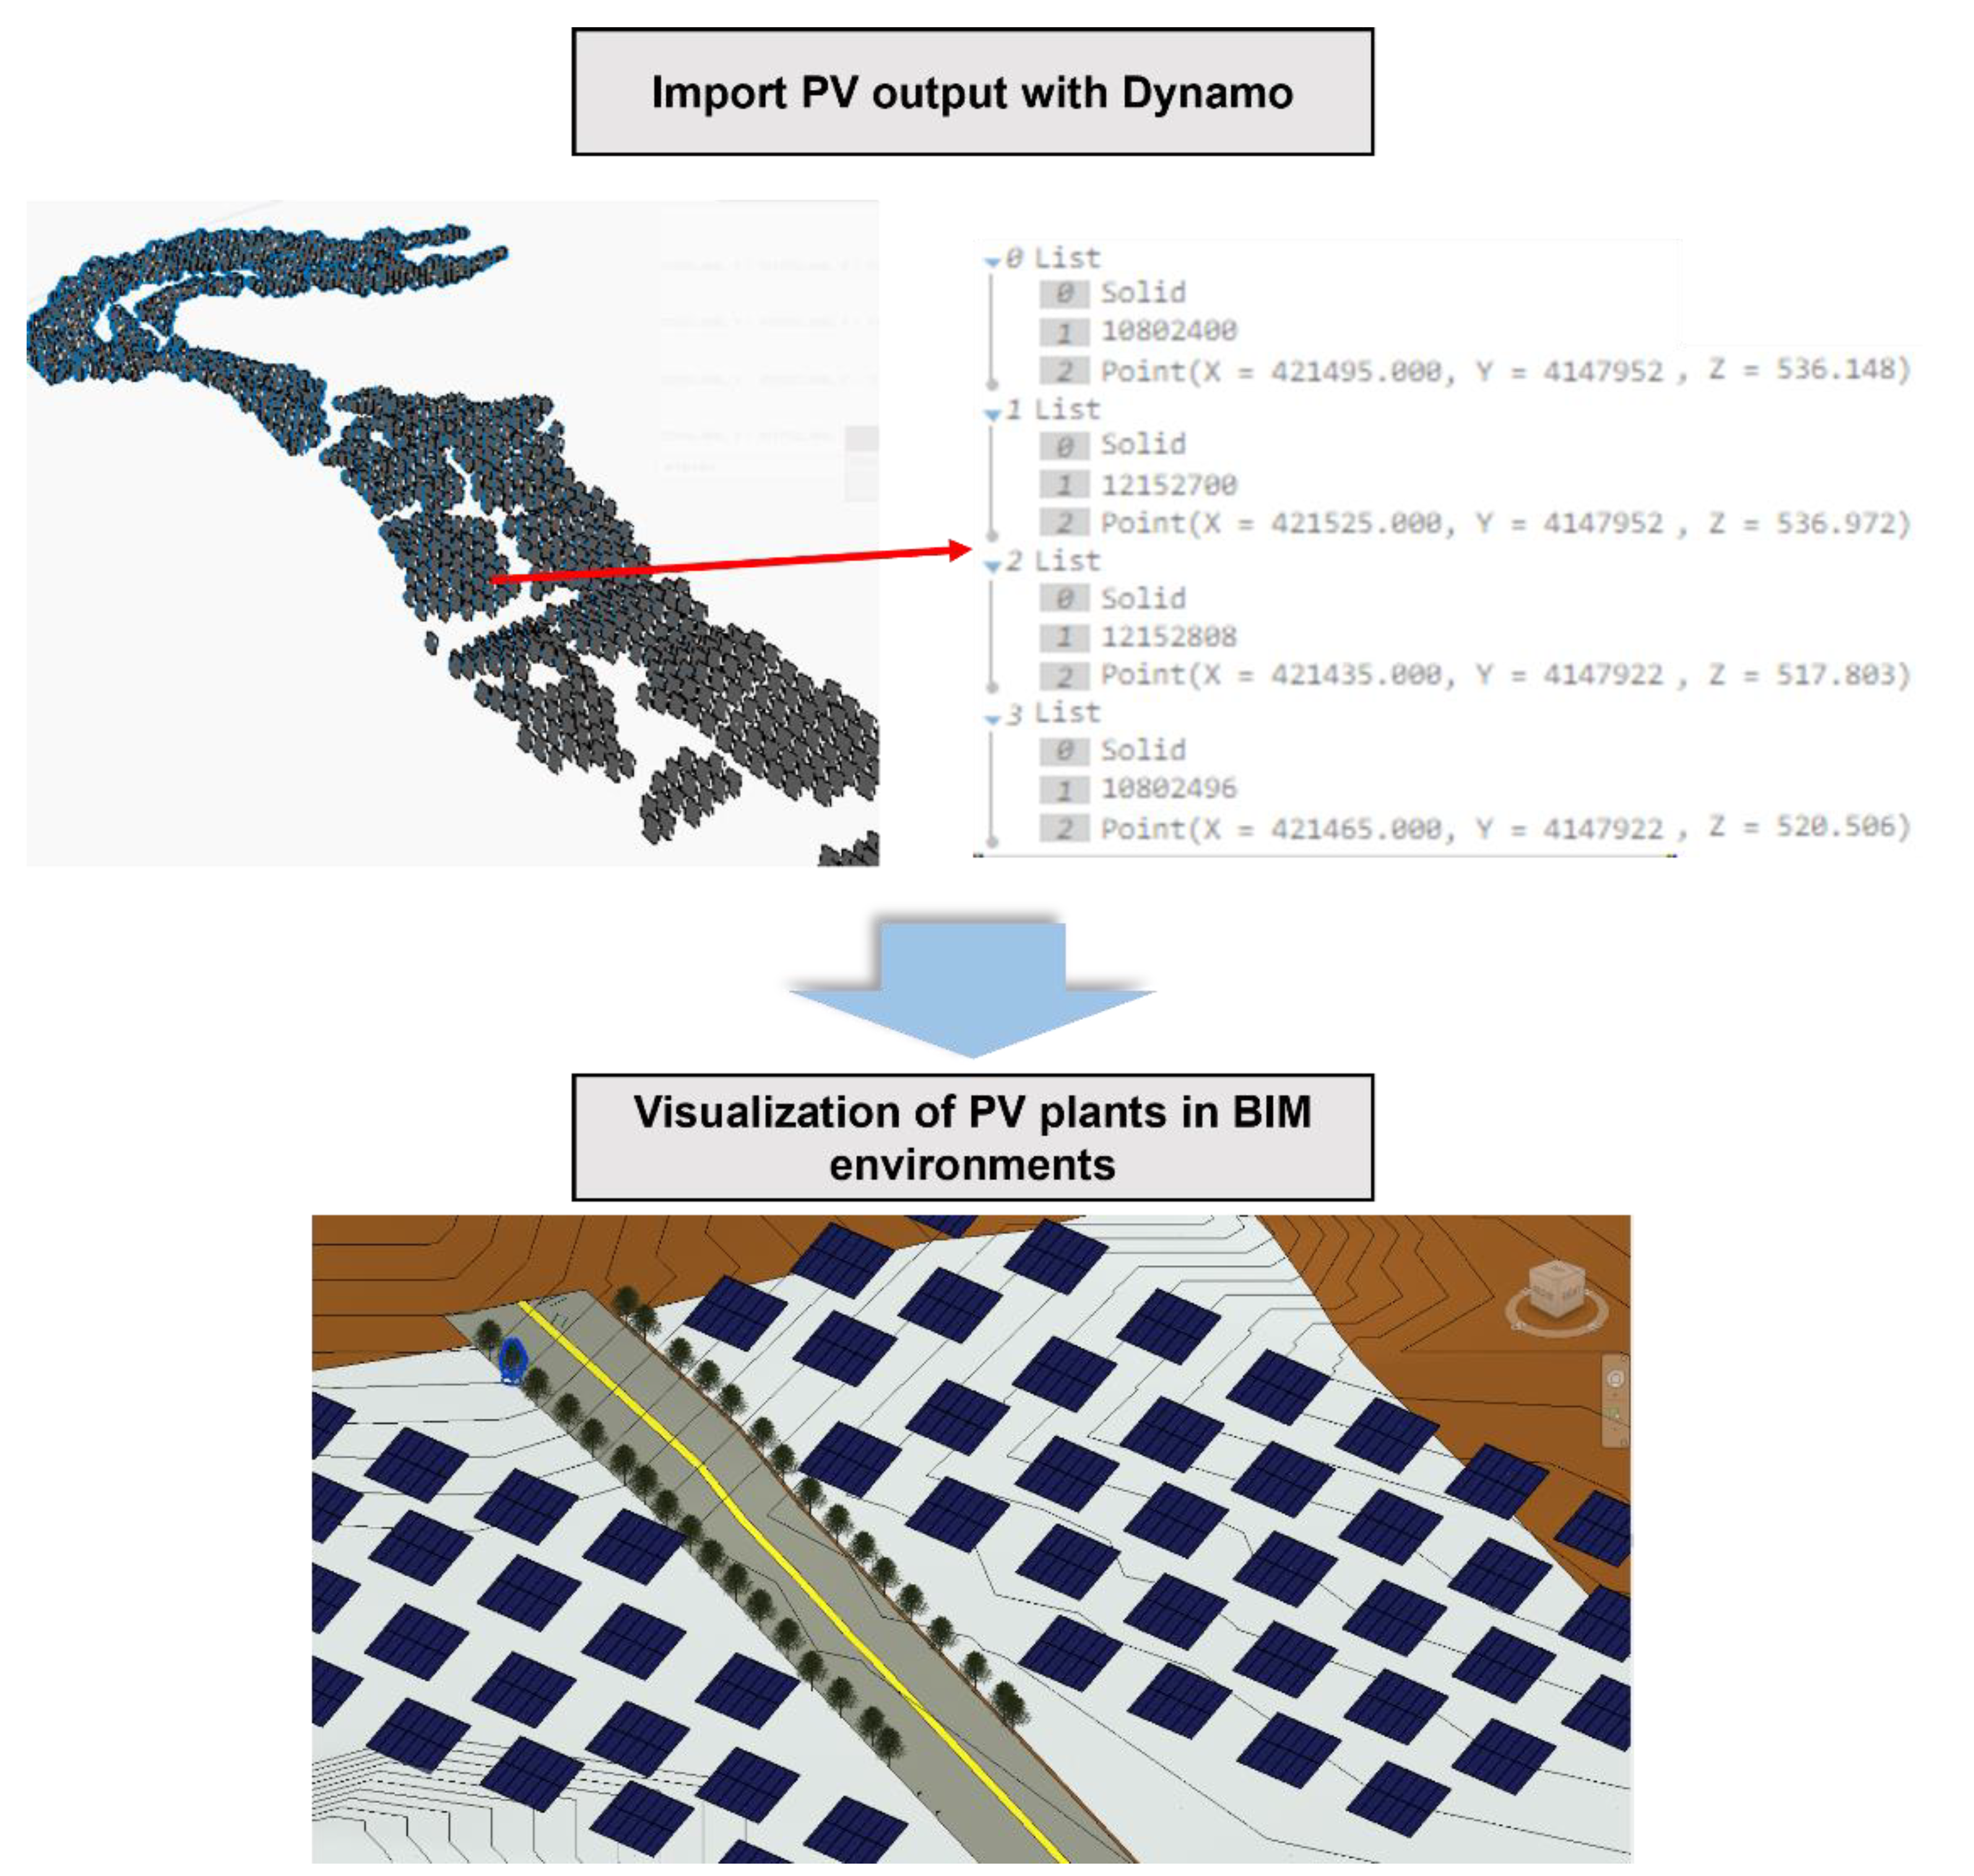
To visualize the 3D PV plant installation in the vicinity of the roads, this study transforms the results from a GIS environment (2D visualization) to a BIM environment (3D visualization), as shown in
Figure 10. In particular, the raster image-based solar PV power output is transformed to point layers, including (x, y, z) coordinates and potential power generation in CSV format, on the GIS. Then, the CSV format–based potential power generation is imported into the list arrangement with a solid shape using the Dynamo function, as shown in
Figure 10.
For example, each list consists of three elements: shape type (e.g., solid), solar PV output (MWh), and coordinates (x, y, z). In addition, to show the construction of PV plants, solid shapes are replaced with families of panels in the BIM environment. Each panel’s family also includes an attribute of PV power-output values to help with energy planning and highway construction management.
4. Discussion
Locating suitable regions for installing PV plants is a pivotal step in planning energy management in infrastructure construction. This research proposes a geo-spatial analysis–based optimal-site selection approach considering unused sites near highway networks. It uses digital numerical maps and raster image–based PV power output maps with a GIS. In addition, the installation of PV plants in suitable areas is visualized in a BIM environment to apply the concept of energy management to managing civil infrastructure (i.e., highway networks).
Previous studies could only investigate potential areas for PV plants nationwide using GIS and decision-making techniques (e.g., AHP). For instance, Colak et al., 2020 [
26] presented optimal site selection for PV plants using GIS and AHP techniques in the case of Turkey province. They dedicated that ten variables (e.g., solar energy potential, land cover, aspect, transformer centers, energy transmission lines, etc.) affect the site selection of PV plants, and they finally selected the candidate sites by restricting to the less clustered areas (i.e., area <20,000 m
2). Also, Liu et al., 2017 [
27] searched the optimal sites for PV power plants using GIS and decision-making methods in four candidate sites in China. They considered economic profit (e.g., initial investment, total revenue, maintenance cost, outage cost), solar radiation, elevation, and temperature to execute the sensitivity analysis for site selection. On the other hand, this proposed approach uses PV power-output maps and thus, evaluates the potential production of PV power in suitable regions using the proposed geo-spatial analysis. The experimental results show that, by using PV power output maps, the proposed method can investigate suitable regions and evaluate the potential production values (e.g., a total value of 6,783,725 MWh) of PV power output in the vicinity of highway networks. The result also demonstrates that the differences of regional scales can affect the production of PV power (e.g., reduce the range of available production from 9.4–15.4 MWh to 11.2–14.4 MWh) in
Table 2. This study also focused on the case study area of Ucheon-myeon (the total potential production value was 8227 MWh) to investigate the candidate sites analyzed on a nationwide scale in more detail. In addition, unlike recent studies that estimate and assess the solar power generation in a limited area such as roof [
19] using BIM, this paper visualizes as families of solar panels generated from geo-spatial analysis on a 3D terrain map (toposurface map) with a BIM environment. In particular, this study visualized the installation of solar panels in the same environments as the realistic 3D terrain (including x, y, and z positions) near the highway by importing the amount of potential electricity that can be produced in the suitable sites by spatial analysis from GIS to BIM and documented the information of potential electricity generation in virtual space (i.e., BIM environment).
The results show that the proposed approach enables the evaluation of power generation in the vicinity of highways as unused areas and explores suitable areas with high production efficiency from the distribution map and heatmap (
Figure 8a,b), where the concentration of suitable regions for the construction of PV plants minimizes the additional installation of electrical facilities. In addition, visualizing the installation of solar PV plants near highway networks in BIM environments may help the energy management and planning of highway management by balancing the energy consumption during highway maintenance and solar power generation produced on the selected suitable sites for PV plants in this paper as building an independent smart grid system in BIM and GIS. For example, if the electricity-consumption data are included in the BIM environment, along with the potential power generation presented in this study, the energy self-sufficiency rate, which indicates production surplus in relation to demand, can be efficiently predicted and support the maintenance and planning of energy infrastructure systems. In this respect, this research may not only help to investigate suitable regions for PV plants using PV power-output maps at a regional and national scale but also be potentially utilized for the energy management and planning of highway-network construction and maintenance.
Although this study can efficiently search for suitable sites for installing solar PV plants with geo-spatial analysis using horizontal-based highway data as polygon shapes, future studies need to address the following issues. The proposed method should be developed by using 3D spatial analysis that can reflect the features’ 3D geometry exactly in the site selection or solar-energy estimation, which could not be represented by 2D or 2.5D analysis using DEM with the BIM-based highway network data and geo-spatial data (e.g., topography and meteorological data) [
28].
This is because the current approach cannot be fully considered or defined for vertical surfaces, such as the height difference between highways and solar PV plants. For instance, the horizontal-based highway data did not reflect obstacle factors preventing solar energy from reaching the candidate sites for PV plants, such as L-type side gutters, soundproof walls, and changes in highway elevations.
Furthermore, this paper should replace the highway objects that display as subregion shapes imported from 2D polygon with data using the 3D model-based highway design to visualize the installation of PV plants near the highway roads. Due to the limitations of the collected 2D data that is not given in the same section, it makes it challenging to assign an elevation value to the highway data in the same section. Thus, the existing data in this paper was converted into a subregion format and limited to highway data displayed in a 3D environment. Accordingly, future studies should be used to the level of detail technique (LOD 350-level 3D design data that include slopes, side gutters, soundproofing, and elevations with industry foundation classes (IFC)) for integrating GIS and BIM environments to implement a 3D-based geo-spatial analysis and more accurate visualization of installation of PV plant for energy management in 3D environments.


