Article

Static Balancing Ability and Lower Body Kinematics Examination of Hungarian Folk Dancers: A Pilot Study Investigating the “Kalocsai Mars” Dance Sequence

Department of Mechatronics, Optics and Engineering Informatics, Faculty of Mechanical Engineering, Budapest University of Technology and Economics, HU-1111 Budapest, Hungary
*
Author to whom correspondence should be addressed.
Submission received: 14 July 2021 / Revised: 8 September 2021 / Accepted: 15 September 2021 / Published: 21 September 2021
(This article belongs to the Special Issue Applied Biomechanics and Motion Analysis)

Abstract

:
Folk dance is a collection of traditional dances that requires years of practicing to perform correctly. The aim of the present study was to develop a complex biomechanical measurement procedure that investigated Hungarian folk dancers’ balancing ability and lower body kinematics through a dance movement called “Kalocsai mars”. Therefore, 11 dancers’ motion (5 female and 6 male; age: 20.5 ± 2.5 years; height: 173.82 ± 7.82 cm; weight: 64.77 ± 8.67 kg) was recorded with an optical-based motion capture system and force platforms simultaneously. Before and after the dancing session, static balancing tests were performed, examining bipedal stance with eyes opened and closed conditions. The ANOVA results showed that the values of the range of motions of the knee joint flexion-extension angles and hip flexion averaged for sessions increased significantly ( p = 0.044 , p = 0.003 , p = 0.005 ) during the dancing sessions. The deviation in the joint angle was greater in the nondominant legs, suggesting that the nondominant side requires more attention to execute the dance steps correctly. The results of the balance tests showed that the oscillation in the posterior direction increased significantly after dancing ( p = 0.023 ). In comparison, the visual feedback had no significant effect on the dancers’ balancing ability.

1. Introduction

Hungarian folk dance is a collection of traditional dances that originated in the Carpathian Basin. In general, folk dance is performed in groups; however, it can be performed individually as the so-called “Legényes’s” and by ages, from children’s ensembles to professionally organized adult groups. The regulated forms of Hungarian folk dance appeared in the late 19th Century [1,2]. As a result of the regulation procedure, regionally danced forms were categorized into different folk dance styles. Currently, these regional folk dance styles have strict dance sequences, and many of them require years of practice to be performed correctly. On the other hand, these folk dance styles differ in their habitual and dynamic attitude. Some forms mostly contain long-lasting spins and rotations, which necessitate sufficient balance ability, while the more dynamic styles consist of short jumps, leg swings, and leg slamming elements, which may predispose its dancers to a high risk of injury. The most dangerous elements for the joints are the leg slamming elements, because they can cause cartilage wear [3,4]. Such folk steps, when the legs are placed forcefully onto the floor, are similar to some steps of Irish folk dances, which have been examined previously from a biomechanical point of view [5].
Biomechanical tools are widely used in different dance styles to reduce the risk of injury or increase performance [6,7,8,9]. One of the most commonly used tools to examine the dancers’ movement is motion analysis. The different dance styles can be characterized by the angular displacement and angular velocity of the body segments. The derived observations can be built into dancers’ everyday practice, such as lowering the risk of injury for ballet and folk dancers, analyzing the effect of fatigue, or investigating their accuracy to increase performance [5,7,10,11,12]. The lower limbs (knee joint, ankle joint, and hip joint) are the most frequently injured areas in both ballet and contemporary dancers; therefore, most studies primarily focused on these areas [6,8,11]. Hendry and Campbell concluded that the increased range of motion (ROM) of dancers in certain ballet movements could reduce the reaction forces during landing; therefore, this could reduce the risk of injury [11]. In order to reduce the incidence of injury, several studies have given fatigue prominence and examined the possible effects of tiredness on the dancer’s motion. The study of Wild et al. investigated the effects of fatigue on lower limb and trunk angles, as well as the peak lower limb joint forces and moments of competitive female Irish dancers during a dance-specific single-limb landing. Compared with the prefatigue trials, Irish dancers landed with reduced ankle plantar flexion and external hip rotation and increased hip-adduction alignment postfatigue, potentially exposing them to a greater risk of injuries [5]. Other than injury prevention, increased dance performance can also be achieved by analyzing kinematic and kinetic parameters that characterize expert performance or efficiency of movement, such as coordination, especially when different skill levels are examined separately. Chang et al. compared the kinematic parameters of Latin dancers according to the dancers’ expertise level. It was found that the kinematic degrees of freedom unfroze as skill level progressed, leading to the increased organization of coordinative structures. The study suggested that understanding the dance sequence from a biomechanical perspective could be helpful to increase the performance of the dancer [9,12].
Besides dynamic motion analysis, assessment of dancers’ static balancing ability is also an extremely important field to analyze [13,14,15]. According to the literature review of da Silveira Costa et al., the aims of static balance tests in dancers are focused on three different fields: comparison of balancing skills in dancers and nondancers, examining balancing ability according to dance knowledge, and the examination of the effect of visual feedback on balancing ability [13]. Considering studies that investigate the effect of visual feedback on balancing ability, it was found that under sensory-challenged conditions, the dancers were better able to maintain their postures upright against gravity [15]. Furthermore, balance tests can provide information about the effect of fatigue, as fatigue can alter neural transmission. Pau et al. examined the effect of fatigue consequent to a competitive performance of rhythmic gymnasts. They found that the ability to generate compensatory contractions is impaired, originating from a lack of neuromuscular control and greater variability in joint motion [16]. This complex neural response leads to poorer postural control expressed in the form of larger COP excursions.
Based on the previously discussed research, it can be concluded that the various components of different dance types affect performance and injury risk in different ways, and thus, it may be useful to examine Hungarian folk dance to better understand the factors underlying injury risk and performance. Even though ballet is the most discussed dance type in the literature, as it uses specific equilibrium exercises (i.e., en relevé or en arabesque penché) and the dancers’ joints are often subjected to extreme loads, some other styles such as Latin dances and folk dances (i.e., Irish folk dance) have also recently been examined from a biomechanical point of view. Since the biomechanical effect of Hungarian folk dance is rarely examined, the present paper aimed to develop a new procedure investigating the Hungarian folk dancers’ lower body kinematics and balancing ability through a dance movement called “Kalocsai mars”. For this purpose, a pilot study was performed involving eleven dancers where the lower body kinematics and kinetics of the “Kalocsai mars” dance sequence and the dancers balancing ability were examined. The multistage study contained motion analysis with the evaluation of the motion patterns during intense dancing sessions and static balancing tests, which aimed to determine how the intense dancing sessions altered balancing ability. A within-study design was adopted to compare the differences in the motion parameters (ROM of the lower limb joint angles, normalized ground reaction force, and cycle time) across multiple dancing sessions. Before and after the dancing sessions, static balancing tests were conducted in bipedal stance with eyes closed and eyes opened conditions. The purpose of the static balancing tests was to examine the common effect of the visual feedback and the effect of potential deterioration in the balancing ability of the Hungarian folk dancers after 10 min of intensive dancing.

2. Materials and Methods

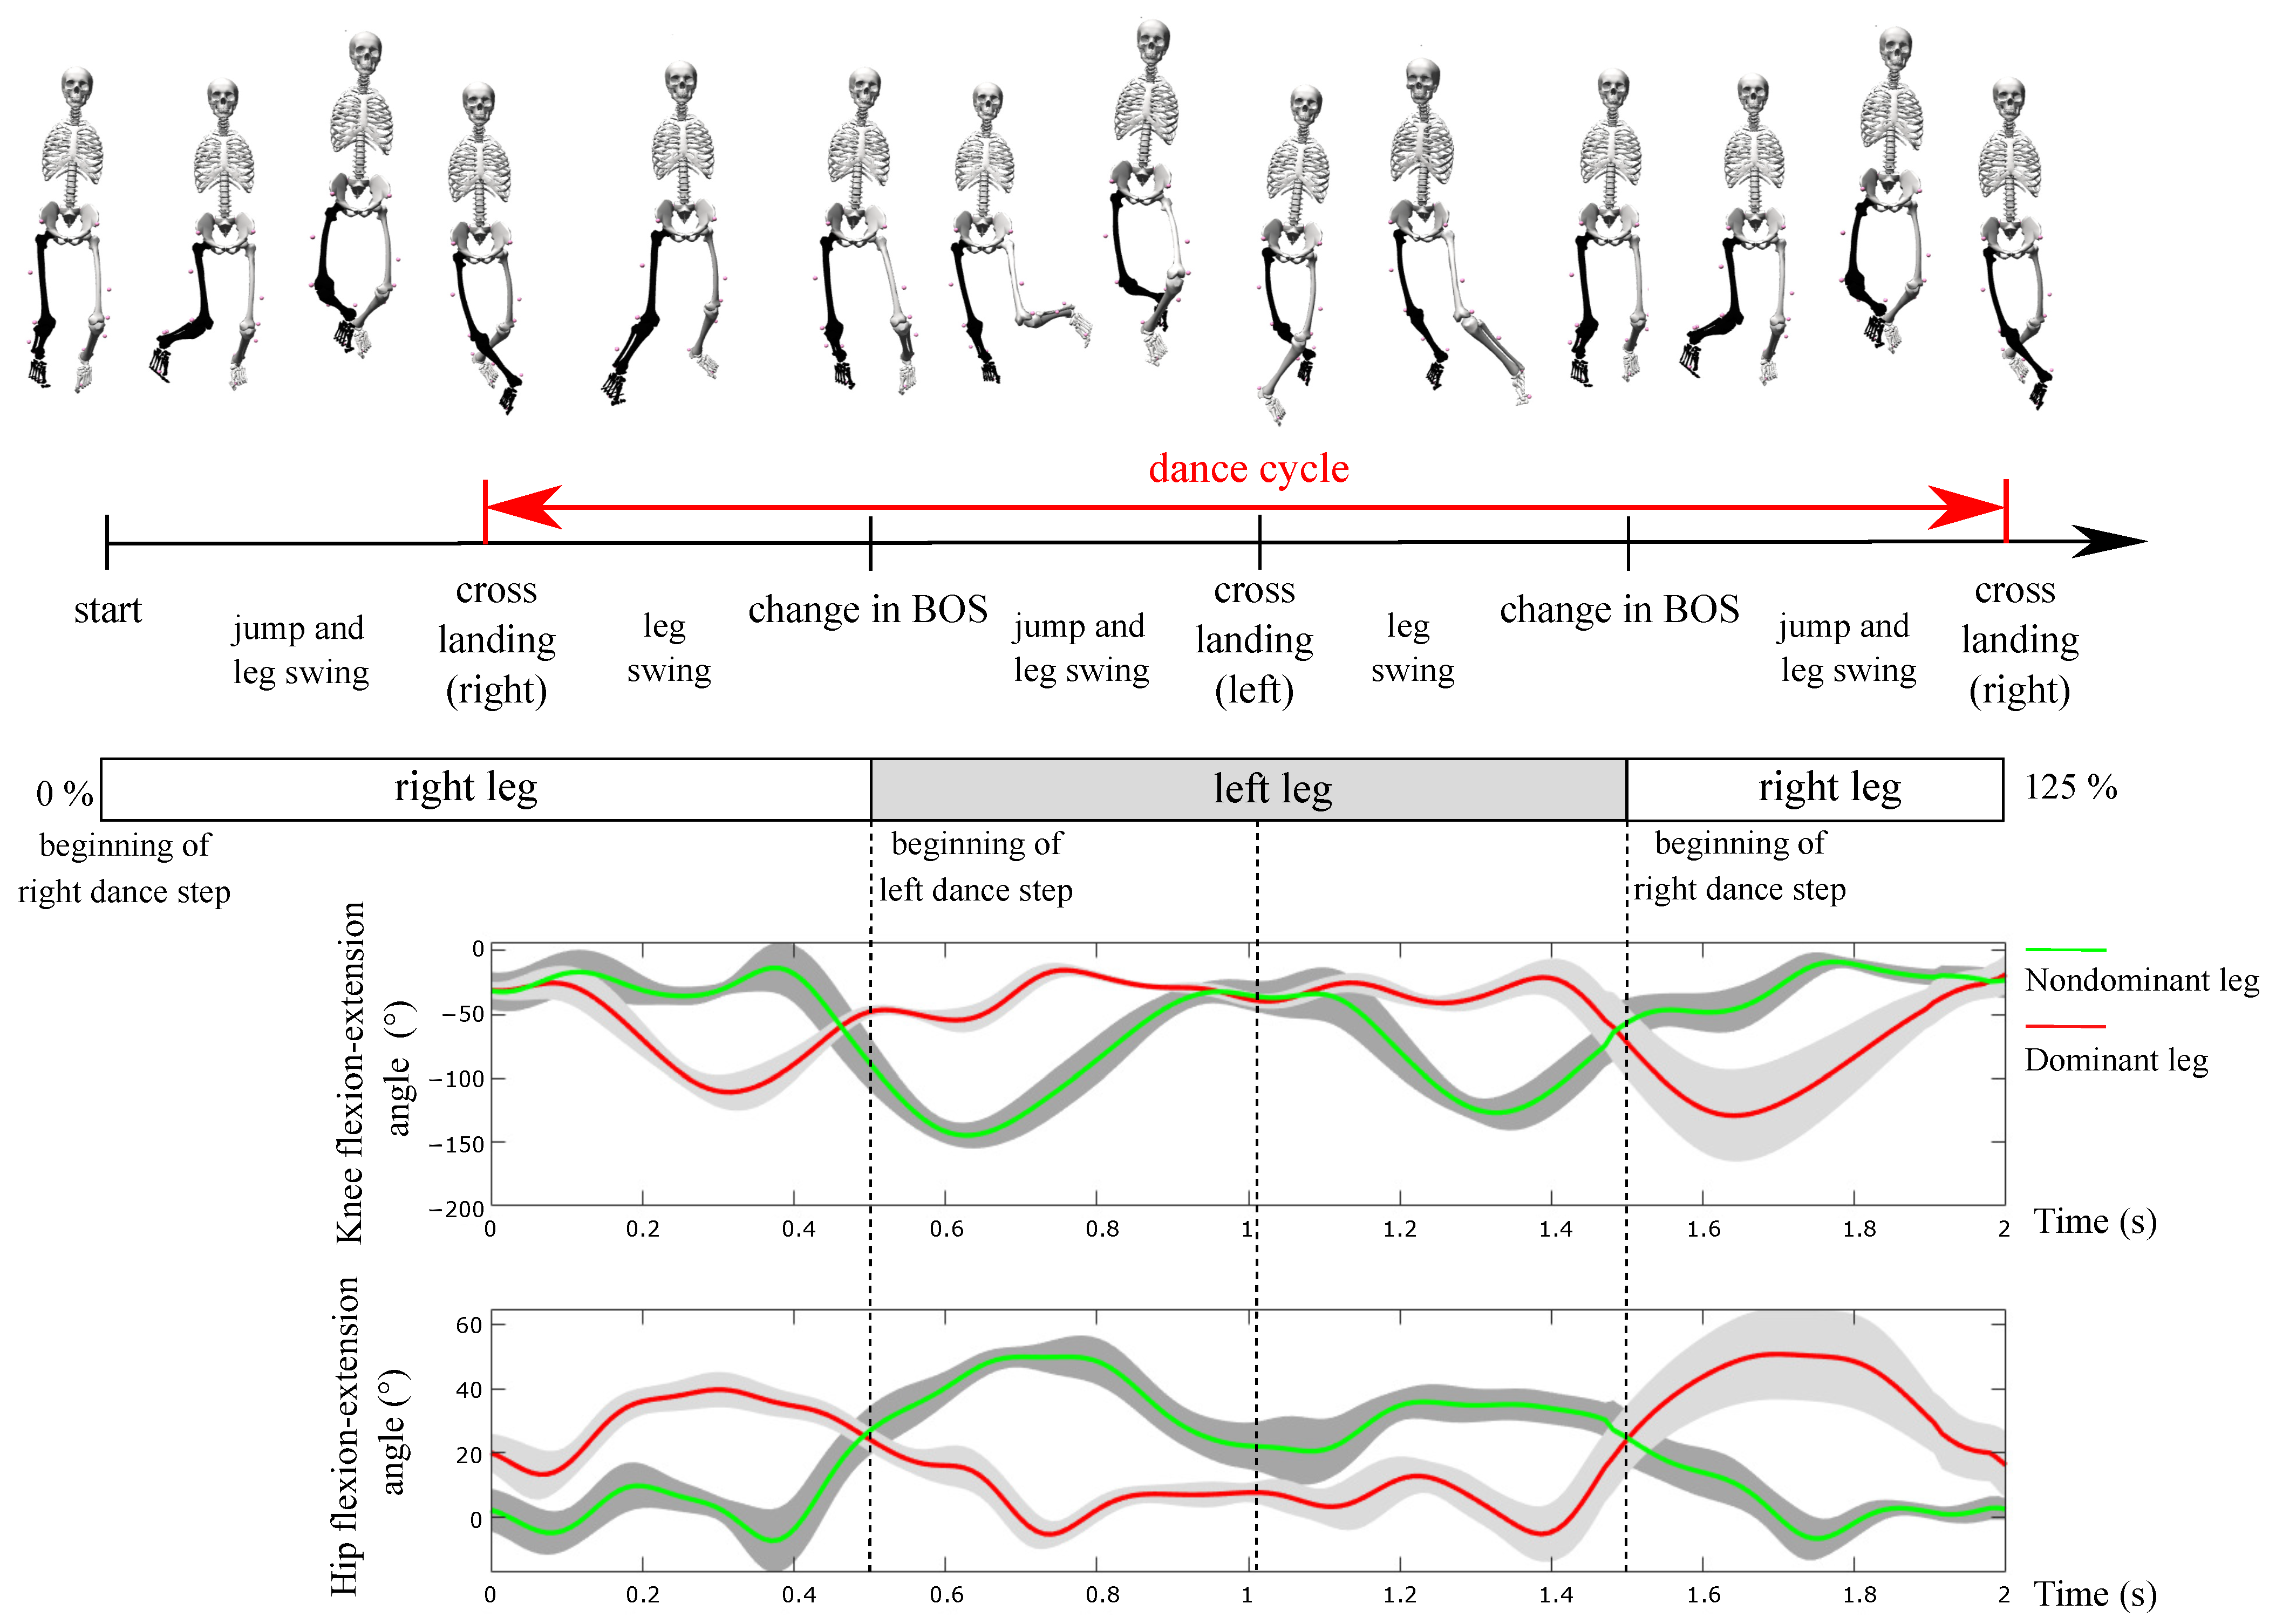
2.1. Examined Motion

A relatively simple and repetitive folk dance movement was chosen as the investigated motion containing a series of short jumps and leg swings (Figure 1) [17]. This movement is generally part of a dance called “Kalocsai mars”. Firstly, the dancer performs a jump where both legs elevate from the floor while bending the knees. During the jump, one of the legs draws an arc in the frontal plane, and in the end, the leg is placed forcefully onto the floor slightly ahead of the other (cross landing). The arc swing is repeated backward with the same leg without the jump. The leg swing ends with a change in the base of support (BOS), and similar to the previously described motion, the movement is repeated with the other leg. During the measurement of the dancing session, the motion sequence was performed continuously with alternating legs. Even though all the participants had prior experiences in this specific folk dance style, an appropriate practice time (between 10 min and 15 min) was provided to familiarize themselves with the movement.

2.2. Subjects

Five female and six male subjects (age: 20.5 ± 2.5 years; height: 173.82 ± 7.82 cm; weight: 64.77 ± 8.67 kg) participated in this present study, who practice at least 5 h a week. Dancers with different skill levels were involved, and the effect of the training level was not taken into consideration. None of the subjects had suffered any musculoskeletal injuries or disorders that affect balancing ability or locomotion system. All subjects gave their written consent to take part in the experiment after they were informed about all aspects of it. Afterwards, participants were asked to fill out the Waterloo Footedness Questionnaire (WFQ-R) to determine their dominant leg [18]. It was found that 10 participants were strongly right-side dominant and one participant was slightly more left-side dominant. The study was approved by the Science and Research Ethics Committee of the University of Physical Education (TE-KEB/17/2021).

2.3. Experimental Setup

A camera-based optical motion capture system was used to record the dancers’ motion (OptiTrack (NaturalPoint, Corvallis, OR, USA)) [19]. This measuring system has an accuracy of submillimeters (mean error: 0.565 mm) [19]. The motion was recorded using 18 OptiTrack Flex 13 cameras with a sampling frequency of 100 Hz. Spherical markers ( 12.7 mm) covered with reflective coating were placed on the distinct anatomical landmarks. This present study examined loads of the lower extremities; thus, 16 markers were placed on the dancers’ lower body according to the pre-implemented conventional lower body biomechanical marker set in the Motive software (NaturalPoint, Corvallis, OR, USA, v.1.10.0.) [20]. The measurements were performed at the Motion Capture Laboratory of the Department of Mechatronics, Optics, and Mechanical Engineering Informatics at Budapest University of Technology and Economics, Budapest, Hungary.
Simultaneous with the motion tracking, one pair of BTS P6000 (BTS Bioengineering, Milan, Italy) force plates were used to capture the ground reaction force (GRF) and center of pressure (COP) values. Data were recorded and exported using the SMART Capture (BTS Bioengineering, Milan, Italy, v.1.10.470.0.) software. One force plate had a 40 cm-wide and 60 cm-long measurement area. The two platforms were placed side by side in parallel with a 600 × 800 mm total detection area. The maximum load capacity of a single force plate was 8000 N. The measurements were captured with a sampling frequency of 1000 Hz [21]. The origin of the force plate and the motion tracking system was calibrated as one point. The two system’s synchronization was fulfilled via a NI-DAQmx (National Instruments, Austin, TX, USA) trigger box. Recordings were started using the motion capture system, which triggered the recording of the force platforms. Measurements were performed under almost identical environmental conditions (21–23 °C, using artificial lighting).

2.4. Experimental Procedure

After all 16 markers were visibly attached to the participant, the analyzed folk dance movement was shown to the subject, and a ten- to fifteen-minute warm-up period was guaranteed before the measurements [20]. Afterwards, a static balance test was performed (before dance) in bipedal stance with eyes opened (EO) and eyes closed (EC) conditions. The subject was asked to stand on the two force plates for the measurement by placing their left and right legs on separate platforms. The duration of the stabilometry tests was 60 s each. After finishing the stability measurements, the dancer waited and stood at attention on the force plate. Then, the folk music started, and the participant was asked to repeat the examined movement of the “Kalocsai mars” dance. After a couple of dance cycles, the recording was started and captured for 30 s. The dancing session was repeated ten times, allowing a 30 s resting time between them (total measurement time: 10 min). The end of the tenth dancing session was followed by a static balance test (after dance), similar to the beginning of the measurement.

2.5. Data Processing

The motion tracking system recorded the spatial coordinates of the anatomical markers, from which joint angles were calculated using the Opensim (NIH Center for Biomedical Computation, Stanford University, Stanford, CA, USA) software’s Inverse Kinematics toolbox (Table 1) [22]. To quantify the recorded folk dance sequences, the 30 s-long sessions were split into cycles; one dance session contained approximately 15 complete dance cycles. The analyzed dance cycle was defined from cross position to the next cross position (Figure 1), which could be clearly determined from the marker placed on the calcaneus (the marker was placed on the center of the heel, where the Achilles tendon attaches to the calcaneus bone) and tibia (the marker was placed on the shin bone near the midline of the lower leg), from which the vertical displacement of the heel and the distance between the two shin bones were analyzed simultaneously. The beginning of a cycle was defined where the two distance functions had local minima, and the cycle lasted until the next coincided with the local minima. This way, the dance cycle started with a cross position and was followed by a short counterclockwise leg swing (Figure 1: right leg). Then, the dancer changed his/her BOS and performed a jump while swinging his/her other leg clockwise (Figure 1: left leg), which again was followed by a cross position and a short leg swing counterclockwise (Figure 1: left leg). After the change in the base of support, the dancer performed a jump again while swinging his/her initial leg clockwise (Figure 1: right leg), which ended with a cross position. Therefore, the cycle ended with the second cross position as well. The average and the standard deviation of the joint angles of the knee joint and the flexion of the hip joint during a dance cycle for one subject are shown in Figure 1. The dominant leg for the subject shown is the right leg.
The average of the ranges of joint angular motion (ROMs) for hip flexion, knee flexion, and pelvic tilt were calculated for each dance session. These angular parameters could be obtained in each dance cycle through the recorded dancing sessions from which the averaged ROMs values could be calculated. The ground reaction force (GRF) was also recorded during the dancing session; the maximum value of the resultant force was also calculated in each dance cycle. The GRF was normalized by the body weight, eliminating possible inhomogeneity within the group. The examined parameters with definitions are summarized in Table 1.
The recorded static stability test was also processed after the measurements. The measured force magnitude (x-y-z component, where x is anteroposterior, z is mediolateral, and y is the vertical axis) and the resultant force’s point of application (coordinates in the x-z plane) were used during the postprocessing procedure. The measurements were carried out with two force platforms; therefore, separate force and displacement coordinates were recorded for the right- (Force Plate No. 2) and the left- (Force Plate No. 1) hand side. To determine the net COP, the point of application of the reaction forces (x- and z-coordinate of the COP) was weighted by the normalized force magnitudes for the x- and z-direction, separately.
Based on the suggestion of Nagymáté et al., six sensitive and reliable COP parameters were examined in this study. These parameters are summarized in Table 2 [23]. The COP parameters were calculated for the before dance and after dance measurements as well.
All the post-processing calculation was performed in MATLAB (2019a, The MathWorks, Natick, MA, USA) with the help of a self-developed MATLAB code.

2.6. Statistical Analysis

Before performing the statistical analysis, it had to be ensured that the dataset was normally distributed. An Anderson–Darling test was conducted on all of the computed values for each investigated parameter to determine if it was normally distributed [24]. The significance level of the normality test was α = 0.05 . It was found that all the examined parameters regarding all dancers and all measurements were normally distributed.
The mean and relative standard deviation (CV) values were calculated from the examined angular parameters’ ROM values in each dancing session. The mean value characterized the overall image of the motion, while the relative standard deviation gave an estimation for the regularity of the movement. Note that only the mean values were considered in the statistical analysis in the case of the maximum force and cycle time. A within-study design was adopted to compare the differences between the dancing sessions. One-way repeated-measures analysis of variance (ANOVA) was applied on the kinetic (maximum of the GRF and cycle time) and kinematic (ROM of knee flexion angle, ROM of hip flexion angle, and ROM of pelvis tilt angle) parameters on all available time points (Sessions 1 to 10). The significance level was α = 0.05 , whereas, as a pilot study, the ANOVA test with a significance level of α = 0.1 was also performed to examine if weakening the criteria affected the results. The null hypothesis was that the investigated parameters did not change at either a 95 % or a 90 % confidence level as dancers had to repeat the dancing sessions several times. A Bonferroni post-hoc test was performed on the kinematic data, to examine the differences between each session separately and investigate which time sequence had a stronger effect on the change [25,26]. A between-study design was applied to evaluate the balance tests, where two-way ANOVA was performed on the COP parameters. The factors were the measurement time (before or after) and the visual feedback (eyes opened or eyes closed). The aim of the statistical analysis was to examine the common effect of the two factors on the balancing ability. The null hypothesis was that the COP parameters did not change at the 95 % confidence level after the dancing sessions, which means a significance level of α = 0.05 .
The statistical analyses were also prepared in MATLAB with the help of the Statistics and Machine Learning Toolbox. The detailed results of the statistical analysis can be found in Supplementary Materials S1 and S2, as well as the results of the post-hoc test, which is summarized in Supplementary Material S3.

3. Results

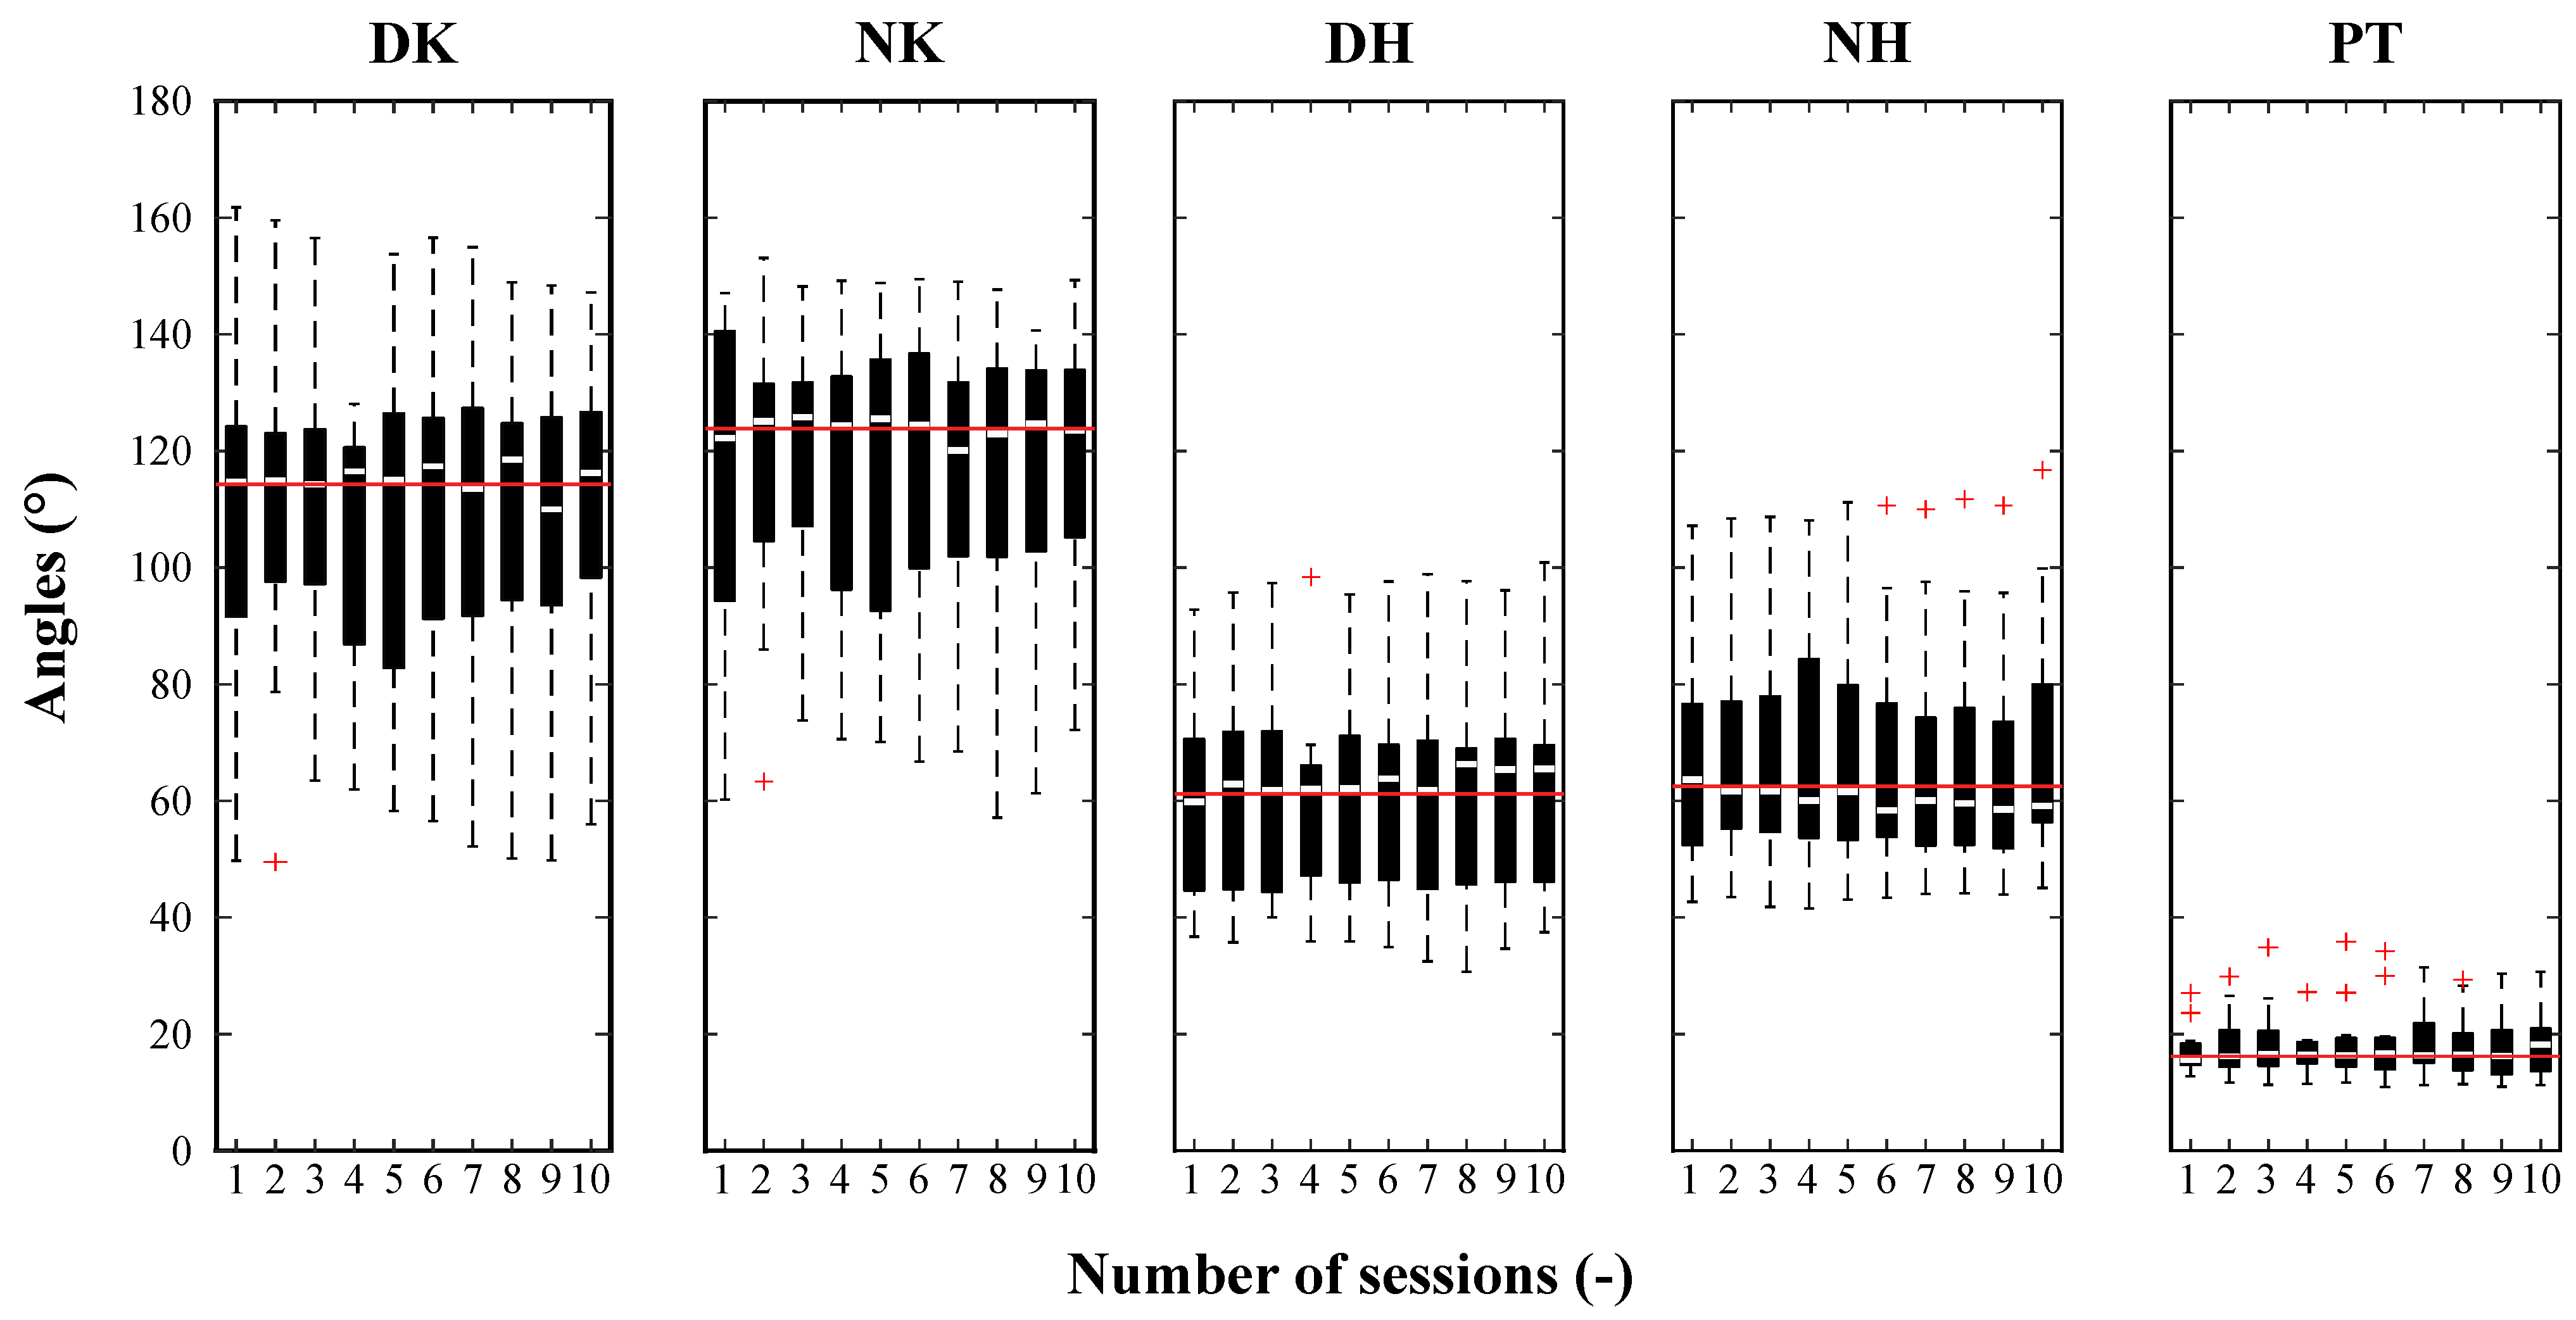
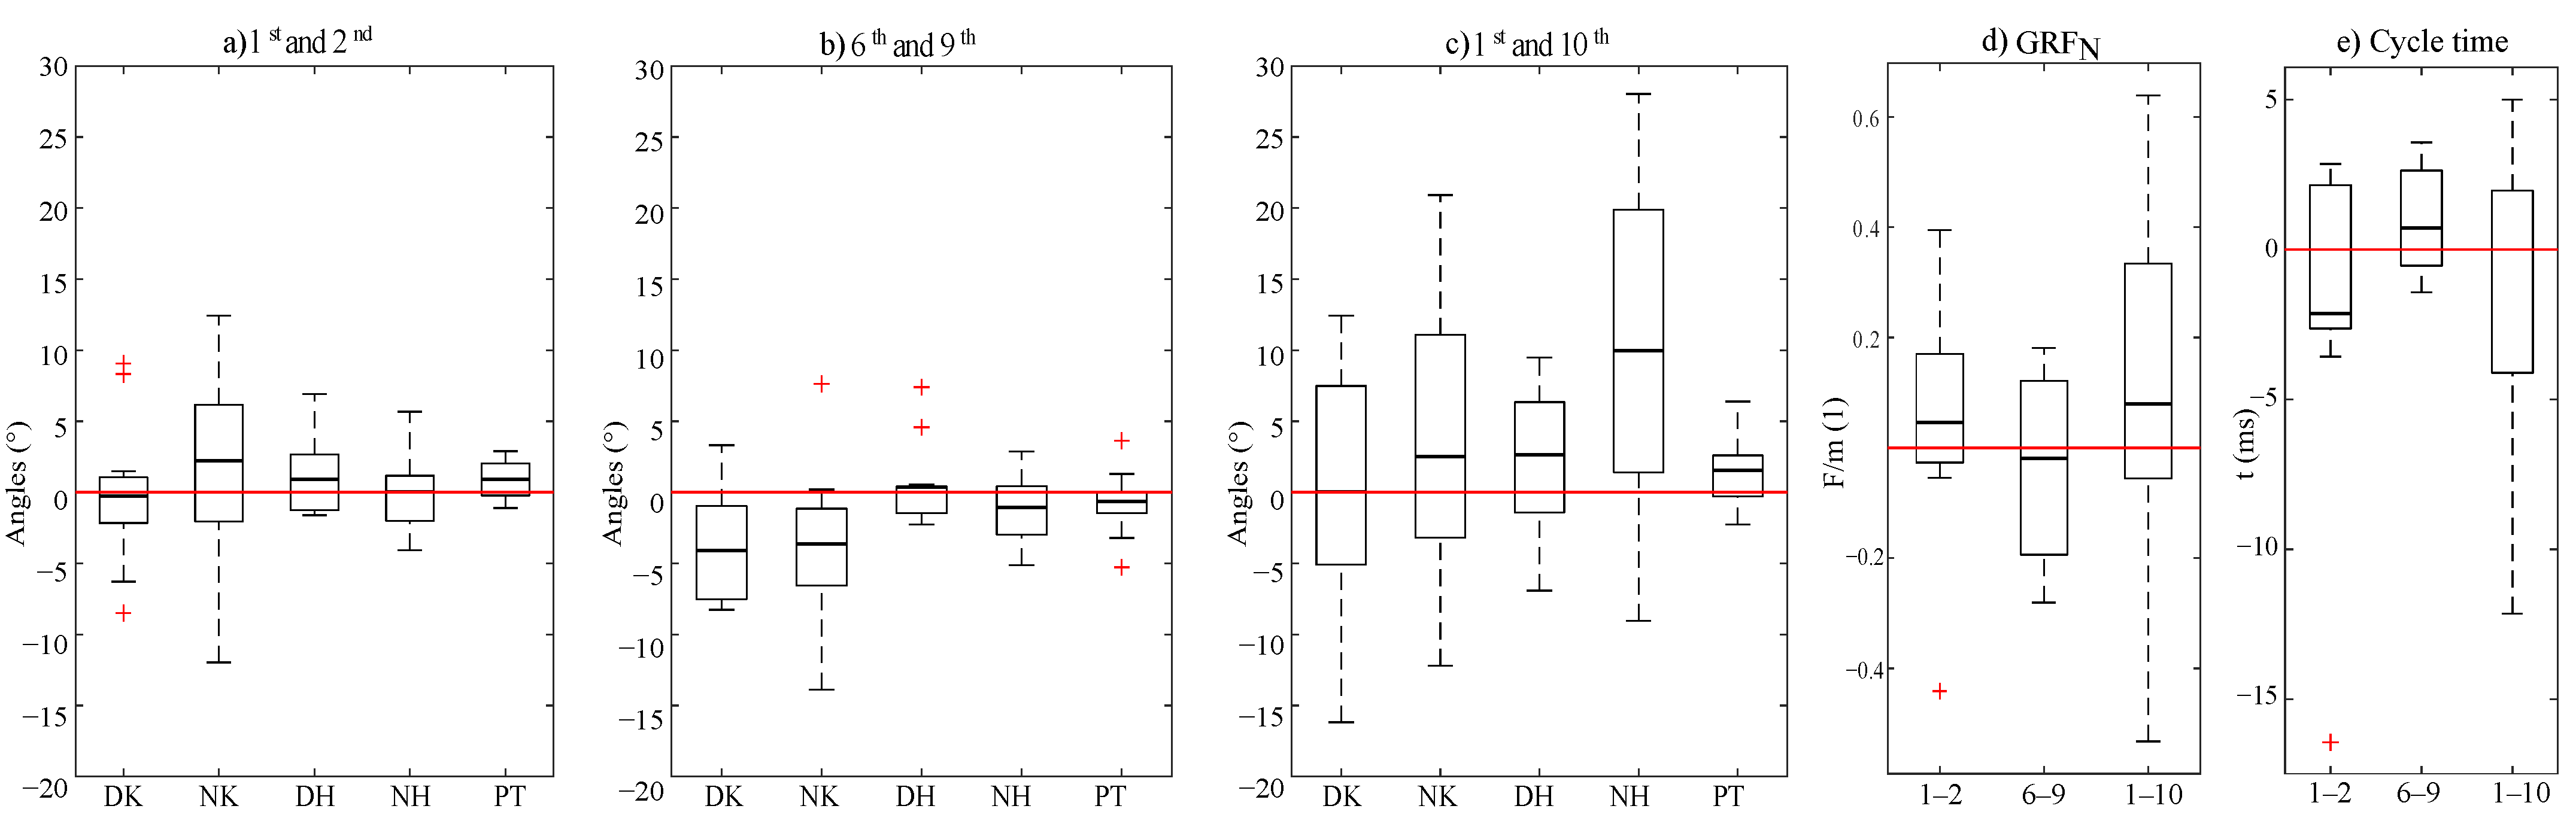
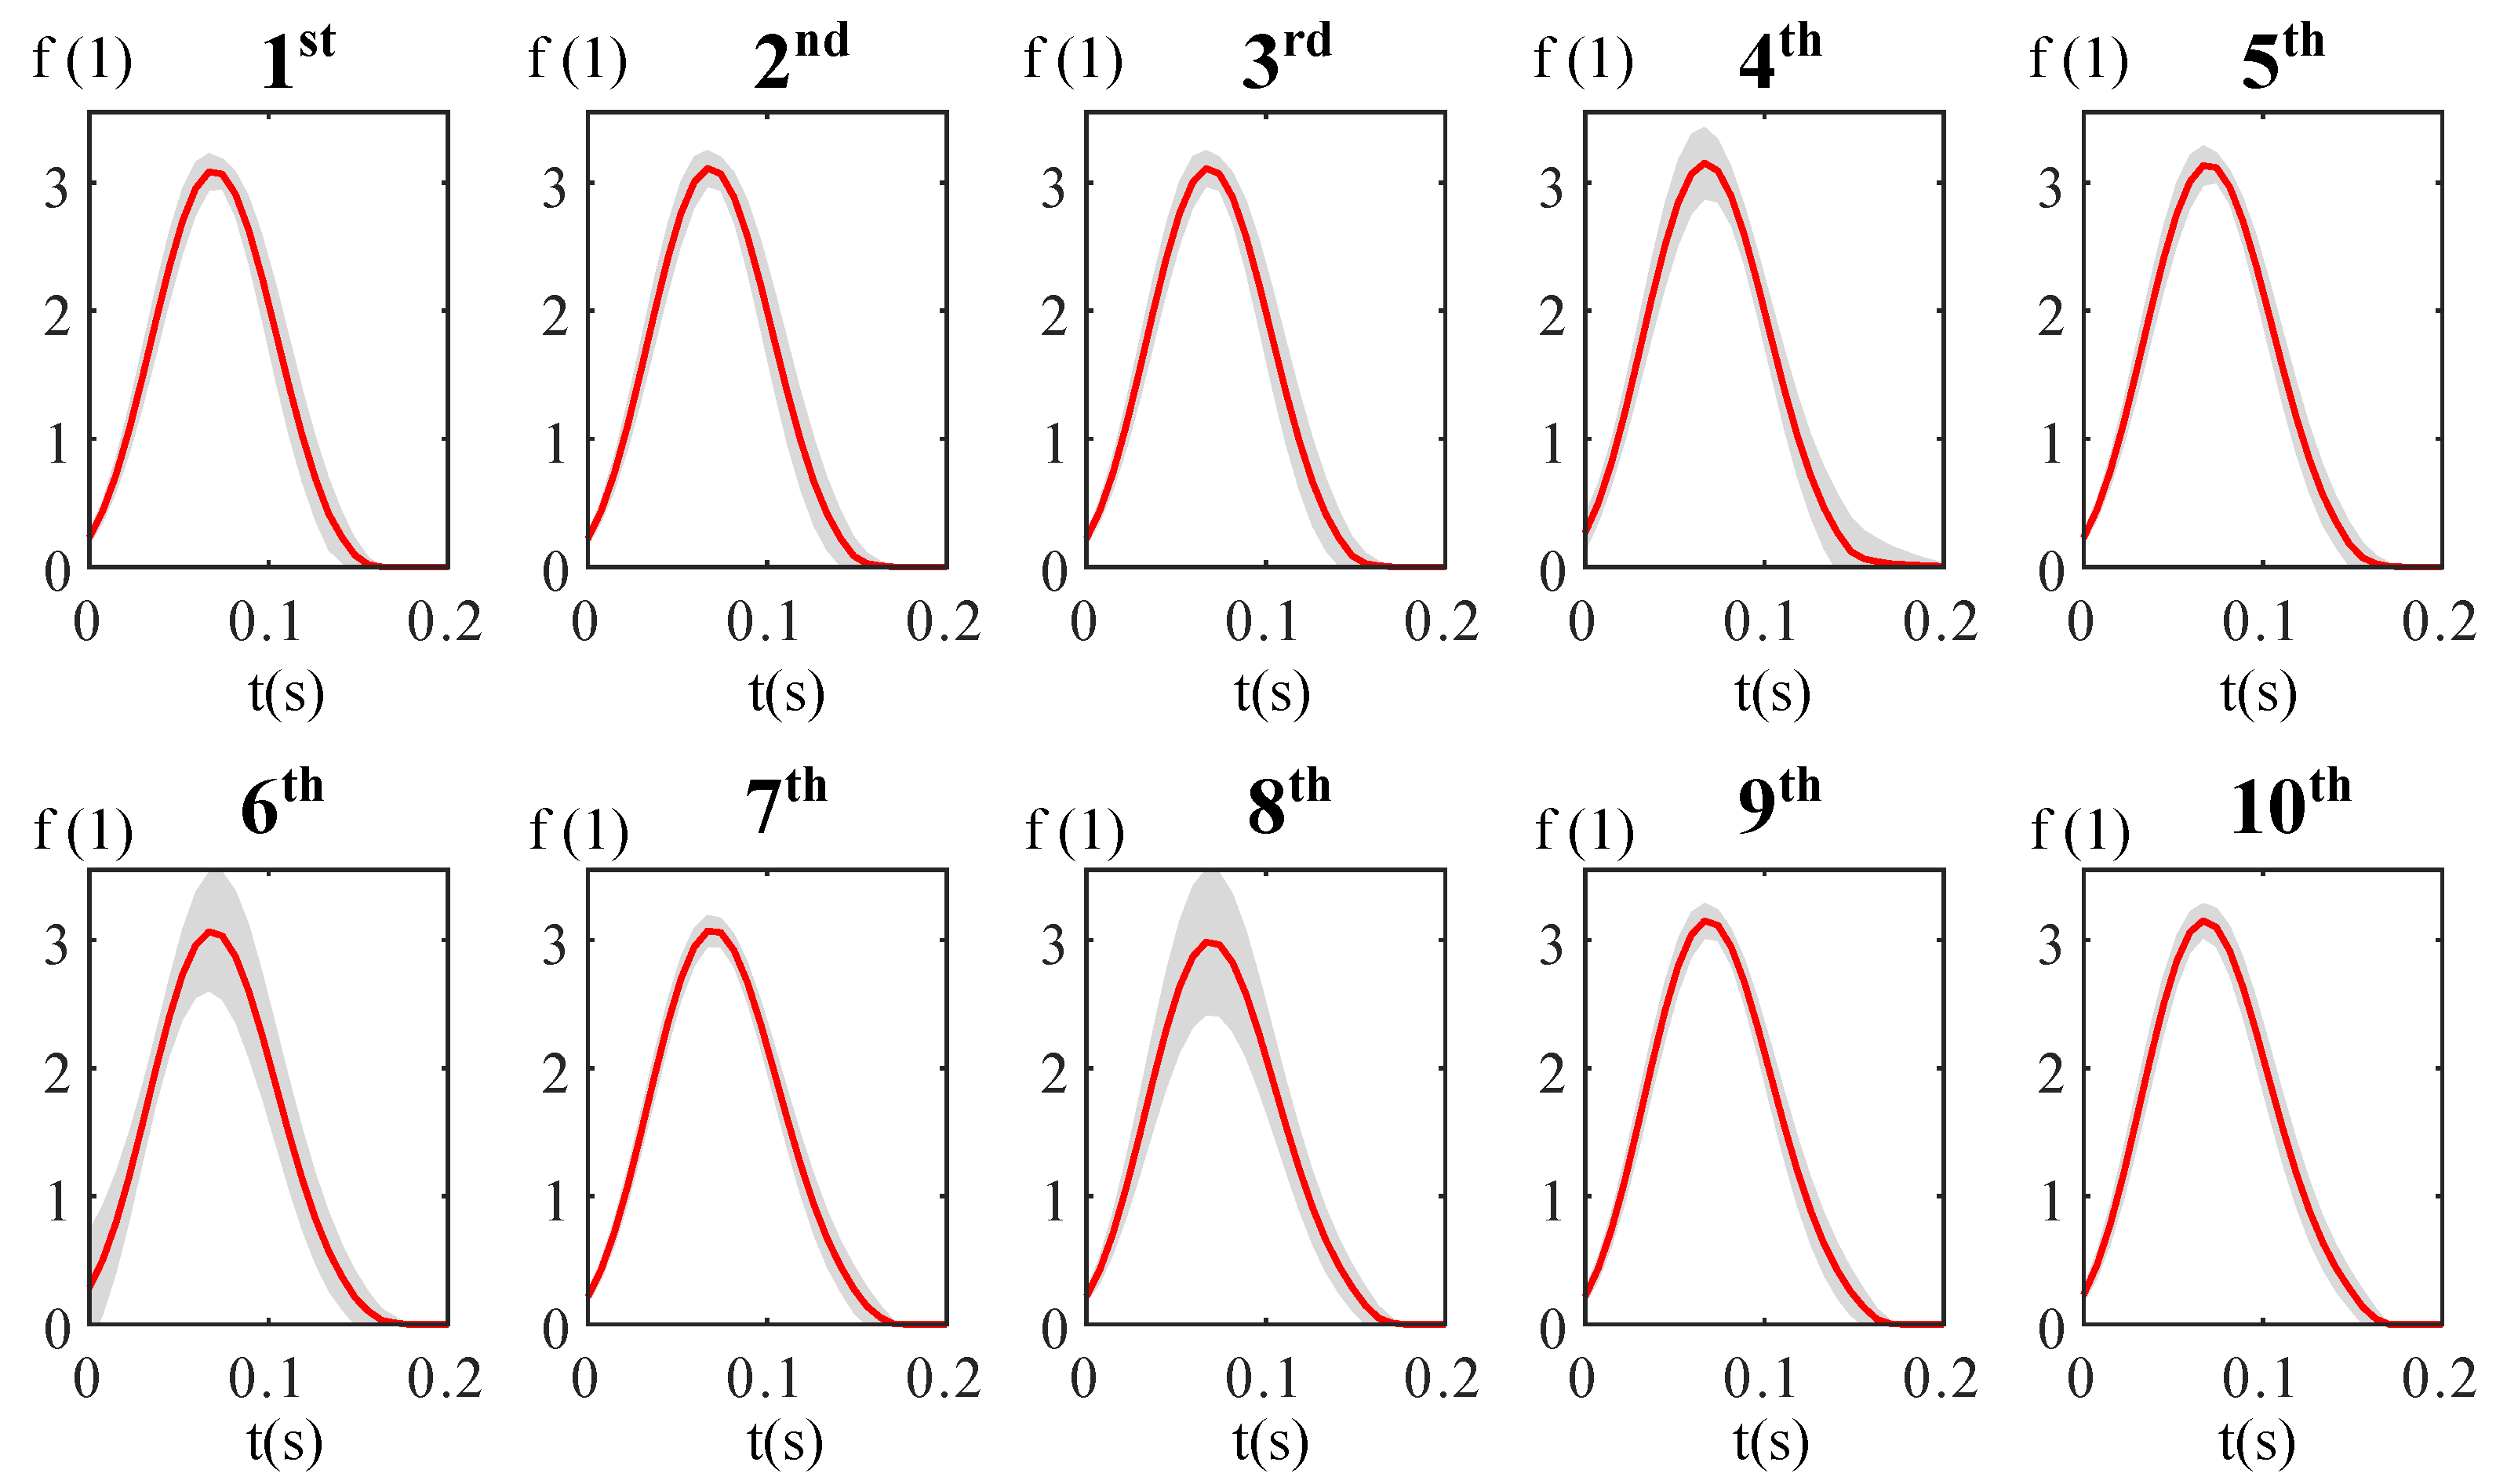
3.1. Results of the Motion Analysis

Table 1 summarizes the examined motion parameters; the results of the analysis of variance are summarized in Table 3. The numeric data of the calculated angular and kinetic parameters are detailed in Supplementary Material S4; the numeric results of the analysis of variance an the post-hoc analysis are detailed in Supplementary Materials S1 and S3, respectively. Moreover, Figure 2 illustrates the change in the joint angles during the ten dance sessions using the average ROM data from all the dancers.
The repeated-measures ANOVA tests’ results showed significant changes during the dancing sessions in the dominant and nondominant knee flexion angles ( p = 0.044 and p = 0.003 ) and nondominant hip flexion angles ( p = 0.005 ). Lowering the significance level to 90 % , it could be seen that all ROMs of the joint angles changed significantly between the first and tenth dance sequence. However, the η 2 values of the averages of the ROMs indicated that the effect size was small.
The results of the Bonferroni post-hoc test showed that the difference between the sixth and the ninth dance was the largest in the dominant knee joint angle, with the difference being significant ( p = 0.002 ). According to the post-hoc analysis, none of the other examined dance sequences showed significant differences at α = 0.05 . Among all the dance sequence pairs, Figure 3 shows three particular chosen scenarios. Figure 3a shows the deviation in the angular parameters at the beginning of the dance, such as the change in between the first two time trials. On the other hand, Figure 3b shows the difference between the sixth and the ninth dance sessions, based on the significant change obtained by the post-hoc analysis. Finally, the deviation in between the first and the last dancing sessions is depicted in Figure 3c. Figure 3 also shows the change in the kinematic parameters (GRF and cycle time). Since the measuring units were different, they are depicted in two separate subfigures (Figure 3d,e). the differences of the normalized ground reaction forces between the 1st and 2nd, 6th and 9th, and 1st and 10th dance sequences are shown. Figure 3e shows the differences of the average cycle time between the 1st and 2nd, 6th and 9th, the 1st and 10th dance sequences. According to the statistical analysis, the changes in the relative standard deviations of the angular parameters were not significantly different at the 95 % nor the 90 % confidence level. The changes in the average cycle times and the normalized ground reaction forces were not significantly different at the 95 % nor at the 90 % confidence level. Note that Figure 2 shows the median values of the angular parameters, while Figure 3 shows the average values of the angular parameters.

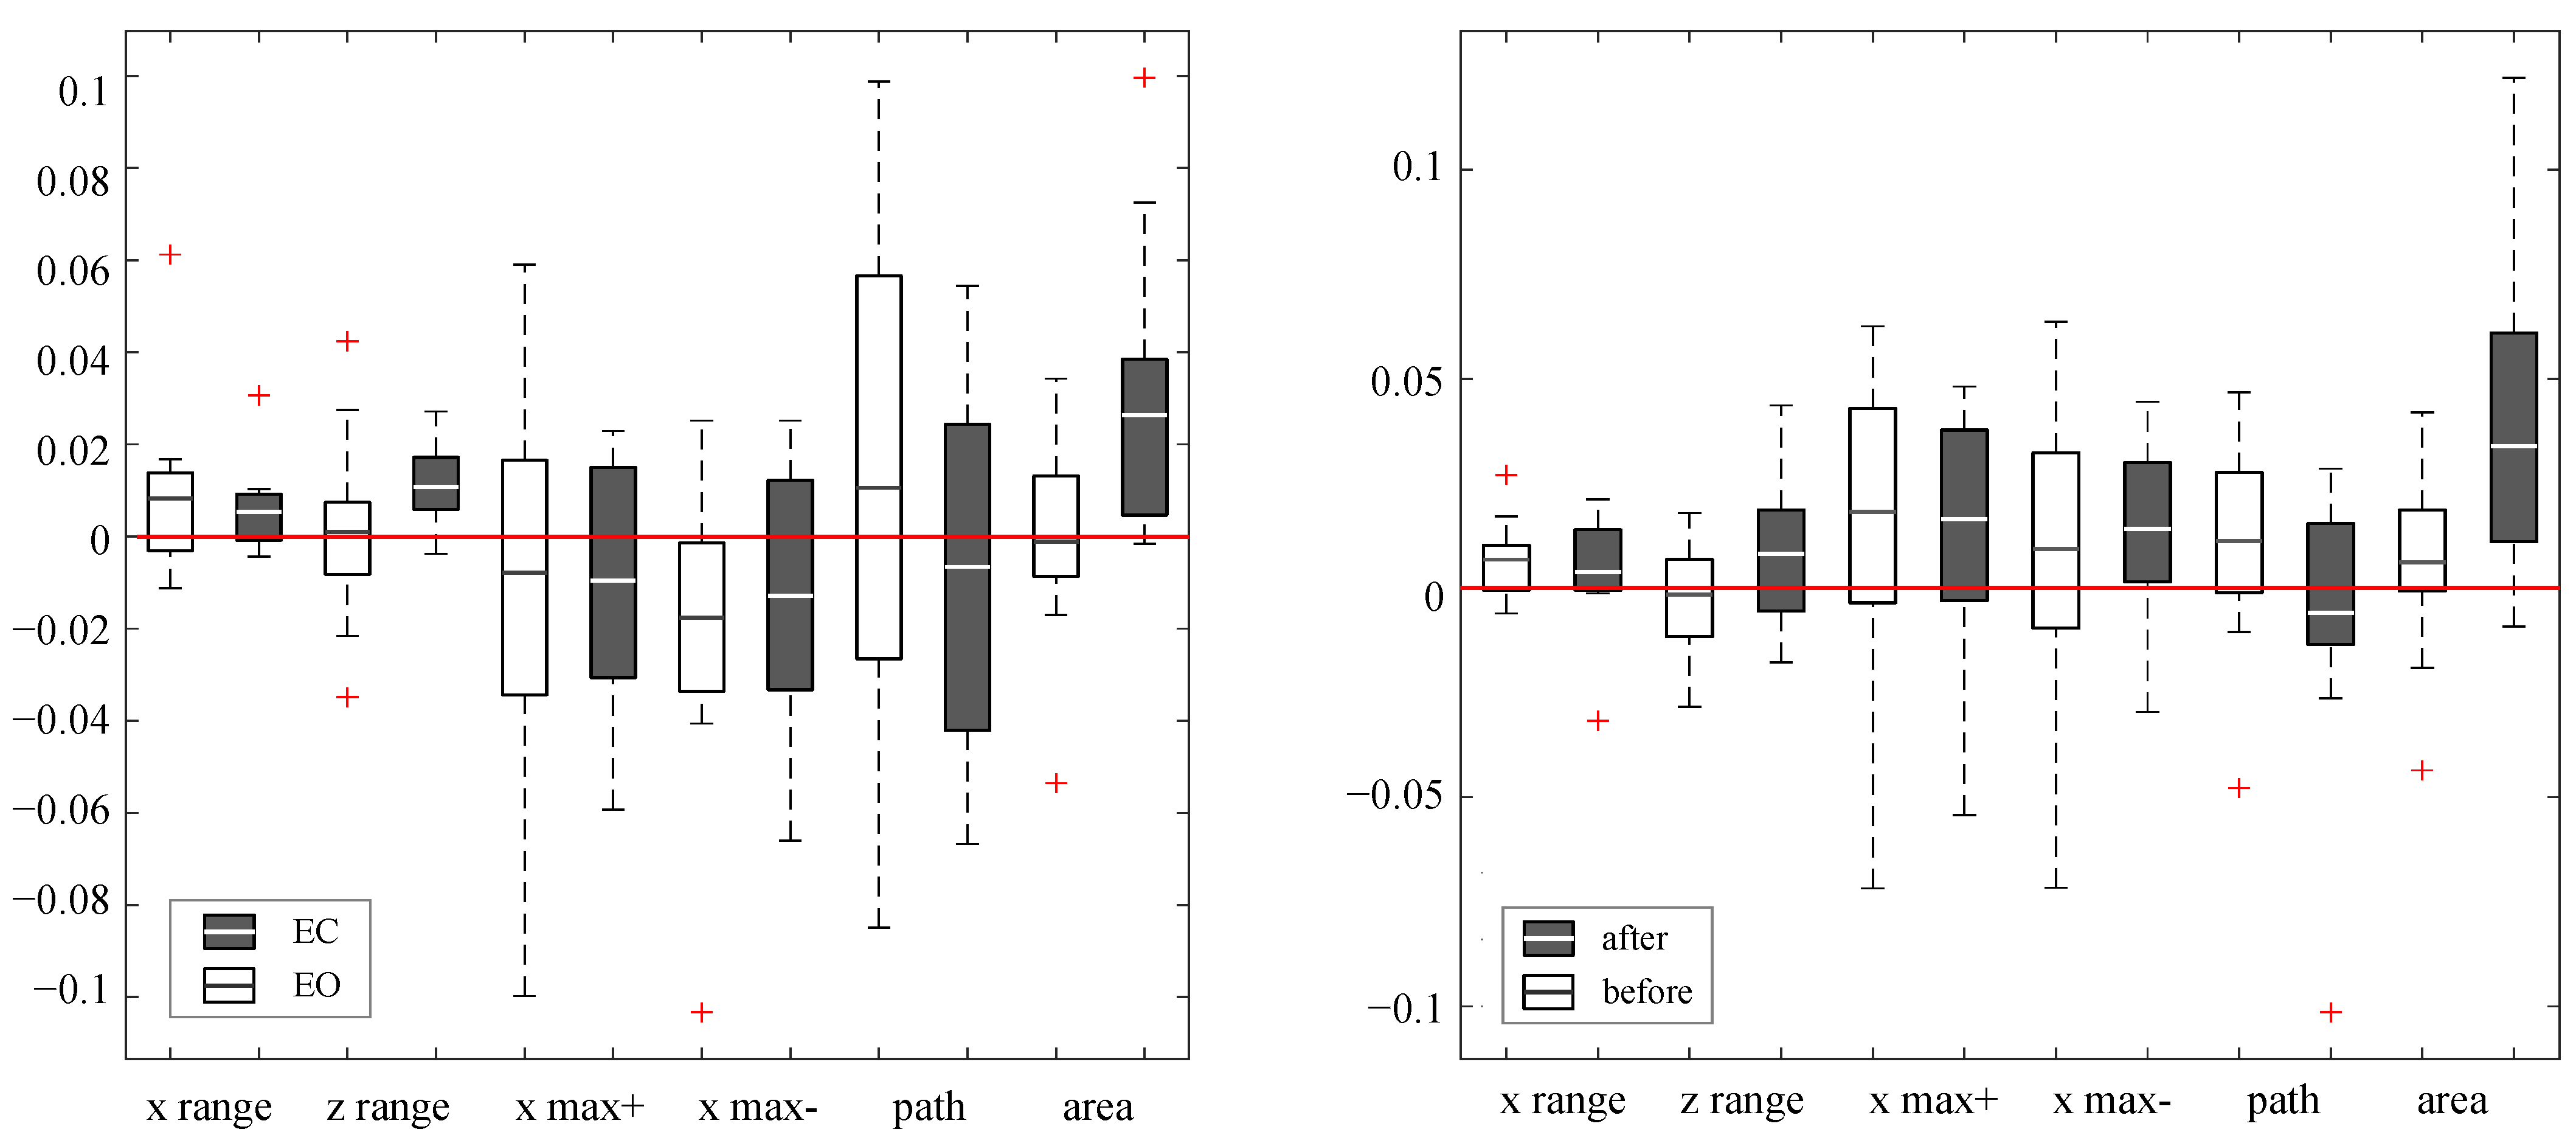
3.2. Results of the Balance Test Data

The results of the two-factor ANOVA test are summarized in Table 4. The numeric data of the calculated stabilometric parameters are detailed in Supplementary Material S5; the numeric results of the analysis of variance are detailed in Supplementary Material S2. As a result of the statistical analysis, considering the effect of time (i.e., before dancing or after dancing), the difference between the deviation of the COP in the posterior direction ( p = 0.023 ) before and after the dancing session was significant. Moreover, comparing the EO and EC measurements regardless of the examination period, the lack of visual feedback (EC conditions) resulted in higher displacement values in the maximum deviation of the COP both in the anterior ( p = 0.006 ) and the posterior ( p = 0.014 ) directions.
Since the two-factor analysis of variance investigated the effect of time (before- and after-dance) and visual effect (EO and EC) simultaneously, Figure 4 shows their impact on the balancing ability separately. Figure 4a shows the difference of the two time trials, which were calculated by subtracting the after-dancing values from the before-dancing, whereas Figure 4b shows the difference due to the visual feedback, where the EO values were subtracted from the EC values.

4. Discussion

The aim of the present pilot study was to develop a complex biomechanical measurement procedure that instigated the Hungarian folk dancers’ lower body kinematics and balancing ability through a dance movement called “Kalocsai mars”. The dancers had to perform the examined motion repetitively ten times at 30 s intervals (total measurement time was 10 min). The differences in the motion parameters between the ten dancing sessions was compared with a one-way repeated-measures ANOVA. Before and after the dancing session, static balancing tests were performed, examining bipedal stance with the eyes opened and closed conditions. The COP parameters were evaluated by two-way ANOVA (between-study design). The factors were the measurement time (before or after) and the visual feedback (opened and closed). Based on the kinematic data and the statistical analysis results, the following observations can be concluded regarding the dancers’ lower body motion and balancing ability.

4.1. Discussion of the Motion Analysis

As can be seen in Figure 3, the differences at earlier repetitions (i.e., between the first and second dance sequence) remained around zero, meaning that the dancers could repeat the movement with great accuracy. On the other hand, the differences between the first and tenth dance sessions were somewhat above zero (Figure 3). This suggests that the joint ROMs increased in time, indicating that the dancers’ movements were less bound during the repetition of the ten dancing sessions. Moreover, the increment of the range of motion of the joint angles increasedthe risk of injury. According to Chang et al., the increased values of whole-body angular momentum accompanied by unfreezing of the upper limb kinematic DOF (increased ROMs) are energetically more expensive [27]. Therefore, it may happen as dancers have to dance for a longer time and cannot pay enough attention to controlling the movements entirely, which may let their limbs move more freely, leading to an energetically more expensive increment in the joints’ ROM. Furthermore, Wild et al. showed that in the case of Irish dancers, after a certain amount of fatiguing session, the dancers landed with a reduced ankle plantar flexion and external hip rotation and increased hip-adduction alignment [5].
Figure 2 shows the ROM values, broken down by the dancing sessions. Taking into consideration the red horizontal line, which is the median value calculated from the ten dancing sessions, after around the fifth or sixth session, the medians of the given session’s joint angle differed from the absolute mean value inconsistently, whereas in the beginning, they were closer to the absolute median value. This effect was greater when the statistical analysis showed a significant change in a higher significance level ( α = 0.05 ). This inconsistent fluctuation might be caused by less concentration and tiredness as the dancers have to repeat the dancing sessions. Moreover, Figure 2 shows that the median values for the nondominant hip (NH) flexion ROM became lower than the overall median even after the fourth session. However, on the dominant side (DH), the medians became greater, although the changes were not significant. The run-down in the nondominant side of the hip flexion angle suggests that the dancers were less able to concentrate on their nondominant side as they had to repeat the dancing session, which also could be an effect of their tiredness. Note that the η 2 values of the averages of the ROMs (Table 3) indicated that the effect size was small. Although the eta values were small, this less significant change may already be a sufficient indication of the tiredness of the dancers. In the case of a larger deviation in the motion parameters, the patterns of the dance could already be visibly changed.
Based on the post-hoc analysis, the difference between the sixth and ninth dance sequences was significant since the differences between the sixth and ninth dance sequences were below zero (Figure 3), which means that the range of motion of the sixth dance sequence was greater than the ninth, suggesting that after the sixth dance sequence, the ROMs of most parameters had decreased. Figure 3 also indicates that this decreasing trend stagnated towards the end, since the first and tenth dance sequences’ comparison showed a positive deficit.
Figure 5 shows that the maximum normalized ground reaction force’s impulses during cross landing were very similar for each session. The values of the maximum GRF slightly increased when dancers had to repeat the dancing, although the increase was not significant (Table 3). The increased GRF resulted in higher loads on the dancers’ joints and means that as the dancers repeated the dance sequence, they could not pay attention to protecting their joints. Hendry and Campbell’s research showed that the increased ROM of ballet dancers in certain tasks could reduce the reaction forces during landing [11]. On the contrary, in the case of Hungarian folk dancers, the increase of the ROMs of the hip flexion-extension, knee flexion-extension, and pelvis tilt angles did not reduce the ground reaction forces during landing, but increased them. This different behavior could be explained by the differences in the two dance types. As expected, the mean differences between the average cycle times were around zero, suggesting that the average cycle time of the last dance did not escalate since the dancers were performing the motion to the same music. Any slight differences from the expected length could be explained by the fact that dancers had to alter their movement when being affected by fatigue.

4.2. Discussion of the Balance Test Data

The increase in the COP parameters suggested that the imbalance of the dancers increased after the dance sessions (Figure 4). The increment may be caused by fatigue. Pau et al., who had examined the postural sway of young rhythmic gymnasts, found that fatigue can alter regular neural transmission, which ultimately leads to poorer postural control expressed in the form of larger COP excursions [16]. Moreover, the result of this study was in accordance with the results of Barbieri’s study, where the postural sway also increased after induction of ankle muscle fatigue [28]. Additionally, based on the statistical analysis of the stability measurements, there was a significant difference at the 95 % confidence level in the following COP parameters after the dance sessions (Table 4): the difference between eyes opened and closed ( p = 0.006 ) of the maximum deviation of the COP in the anterior direction and the difference between eyes opened and closed ( p = 0.014 ), also before and after dancing ( p = 0.023 ), of the maximum deviation of the COP in the posterior direction. This suggested that the lack of visual feedback increased the imbalance after the dance sessions. The results of the present study corresponded to the results of the study of Fronczek–Wojciechowska et al. [15]. The other examined COP parameters did not show a significant difference at the 95 % confidence level, which can be explained by the dancers’ experience as their bodies are accustomed to dancing later in the repetitions.

4.3. Limitations of This Study

The study suggested a new method to analyze the motion of Hungarian folk dancers from a biomechanical perspective. It can be concluded that the suggested parameters are measurable and can give a quantitative analysis of the motion of the dancer. However, a limitation of this study was the relatively small number of subjects. Moreover, since training and coaching practices may vary in different dance troupes, differences in practices may have influenced the performance. In this present study, dancers with different skill levels were involved, and the effect of the training level was not taken into consideration. Furthermore, the ankle joint angles were excluded from the study due to the fact that the markers were placed on the shoes and when the ankle joint angles were calculated, very different ROM angle time curves and abnormal ankle joint angle were obtained for most of the dancers. However, by applying another biomechanical model, the ankle joint angles could be taken into consideration in the future.

5. Conclusions

The present paper examined the changes in the kinematic, kinetic, and COP parameters during repeated dancing sessions and the immediate effects of the ten dancing sessions on static balancing ability. Understanding a Hungarian folk dance sequence from a biomechanical perspective could be helpful to improve the performance of the dancer, as Chang et al. proposed [9]. The present study was a pilot study to collect preliminary data for our self-developed measurement procedure investigating the performance of Hungarian folk dancers. The long-term goals include a follow-up study with further data collection and analysis of Hungarian folk dancers. With an adequate amount of information, the motion of Hungarian folk dancers could be examined in further detail, which would help the dancers improve their sports performance. At the same time, the risk of injury during dancing could be reduced.
Based on the statistical analysis (Table 3), there was a significant difference at the 95 % confidence level in the following motion parameters: the dominant and nondominant knee joint angles ( p = 0.044 and p = 0.003 ) and the nondominant hip flexion angles ( p = 0.005 ). This suggested that performing the motion correctly with the knees required more attention and energy than the other examined parameters. Moreover, all ROMs of the joint angles of the lower extremities showed significant changes at the 90 % confidence level. The increased GRF resulted in higher loads on the dancers’ joints and meant that as the dancers repeated the dance sequence, they could not pay attention to protecting their joints, which may lead to injury. However, according to the statistical analysis, the change in the normalized GRF was not significant at α = 0.05 nor at α = 0.10 .
The results of the balance tests suggested that the visual feedback was important to the dancers, as their stability decreased in the anterior and posterior directions when the test was performed with eyes closed. The results of the balance tests also advised that the imbalance in the posterior direction increased significantly after the dancing sessions, which might be caused by the dancers’ fatigue.

Supplementary Materials

The following are available online at https://0-www-mdpi-com.brum.beds.ac.uk/article/10.3390/app11188789/s1. Supplementary Material S1. Results of the ANOVA test for the angular and kinematic parameters. Supplementary Material S2. Results of the ANOVA test for the stabilometric parameters. Supplementary Material S3. Results of the posthoc test for the angular and kinematic parame-ters. Supplementary Material S4. Data of the angular and kinematic parameters. Supplementary Material S5. Data of the stabilometric parameters.

Author Contributions

Conceptualization, R.M.K., C.M. and Z.P.; methodology, R.M.K. and Z.P.; software, C.M.; validation, R.M.K. and C.M.; formal analysis, C.M. and Z.P.; investigation, C.M. and Z.P.; resources, R.M.K.; data curation, C.M. and Z.P.; writing—original draft preparation, C.M. and Z.P.; writing—review and editing, R.M.K.; visualization, C.M. and Z.P.; supervision, R.M.K.; project administration, R.M.K.; funding acquisition, R.M.K. All authors have read and agreed to the published version of the manuscript.

Funding

This research was supported by the Hungarian Scientific Research Fund of the National Research, Development, and Innovation Office (NRDI) (Grant No. OTKA K115894). The research reported in this paper and carried out at Budapest University of Technology and Economics was supported by the NRDI Fund TKP2020 NC (Grant No. BME-NC) based on the charter of bolster issued by the NRDI Office under the auspices of the Ministry for Innovation and Technology, Hungary. The research of Cecilia Molnar was supported by the New National Excellence Program of the Hungarian Ministry of Human Resources (Grant Number ÚNKP-21-1-I-BME-224).

Institutional Review Board Statement

The study was conducted according to the guidelines of the Declaration of Helsinki and approved by the Science and Research Ethics Committee of Budapest University of Physical Education (TE-KEB/17/2021).

Informed Consent Statement

Informed consent was obtained from all subjects involved in the study.

Data Availability Statement

The data presented in this study are available upon request from the corresponding author.

Acknowledgments

The authors would like to thank all the Hungarian folk dancers who participated in the study.

Conflicts of Interest

The authors declare no conflict of interest. The funders had no role in the design of the study; in the collection, analyses or interpretation of data; in the writing of the manuscript; nor in the decision to publish the results.

Abbreviations

The following abbreviations are used in this manuscript:
ANOVAAnalysis of variance
BOSBase of support
COPCenter of pressure
CVCoefficient of variation
DKDominant knee flexion-extension angle
DHDominant hip flexion-extension angle
EOEyes opened
ECEyes closed
GFRGround reaction force
NKNondominant knee flexion-extension angle
NHNondominant hip flexion-extension angle
PTPelvis tilt angle in the sagittal plane
ROMRange of motion

References

  1. Felföldi, L. Folk dance research in Hungary: Relations among theory, fieldwork and the archive. In Dance in the Field; Springer: Berlin/Heidelberg, Germany, 1999; pp. 55–70. [Google Scholar]
  2. Diószegi, L. Historic moments of hungarian folk dance: From the Gyöngyösbokréta to the dance house movement. Hung. Stud. 2008, 22, 3–8. [Google Scholar] [CrossRef] [Green Version]
  3. Long, M. Modeling and analysis of knee joint impact damage in triple jump manipulators based on finite element method. Int. J. Model. Simul. Sci. Comput. 2019, 10, 1950030. [Google Scholar] [CrossRef]
  4. Wang, M.L.; Peng, Z.X. Wear in human knees. Biosurface Biotribol. 2015, 1, 98–112. [Google Scholar] [CrossRef] [Green Version]
  5. Wild, C.Y.; Grealish, A.; Hopper, D. Lower Limb and Trunk Biomechanics After Fatigue in Competitive Female Irish Dancers. J. Athl. Train. 2017, 52, 643–648. [Google Scholar] [CrossRef] [PubMed] [Green Version]
  6. Kadel, N. Foot and Ankle Problems in Dancers. Phys. Med. Rehabil. Clin. N. Am. 2014, 25, 829–844. [Google Scholar] [CrossRef] [PubMed]
  7. Fuller, M.; Moyle, G.M.; Hunt, A.P.; Minett, G.M. Injuries during transition periods across the year in pre-professional and professional ballet and contemporary dancers: A systematic review and meta-analysis. Phys. Ther. Sport 2020, 44, 14–23. [Google Scholar] [CrossRef]
  8. Cahalan, R.; Kearney, P.; Ni Bhriain, O.; Redding, E.; Quin, E.; McLaughlin, L.C.; O’Sullivan, K. Dance exposure, wellbeing and injury in collegiate Irish and contemporary dancers: A prospective study. Phys. Ther. Sport 2018, 34, 77–83. [Google Scholar] [CrossRef]
  9. Chang, M.; Halaki, M.; Adams, R.; Cobley, S.; Lee, K.Y.; O’Dwyer, N. An Exploration of the Perception of Dance and Its Relation to Biomechanical Motion: A Systematic Review and Narrative Synthesis. J. Danc. Med. Sci. 2016, 20, 127–136. [Google Scholar] [CrossRef]
  10. Quanbeck, A.E.; Russell, J.A.; Handley, S.C.; Quanbeck, D.S. Kinematic analysis of hip and knee rotation and other contributors to ballet turnout. J. Sport. Sci. 2017, 35, 331–338. [Google Scholar] [CrossRef]
  11. Harwood, A.; Campbell, A.; Hendry, D.; Ng, L.; Wild, C.Y. Differences in lower limb biomechanics between ballet dancers and non-dancers during functional landing tasks. Phys. Ther. Sport 2018, 32, 180–186. [Google Scholar] [CrossRef]
  12. Chang, M.; O’Dwyer, N.; Adams, R.; Cobley, S.; Lee, K.Y.; Halaki, M. Whole-body kinematics and coordination in a complex dance sequence: Differences across skill levels. Hum. Mov. Sci. 2020, 69, 102564. [Google Scholar] [CrossRef]
  13. da Silveira Costa, M.S.; de Sá Ferreira, A.; Felicio, L.R. Static and dynamic balance in ballet dancers: A literature review. Fisioter. Pesqui 2013, 20, 299–305. [Google Scholar]
  14. Kozinc, Ž.; Šarabon, N. Transient body sway characteristics during single-leg quiet stance in ballet dancers and young adults. J. Biomech. 2021, 115, 110195. [Google Scholar] [CrossRef]
  15. Fronczek–Wojciechowska, M.; Padula, G.; Kowalska, J.; Galli, M.; Livatino, S.; Kopacz, K. Static balance and dynamic balance related to rotational movement in ballet dance students. Int. J. Perform. Anal. Sport 2016, 16, 801–816. [Google Scholar] [CrossRef] [Green Version]
  16. Pau, M.; Laconi, I.; Leban, B. Effect of fatigue on postural sway in sport-specific positions of young rhythmic gymnasts. Sport Sci. Health 2021, 17, 145–152. [Google Scholar] [CrossRef]
  17. Video of the Examined Dance Step. Available online: https://youtu.be/goCMP8qeEA8 (accessed on 12 July 2021).
  18. van Melick, N.; Meddeler, B.M.; Hoogeboom, T.J.; Nijhuis-van der Sanden, M.W.G.; van Cingel, R.E.H. How to determine leg dominance: The agreement between self-reported and observed performance in healthy adults. PLoS ONE 2017, 12, e0189876. [Google Scholar] [CrossRef] [Green Version]
  19. Nagymáté, G.; Kiss, R.M. Motion capture system validation with surveying techniques. Mater. Today Proc. 2018, 5, 26501–26506. [Google Scholar] [CrossRef] [Green Version]
  20. Skeleton Tracking—NaturalPoint Product Documentation Ver 2.2. Available online: https://v22.wiki.optitrack.com/index.php (accessed on 10 June 2021).
  21. Scoppa, F.; Capra, R.; Gallamini, M.; Shiffer, R. Clinical stabilometry standardization: Basic definitions—Acquisition interval—Sampling frequency. Gait Posture 2013, 37, 290–292. [Google Scholar] [CrossRef]
  22. Seth, A.; Hicks, J.L.; Uchida, T.K.; Habib, A.; Dembia, C.L.; Dunne, J.J.; Ong, C.F.; DeMers, M.S.; Rajagopal, A.; Millard, M.; et al. OpenSim: Simulating musculoskeletal dynamics and neuromuscular control to study human and animal movement. PLoS Comput. Biol. 2018, 14, e1006223. [Google Scholar] [CrossRef]
  23. Nagymáté, G. Stabilometric Parameter Analyses and Optical Based Motion Analysis. Ph.D. Thesis, Budapest University of Technology and Economics, Budapest, Hungary, 2019; p. 120. [Google Scholar]
  24. Nelson, L.S. The Anderson-Darling test for normality. J. Qual. Technol. 1998, 30, 298. [Google Scholar] [CrossRef]
  25. Pauw, K.D.; Roelands, B.; Cheung, S.S.; Geus, B.d.; Rietjens, G.; Meeusen, R. Guidelines to Classify Subject Groups in Sport-Science Research. Int. J. Sport. Physiol. Perform. 2013, 8, 111–122. [Google Scholar] [CrossRef] [PubMed] [Green Version]
  26. Perrett, D.; Schaffer, J.; Piccone, A.; Roozeboom, M. Bonferroni adjustments in tests for regression coefficients. Mult. Linear Regres. Viewp. 2006, 32, 1–6. [Google Scholar]
  27. Chang, M.; O’Dwyer, N.; Adams, R.; Cobley, S.; Lee, K.Y.; Halaki, M. Whole-body angular momentum in a complex dance sequence: Differences across skill levels. Hum. Mov. Sci. 2019, 67, 102512. [Google Scholar] [CrossRef] [PubMed]
  28. Barbieri, F.A.; Penedo, T.; Simieli, L.; Barbieri, R.A.; Zagatto, A.M.; van Diëen, J.H.; Pijnappels, M.A.G.M.; Rodrigues, S.T.; Polastri, P.F. Effects of Ankle Muscle Fatigue and Visual Behavior on Postural Sway in Young Adults. Front. Physiol. 2019, 10, 643. [Google Scholar] [CrossRef]
Figure 1. The examined motion of the “Kalocsai mars” dance: one dance step consists of one right and left leg repetition. The figure also shows the definition of a dance cycle, which can be used to analyze the angular and kinetic parameters of the lower extremities. Below, the average and the standard deviation of knee flexion angle and hip flexion angle are also represented. The dominant leg, for the subject shown in the figure, was the right leg. The perspective might be distorted.
Applsci 11 08789 g001
Figure 2. The box plots (with median values) of the ROMs of the joint angles for each dance session using the average ROM data from all the dancers. The overall median of the ten sessions is denoted with a horizontal red line on each subplot. The numeric data are detailed in Supplementary Material S4.
Applsci 11 08789 g002
Figure 3. (ac) show the differences between the dance sequences of the average values of the angular parameters. (a) shows the differences between the 1st and the 2nd sessions, (b) shows the differences between the 6th and the 9th sessions, and (c) shows the differences between the 1st and the 10th sessions. In the 4th diagram (d), the normalized ground reaction force is depicted (1st and 2nd, 6th and 9th, and 1st and 10th sessions), whereas the 5th (e) shows the differences between the dance sequences (1st and 2nd, 6th and 9th, and 1st and 10th sequences) in the case of the average cycle time. The numeric data are detailed in Supplementary Material S4.
Applsci 11 08789 g003
Figure 4. (a) The box plot shows the differences between the before- and after-dancing sessions in the averaged COP parameters distinguished by the EC and EO conditions. (b) The box plot shows the differences in between the two visual feedback conditions (EO and EC) in the averaged COP parameters by separated before- and after-dance session values. Note that the difference in the path of COP was downscaled to a hundredth and the difference in the COP area upscaled by fifty-fold. The numeric data are detailed in Supplementary Material S5.
Applsci 11 08789 g004
Figure 5. The maximum normalized ground reaction force’s impulses during cross landing in the case of Dancer No. 2. For each 30 s-long dancing session, the measured force impulses are plotted on top of each other. The red GRF impulse curve denotes the mean curve in each session. Note that in the statistical analyses, only the maximum peak value was used. The numeric data are detailed in Supplementary Material S4.
Applsci 11 08789 g005
Table 1. Examined biomechanical parameters calculated from the markers’ coordinates and the captured ground reaction forces.
Parameter NameDescriptionUnit
Average cycle timeAverage duration of one dance cycleseconds (s)
Dominant knee joint angle (DK)Dominant knee flexion-extension angledegrees (°)
Nondominant knee joint angle (NK)Nondominant knee flexion-extension angledegrees (°)
Dominant hip flexion angle (DH)Dominant hip flexion-extension angledegrees (°)
Nondominant hip flexion angle (NH)Nondominant hip flexion-extension angledegrees (°)
Pelvis tilt (PT)Pelvis tilt angle in sagittal planedegrees (°)
Normalized ground reaction force (GRF)Ground reaction force normalized by body weight(1)
Table 2. Examined COP parameters.
Parameter NameDescriptionUnit
COP x rangeThe difference between the maximum and minimum coordinates
of COP in the x anterior-posterior direction
(mm)
COP z rangeThe difference between the maximum and minimum coordinates
of COP in the z medio-lateralis direction
(mm)
COP areaThe area of the ellipse that contains 95 % of the data(mm2)
COP x max +Maximum deviation of COP in the x direction
from the mean in the positive direction
(mm)
COP x max −Maximum deviation of COP in the x direction
from the mean in the negative direction
(mm)
Path of COPThe path of the COP during the measurement in the x-z plane(mm)
Table 3. Results of the repeated-measures ANOVA test for the motion analysis parameters. It shows the significant changes in the motion parameters during the dancing sessions.
Parameter NameSumSqDFMeanSqFp-Value η 2
Avg of ROM of DK561.48962.382.070.041 **0.0032
Avg of ROM of NK733.18981.463.000.0038 **0.0037
Avg of ROM of PT39.2894.361.880.066 *0.0068
Avg of ROM of DH139.15915.461.760.088 *0.0025
Avg of ROM of NH249.70927.742.820.006 **0.0034
CV of ROM of DK0.00890.000980.910.5170.0238
CV of ROM of NK0.00790.000820.730.6790.0359
CV of ROM of PT0.01190.001250.930.4970.0914
CV of ROM of DH0.00490.000521.360.2160.0376
CV of ROM of NH 0.00590.000560.970.4660.053
Max of the GRF0.09790.010790.680.7190.0019
Avg of cycle time 7.04 · 10 5 9 7.83 · 10 6 0.157 0.997 0.0719
* p < 0.1, ** p < 0.05.
Table 4. Results of the ANOVA test for the COP parameters.
Parameter NameFactorSumSqDFMeanSqFp-Value
COP x rangebefore/after0.000510.00052.430.15
EO/EC0.000310.00032.510.14
COP z rangebefore/after0.0003710.00033.350.096
EO/EC0.0001210.000120.870.37
COP areabefore/after 2.71 · 10 6 1 2.71 · 10 6 2.400.151
EO/EC 2.82 · 10 7 1 2.82 · 10 7 0.540.47
COP x max +before/after0.000810.00082.610.13
EO/EC0.003310.003311.930.006 **
COP x max −before/after0.002510.00258.70.014 **
EO/EC0.001510.00157.10.0236 **
Path of COPbefore/after0.4310.430.0210.88
EO/EC0.7910.790.190.66
** p < 0.05.
Publisher’s Note: MDPI stays neutral with regard to jurisdictional claims in published maps and institutional affiliations.

