1. Introduction
Technology has become a necessity for humanity to control the essential aspects required for development and evolution. As people have grown fond of technology and integrated it into every activity of their daily routine, increasing the comfort and confidence toward its results, it would be prudent to use technology to build and simulate the required features and characteristics of an environment for the elderly and disabled people to fulfill their basic desires and enhance their productivity and creativity within society.
The motivation behind the research began gradually from the moment we noticed articles about the initiations occurring worldwide to help people of determination become integrated into social tasks, such as schools and hospitals. A recent newspaper article [
1] was published discussing the obstacles encountered by people of determination inside shopping stores and how such an essential task can become very difficult to perform. Thus, we were motivated to utilize the extent of our knowledge combined with the recent research to construct a system that would bring us closer to a solution.
One of the most desirable qualities that individuals aspire to maintain is obtaining whatever is needed to facilitate their life. Old and disabled people may face difficulties and obstacles in fulfilling this desire. Shopping could be a very weary and exhausting activity that they need to practice daily. Obtaining items from shelves, waiting in a long cashier line, and having difficulty accessing knowledge about the products are obstacles that they may face. Our service robot aims to solve most of these problems and facilitate the shopping process for people with disabilities.
Some of the existing solutions that could be considered to assist the situation would be personal assistants provided by the market store and online shopping websites. Many people may feel uncomfortable asking a person to do everything desired while shopping, and in some situations, it may produce awkwardness and unease. Online shopping does not provide the typical shopping experience that people may want. It would not be easy to buy items that are not available physically and deal with restoring purchases. Online shopping is not instant and may take time to obtain items purchased physically. Our proposed system aims to provide a new meaning of shopping through which disabled people can acquire the ability to have the shopping experience with comfort and ease.
Our approach proposes smart systems determined to facilitate obtaining items from high shelves, reduce overcrowding at cashier lines, and have high reliability.
The remainder of the paper is organized as follows:
Section 2 discusses the literature review.
Section 3 introduces the materials and methods. In
Section 3.1, we present the system overview. In
Section 3.3 and
Section 3.5, we present our robotic arm control mechanisms. The scanning and validation systems proposed are presented in
Section 3.4 and
Section 3.6. We present the testing results for each of the sub-systems in
Section 4. Finally, the conclusions are drawn in
Section 5, and future improvements are proposed in
Section 6.
2. Literature Review
Smart systems for shopping applications were recently targeted in many types of research that provide potential solutions for different impediments that apply to ordinary customers or those who require certain assistance. Those applications vary from smart shopping carts to smart scanning systems for visually impaired customers, smart assistants’ software for TV shopping, or even for the analysis of customers’ patterns and behaviors within stores [
2,
3]. The shopping cart developed in [
4] aimed to provide customers with an autonomous payment service by eliminating the need for customers to wait in check-out queues or to manually search for and scan the barcodes of the items that they wish to purchase. This was accomplished through an object detection system built to detect and classify the different items added to the cart, seen by a camera module. Purchase validation was mainly dependent on load cells equipment with a load amplifier to facilitate the communication between the cells and the used microprocessor.
Table 1 shows the features presented by different approaches, including ours. The approaches of [
5,
6] propose autonomously controlled robots to approach and select items. The carts presented by [
6,
7,
8] use RFID technology for self-checkout; CNN is used for item detection inside the cart in [
4]. From the point of view of the store, RFID technology increases the store infrastructure needed in terms of purchasing and installing scanning tags. Similarly, utilizing CNN for item detection would require a team specialized in constant training of the network with the new data presented by new items and appearance changes of products. The approach presented by [
9] uses computer vision and the YOLO network to detect the different behaviors of shopping, including no hand, empty hand and holding item. This approach has neglected the option of holding multiple items, which, from the store’s point of view, affects its reliability. The most common method for item validation is performed using weight sensors. Our proposed approach aims to provide the shopping experience with minimal requirements from the store, as using the YOLO model for barcode detection translates the process performed by a human cashier and is supported by a sensor and vision-based anti-theft system to increase reliability.
Items detection was also used in other recent smart shopping systems, such as Caper AI Checkout and Amazon Go. Caper is a shopping cart that utilizes an object detection network to provide information on items detected by a camera module built in the cart. Item validation is achieved through an additional layer of recognition through sensor fusion and a weight sensing system. Caper cart can be considered an alternative for the Amazon Go system, which was launched earlier with the concept of checkout-free stores. Amazon Go is based only on a complicated object detection system that utilizes computer vision, deep learning, and sensor fusion technology with the help of a network of cameras and sensors installed within the store ceiling. This system not only allows the recognition of the items, but it also tracks all items, whether they are added to the baskets or returned to the shelves. It also tracks and distinguishes which user commits the purchasing or returning action as long as the user is in the store [
10]. This approach does not require any additional validation system, but it is applied in relatively small grocery stores owned by Amazon, and it is not easily applicable in other stores. Though Caper carts also require training on the items provided in each store it is applied in, it still provides a manual scanning feature that makes it usable without training.
Nevertheless, detecting grocery items can be problematic because it requires the detection model to be updated with the continuously changing packaging of different items in a store. One approach to overcome this issue was used in the system proposed in [
2] for visually impaired customers that we mentioned earlier, including samples in the training set that are only taken in perfect lighting and ideal conditions. At the same time, all tests are conducted on data gathered from videos taken of items in the stores. Thus, they are subjected to different conditions of lighting and potential distortions and occlusions. Following this training approach would usually make it hard to optimize the model and result in decreased accuracy to enhance the generalization of the detector. Powerful techniques can reduce this gap between both training and testing sets, including pre-processing and post-processing methods that benefit from the color, position, and texture information to distinguish between the targeted items, as shown in the approach proposed in [
11].
The design of the architecture of the feature extraction network in the YOLOv2 algorithm should vary depending on the application and highly correlate with the model performance. Applications with a limited number of output classes in which a detector targets a certain pattern or shape can be implemented with small network architecture. For instance, the architectures of two models developed in [
12], used to detect defects in yarn-dyed fabric, were made of 24 layers for the first model and only 14 layers for the second. The used architectures were YOLO9000 and Tiny-YOLO, respectively, and they were compared to a third 30-layer one, called YOLO-VOC. The results showed superior performance for the YOLO-VOC, compared to the first models. However, by performing an iterative optimization of the training options, including the number of iterations, the activation function, and the learning rate, the average precision, recall, and IoU results exceeded the YOLO-VOC results, reaching 92.62%, 90.56%, and 66.36%, respectively, for the Tiny-YOLO architecture. The results were slightly better for YOLO9000. For more complicated applications, such as for the detector developed in [
13], large architectures might be required when the features of the targeted objects are more complex and variable. The authors in [
14] used a 30-block architecture with 22 convolutional layers to detect and distinguish between healthy and infected tomatoes. The authors increased the network’s performance to achieve a mAP score of 0.91 by adjusting the learning rate during the training process as a function of the average loss.
Gaussian mixture modeling (GMM) was implemented in [
15] to detect moving objects. The authors applied a new approach in which image blocking was used to construct the GMM model of the background instead of using individual pixels. Although the accuracy would be reduced, such a method with optimal parameters could decrease the processing time required for constructing the background model. The authors then used a wavelet de-noising method instead of median filtering, as the results obtained showed a preference for the wavelet filter with a low threshold value. Furthermore, the paper introduced an adaptive background technique in which the background changes at each stage to account for the dynamic nature of the background. The results of the procedure used were better in terms of running time and object detection.
Another approach was presented in [
16], where GMM was applied and, to enhance the results, it was accompanied by the Hole Filling algorithm. The procedure carried out by the Hole Filling algorithm involves using a circle-like filter with a specified radius. The filter then moves through the foreground mask resulting from the GMM and computes the number of pixels detected as the foreground. If the number of pixels is below a specified value, the whole region is assumed to be a part of the background. The parameters specified in Hole Filling include the applied filter’s radius and threshold for the number of foregrounds computed for the region to be taken as part of the foreground. The results of the procedure showed high accuracy and Kappa statistics.
One more approach was introduced in [
17], where the GMM method was thoroughly investigated. The results showed significant distortion when the same initialized learning rate was used to update the mean and variance of the Gaussian distributions. The reason for distortion is that the pixels become saturated, which means that they neither become the background nor the foreground. The variance is updated with a high learning rate and a huge difference between the pixel values in the image. Thus, a semi-parametric model presented by a sigmoid is introduced to control the updating of the variance. When there is a slight change between the mean and the variance, a quasi-linear update is activated, and a flattened update is implemented when there is a slight change. The approach showed promising results for detecting the foreground when the lighting is changing.
3. Materials and Methods
3.1. System Overview
The proposed system includes one passive subsystem, a validation system, two active systems in which manual arm control and auto-scanning modes are toggled, and a mobile app for user feedback. In the idle state, the system is in manual control mode, where the linear actuator and the arm gripper are controllable by the user once an item is picked up. The auto scanning mode is enabled manually by the user; it locates the item in front of the scanner base, starts the barcode detection and scanning process, then drops the item in a non-congested section in the cart. Items scanned are registered in the system and validated, and the selected item and quantity are presented in the app. The system overview is shown in
Figure 1.
The scanner base is vertically rotatable through a stepper motor installed on the cart edge and connected to the base with a coupler. The base includes a camera used for the deep learning–based barcode detection system. The base rotation allows the detection of barcodes from the lower side of items when the actuator is still unpacked.
If no barcodes are detected until the actuator is packed, auto scanning starts by placing the item near the scanner base, not too close so that the entire item is in the camera’s field of view, and not too far so that the camera can detect the barcode. The gripper starts rotating while a YOLO detection pipeline is running, and the center of the ROI with the highest confidence score is used to align the barcode with the scanner in a feedback PID control loop. The visual difference, in pixels, between the detected centroid and the scanner sensor, mapped to the frame in pixels, is used in the control loop to determine the following motion input of the gripper in the x-axis and the y-axis. Scanning the item and registering its barcode ends the loop and allows it to be placed in the cart. Manual scanning is possible if the timeout duration is reached without barcode registration.
Accordingly, the visual difference, in pixels, between the detected centroid and the scanner sensor, mapped to the frame in pixels, is used in the control loop to determine the following motion input of the gripper in the x-axis and the y-axis. Scanning the item and registering its barcode ends the loop and allows it to be placed in the cart. Manual scanning is possible if the timeout duration is reached without barcode registration.
Finally, the validation system is used to check if the item inserted was scanned or not. The system uses a camera with a view of the items inside the cart and load cells mounted at the base to detect the insertion of new items. The items are further checked to be the same as those scanned, using matched SURF features and weight comparisons. The actual weights and features are stored in the database and accessed by the system.
3.2. Main Algorithms Used
3.2.1. YOLOv2—Object Detection
One of the important networks used in our proposed system is YOLOv2 and TinyYolo for object detection. While the gripper starts rotating to detect a barcode placed on an object, a single-stage real-time object detection pipeline, You Only Look Once (YOLO), is running. The object detection process, depicted in
Figure 2, includes locating and classifying certain objects on an image. The input image is first divided into an
S ×
S grid of cells, each of which is responsible for detecting objects falling in the grid, and each grid returns the bounding box information and the probability belonging to a certain classification.
Each bounding box (
B) has five components: (
x,
y,
w,
h, confidence). The
x,
y coordinates represent the center of the box relative to the bounds of the grid cell, and
w,
h are predicted, relative to the image size. These coordinates are then normalized to become between 0 and 1. The confidence prediction, shown in Equation (
1), is represented by the IOU between the prediction box and any ground truth boxes. These confidence scores reflect how confident the model is that the box contains an object and also how accurate it thinks the box is that it predicts.
where
Pr(
Object) represents the probability that the bounding box contains the object. Finally, the predictions are encoded as an
tensor, where the image is divided into an
grid and for each grid, the cell predicts
B bounding boxes, the confidence for those boxes, and the
C class probabilities.
The loss function, described in Equation (
2), is composed of classification loss, localization loss and confidence loss. Unlike other algorithms, this approach learns a generalizable representation of the objects and makes accurate predictions with a single neural evaluation. The algorithm thresholds the predictions and performs non-maximum suppression to remove duplicates and outputs bounding boxes that define the sections with objects [
18].
In our proposed system, we use YOLOv2 along with TinyYOLO feature extraction in the object detection pipeline, due to its advantages compared to other state-of-the-art detection algorithms. The YOLO algorithm has the advantage of being capable of recognizing and locating up to 49 objects in a single image. In terms of performance and speed, the YOLO algorithm is able to accurately detect objects in real time, making it suitable for our use case.
3.2.2. GMM—Background Subtraction
During the auto-scanning process, the robotic arm picks up the item, scans it, and adds it to the cart. The existence of a new item in the cart is detected by GMM and other algorithms applied to the scene of the cart, before and after adding the item.
Background subtraction is a technique for detecting all moving objects (foreground) in a video stream by creating a background model, which is a representation of the scene. This background model is then compared to the input frame, and any significant difference in an image region from the background model indicate the presence of a moving item. Multiple algorithms have been proposed for background subtraction, such as Gaussian mixture model (GMM) and the kernel density estimator (KDE), over the years [
19]. In GMM, each pixel value is modeled as a mixture of Gaussians. A pixel from a new image is considered to be a background pixel if its new value is well described by its background density function. Otherwise, the pixel is classified as foreground. The algorithm starts by initializing t
k number of distributions for every pixel location in a frame to model a dynamic background that can withhold enough data about the structure of the background. For a pixel to belong to one of the distributions, it should satisfy the condition in Equation (
3), where
is the pixel value at frame
t,
and
is the mean and standard deviation of distribution k, and factor
is selected to be 2.5. If the condition is satisfied for a distribution
k, the parameters of the distribution are updated, using (Equations (
4)–(
6)). Where
is the learning rate, which 1/
corresponds to the speed at which the model parameters are updated with a value of 0.005,
is computed using Equation (
7);
is 1 when the condition is satisfied and 0 otherwise. After processing each frame of t, the distributions of each pixel are sorted by the ratio of
. If none of the distributions have satisfied the condition, the lowest distribution in the sorted list is replaced by a new distribution initialized with the same parameters as before.
After all of the training frames have been processed, the background model is built using the smallest number
b of distributions that will fulfill the requirement stated in Equation (
8).
T describes how dynamic the model can be. After obtaining the background model, background subtraction is carried out with the successive upcoming frames to obtain the foreground segment. As the process progresses with foreground detection, the model is updated to reflect the changing structure of the background, resulting in a reliable approach for detecting moving objects.
3.3. Robotic Arm: Manual Control
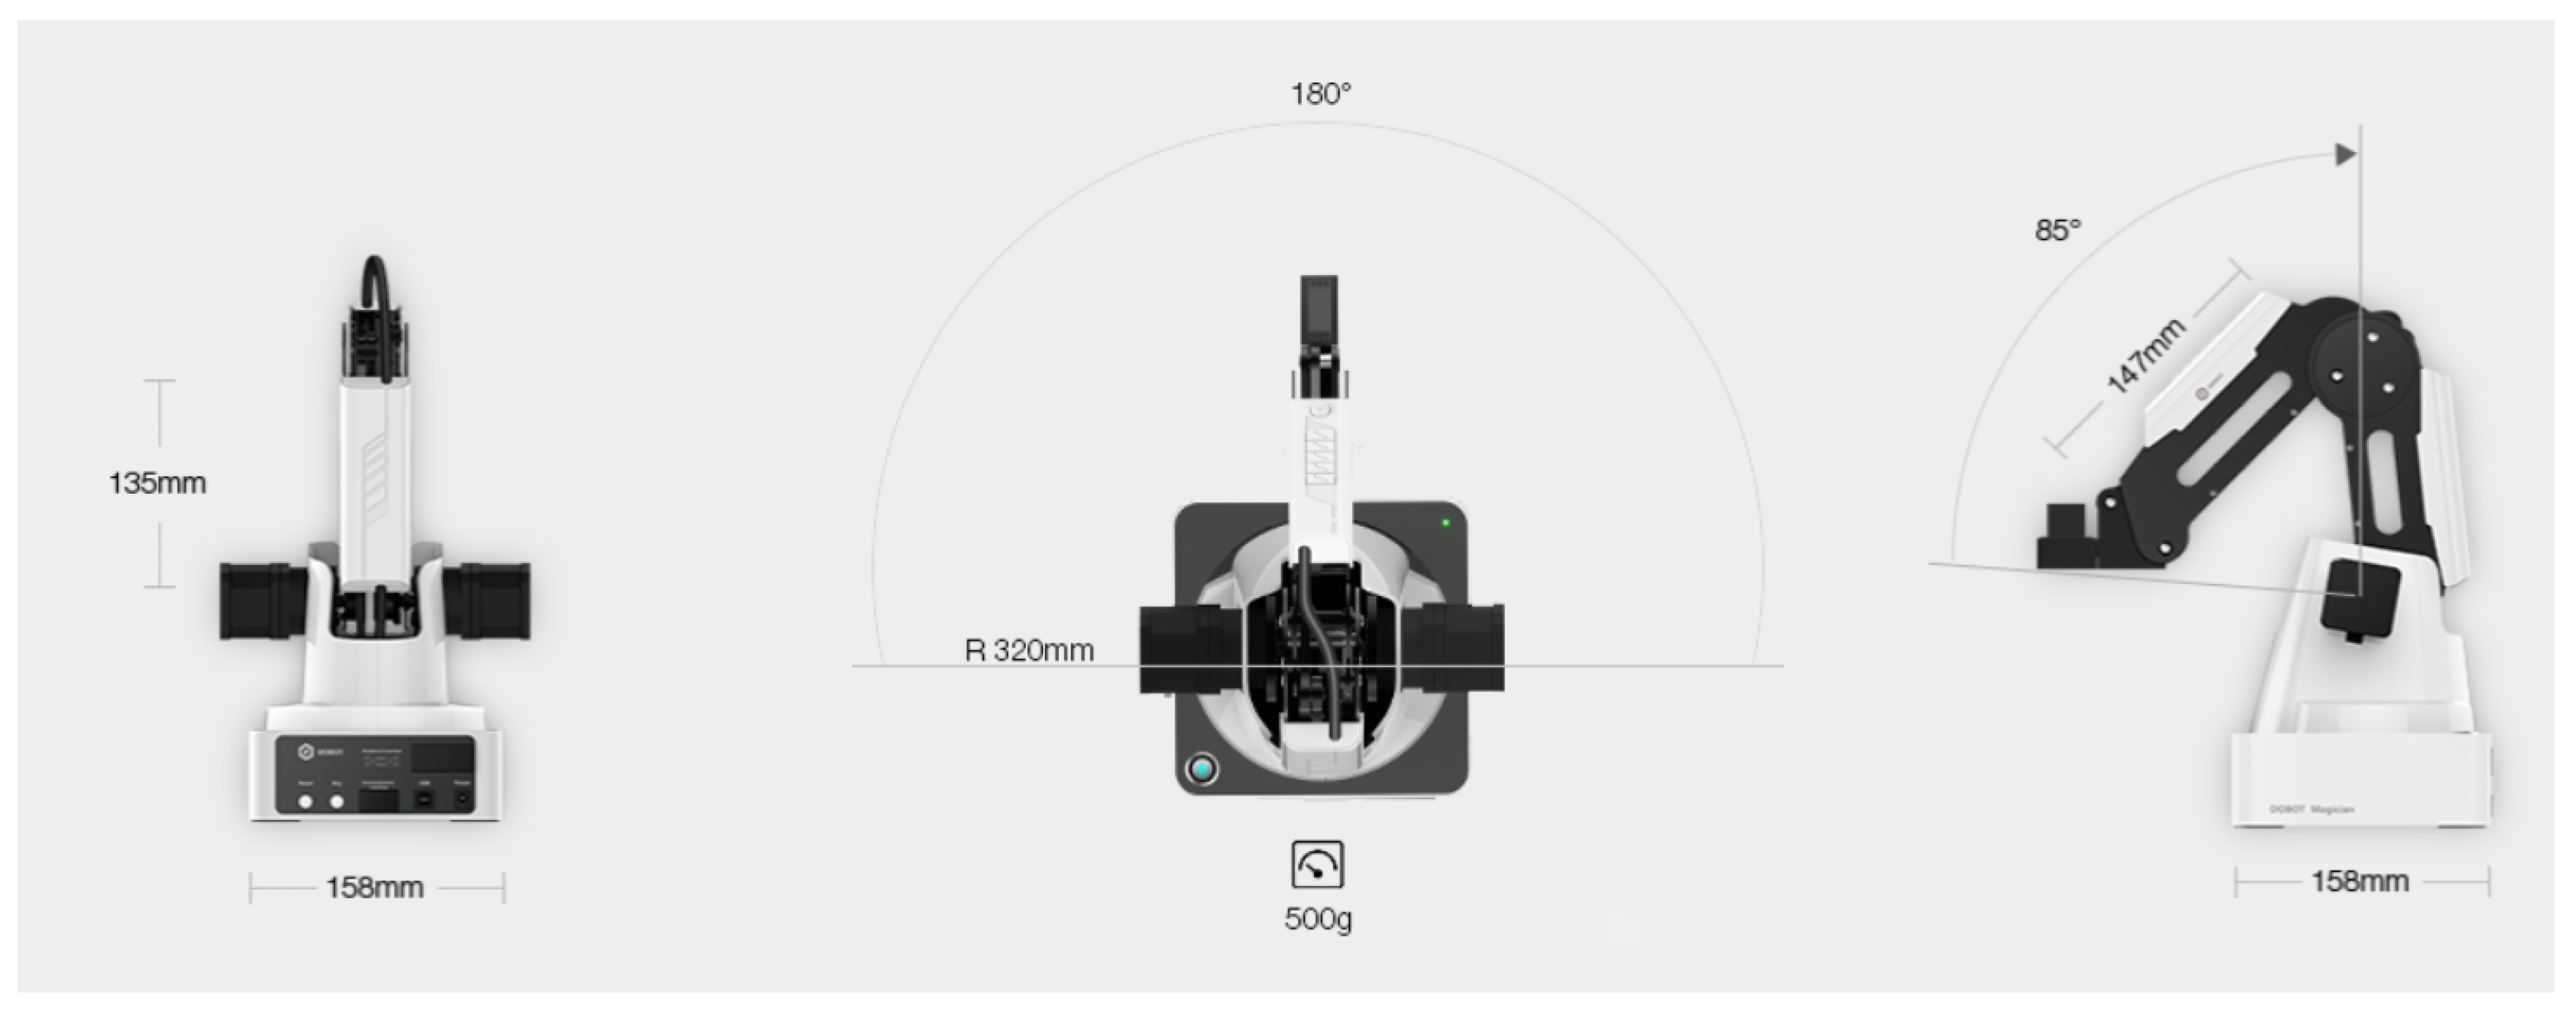
The robotic arm used works on 3-axis with specifications as shown in
Figure 3. The forward axis is the servo of the gripper, which rotates at 480 degrees per sec to 180 degrees in both directions at a load of 250 g. For experimental purposes, this servo is set at −180 degrees, and the items used for testing are lower than 250 g in weight.
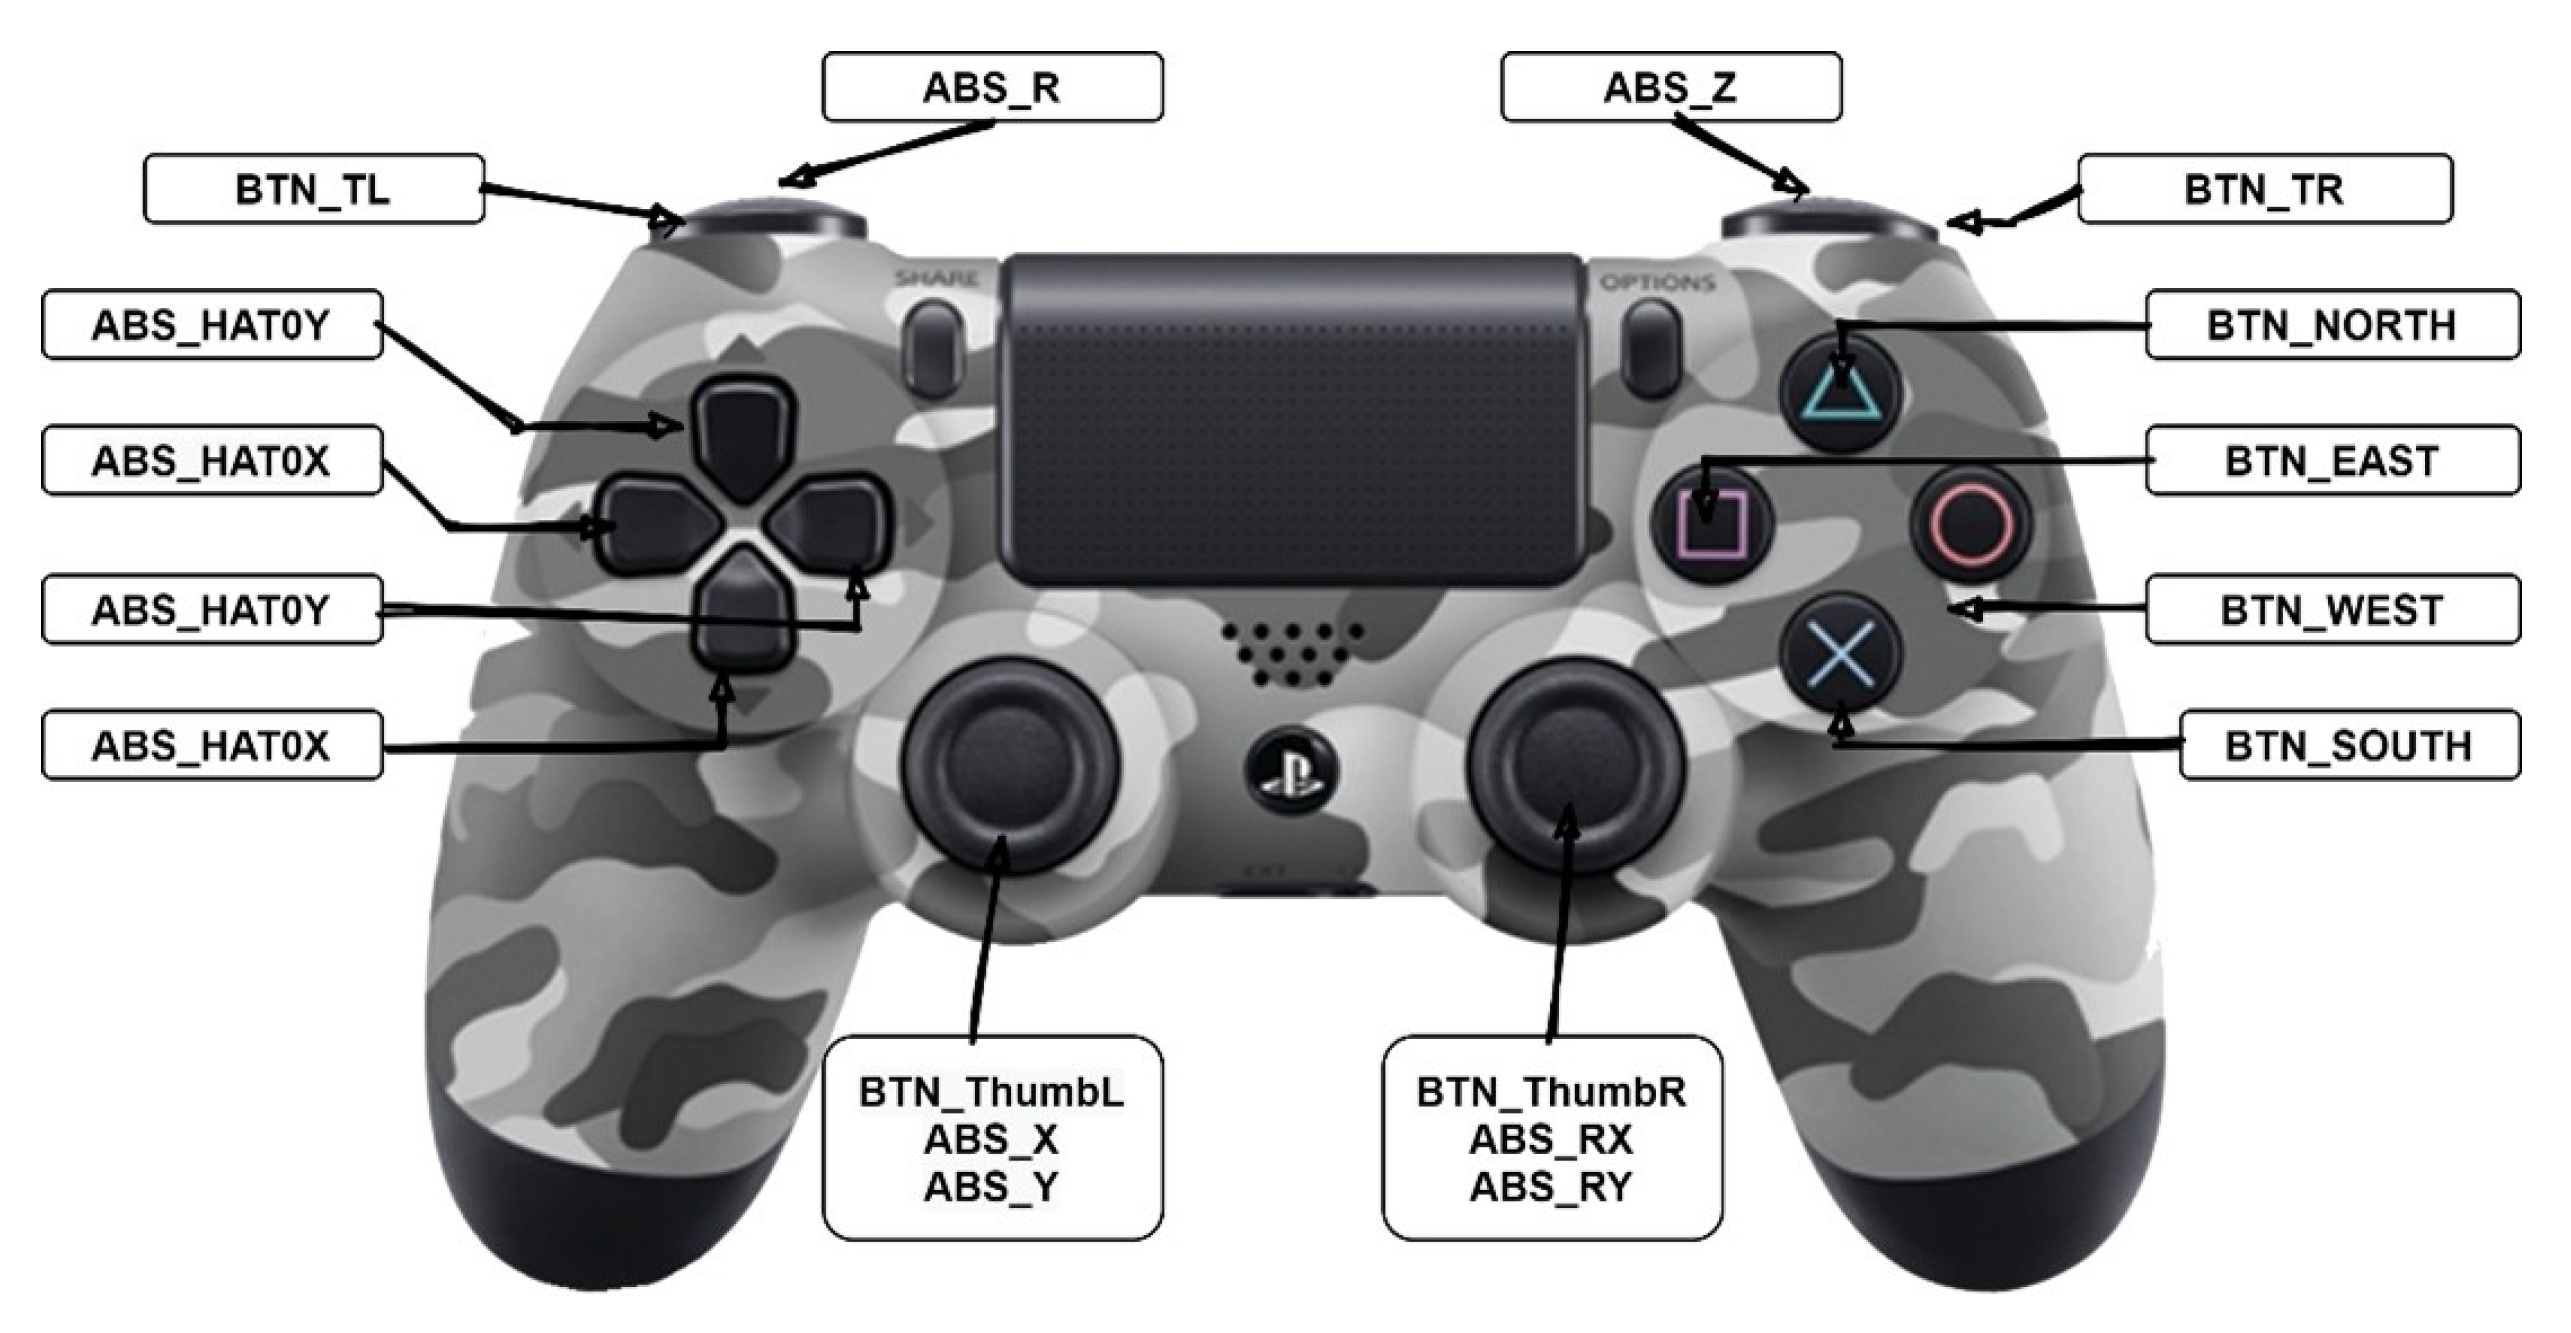
We use a gamepad to control the robotic arm, as shown in
Figure 4. We require receiving 16 different inputs, indicating only the buttons and sticks needed to control the control system. All of the variables have ‘0 ’ in their idle state; the values when buttons are pressed are either ‘1 ’ or ‘−1 ’ depending on the type and location of the buttons. The two joysticks have two different inputs for the
x-axis and the
y-axis, and their values range from −32,767 to 32,767. The joysticks have a third value when pressed.
Table 2 shows the activation values and the associated command for every button.
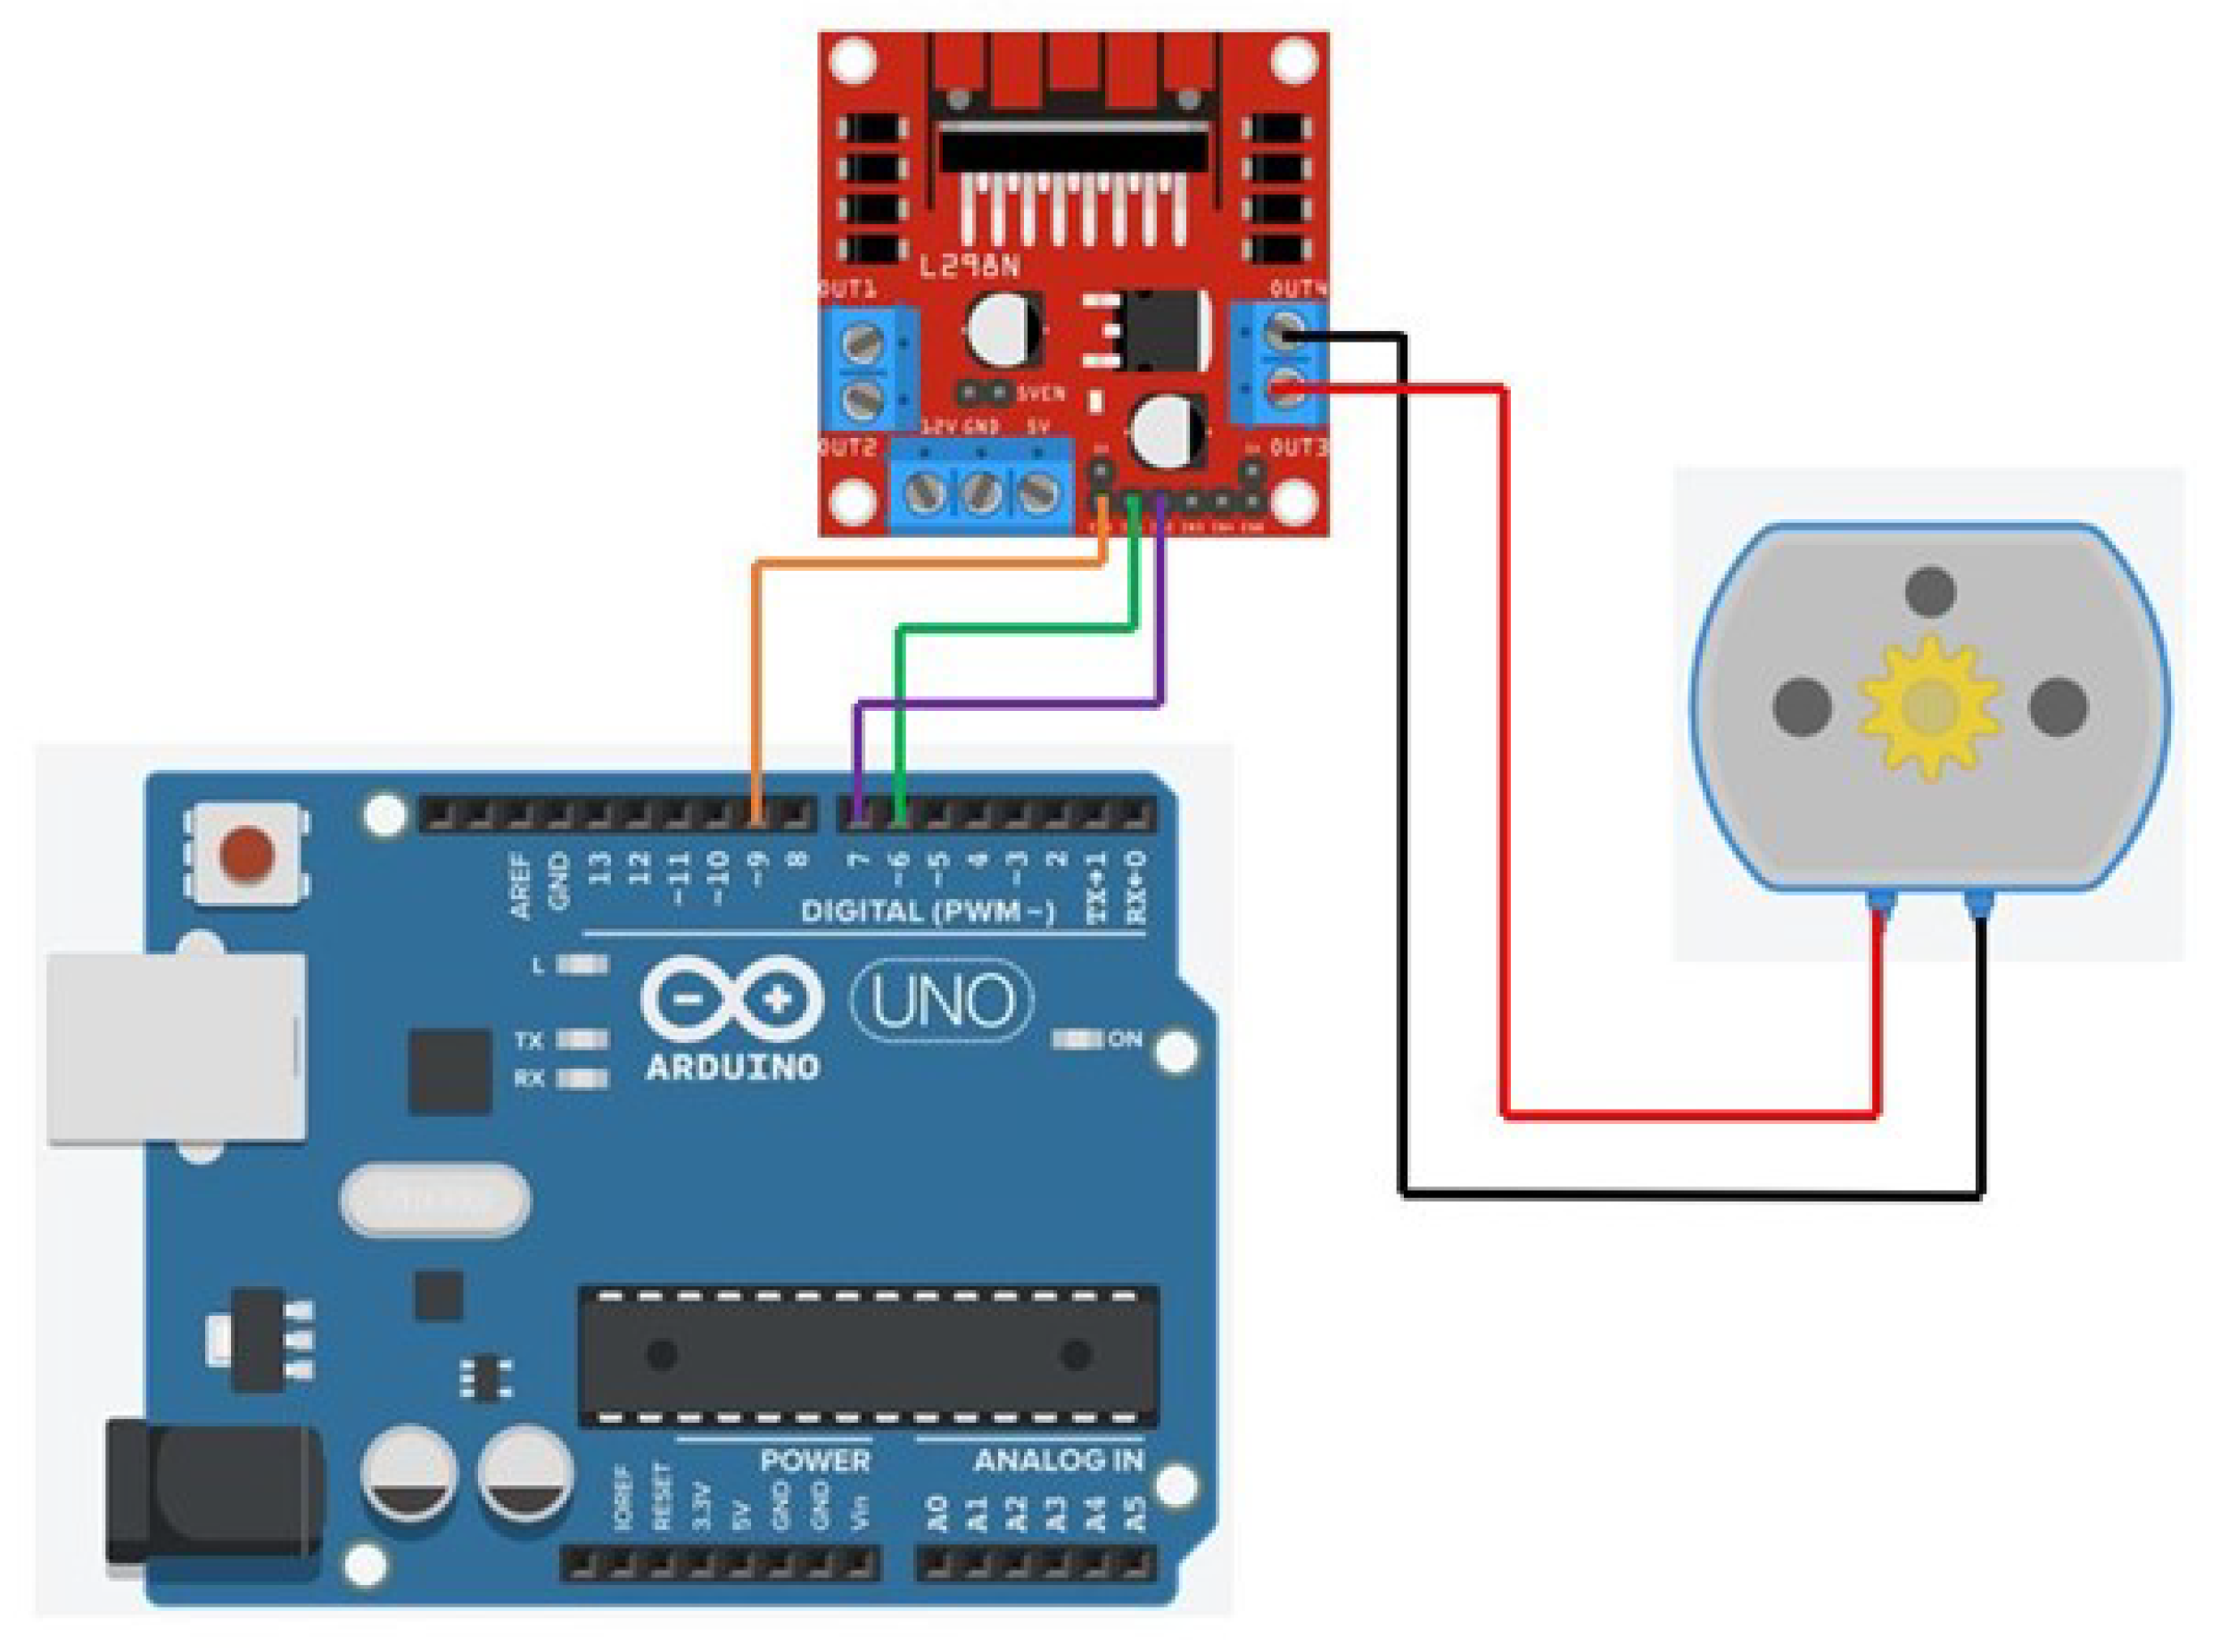
A linear actuator is a type of actuator that generates linear motion out from the rotary motion of a DC motor. The mechanism behind this conversion of motion is simple and can be done mechanically through a screw, cam, or wheel and axle actuators. The linear actuator used in this project is screw-based. The main components of this actuator are a DC motor, screw, and a shaft; the screw is mounted to the motor’s rotor, and the shaft moves along the screw as it turns. The shaft is a nut on the screw. Controlling the direction of the DC motor controls the course of the movement of the shaft, either up or down. In our project, the linear actuator is the lifting mechanism we used to add extra height to the robotic arm and enable it to reach the high shelves. The linear actuator is controlled through Arduino Uno connected to our computing server. The user can choose to go up or down through the controller; the signal is then read by the Python code and sent to our computing server to operate the linear actuator accordingly. The schematic of the connection of the linear actuator to the laptop is shown in
Figure 5. The linear actuator, used in the experiment, has a speed of 50 mm/s at no load with a maximum reach of 500 mm. The robotic arm weighs 500 g, and the item is expected to be maximum of 250 g, which, in total, the linear actuator is approximated to carry 750 g; it is expected to take around 12 s to reach the maximum height.
3.4. Scanning System
The main components of the auto-scanning functionality are the barcode detection pipeline and the scanner hardware. The auto-scan mode is activated manually when the computing server reads the corresponding command triggered by the user input from the controller. To implement YOLOv2 as the backbone for the barcode detection pipeline, we developed multiple scripts for dataset exporting, data processing, anchor-boxes estimation, model training, model evaluation, and final execution.
3.4.1. Data Post Processing
Before starting the detector optimization, the training data size is expanded to increase the accuracy as more resources are available for the neural network optimizer in the detector. This is achieved through data augmentation techniques that do not require more samples. Instead, linear and non-linear transformations methods are applied to the images in the dataset to distort some of the visual information of the image while preserving its structure. The data augmentation process not only provides additional samples, but the variance it adds to the dataset helps in decreasing overfitting [
20].
Different types of transformation can be applied to augment the data, including image rotation, shearing, affine transformation, and multiple color transformations, such as contrast manipulation, blurring, and histogram equalization [
21]. We had some considerations to take into account before selecting proper transformation. First, we recorded the raw data videos for barcodes at different pitch and yaw angles, depth, and positions. Thus, performing image projection or displacement cannot increase the variance of the data. Additionally, we avoided texture transformation since distorting the barcode strips can badly affect the system performance. Instead, we only used reflection and contrast mapping across different color channels. Since bounding boxes are assigned earlier, the bounding boxes are displaced after reflection. Bounding boxes correction is applied as follows:
Define a bounding box as for an image with m rows and n columns.
For reflection over the
x-axis, the following holds:
For reflection over the
y-axis, the following holds:
Meanwhile, random color transformation is applied for each original image, image reflected on y, and image reflected on x as follows:
The augmentation process results in increasing the dataset six times. For each sample, the transformations shown in
Figure 6 are applied. The total size of the final dataset is 31,500 samples. No additional transformations are applied to avoid redundancy or excessively increasing the training time. The optimized model required about 40 h to finish 12 epochs over the complete dataset, using a GTX 1060 GPU.
3.4.2. Design and Optimization of the Barcode Detector
The performance of the detection model is highly dependent on several hyperparameters that require optimization during the training process; thus, training multiple models and analyzing their performance is essential. Of course, performing brute-force attack testing for a large set of hyperparameters is unpractical, as each entire training run requires a lot of time. Instead, we tested each parameter for different values within an exponentially increasing range, and the testing was applied for only a small portion of the data. As the process is repeated, the possibilities for the parameters decrease; we then performed full training runs on a small set of parameters. The final selected parameters are not the absolute best solution. Yet, we compensated the optimization imperfection by adding more training data until a satisfying mean average precision (mAP) rate was achieved. The hyperparameters included the dropout factor, number of epochs, learning rate , regularization term, anchor boxes, and the structure of the feature extraction network.
The anchor boxes estimate the ROIs in the processed image; then, the YOLO network can classify those regions. Anchors are used as an alternative for scanning each possible box in the image by arranging tiled sets of anchors in an
grid as shown in
Figure 7. Instead of detecting the ROI directly, the network predicts the IoU ratio between the anchor and the object, the offset of the anchor from the object, and other parameters to refine the anchors as bounding boxes around the objects of interest. The anchors are set in a grid in the image, usually a
grid.
The number of required anchors is one of the parameters that we optimized between 4, 5, and 6. The size of each anchor is optimized using a built-in function that requires the labeled dataset. This is because the shape of the anchors depends on the potential ratios of the objects of interest; thus, it is different for each dataset.
Another hyperparameter is the selection of the feature extraction network. The network layers are extracted from a pre-trained network while freezing their trainable parameters as a transfer learning method. Freezing the weights is achieved by setting the learning rate for each targeted layer to zero. This is applied to all or some of the convolutional layers without including the fully connected layer. Adding more convolutional layers increases the complexity and the computational cost of the detector but improves the mAP. Sometimes, different learning rates are assigned to the layers as the feature extraction ones are not completely frozen but are allowed to adapt by setting their
to a small value compared to the new YOLO layers as proposed in [
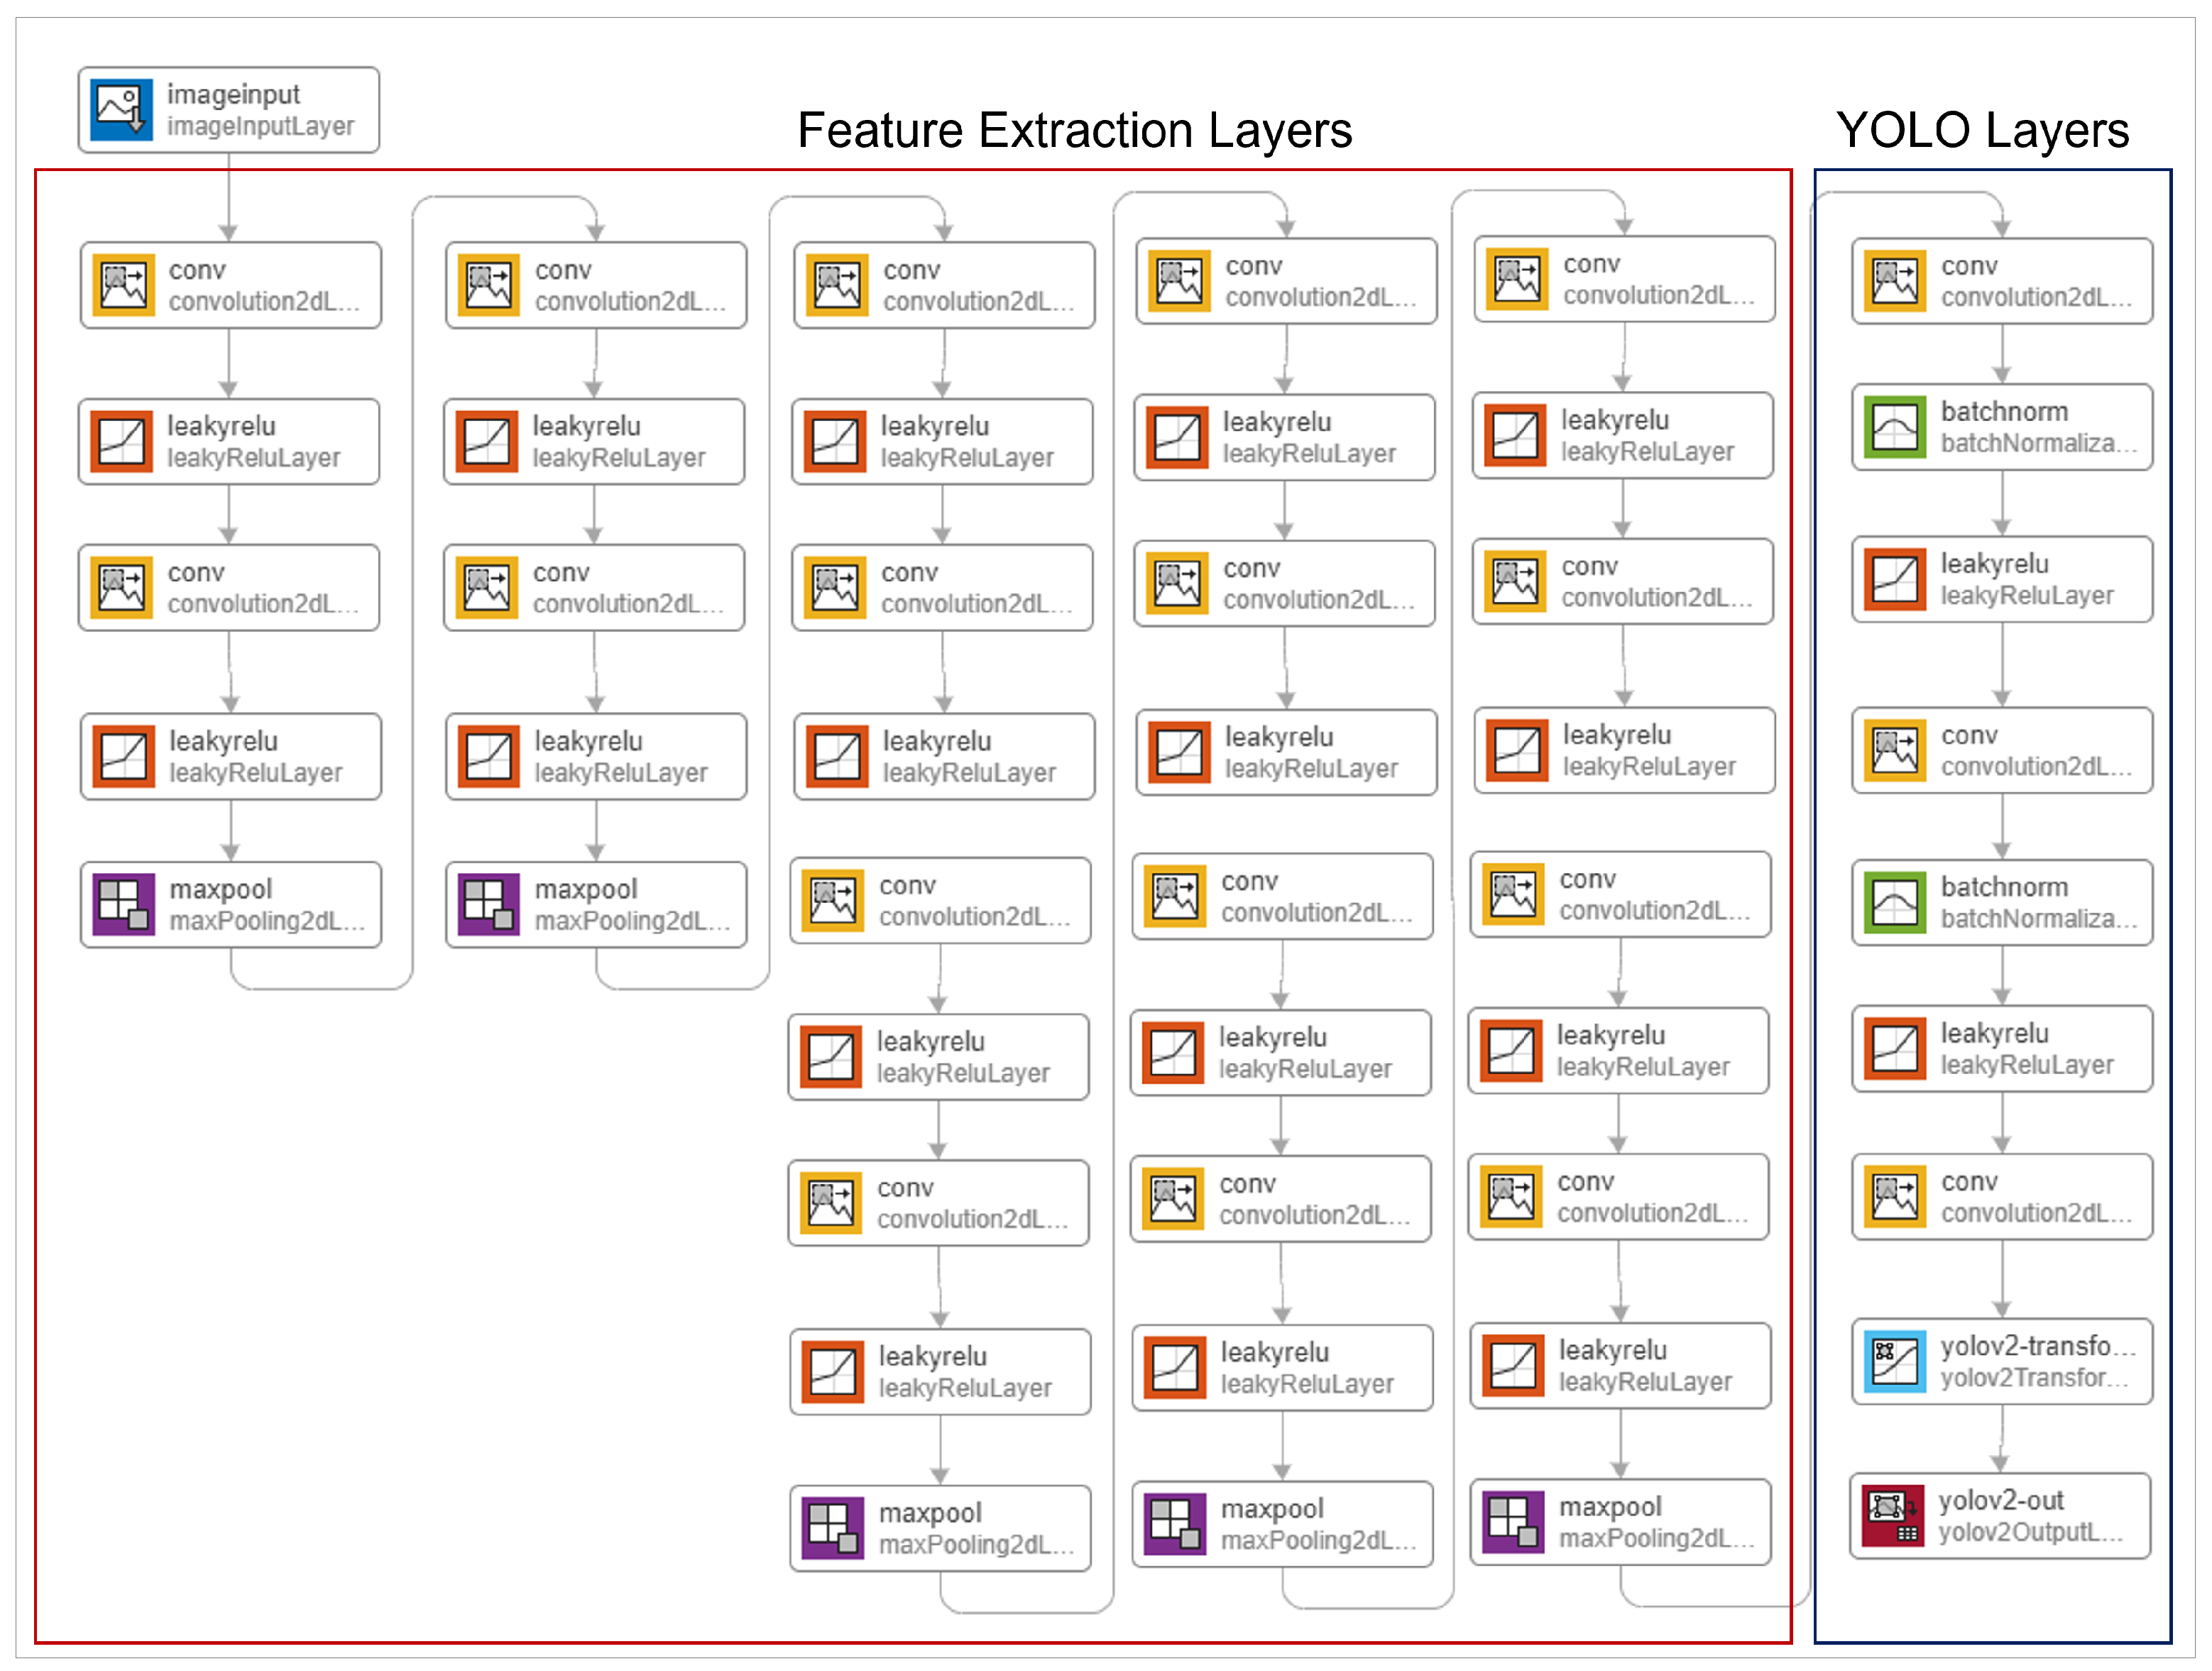
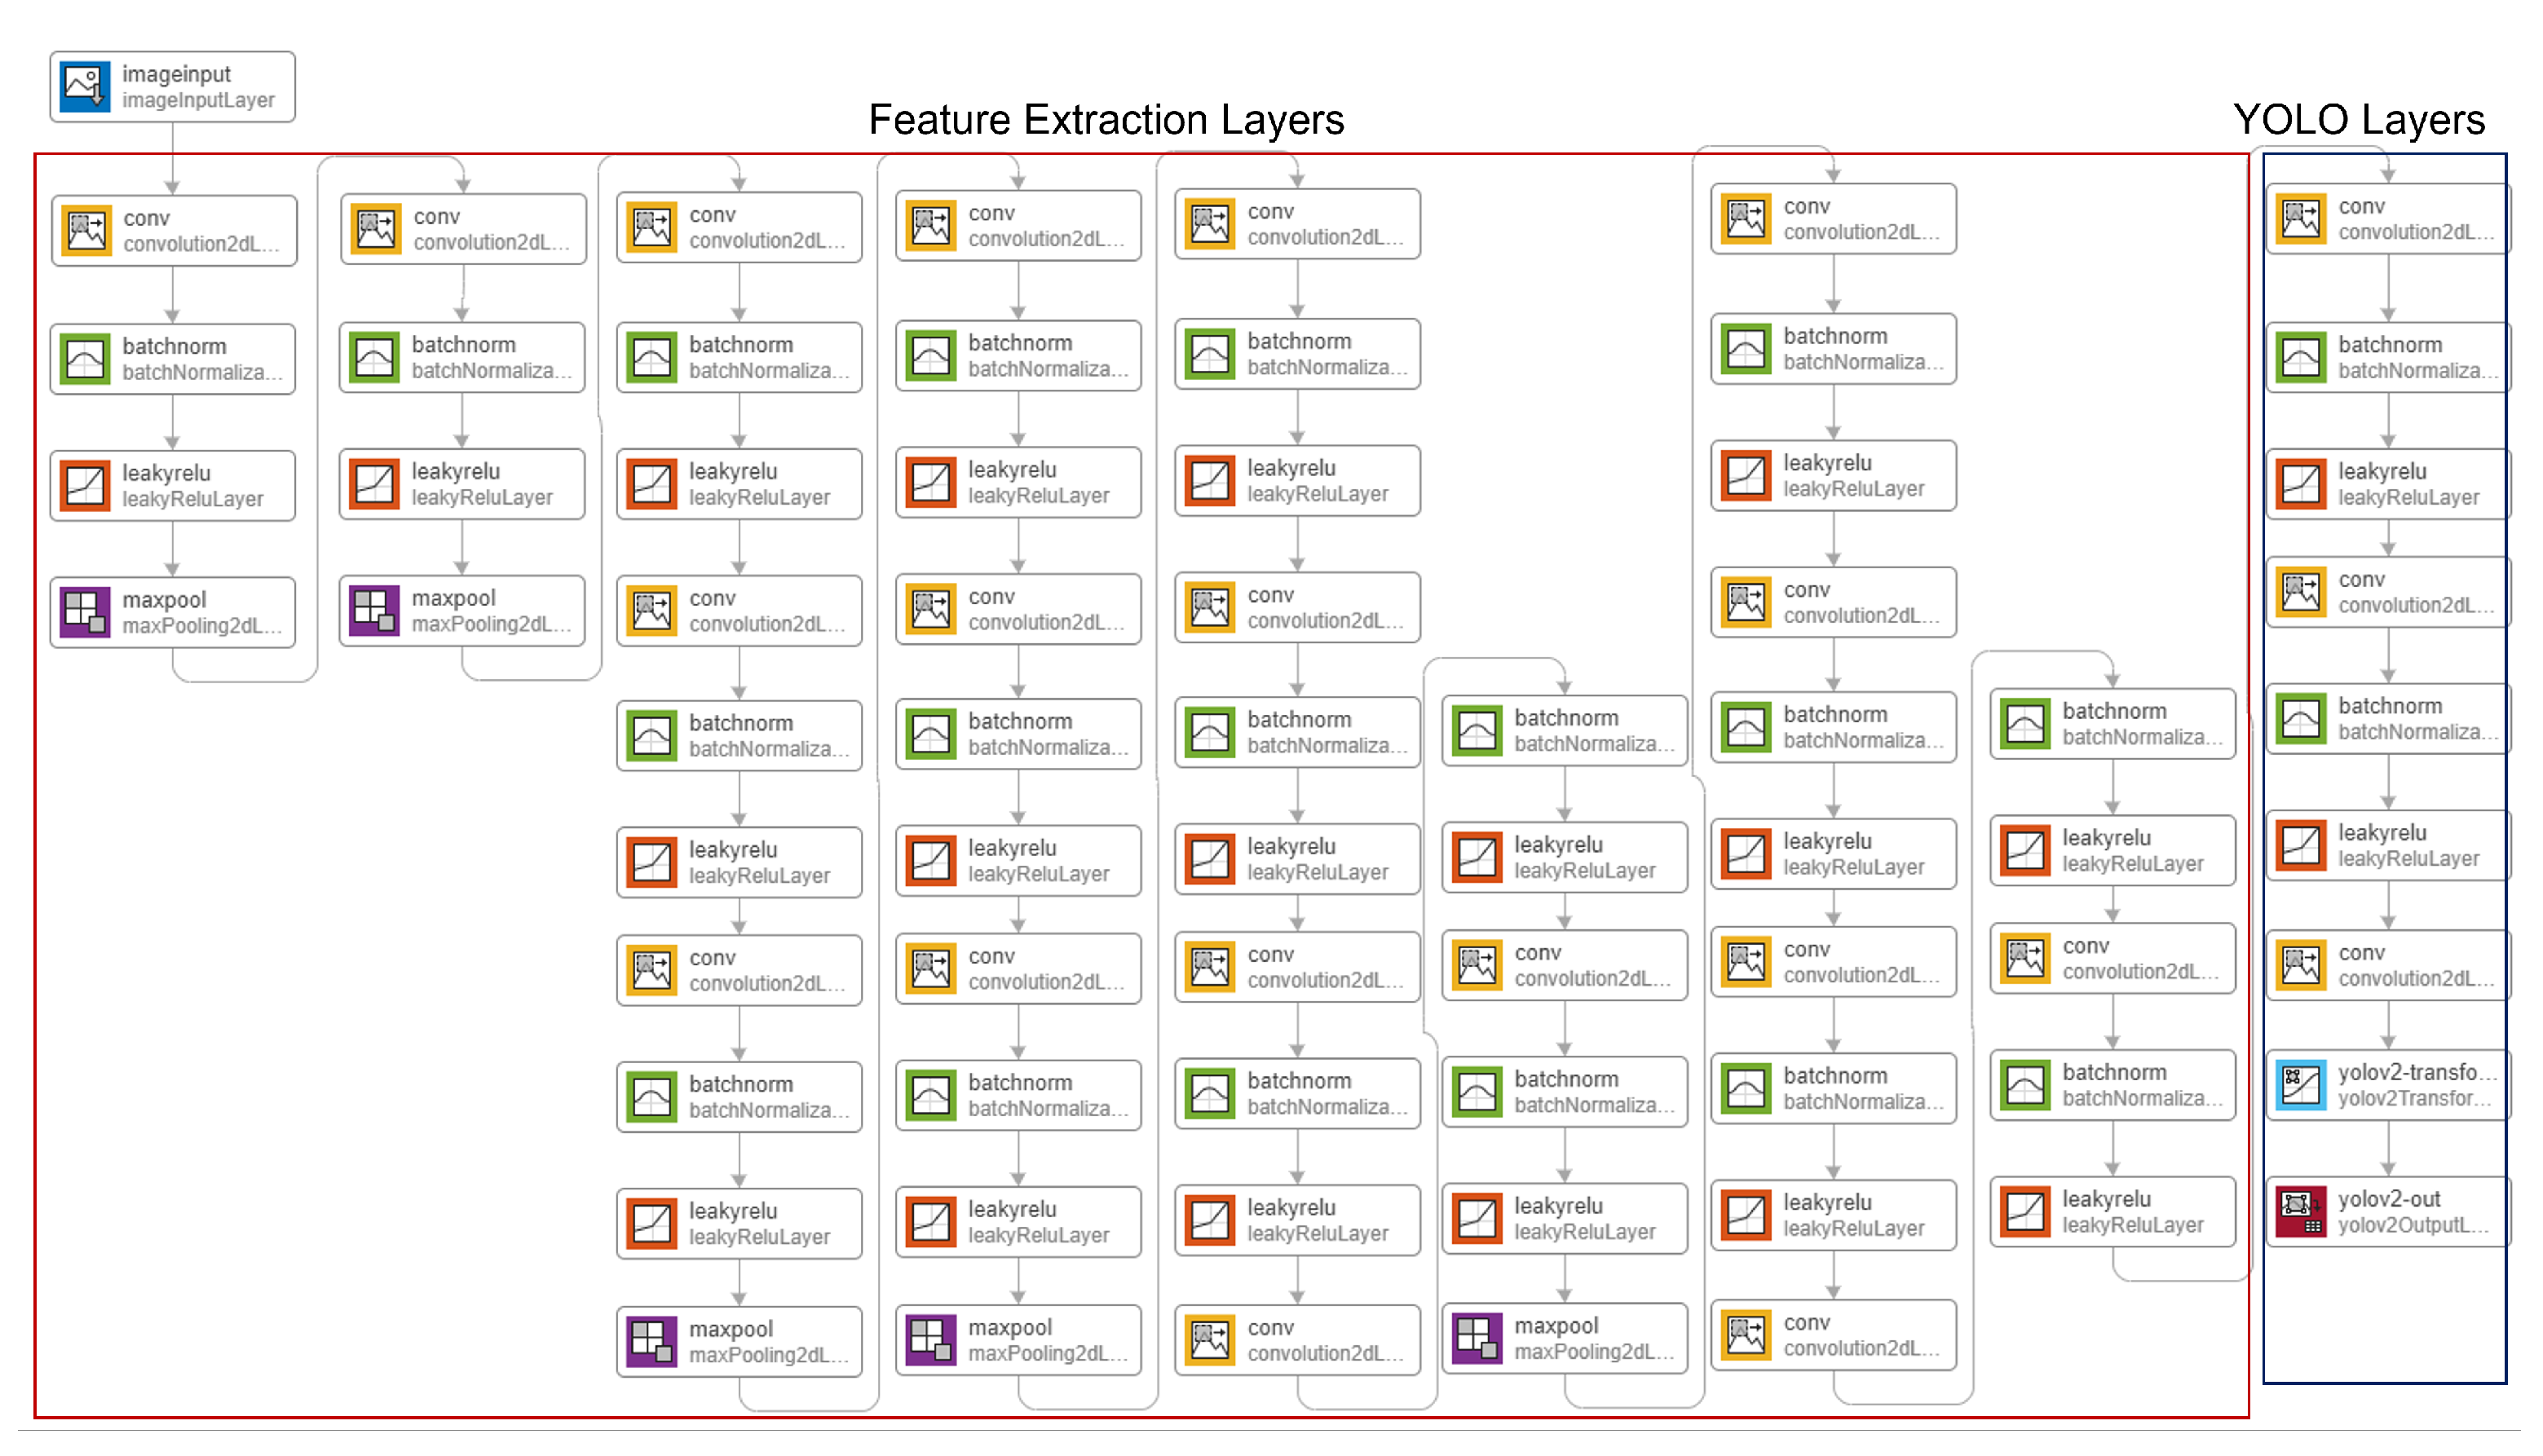
22]. We tried different small non-trained layers and known pre-trained layers for feature extraction, including VGG19, Darknet19, and TinyYOLO. The comparison between the used layers is shown in
Figure 8,
Figure 9 and
Figure 10.
The selection of a good optimizer is also important. The optimizer is the function used to update the weights of the unfrozen CNN filters and the other YOLO trainable parameters by minimizing their cost or loss function. The loss function
measures how good the detector is in predicting the class, or the value in the case of regression, of the given samples based on the difference between the detector score and the ground truth labels. Since the prediction is calculated as a function of
, which is the trainable weights
w and their biases, the
matrix updates every iteration based on the calculated loss of a mini-batch of sample images per iteration
i. We used
Adam optimizer, which is proposed in [
23]. The updating function is based on the standard gradient descent (SGD) shown in (
12), where the new weights are equal to the old weights minus the loss matrix.
The difference between SGD and stochastic SGD is that in standard SGD, the function
is calculated over the entire dataset. In contrast, in stochastic SGD, it is calculated over the mini-batches, which are randomly picked [
24]. A momentum term is added (
12) as in (
13):
which accelerates the optimization process by making the update depending not only on the loss function but also on the change in weights during the previous update, where
. This causes the optimizer to step a large value in the next iteration when that
is large and small steps otherwise [
25]. The Adam optimizer enhances the efficiency of this process with an adaptive momentum term calculated as follows:
Define an exponential decay rate and a squared exponential decay rate . but are usually set between 0.9 and 1 for , and is usually set to 0.9, 0.99, or 0.999.
Update first momentum estimate
m as follows:
Calculate the second momentum estimate as follows:
Calculate the corrected first and second momentum estimates as follows:
Update the weights as follows:
where
A regularization factor
is added to the function
as in (
14) to penalize the loss as a way of decreasing data overfitting.
where
is the regularization term, and
w is the trainable weights. To sum up, we had the following hyperparameters to optimize.
Number of anchor boxes: We tried different values less than 10, mainly 4, 5, 6.
Network structure: We tested three different feature extraction layers, which are TinyYOLO, VGG19, and DarkNet19.
Initial leaning rate α: We tried different values ranging exponentially from 0.1 to 0.001.
Learning drop factor and learning drop period : We used them to decrease the learning rate by a factor of each iteration.
Gradient decay factor and squared gradient decay factor .
Regularization term λ: We tried different values from 0.1 to 0.00001.
3.5. Robotic Arm: Automatic Control
The trained barcode detector model guides the robotic arm while in auto mode to rotate the item in front of the camera installed near the scanner until the barcode is found. Once detected, the rotation is stopped, and the arm gripper is guided with a PID controller in the horizontal and vertical axes while moving slowly toward the scanner. This is achieved by running the PID code, where the required thrust in the x-axis and y-axis is calculated; then, the results are written continuously to a text file that can be accessed by the Python code controlling the arm at the same time. This is achieved through the following steps:
A camera is used to stream frames to the system once the robotic arm’s auto mode is activated.
,
, and
parameters are initialized. These represent the proportional control, derivative control, and integral control, respectively. The PID controller response for each parameter is calculated as shown in (
15)–(
17) for an input signal
and output
.
We use the three parameters to implement the controller block as shown in
Figure 11 for the discrete signal per each frame in the camera stream sequence.
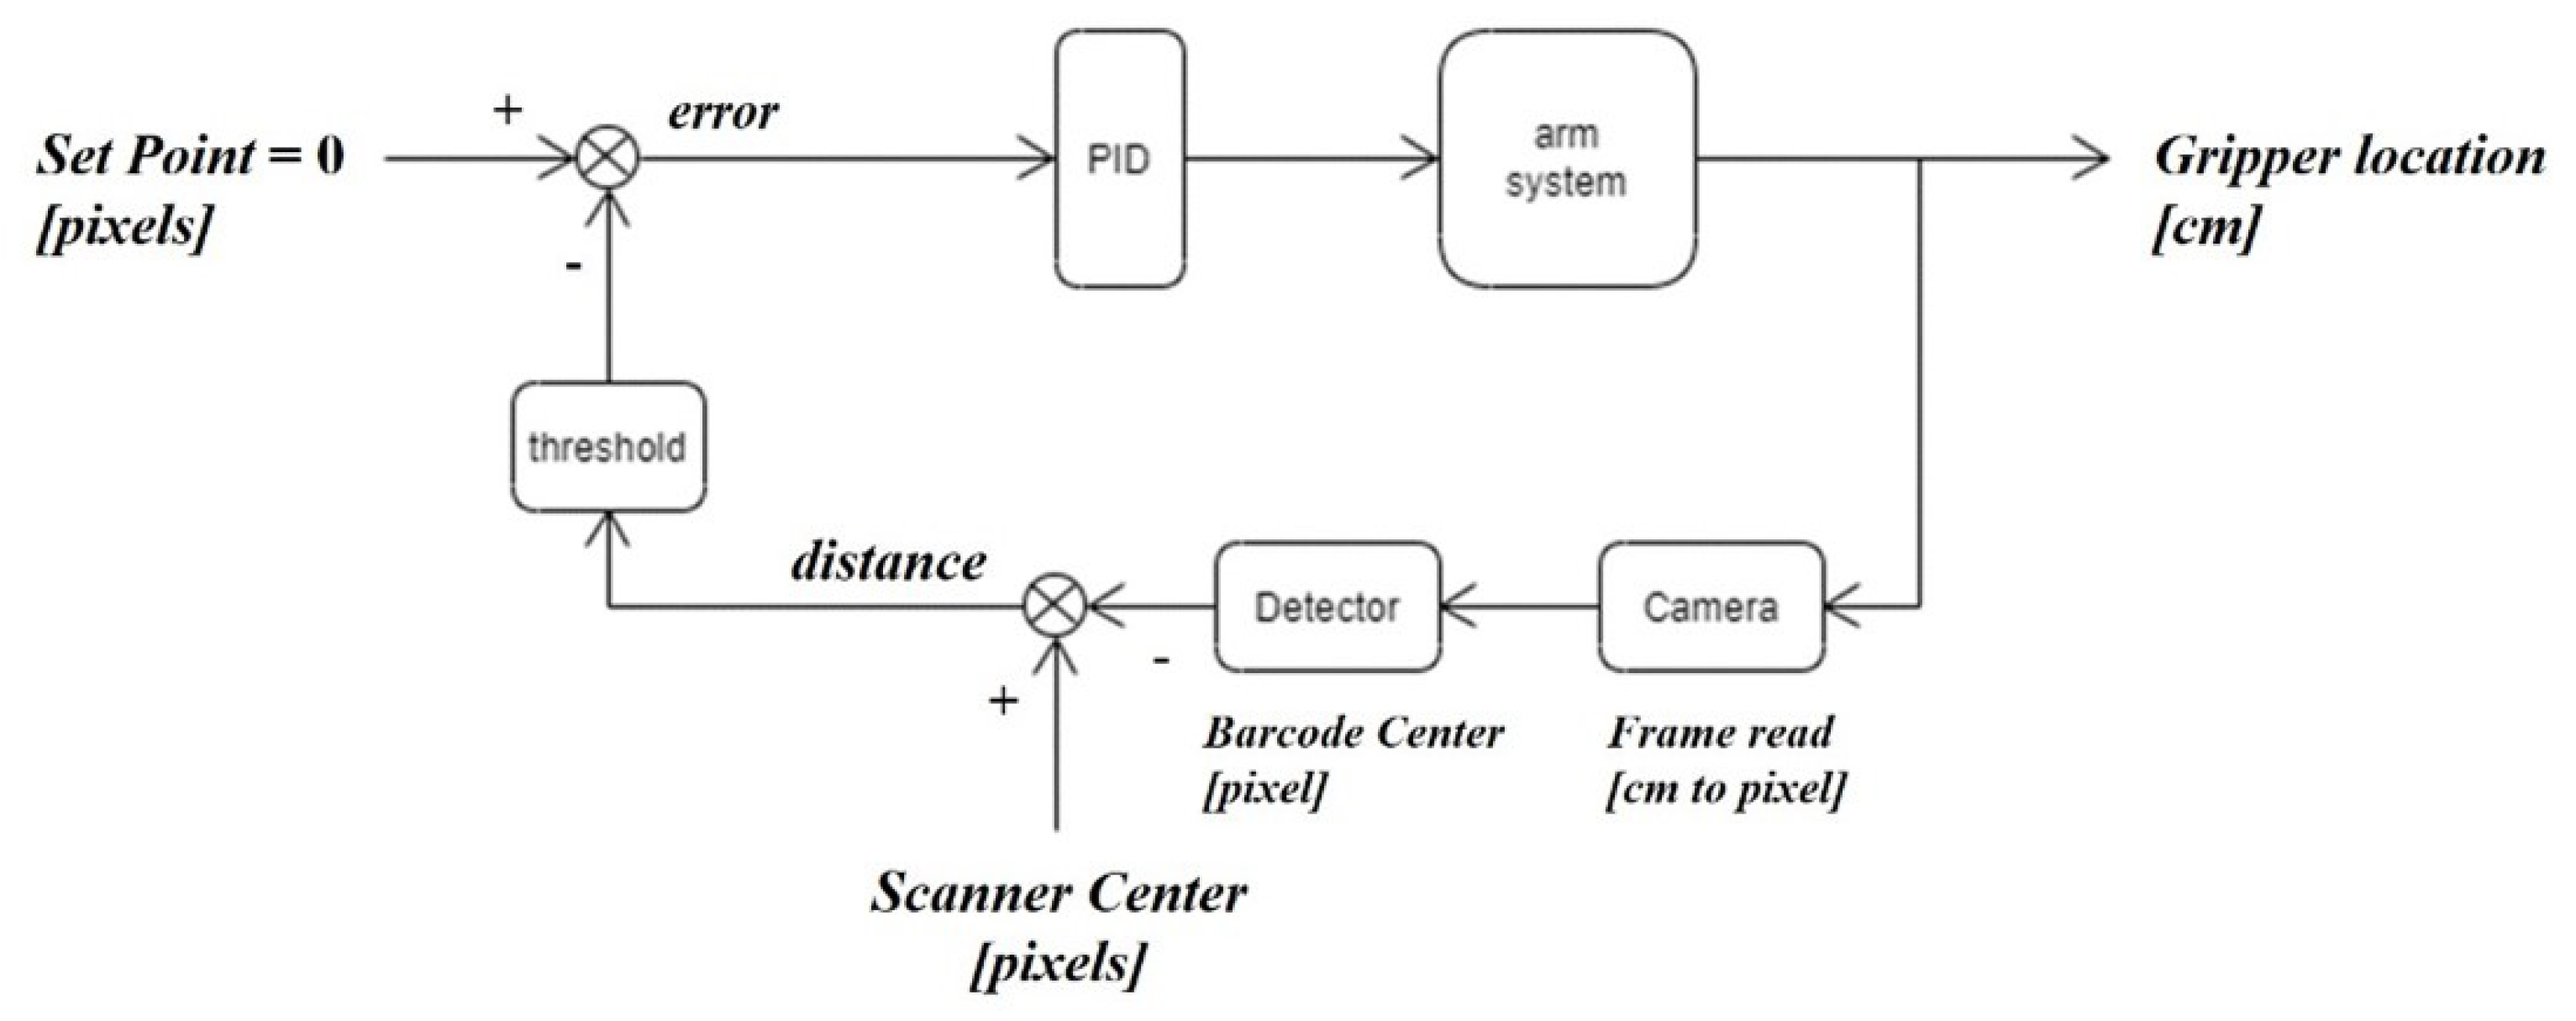
The controller is used in the feedback loop shown in
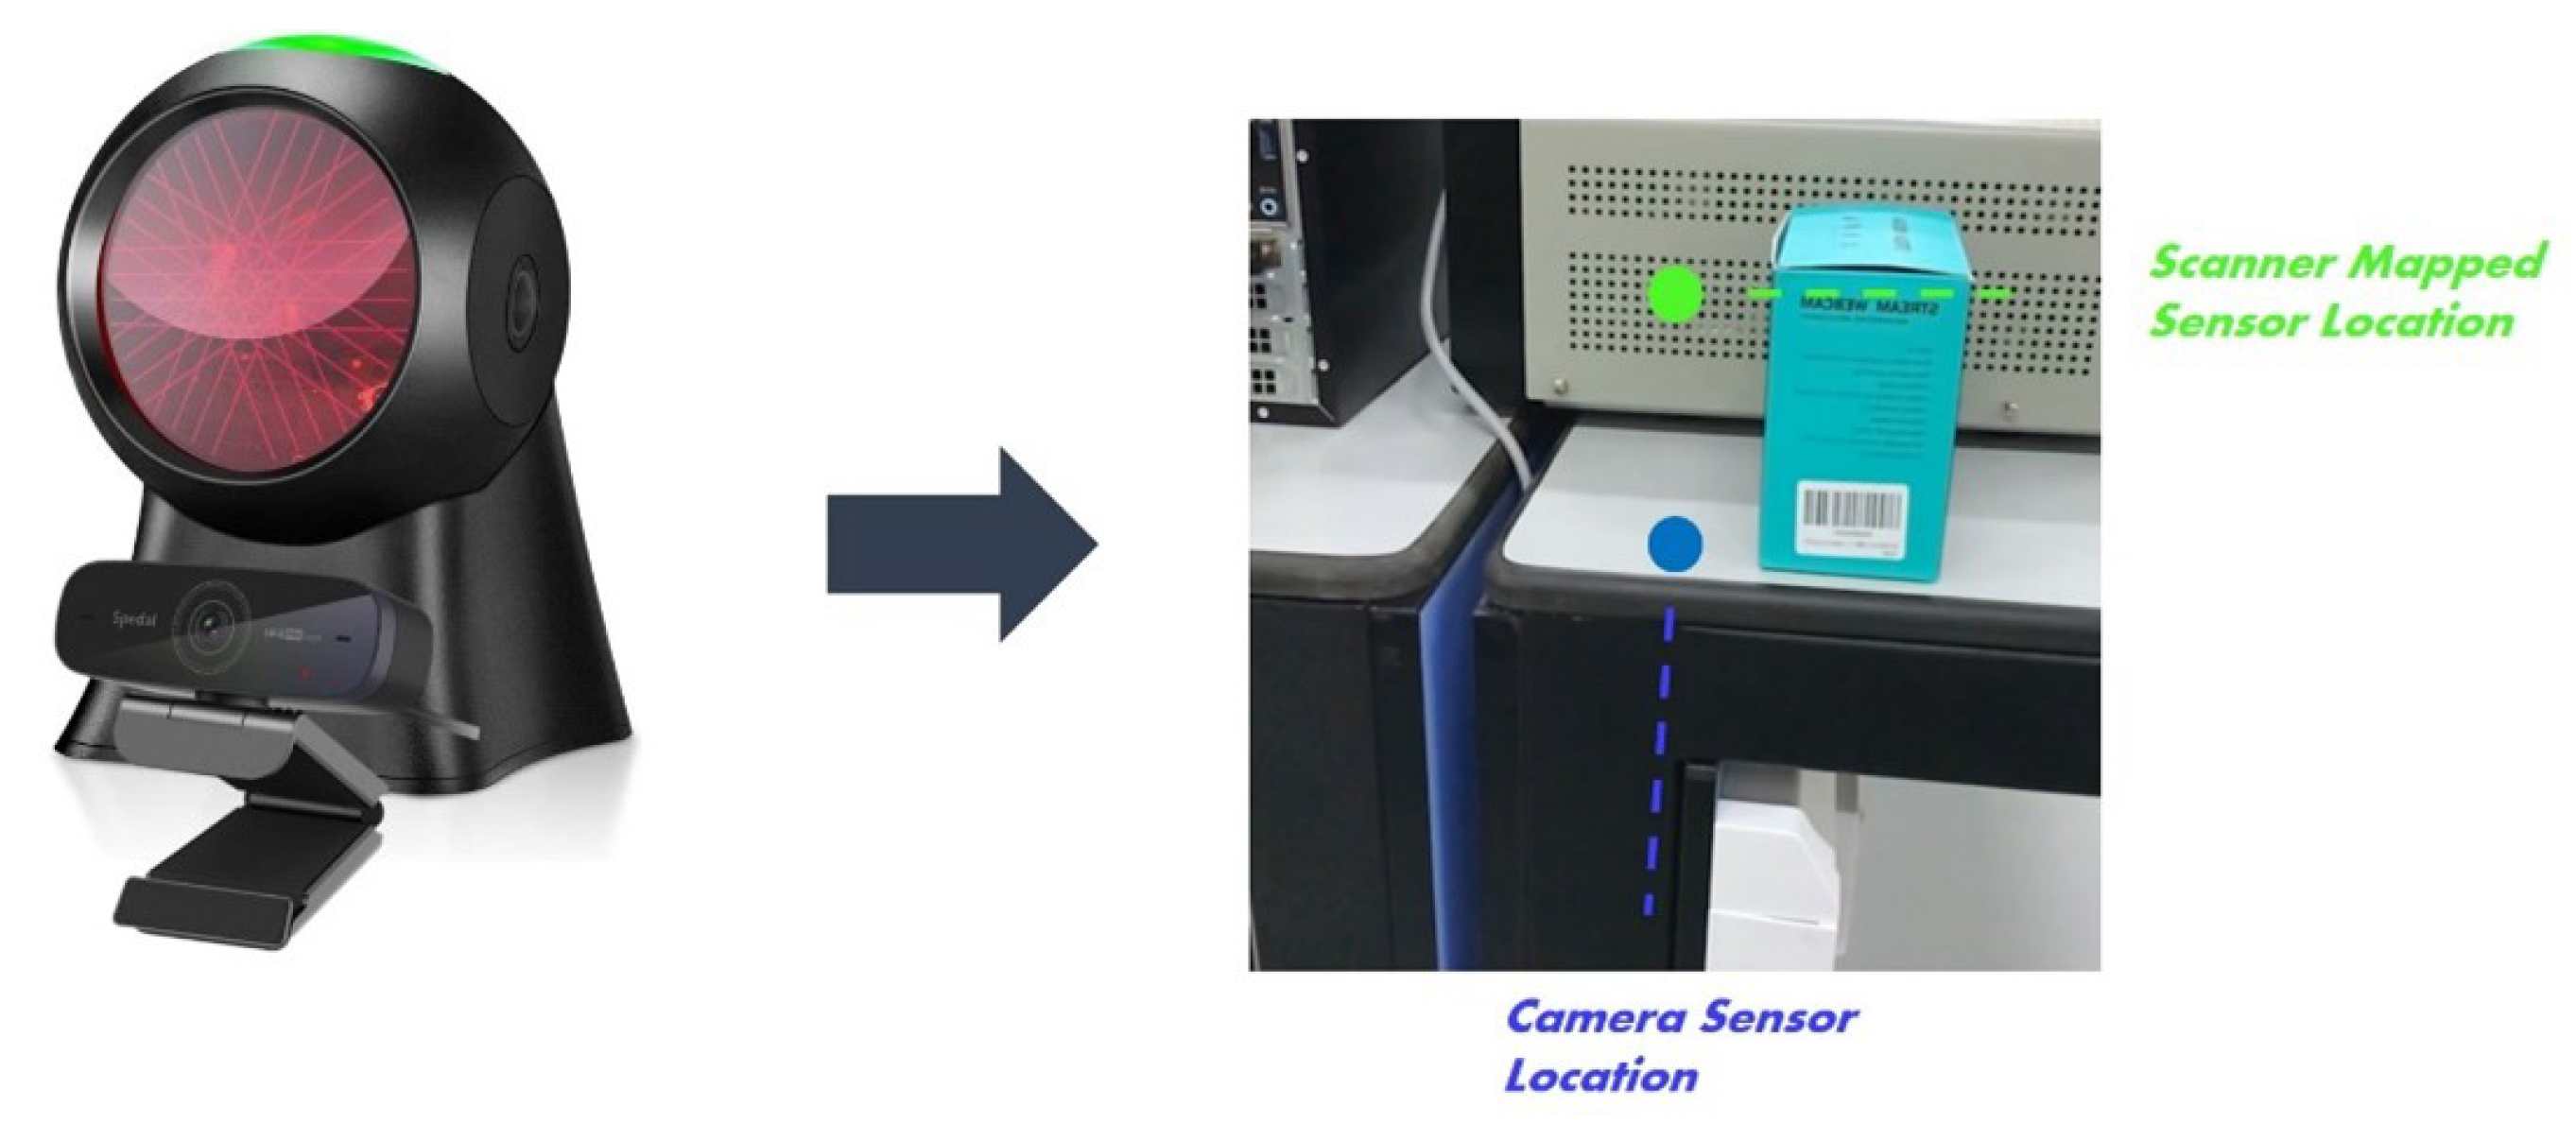
Figure 12. We want to have the center of the barcode be aligned with the scanner. The actual location of the scanner with respect to the center of the camera is mapped into the camera frame, ignoring the difference in depth between the sensor of the camera and the sensor of the scanner as shown in
Figure 13.
We set the system input to zero since we want the barcode centroid to align with the center of the scanner. However, we allow a suppression threshold for the difference between both, so if the distance signal in the figure is less than 20 pixels, it is set to zero. This is because the detection system does not return perfect feedback, as the bounding box around the barcode keeps changing slightly, due to the small fluctuations in the scene.
The closed-loop with the PID is applied twice—once for each axis—so the distance is calculated in only one dimension.
3.6. Validation
The validation system is composed of computer vision–based and load cells–based subsystems to detect items and validate them, using weight and features. Firstly, the existence of a new item in the cart is detected by GMM and Kalman filter applied to the scene of the cart before and after insertion of the item. The item is detected using a camera mounted on the cart, and the weight change is sensed by the load cells mounted at the cart’s base. SURF point features of the item are then extracted. The features together with the weight are then compared to those of the item with the barcode, which is lastly scanned and obtained from the database to measure the item’s validity. The feature points extracted by SURF are mainly dependent on patterns and structures, and for this reason, the hue value of the position of every feature point from the HSI color space is used to add color matching to the system. The system’s output determines whether or not the item detected is the same as the item scanned. It is worth mentioning that the system does not move forward with the validation stage if there is a detection but no recent barcode is scanned.
3.6.1. Item Detection and Tracking: GMM and Kalman Filter
Items detection in the cart is implemented by eliminating the image’s background segment, leaving only the foreground segment. The main obstacle of the process is deciding whether the pixels in the image belong to the foreground or background. Segmentation by standard background subtraction using a static background, such as the first frame, would be subject to any insignificant changes. Regarding the problem at hand, the view inside of the cart keeps changing with every new item introduced. Thus, it is crucial to have an updated background with every new variation in the scene of the cart. The best approach for executing the process is to model the background by learning previous information to be adaptive to different forms that the background can have over a specific time. The foreground detection algorithm utilized in this project is based on Gaussian mixture modeling (GMM) [
26].
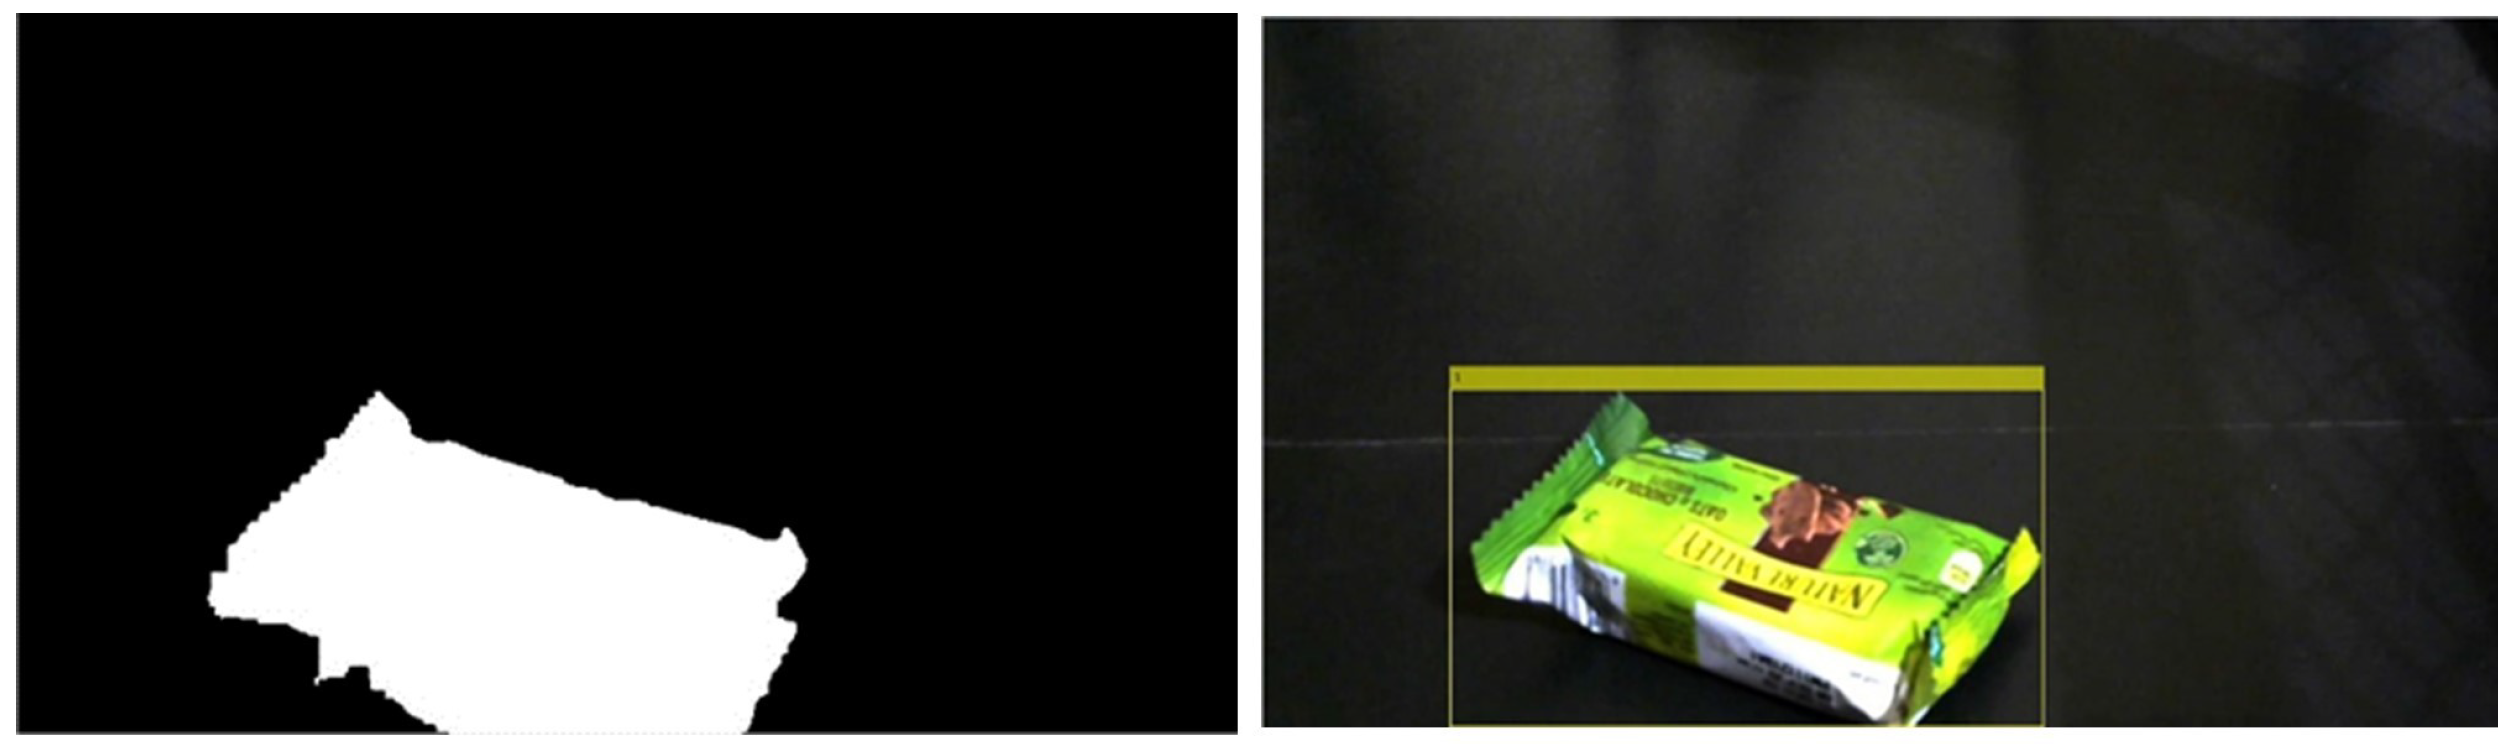
Figure 14 shows the process of item detection and tracking. The method assumes that the background would have the strongest statistical Gaussian distributions compared to the foreground. Relating this to our case, a new item inserted into the scene forms new pixel values that are statistically weak in comparison to the previous values and thus, are detected as the foreground. These new pixel values then increase in strength over time until they become part of the background. There are three distributions,
k, initialized in this implementation, each with a mean
of the same value as the pixel of the first frame, variance
of 900, and a normalized weight
of 0.33. Every distribution in each pixel location of the first frame is updated through
t number of training frames, which for this project, is chosen to be 40. After processing all of the training frames, the background model is constructed, using minimum number
b of distributions that would be efficient to satisfy the condition shown in (
8), where threshold
T is selected to be 0.7. As the process moves forward with foreground detection, the model is updated with the background’s changing structure, leading to a robust technique for moving-objects detection.
Kalman filter is used for tracking moving items once they are inserted inside the cart to the rest point. The Kalman filter consists of two updating operations dependent on each other: one is prediction, and the other is correction. The equations used for prediction are Equations (
18) and (
19), where
is the state—in our implementation, it is considered the location and initialized by the centroid of the object detected in the current frame.
A is the state transition set in the form of a block diagonal matrix of identical submatrices of [1 1; 0 1],
B is the control model and given a value of 0,
P is the state estimation error covariance and is initialized by [200, 50], and
Q is the process noise covariance, set at [100, 25]. The equations used for correction are Equations (
20)–(
22) where
K is the Kalman gain,
H is the measurement model set in the form same as
A but with submatrices of [1 0], and
z is the correct location obtained from the centroid of the object in the next frame.
As observed, the prediction and correction formulas depend on specific criteria that are impossible to be met most of the time, which would cause multiple tracks for the same item. For this reason, the track is assumed to be reliable only if it has existed for 30 frames or more, which is about 1 s of detection at 30 FPS. The system then waits for another 10 frames after any detection of the item being tracked. This concludes the detection stage, where the item is stationary inside the cart.
3.6.2. Item Validation: SURF, HSI and Load-Cells
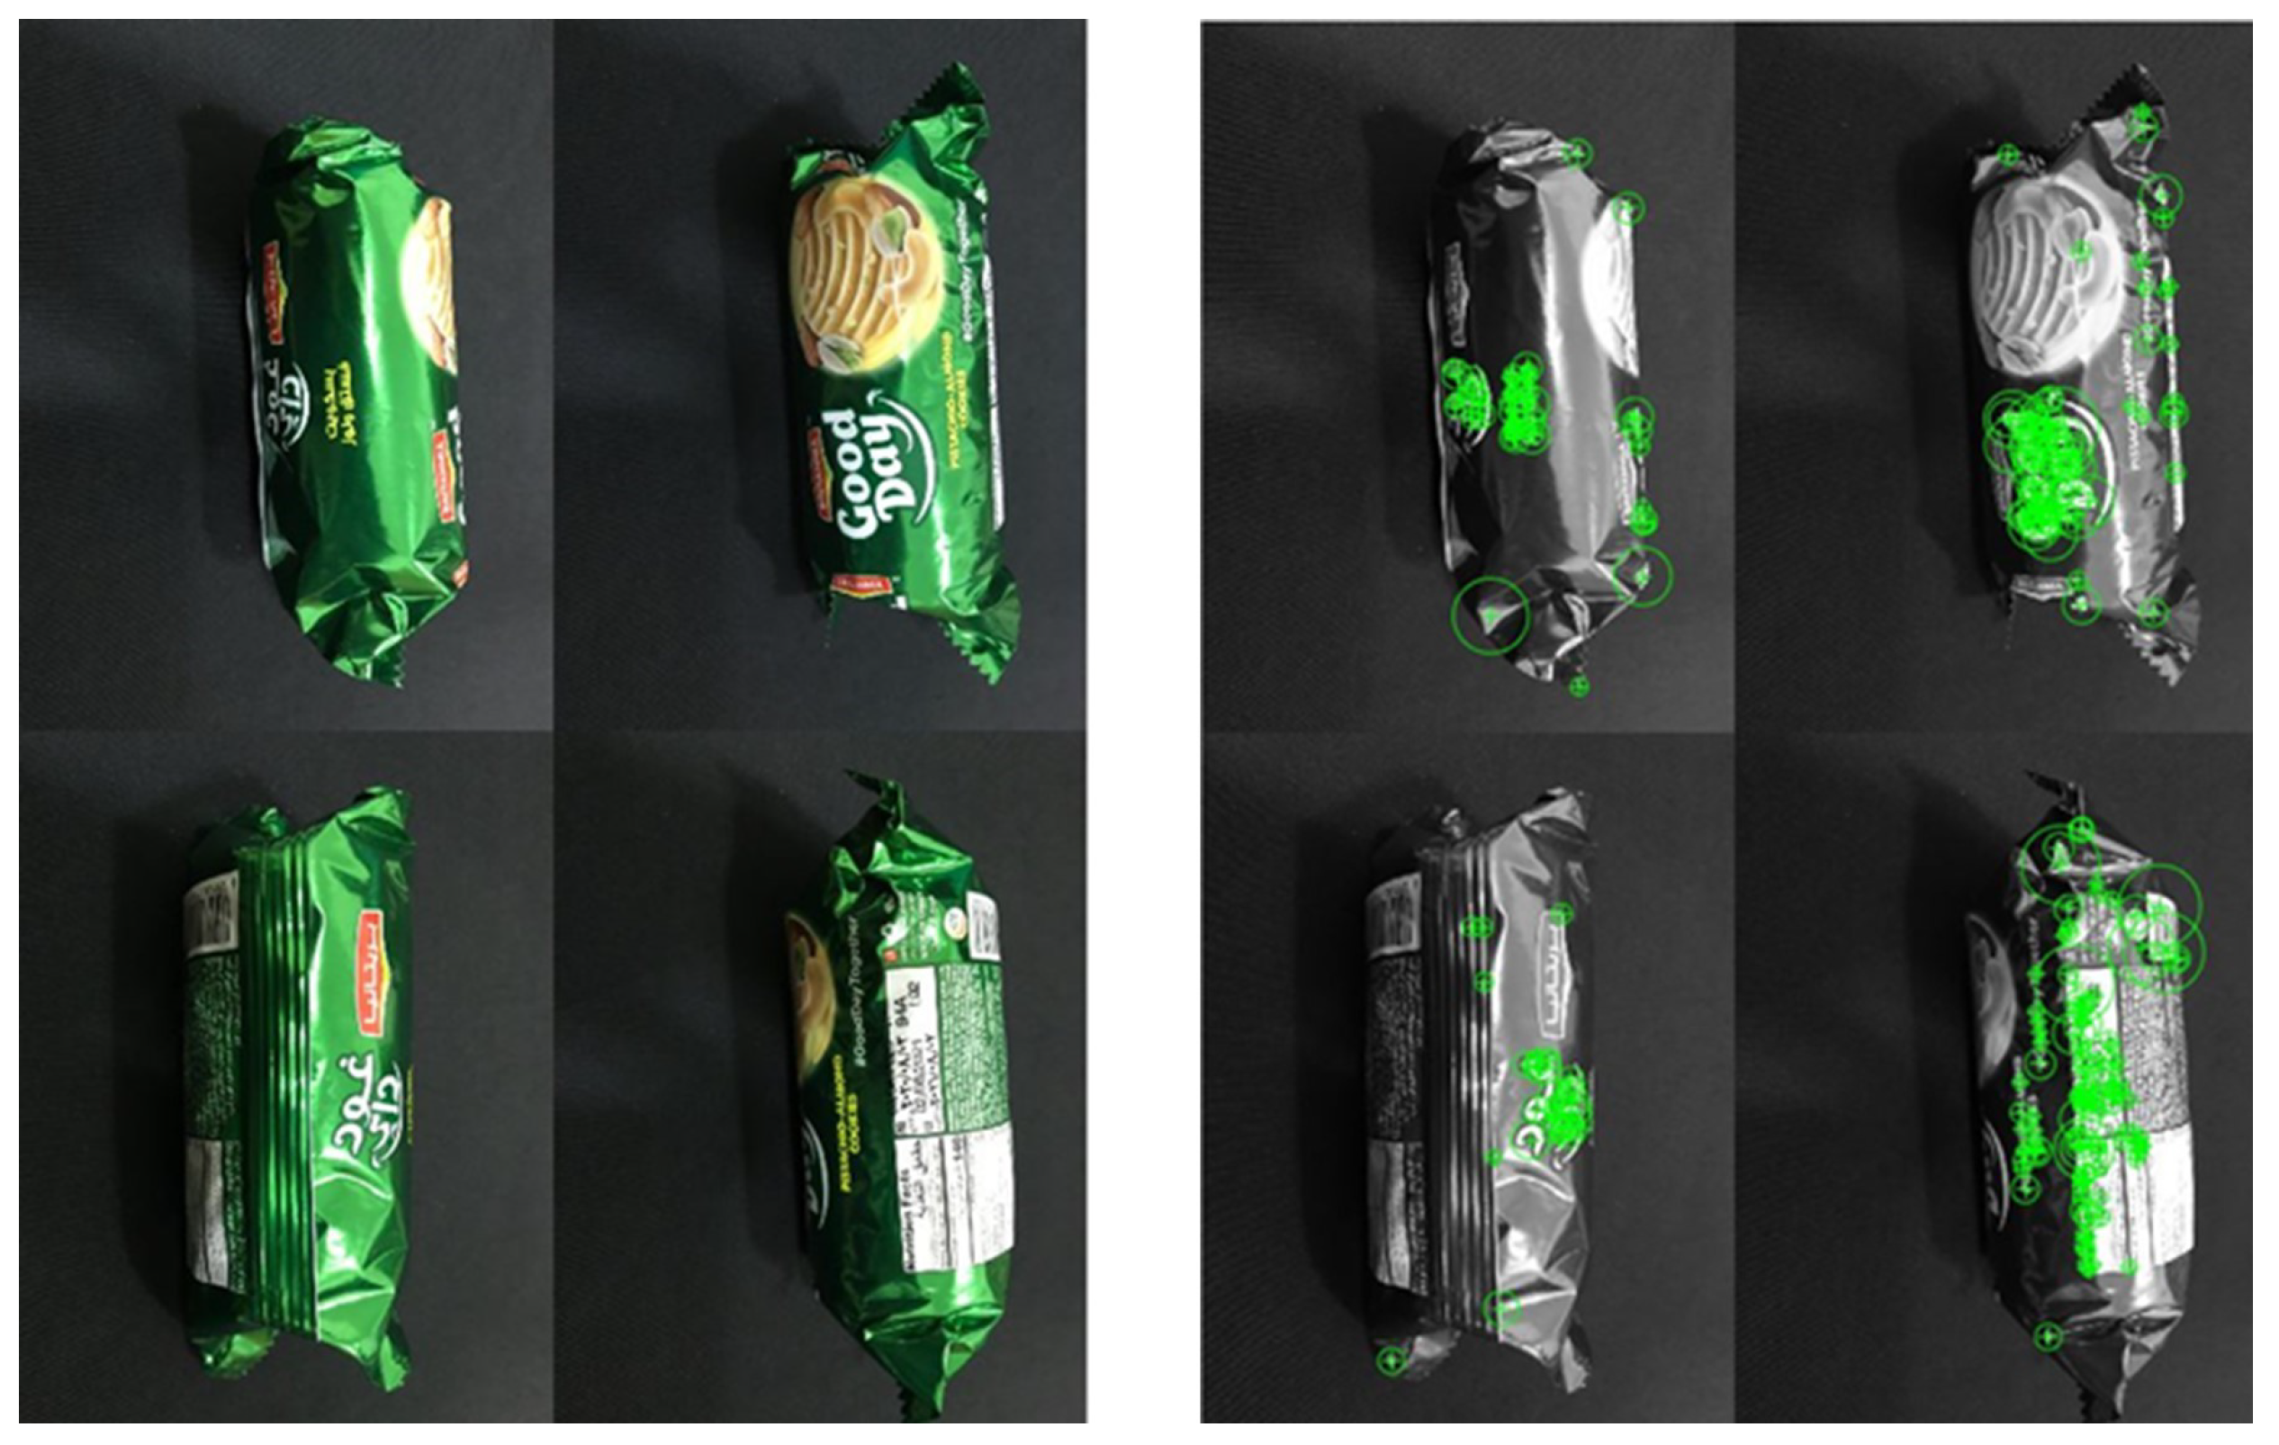
The validation of the item is performed, using SURF features matching combined with the value of hue obtained from the HSI color space for appearance similarities and load cells for matching weight. The database added to the system includes the weight, the feature points and the hue value of those points.
Figure 15 shows a sample of the SURF features extracted from images taken from different sides of one item and stored in the database. Feature points of the region detected of the item are extracted and matched with those of the item that has been scanned, obtained from the database. Finally, the item inserted and the item scanned are considered the same if they have 20 or more matched features.
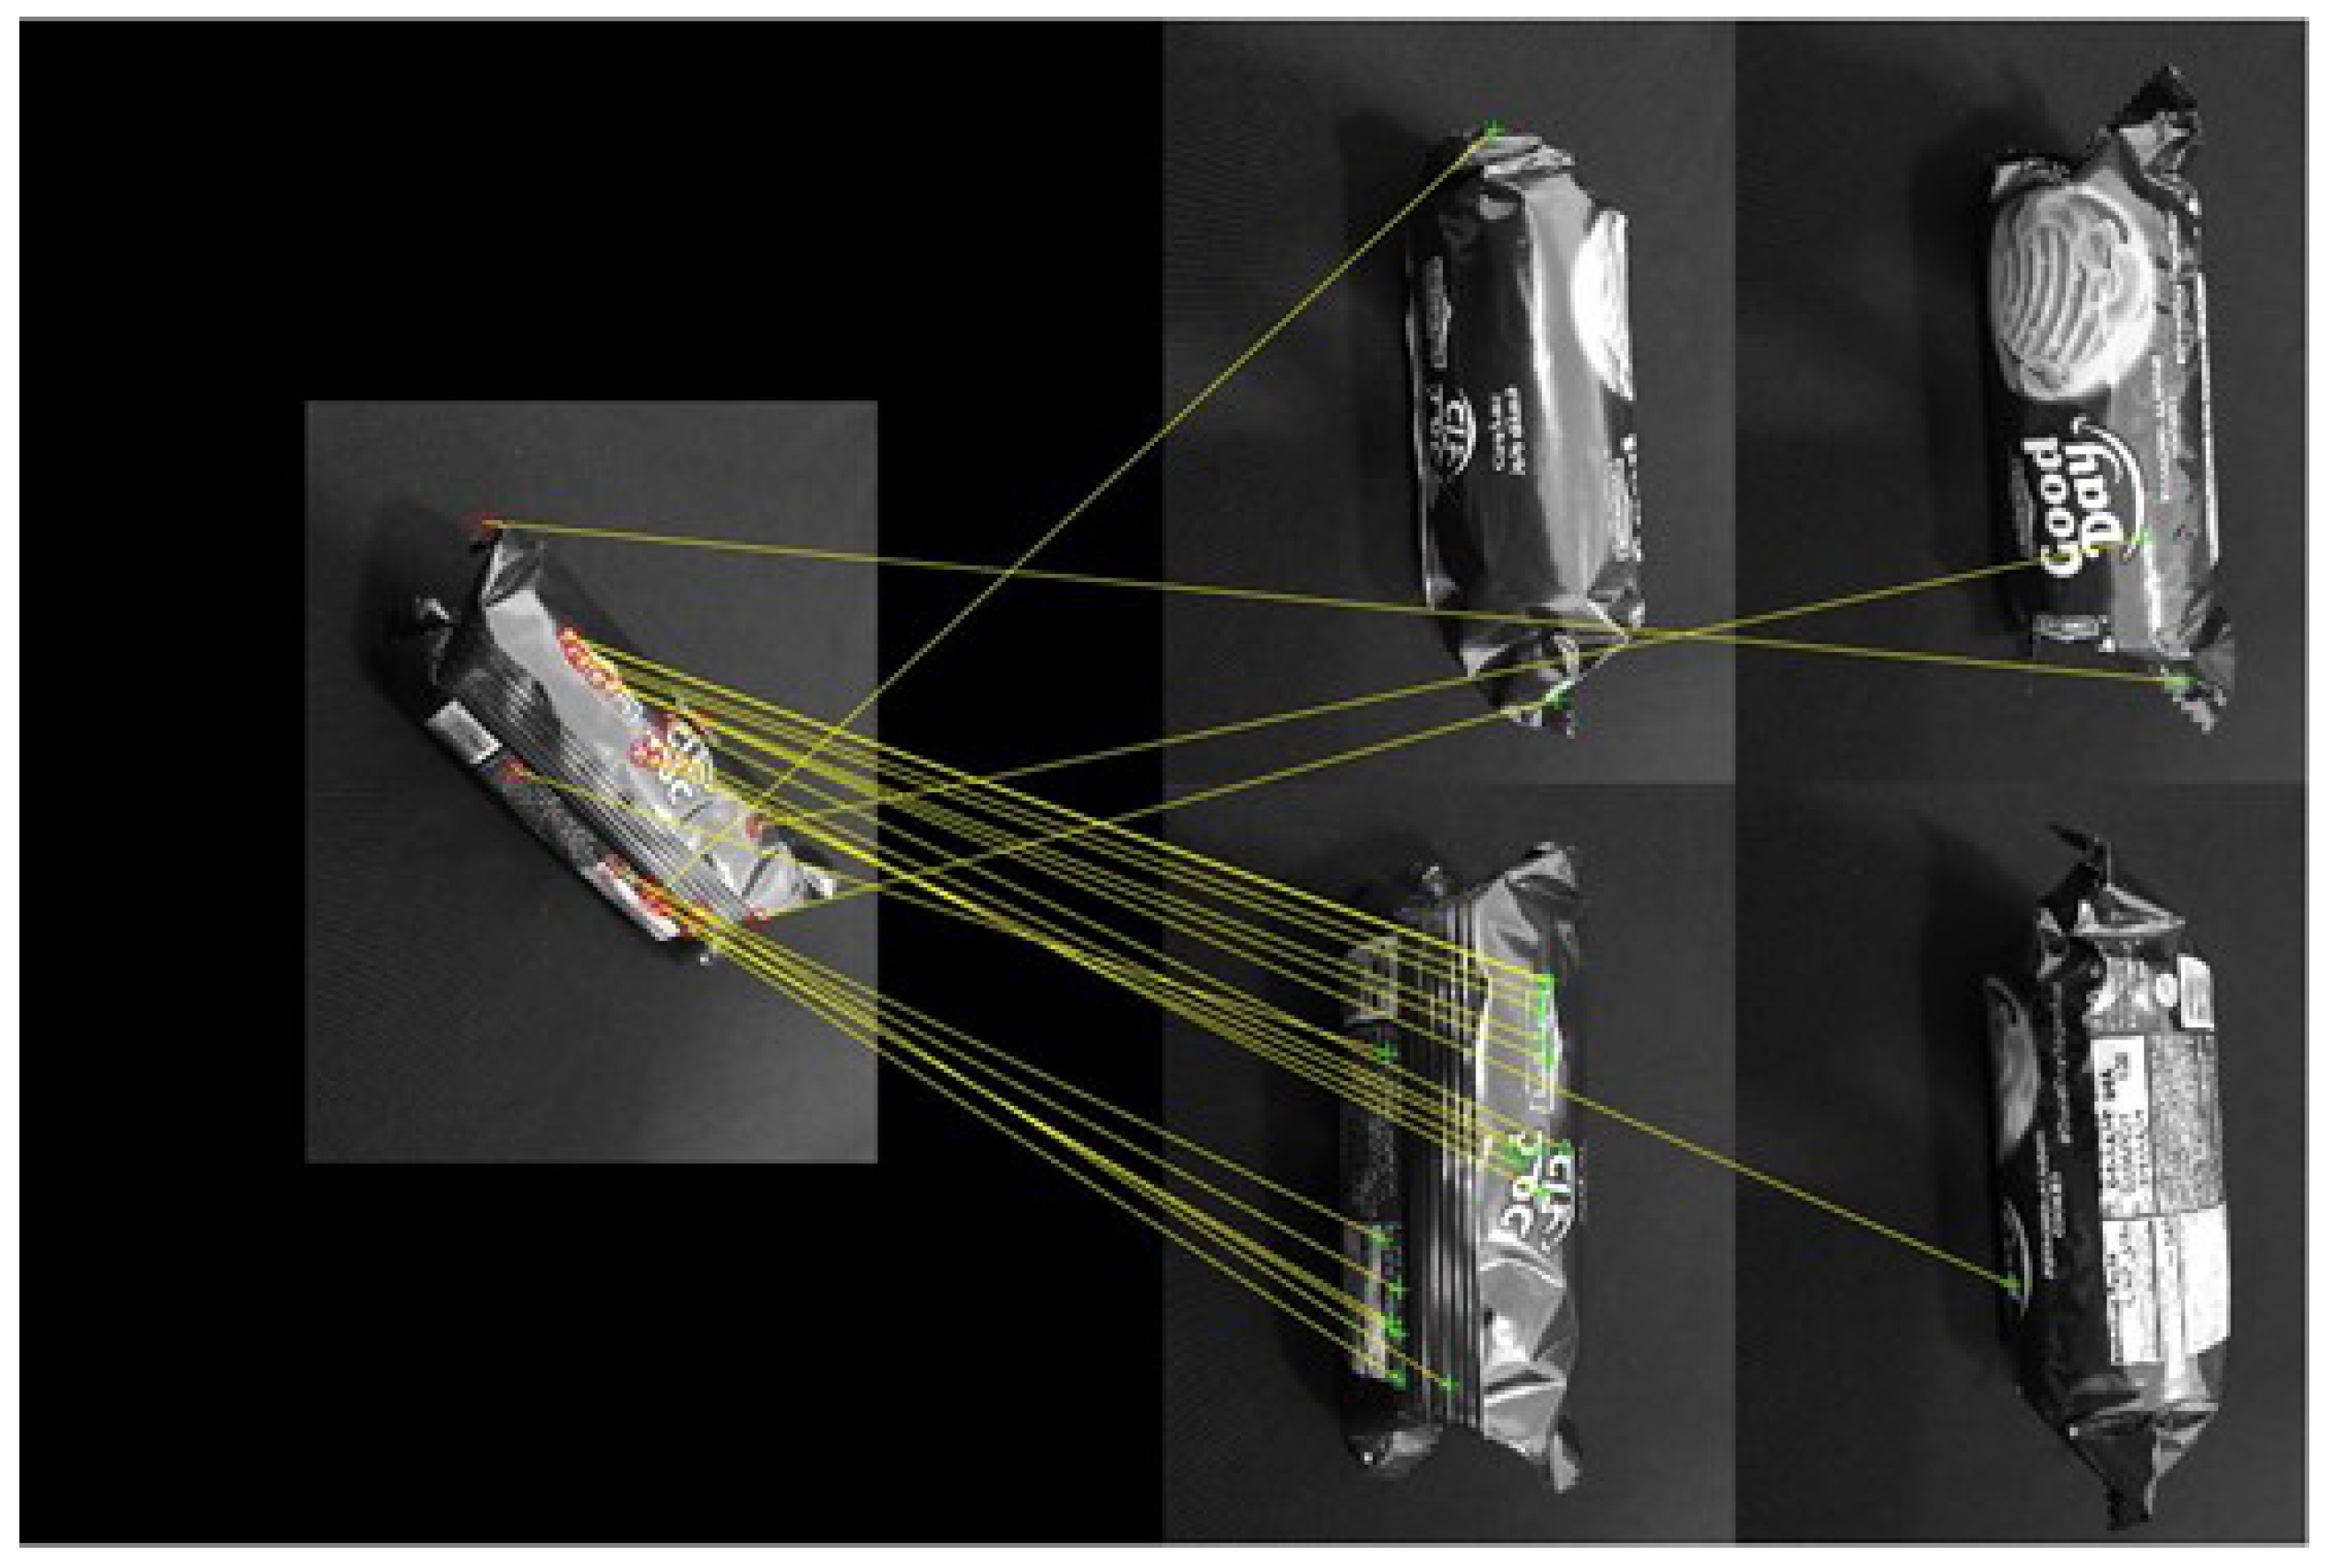
Figure 16 and
Figure 17 show the process of extracting features and matching them with the features of the item stored in the database.
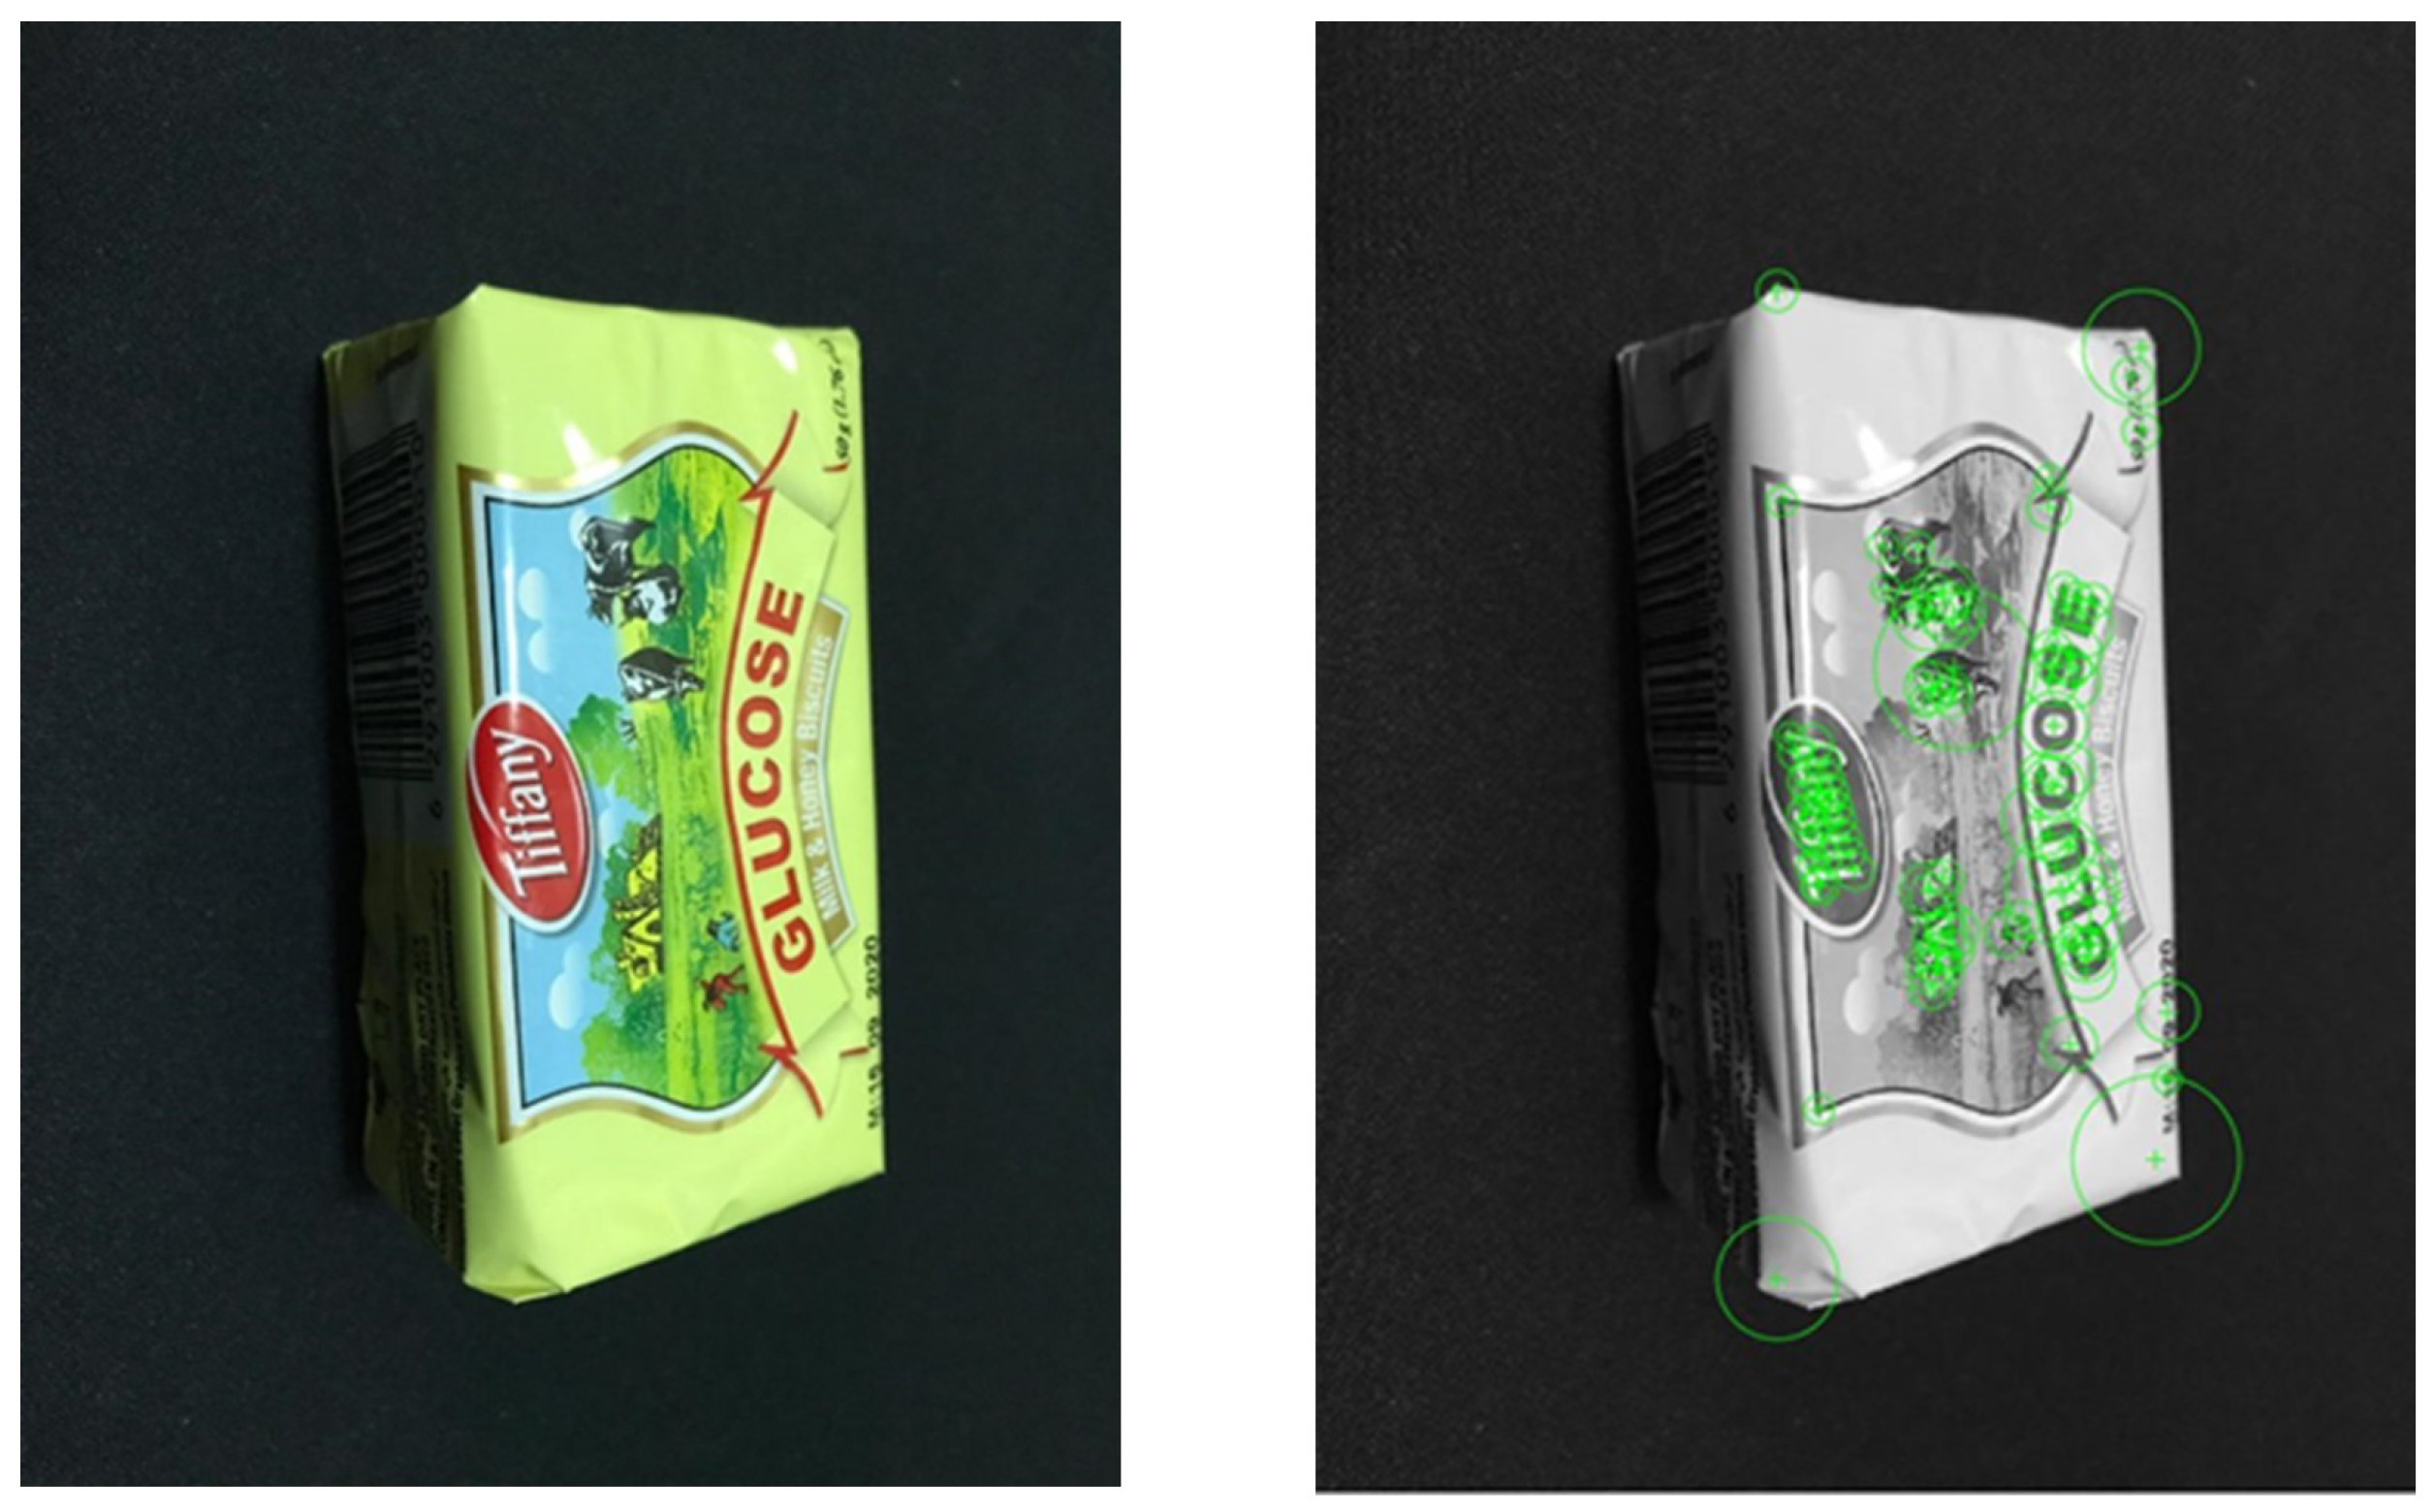
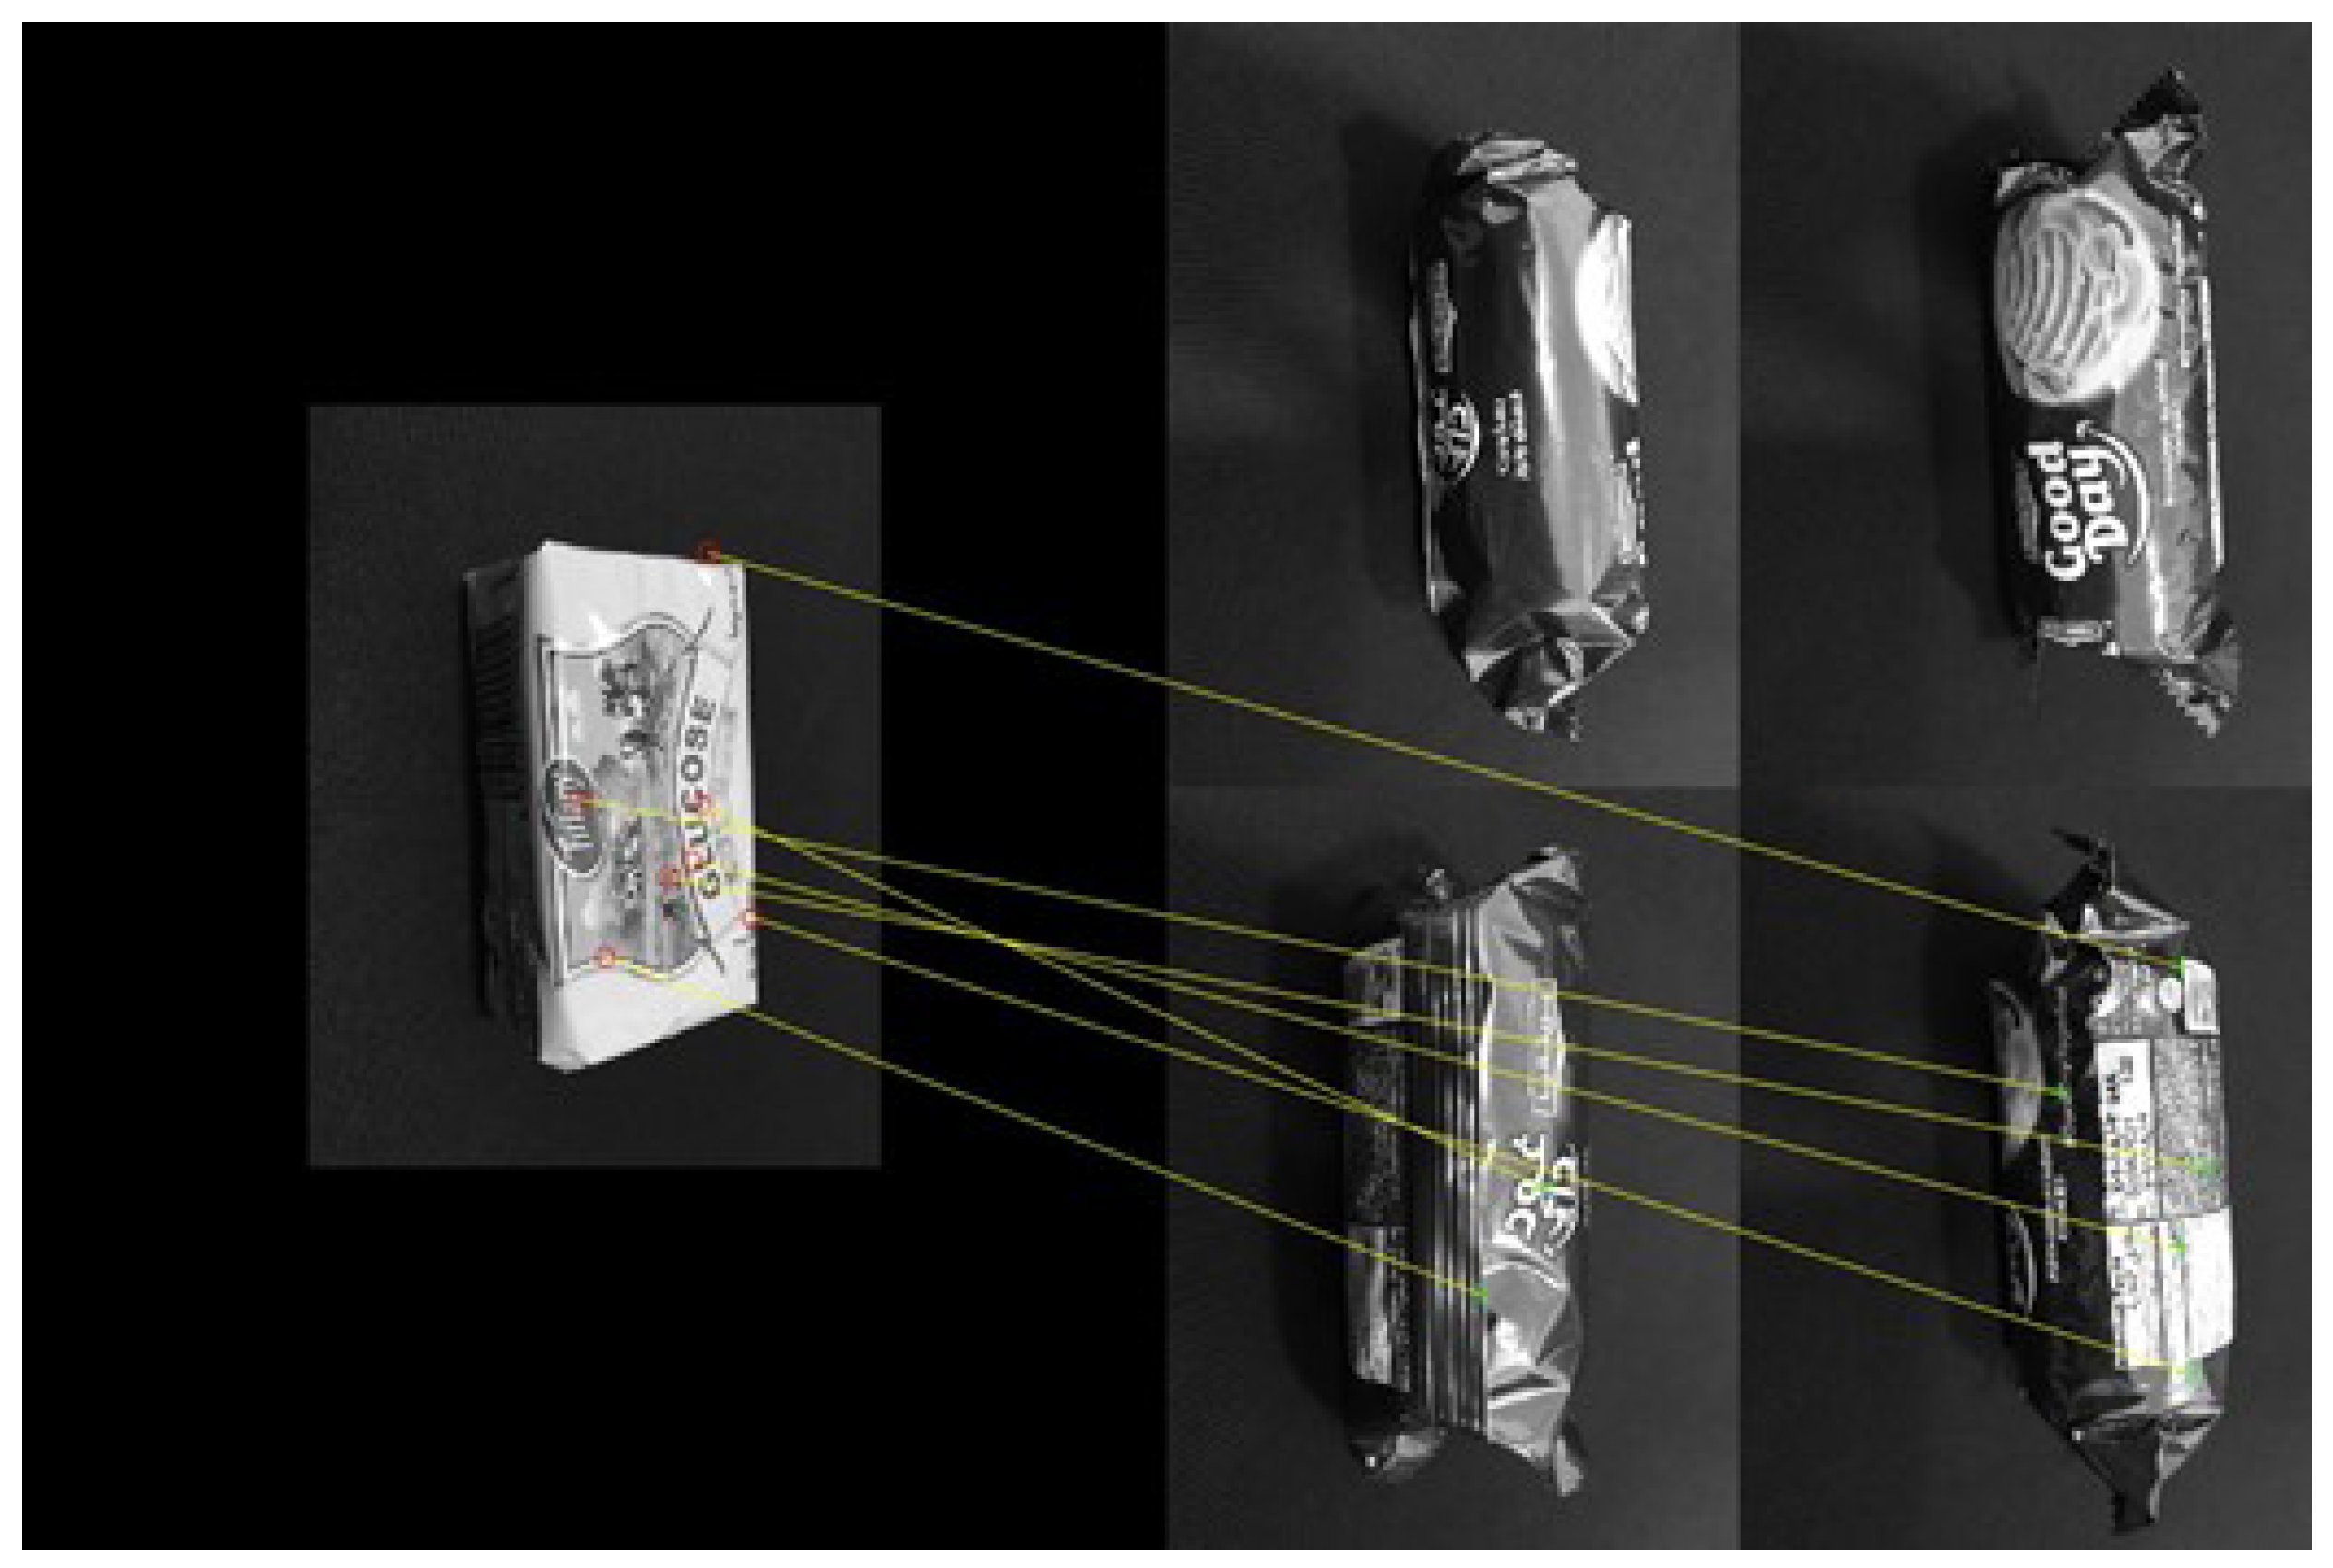
Figure 18 and
Figure 19 show the same process but with a different item. It can be observed that the number of the matched features is very much lower than the one of the similar items.
Figure 20 shows the Wheatstone bridge schematic of the load cells circuit. The signals obtained from the sensors are amplified and sent to the Arduino microcontroller. Each load cell is rated at 1 kg, adding up to a total of 4 kg capacity. A new item is assumed to be detected if the weight difference is more than 20 g, considering no item can have a lower weight. The weight of the item in the cart is compared to the one scanned with an accuracy of 5 g.
Figure 21 illustrates a sample result of a correctly validated item.
4. Results
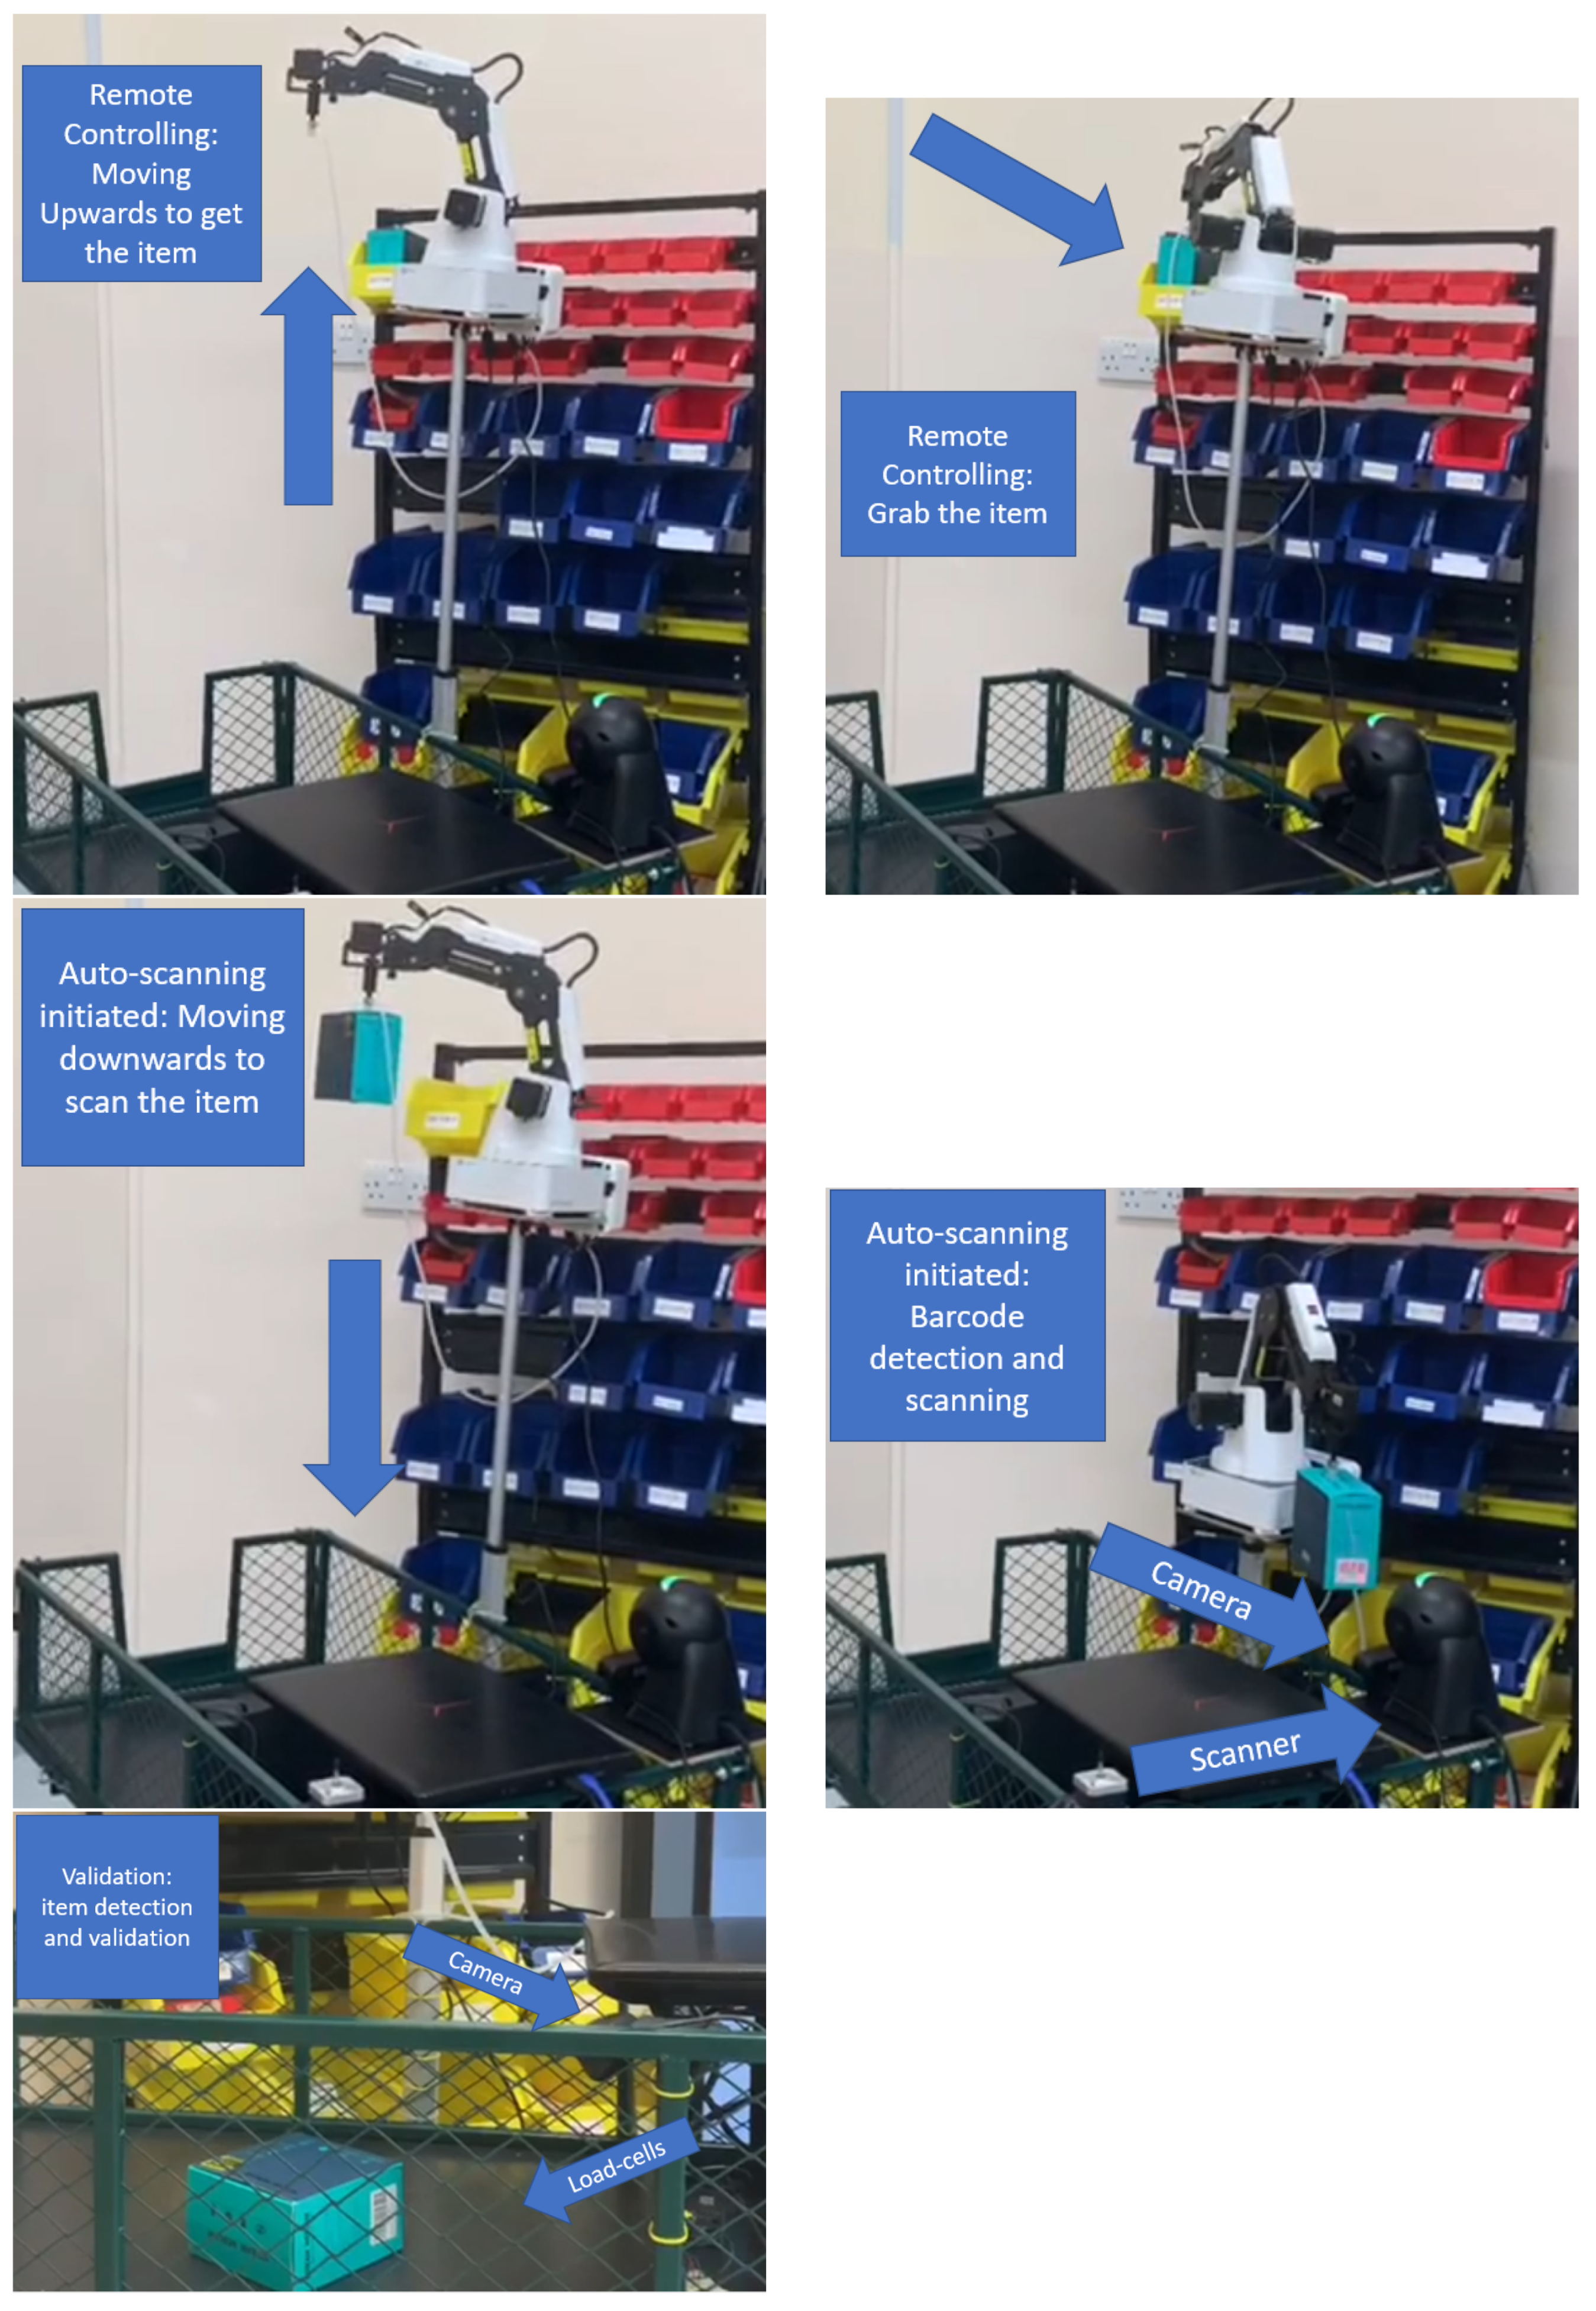
Figure 22 shows the different stages of the proposed approach using a prototype.
In this section, we present the testing results for each of the sub-systems. We tested our robotic arm in both the manual control mode and the automatic mode. Our testing results show that the communication between the gamepad and the microcontroller has a delay of around 10 ms. The execution of the response to that event takes about 45 ms, resulting in a total time of 55 ms, which is acceptable for its application.
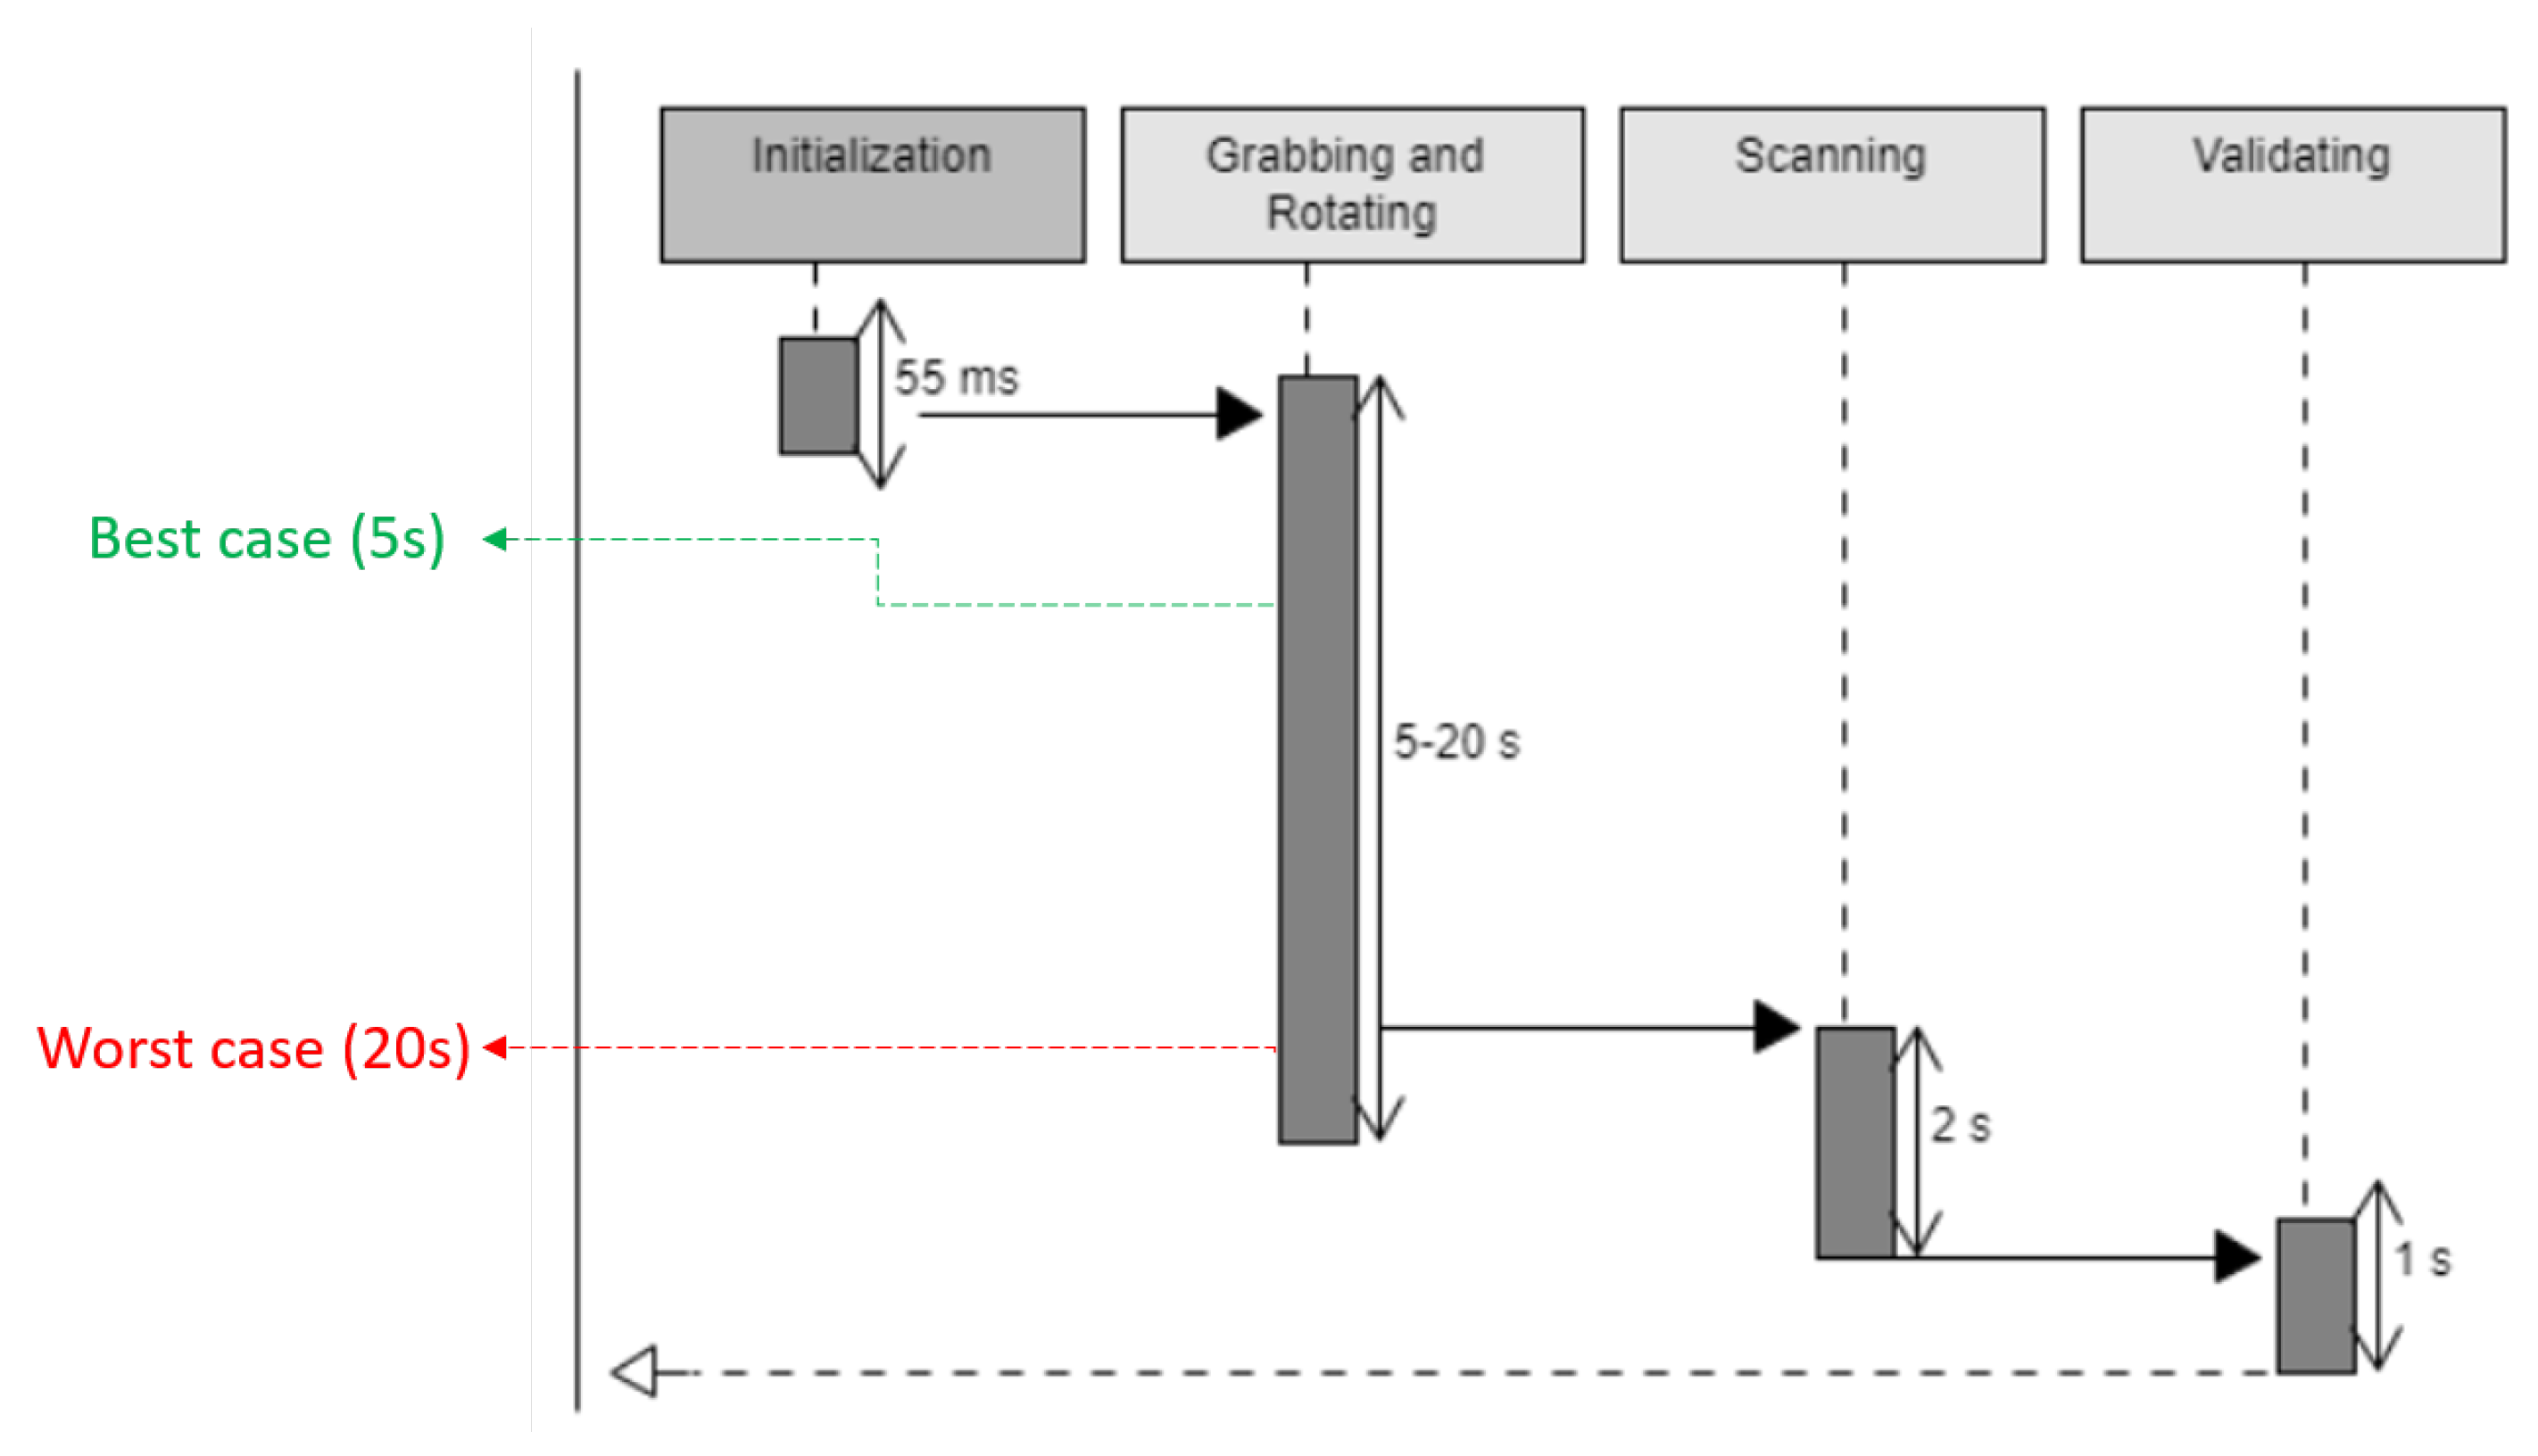
The system takes about 5 to 20 s to obtain an item. The extreme delay occurs, due to the linear actuator speed. Thus, the time consumed highly depends on the height of the location of the item. The system then takes 2 s for scanning the item and 1 s for validation. The execution time of the whole process is presented in
Figure 23.
The precision–recall curve is shown in
Figure 24 and
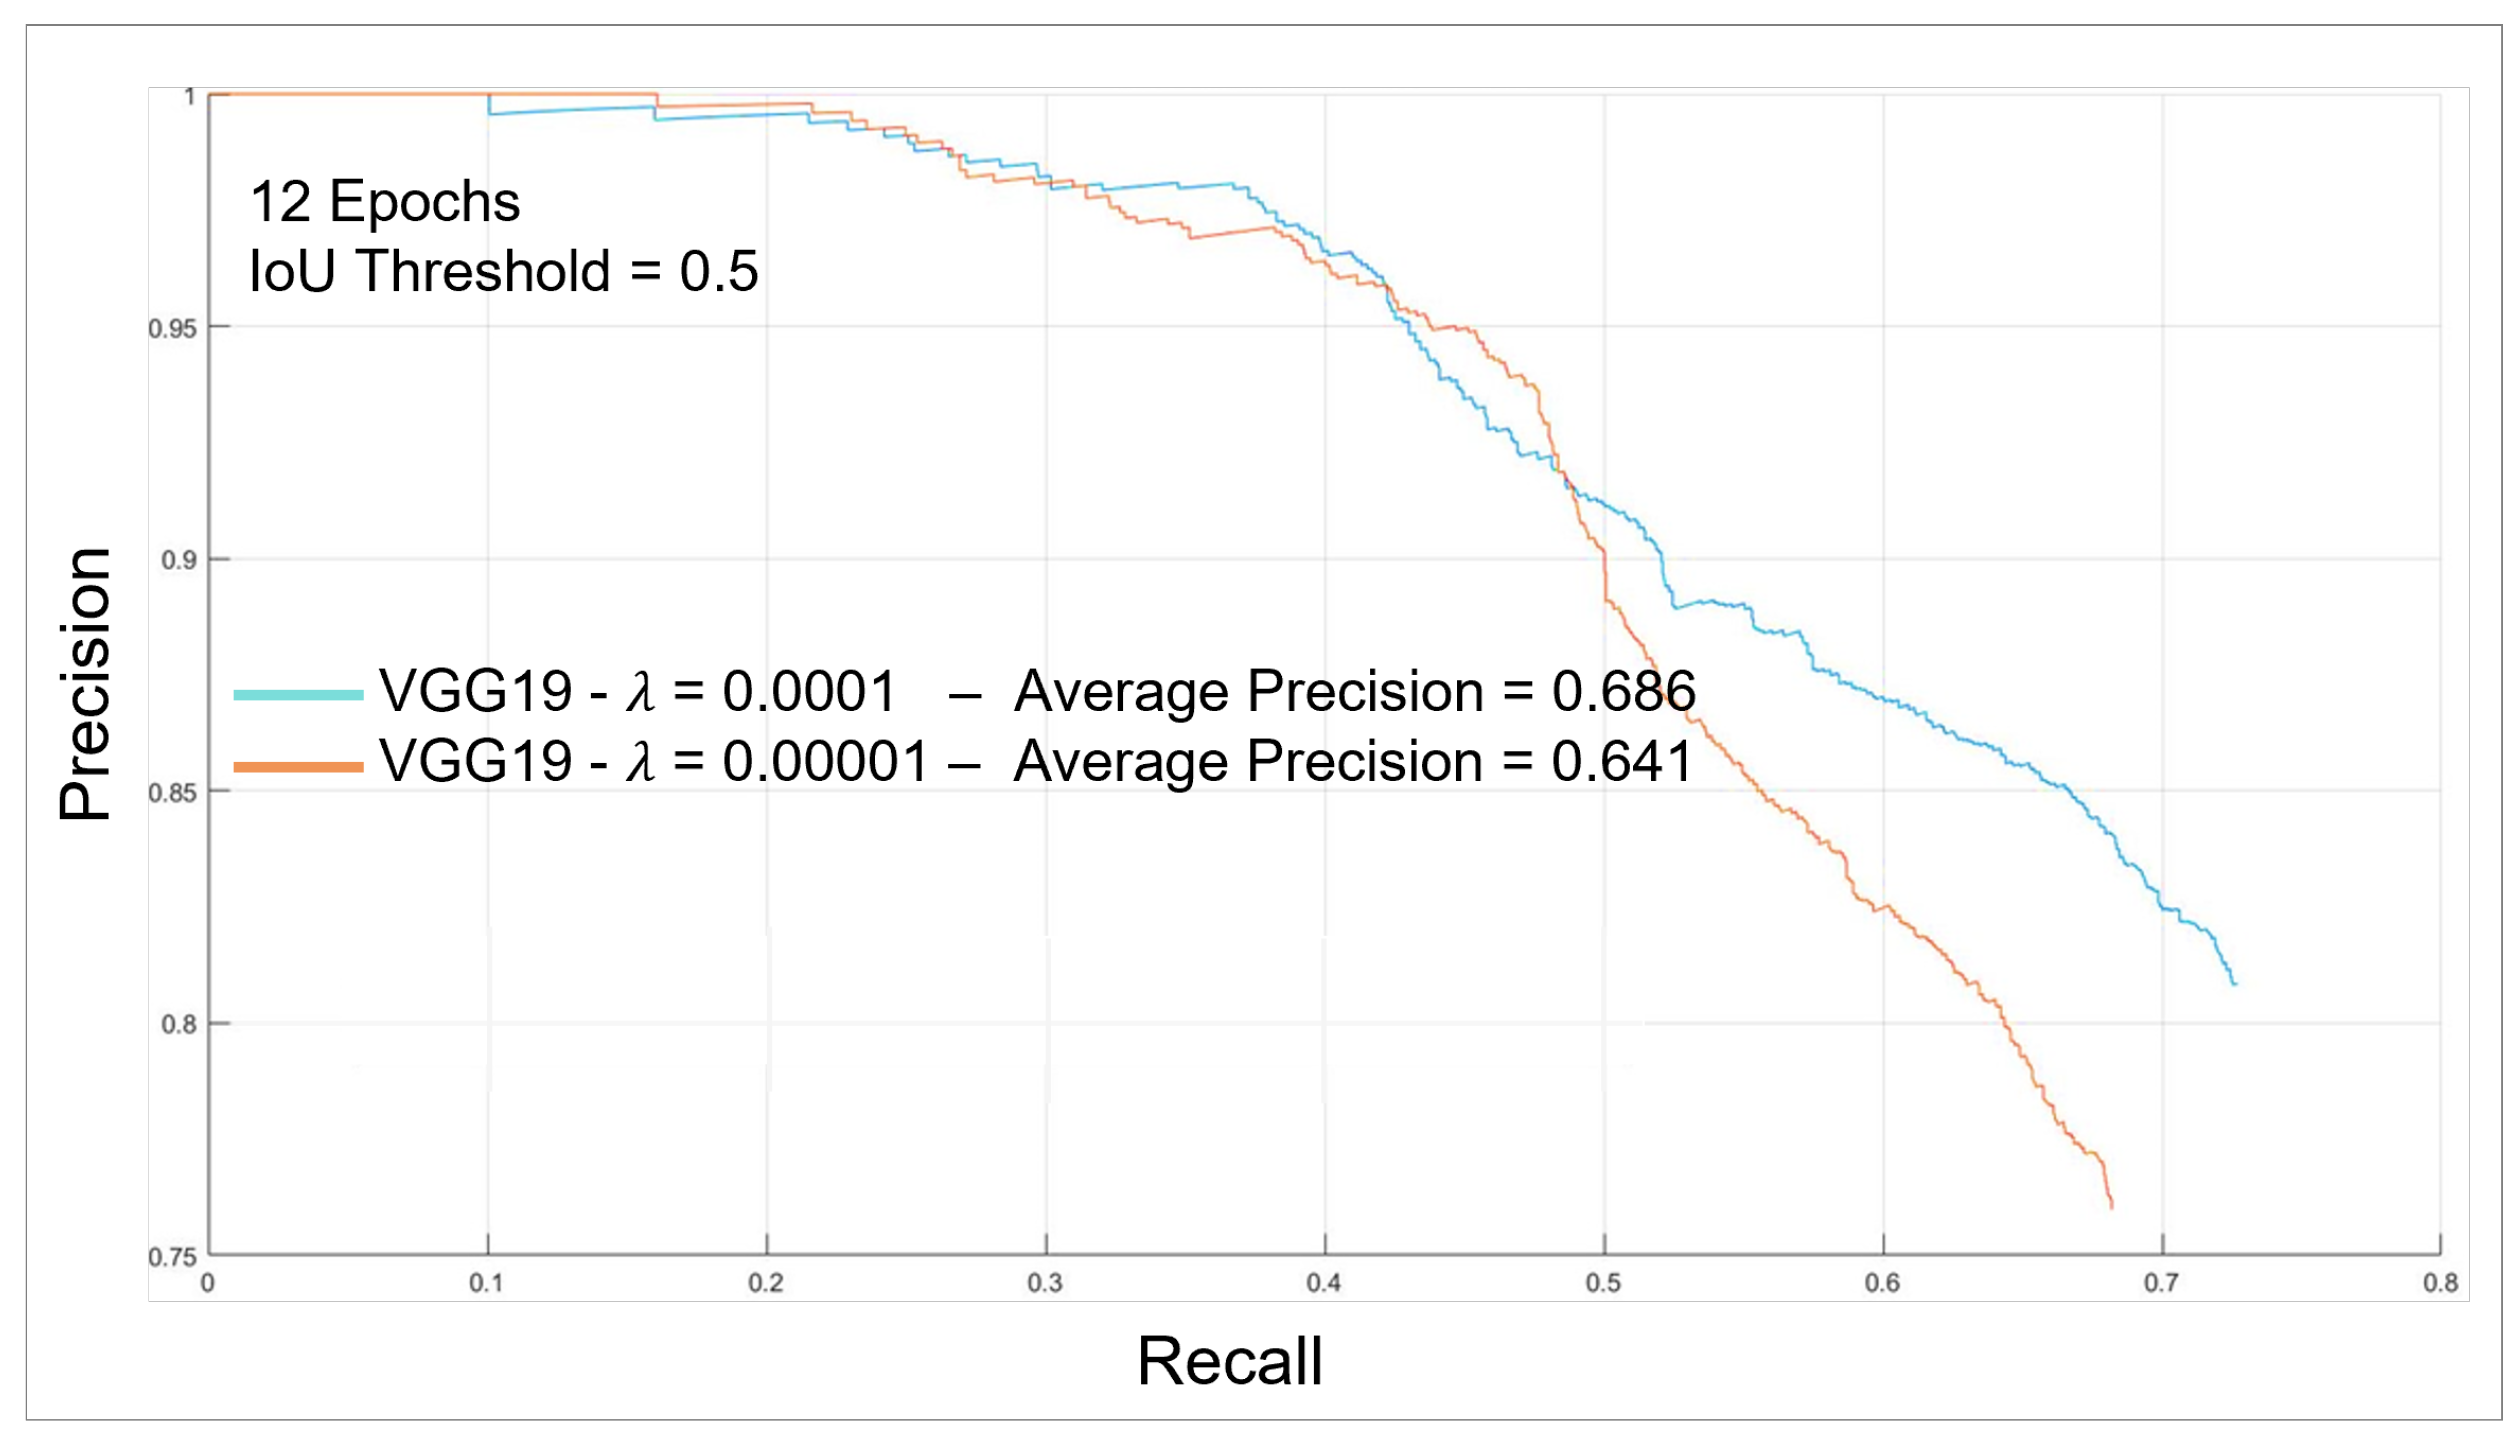
Figure 25 for the two VGG19 networks with different regularization terms. As shown, the model with less regularization was less accurate by 2.4, compared to the first one. We conducted an earlier, similar test, but on a small random portion of the training set, and the network showed better performance than the current results. This is because decreasing the regularization term helps the model learn on the training data; however, overfitting occurs when it is too low, and testing on the same set provides misleading results. Training on high resulted in poor performance in earlier tests due to underfitting, as the data could not be learned sufficiently from the training set.
By increasing the threshold as in
Figure 25, we can see that the mAP score decreased from 94.7% to 68.6%, as many bounding boxes with low confidence scores are ignored, even if they represent correct barcode locations. However, we can tolerate a low score in our application since the scanner can scan barcodes without accurate localization of its center. Approximation of the barcode location is sufficient in this case, as shown in
Figure 26 for low and high confidence scores, respectively.
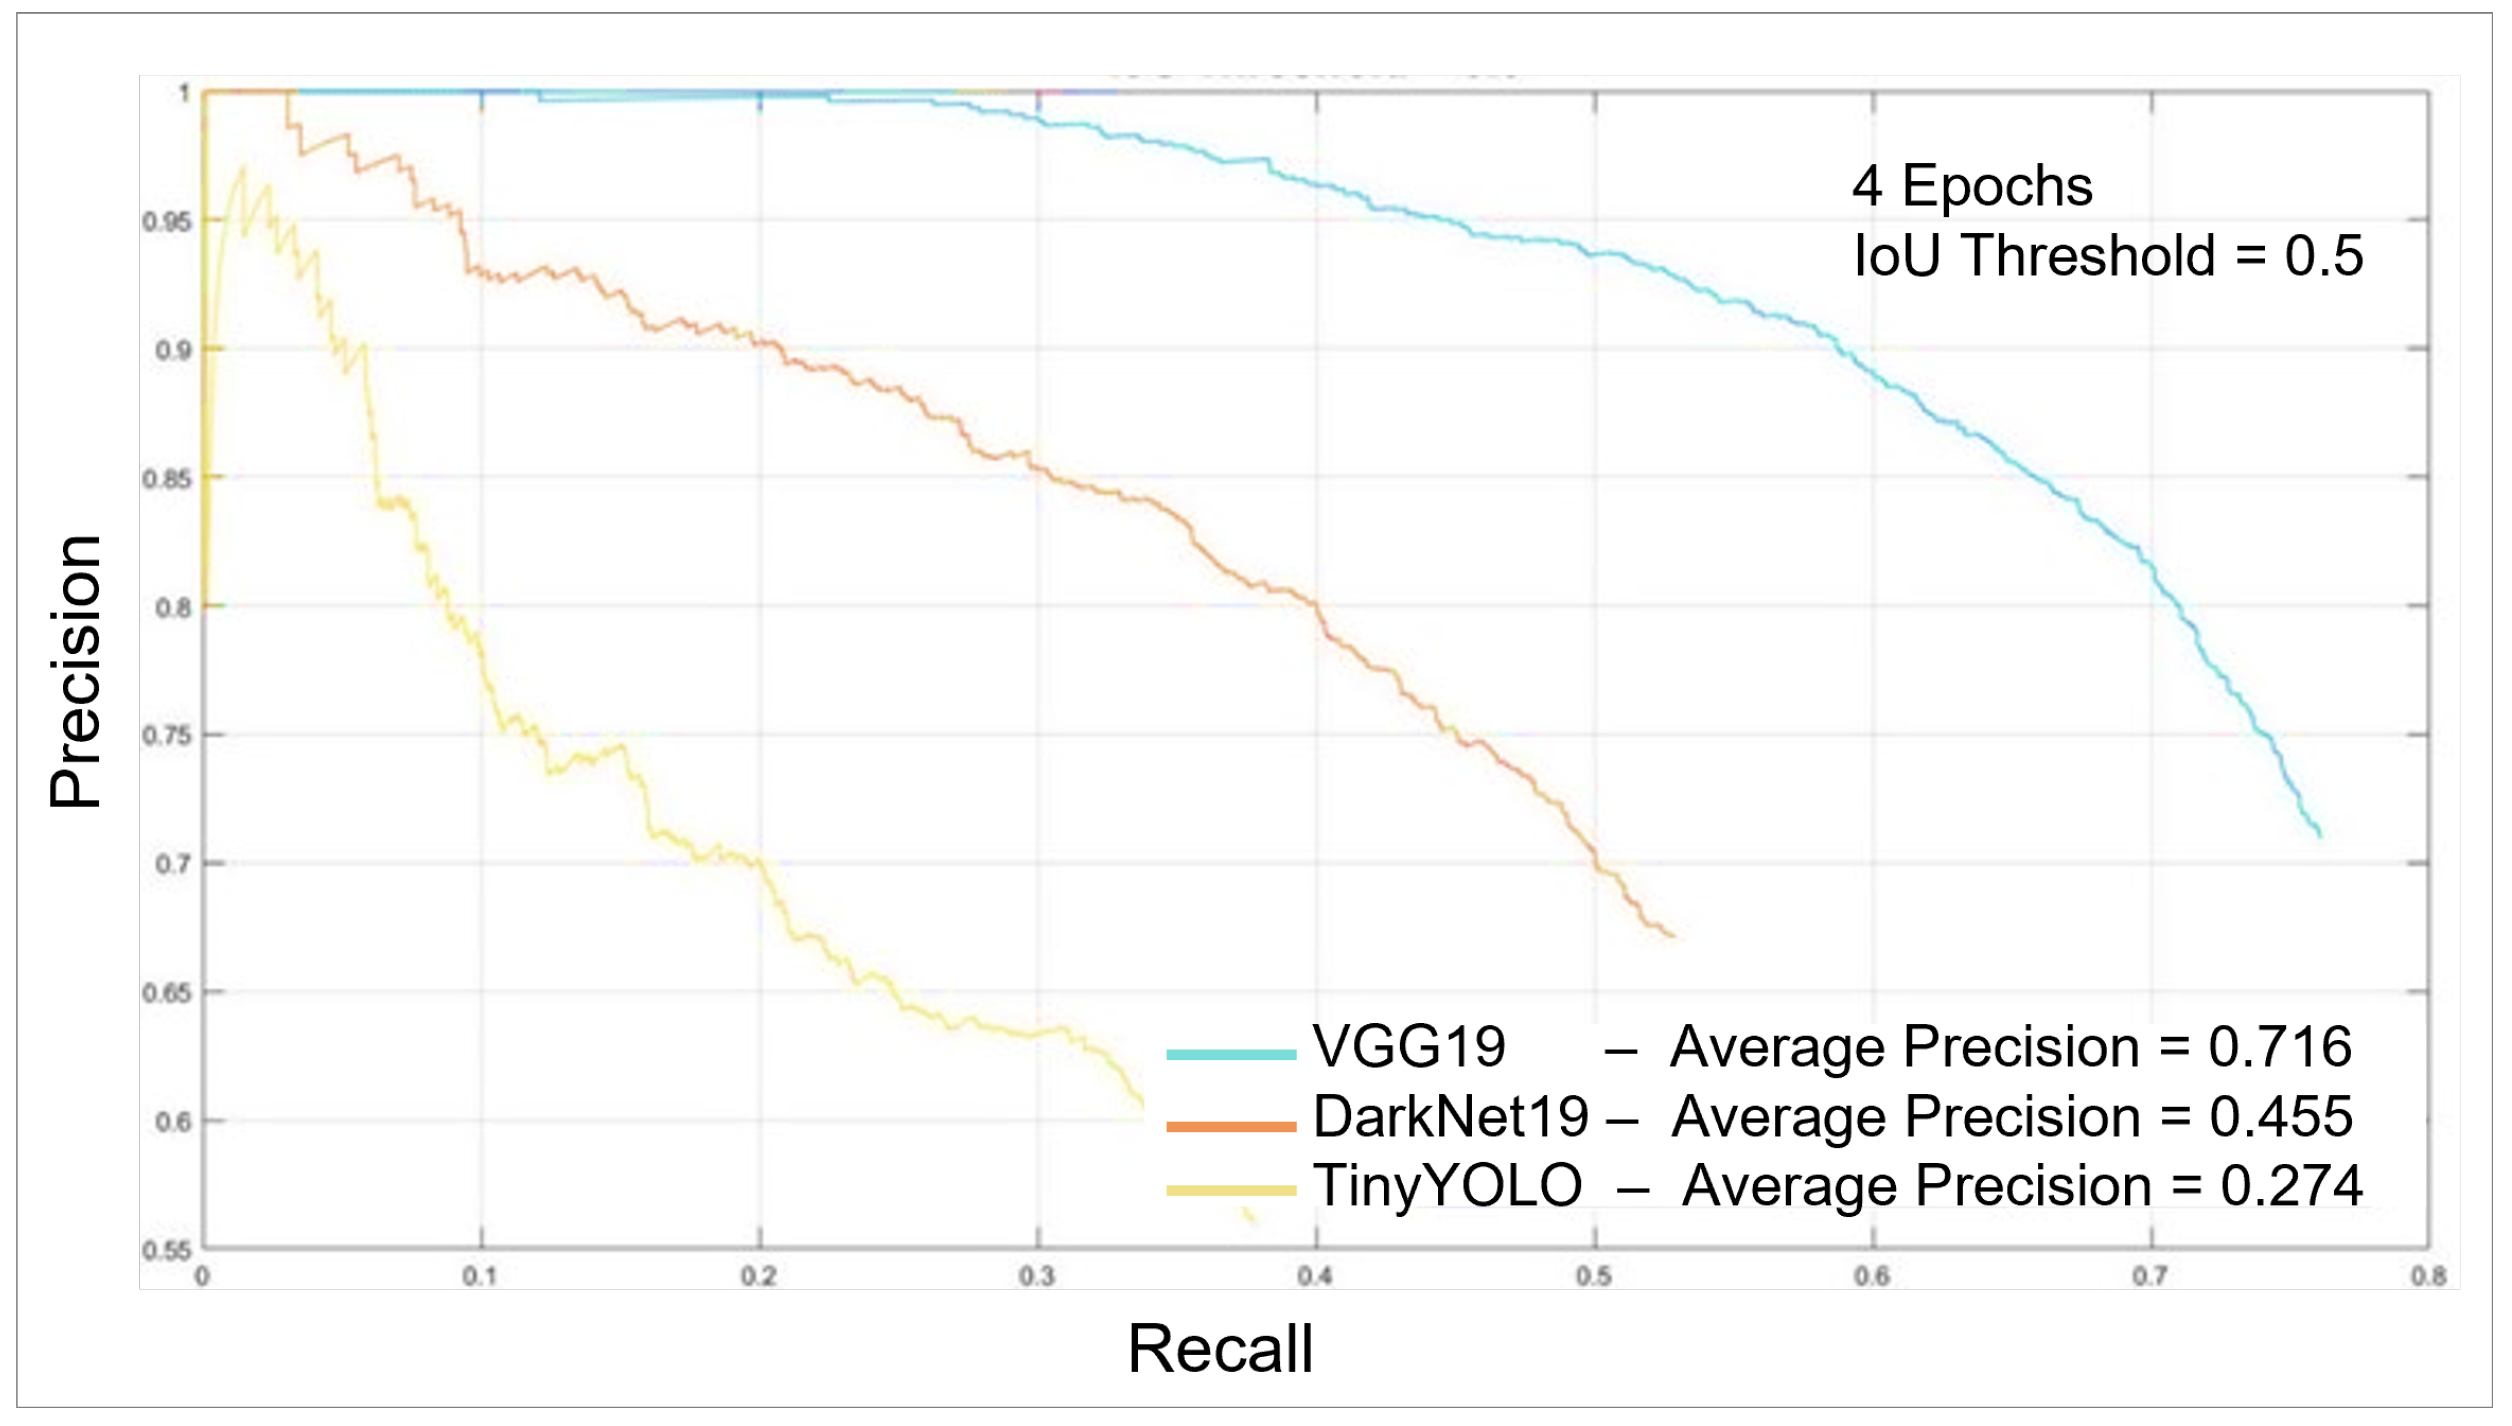
We can see in
Figure 27 that the average precision for the VGG19 network is better by 3% than the same network trained for a longer time. This can be attributed to overfitting after training for too long; however, as depicted in
Figure 28, an increase in the IoU threshold tolerance increases the precision score for the network trained for 12 epochs. During the training process, the loss starts to converge after the second epoch, so we can say that training for a long time after conversion is not favorable, especially when the score at a lesser threshold tolerance is better for the less-trained network.
By comparing the different network structures, we can see that VGG19 clearly has the advantage; however, it was the slowest. The pipeline speed comparison for all networks is shown in
Table 3.
The execution of the system’s components, including YOLOv2 and GMM, is done using the “Nividia GEFORCE GTX 1050 Ti” processor, which works at 27–30 frames per sec with 75 watts. On the other hand, the testing done on the FPGA “Jetson AGX Xavier” showed that it works at 24–30 frames per sec with 30 watts. Although the execution time of YOLOv2, being the heaviest component of the system, on FPGA is expected to be longer, the efficiency of the power consumption is much better when operating in real-time is maintained. These results confirm that the system can be integrated in the future to being operated using FPGA.
The DarkNet network is dismissed as a choice since a high drop in the mAP score was noticed in exchange for a small FPS improvement. On the other hand, the TinyYOLO frame rate is considerably tradeable with the mAP drop since more effort can be added to the training set to improve the performance, while having a high-speed detection pipeline. Additionally, the TinyYOLO network is still usable at the IoU threshold = 0.1 because we could still achieve 100% recall at a low precision score, which means that the barcodes could still be detected but with some lagging in the system due to sudden false detections. During visualized testing, the TinyYOLO network was able to focus the bounding box on the barcode most of the time. When no barcode existed, the bounding box was shown on random objects with a confidence score of 0.2. So, we solved this problem by setting the IoU threshold to 0.3 at the cost of missing the barcode sometimes. However, the more suitable network for our application is the VGG19; it can be used with slow arm movement, due to the low FPS. The VGG19 mAP is high, though the same optimization properties were used for all networks because it was pre-trained on a huge dataset with 1000 different categories. Hence, the feature extraction filters were optimized to extract the features of most objects. Meanwhile, the TinyYOLO network was trained on only 31,500 from scratch and only one object.
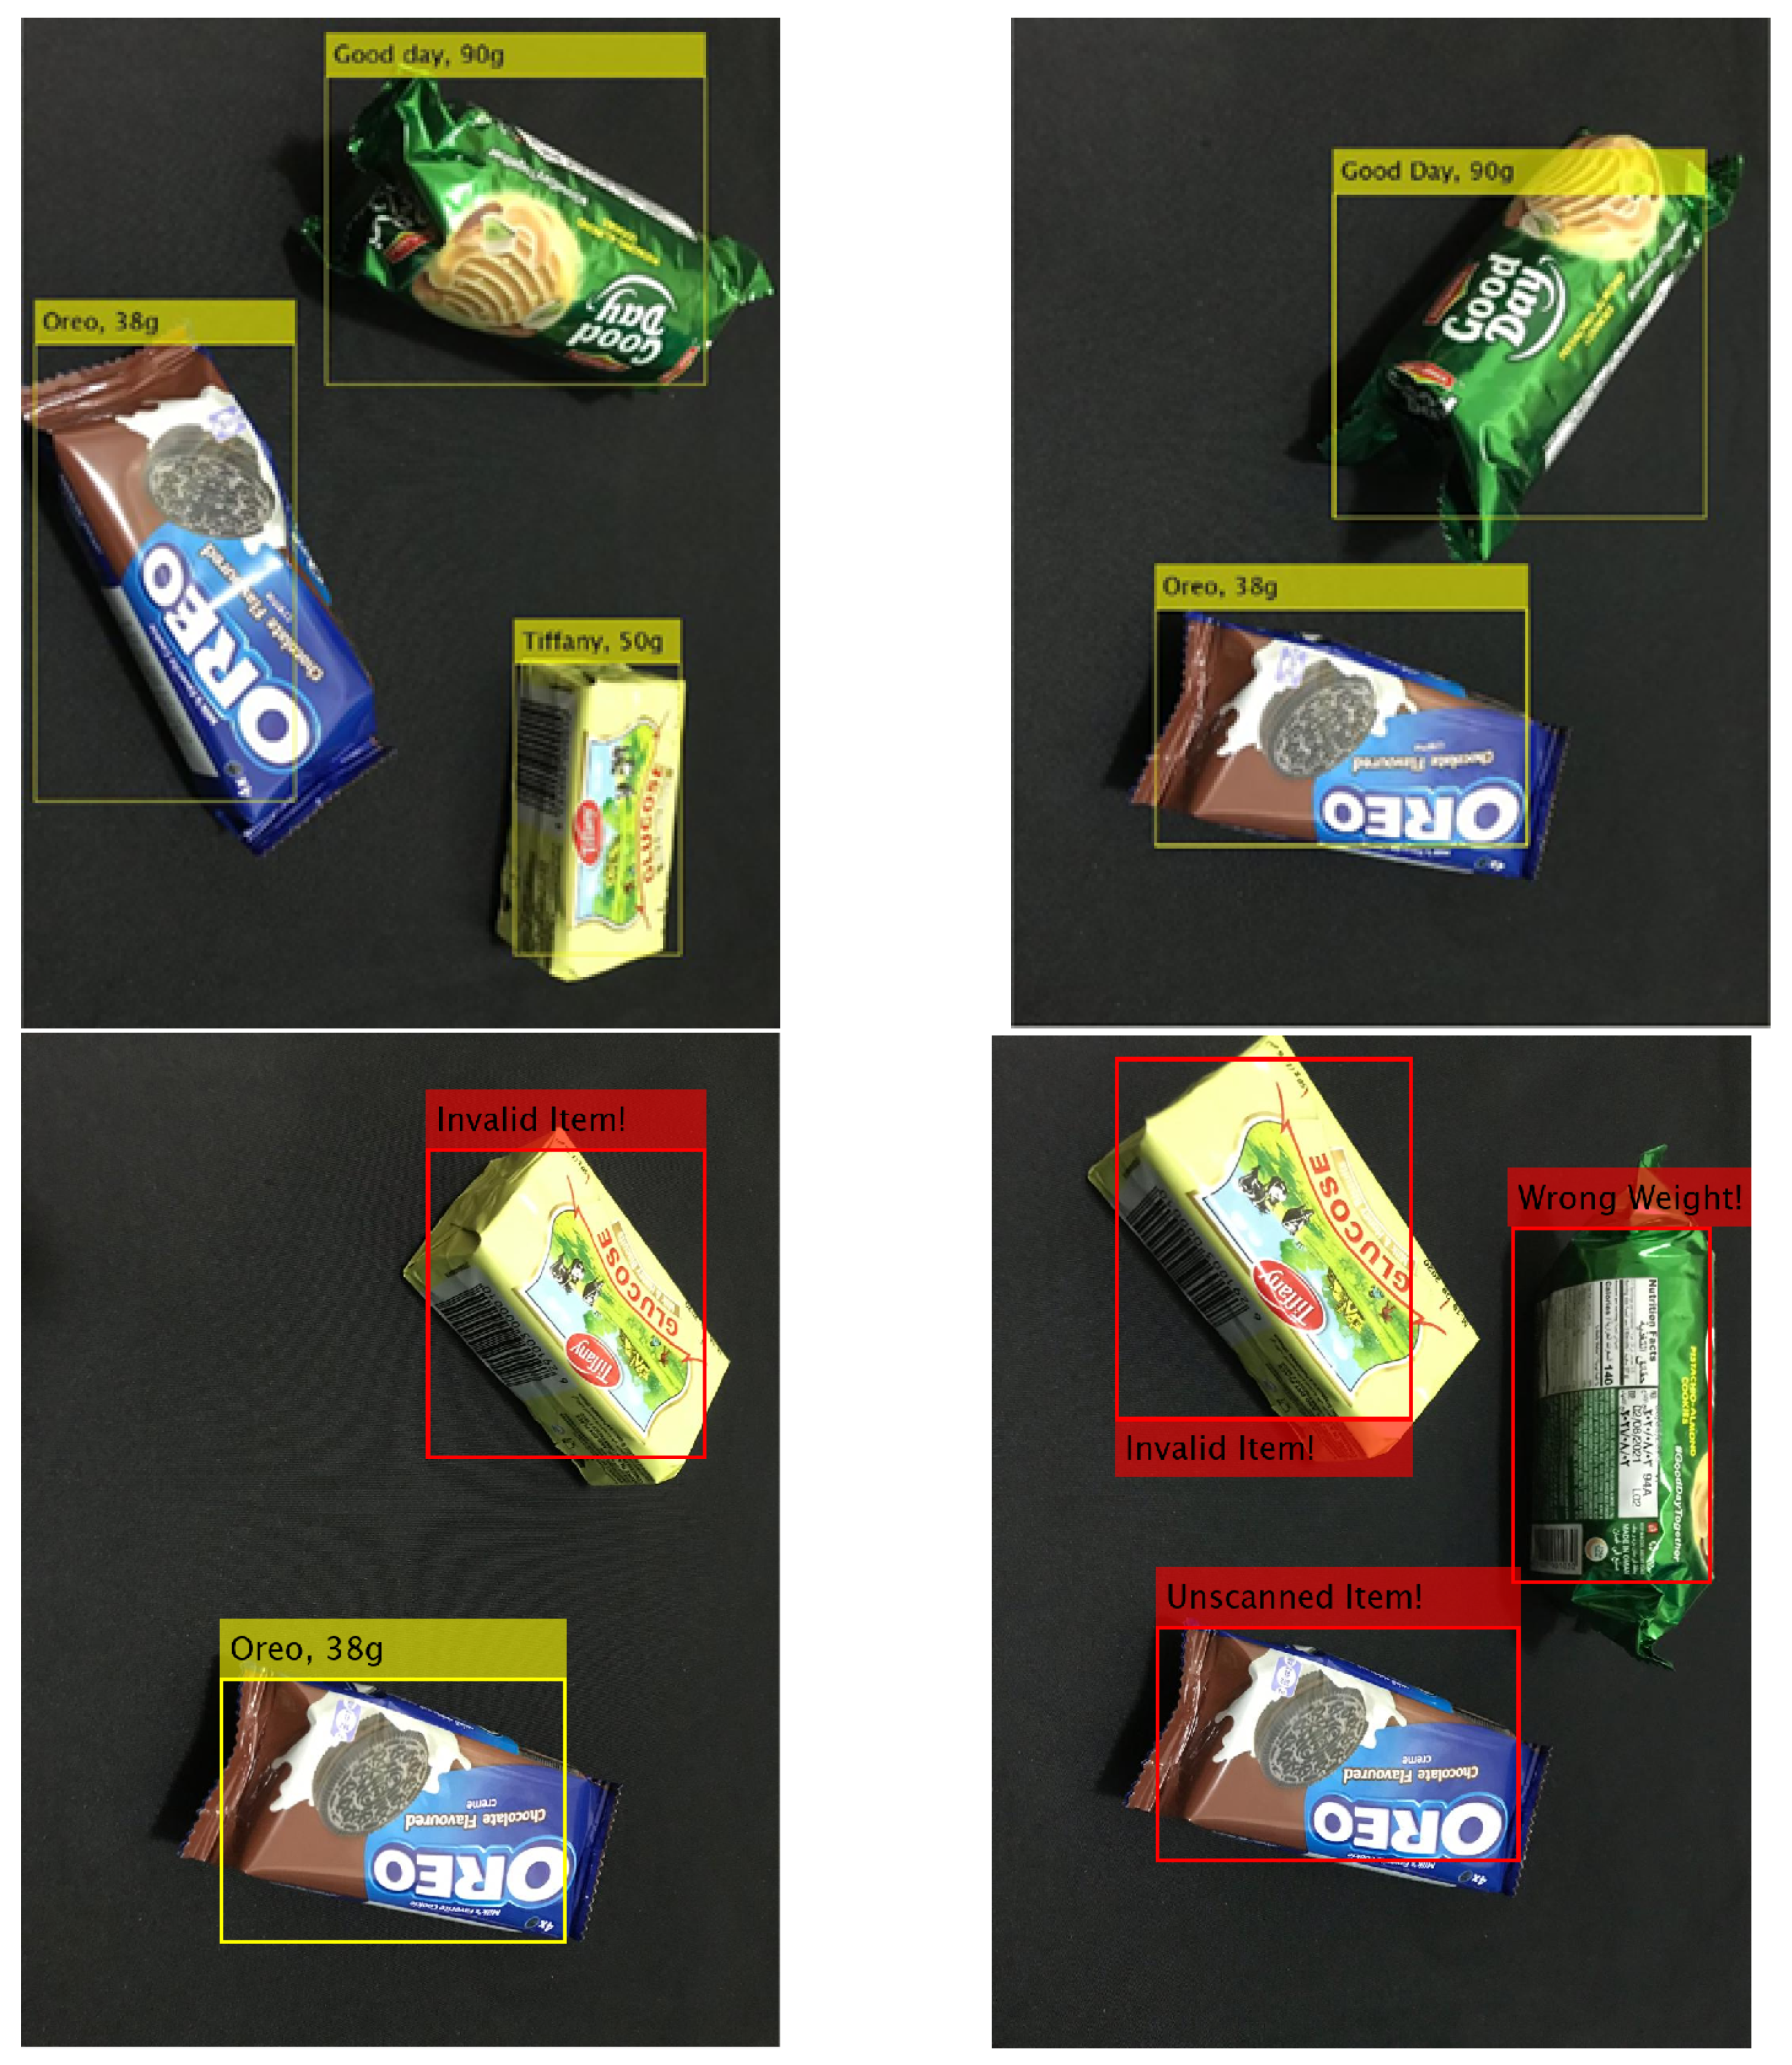
The results of the validation system are shown in
Figure 29. The correctly validated items are labeled by the brand name and the real weight of the item. The items with only a different weight than the ones scanned are labeled “Wrong Weight”, and the items with low matched features are labeled “Invalid Item”. Finally, the items that are detected with no recent scanning are labeled “Unscanned Items”. The system was successful in detecting and validating items in different scenarios.
5. Discussion
In this paper, we propose a smart service robot for elderly and disabled people, presented in multiple subsystems synchronized together. The system is implemented on a shopping cart with a robotic arm equipped with a lifting mechanism to reach high shelves. Then, a scanner with a camera is used to perform automatic scanning based on barcode detection. A validation system with a camera and load cells viewing the cart is used to validate scanned items and alert of non-scanned items based on a computer vision pipeline. The manual control system consists of a robotic arm, a linear actuator, and a controller that controls both. The user grabs items from the shelves through this system, then initiates the automated scanning system. The barcode recognition network is developed based on YOLOv2 architecture trained over 31,500 augmented samples. Three feature extraction layers are tested: pre-trained VGG19, pre-trained DarkNet19, and TinyYOLO network trained from scratch. The results showed a maximum mAP of 92.4%, 86.4%, and 78.4%, with a frame rate of 6.2, 11, and 27 FPS for each network architecture. A validation system is implemented to increase the reliability and robustness of the system. GMM and Kalman filter are used to detect newly inserted items in the cart. SURF features are combined with the hue value of the HSI color space together with the weight value measured by the load cells to validate that the new item is indeed the one has been scanned. The system shows robustness in different scenarios, including detecting unscanned items, items of the same appearance but different weight and items with the same weight but different appearance. The system shows mechanical limitations with the lifting mechanism; the linear actuator can take up to 20 s to lift the arm to the highest level, 500 mm, and bring it back.
6. Future Improvements and Limitations of the Present Work
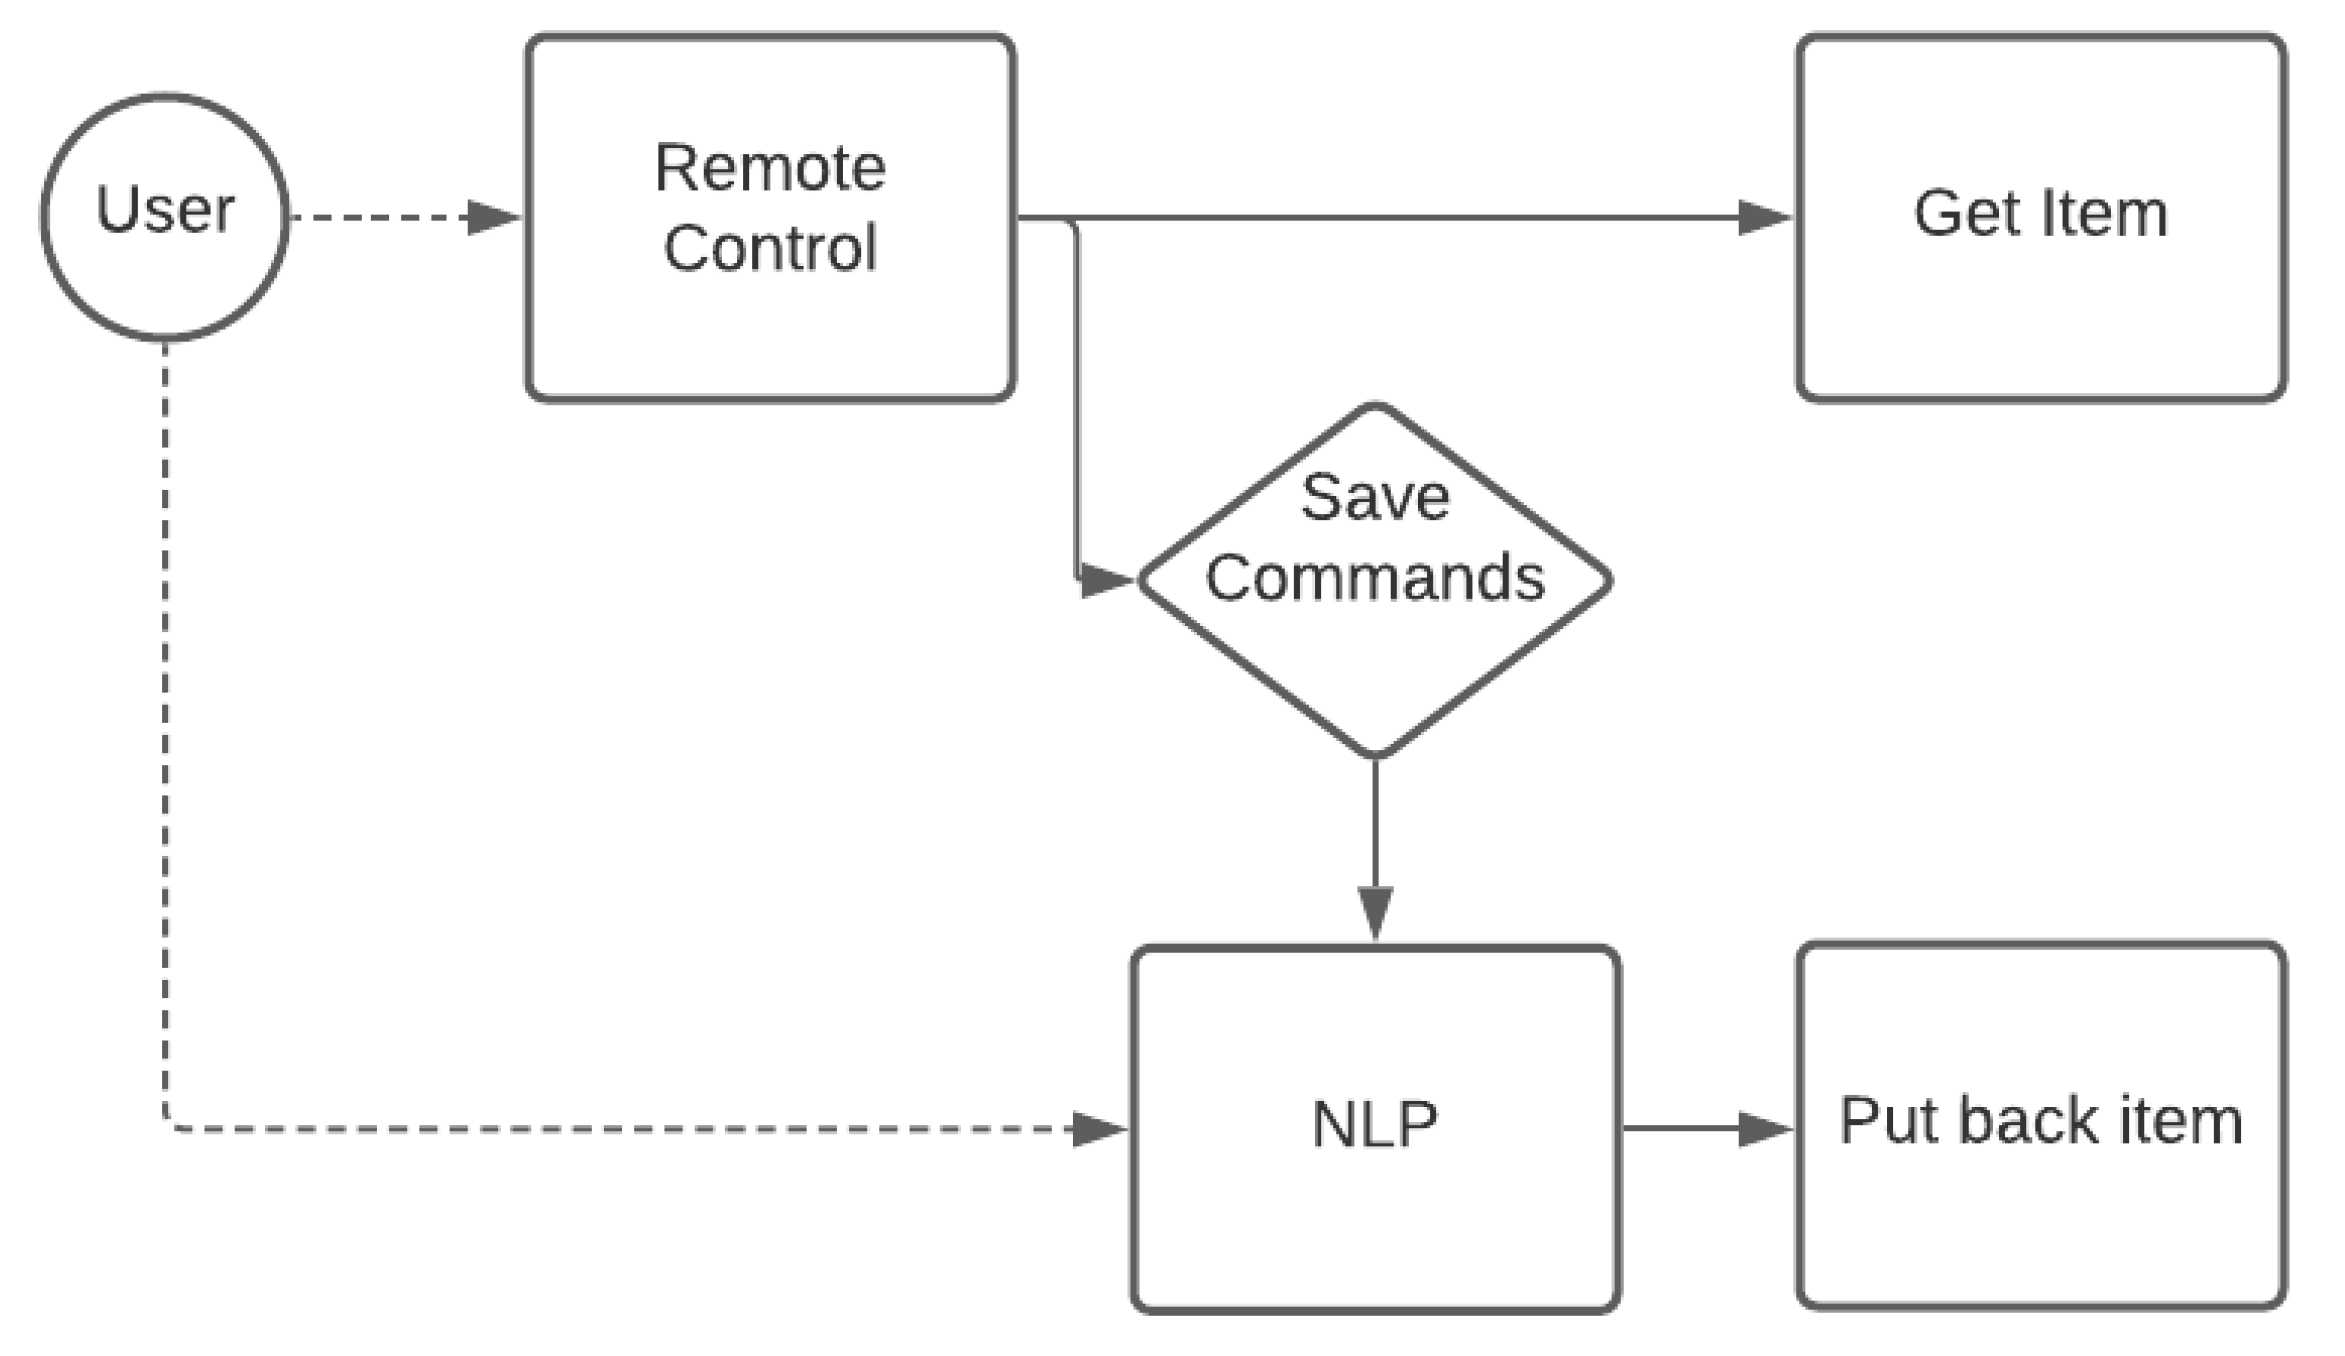
The most important factor in the proposed solution that needs to be considered for further research is the user’s control of the robotic arm, which may require training and practice to become used to it. The natural language processing (NLP) technology has been integrated into multiple approaches in terms of the utilization and control of robots, as shown in [
27]. NLP can help to eliminate repetitive scenarios, such as returning an item from the cart to the shelf, by executing the recorded motion from the user’s feedback.
Figure 30 shows a brief flowchart of the NLP process.
Another area that requires further research is the mechanical aspect of the paper. Our approach has suffered from the linear actuator, as the lifting mechanism operates at low speed. There are multiple ways in which the linear actuator can perform at higher speed, including supplying more power to a higher rated motor. On the other hand, there are other approaches, including a mechanical scissor lift, which has a higher capacity of weight with better stability, and a vertical slider, which can provide more robustness and control. Furthermore, the robotic arm is very limited in its work space. This leads to a difficulty in creating a direct control system. This problem can be solved by using wider range servos.
Last but not least, an image quality assessment system is required to detect and reduce random interference from the environment, such as a change in illumination, vibration and noises. A shadow detection and removal algorithm can prevent the wrong detection of shadows as an item inside the cart.
Author Contributions
Funding acquisition, M.G., M.A. (Mohammad Alkhedher) and A.S.E.-B.; investigation, M.G., M.Y., A.G. and G.E.B.; methodology, M.G., M.Y., A.G. and G.E.B.; project administration, M.G., M.Y., M.A. (Marah Alhalabi), M.A. (Mohammad Alkhedher) and A.S.E.-B.; Software, M.G., M.Y., A.G. and G.E.B.; supervision, M.G., M.Y., M.A. (Marah Alhalabi), M.A. (Mohammad Alkhedher) and A.S.E.-B.; validation, M.G., M.Y., A.G. and G.E.B.; writing—original draft, M.G., M.Y., A.G. and G.E.B.; writing—review and editing, M.G., M.Y., M.A. (Marah Alhalabi), M.A. (Mohammad Alkhedher) and A.S.E.-B. All authors have read and agreed to the published version of the manuscript.
Funding
This research was funded by the Office of Research and Sponsored Programs in Abu Dhabi University with grant number 19300473.
Acknowledgments
The authors thank Abdalla Rashed, Saeed Darwish, and Tasnim Basmaji for their roles in the implementation and testing.
Conflicts of Interest
The authors declare no conflict of interest.
References
- Al Youm, E. Obstacles Faced by People of Determination. 2019. Available online: https://www.emaratalyoum.com/business/local/2019-06-10-1.1221161 (accessed on 17 September 2021).
- Winlock, T.; Christiansen, E.; Belongie, S. Toward real-time grocery detection for the visually impaired. In Proceedings of the IEEE Computer Society Conference on Computer Vision and Pattern Recognition—Workshops, San Francisco, CA, USA, 13–18 June 2010. [Google Scholar]
- Fleites, F.C.; Wang, H.; Chen, S.-C. Enhancing product detection with multicue optimization for tv shopping applications. IEEE Trans. Emerg. Top. Comput. 2015, 3, 161–171. [Google Scholar] [CrossRef]
- Belibov, D.; Tudose, D.S. Smart shopping cart. In Proceedings of the 18th RoEduNet Conference: Networking in Education and Research (RoEduNet), Galați, Romania, 10–12 October 2019. [Google Scholar]
- Alves, R.; Admas Linhares, B.; Souza, J.R. Autonomous Shopping Cart: A New Concept of Service Robot for Assisting Customers. In Proceedings of the 2018 Latin American Robotic Symposium, 2018 Brazilian Symposium on Robotics (SBR) and 2018 Workshop on Robotics in Education (WRE), Paraiba, Brazil, 6–10 November 2018. [Google Scholar]
- Arciuolo, T.; Abuzneid, A. Simultaneously Shop, Bag, and Checkout (2SBC-Cart): A Smart Cart for Expedited Supermarket Shopping. In Proceedings of the 2019 International Conference on Computational Science and Computational Intelligence (CSCI), Las Vegas, NV, USA, 5–7 December 2019. [Google Scholar]
- Subudhi, S.R.; Ponnalagu, R.N. An Intelligent Shopping Cart with Automatic Product Detection and Secure Payment System. In Proceedings of the 2019 IEEE 16th India Council International Conference (INDICON), Rajkot, India, 13–15 December 2019. [Google Scholar]
- Mekruksavanich, S. The Smart Shopping Basket Based on IoT Applications. In Proceedings of the 2019 IEEE 10th International Conference on Software Engineering and Service Science (ICSESS), Beijing, China, 18–20 October 2019. [Google Scholar]
- Sarwar, M.A.; Daraghmi, Y.; Liu, K.; Chi, H.; İk, T.U.; Li, Y. Smart Shopping Carts Based on Mobile Computing and Deep Learning Cloud Services. In Proceedings of the 2020 IEEE Wireless Communications and Networking Conference (WCNC), Seoul, Korea, 25–28 May 2020. [Google Scholar]
- Popa, M.; Rothkrantz, L.; Yang, Z.; Wiggers, P.; Popa, M.; Braspenning, R.; Shan, C. Analysis of shopping behavior based on surveillance system. In Proceedings of the IEEE International Conference on Systems, Man and Cybernetics, Istanbul, Turkey, 10–13 October 2010. [Google Scholar]
- Polacco, A.; Backes, K. The amazon go concept: Implications, applications, and sustainability. J. Bus. Manag. 2018, 24, 79–92. [Google Scholar]
- Franco, A.; Maltoni, D.; Papi, S. Grocery product detection and recognition. Expert Syst. Appl. 2017, 81, 163–176. [Google Scholar] [CrossRef]
- Zhang, H.; Zhang, L.; Li, P.; Gu, D. Yarn-dyed fabric defect detection with yolov2 based on deep convolution neural networks. In Proceedings of the IEEE 7th Data Driven Control and Learning Systems Conference (DDCLS), Enshi, China, 25–27 May 2018. [Google Scholar]
- Zhao, J.; Qu, J. Healthy and diseased tomatoes detection based on yolov2. In Proceedings of the International Conference on Human Centered Computing, Čačak, Serbia, 5–7 August 2019. [Google Scholar]
- Xu, C.; Lu, X. Novel Gaussian mixture model background subtraction method for detecting moving objects. In Proceedings of the IEEE International Conference of Safety Produce Informatization, Chongqing, China, 10–12 December 2018. [Google Scholar]
- Hardjono, B.; Wibisono, A.; Sina, I.; Nurhadiyatna, A.; Jatmiko, W.; Mursanto, P. Background subtraction using gaussian mixture model enhanced by hole filling algorithm (gmmhf). In Proceedings of the IEEE International Conference on Systems, Man, and Cybernetics, Manchester, UK, 13–16 October 2013. [Google Scholar]
- Phung, S.L.; Beghdadi, A.; Bouttefroy, P.L.M.; Bouzerdoum, A. On the analysis of background subtraction techniques using gaussian mixture models. In Proceedings of the IEEE International Conference on Acoustics, Speech and Signal Processing, Dallas, TX, USA, 14–19 March 2010. [Google Scholar]
- Feng, Z.; Luo, X.; Yang, T.; Kita, K. An object Detection System Based on YOLOv2 in Fashion Apparel. In Proceedings of the 2018 IEEE 4th International Conference on Computer and Communications (ICCC), Chengdu, China, 7–10 December 2018; pp. 1532–1536. [Google Scholar] [CrossRef]
- Chen, P.; Chen, X.; Jin, B.; Zhu, X. Online EM Algorithm for Background Subtraction. Procedia Eng. 2012, 29, 164–169. [Google Scholar] [CrossRef] [Green Version]
- Wong, S.C.; Gatt, A.; Stamatescu, V.; McDonnell, M.D. Understanding Data Augmentation for Classification: When to Warp? In Proceedings of the International Conference on Digital Image Computing: Techniques and Applications (DICTA), Gold Coast, Australia, 30 November–2 December 2016. [Google Scholar]
- Mikołajczyk, A.; Grochowski, M. Data augmentation for improving deep learning in image classification problem. In Proceedings of the International Interdisciplinary PhD Workshop (IIPhDW), Swinoujscie, Poland, 9–12 May 2018. [Google Scholar]
- Molchanov, V.V.; Vishnyakov, B.V.; Vizilter, Y.V.; Vishnyakova, O.V.; Knyaz, V.A. Pedestrian detection in video surveillance using fully convolutional yolo neural network. In Automated Visual Inspection and Machine Vision II; International Society for Optics and Photonics: Bellingham, WA, USA, 2017. [Google Scholar]
- Kingma, D.P.; Adam, J.B. A method for stochastic optimization. In Proceedings of the International Conference on Learning Representations (ICLR), Banff, AB, Canada, 14–16 April 2014. [Google Scholar]
- Bottou, L. Large-scale machine learning with stochastic gradient descent. In Proceedings of the International Conference on Computational Statistics, Paris, France, 22–27 August 2010. [Google Scholar]
- Qian, N. On the momentum term in gradient descent learning algorithms. Neural Netw. 1999, 12, 145–151. [Google Scholar] [CrossRef]
- Rohini, C.; Gengaje, S. Multiple Object Detection using GMM Technique and Tracking using Kalman Filter. Int. J. Comput. Appl. 2017, 172, 20–25. [Google Scholar]
- Muthugala, M.V.J.; Jayasekara, A.B.P. A Review of Service Robots Coping with Uncertain Information in Natural Language Instructions. IEEE Access 2018, 6, 12913–12928. [Google Scholar] [CrossRef]
Figure 1.
System overview.
Figure 1.
System overview.
Figure 3.
Robotic arm specifications.
Figure 3.
Robotic arm specifications.
Figure 5.
Schematic of the linear actuator circuit.
Figure 5.
Schematic of the linear actuator circuit.
Figure 6.
Reflections and their color transformations for one sample.
Figure 6.
Reflections and their color transformations for one sample.
Figure 7.
Two anchor boxes tiled in a 4 × 4 grid.
Figure 7.
Two anchor boxes tiled in a 4 × 4 grid.
Figure 8.
YOLOv2 with TinyYOLO feature extraction.
Figure 8.
YOLOv2 with TinyYOLO feature extraction.
Figure 9.
YOLOv2 with VGG19 feature extraction.
Figure 9.
YOLOv2 with VGG19 feature extraction.
Figure 10.
YOLOv2 with DarkNet feature extraction.
Figure 10.
YOLOv2 with DarkNet feature extraction.
Figure 11.
PID controller diagram.
Figure 11.
PID controller diagram.
Figure 12.
The closed-loop PID system.
Figure 12.
The closed-loop PID system.
Figure 13.
Mapping the centers of the camera and scanner sensors.
Figure 13.
Mapping the centers of the camera and scanner sensors.
Figure 14.
Foreground mask and tracking of the detected item.
Figure 14.
Foreground mask and tracking of the detected item.
Figure 15.
Sample of the SURF features extracted and stored in the database of an item.
Figure 15.
Sample of the SURF features extracted and stored in the database of an item.
Figure 16.
SURF features extracted of an item in cart.
Figure 16.
SURF features extracted of an item in cart.
Figure 17.
The feature matching process of similar items.
Figure 17.
The feature matching process of similar items.
Figure 18.
SURF features extraction of another item.
Figure 18.
SURF features extraction of another item.
Figure 19.
Feature matching process of different items.
Figure 19.
Feature matching process of different items.
Figure 20.
Schematic of the load-cells circuit.
Figure 20.
Schematic of the load-cells circuit.
Figure 21.
Sample result of correctly validated item.
Figure 21.
Sample result of correctly validated item.
Figure 22.
Stages of the proposed approach using prototype.
Figure 22.
Stages of the proposed approach using prototype.
Figure 23.
Execution time of the full process.
Figure 23.
Execution time of the full process.
Figure 24.
Recall–precision curve for VGG19 networks trained for 12 epochs. IoU threshold = 0.1.
Figure 24.
Recall–precision curve for VGG19 networks trained for 12 epochs. IoU threshold = 0.1.
Figure 25.
Recall–precision curve for VGG19 networks trained for 12 epochs. IoU threshold = 0.5.
Figure 25.
Recall–precision curve for VGG19 networks trained for 12 epochs. IoU threshold = 0.5.
Figure 26.
Detection of clear barcodes with high confidence score and unclear one with a lower confidence score.
Figure 26.
Detection of clear barcodes with high confidence score and unclear one with a lower confidence score.
Figure 27.
Recall–precision curve for VGG19, DarkNet, and TinyYOLO networks trained for 4 epochs. IoU threshold = 0.1.
Figure 27.
Recall–precision curve for VGG19, DarkNet, and TinyYOLO networks trained for 4 epochs. IoU threshold = 0.1.
Figure 28.
Recall–precision curve for VGG19, DarkNet, and TinyYOLO networks trained for 4 epochs. IoU threshold = 0.5.
Figure 28.
Recall–precision curve for VGG19, DarkNet, and TinyYOLO networks trained for 4 epochs. IoU threshold = 0.5.
Figure 29.
Results of the validation system.
Figure 29.
Results of the validation system.
Figure 30.
Flowchart of the integration of NLP into our system.
Figure 30.
Flowchart of the integration of NLP into our system.
Table 1.
Feature table.
| Approach | Item
Accessibility | Self-Checkout | Anti-Theft | Store
Infrastructure |
|---|
| Dan Belibov et al. [4] | - | CNN (Item
detection) | Weight | High |
| S. R. Subudhi et al. [7] | - | RFID | - | High |
| Raulcezar Alves et al. [5] | Autonomous | - | - | Low |
| Thomas Arciuolo et al. [6] | Autonomous | RFID | - | High |
| M. A. Sarwar et al. [9] | - | YOLO (Shopping
behavior) | - | Low |
| S. Mekruksavanich [8] | - | RFID | Weight | High |
| Ours | Semi-
Autonomous | YOLO (Barcode
detection) | Weight,
SURF,
& Color | Low |
Table 2.
Description of gamepad’s buttons.
Table 2.
Description of gamepad’s buttons.
| Button/Button Combinations | Activation Value | Associated Command |
|---|
| BTN_SOUTH | 1 | Suction cup ON\OFF |
| BTN_EAST | 1 | Start the scanning |
| BTN_NORTH | 1 | Emergency button |
| BTN_WEST | 1 | Air pump ON\OFF |
| ABS_HAT0Y | −1 | End effector up |
| ABS_HAT0Y | 1 | End effector down |
| ABS_HAT0X | −1 | End effector rotates clockwise |
| ABS_HAT0X | 1 | End effector rotates anti-clockwise |
| ABS_RX | >32,000 | Linear actuator forward |
| ABS_RX | <−32,000 | Linear actuator down |
| ABS_RY | >32,000 | Linear actuator to the left |
| ABS_RY | <−32,000 | Linear actuator to the right |
| BTN_TR (hold) + ABS_RX | 1 + (>32,000) | Linear actuator up |
| BTN_TR (hold) + ABS_RX | 1 + (<−32,000) | Linear actuator down |
Table 3.
Comparing the average FPS of the trained networks.
Table 3.
Comparing the average FPS of the trained networks.
| Network | VGG19 | DarkNet19 | TinyYOLO |
|---|
| Average FPS | 6.2 | 11 | 27 |
| Publisher’s Note: MDPI stays neutral with regard to jurisdictional claims in published maps and institutional affiliations. |
© 2021 by the authors. Licensee MDPI, Basel, Switzerland. This article is an open access article distributed under the terms and conditions of the Creative Commons Attribution (CC BY) license (https://creativecommons.org/licenses/by/4.0/).


 ,
, 


