
Applications of FFTA–HFACS for Analyzing Human and Organization Factors in Electric Misoperation Accidents


School of Electrical Engineering and Automation, Fuzhou University, Fuzhou 350108, China
*
Author to whom correspondence should be addressed.
Appl. Sci. 2021, 11(19), 9008; https://0-doi-org.brum.beds.ac.uk/10.3390/app11199008
Submission received: 26 August 2021
/
Revised: 19 September 2021
/
Accepted: 21 September 2021
/
Published: 27 September 2021
(This article belongs to the Topic Industrial Engineering and Management)
Abstract
:Human and organizational factors (HOFs) play an important role in electric misoperation accidents (EMAs), but research into the reliability of human factors is still in its infancy in the field of EMAs, and further investment in research is urgently required. To analyze the HOFs in EMAs, a hybrid method including the Human Factors Analysis and Classification System (HFACS) and fuzzy fault tree analysis (FFTA) was applied to EMAs for the first time in the paper. HFACS is used to identify and classify the HOFs with 135 accidents, reorganized as basic events (BEs), intermediate events (IEs), and top event (TE), and develop the architecture of fault tree (FT). Fuzzy aggregation is employed to address experts’ expressions and obtain the failure probabilities of the BEs and the minimal cut sets (MCSs) of the FT. The approach generates BEs failure probabilities without reliance on quantitative historical failure statistics of EMAs via qualitative records processing. The FFTA–HFACS model is applied for quantitative analysis of the probability of failure of electrical mishaps and the interaction between accident risk factors. It can assist professionals in deciding whether and where to take preventive or corrective actions and assist in knowledgeable decision-making around the electric operation and maintenance process. Finally, applying this hybrid method to EMAs, the results show that the probability of an EMAs is 1.0410 × 10⁻², which is a risk level that is likely to occur and must be controlled. Two of the most important risk factors are habitual violations and supervisory violation; a combination of risk factors of inadequate work preparation and paralysis, and irresponsibility on the part of employees are also frequent errors.
1. Introduction
According to the National Energy Administration of China [1], there will be around 42 major electric power safety production accidents in China per year. Data from 2019–2020 shows that the proportion of accidents due to human insecurity is about 65%. Electric misoperation is one of the leading causes of power safety production accidents. Operation errors usually cause significant accidents, such as power outages, equipment damage, personal injuries, and the collapse of the power grid. In terms of preventing misoperation, even though the “Electric Industry Safety Work Regulations” has stipulated, and various units have performed a lot of work, misoperation accidents proceed to occur frequently.
A human error caused the Colombia blackout in 2007 in the 230 kV Substation Protection; the operation of the protection scheme of a coupling switch between the busloads caused a cascading outage in the transmission system [2]. The Florida blackout in 2008 was also caused by a human error when a protection and control engineer manually removed the primary protection and the breakdown protection (secondary protection) from the service for an energized piece of equipment [3]. Between 2003 and 2016, China Southern Power Grid alone announced approximately 150 EMAs. Many EMAs show that personal injury and death caused by electric shock and electric equipment accidents are commonly related to the failure of electric workers to comply with the “Electric Safety Work Regulations”. Static textual safety regulations and accident reports cannot play a function in accident prevention. Human error is the outcome, not the cause [4]. Organizational and management deficiencies have been the most critical potential cause behind most human errors that directly or indirectly lead to catastrophic accidents [5]. However, in the power system, there are few studies on the reliability analysis of human factors and organizational factors. Wu [6] pointed out the conclusion that human factors reliability research in the field of power transmission and transformation is mainly confined to qualitative research and the development of corporate safety regulations yet, with relatively little quantitative research, and that there is an urgent need to combine research results from other fields to carry out related research work in greater depth. Because of these facts, it is necessary to implement a proactive and comprehensive accident prevention scheme for EMAs to identify and analyze the HOFs.
Over the last several years, the HFACS has received extensive research attention as a valid and reliable tool in human factors accident analysis [7,8,9] and has been successfully utilized in a variety of safety-critical and tightly-coupled industrial settings which have experienced massive catastrophic losses due to human errors and organizational failures [10]. HFACS proposes a hierarchal structure of the system, divided into four levels, with active failures at the lowest level and latent failures at the three higher levels. HFACS can cover almost all aspects of human factors that lead to accidents, from unsafe acts of frontline workers to the root causes behind these acts.
Despite its unique capabilities as an effective tool to identify and classify the HOFs in accident investigation, HFACS has been criticized for the lack of quantitative analysis and the complex interdependencies among causal factors and reasoning [11,12]. Wang et al. [13] agreed that quantification would enhance the analytical capabilities of the HFACS and make it feasible to gain deeper insight and more substantive and objective analysis during accident investigations. Hence, fault tree analysis (FTA) is used to enhance the quantitative expression ability of HFACS and clarify the degree of complex dependence between related factors.
FTA is a quantitative and qualitative evaluation technique that identifies events as TEs and systematically arranges all the causes of errors in a top-down structure that looks like a tree to calculate the probability of the top event occurring [14]. In a conventional FTA, the BEs are represented by probabilities (crisp numbers). It assumes that the exact probability of the event has been given and adequate failure data is available. However, many modern systems are highly reliable, and it is often complicated to obtain sufficient statistics to estimate actual failure rates or failure probabilities. Moreover, the inaccuracy of system models resulting from human errors is tough to handle by simply using a conventional probabilistic reliability theory. These fundamental problems with probabilistic reliability theory have prompted researchers to find new models or new reliability theories which can complement the classical probabilistic definition of reliability. Misra et al. [15] believe that when there is little quantitative information about parameter fluctuations, fuzzy methods may be the only option, and the probability of BE will be characterized by fuzzy numbers. Therefore, the fuzzy fault tree analysis was developed to deal with such issues. Singer [16] used L-R type fuzzy numbers to analyze fuzzy reliability. Shu et al. [17] used intuitionistic fuzzy methods to analyze fault trees on a printed circuit board assembly. Yin et al. [18] proposed an FFTA approach based on the similarity aggregation method.
The FFTA–HFACS method has been applied in many fields. Its differences are mainly reflected in fuzzy algorithms, the constructed fault tree, and the angle of accident analysis. Rajakarunakaran et al. [19] applied FFTA–HFACS to hydrocarbon refueling stations for the first time, revealing that gas station accidents are associated with overfilling, drain valves, liquid outlets line, and vehicle impact. Qiao et al. [20] proposed FFTA–HFACS to evaluate human factors that contributed to maritime accidents. FFTA–HFACSA was used by Sarıalioğlu et al. [21] to examine the causes of fire-explosion accidents in ships. However, to the best of our knowledge, there is no research on applying the FFTA–HFACS method in analyzing the HOFs of EMAs.
The motivation of this study is to develop a flexible EMAs analysis model by incorporating FFTA into the HFACS. Based on the FT framework, fuzzy aggregation is used to form a fuzzy fault tree. Its purpose is to convert the BE qualitative data expressed by the expert’s subjective evaluation of the failure possibility into a fuzzy number operation format, thereby converting the fuzzy number into a single scalar, which is used to generate the BE failure probability and further evaluate the occurrence probability of the TE. There are several aspects to the originality of this study: (i) the first application of FFTA–HFACS method in the analysis of EMAs to identify and analyze the HOFs, (ii) aggregating experts judgments for BEs of EMAs with vague failures, (iii) ranking the MCS of FFT, thereby achieving the systems reliability measures. The FFTA formed by fuzzy aggregation exhibits two advantages: (i) an ability to use expert opinions expressed in linguistic terms to evaluate EMAs’ BEs; (ii) an ability to capture the subjective and imprecise factors of specialist linguistic assessments.
This paper is organized as follows: Section 2 introduces the implementation framework of the FFTA–HFCAS model, and Section 3 describes the proposed methodology in detail. Section 4 demonstrates the application process of FFTA–HFACS in EMAs to confirm the applicability and flexibility. Finally, some conclusions and suggestions are presented in Section 5.
2. The Framework of the Study
It is well known that China is at the leading edge of power system technology. However, there is still relatively little research on the human factors reliability analysis of power safety production. Li et al. [22] identified “fatigue” as the main cause of human accidents in power grid enterprises based on the HFACS and grey correlation method. Liu et al. [23] used correlation rule analysis, exploratory factor analysis, and Pearson correlation analysis to mine eight behavioral formation factors in nuclear power plants and found the correlations among the factors of “complexity”, “stress”, and “available time”. Liu et al. [24] conducted a chi-square test and concession ratio analysis on the human factors of power production accidents to speculate on their causal relationships. The above scholars, based on accident data, have used traditional statistical methods to analyze the important risk factors for accidents. It is able to partially respond to the causes of accidents, but the traditional statistical approach itself suffers from independent assumptions and requires high data integrity.
Other academics are beginning to integrate accident data and expert assessments to make an assessment of accident risk. Tang et al. [25] proposed a fuzzy weighted cognitive reliability and error analysis method (CREAM) to quantify the probability of human error in power operations. Lu et al. [26] proposed a quantitative analysis method for the human operational reliability of power grids based on the CREAM model, with expert weights and model input data determined by expert scoring. While these scholars have combined the expert opinion and also used fuzzy set theory methods, they have only quantitatively assessed accident failure probabilities and have not bothered to explore the coupling relationships between accident factors.
This work applies the FFTA–HFCAS model to analyze the HOFs in EMAs. The proposed analytical model is the first of its kind to be applied to the field of electrical production safety. This method not only analyses the important risk factors for electrical mishaps from traditional statistical methods, but also combines expert empirical assessment, using fuzzy set theory to generalize the subjectivity of experts and quantify the probability of failure and the interaction between accident risk factors.
The framework of this work is shown in Figure 1.
- (1)
- Data collection. Reliable EMAs data forms are the basis of accident analysis studies. In the present study, 135 typical EMAs of China Southern Power Grid from 2003 to 2016 were selected to establish an accident database. The 135 EMAs reports described the background of the accident, the cause of the accident, the exposed problems, and the preventive measures that will be taken in the future, which provide an excellent reference value for the study of this article.
- (2)
- HFACS structure. The preliminary HFACS, a model, set up for aviation, originated from the Reason’s “Swiss Cheese” model, which emphasizes the organizational dimension of accident causation [27]. The four levels of the HFACS framework including unsafe acts, preconditions for unsafe acts, unsafe supervision, and organizational influences, used today were expanded by Shappell et al. [28]. Each level consists of a set of sub-levels, and each sub-level has classification codes, known as nano-codes. Because of its unique features, various versions of HFACS have been used as a valuable and reliable tool for identifying and analyzing human factors in a wide range of other domains, such as HFACS–MI for mining [29,30], HFACS–RAs for railways [31], HFACS–MMO for marine engineering, HFACS–CSMEs for the chemical industry [32], and so on.
In this stage, the accident report, expert knowledge, and literature review can be summarized, and the causes of EMAs are transformed into levels in the HFACS hierarchical structure [33].
- (3)
- Statistical analysis. The Statistical analysis method for the HFACS framework is also an effective method to mine data law. Hinrichs et al. [34] counted 368 causal factors in the HFACS framework in maritime shipping and found that the technical environment had the highest frequency and identified it as a prerequisite in the preconditions for the unsafe acts category. Batalden et al. [35] used the HFACS framework to calculate the proportion of causal factors in marine accidents in the UK and found that the hidden conditions of accidents account for 72% of the total. Kim et al. [36] conducted a frequency analysis of the risk factors in the HFACS framework of nuclear power plants and found that there are potential hazards of insufficient employee knowledge and insufficient training among the organizational factors.
In this stage, through the construction of the HFACS framework, the HOFs related to EMAs can be analyzed and classified into the corresponding levels of HFACS. The total frequency of these factors can be counted, and traditional statistical analysis also can be performed.
- (4)
- Fault Tree Modeling. FTA originated from the aerospace industry and was adapted by the nuclear power plant industry to qualify and quantify the risks [37]. FTA is a technique widely used to assess the safety and reliability of safety-critical systems, such as the analysis of tunnel boring machine accident [38], the risk assessments of collision and grounding accidents [39], and the fire risk assessment in the natural gas industry [40]. The typical FT consists of TE, BEs, IEs, and gates. TE is the root of the FT; BEs are the leaves of the acyclic graph, which cannot be decomposed anymore; IEs are represented by BEs and other IEs through a combination of logic gates; gates usually refers to Boolean connectors, AND and OR are used most frequently.
In this stage, the HOFs of EMAs analyzed by the HFACS are converted into main elements to construct a fault tree. The main elements of a fault tree can be classified as TE, BEs, and IEs [41,42]. The FTA method is used to determine the relationships between the HOFs in the system [43].
- (5)
- Fuzzy aggregation analysis. It is often difficult to accurately and quantitatively analyze the failure probability of systems and components. In other words, a crisp method is difficult to convey the inaccurate or vague nature in system modeling to express the failure rate of system components [44]. In this case, therefore, an approximate estimate may be required. Fuzzy set theory, introduced by Zadeh in 1965 [45], is a rigorous mathematical framework for the precise and rigorous study of fuzzy conceptual phenomena and is well suited to deal with fuzzy relations, fuzzy criteria, and fuzzy phenomena [46]. Tanaka et al. [47] pioneered the study of the use of fuzzy set theory in FTA, treating the probability of BE as a trapezoidal fuzzy number and applying the principle of fuzzy expansion to determine the probability of TE. In response to this work, further research was carried out by Misra et al. [48] to give other forms of FFTA. Subsequently, variants of FFTA have been widely used in accident analysis, for example in the petrochemical process industry [49], in power transmission grids [50], and in combustion engineering reactor protection systems [51].
In this step, a FFTA model is also used with a fuzzy algorithm called Fuzzy aggregation analysis. The purpose of this stage is to fuzzify, aggregate, and defuzzify the expert’s linguistic assessments of EMAs’ BEs to obtain the failure probability of the BEs. Then, according to the logical relationship between the failure probability of BE, the failure probability of EMAs’ TE is derived [52].
- (6)
- Ranking the MCSs of FT. A cut set (CS) is a group of one or more BEs. The MCS is a CS without any further simplification and is the shortest path that constitutes TE. Therefore, the analysis of MCSs can help researchers gain insight into the importance of each possible pathway of the TE occurrence [53].
- (7)
- Analysis and evaluation of the effects. Integrate the analysis and calculation results of the above stages, evaluate the efficiency of the HOFs related to EMAs, and propose measures to reduce and eliminate accidents. The calculation principles and implementation process of the methods involved in the above steps will be explained in detail in the next section.
3. Methodology
3.1. Human Factor Analysis and Classification System (HFACS)
In this study, a modified version of the HFACS proposed for the EMAs, called HFACS–EMAs, is used. Like the original HFACS version, HFACS–EMAs also has four primary levels but differ on the sub-levels and nano-codes. Figure 2 depicts the HFACS–EMAs framework.
3.2. Fault Tree Analysis (FTA)
FT provides a framework by which to undergo a thorough qualitative and quantitative evaluation of the TE.
3.2.1. The Quantitative Analysis
FT quantitative analysis is to calculate the occurrence probability of the TE if all the failure probabilities of the BEs are available. The FTA method is based on Boolean logic [54], and the calculation of FT uses Boolean mathematics [55]. An FT can be modeled by a set of AND gates and OR gates connected between BEs and IEs. The AND gate and OR gate with m BEs are given in Equations (1) and (2), respectively:
where Qj(t) is a probability of failure of BE j (j = 1 to m), Q(t) is probability of failure of the top gate event due to all BEs.
Each MCS represents a combination of some BEs, which may cause the TE. It is assumed that all the r BEs in the CS j are independent; the probability that the CS j fails at time t is:
where Qr(t) is the probability of failure of BE r (r = 1 to n) leading to CS, Qo(t) is the probability of failure of CS o due to all BEs.
The probability of the TE failure is determined by Equation (4).
where Qo(t) is the probability of failure of CS o (o = 1 to k), QTE(t) is the probability of failure of TE due to all CSs. If the r BEs in the CS j are not independent, the probability of the TE failure in a complex system will become extremely complicated, and Equation (4) cannot find an accurate solution. However, generally, the approximate solution is still obtained by Equation (4) [56].
3.2.2. The Qualitative Analysis
The FT qualitative analysis can find out possible failure paths leading to the TE and identify the weakest link in the system. The qualitative research mainly analyzes the MCSs of FT. The more MCSs, the more dangerous the system is [57]. In the FTA, the Fussell–Vesely importance measure (FV-I) method is commonly used to determine the significance value of the BEs and MCSs forming the TE [58]. The FV-I method is calculated as follows:
where IiFV(t) is the importance degree of MCS i, Qi(t) is the occurrence probability of MCS i, and QS(t) is the occurrence probability of the TE due to all MCSs.
3.3. Fuzzy Fault Tree Analysis
In traditional FTA, the occurrence probabilities of BEs are numerical values. Using this structure because of insufficient data and high uncertainty, it is generally impractical to obtain an accurate estimate of the occurrence probabilities of BEs. In such ambiguous cases, the ‘fuzzy logic’ strategy can be used. The probability value of each BE is expressed in fuzzy numbers obtained from expert views. This is the main reason why FT has been extended into an FFT [59]. The FFTA mainly comprises the following steps.
3.3.1. Domain Expert Evaluations
The failure probability of EMA’s BEs needs to be evaluated by experts. Expert judgment methods have been widely adopted in different fields, including risk analysis, accident investigation, decision examination, and so on [60]. In practical applications, experts may have varying degrees of professional knowledge, background, and working experience. They may show different views on the same events and provide various assessments subjectively. Therefore, a weighting coefficient is introduced to represent the relative quality of various experts.
According to the actual situation of the substation, modify the expert’s weighting scores calculation table proposed by Renjith et al. [61], and Table 1 can be obtained. Refer to Table 1, using Equation (6) to calculate the expert’s weighting coefficient.
where WEIi is the ith expert’s weighting coefficient, SCOi is the ith expert’s total score, SPPi is the ith expert’s professional-position score, SECi is the ith expert’s education-level score or competency score, and SPEi is the ith expert’s professional-experience score.
3.3.2. Fuzzification
The expert judgment rating can be assumed in linguistic terms, which are used for soliciting expert opinions for each BE. Studies have shown that the suitable number of linguistic term selections for humans to make appropriate judgments is between 5 and 9 [62]. In this study, a linguistic scale consisting of seven terms is used to solicit opinions from experts on BEs with unknown error rates. The linguistic scale used to evaluate the failure probability of BEs included the terms ‘very high’, ‘high’, ‘medium high’, ‘medium’, ‘medium low’, ‘low’, and ‘very low’.
After obtaining the expert linguistic terms of BEs, a triangular fuzzy number (TFN) is used to determine the occurrence probability values of BEs. A TFN represents a triple set of fuzzy probability values (a1, a2, a3) of a BE. The corresponding relationship is shown in Table 2.
The membership function of the TFN can be calculated as follows:
where A is TFN (a1, a2, a3), μA(x) is the membership function.
3.3.3. Aggregation
For the failure probability of each BE, different experts have made a separate subjective linguistic evaluation, which needs to be integrated to generate the final quantitative data. This study uses the fuzzy aggregation analysis algorithm proposed by Hsu and Chen for aggregation [63]. The fuzzy aggregation analysis algorithm is implemented by the following steps.
Step 1: Calculation of the degree of similarity (S)
where Suv (, ) is the degree of agreement for different opinions between expert Eu and Ev, = (au1, au2, au3) and = (av1, av2, av3) are represented as two TFNs (u ≠ v).
Step 2: Calculation for the average agreement (AA) degree for each expert viewpoint
where AA(Eu) is the AA degree of expert Eu, U is the total number of experts.
Step 3: Calculation for the relative agreement (RA) degree for each expert viewpoint
where RA(Eu) is the RA degree of expert Eu.
Step 4: Estimation of the consensus coefficient (CC) for each expert
where CC(Eu) is the CC of expert Eu, WEI(Eu) is the weighting coefficient of expert Eu, β (0 ≤ β ≤ 1) represents the importance of WEI(Eu) over RA(Eu). In this study, β = 0.5 was considered [64].
Step 5: Calculation for the aggregated results of the experts’ viewpoints
where is the aggregated result value, and it is a fuzzy number.
3.3.4. Defuzzification
When fuzzy ratings are incorporated into an FTA problem, the final ratings are also fuzzy numbers. To determine a clear rating, must be converted to a crisp score, named fuzzy possibility score (FPS). Defuzzification methods include ‘mean-max membership’, ‘center of sums’, ‘weighted average method’ [65]. In this study, due to its simplicity and ease of understanding, ‘center of area’ method was used to calculate the of BEs.
For the = (c1, c2, c3), the equation is as follows:
where RAG is the FPS of .
3.3.5. Occurrence Failure Probability Generation
In some cases, due to the uncertainty of the data, it is impossible to find the failure probability value. This problem can be resolved by converting the FPS to a ‘failure probability’ (FP) form, which was proposed by Onisawa [66]. The conversion formula is as follows:
At this point, the failure probability of BEs can be thoroughly calculated. The failure probability of TE can also be derived from the BEs through the logic gate relationship in the constructed FT.
4. Application and Discussion of the Methodology
The proposed analysis procedure can be briefly divided into two stages: (i) one in which the HOFs identification and classification were conducted using the HFACS; (ii) one in which the FFTA was applied to EMAs to conduct a comprehensive risk analysis. The programming of the program calculation involved in the analysis was completed based on the MATLAB 2020b platform.
4.1. Application of the HFACS
4.1.1. Classification Process
To construct the HFACS–EMAs framework, first, it is necessary to identify the HOFs involved in the accident occurrence by collecting detailed data and conditions. Benefited from reports recorded by China Southern Power Grid, the construction of the HFACS–EMAs framework is relatively easy.
A total of 119 factors were used in the classification process, with a total frequency of 1187. According to the HFACS–EMAs framework, Figure 3 shows the distribution of these factors at the four levels of HFACS–EMAs, and Figure 4 shows the distribution of sub-categories. The coding for each level of the HFACS–EMAs is given in Appendix A.
4.1.2. Discussion of Distributions
It can be seen from Figure 3 that Level 2 has the most significant frequency ratio, reaching 47.33%, followed by Level 4, reaching 18.20%. Moreover, from Figure 4, in the sub-level, the frequency of unsuitability of ‘Quality and ability’ is the highest, reaching 19.45, the second is ‘Organizational process’, reaching 14.36%. Moreover, ‘Quality and ability’ belongs to Level 2, ‘Organizational process’ belongs to Level 4. From a macro level, it is not difficult to think that Level 2 and Level 4 are important potential factors that cause EMAs.
As can be seen from the Appendix A, at a more detailed level, ‘Inadequate guardianship/supervision’ has the highest frequency, reaching 80 times, followed by ‘Paralyzed thinking, irresponsible’, ‘Low-security awareness’, ‘On-site safety production management is not in place’. Therefore, the detailed factors that lead to the occurrence of EMAs are more concentrated on the employees themselves and organizational management.
4.2. Application of FFTA
4.2.1. Fault Tree Development
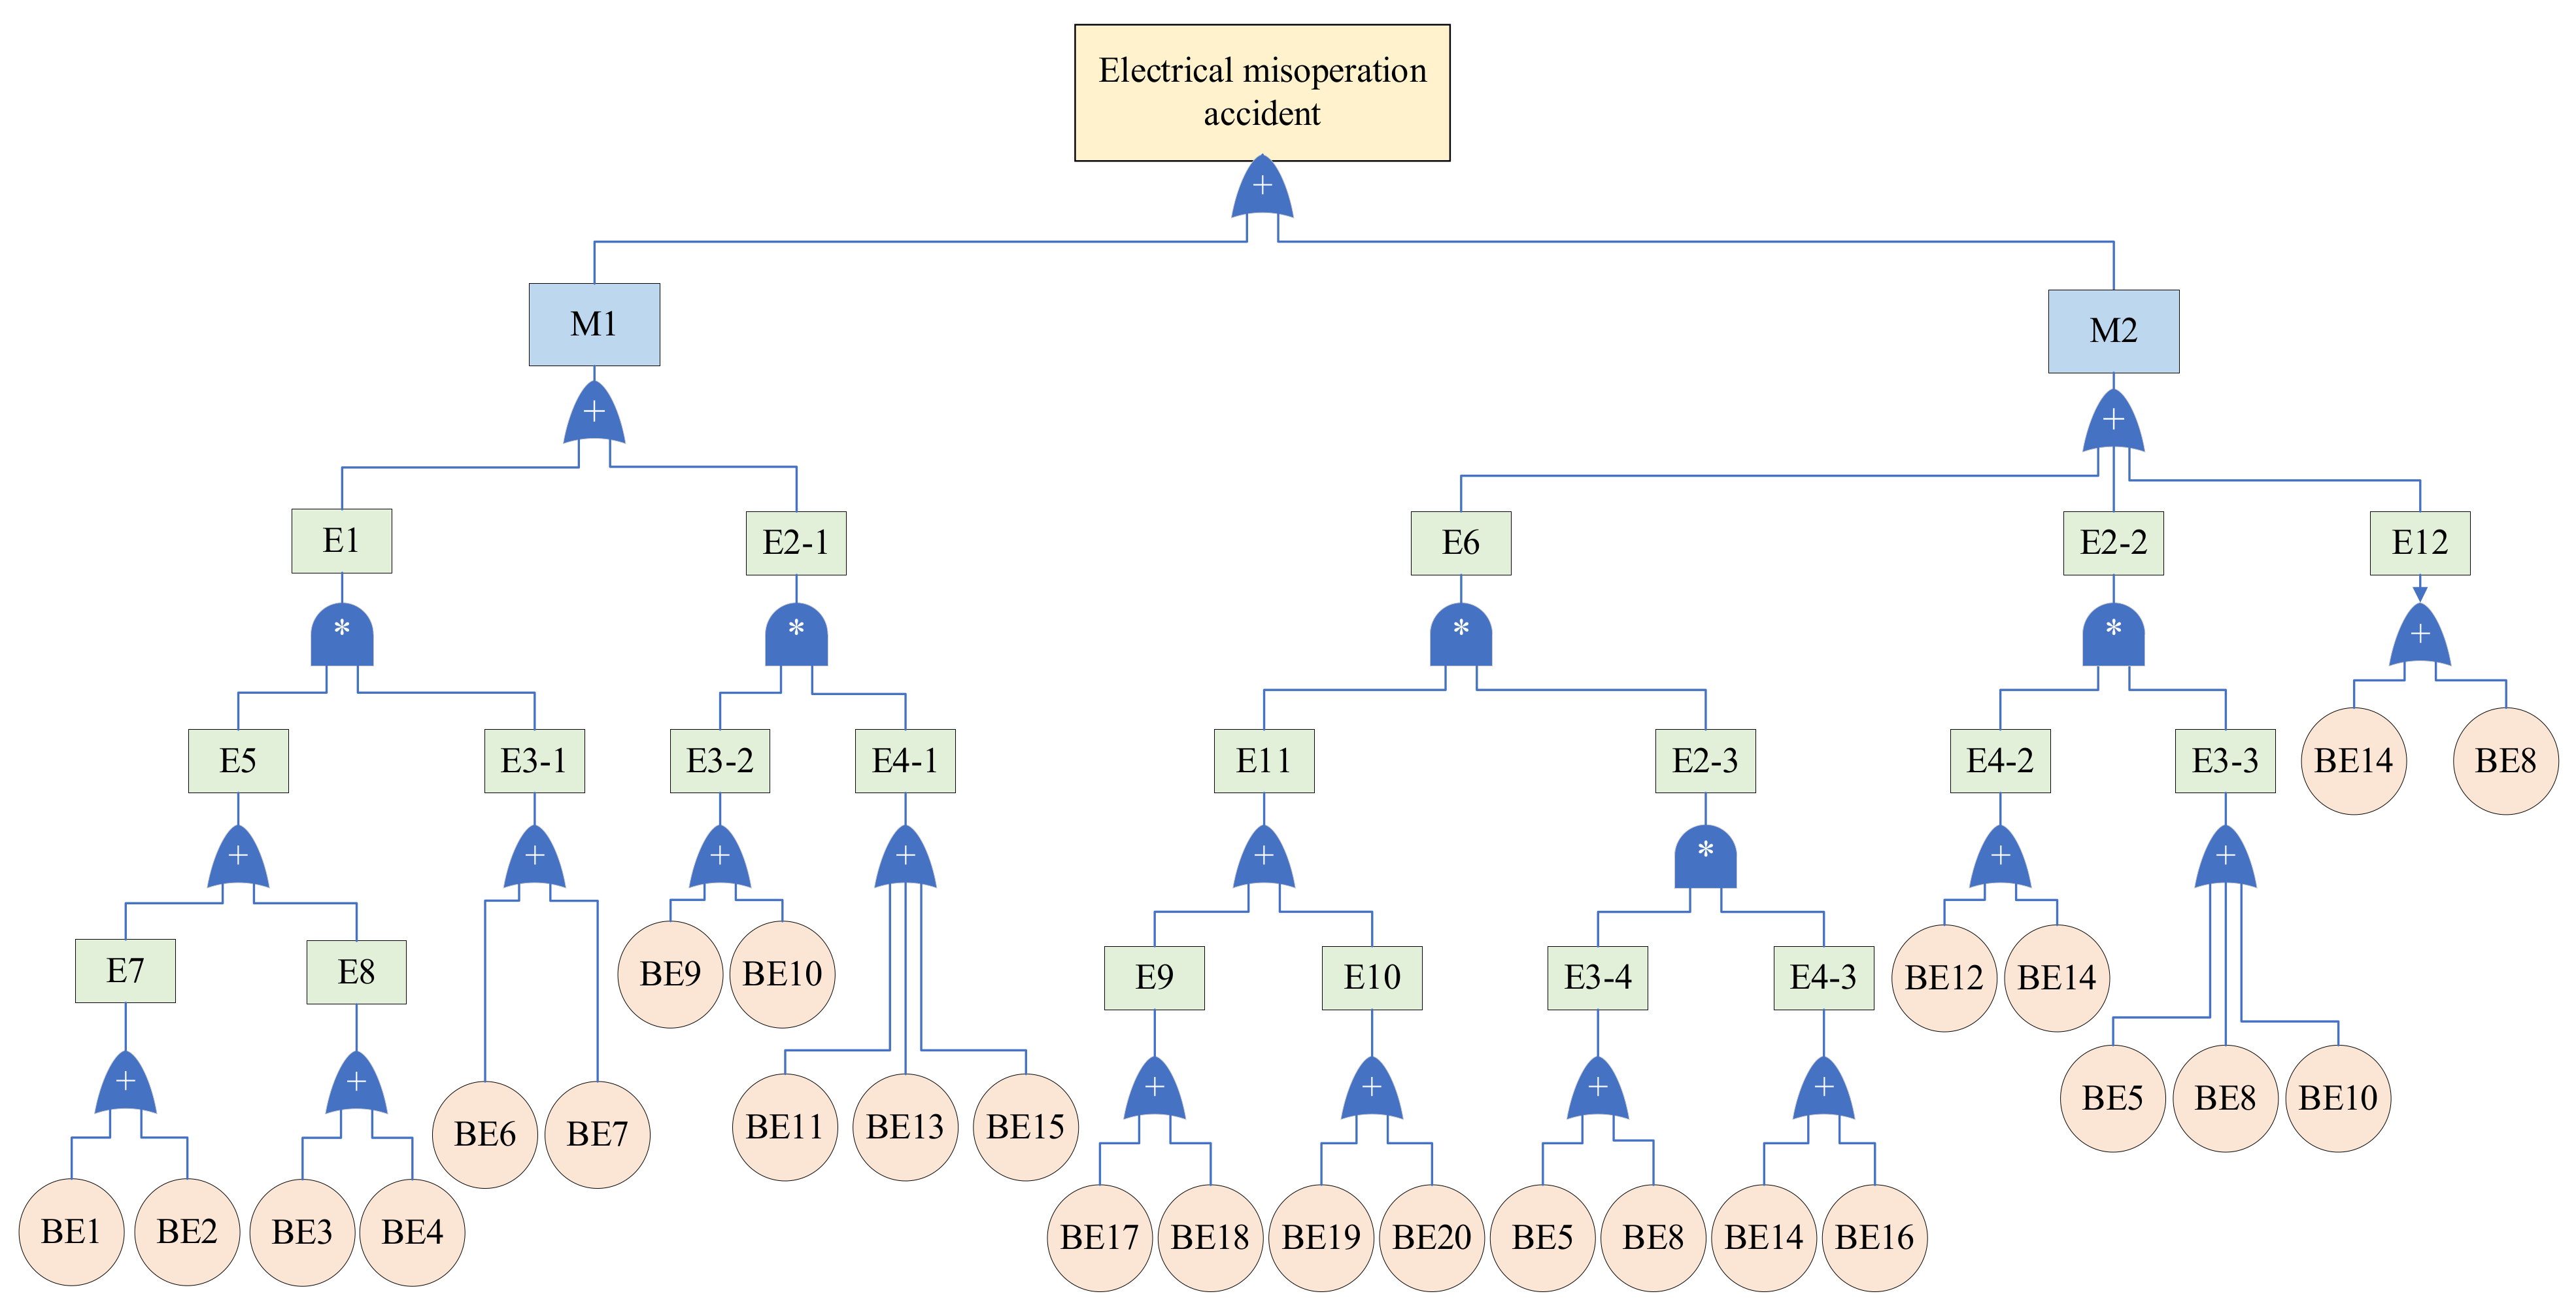
To construct a FT diagram, it is necessary to determine TE, IEs, and BEs, and establish the cause-and-effect relationship between these events using logic gates. In this study, considering accident reports, expert evaluations, and comparable studies, TE, IEs, and BEs can be transformed from the aforementioned HFACS–EMAs framework, and the final FT is illustrated in Figure 5. The TE of the FT is EMAs, and the connection with the TE is the ‘Misoperation’ and ‘Illegal operation’, because both of them will lead to the occurrence of the accident directly. The BEs are the nano-code from Level 2 to Level 4 in HFACS–EMAs (Appendix A), and the IEs are composed of a logical combination of BEs (Table 3).
4.2.2. Domain Expert Evaluations
The evaluation effect of experts is crucial to scientific conclusions. It is generally preferred to select a heterogeneous group with different experiences and various viewpoints as the composition of the expert group. In the present study, a heterogeneous group of experts was selected to calculate the impact rate of BEs in EMAs, and 11 power systems were employed to judge the HOFs. Refer to the expert weight scores listed in Table 1 and Equation (6) to calculate the expert’s weighting coefficient, and the results are shown in Table 4.
4.2.3. Fuzzification and Aggregation
The expert group used the language measurement scale in Table 2 to evaluate each BE, and the results were given in Table 5.
In the aggregation stage, BE5 was selected as an example. The S values (Table 6), the AA values, the RA values, and the CC values (Table 7) of the BE5 were calculated using Equations (8)–(11). As a result of these calculations, according to Equation (12), the aggregated result value of the BE5 was found to be (0.7565, 0.8219, 0.8873).
4.2.4. Defuzzification and Occurrence Failure Probability Generation
Do the same calculation as BE5 for other BEs, and the aggregated result value of other BEs can be obtained. Apply Equation (13) to convert to RAG (FPS), and then use Equation (14) to generate failure probability (FP). The FP of all BEs is presented in Table 8. The BE with the most enormous FPS (FP) was BE5, with a value of 0.8215 (4.1486 × 10⁻²). The BEs with the second and third most significant FPS (FP) were BE7 and BE10.
If the FP value of all BEs is known, the FP value of the TE can be calculated. The probability values of the BEs obtained from the fuzzification to the probability-generation stages were placed in the FT, finding the MCSs of FT and using Equation (4), and the probability value of the TE was calculated. In this study, the FP value of the TE was found to be 1.0414 × 10⁻².
4.3. Discussion of the Results
From Table 8, it can be obtained that the failure probability of electrical misoperation accidents is 1.0414 × 10⁻². Compared with the 5.6E-03 probability of an electricity maintenance accident [50], the probability of occurrence of EMAs is relatively higher. Because this article not only considers the misoperation of maintenance but also considers the misoperation, it considers not only the human factor but also considers the organizational factor. Compared with the 7.401 × 10⁻² probability of occurrence of fire-explosion accidents in ship engine rooms [21], and the 4.823 × 10⁻² probability of occurrence of LPG release accidents [19], the probability of occurrence of EMAs is relatively tiny. However, they belong to the same quantitative level. According to the “Safety Production Risk Management Measures” promulgated by various provinces in China [67], the probability of an accident between 0.01 and 1 is a very probable accident and must be controlled. It is confirmed once again that the accident analysis and prevention work of EMAs is meaningful.
In this study, the cut-set analysis method of FFTA was used to identify non-conforming items or combinations of non-conforming items that led to the occurrence of TE. It can be seen from Table 9 that Cut Set BE8 (Habitual violation) and BE14 (Supervisory violation) are among the top two, and violations by employees and commanders will directly lead to infractions. There are strict “two votes, three systems” rules and regulations for electricity production, but they are often ignored. Luo [68] deliberately summarized a number of ways in which the “two votes, three systems” had been violated. Wang [69] concluded that 70% to 80% of man-made operational accidents in power systems are directly linked to violations. This result obtained in this study is more in line with reality.
The weakest cut set combination is the BE12 (Work preparation) and BE5 (Thoughts are paralyzed, work is sloppy and irresponsible) combination. It is necessary to avoid the team’s work preparation before the operation, especially the explanation of dangerous points and the arrangement of safety measures, which occur at the same time as the paralysis and irresponsible thinking of the operators. Gruenefeld et al. [70] pointed out that human error mostly occurs due to a general lack of situational awareness among personnel. By not explaining the dangerous points before the operation and by not placing safety measures in place, the operator will lack situational awareness of their area of operation and the risk of accidents. At the same time, paralysis in the operator’s mind and taking things for granted will inevitably lead to accidents and even loss of life [71].
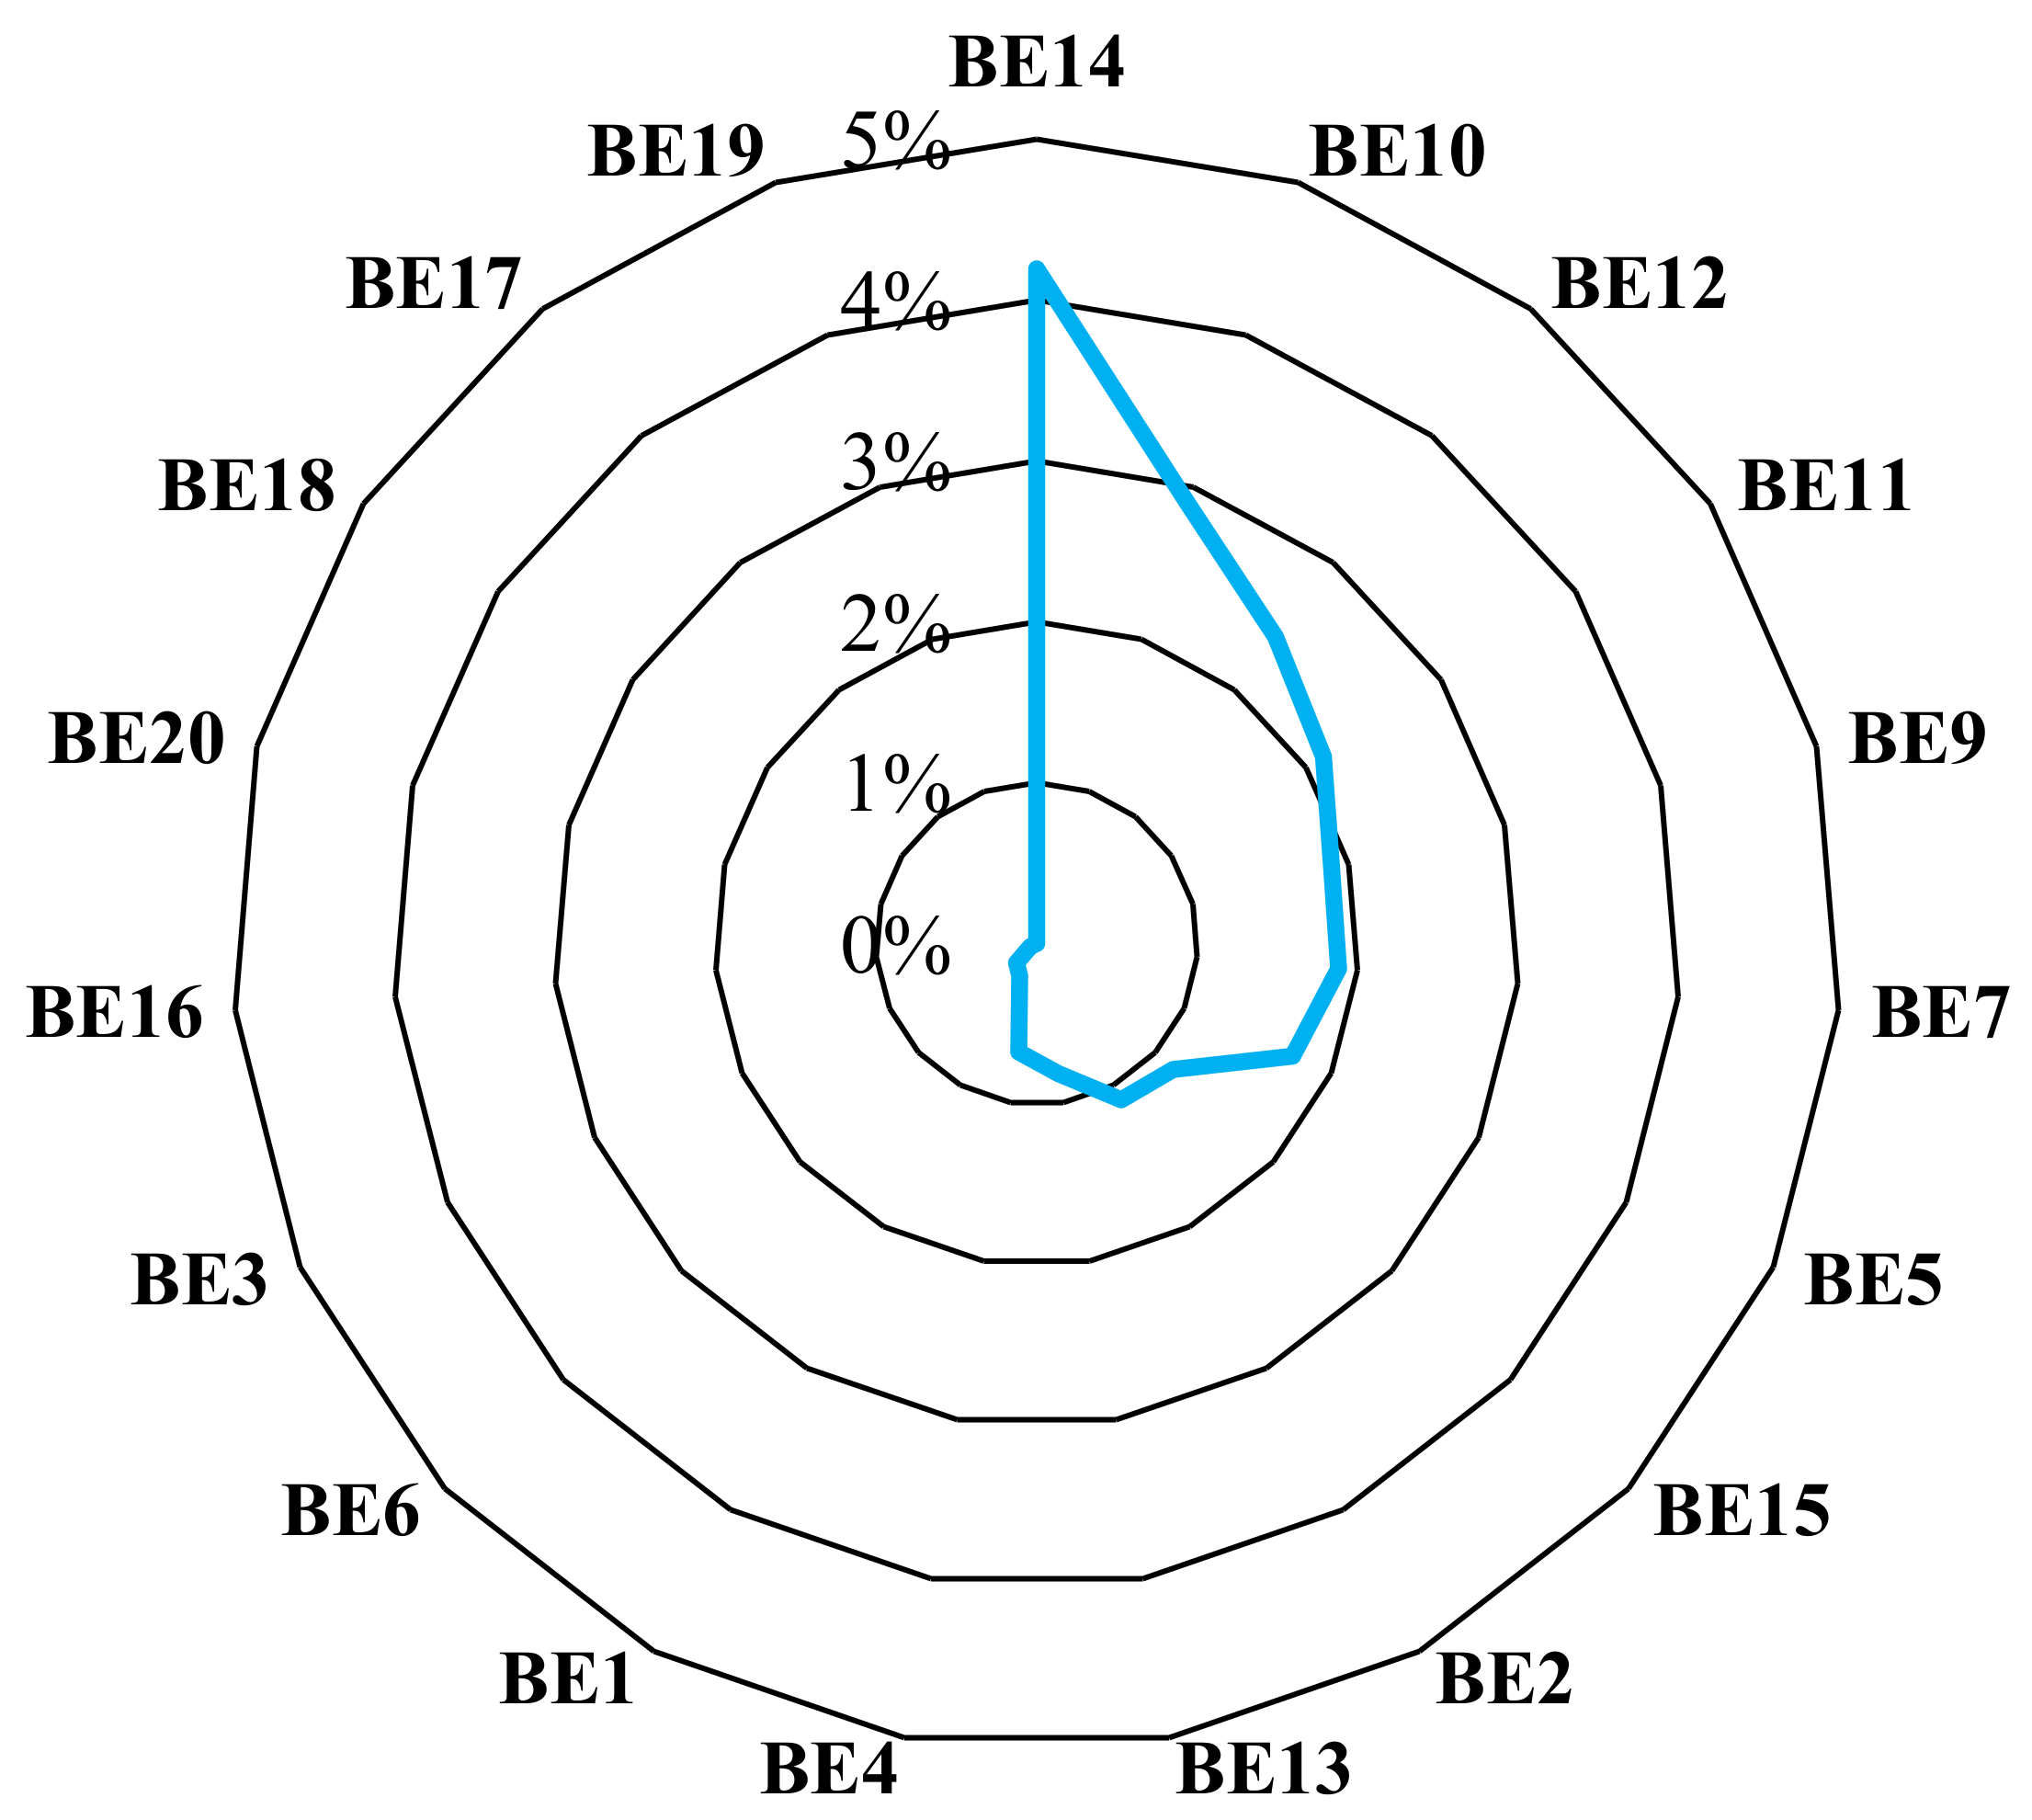
Assuming that measures are taken to eliminate the inappropriate items of BE12, the incidence of TE will be reduced to 1.0163 × 10⁻², and the risk will be reduced by 2.42% compared to the original. Similar analysis can be performed for other MCSs relations. Figure 6 shows the percentage value of the accident risk that can be reduced by eliminating any BE.
This method is used to find out all possible causes of EMAs, as well as the most critical factors and weakest links that affect the reliability of the system so that these critical events can be paid attention to in daily operations in order to manage and control risks more effectively. Although the factors that caused the accident cannot be entirely eliminated through the FFTA inspection and evaluation, the risk of the accident can be minimized by taking preventive measures.
5. Conclusions
In this study, a hybrid model based on the HFACS and FFTA was used in the EMAs. The HOFs of EMAs were classified using the HFACS structure, and the formation process of accidents was revealed through the application of FFTA. According to the results, the following issue can be concluded:
- The roots of human and organizational errors in EMAs were identified and predicted based on the form of four levels of the HFACS method. The number of fundamental causes (more detailed level) detected at the level of the unsafe acts is 26, the preconditions for unsafe acts level is 62, the level of unsafe supervision is 12, and the level of organizational influences is 19.
- Using the FTA, a logical relationship between identified causes and human and organizational errors was constructed. 20 roots were identified as the BEs for the TE.
- The results of calculating and analyzing the probability of occurrence of EMAs using FFTA reach 1.0414 × 10⁻².
- The ranking of the MCSs showed that by controlling the occurrence of the BEs that constitute the MCSs, the occurrence of EMAs would be reduced.
As for the method itself, it has the following two advantages:
- (a)
- When quantitative historical fault data is scarce or unavailable, fuzzy logic can process qualitative data.
- (b)
- The use of linguistic values in system reliability assessment can express expert opinions intuitively and conveniently.
Although FFTA–HFACS has the above merits, it also has the following limitations:
- (1)
- FTA is the conversion of a physical system into a structured logical diagram [72] and, therefore, also requires certain incident scenarios for the construction of the incident tree structure.
- (2)
- The successful and exact application of this method still relies on the estimation of the probabilities of the BEs. Therefore, experts with extensive knowledge and experience should be consulted [18].
In light of above, further research can be conducted:
- The FFTA–HFACS hybrid approach can quantitatively assess the probability of failure and significant accident risk or a combination of their accident risks, but it lacks an explanation of how accident risk affects the occurrence of an accident. This is an issue that is well worth investigating.
- In this study, the MCS was artificially identified as an accident critical risk and its elimination would improve the reliability of the system. However, it has not yet been considered what measures can be taken to eliminate the MCS, and in this regard, the use of multi-criteria decision making (MCDM) may be a good idea in the future [64].
Author Contributions
C.L. and Q.X. contributed to paper writing and the whole revision process; Y.H. contributed to paper editing. All authors have read and agreed to the published version of the manuscript.
Funding
This research was funded by National Natural Science Foundation of China (51977038).
Institutional Review Board Statement
Not applicable.
Informed Consent Statement
Not applicable.
Data Availability Statement
Not applicable.
Conflicts of Interest
The authors declare no conflict of interest.
Appendix A

Table A1.
HFACS–EMAs framework hierarchy of identified human and organizational errors.
| Level | Sub-Level | Nano-Code | More Detailed Level | Frequency |
|---|---|---|---|---|
| Organizational influence | Organizational process | Five preventions, relay protection, and grounding device management are not strict and chaotic (BE17) | Inadequate management of equipment operation and maintenance | 12 |
| Ground wire management is chaotic | 4 | |||
| Equipment maintenance management is not in place | 2 | |||
| Protect connection piece management vulnerabilities | 2 | |||
| Mistake prevention device management vulnerabilities | 16 | |||
| Irregular use of security tools | 1 | |||
| Inadequate management of equipment numbers, identification plates, drawings and documents | 15 | |||
| Worksite safety measures and safety management are not in place (BE18) | The two-vote-three system is not strictly enforced | 17 | ||
| Lax acceptance management | 14 | |||
| Recitation system is a mere formality | 8 | |||
| On-site safety production management is not in place | 45 | |||
| Vulnerabilities in scheduling management | 8 | |||
| There are loopholes in relay protection management | 2 | |||
| Operating recording system loopholes | 3 | |||
| The safety production responsibility system is not in place, and there are loopholes in the operating procedures | 23 | |||
| Organizational climate | Ignore safety regulations, weak legal meaning of risks, and inadequate definition of responsibilities (BE19) | The assistance of various departments is poor | 4 | |
| The reward and punishment system is not perfect, and the assessment is not detailed | 5 | |||
| Not executed as scheduled | 5 | |||
| Training and education | Lack of targeted training and education, poor results, and poor training (BE20) | Safety education and training are unfavorable and mere formality | 32 | |
| Unsafe Supervision | Inadequate supervision | Lax supervision, mere formality, and weak inspections (BE13) | Inadequate guardianship/supervision | 80 |
| The operation ticket was not reviewed carefully | 17 | |||
| Supervisory violation | Supervisors command in violation of regulations and knowingly commit crimes (BE14) | Did not perform voicing or recitation operations | 15 | |
| Assign non-work related tasks | 1 | |||
| Illegal command | 10 | |||
| No rehearsal of the five-prevention operation | 1 | |||
| Poor work ticket awareness | 3 | |||
| Failure to correct known problem | Failure to discover potential safety hazards in a timely manner, and fail to correct problems in a timely manner (BE15) | Equipment inspection is not in place, burying hidden dangers | 15 | |
| Failure to detect violations and failures in time | 13 | |||
| Found the problem but did not stop it and rectify it | 23 | |||
| Planned inappropriate operators | Unreasonable schedule and improper work schedule (BE16) | Unclear responsibilities, unclear tasks | 14 | |
| Unreasonable construction period, unreasonable division of labor, lack of co-ordination of work tasks | 13 | |||
| Preconditions for Unsafe Acts | Physical environment | Bad weather (BE1) | Thunderstorm weather / Heavy rain | 6 |
| Infrastructure/design legacy issues (BE2) | Infrastructure legacy | 3 | ||
| Design legacy issues | 7 | |||
| Installation conditions | Five preventions of microcomputer working abnormally (BE3) | Five anti-lock corrosion, bayonet failure | 3 | |
| Relay protection failure | 1 | |||
| Relay protection setting value error | 5 | |||
| Microcomputer five defenses are not equipped with a backup power supply | 2 | |||
| The protection device is black or the circuit is faulty | 5 | |||
| Five preventions of microcomputer communication interruption and system abnormality | 4 | |||
| Electrical equipment failure (BE4) | Operating mechanism failure | 8 | ||
| Insulation drops because of moisture | 1 | |||
| Isolation switch is defective | 1 | |||
| Transformer on-load switch failure | 1 | |||
| Circuit breaker leakage | 2 | |||
| The equipment does not meet the requirements for preventing misoperation | 4 | |||
| Psychological states | Thoughts are paralyzed, work is sloppy and irresponsible (BE5) | Careless work, carelessness, fluke mentality | 10 | |
| Paralyzed thinking, irresponsible | 72 | |||
| Conceal a mistake | 2 | |||
| Mental states | Lack of concentration, fatigue (BE6) | Forget | 3 | |
| Negligence, wrong memory | 5 | |||
| Fatigue | 3 | |||
| Distracted and poor | 9 | |||
| Overly nervous | 3 | |||
| Safety awareness | Weak safety meaning, work with experience (BE7) | Low security awareness | 49 | |
| Insufficient self-protection awareness | 3 | |||
| Quality and ability | Habitual violation (BE8) | Did not check the operation mode carefully | 4 | |
| The grounding switch position is not checked | 3 | |||
| Unauthorized operation | 29 | |||
| False record operation ticket | 4 | |||
| Cross the safety fence and remove the warning sign | 3 | |||
| Failure to check the operation ticket carefully | 7 | |||
| Failure to carefully check the drawings and field wiring | 5 | |||
| Failure to carefully check the device name, location, and serial number | 38 | |||
| Unfulfilled work ticket termination procedures | 1 | |||
| Forced operation, forced construction | 5 | |||
| The operation ticket is not filled in as required | 11 | |||
| Unauthorized use of the master key | 7 | |||
| Lie to report | 4 | |||
| Did not perform voicing or recitation operations | 14 | |||
| Unfamiliar with the principle, do not understand the situation (BE9) | Misunderstanding | 15 | ||
| Take it for granted, operate by experience | 10 | |||
| Not familiar with the operating mode | 7 | |||
| Not familiar with system equipment | 16 | |||
| Insufficient grasp of the quadratic principle | 8 | |||
| Do not understand the situation of safety facilities | 3 | |||
| Not familiar with operation and scheduling procedures | 7 | |||
| Operation is not recorded | 3 | |||
| Lack of emergency response capabilities | 2 | |||
| Blind obedience (BE10) | Not report and verify in time | 15 | ||
| Blind obedience, blind operation | 12 | |||
| Communication | Incomplete communication and unclear division of labor (BE11) | Failure to accurately sing and repeat | 13 | |
| No use of canonical terminology | 7 | |||
| Insufficient information exchange | 8 | |||
| Work preparation | Incomplete confession, no electricity test before operation, uncounted grounding wire (BE12) | Incomplete shift of duty work | 7 | |
| Safety measures and safety settings are not in place | 31 | |||
| No control and analysis of dangerous points | 21 | |||
| Did not carefully count the grounding wires | 1 | |||
| No prior electricity check | 7 | |||
| No comprehensive technical clarification | 8 | |||
| Operation ticket missing items | 4 | |||
| On-site equipment inspection and inspection are not in place | 10 | |||
| Not enough time (BE12) | Operation time is tight | 3 | ||
| Unsafe Acts | Misoperation (M1) | Inadvertent misconduct | Mismatch, mislink | 5 |
| Walk into the wrong interval | 12 | |||
| Mistuning | 3 | |||
| Misuse of the (relay) protection, mistake out of the protection | 2 | |||
| Accidentally touched, accidentally pressed | 14 | |||
| Pull by mistake | 5 | |||
| Missing investment protection | 6 | |||
| Mis-scheduling | 2 | |||
| Miswiring | 4 | |||
| Wrong throw and return of the connecting piece | 13 | |||
| Slip and fall accidentally | 3 | |||
| Excessive force | 2 | |||
| Illegal operation (M2) | Violation of the two-vote-three system | Unauthorized expansion of the scope of work | 16 | |
| Jump item/Miss item operation | 17 | |||
| No feedback to dispatcher | 5 | |||
| Not marked on work ticket | 1 | |||
| Failure to carefully check the device name, location, and serial number | 40 | |||
| Failure to conduct electrical inspections and tests | 7 | |||
| No ticket operation | 15 | |||
| No recording system implemented | 6 | |||
| Voting and repeating system not implemented | 13 | |||
| Impostor job | 3 | |||
| The operation ticket was not reviewed carefully | 7 | |||
| Violation of the work permit system | 1 | |||
| Illegal use of the unlock key to operate | 5 | |||
| Switching is not executed by two people | 1 |
References
- National Energy Administration. Available online: http://www.nea.gov.cn/2021-03/25/c_139834495.htm (accessed on 25 March 2021).
- Avella, P.C.; Cabra, Á.M.; Montoya, N.D.; Barreto, A.B.; Botero, L.S.; Vargas, J. Evento del 26 de Abril de 2007 en el sistEMAs Interconectado Nacional sin Colombiano; XM Companıa de Expertos en Mercados: Medellín, Colombia, 2007. [Google Scholar]
- Veloza, O.P.; Santamaria, F. Analysis of major blackouts from 2003 to 2015: Classification of incidents and review of main causes. Electr. J. 2016, 29, 42–49. [Google Scholar] [CrossRef]
- Reason, J. Managing the Risks of Organizational Accidents; Ashgate Pub Ltd.: Aldershot, UK, 1997. [Google Scholar]
- Wiegmann, D.A.; Shappell, S.A. A Human Error Approach to Aviation Accident Analysis: The Human Factors Analysis and Classification System; Routledge: London, UK, 2017. [Google Scholar]
- Wu, J.; Quan, S.; Jiang, H.; Chen, A. Survey on quantification of human factor risk in electric misoperation. Mech. Electr. Eng. Technol. 2015, 44, 13–16. [Google Scholar]
- Harris, D.; Li, W.C. An extension of the Human Factors Analysis and Classification System for use in open systems. Theor. Issues Ergon. Sci. 2011, 12, 108–128. [Google Scholar] [CrossRef]
- Ergai, A.; Cohen, T.; Sharp, J.; Wiegmann, D.; Gramopadhye, A.; Shappell, S. Assessment of the Human Factors Analysis and Classification System (HFACS): Intra-rater and inter-rater reliability. Saf. Sci. 2016, 82, 393–398. [Google Scholar] [CrossRef] [Green Version]
- Yıldırım, U.; Başar, E.; Uğurlu, Ö. Assessment of collisions and grounding accidents with human factors analysis and classification system (HFACS) and statistical methods. Saf. Sci. 2019, 119, 412–425. [Google Scholar] [CrossRef]
- Hollaway, D.M.A.; Johnson, J.D. Human factors analysis and classification system (HFACS): Investigatory tool for human factors in offshore operational safety. In Proceedings of the Offshore Technology Conference, Houston, TX, USA, 5–8 May 2014; OnePetro: Houston, TX, USA, 2014. [Google Scholar]
- Zarei, E.; Yazdi, M.; Abbassi, R.; Khan, F. A hybrid model for human factor analysis in process accidents: FBN-HFACS. J. Loss Prev. Process. Ind. 2019, 57, 142–155. [Google Scholar] [CrossRef]
- Wang, Y.F.; Roohi, S.F.; Hu, X.M.; Xie, M. Investigations of Human and Organizational Factors in hazardous vapor accidents. J. Hazard. Mater. 2011, 191, 69–82. [Google Scholar] [CrossRef] [PubMed]
- Wang, Y.F.; Roohi, S.F.; Hu, X.M.; Xie, M. A new methodology to integrate human factors analysis and classification system with Bayesian Network. In Proceedings of the 2010 IEEE International Conference on Industrial Engineering and Engineering Management, Macao, China, 7–10 December 2010; pp. 1776–1780. [Google Scholar]
- Jaise, J.; Kumar NB, A.; Shanmugam, N.S.; Sankaranarayanasamy, K. Power system: A reliability assessment using FTA. Int. J. Syst. Assur. Eng. Manag. 2013, 4, 78–85. [Google Scholar] [CrossRef]
- Misra, K.B.; Weber, G.G. Use of fuzzy set theory for level-I studies in probabilistic risk assessment. Fuzzy Sets Syst. 1990, 37, 139–160. [Google Scholar] [CrossRef]
- Singer, D. A fuzzy set approach to fault tree and reliability analysis. Fuzzy Sets Syst. 1990, 34, 145–155. [Google Scholar] [CrossRef]
- Shu, M.H.; Cheng, C.H.; Chang, J.R. Using intuitionistic fuzzy sets for fault-tree analysis on printed circuit board assembly. Microelectron. Reliab. 2006, 46, 2139–2148. [Google Scholar] [CrossRef]
- Yin, H.; Liu, C.; Wu, W.; Song, K.; Liu, D.; Dan, Y. Safety assessment of natural gas storage tank using similarity aggregation method based fuzzy fault tree analysis (SAM-FFTA) approach. J. Loss Prev. Process. Ind. 2020, 66, 104159. [Google Scholar] [CrossRef]
- Rajakarunakaran, S.; Kumar, A.M.; Prabhu, V.A. Applications of fuzzy faulty tree analysis and expert elicitation for evaluation of risks in LPG refuelling station. J. Loss Prev. Process. Ind. 2015, 33, 109–123. [Google Scholar] [CrossRef]
- Qiao, W.; Liu, Y.; Ma, X.; Liu, Y. A methodology to evaluate human factors contributed to maritime accident by mapping fuzzy FT into ANN based on HFACS. Ocean. Eng. 2020, 197, 106892. [Google Scholar] [CrossRef]
- Sarıalioğlu, S.; Uğurlu, Ö.; Aydın, M.; Vardar, B.; Wang, J. A hybrid model for human-factor analysis of engine-room fires on ships: HFACS-PV&FFTA. Ocean. Eng. 2020, 217, 107992. [Google Scholar]
- Li, Y.; Jin, N.; Hong, M. Human accident hidden hazard identification and evaluation of power grid enterprise based on HFACS and grey correlation analysis method. J. Saf. Sci. Technol. 2013, 9, 157–161. [Google Scholar]
- Liu, J.; Zhang, L.; Zou, Y.; Sun, Q.; Liu, X.; Chen, S. Identification of correlation among performance shaping factors of SPAR-H method. Nucl. Power Eng. 2021, 42, 144–150. [Google Scholar]
- Liu, Y.; Zhang, L.; Hu, H. Analysis of human factors in electric power production accidents based on improved HFACS. Value Eng. 2017, 36, 240–242. [Google Scholar]
- Tang, J.; Bao, Y.; Liu, W. Fuzzy weighted method of human reliability assessment in substation operation. Proc. CSU-EPSA 2016, 28, 1–5. [Google Scholar]
- Lu, H.; Wang, M.; Guo, C.; Yu, B. A quantitative method for human reliability in power system based on CREAM. Power Syst. Prot. Control 2013, 41, 37–42. [Google Scholar]
- Reason, J. The contribution of latent human failures to the breakdown of complex systems. Philos. Trans. R. Soc. London. B Biol. Sci. 1990, 327, 475–484. [Google Scholar] [PubMed]
- Shappell, S.A.; Wiegmann, D.A. The Human Factors Analysis and Classification System—HFACS; EMBRY-RIDDLE Aeronautical University Press: Oklahoma City, OK, USA, 2000. [Google Scholar]
- Liu, R.; Cheng, W.; Yu, Y.; Xu, Q.; Jiang, A.; Lv, T. An impacting factors analysis of miners’ unsafe acts based on HFACS-CM and SEM. Process. Saf. Environ. Prot. 2019, 122, 221–231. [Google Scholar] [CrossRef]
- Zhang, Y.; Jing, L.; Bai, Q.; Liu, T.; Feng, Y. A systems approach to extraordinarily major coal mine accidents in China from 1997 to 2011: An application of the HFACS approach. Int. J. Occup. Saf. Ergon. 2019, 25, 181–193. [Google Scholar] [CrossRef]
- Zhan, Q.; Zheng, W.; Zhao, B. A hybrid human and organizational analysis method for railway accidents based on HFACS-Railway Accidents (HFACS-RAs). Saf. Sci. 2017, 91, 232–250. [Google Scholar] [CrossRef]
- Wang, J.; Fan, Y.; Gao, Y. Revising HFACS for SMEs in the chemical industry: HFACS-CSMEs. J. Loss Prev. Process. Ind. 2020, 65, 104138. [Google Scholar] [CrossRef]
- Chen, S.T.; Wall, A.; Davies, P.; Yang, Z.; Chou, Y.-H. A Human and Organisational Factors (HOFs) analysis method for marine casualties using HFACS-Maritime Accidents (HFACS-MA). Saf. Sci. 2013, 60, 105–114. [Google Scholar] [CrossRef]
- Schröder-Hinrichs, J.U.; Baldauf, M.; Ghirxi, K.T. Accident investigation reporting deficiencies related to organizational factors in machinery space fires and explosions. Accid. Anal. Prev. 2011, 43, 1187–1196. [Google Scholar] [CrossRef]
- Batalden, B.M.; Sydnes, A.K. Maritime safety and the ISM code: A study of investigated casualties and incidents. WMU J. Marit. Aff. 2014, 13, 3–25. [Google Scholar] [CrossRef] [Green Version]
- Kim, S.K.; Lee, Y.H.; Jang, T.I.; Oh, Y.J.; Shin, K.H. An investigation on unintended reactor trip events in terms of human error hazards of Korean nuclear power plants. Ann. Nucl. Energy 2014, 65, 223–231. [Google Scholar] [CrossRef]
- Baig, A.A.; Ruzli, R.; Buang, A.B. Reliability analysis using fault tree analysis: A review. Int. J. Chem. Eng. Appl. 2013, 4, 169. [Google Scholar] [CrossRef] [Green Version]
- Hyun, K.C.; Min, S.; Choi, H.; Park, J.; Lee, I.-M. Risk analysis using fault-tree analysis (FTA) and analytic hierarchy process (AHP) applicable to shield TBM tunnels. Tunn. Undergr. Space Technol. 2015, 49, 121–129. [Google Scholar] [CrossRef]
- Uğurlu, Ö.; Köse, E.; Yıldırım, U.; Yüksekyıldız, E. Marine accident analysis for collision and grounding in oil tanker using FTA method. Marit. Policy Manag. 2015, 42, 163–185. [Google Scholar] [CrossRef]
- Hosseini, N.; Givehchi, S.; Maknoon, R. Cost-based fire risk assessment in natural gas industry by means of fuzzy FTA and ETA. J. Loss Prev. Process. Ind. 2020, 63, 104025. [Google Scholar] [CrossRef]
- Antao, P.; Soares, C.G. Fault-tree models of accident scenarios of RoPax vessels. Int. J. Autom. Comput. 2006, 3, 107–116. [Google Scholar] [CrossRef]
- Miri, L.M.R.; Wang, J.; Yang, Z.; Finlay, J. Application of fuzzy fault tree analysis on oil and gas offshore pipelines. Int. J. Mar. Sci. Eng. 2011, 1, 29–42. [Google Scholar]
- Peeters, J.; Basten, R.J.; Tinga, T. Improving failure analysis efficiency by combining FTA and FMEA in a recursive manner. Reliab. Eng. Syst. Saf. 2018, 172, 36–44. [Google Scholar] [CrossRef] [Green Version]
- Liang, G.S.; Wang, M.J.J. Fuzzy fault-tree analysis using failure possibility. Microelectron. Reliab. 1993, 33, 583–597. [Google Scholar] [CrossRef]
- Zadeh, L.A. Fuzzy Sets, Fuzzy Logic, and Fuzzy Systems: Selected Papers by Lotfi A Zadeh; World Scientific: Singapore, 1996; pp. 394–432. [Google Scholar]
- Zimmermann, H.J. Fuzzy set theory. In Wiley Interdisciplinary Reviews: Computational Statistics; Wiley: Hoboken, NJ, USA, 2010; Volume 2, pp. 317–332. [Google Scholar]
- Tanaka, H.; Fan, L.T.; Lai, F.S.; Toguchi, K. Fault-tree analysis by fuzzy probability. IEEE Trans. Reliab. 1983, 32, 453–457. [Google Scholar] [CrossRef]
- Misra, K.B.; Weber, G.G. A new method for fuzzy fault tree analysis. Microelectron. Reliab. 1989, 29, 195–216. [Google Scholar] [CrossRef]
- Lavasani, S.M.; Zendegani, A.; Celik, M. An extension to Fuzzy Fault Tree Analysis (FFTA) application in petrochemical process industry. Process. Saf. Environ. Prot. 2015, 93, 75–88. [Google Scholar] [CrossRef]
- Tavakoli, M.; Nafar, M. Modification of the FFTA method for calculating and analyzing the human reliability of maintenance groups in power transmission grids. Int. J. Syst. Assur. Eng. Manag. 2021, 1–14. [Google Scholar] [CrossRef]
- Kumar, M. A novel weakest t-norm based fuzzy importance measure for fuzzy fault tree analysis of combustion engineering reactor protection system. Int. J. Uncertain. Fuzziness Knowl.-Based Syst. 2019, 27, 949–967. [Google Scholar] [CrossRef]
- Cheliyan, A.S.; Bhattacharyya, S.K. Fuzzy fault tree analysis of oil and gas leakage in subsea production systems. J. Ocean. Eng. Sci. 2018, 3, 38–48. [Google Scholar] [CrossRef]
- Renjith, V.R.; Madhu, G.; Nayagam, V.L.G.; Bhasi, A.B. Two-dimensional fuzzy fault tree analysis for chlorine release from a chlor-alkali industry using expert elicitation. J. Hazard. Mater. 2010, 183, 103–110. [Google Scholar] [CrossRef] [PubMed]
- Zhu, C.; Tang, S.; Li, Z.; Fang, X. Dynamic study of critical factors of explosion accident in laboratory based on FTA. Saf. Sci. 2020, 130, 104877. [Google Scholar] [CrossRef]
- Chen, Y. The development and validation of a human factors analysis and classification system for the construction industry. Int. J. Occup. Saf. Ergon. 2020, 1–15. [Google Scholar] [CrossRef]
- Yuhua, D.; Datao, Y. Estimation of failure probability of oil and gas transmission pipelines by fuzzy fault tree analysis. J. Loss Prev. Process. Ind. 2005, 18, 83–88. [Google Scholar] [CrossRef]
- Vesely, W.E.; Goldberg, F.F.; Roberts, N.H.; Haasl, D.F. Fault Tree Handbook; Nuclear Regulatory Commission: Washington, DC, USA, 1981.
- Shafiee, M.; Enjema, E.; Kolios, A. An integrated FTA-FMEA model for risk analysis of engineering systems: A case study of subsea blowout preventers. Appl. Sci. 2019, 9, 1192. [Google Scholar] [CrossRef] [Green Version]
- Rausand, M.; Hoyland, A. System Reliability Theory: Models, Statistical Methods, and Applications; John Wiley & Sons: Hoboken, NJ, USA, 2003. [Google Scholar]
- Yazdi, M.; Daneshvar, S.; Setareh, H. An extension to fuzzy developed failure mode and effects analysis (FDFMEA) application for aircraft landing system. Saf. Sci. 2017, 98, 113–123. [Google Scholar] [CrossRef]
- Rostamabadi, A.; Jahangiri, M.; Zarei, E.; Kamalinia, M.; Banaee, S.; Samaei, M.R. A novel fuzzy bayesian network-HFACS (FBN-HFACS) model for analyzing human and organization factors (HOFs) in process accidents. Process. Saf. Environ. Prot. 2019, 132, 59–72. [Google Scholar] [CrossRef]
- Miller, G.A. The magical number seven, plus or minus two: Some limits on our capacity for processing information. Psychol. Rev. 1956, 63, 81. [Google Scholar] [CrossRef] [Green Version]
- Hsu, H.M.; Chen, C.T. Fuzzy hierarchical weight analysis model for multicriteria decision problem. J. Chin. Inst. Ind. Eng. 1994, 11, 126–136. [Google Scholar]
- Lavasani, S.M.; Ramzali, N.; Sabzalipour, F.; Akyuz, E. Utilisation of Fuzzy Fault Tree Analysis (FFTA) for quantified risk analysis of leakage in abandoned oil and natural-gas wells. Ocean. Eng. 2015, 108, 729–737. [Google Scholar] [CrossRef]
- Wang, W.J. New similarity measures on fuzzy sets and on elements. Fuzzy Sets Syst. 1997, 85, 305–309. [Google Scholar] [CrossRef]
- Onisawa, T. An application of fuzzy concepts to modelling of reliability analysis. Fuzzy Sets Syst. 1990, 37, 267–286. [Google Scholar] [CrossRef]
- Foshan People’s Government. Available online: http://www.foshan.gov.cn/zwgk/zfgb/rmzfbgswj/content/post_1743618.html (accessed on 10 February 2019).
- Luo, Z. A brief discussion on the problems of “two tickets” in the use of electric power production safety work. Chin. Foreign Entrep. 2013, 163–164. [Google Scholar]
- Wang, Y. Trial description of habitual violation and preventive measures. Guangxi Electr. Ind. 2010, 80, 126. [Google Scholar]
- Gruenefeld, U.; Stratmann, T.C.; Brueck, Y.; Hahn, A.; Boll, S.; Heuten, W. Investigations on container ship berthing from the pilot’s perspective: Accident analysis, ethnographic study, and online survey. TransNav Int. J. Mar. Navig. Saf. Sea Transp. 2018, 12, 493–498. [Google Scholar] [CrossRef]
- Fan, S.; Blanco-Davis, E.; Yang, Z.; Zhang, J.; Yan, X. Incorporation of human factors into maritime accident analysis using a data-driven Bayesian network. Reliab. Eng. Syst. Saf. 2020, 203, 107070. [Google Scholar] [CrossRef]
- Mahmood, Y.A.; Ahmadi, A.; Verma, A.K.; Srividya, A.; Kumar, U. Fuzzy fault tree analysis: A review of concept and application. Int. J. Syst. Assur. Eng. Manag. 2013, 4, 19–32. [Google Scholar] [CrossRef]
Figure 1.
The framework of the study.

Figure 2.
The HFACS framework.

Figure 3.
The distribution of the HOFs in EMAs.

Figure 4.
The distribution of HFACS–EMAs sub-categories.

Figure 5.
FT structure of EMAs.

Figure 6.
Percentage of risk reduction.

Table 1.
Expert’s weighting scores.
| Constitution | Classification | Score |
|---|---|---|
| Professional position | Foreman/Deputy foreman | 5 |
| Shift foreman/Safety officer | 4 | |
| Deputy shift foreman/Technician | 3 | |
| Watcher/Deputy watcher | 2 | |
| Trainee | 1 | |
| Education-level/Competency (The higher one is preferred) | Doctor/Senior technician | 5 |
| Master/Senior engineer | 4 | |
| Undergraduate/Intermediate engineer | 3 | |
| Junior college/Junior engineer | 2 | |
| Below the junior college/Junior engineer | 1 | |
| Professional experience time | Greater than 20 years | 5 |
| 15 to 20 | 4 | |
| 10 to 15 | 3 | |
| 5 to 10 | 2 | |
| Less than 5 years | 1 |
Table 2.
Linguistic measurement scale.
| Scale | TFN | ||
|---|---|---|---|
| a1 | a2 | a3 | |
| Very low (VL) | 0.00 | 0.04 | 0.08 |
| Low (L) | 0.07 | 0.13 | 0.19 |
| Medium low (ML) | 0.17 | 0.27 | 0.37 |
| Medium (M) | 0.35 | 0.50 | .065 |
| Medium high (MH) | 0.63 | 0.73 | 0.83 |
| High (H) | 0.81 | 0.87 | 0.93 |
| Very high (VH) | 0.92 | 0.96 | 1.00 |
Table 3.
IEs involved in the EMAs.
| Item | Description | Item | Description |
|---|---|---|---|
| E1 | External factors | E9 | Rules and regulations |
| E2-X | Process factors | E10 | Company culture |
| E3-X | Personal qualities | E11 | Organizational influence |
| E4-X | Team management | E12 | Direct violation factors |
| E5 | Environmental factor | X | Refers to the serial number |
| E6 | Organizational factors | M1 | Misoperation |
| E7 | Poor physical environment | M2 | Illegal operation |
| E8 | Bad device defect |
Table 4.
The situation of the expert group and the weighting of experts.
| Expert no. | Professional Position | Education-Level /Competency | Professional Experience (Year) | Weighting Score | Total Score | Weighting Coefficient | ||
|---|---|---|---|---|---|---|---|---|
| SPP | SEC | SPE | ||||||
| 1 | Foreman | Senior technician | 16 | 5 | 5 | 4 | 1 | Foreman |
| 2 | Deputy foreman | Senior technician | 25 | 5 | 5 | 5 | 2 | Deputy foreman |
| 3 | Shift foreman | Senior technician | 11 | 4 | 5 | 3 | 3 | Shift foreman |
| 4 | Safety officer | Senior engineer | 6 | 4 | 4 | 2 | 4 | Safety officer |
| 5 | Safety officer | Doctor | 8 | 4 | 5 | 2 | 5 | Safety officer |
| 6 | Deputy shift foreman | Senior technician | 6 | 3 | 5 | 2 | 6 | Deputy shift foreman |
| 7 | Technician | Master | 4 | 3 | 4 | 1 | 7 | Technician |
| 8 | Watcher | Senior engineer | 5 | 2 | 4 | 1 | 8 | Watcher |
| 9 | Deputy watcher | Intermediate engineer | 2 | 2 | 3 | 1 | 9 | Deputy watcher |
| 10 | Deputy watcher | Undergraduate | 2 | 2 | 3 | 1 | 10 | Deputy watcher |
| 11 | Trainee | Undergraduate | 0.5 | 1 | 3 | 1 | 11 | Trainee |
Table 5.
Linguistic results of experts evaluations of BEs.
| BE No. | ||||||||||||||||||||
|---|---|---|---|---|---|---|---|---|---|---|---|---|---|---|---|---|---|---|---|---|
| Experts | 1 | 2 | 3 | 4 | 5 | 6 | 7 | 8 | 9 | 10 | 11 | 12 | 13 | 14 | 15 | 16 | 17 | 18 | 19 | 20 |
| 1 | L | MH | L | ML | VH | ML | MH | M | H | H | MH | M | L | ML | M | ML | M | ML | ML | M |
| 2 | L | M | L | M | H | ML | M | MH | H | H | M | MH | L | L | ML | L | ML | ML | ML | M |
| 3 | ML | M | VL | M | H | L | MH | ML | M | M | ML | ML | ML | L | M | M | ML | ML | L | M |
| 4 | L | M | ML | MH | H | ML | H | MH | MH | M | MH | ML | M | M | ML | ML | M | L | L | MH |
| 5 | ML | M | L | M | H | ML | MH | MH | M | MH | ML | ML | MH | ML | H | ML | L | ML | L | M |
| 6 | M | M | VL | M | VH | M | MH | M | M | VH | VH | ML | MH | L | MH | L | ML | M | M | M |
| 7 | ML | ML | ML | ML | MH | ML | H | H | MH | M | M | H | M | ML | M | MH | M | MH | ML | M |
| 8 | H | M | ML | M | MH | MH | VH | H | VH | VH | VH | VH | MH | VH | VH | M | M | H | H | H |
| 9 | VL | ML | L | ML | H | H | MH | L | M | M | M | MH | M | VL | ML | M | L | L | L | ML |
| 10 | M | MH | M | ML | L | ML | VL | ML | M | M | ML | VL | VL | VL | VL | ML | L | VL | VL | VL |
| 11 | VH | M | M | M | MH | MH | MH | MH | M | M | M | M | M | ML | ML | M | ML | ML | ML | ML |
Table 6.
The S values of BE 5.
| Expert No. | Membership Function | S | S Value | S | S Value | S | S Value | S | S Value | ||
|---|---|---|---|---|---|---|---|---|---|---|---|
| a1 | a2 | a3 | |||||||||
| 1 | 0.9200 | 0.9600 | 1 | S (1,2) | 0.9100 | S (2,7) | 0.8600 | S (4,6) | 0.9100 | S (6,9) | 0.9100 |
| 2 | 0.8100 | 0.8700 | 0.9300 | S (1,3) | 0.9100 | S (2,8) | 0.8600 | S (4,7) | 0.8600 | S (6,10) | 0.1700 |
| 3 | 0.8100 | 0.8700 | 0.9300 | S (1,4) | 0.9100 | S (2,9) | 1 | S (4,8) | 0.8600 | S (6,11) | 0.7700 |
| 4 | 0.8100 | 0.8700 | 0.9300 | S (1,5) | 0.9100 | S (2,10) | 0.2600 | S (4,9) | 1 | S (7,8) | 1 |
| 5 | 0.8100 | 0.8700 | 0.9300 | S (1,6) | 1 | S (2,11) | 0.8600 | S (4,10) | 0.2600 | S (7,9) | 0.8600 |
| 6 | 0.9200 | 0.9600 | 1 | S (1,7) | 0.7700 | S (3,4) | 1 | S (4,11) | 0.8600 | S (7,10) | 0.4000 |
| 7 | 0.6300 | 0.7300 | 0.8300 | S (1,8) | 0.7700 | S (3,5) | 1 | S (5,6) | 0.9100 | S (7,11) | 1 |
| 8 | 0.6300 | 0.7300 | 0.8300 | S (1,9) | 0.9100 | S (3,6) | 0.9100 | S (5,7) | 0.8600 | S (8,9) | 0.8600 |
| 9 | 0.8100 | 0.8700 | 0.9300 | S (1,10) | 0.1700 | S (3,7) | 0.8600 | S (5,8) | 0.8600 | S (8,10) | 0.4000 |
| 10 | 0.0700 | 0.1300 | 0.1900 | S (1,11) | 0.7700 | S (3,8) | 0.8600 | S (5,9) | 1 | S (8,11) | 1 |
| 11 | 0.6300 | 0.7300 | 0.8300 | S (2,3) | 1 | S (3,9) | 1 | S (5,10) | 0.2600 | S (9,10) | 0.2600 |
| S (2,4) | 1 | S (3,10) | 0.2600 | S (5,11) | 0.8600 | S (9,11) | 0.8600 | ||||
| S (2,5) | 1 | S (3,11) | 0.8600 | S (6,7) | 0.7700 | S (10,11) | 0.4000 | ||||
| S (2,6) | 0.9100 | S (4,5) | 1 | S (6,8) | 0.7700 | ||||||
Table 7.
The AA, RA, CC of BE 5.
| Expert No. | 1 | 2 | 3 | 4 | 5 | 6 | 7 | 8 | 9 | 10 | 11 |
|---|---|---|---|---|---|---|---|---|---|---|---|
| AA | 0.8030 | 0.8660 | 0.8660 | 0.8660 | 0.8660 | 0.8030 | 0.8240 | 0.8240 | 0.8660 | 0.2840 | 0.8240 |
| RA | 0.0924 | 0.0996 | 0.0996 | 0.0996 | 0.0996 | 0.0924 | 0.0948 | 0.0948 | 0.0996 | 0.0327 | 0.0948 |
| CC | 0.1135 | 0.1219 | 0.1075 | 0.0979 | 0.1027 | 0.0943 | 0.0859 | 0.0811 | 0.0787 | 0.0452 | 0.0714 |
Table 8.
FPS and FP of all BEs.
| BE No. | FPS | FP | Rank | |||
|---|---|---|---|---|---|---|
| a1 | a2 | a3 | ||||
| 1 | 0.2318 | 0.3172 | 0.4025 | 0.3172 | 1.0694 × 10⁻³ | 17 |
| 2 | 0.3728 | 0.5066 | 0.6404 | 0.5066 | 5.2392 × 10⁻³ | 7 |
| 3 | 0.1188 | 0.1970 | 0.2753 | 0.1970 | 2.1140 × 10⁻⁴ | 20 |
| 4 | 0.3125 | 0.4413 | 0.5700 | 0.4413 | 3.2421 × 10⁻³ | 11 |
| 5 | 0.7565 | 0.8218 | 0.8872 | 0.8218 | 4.1486 × 10⁻² | 1 |
| 6 | 0.2776 | 0.3759 | 0.4742 | 0.3759 | 1.8865 × 10⁻³ | 13 |
| 7 | 0.6238 | 0.7150 | 0.8062 | 0.7150 | 2.0262 × 10⁻² | 2 |
| 8 | 0.4869 | 0.5887 | 0.6904 | 0.5887 | 9.0842 × 10⁻³ | 5 |
| 9 | 0.5437 | 0.6568 | 0.7698 | 0.6568 | 1.4019 × 10⁻² | 4 |
| 10 | 0.5745 | 0.6813 | 0.7881 | 0.6813 | 1.6363 × 10⁻² | 3 |
| 11 | 0.4475 | 0.5566 | 0.6658 | 0.5566 | 7.3658 × 10⁻³ | 6 |
| 12 | 0.3832 | 0.4819 | 0.5805 | 0.4819 | 4.3936 × 10⁻³ | 9 |
| 13 | 0.3200 | 0.4243 | 0.5285 | 0.4243 | 2.8357 × 10⁻³ | 12 |
| 14 | 0.1644 | 0.2438 | 0.3233 | 0.2438 | 4.4128 × 10⁻⁴ | 19 |
| 15 | 0.3644 | 0.4689 | 0.5734 | 0.4689 | 3.9949 × 10⁻³ | 10 |
| 16 | 0.2429 | 0.3512 | 0.4596 | 0.3512 | 1.5030 × 10⁻³ | 14 |
| 17 | 0.2112 | 0.3197 | 0.4281 | 0.3197 | 1.0975 × 10⁻³ | 16 |
| 18 | 0.2292 | 0.3203 | 0.4115 | 0.3203 | 1.1054 × 10⁻³ | 15 |
| 19 | 0.1697 | 0.2523 | 0.3348 | 0.2523 | 4.9534 × 10⁻⁴ | 18 |
| 20 | 0.3594 | 0.4852 | 0.6110 | 0.4852 | 4.5009 × 10⁻³ | 8 |
Table 9.
FP and FV-I values of MCSs.
| No. | MCSs | FP | FV-I Values | Rank | No. | MCSs | FP | FV-I Values | Rank |
|---|---|---|---|---|---|---|---|---|---|
| 1 | BE1-BE6 | 2.0175 × 10⁻⁶ | 1.9372 × 10⁻⁴ | 17 | 12 | BE10-BE11 | 1.2053 × 10⁻⁴ | 1.1573 × 10⁻² | 4 |
| 2 | BE1-BE7 | 2.1669 × 10⁻⁵ | 2.0806 × 10⁻³ | 13 | 13 | BE10-BE13 | 4.6402 × 10⁻⁵ | 4.4554 × 10⁻³ | 11 |
| 3 | BE2-BE6 | 9.8842 × 10⁻⁶ | 9.4906 × 10⁻⁴ | 14 | 14 | BE10-BE15 | 6.5372 × 10⁻⁵ | 6.2768 × 10⁻³ | 9 |
| 4 | BE2-BE7 | 1.06158 × 10⁻⁴ | 1.0193 × 10⁻² | 5 | 15 | BE17-BE5-BE16 | 6.8436 × 10⁻⁸ | 6.5711 × 10⁻⁶ | 21 |
| 5 | BE3-BE6 | 3.9883 × 10⁻⁷ | 3.8294 × 10⁻⁵ | 18 | 16 | BE18-BE5-BE16 | 6.8929 × 10⁻⁸ | 6.6184 × 10⁻⁶ | 20 |
| 6 | BE3-BE7 | 4.2835 × 10⁻⁶ | 4.1129 × 10⁻⁴ | 16 | 17 | BE19-BE5-BE16 | 3.0887 × 10⁻⁸ | 2.9657 × 10⁻⁶ | 22 |
| 7 | BE4-BE6 | 6.1166 × 10⁻⁶ | 5.8730 × 10⁻⁴ | 15 | 18 | BE20-BE5-BE16 | 2.8065 × 10⁻⁷ | 2.6947 × 10⁻⁵ | 19 |
| 8 | BE4-BE7 | 6.5693 × 10⁻⁵ | 6.3077 × 10⁻³ | 8 | 19 | BE12-BE5 | 1.8227 × 10⁻⁴ | 1.7501 × 10⁻² | 3 |
| 9 | BE9-BE11 | 1.0326 × 10⁻⁴ | 9.9153 × 10⁻³ | 6 | 20 | B12-B10 | 7.1894 × 10⁻⁵ | 6.9031 × 10⁻³ | 7 |
| 10 | BE9-BE13 | 3.9755 × 10⁻⁵ | 3.8172 × 10⁻³ | 12 | 21 | BE14 | 4.4128 × 10⁻⁴ | 4.2371 × 10⁻² | 2 |
| 11 | BE9-BE15 | 5.6008 × 10⁻⁵ | 5.3777 × 10⁻³ | 10 | 22 | BE8 | 9.0842 × 10⁻³ | 8.7224 × 10⁻¹ | 1 |
Publisher’s Note: MDPI stays neutral with regard to jurisdictional claims in published maps and institutional affiliations. |
© 2021 by the authors. Licensee MDPI, Basel, Switzerland. This article is an open access article distributed under the terms and conditions of the Creative Commons Attribution (CC BY) license (https://creativecommons.org/licenses/by/4.0/).
Share and Cite
MDPI and ACS Style
Lin, C.; Xu, Q.; Huang, Y. Applications of FFTA–HFACS for Analyzing Human and Organization Factors in Electric Misoperation Accidents. Appl. Sci. 2021, 11, 9008. https://0-doi-org.brum.beds.ac.uk/10.3390/app11199008
AMA Style
Lin C, Xu Q, Huang Y. Applications of FFTA–HFACS for Analyzing Human and Organization Factors in Electric Misoperation Accidents. Applied Sciences. 2021; 11(19):9008. https://0-doi-org.brum.beds.ac.uk/10.3390/app11199008
Chicago/Turabian StyleLin, Chuan, Qifeng Xu, and Yifan Huang. 2021. "Applications of FFTA–HFACS for Analyzing Human and Organization Factors in Electric Misoperation Accidents" Applied Sciences 11, no. 19: 9008. https://0-doi-org.brum.beds.ac.uk/10.3390/app11199008
Note that from the first issue of 2016, this journal uses article numbers instead of page numbers. See further details here.