
Review of Element Analysis of Industrial Materials by In-Line Laser—Induced Breakdown Spectroscopy (LIBS)

 , , ,
, , , 
Abstract
:1. Introduction
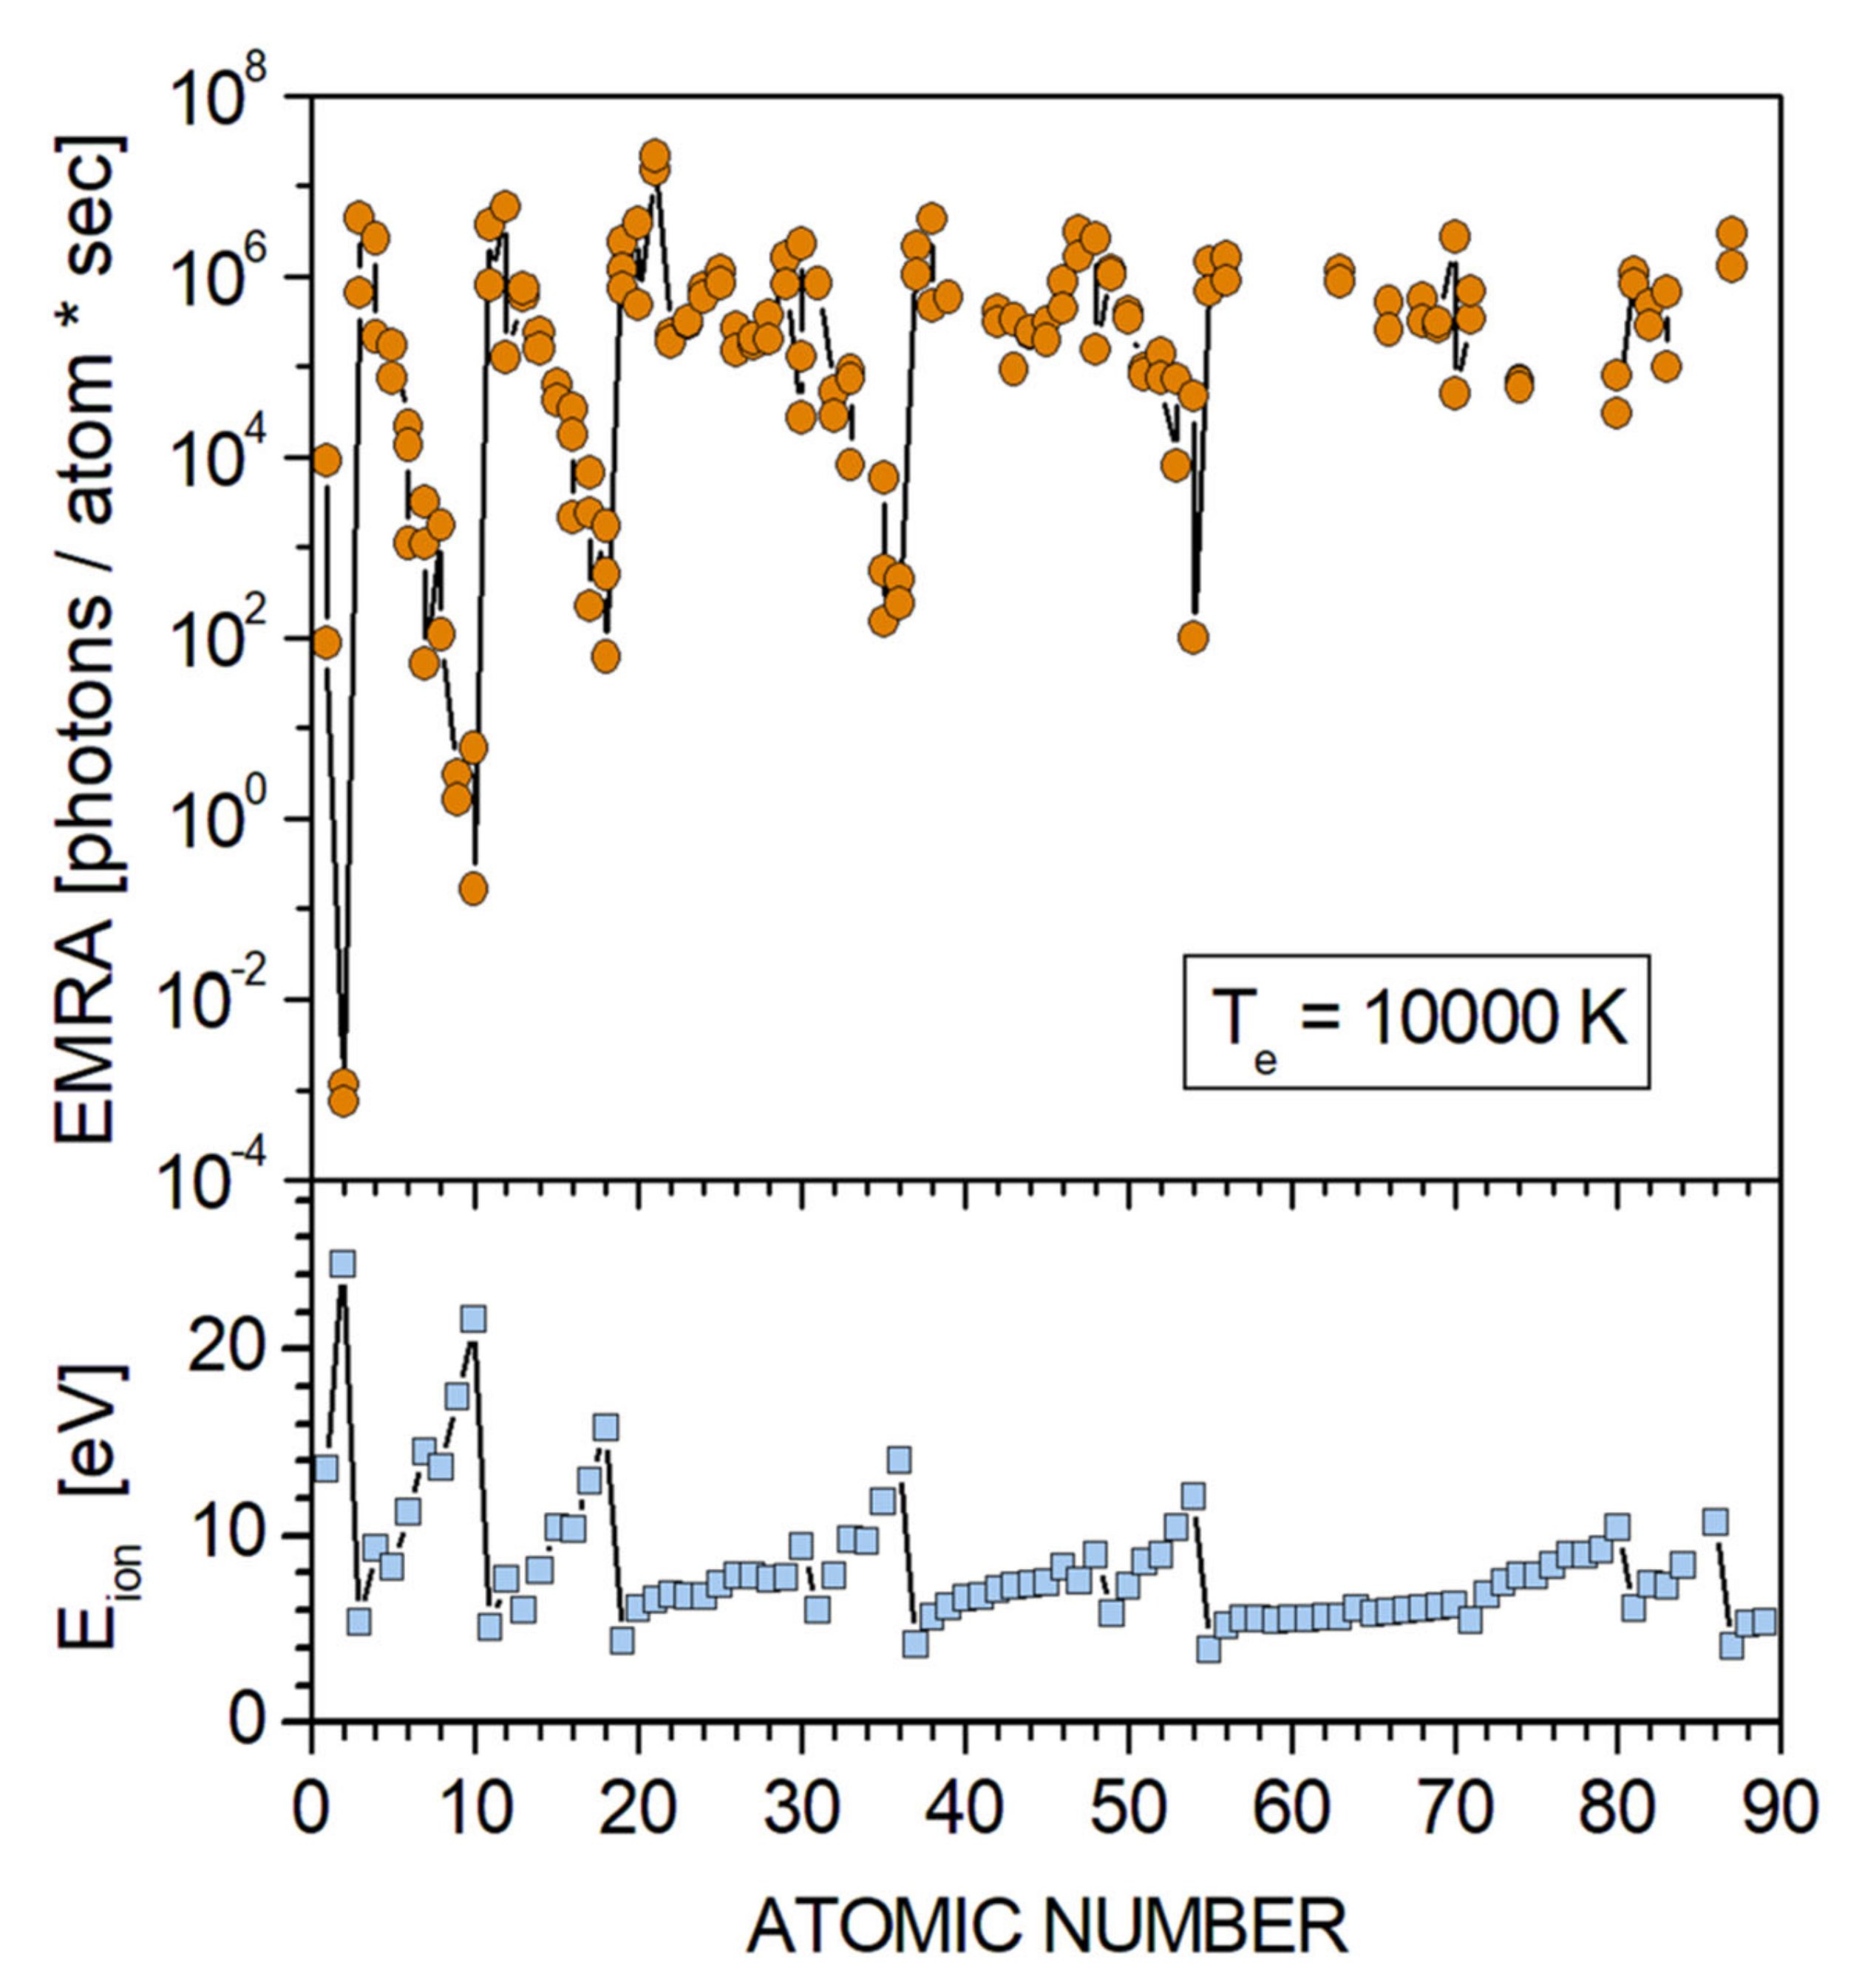
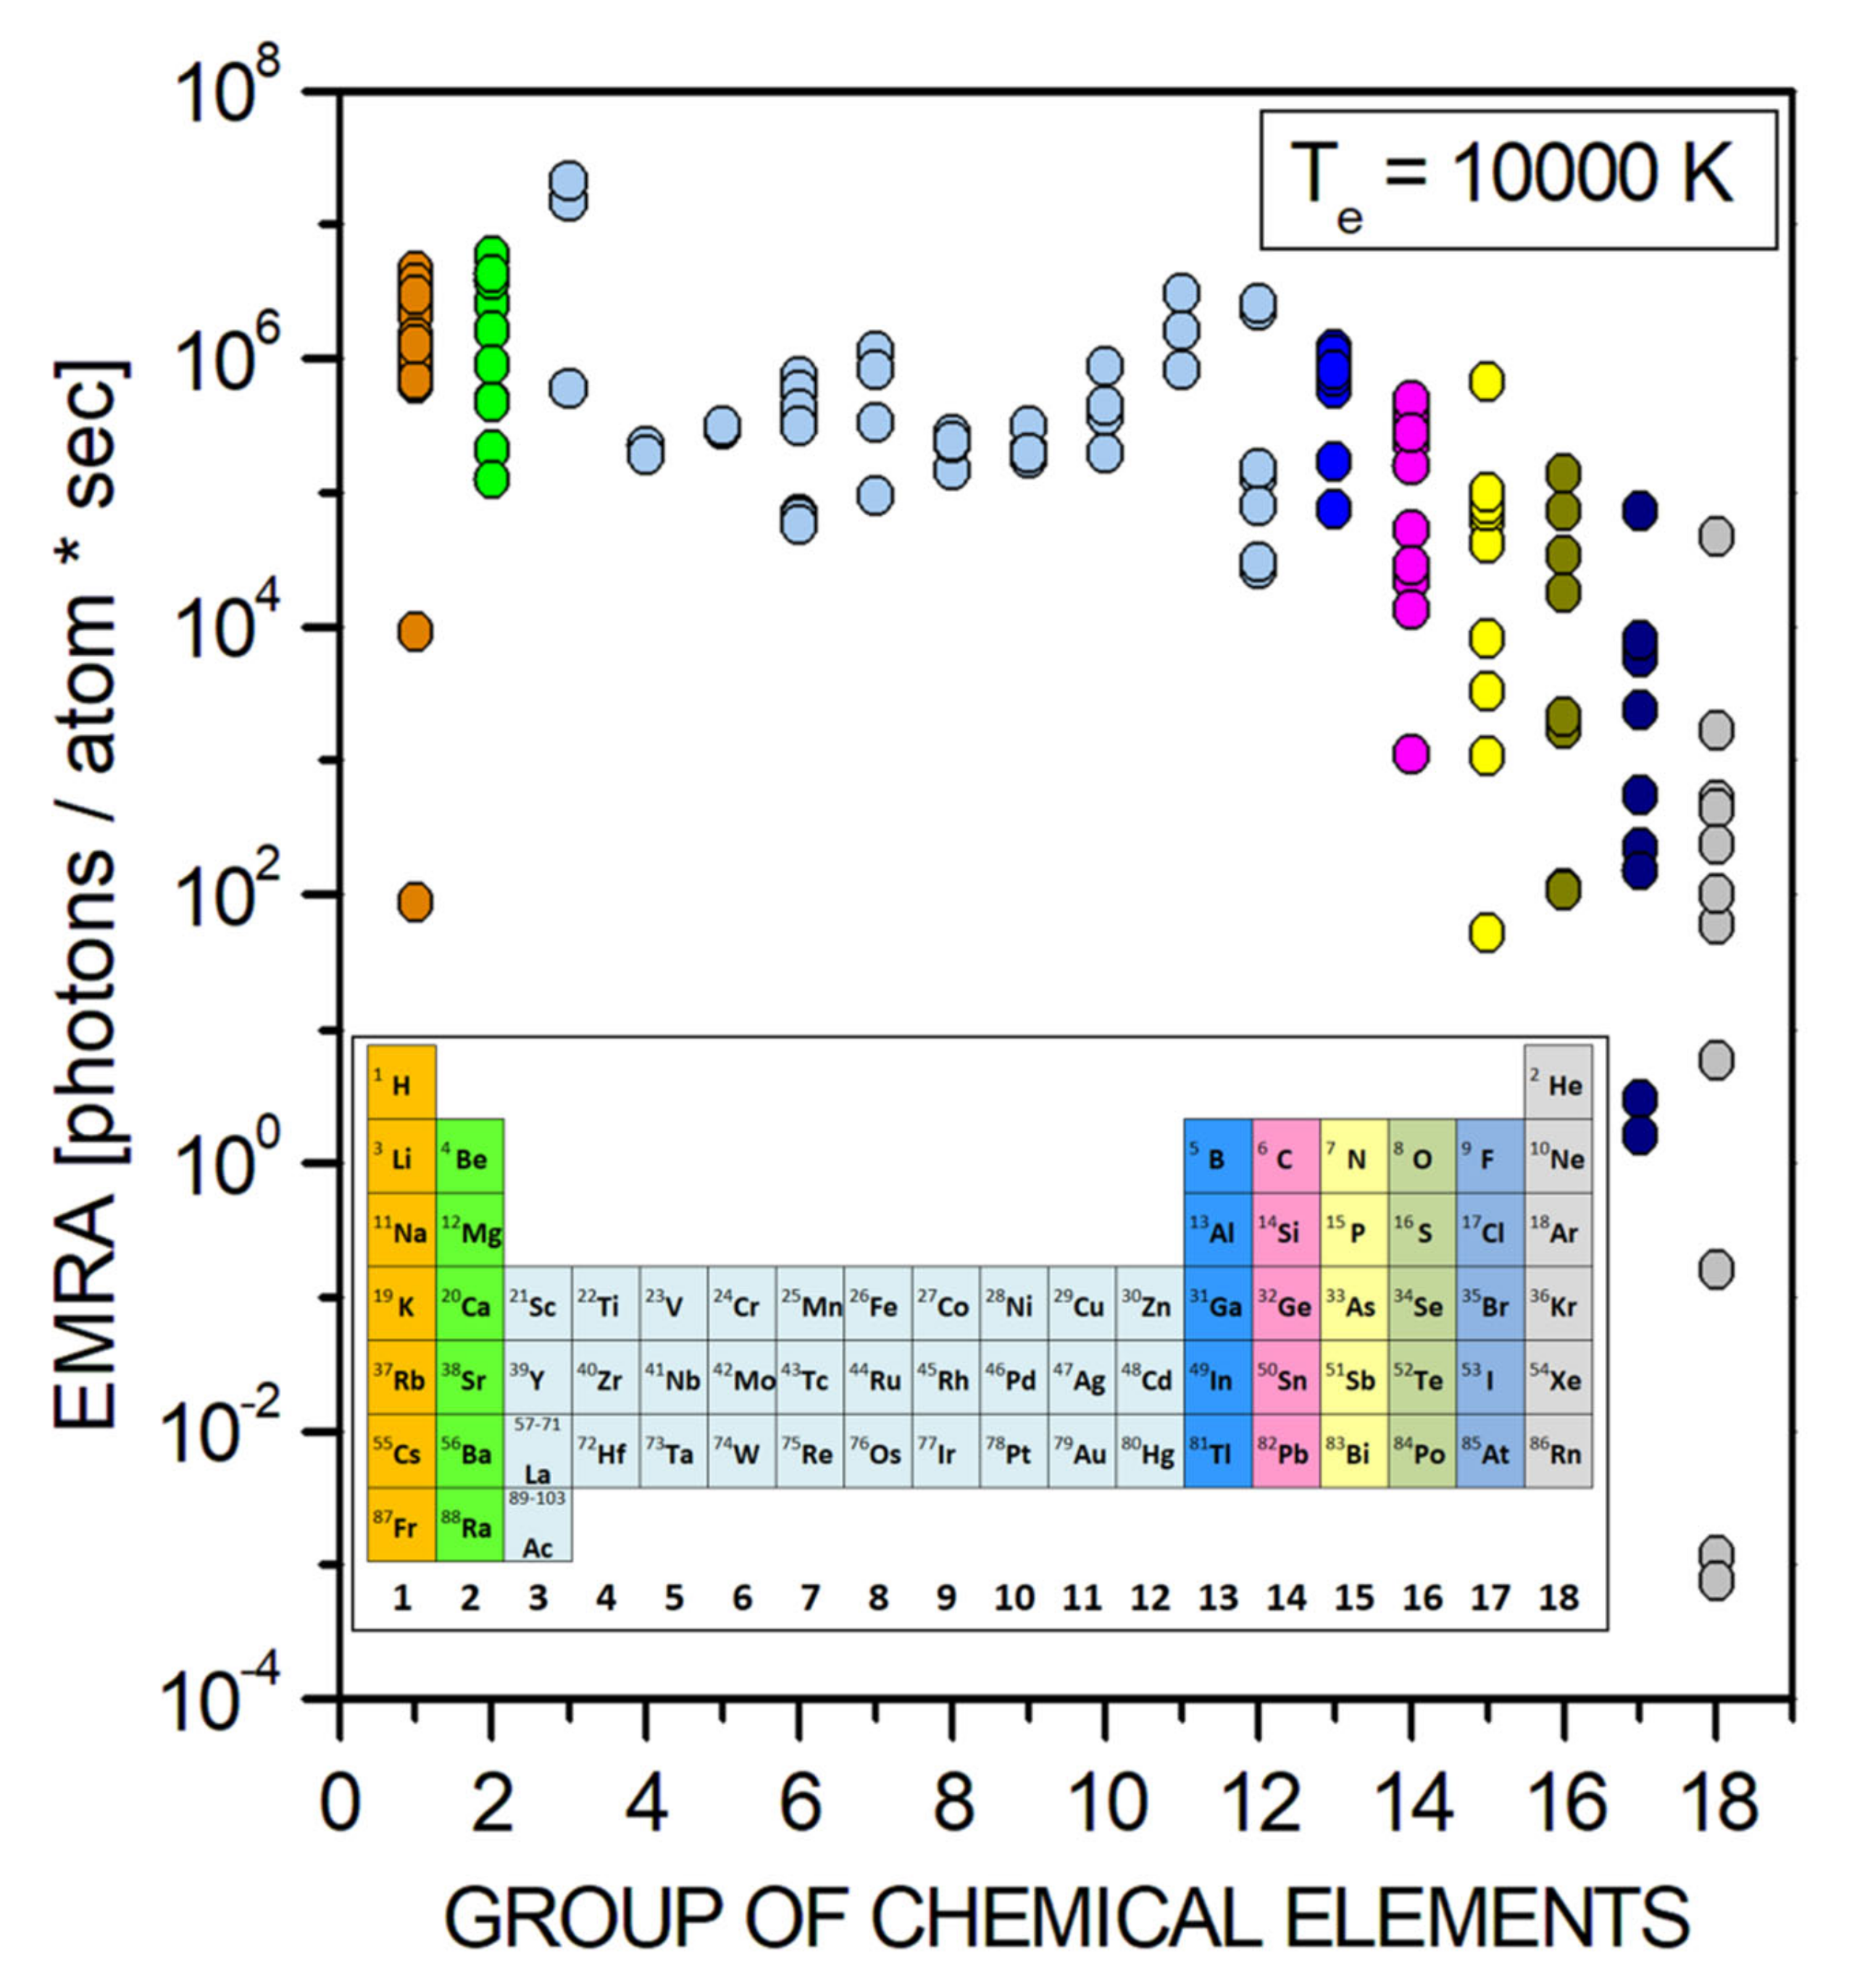
2. Plasma Emission and Multi-Element Detection
3. LIBS Analysis of Industrial Materials
- Metal melts:
- ◦
- ◦
- Sodium [193],
- ◦
- ◦
- Particulate matter:
- ◦
- ◦
- ◦
- ◦
4. Technology Materials
4.1. Precious Metals and Minerals
4.2. Plastics Materials
4.3. Secondary Raw Materials
5. In-Line Application of LIBS in Industrial Production
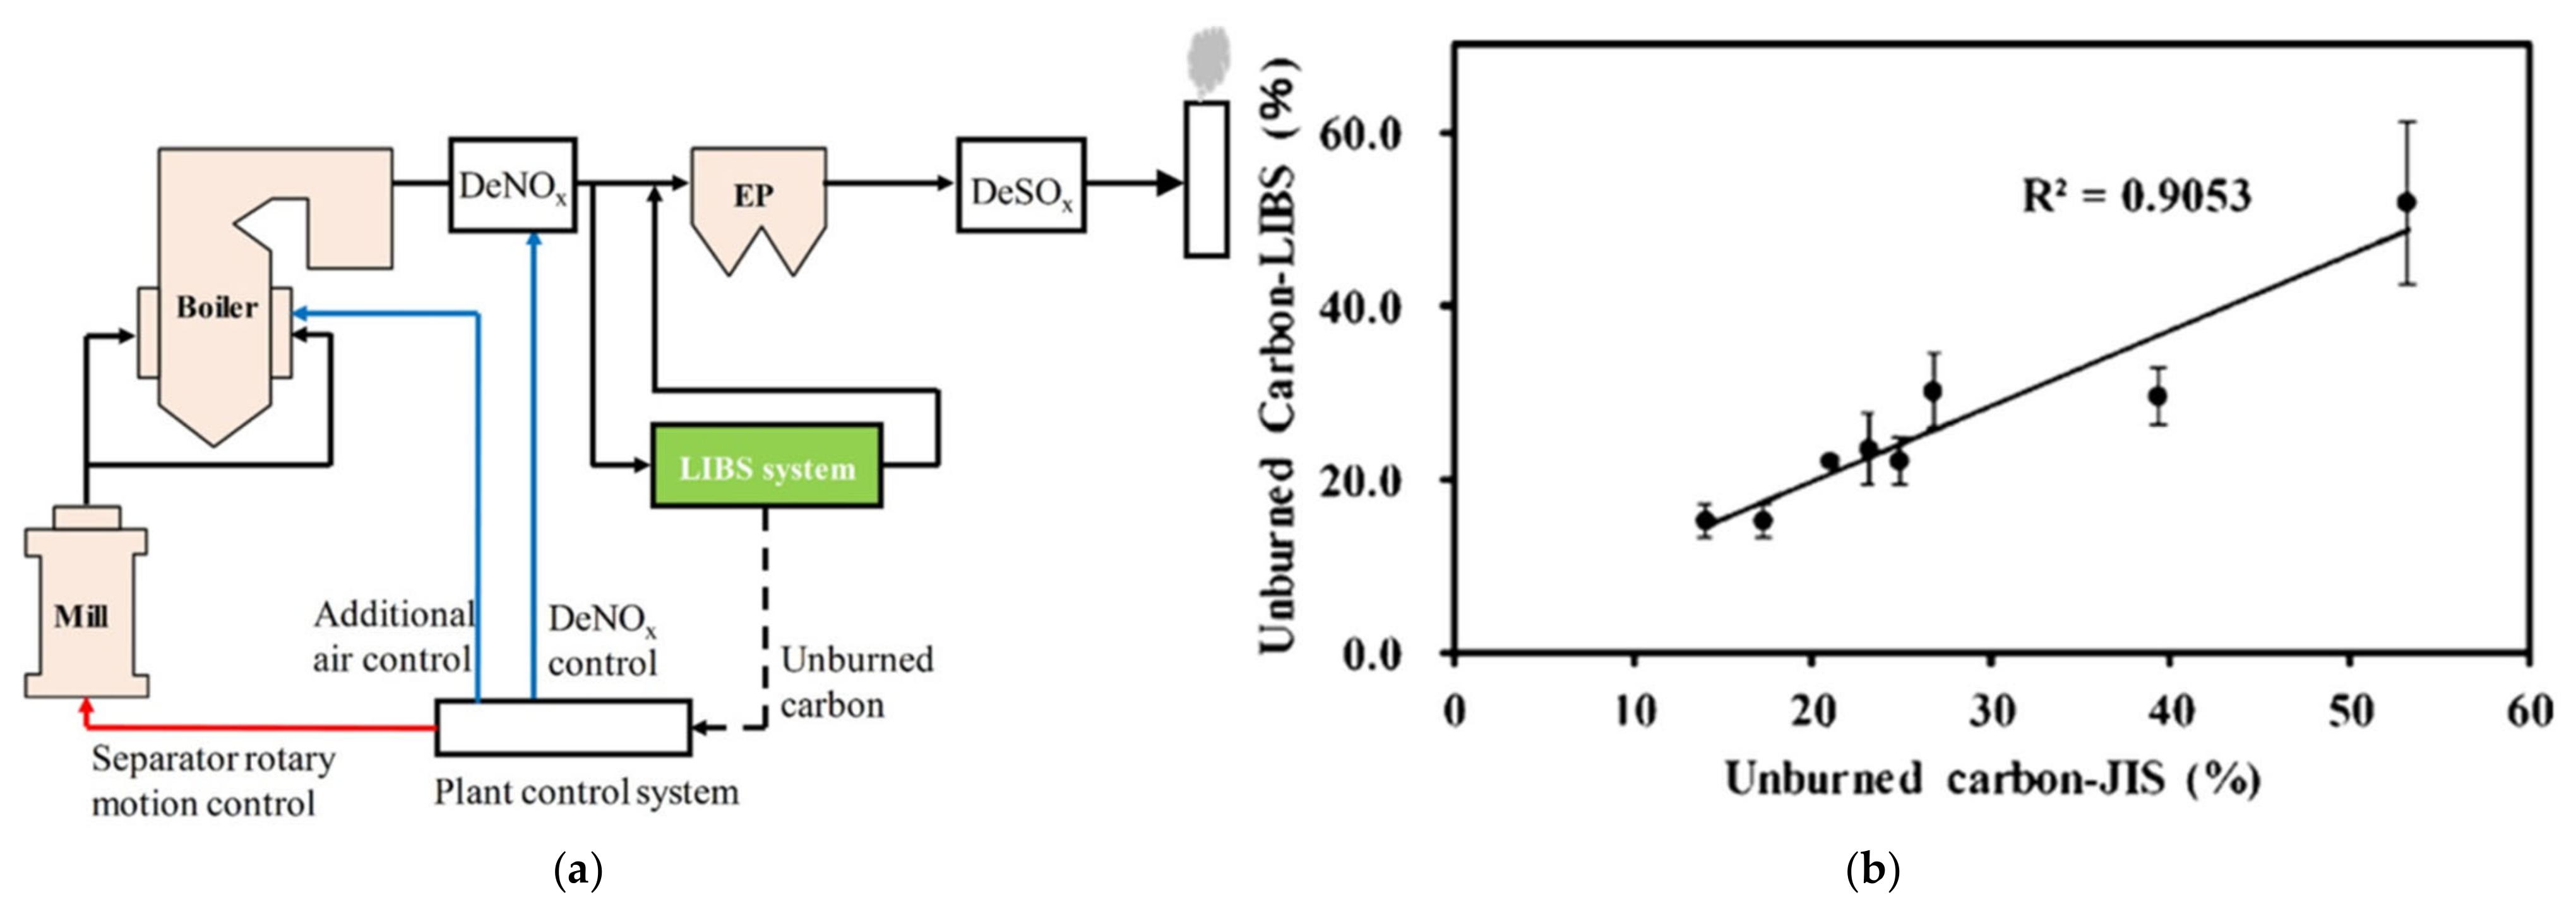
5.1. Coal and Coal Ash
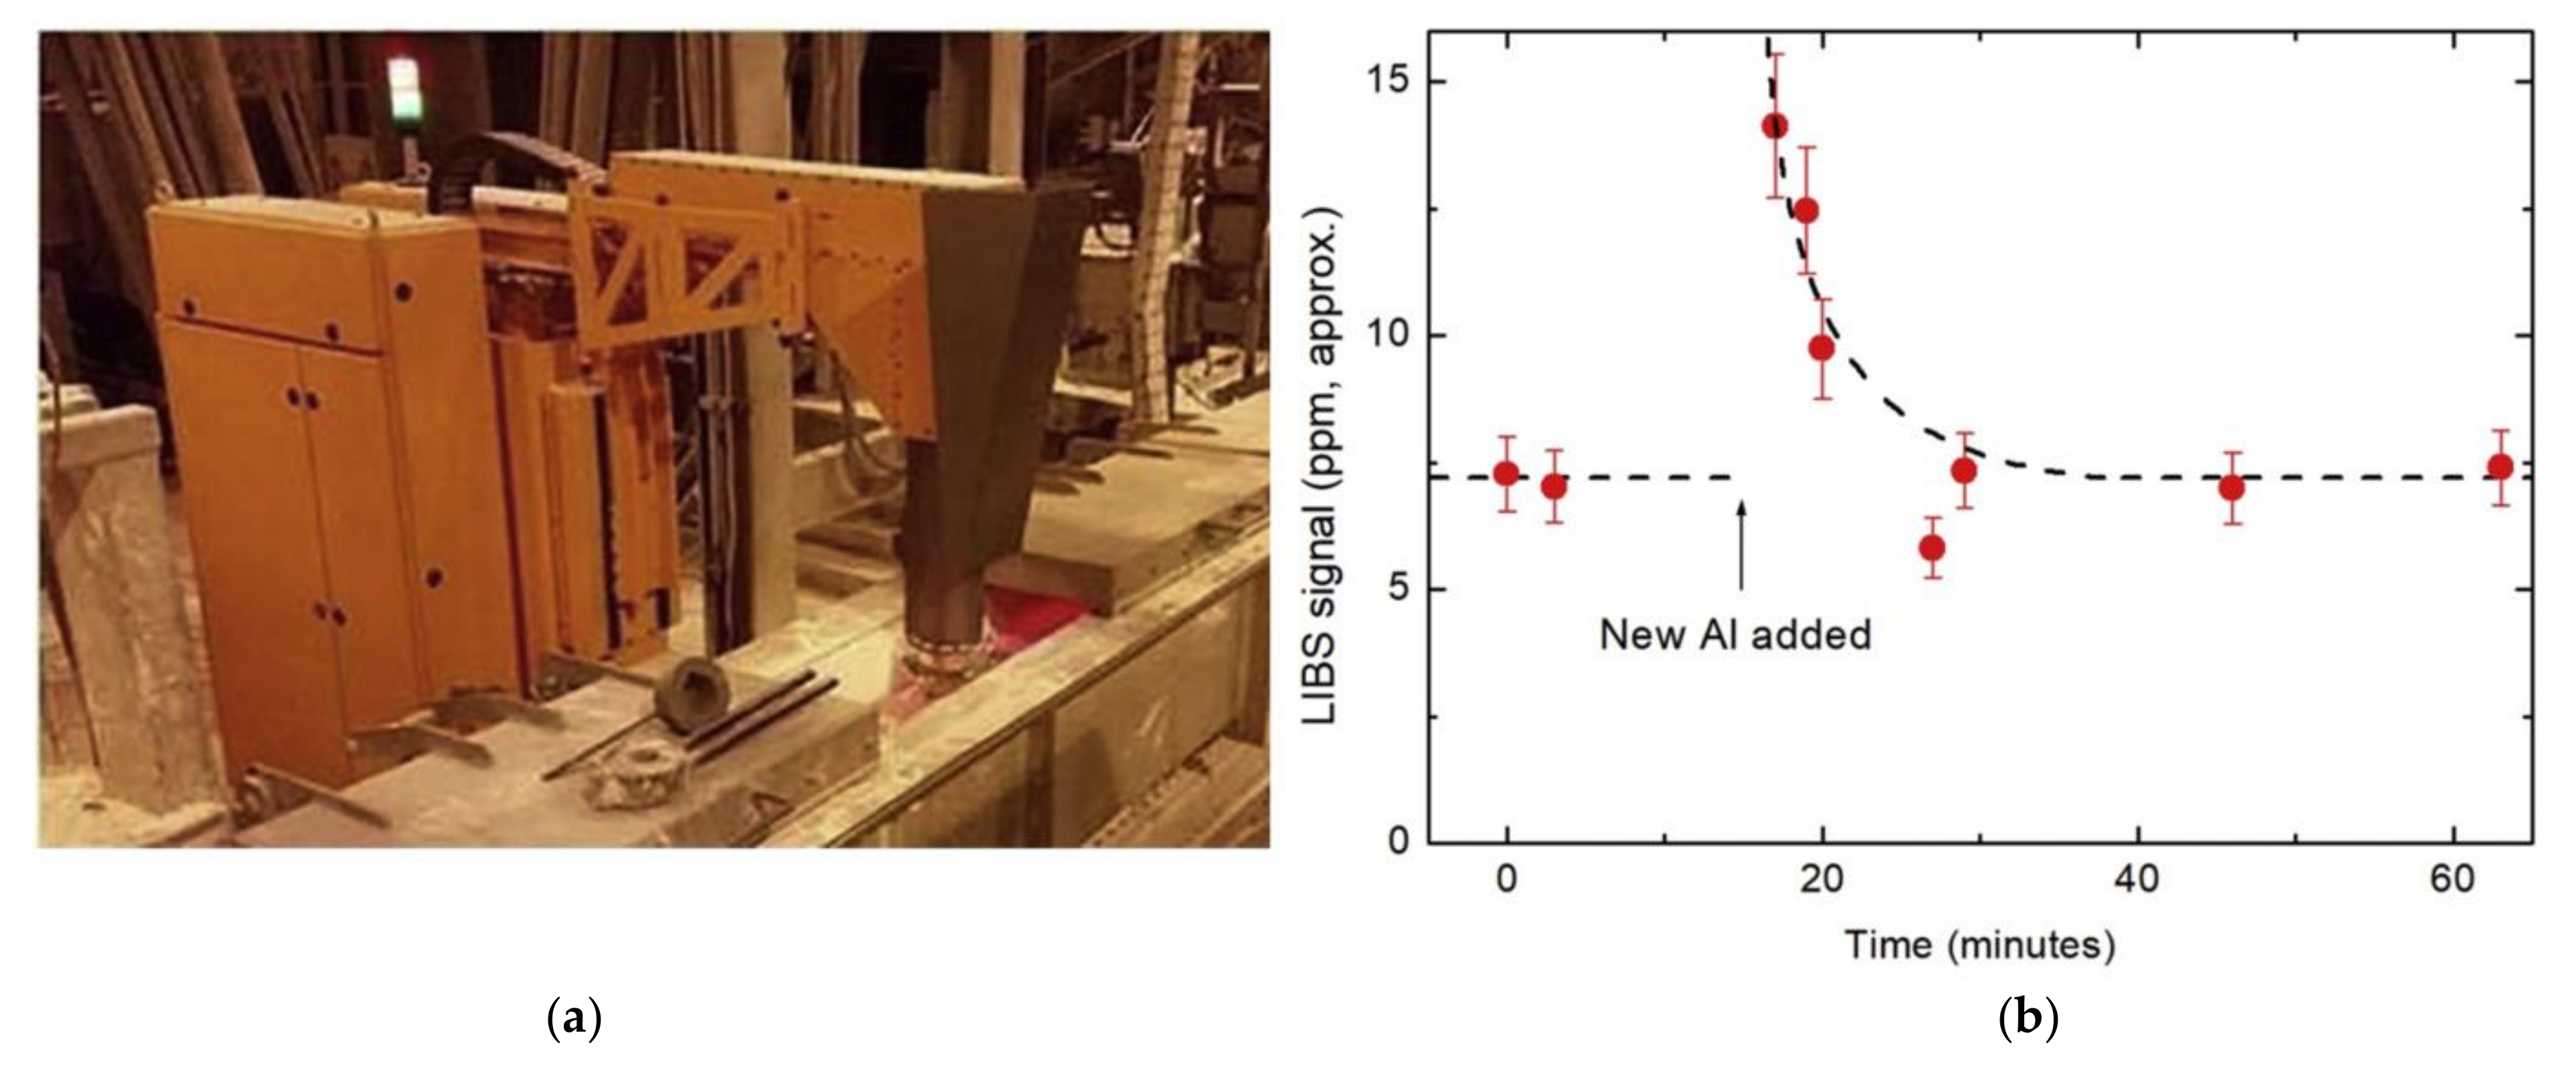
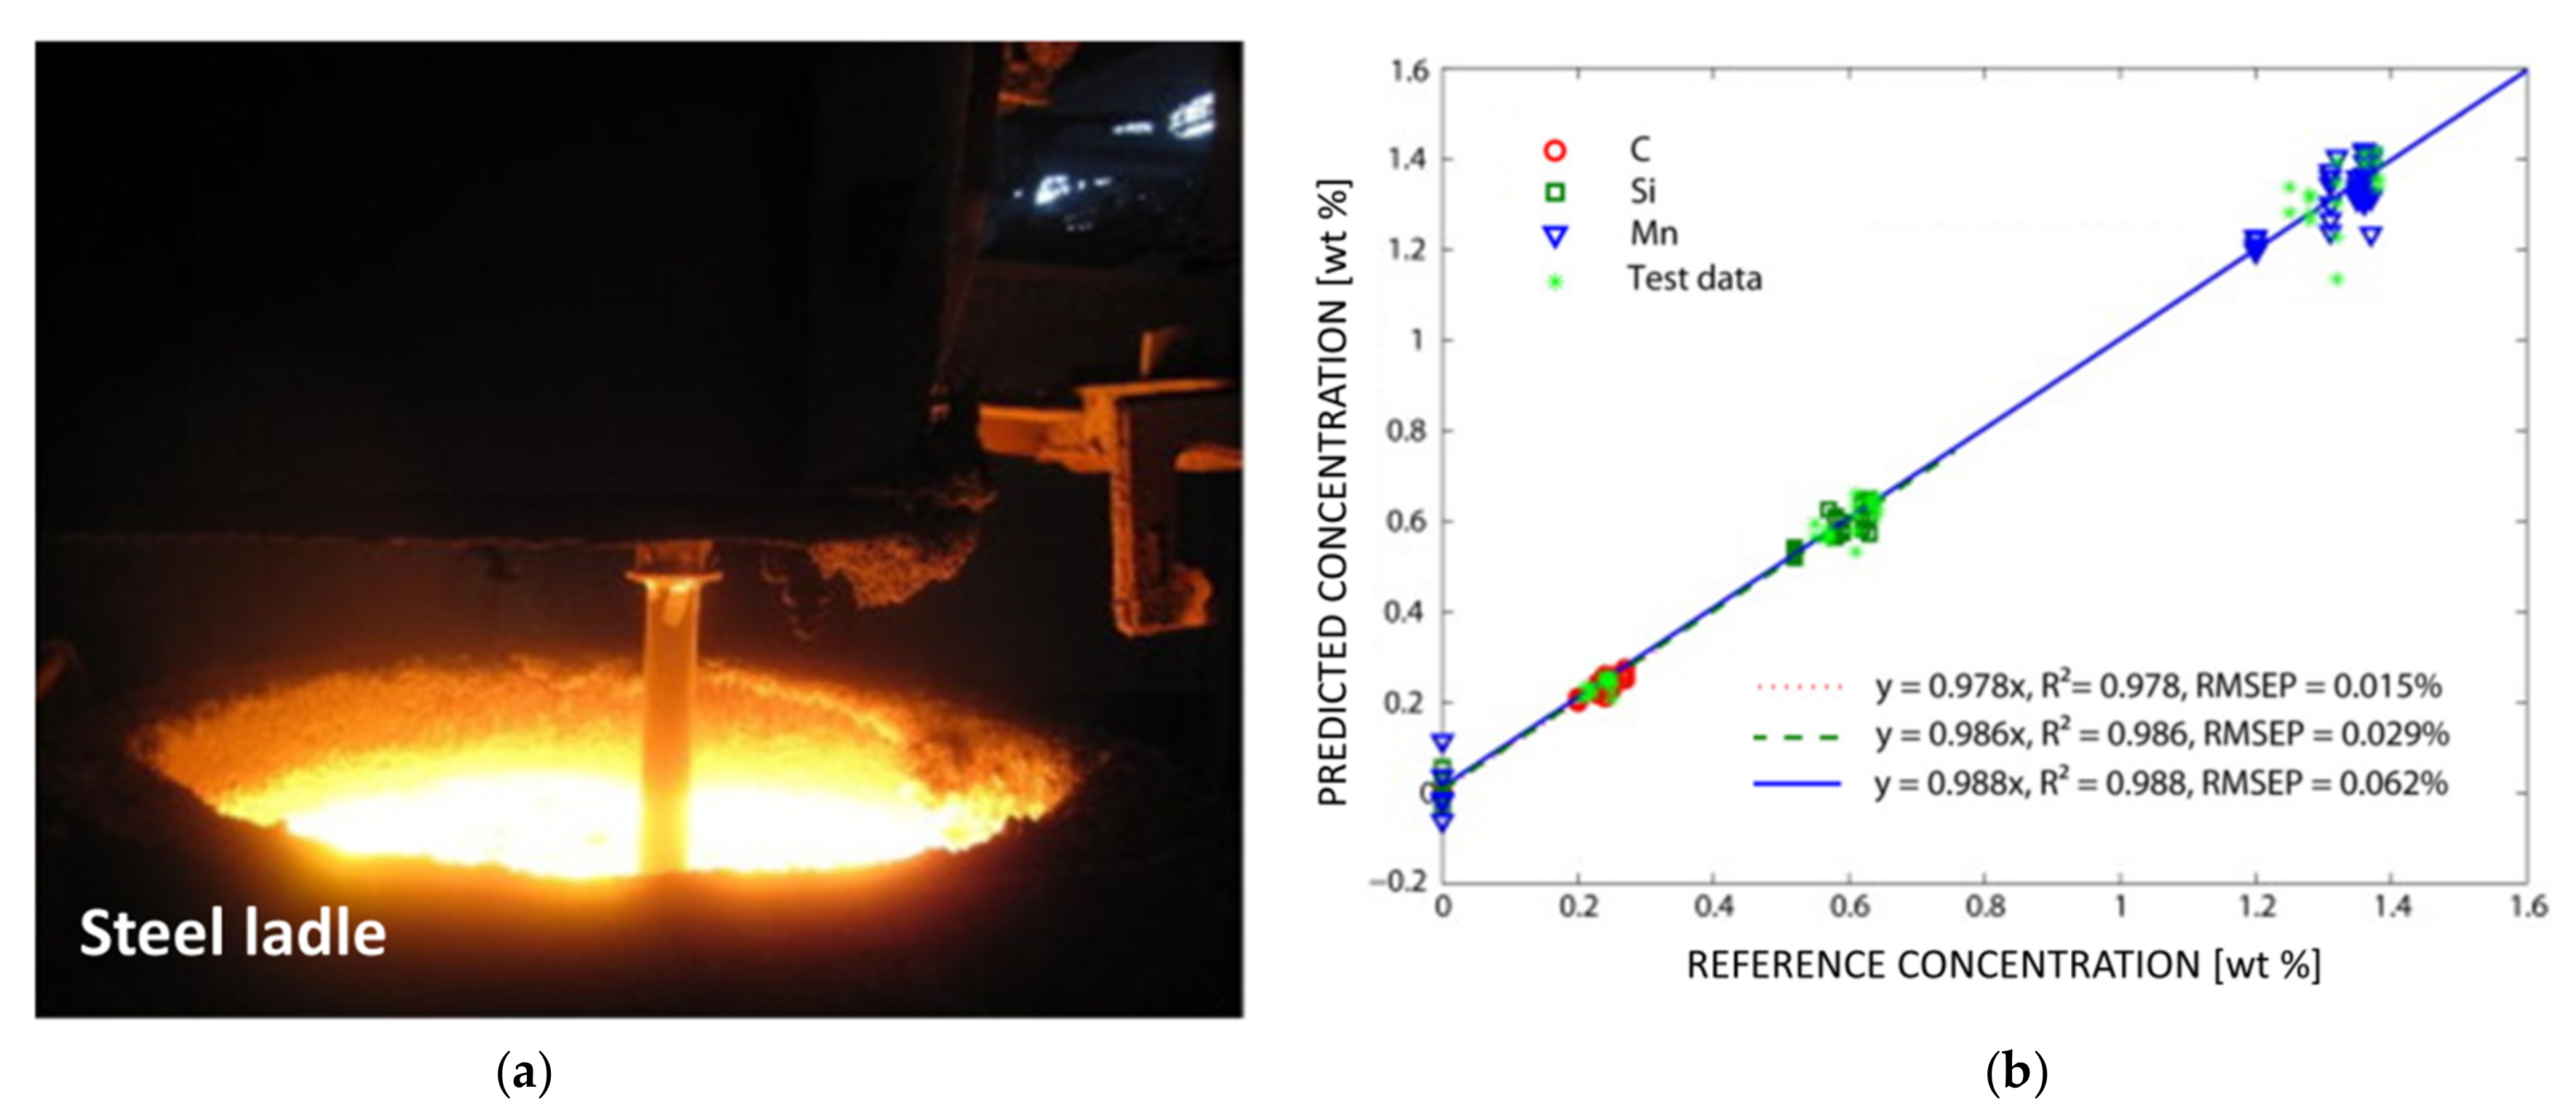
5.2. Metal Melts
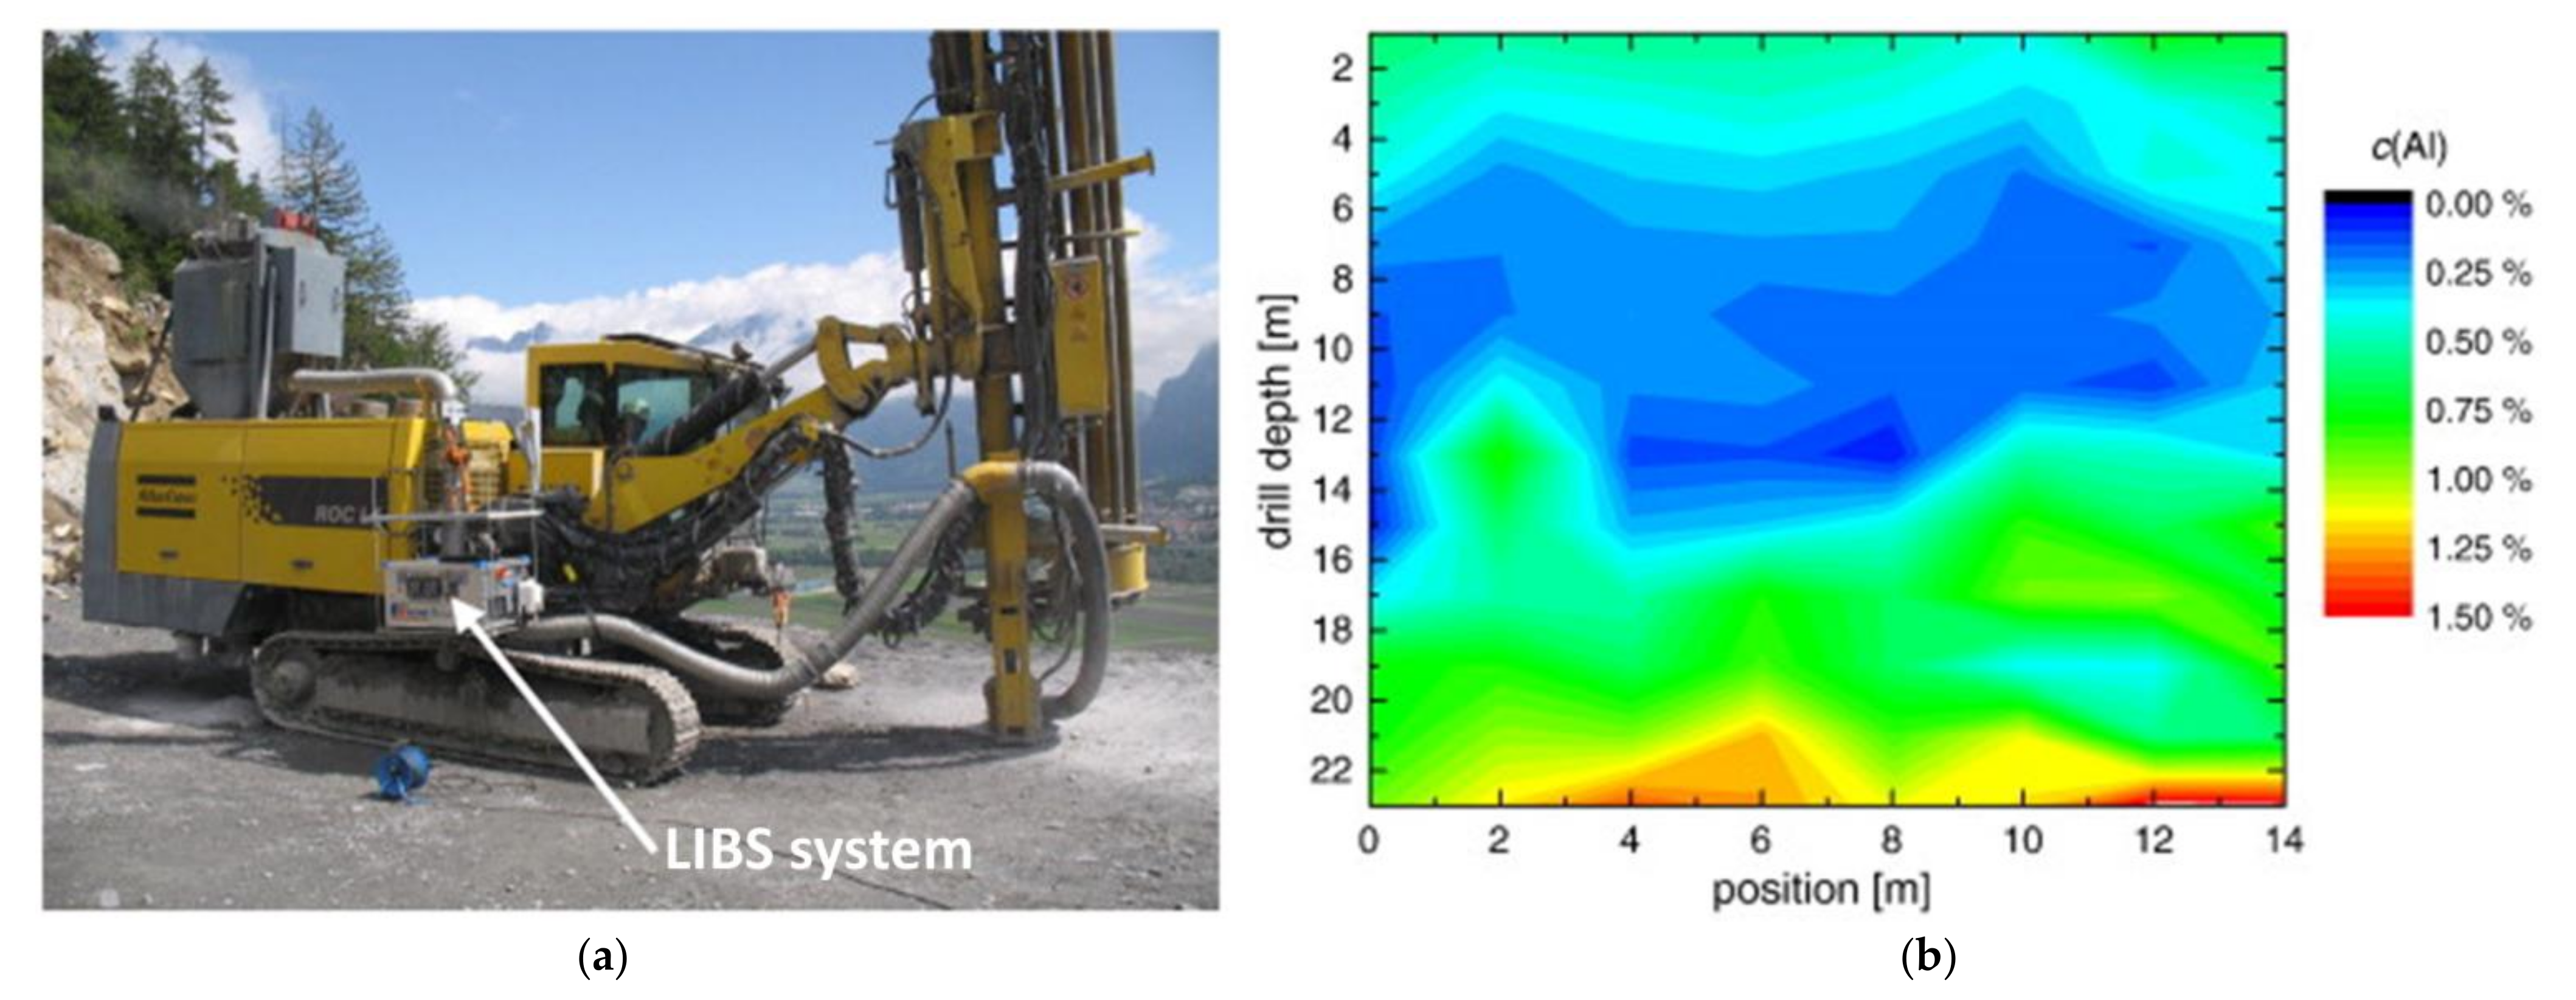
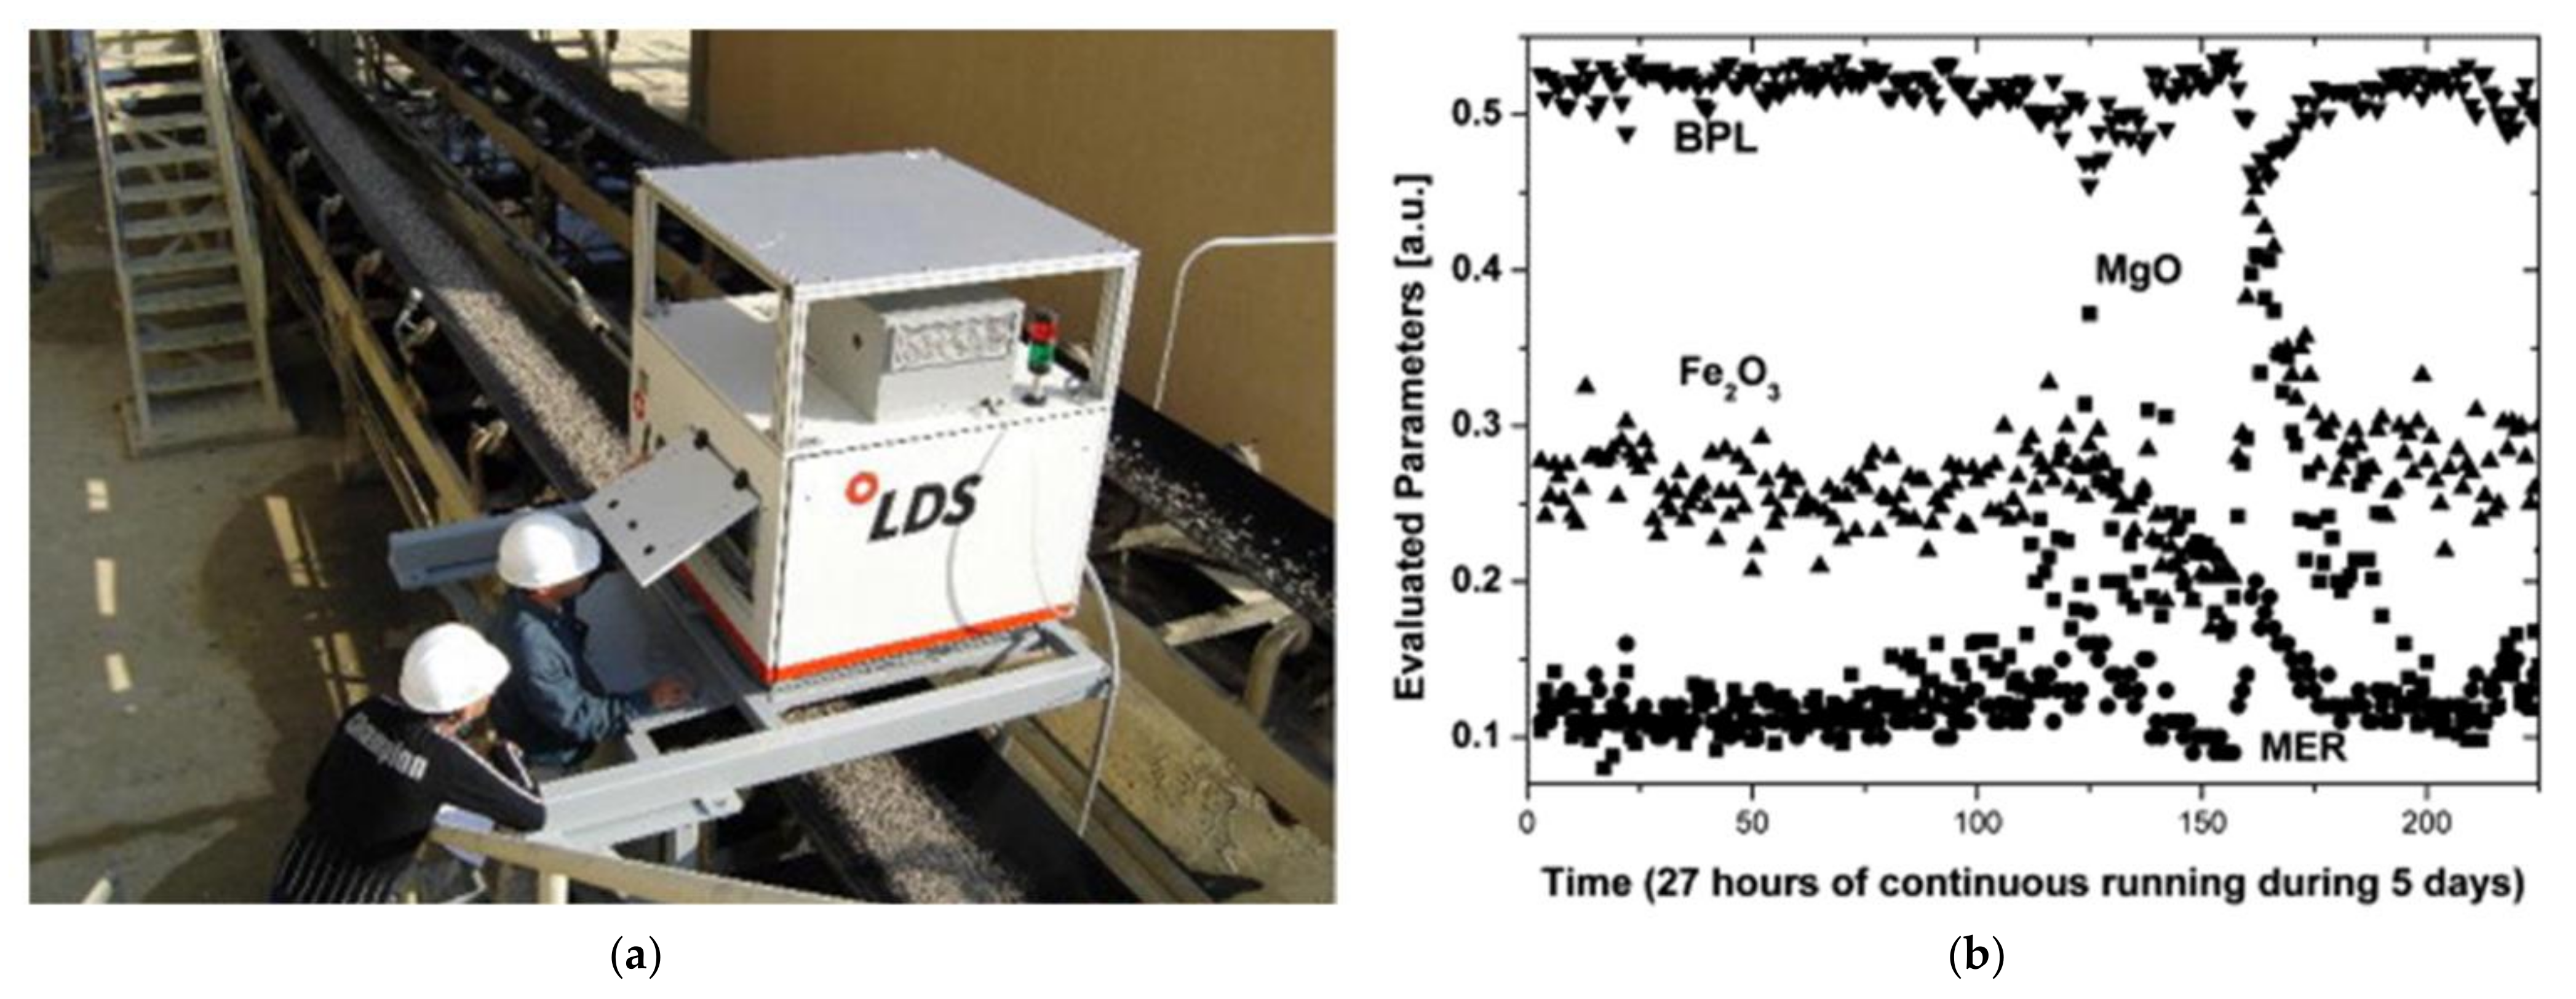
5.3. Minerals
5.4. Metal Scrap
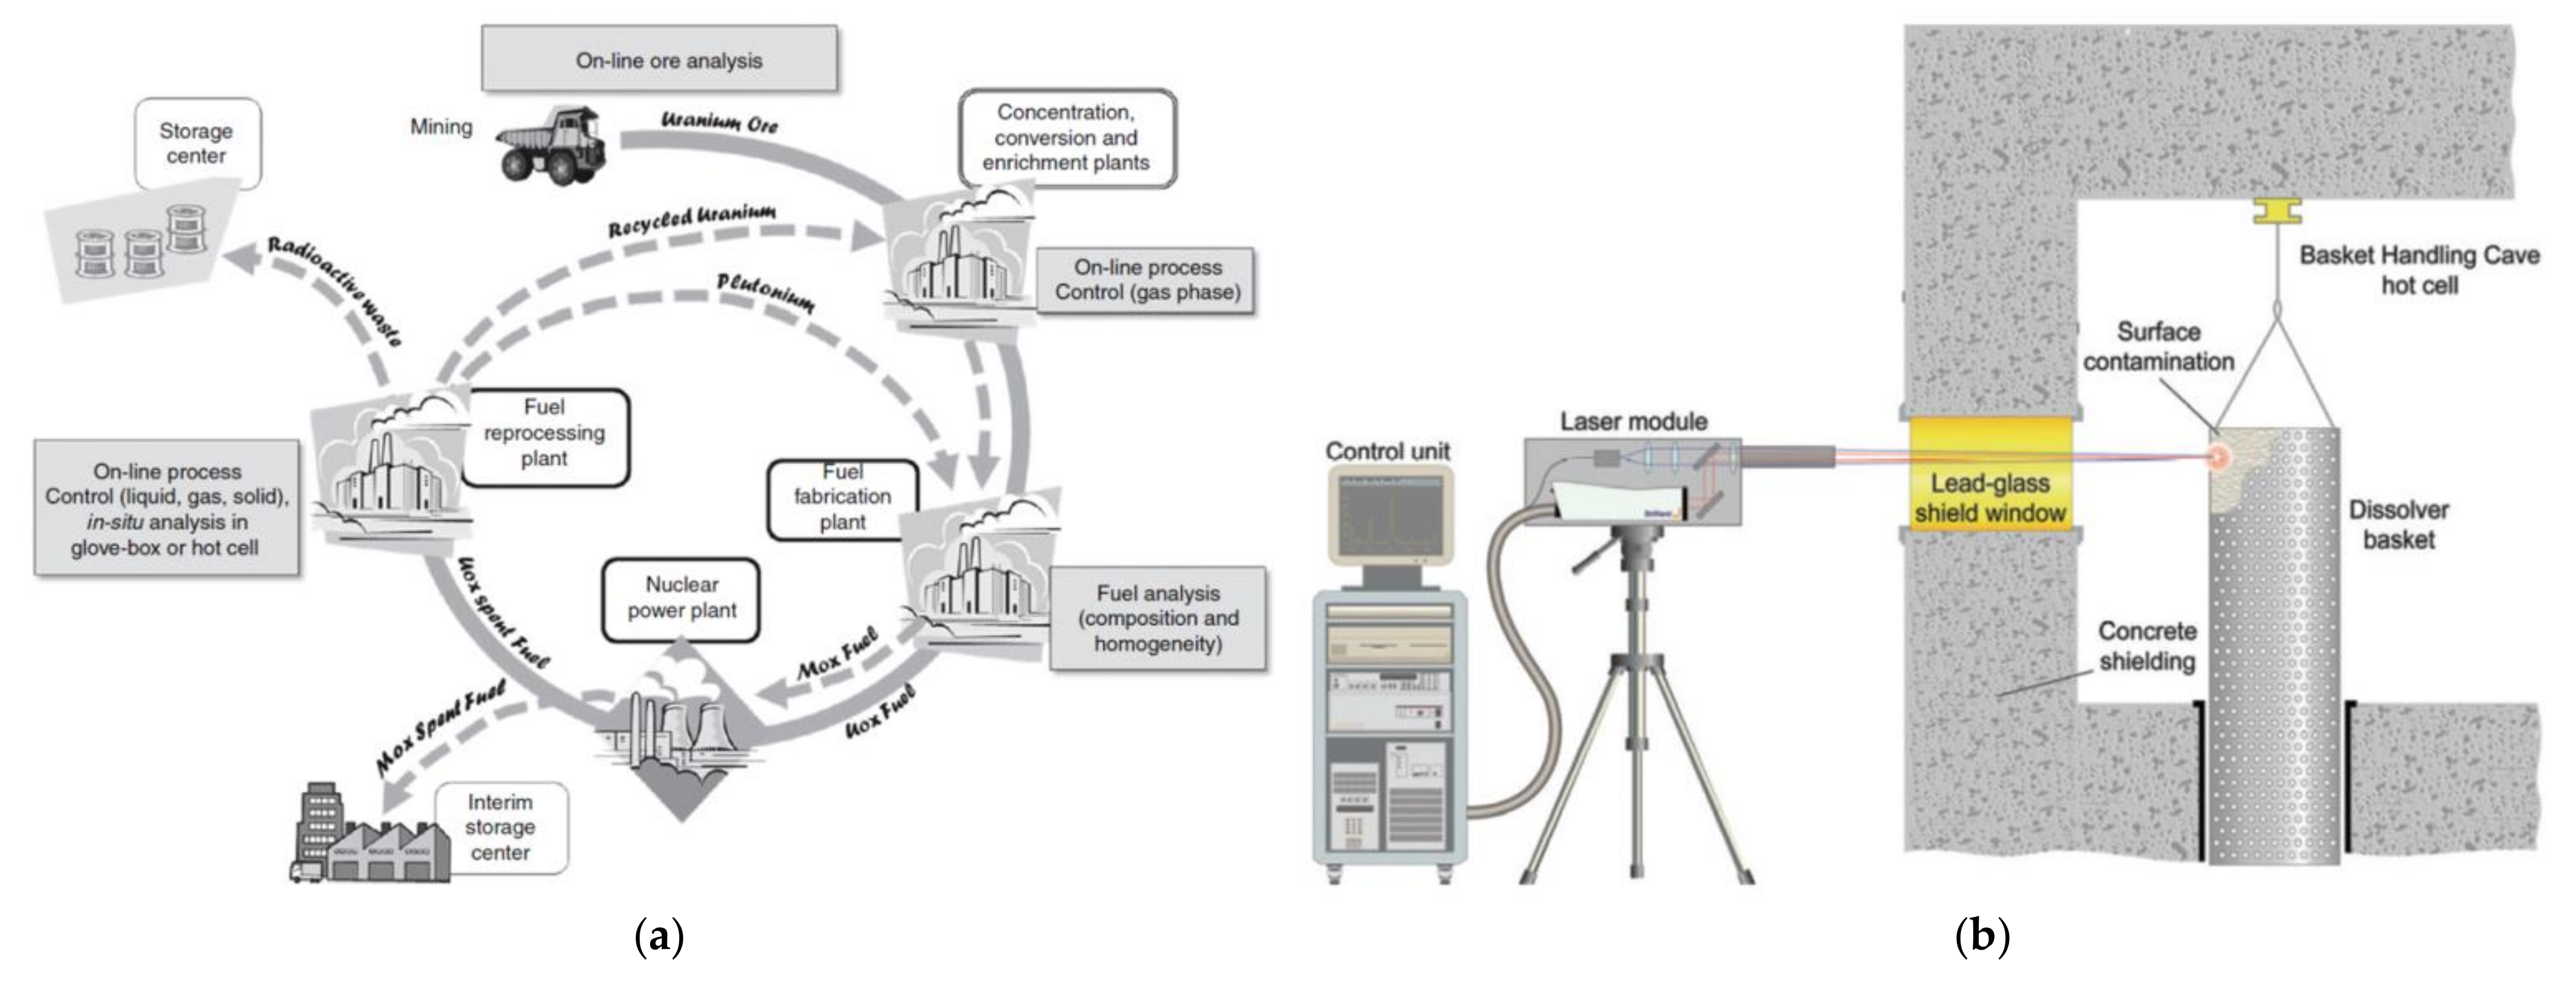
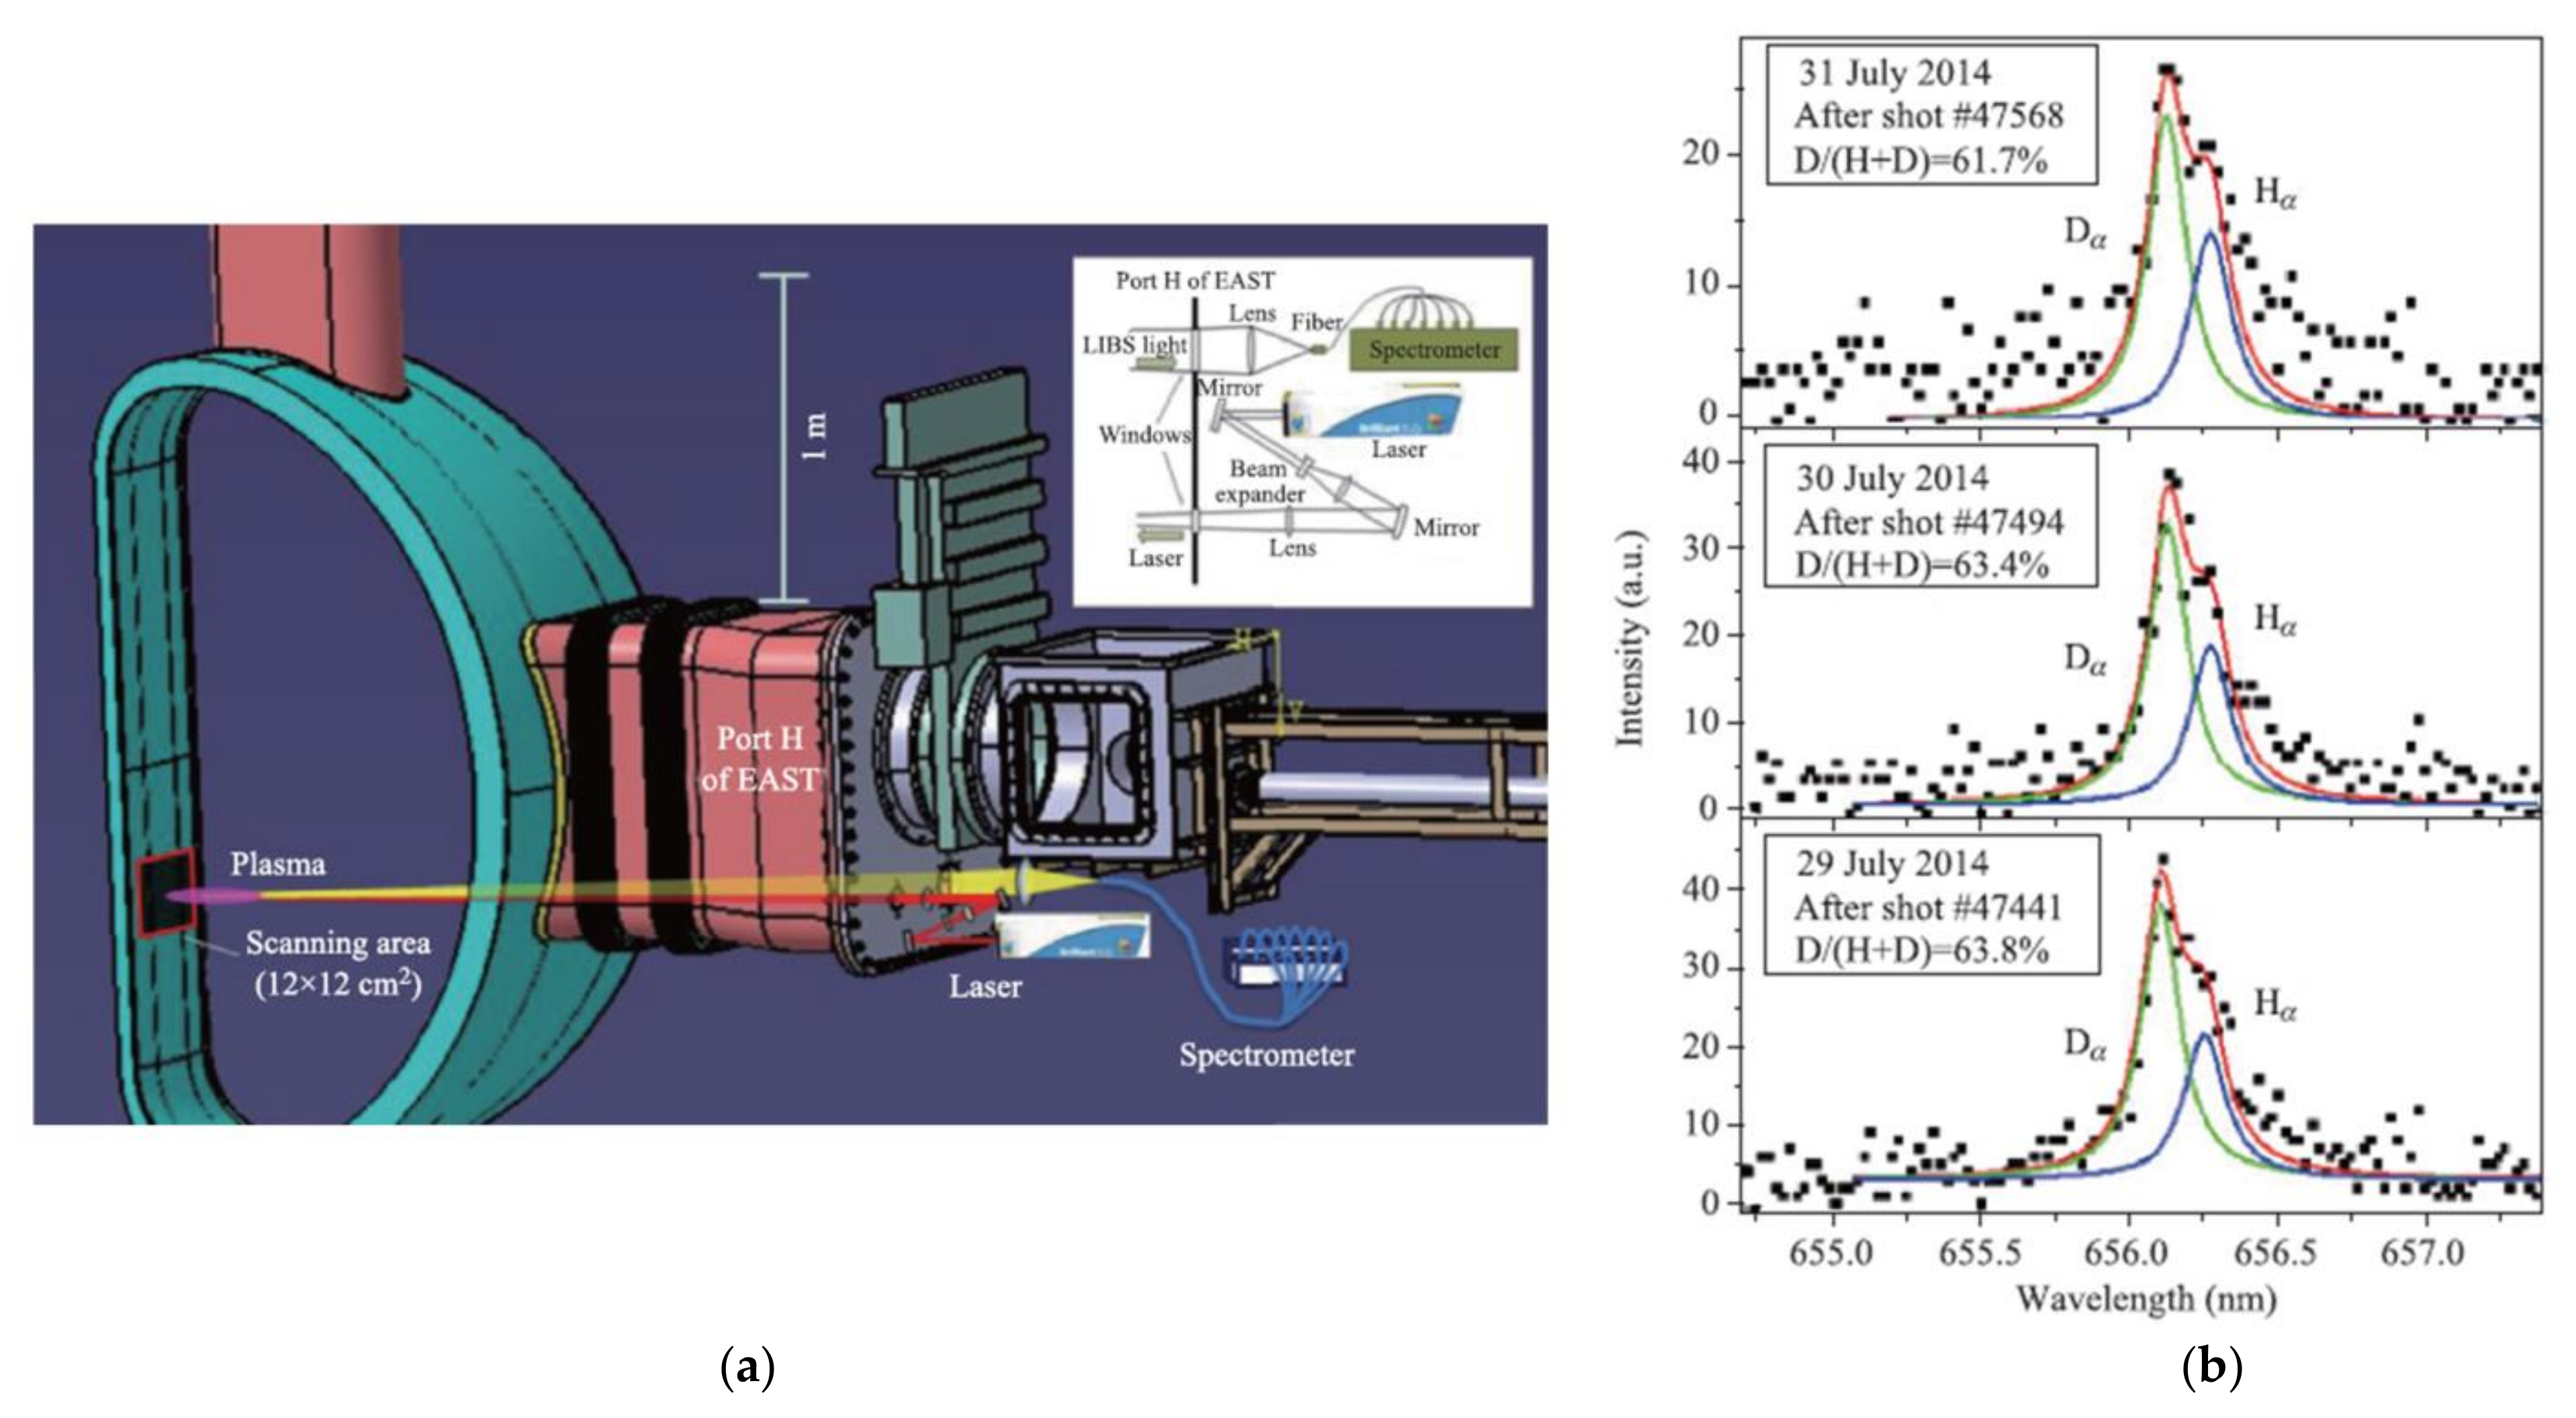
5.5. Nuclear Material
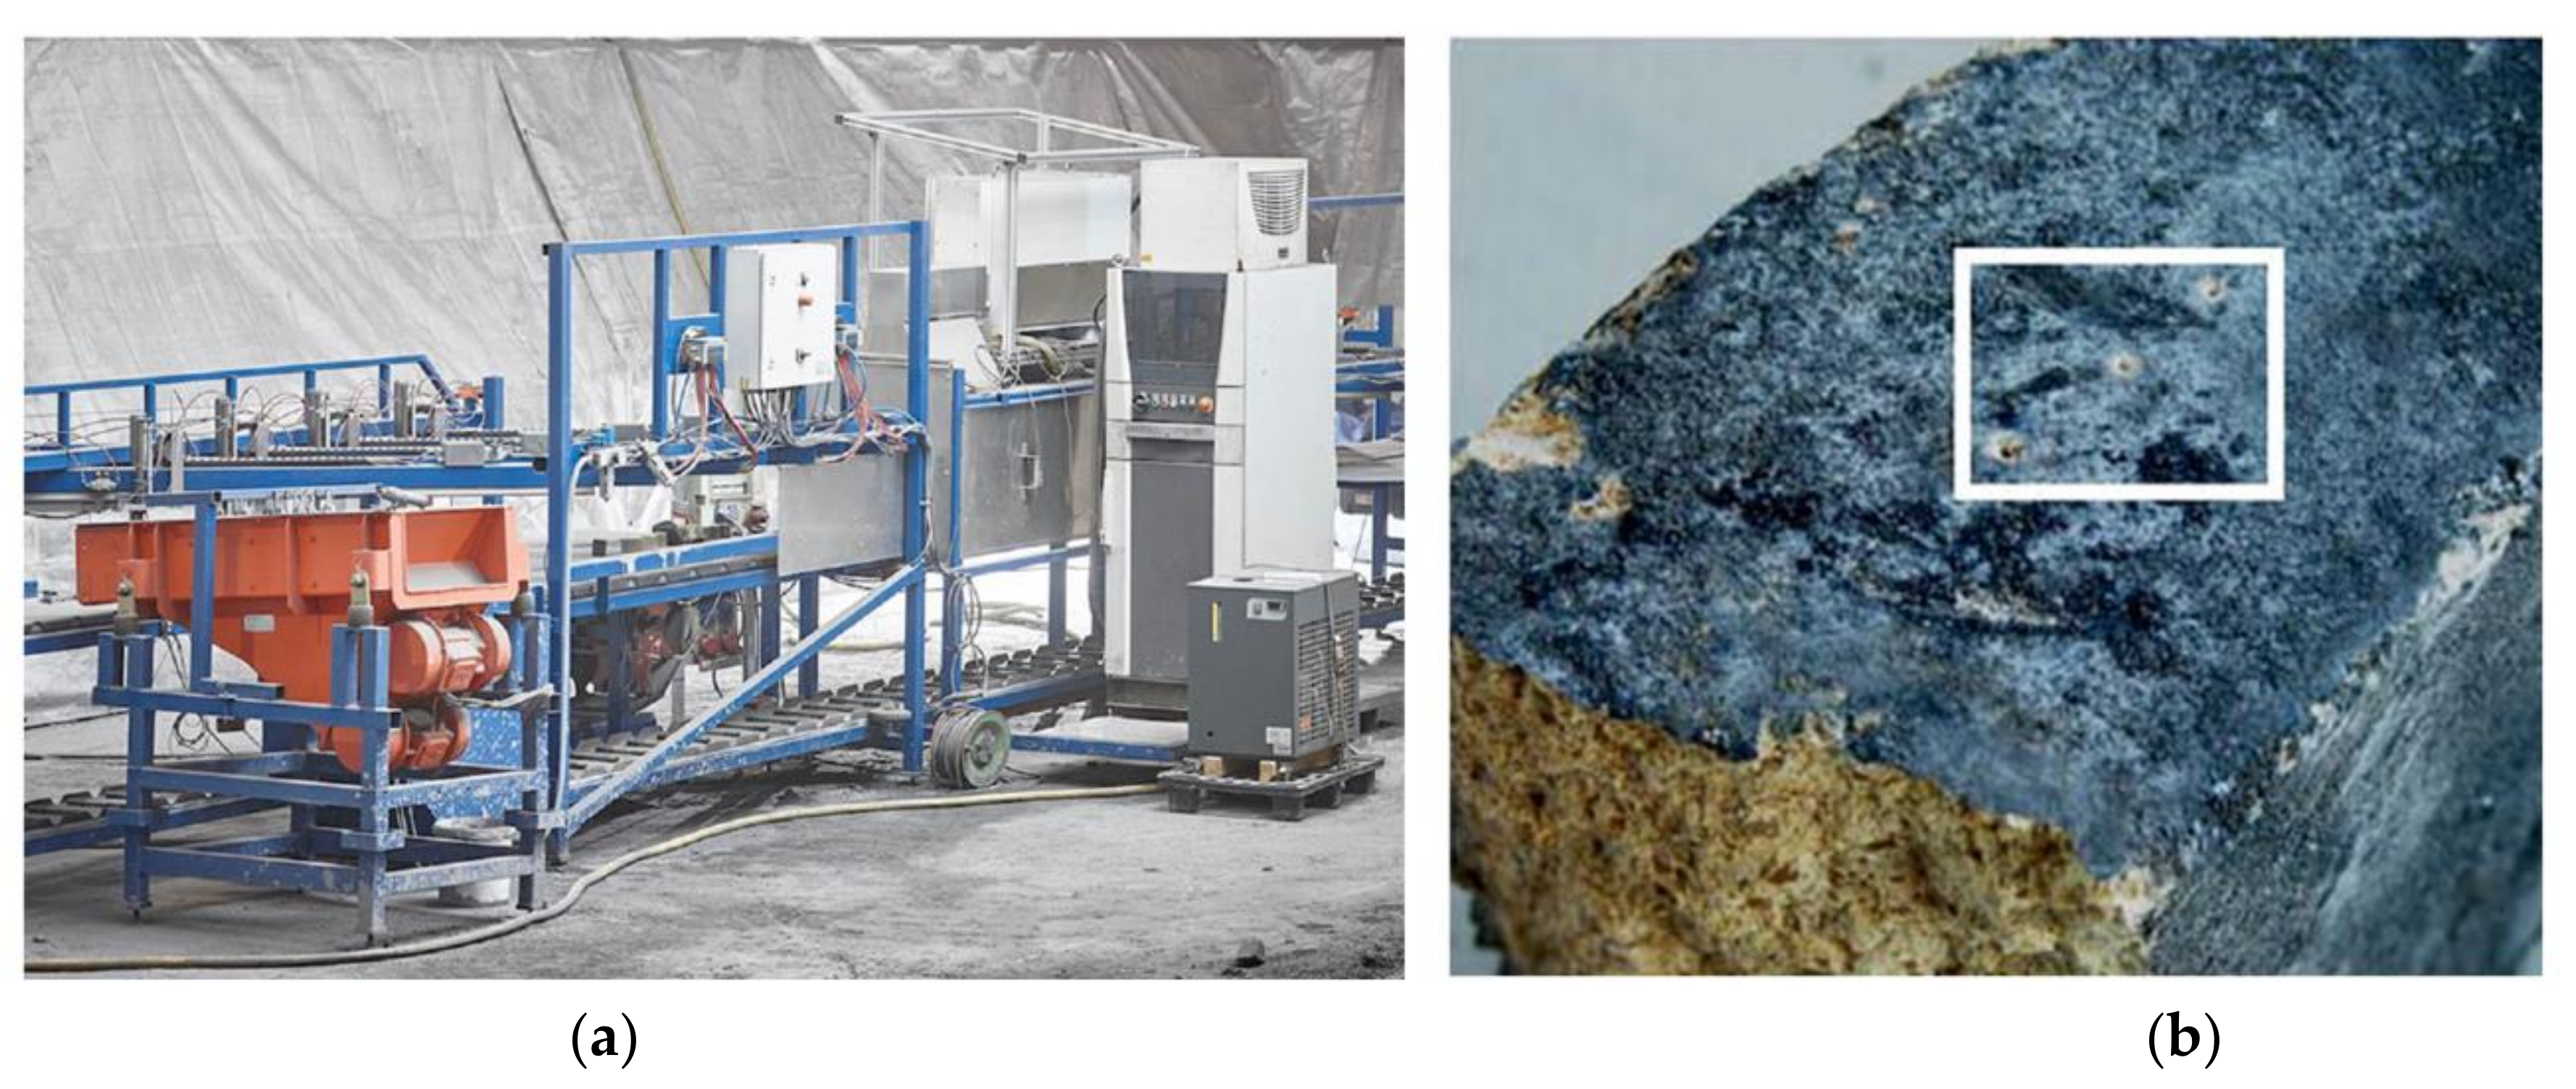
5.6. Refractory Materials
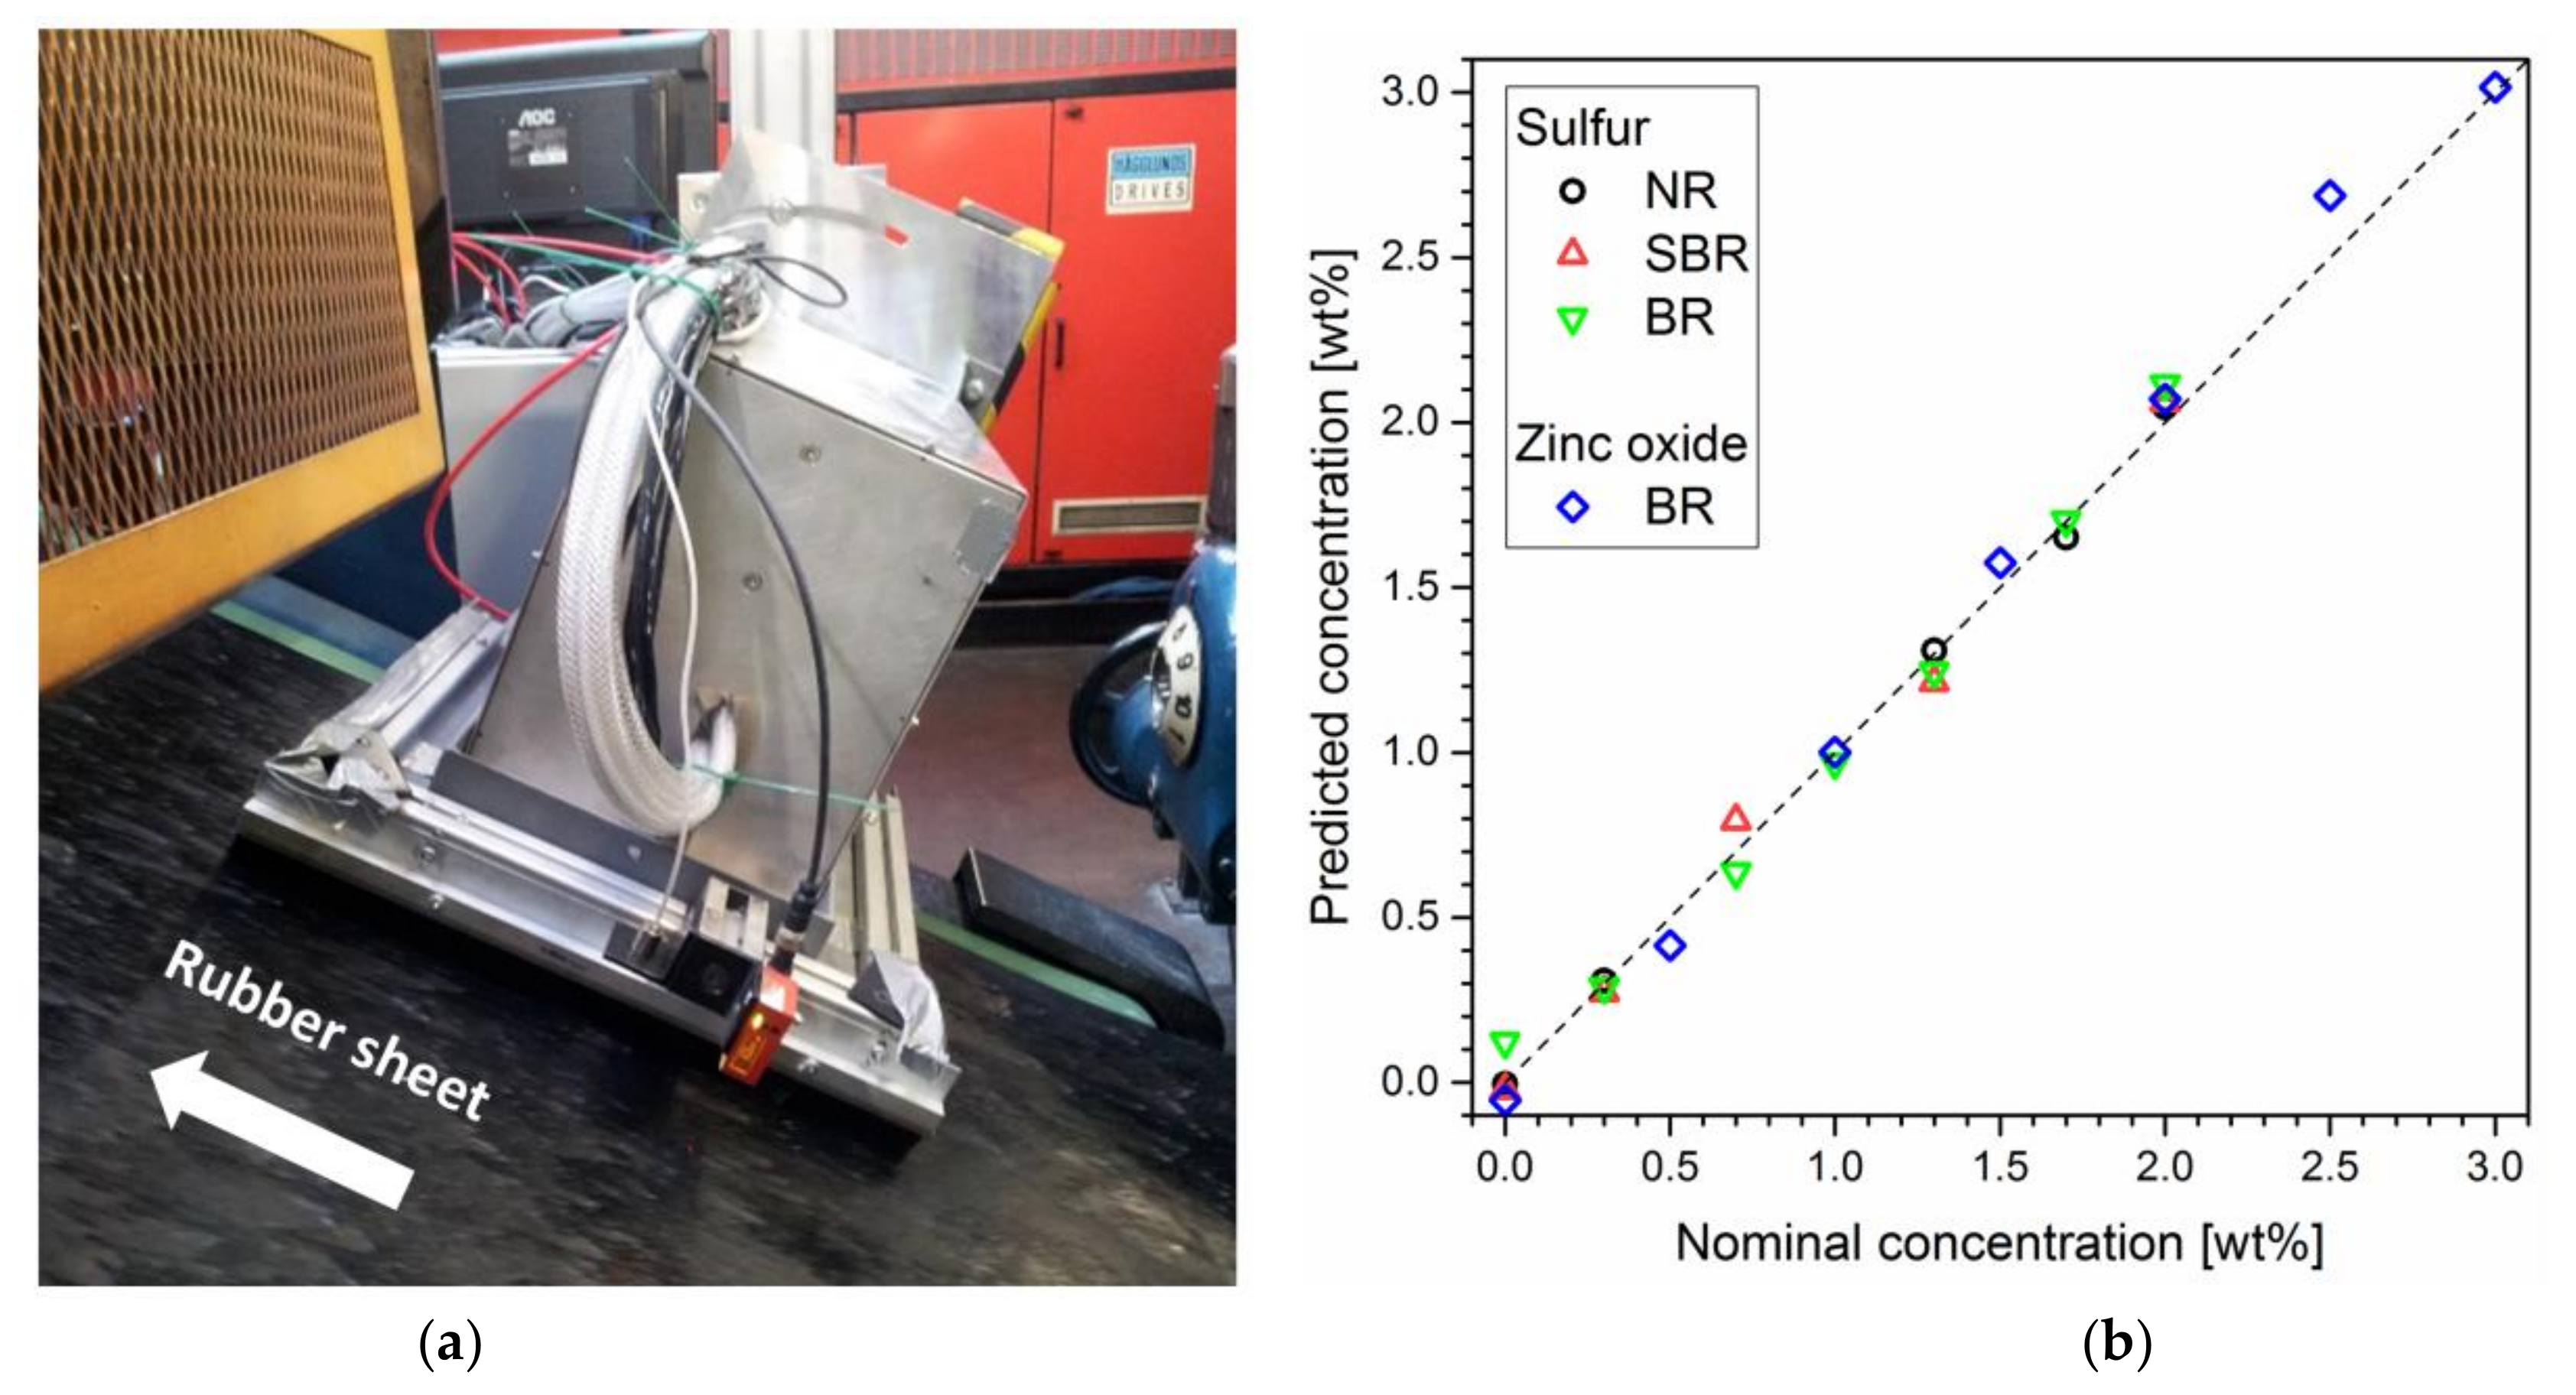
5.7. Rubber
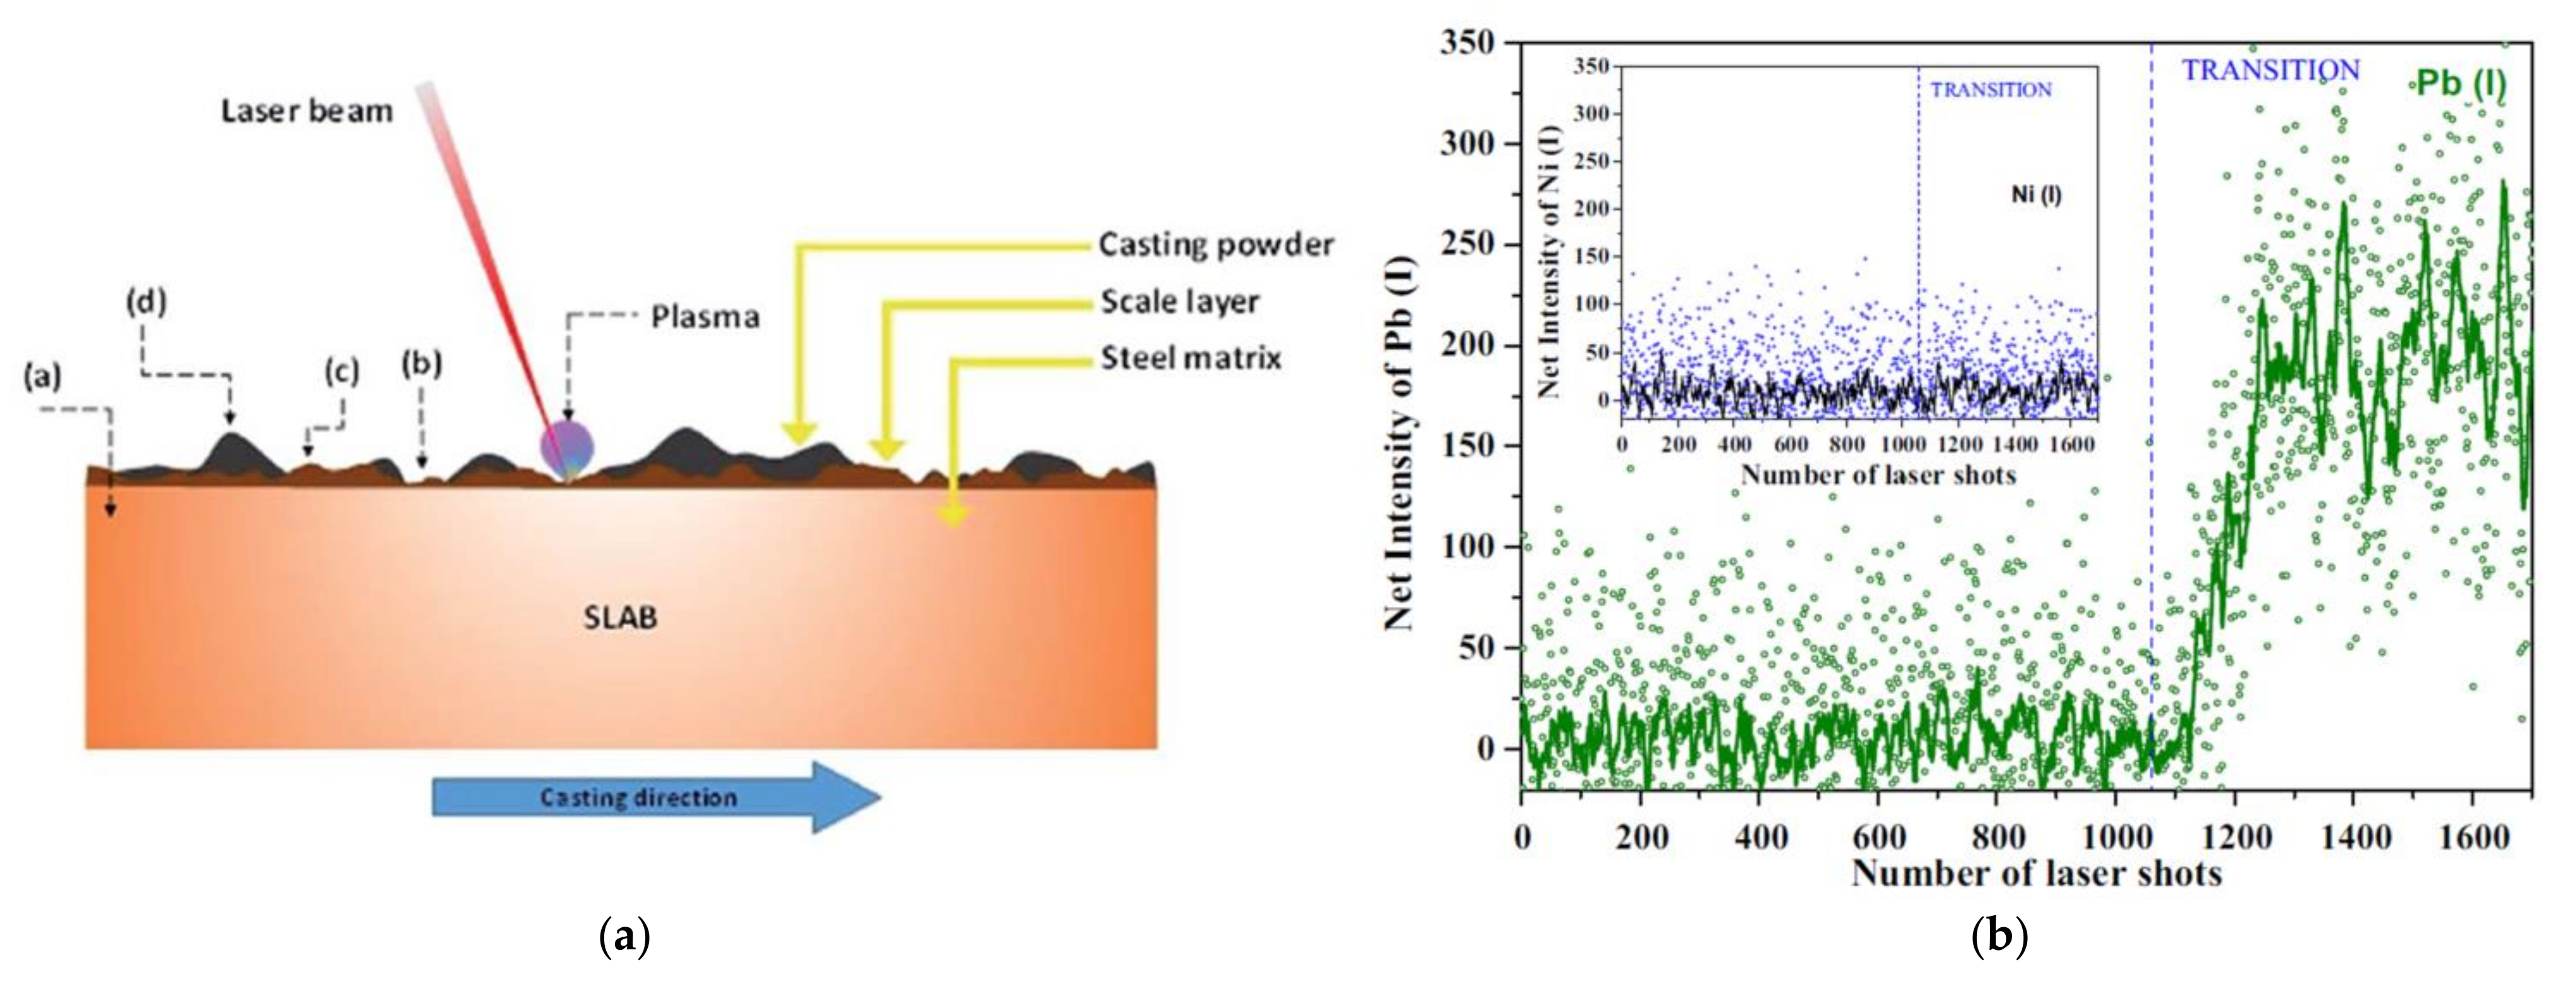
5.8. Steel Grade Detection in Casting
5.9. Steel Slags
5.10. Waste Electrical and Electronic Equipment
5.11. Waste Polymers
5.12. Welds
6. Conclusions
Author Contributions
Funding
Institutional Review Board Statement
Informed Consent Statement
Data Availability Statement
Acknowledgments
Conflicts of Interest
Appendix A


References
- Singh, J.P.; Thakur, S.N. Laser-Induced Breakdown Spectroscopy, 2nd ed.; Elsevier: Amsterdam, Netherlands, 2020. [Google Scholar]
- Mussazzi, S.; Perini, U. Laser-Induced Breakdown Spectroscopy: Theory and Applications; Springer Series in Optical Sciences; Springer: Berlin/Heidelberg, Germany, 2014; Volume 182. [Google Scholar]
- Hahn, D.W.; Omenetto, N. Laser-induced breakdown spectroscopy (LIBS), part I: Review of basic diagnostics and plasma particle interactions: Still-challenging issues within the analytical plasma community. Appl. Spectrosc. 2010, 64, 335A–366A. [Google Scholar] [CrossRef] [Green Version]
- Hahn, D.W.; Omenetto, N. Laser-induced breakdown spectroscopy (LIBS), part II: Review of instrumental and methodological approaches to material analysis and applications to different fields. Appl. Spectrosc. 2012, 66, 347–419. [Google Scholar] [CrossRef]
- Pathak, A.K.; Kumar, R.; Singh, V.K.; Agrawal, R.; Rai, S.; Rai, A.K. Assessment of LIBS for spectrochemical analysis: A review. Appl. Spectrosc. Rev. 2012, 47, 14–40. [Google Scholar] [CrossRef]
- Noll, R. Laser Induced Breakdown Spectroscopy, Fundamentals and Applications; Springer: Berlin/Heidelberg, Germany, 2012. [Google Scholar]
- Miziolek, A.W.; Palleschi, V.; Schechter, I. Laser-Induced Breakdown Spectroscopy (LIBS), Fundamentals and Applications; Cambridge University Press: Cambridge, UK, 2006. [Google Scholar]
- Cremers, D.A.; Radziemski, L.J. Handbook of Laser-Induced Breakdown Spectroscopy; John Wiley & Sons Ltd.: Chichester, West Sussex, UK, 2006. [Google Scholar]
- Carter, S.; Clough, R.; Fisher, A.; Gibson, B.; Russell, B.; Waack, J. Atomic spectrometry update: Review of advances in the analysis of metals, chemicals and materials. J. Anal. At. Spectrom. 2020, 35, 2410–2474. [Google Scholar] [CrossRef]
- Christesen, S.D.; Fountain III, A.W.; Chyba, T.H.; Pearman, W.F.; Guicheteau, J.A. Laser spectroscopy for the detection of chemical, biological and explosive threats. In Laser Spectroscopy for Sensing: Fundamentals, Techniques and Applications; Baudelet, M., Ed.; Woodhead: Cambridge, UK, 2014; Chapter 13; pp. 393–420. [Google Scholar] [CrossRef]
- Panya panya, S.N.; Galmed, A.H.; Maaza, M.; Mothudi, B.M.; Harith, M.A.; Kennedy, J. Laser-Induced Breakdown Spectroscopy (LIBS) on Geological Samples: Compositional Differentiation. MRS Adv. 2018, 3, 1969–1983. [Google Scholar] [CrossRef]
- Qiao, S.; Ding, Y.; Tian, D.; Yao, L.; Yang, G. A Review of Laser-Induced Breakdown Spectroscopy for Analysis of Geological Materials. Appl. Spectrosc. Rev. 2015, 50, 1–26. [Google Scholar] [CrossRef]
- Botto, A.; Campanella, B.; Legnaioli, S.; Lezzerini, M.; Lorenzetti, G.; Pagnotta, S.; Poggialini, F.; Palleschi, V. Applications of laser-induced breakdown spectroscopy in cultural heritage and archaeology: A critical review. J. Anal. At. Spectrom. 2019, 34, 81–103. [Google Scholar] [CrossRef]
- Lazic, V.; Vadrucci, M.; Fantoni, R.; Chiari, M.; Mazzinghi, A.; Gorghinian, A. Applications of laser induced breakdown spectroscopy for cultural heritage: A comparison with XRF and PIXE techniques. Spectrochim. Acta Part B 2018, 149, 1–14. [Google Scholar] [CrossRef]
- Rehse, S.J. A review of the use of laser-induced breakdown spectroscopy for bacterial classification, quantification, and identification. Spectrochim. Acta Part B 2019, 154, 50–69. [Google Scholar] [CrossRef]
- Gaudiuso, R.; Melikechi, N.; Abdel-Salam, Z.A.; Harith, M.A.; Palleschi, V.; Motto-Ros, V.; Busser, B. Laser-induced breakdown spectroscopy for human and animal health: A review. Spectrochim. Acta Part B 2018, 152, 123–148. [Google Scholar] [CrossRef]
- Singh, V.K.; Rai, A.K. Prospects for laser-induced breakdown spectroscopy for biomedical applications: A review. Lasers Med. Sci. 2011, 26, 673–687. [Google Scholar] [CrossRef]
- Baudelet, M.; Guyon, L.; Yu, J.; Wolf, J.-P.; Amodeo, T.; Frájafon, E.; Laloi, P. Femtosecond time-resolved laser-induced breakdown spectroscopy for detection and identification of bacteria: A comparison to the nanosecond regime. J. Appl. Phys. 2006, 99, 084701. [Google Scholar] [CrossRef] [Green Version]
- Fortes, F.J.; Guirado, S.; Metzinger, A.; Laserna, J.J. A study of underwater stand-off laser-induced breakdown spectroscopy for chemical analysis of objects in the deep ocean. J. Anal. At. Spectrom. 2015, 30, 1050–1056. [Google Scholar] [CrossRef]
- Thornton, B.; Takahashi, T.; Sato, T.; Sakka, T.; Tamura, A.; Matsumoto, A.; Nozaki, T.; Ohki, T.; Ohki, K. Development of a deep-sea laser-induced breakdown spectrometer for in situ multi-element chemical analysis. Deep Sea Res. Part I 2015, 95, 20–36. [Google Scholar] [CrossRef] [Green Version]
- Wiens, R.C.; Maurice, S.; Barraclough, B.; Saccoccio, M.; Barkley, W.C.; Bell III, J.F.; Bender, S.; Bernardin, J.; Blaney, D.; Blank, J.; et al. The chemcam instrument suite on the mars science laboratory (MSL) rover: Body unit and combined system tests. Space Sci. Rev. 2012, 170, 167–227. [Google Scholar] [CrossRef]
- Nachon, M.; Clegg, S.M.; Mangold, N.; Schröder, S.; Kah, L.C.; Dromart, G.; Ollila, A.; Johnson, J.R.; Oehler, D.Z.; Bridges, J.C.; et al. Calcium sulfate veins characterized by chemcam/curiosity at gale crater, mars. J. Geophys. Res. Planets 2014, 119, 1991–2016. [Google Scholar] [CrossRef] [Green Version]
- NASA, Mars Science Laboratory. Available online: http://www.nasa.gov/mission_pages/msl/index.html (accessed on 24 February 2021).
- NASA, Mars Perseverance Rover. Available online: https://www.nasa.gov/perseverance (accessed on 24 February 2021).
- Zhang, Y.; Zhang, T.; Li, H. Application of laser-induced breakdown spectroscopy (LIBS) in environmental monitoring. Spectrochim. Acta Part B 2021, 181, 106218. [Google Scholar] [CrossRef]
- Gonçalves, D.A.; Senesi, G.S.; Nicolodelli, G. Laser-induced breakdown spectroscopy applied to environmental systems and their potential contaminants. An overview of advances achieved in the last few years. Trends Environ. Anal. Chem. 2021, 30, e00121. [Google Scholar] [CrossRef]
- Zorov, N.B.; Popov, A.M.; Zaytsev, S.M.; Labutin, T.A. Qualitative and quantitative analysis of environmental samples by laser-induced breakdown spectrometry. Russ. Chem. Rev. 2015, 84, 1021–1050. [Google Scholar] [CrossRef]
- Yu, X.; Li, Y.; Gu, X.; Bao, J.; Yang, H.; Sun, L. Laser-induced breakdown spectroscopy application in environmental monitoring of water quality: A review. Environ. Monit. Assess. 2014, 186, 8969–8980. [Google Scholar] [CrossRef] [PubMed]
- Bäuerle, D. Laser Processing and Chemistry, 4th ed.; Springer: Berlin/Heidelberg, Germany, 2011. [Google Scholar]
- Konjević, N.; Ivković, M.; Jovićević, S. Spectroscopic diagnostics of laser-induced plasmas. Spectrochim. Acta Part B 2010, 65, 593–602. [Google Scholar] [CrossRef]
- Kautz, E.J.; Rönnebro, E.C.E.; Devaraj, A.; Senor, D.J.; Harilal, S.S. Detection of hydrogen isotopes in zircaloy-4 via femtosecond LIBS. J. Anal. At. Spectrom. 2021, 36, 1217–1227. [Google Scholar] [CrossRef]
- Giannakaris, N.; Haider, A.; Ahamer, C.M.; Grünberger, S.; Trautner, S.; Pedarnig, J.D. Femtosecond single-pulse and orthogonal double-pulse laser-induced breakdown spectroscopy (LIBS): Femtogram mass detection and chemical imaging with micrometer spatial resolution. Appl. Spectrosc. 2021. published online. [Google Scholar] [CrossRef]
- He, X.; Chen, B.; Chen, Y.; Li, R.; Wang, F. Femtosecond laser-ablation spark-induced breakdown spectroscopy and its application to the elemental analysis of aluminum alloys. J. Anal. At. Spectrom. 2018, 33, 2203–2209. [Google Scholar] [CrossRef]
- Ahamer, C.M.; Pedarnig, J.D. Femtosecond double pulse laser-induced breakdown spectroscopy: Investigation of the intensity enhancement. Spectrochim. Acta Part B 2018, 148, 23–30. [Google Scholar] [CrossRef]
- Ahamer, C.M.; Riepl, K.M.; Huber, N.; Pedarnig, J.D. Femtosecond laser-induced breakdown spectroscopy: Elemental imaging of thin films with high spatial resolution. Spectrochim. Acta Part B 2017, 136, 56–65. [Google Scholar] [CrossRef]
- Zhang, D.; Chen, A.; Wang, X.; Li, S.; Wang, Y.; Sui, L.; Jiang, Y.; Jin, M. Enhancement mechanism of femtosecond double-pulse laser-induced Cu plasma spectroscopy. Opt. Laser Technol. 2017, 96, 117–122. [Google Scholar] [CrossRef]
- Labutin, T.A.; Lednev, V.N.; Ilyin, A.A.; Popov, A.M. Femtosecond laser-induced breakdown spectroscopy. J. Anal. At. Spectrom. 2016, 31, 90–118. [Google Scholar] [CrossRef]
- Zorba, V.; Mao, X.; Russo, R.E. Femtosecond laser induced breakdown spectroscopy of Cu at the micron/sub-micron scale. Spectrochim. Acta Part B 2015, 113, 37–42. [Google Scholar] [CrossRef] [Green Version]
- Harilal, S.S.; Brumfield, B.E.; LaHaye, N.L.; Hartig, K.C.; Phillips, M.C. Optical spectroscopy of laser-produced plasmas for standoff isotopic analysis. Appl. Phys. Rev. 2018, 5, 021301. [Google Scholar] [CrossRef]
- Bol’shakov, A.A.; Mao, X.L.; Gonzalez, J.J.; Russo, R.E. Laser ablation molecular isotopic spectrometry (LAMIS): Current state of the art. J. Anal. At. Spectrom. 2016, 31, 119–134. [Google Scholar] [CrossRef]
- Otto, M. Chemometrics—Statistics and Computer Application in Analytical Chemistry, 5th ed.; Wiley-VCH: Weinheim, Germany, 2019. [Google Scholar]
- Torrione, R.; Collins, L.M.; Morton Jr, K.D. Multivariate analysis, chemometrics, and machine learning in laser spectroscopy. In Laser Spectroscopy for Sensing: Fundamentals, Techniques And Applications; Baudelet, M., Ed.; Woodhead: Cambridge, UK, 2014; Chapter 5; pp. 125–164. [Google Scholar] [CrossRef]
- Poitrasson, F.; d’Abzac, F.-X. Femtosecond laser ablation inductively coupled plasma source mass spectrometry for elemental and isotopic analysis: Are ultrafast lasers worthwhile? J. Anal. At. Spectrom. 2017, 32, 1075–1091. [Google Scholar] [CrossRef]
- LaHaye, N.L.; Phillips, M.C.; Duffin, A.M.; Eiden, G.C.; Harilal, S.S. The influence of ns- and fs-LA plume local conditions on the performance of a combined LIBS/LA-ICP-MS sensor. J. Anal. At. Spectrom. 2016, 31, 515–522. [Google Scholar] [CrossRef]
- Koch, J.; Günther, D. Review of the State-of-the-Art of Laser Ablation Inductively Coupled Plasma Mass Spectrometry. Appl. Spectrosc. 2011, 65, 155A–162A. [Google Scholar] [CrossRef]
- Knobel, R.; Behrens, H.; Schwarzburger, N.I.; Binnewies, M.; Horn, I. Kinetics of lithium intercalation in TiX2 single crystals (X = S, Se, Te) under hydrostatic pressure. Z. Phys. Chem. 2015, 229, 1289–1312. [Google Scholar] [CrossRef]
- Bian, Q.Z.; Koch, J.; Lindner, H.; Berndt, H.; Hergenröder, R.; Niemax, K. Non-matrix matched calibration using near-IR femtosecond laser ablation inductively coupled plasma optical emission spectrometry. J. Anal. At. Spectrom. 2005, 20, 736–740. [Google Scholar] [CrossRef]
- Ciucci, A.; Corsi, M.; Palleschi, V.; Rastelli, S.; Salvetti, A.; Tognoni, E. New procedure for quantitative elemental analysis by laser induced plasma spectroscopy. Appl. Spectrosc. 1999, 53, 960–964. [Google Scholar] [CrossRef]
- Tognoni, E.; Cristoforetti, G.; Legnaioli, S.; Palleschi, V.; Salvetti, A.; Mueller, M.; Panne, U.; Gornushkin, I. A numerical study of expected accuracy and precision in calibration-free laser-induced breakdown spectroscopy in the assumption of ideal analytical plasma. Spectrochim. Acta Part B 2007, 62, 1287–1302. [Google Scholar] [CrossRef]
- LIBS Info (2021). And: Applied Photonics Ltd. (2019), Analytical Capabilities of LIBS. Available online: http://www.appliedphotonics.co.uk/Libs/capabilities_libs.htm (accessed on 23 January 2019).
- Ahamer, C.M.; Eschlböck-Fuchs, S.; Kolmhofer, P.J.; Rössler, R.; Huber, N.; Pedarnig, J.D. Laser-induced breakdown spectroscopy of major and minor oxides in steel slags: Influence of detection geometry and signal normalization. Spectrochim. Acta Part B 2016, 122, 157–164. [Google Scholar] [CrossRef]
- NIST Atomic Spectra Database. Available online: http://physics.nist.gov/PhysRefData/ASD/ (accessed on 14 July 2021).
- Sansonetti, J.; Martin, W.; Young, S. Handbook of Basic Atomic Spectroscopic Data (version 1.1.2). 2005. Available online: http://physics.nist.gov/Handbook (accessed on 14 July 2021).
- IUPAC, International Union of Pure and Applied Chemistry. 2021. Available online: https://iupac.org/ (accessed on 14 July 2021).
- Eschlböck-Fuchs, S.; Demidov, A.; Gornuskin, I.B.; Schmid, T.; Rössler, R.; Huber, N.; Panne, U.; Pedarnig, J.D. Tomography of homogenized laser-induced plasma by Radon transform technique. Spectrochim. Acta Part B 2016, 123, 59–67. [Google Scholar] [CrossRef]
- Ctvrtníkova, T.; Cabalín, L.M.; Laserna, J.; Kanický, V. Comparison of double-pulse and single-pulse laser-induced breakdown spectroscopy techniques in the analysis of powdered samples of silicate raw materials for the brick-and-tile industry. Spectrochim. Acta Part B 2008, 63, 42–50. [Google Scholar] [CrossRef]
- St-Onge, L.; Sabsabi, M.; Cielo, P. Analysis of solids using laser-induced plasma spectroscopy in double-pulse mode. Spectrochim. Acta Part B 1998, 53, 407–415. [Google Scholar] [CrossRef]
- Babushok, V.I.; DeLucia, F.C., Jr.; Gottfried, J.L.; Munson, C.A.; Miziolek, A.W. Double pulse laser ablation and plasma: Laser induced breakdown spectroscopy signal enhancement. Spectrochim. Acta Part B 2006, 61, 999–1014. [Google Scholar] [CrossRef]
- Viskup, R.; Praher, B.; Linsmeyer, T.; Scherndl, H.; Pedarnig, J.D.; Heitz, J. Influence of pulse-to-pulse delay for 532 nm double-pulse laser-induced breakdown spectroscopy of technical polymers. Spectrochim. Acta Part B 2010, 65, 935–942. [Google Scholar] [CrossRef]
- Windom, B.C.; Hahn, D.W. Laser ablation—laser induced breakdown spectroscopy (LA-LIBS): A means for overcoming matrix effects leading to improved analyte response. J. Anal. At. Spectrom. 2009, 24, 1665–1675. [Google Scholar] [CrossRef]
- Heilbrunner, H.; Huber, N.; Wolfmeir, H.; Arenholz, E.; Pedarnig, J.D.; Heitz, J. Double-pulse laser-induced breakdown spectroscopy for trace element analysis in sintered iron oxide ceramics. Appl. Phys. A: Mater. Sci. Process. 2012, 106, 15–23. [Google Scholar] [CrossRef]
- Grünberger, S.; Eschlböck-Fuchs, S.; Hofstadler, J.; Pissenberger, A.; Duchaczek, H.; Trautner, S.; Pedarnig, J.D. Analysis of minor elements in steel and chemical imaging of micro-patterned polymer by laser ablation-spark discharge-optical emission spectroscopy and laser-induced breakdown spectroscopy. Spectrochim. Acta Part B 2020, 169, 105884. [Google Scholar] [CrossRef]
- Grünberger, S.; Watzl, G.; Huber, N.; Eschlböck-Fuchs, S.; Hofstadler, J.; Pissenberger, A.; Duchaczek, H.; Trautner, S.; Pedarnig, J.D. Chemical imaging with Laser Ablation—Spark Discharge—Optical Emission Spectroscopy (LA-SD-OES) and Laser-Induced Breakdown Spectroscopy (LIBS). Opt. Laser Technol. 2020, 123, 105944. [Google Scholar] [CrossRef]
- Kexue, L.I.; Zhou, W.; Shen, Q.; Shao, J.; Qian, H. Signal enhancement of lead and arsenic in soil using laser ablation combined with fast electric discharge. Spectrochim. Acta Part B 2010, 65, 420–424. [Google Scholar] [CrossRef]
- Chen, Y.; Zhang, Q.; Li, G.; Li, R.; Zhou, J. Laser ignition assisted spark-induced breakdown spectroscopy for the ultra-sensitive detection of trace mercury ions in aqueous solutions. J. Anal. At. Spectrom. 2010, 25, 1969–1973. [Google Scholar] [CrossRef]
- Deng, W.; Liu, Y.; Wei, G.; Li, X.; Tu, X.; Xie, L.; Zhang, H.; Sun, W. High-precision analysis of Sr/Ca and Mg/Ca ratios in corals by laser ablation inductively coupled plasma optical emission spectrometry. J. Anal. At. Spectrom. 2010, 25, 84–87. [Google Scholar] [CrossRef]
- Pedarnig, J.D.; Heitz, J.; Ionita, E.R.; Dinescu, G.; Praher, B.; Viskup, R. Combination of RF—plasma jet and Laser—induced plasma for breakdown spectroscopy analysis of complex materials. Appl. Surf. Sci. 2011, 257, 5452–5455. [Google Scholar] [CrossRef]
- Iqbal, A.; Sun, Z.; Wall, M.; Alwahabi, Z.T. Sensitive elemental detection using microwave-assisted laser-induced breakdown imaging. Spectrochim. Acta Part B 2017, 136, 16–22. [Google Scholar] [CrossRef]
- Ikeda, Y.; Moon, A.; Kaneko, M. Development of microwave-enhanced spark-induced breakdown spectroscopy. Appl. Opt. 2010, 49, C95–C100. [Google Scholar] [CrossRef]
- Liu, Y.; Baudelet, M.; Richardson, M. Elemental analysis by microwave-assisted laser-induced breakdown spectroscopy: Evaluation on ceramics. J. Anal. At. Spectrom. 2010, 25, 1316–1323. [Google Scholar] [CrossRef]
- Liu, J.; Shen, X.-J.; Xu, P.; Cui, F.-P.; Shi, X.-X.; Li, X.-P.; Wang, H.-Z. Research on on-line classification system of aluminum alloy for laser-induced breakdown spectrum. Spectrosc. Spectr. Analysis. 2020, 40, 3901–3905. [Google Scholar]
- Piorek, S. Rapid sorting of aluminum alloys with handheld μLIBS analyzer. Mater. Today Proc. 2019, 10, 348–354. [Google Scholar] [CrossRef]
- Aragón, C.; Aguilera, J.A. Direct analysis of aluminum alloys by CSigma laser-induced breakdown spectroscopy. Anal. Chim. Acta 2018, 1009, 12–19. [Google Scholar] [CrossRef]
- Bennett, B.N.; Martin, M.Z.; Leonard, D.N.; Garlea, E. Calibration curves for commercial copper and aluminum alloys using handheld laser-induced breakdown spectroscopy. Appl. Phys. B Lasers Opt. 2018, 124, 42. [Google Scholar] [CrossRef]
- Sun, D.; Ma, Y.; Wang, Y.; Su, M.; Lu, Q.; Dong, C. Determination of the limits of detection for aluminum-based alloys by spatially resolved single-and double-pulse laser-induced breakdown spectroscopy. Anal. Methods 2018, 10, 2595–2603. [Google Scholar] [CrossRef]
- Doucet, F.R.; Belliveau, T.F.; Fortier, J.-L.; Hubert, J. Use of chemometrics and laser-induced breakdown spectroscopy for quantitative analysis of major and minor elements in aluminium alloys. Appl. Spectrosc. 2007, 61, 327–332. [Google Scholar] [CrossRef]
- Campanella, B.; Grifoni, E.; Legnaioli, S.; Lorenzetti, G.; Pagnotta, S.; Sorrentino, F.; Palleschi, V. Classification of wrought aluminum alloys by ANN evaluation of LIBS spectra from aluminum scrap samples. Spectrochim. Acta Part B 2017, 134, 52–57. [Google Scholar] [CrossRef]
- Zivkovic, S.; Savovic, J.; Trtica, M.; Mutic, J.; Momcilovic, M. Elemental analysis of aluminum alloys by laser induced breakdown spectroscopy based on TEA CO2 laser. J. Alloy. Compd. 2017, 700, 175–184. [Google Scholar] [CrossRef]
- Cristoforetti, G.; Legnaioli, S.; Palleschi, V.; Salvetti, A.; Tognoni, E.; Benedetti, P.A.; Brioschi, F.; Ferrario, F. Quantitative analysis of aluminium alloys by low-energy, high-repetition rate laser-induced breakdown spectroscopy. J. Anal. At. Spectrom. 2006, 21, 697–702. [Google Scholar] [CrossRef]
- Kaufmann, H.; Fragner, W.; Uggowitzer, P.J. Influence of variations in alloy composition on castability and process stability. Part 2: Semi-solid casting processes. Int. J. Cast Met. Res. 2005, 18, 279–285. [Google Scholar] [CrossRef]
- Völker, T.; Millar, S.; Strangfeld, C.; Wilsch, G. Identification of type of cement through laser-induced breakdown spectroscopy. Constr. Build. Mater. 2020, 258, 120345. [Google Scholar] [CrossRef]
- Mateo, J.; Quintero, M.C.; Fernández, J.M.; García, M.C.; Rodero, A. Application of LIBS technology for determination of Cl concentrations in mortar samples. Constr. Build. Mater. 2019, 204, 716–726. [Google Scholar] [CrossRef]
- Dietz, T.; Klose, J.; Kohns, P.; Ankerhold, G. Quantitative determination of chlorides by molecular laser-induced breakdown spectroscopy. Spectrochim. Acta Part B 2019, 152, 59–67. [Google Scholar] [CrossRef]
- Millar, S.; Gottlieb, C.; Günther, T.; Sankat, N.; Wilsch, G.; Kruschwitz, S. Chlorine determination in cement-bound materials with laser-induced breakdown spectroscopy (LIBS)—A review and validation. Spectrochim. Acta Part B 2018, 147, 1–8. [Google Scholar] [CrossRef]
- Yin, H.; Hou, Z.; Zhang, L.; Zhang, X.; Wang, Z.; Li, Z. Cement raw material quality analysis using laser-induced breakdown spectroscopy. J. Anal. At. Spectrom. 2016, 31, 2384–2390. [Google Scholar] [CrossRef]
- Xia, H.; Bakker, M.C.M. Reliable classification of moving waste materials with LIBS in concrete recycling. Talanta 2014, 120, 239–247. [Google Scholar] [CrossRef] [PubMed]
- Labutin, T.A.; Popov, A.M.; Raikov, S.N.; Zaytsev, S.M.; Labutina, N.A.; Zorov, N.B. Determination of chlorine in concrete by laser-induced breakdown spectroscopy in air. J. Appl. Spectrosc. 2013, 80, 315–318. [Google Scholar] [CrossRef]
- Mansoori, A.; Roshanzadeh, B.; Khalaji, M.; Tavassoli, S.H. Quantitative analysis of cement powder by laser induced breakdown spectroscopy. Opt. Lasers Eng. 2011, 49, 318–323. [Google Scholar] [CrossRef]
- Gondal, M.A.; Yamani, Z.H.; Hussain, T.; Al-Amoudi, O.S.B. Determination of chloride content in different types of cement using laser-induced breakdown spectroscopy. Spectrosc. Lett. 2009, 42, 171–177. [Google Scholar] [CrossRef]
- Gehlen, C.D.; Wiens, E.; Noll, R.; Wilsch, G.; Reichling, K. Chlorine detection in cement with laser-induced breakdown spectroscopy in the infrared and ultraviolet spectral range. Spectrochim. Acta Part B 2009, 64, 1135–1140. [Google Scholar] [CrossRef]
- Weritz, F.; Schaurich, D.; Wilsch, G. Detector comparison for sulfur and chlorine detection with laser induced breakdown spectroscopy in the near-infrared-region. Spectrochim. Acta Part B 2007, 62, 1504–1511. [Google Scholar] [CrossRef]
- Guo, L.-B.; Zhang, D.; Sun, L.-X.; Yao, S.-C.; Zhang, L.; Wang, Z.-Z.; Wang, Q.-Q.; Ding, H.-B.; Lu, Y.; Hou, Z.-Y.; et al. Development in the application of laser-induced breakdown spectroscopy in recent years: A review. Front. Phys. 2021, 16, 22500. [Google Scholar] [CrossRef]
- Zhang, W.; Zhuo, Z.; Lu, P.; Tang, J.; Tang, H.; Lu, J.; Xing, T.; Wang, Y. LIBS analysis of the ash content, volatile matter, and calorific value in coal by partial least squares regression based on ash classification. J. Anal. At. Spectrom. 2020, 35, 1621–1631. [Google Scholar] [CrossRef]
- Zhang, Y.; Dong, M.; Cheng, L.; Wei, L.; Cai, J.; Lu, J. Improved measurement in quantitative analysis of coal properties using laser induced breakdown spectroscopy. J. Anal. At. Spectrom. 2020, 35, 810–818. [Google Scholar] [CrossRef]
- Sheta, S.; Afgan, M.S.; Hou, Z.; Yao, S.-C.; Zhang, L.; Li, Z.; Wang, Z. Coal analysis by laser-induced breakdown spectroscopy: A tutorial review. J. Anal. At. Spectrom. 2019, 34, 1047–1082. [Google Scholar] [CrossRef]
- Li, W.; Lu, J.; Dong, M.; Lu, S.; Yu, J.; Li, S.; Huang, J.; Liu, J. Quantitative analysis of calorific value of coal based on spectral preprocessing by laser-induced breakdown spectroscopy (LIBS). Energy Fuels 2018, 32, 24–32. [Google Scholar] [CrossRef]
- Yan, C.; Qi, J.; Liang, J.; Zhang, T.; Li, H. Determination of coal properties using laser-induced breakdown spectroscopy combined with kernel extreme learning machine and variable selection. J. Anal. At. Spectrom. 2018, 33, 2089–2097. [Google Scholar] [CrossRef]
- Yao, S.; Mo, J.; Zhao, J.; Li, Y.; Zhang, X.; Lu, W.; Lu, Z. Development of a rapid coal analyzer using laser-induced breakdown spectroscopy (LIBS). Appl. Spectrosc. 2018, 72, 1225–1233. [Google Scholar] [CrossRef]
- He, Y.; Whiddon, R.; Wang, Z.; Liu, Y.; Zhu, Y.; Liu, J.; Cen, K. Inhibition of sodium release from zhundong coal via the addition of mineral additives: Online combustion measurement with laser-induced breakdown spectroscopy (LIBS). Energy Fuels 2017, 31, 1082–1090. [Google Scholar] [CrossRef]
- Redoglio, D.; Golinelli, E.; Musazzi, S.; Perini, U.; Barberis, F. A large depth of field LIBS measuring system for elemental analysis of moving samples of raw coal. Spectrochim. Acta Part B 2016, 116, 46–50. [Google Scholar] [CrossRef]
- Dong, M.; Oropeza, D.; Chirinos, J.; González, J.J.; Lu, J.; Mao, X.; Russo, R.E. Elemental analysis of coal by tandem laser induced breakdown spectroscopy and laser ablation inductively coupled plasma time of flight mass spectrometry. Spectrochim. Acta Part B 2015, 109, 44–50. [Google Scholar] [CrossRef] [Green Version]
- Noll, R.; Fricke-Begemann, C.; Brunk, M.; Connemann, S.; Meinhardt, C.; Scharun, M.; Sturm, V.; Makowe, J.; Gehlen, C. Laser-induced breakdown spectroscopy expands into industrial applications. Spectrochim. Acta Part B 2014, 93, 41–51. [Google Scholar] [CrossRef]
- Wang, Z.; Yuan, T.-B.; Hou, Z.-Y.; Zhou, W.-D.; Lu, J.-D.; Ding, H.-B.; Zeng, X.-Y. Laser-induced breakdown spectroscopy in China. Front. Phys. 2014, 9, 419–438. [Google Scholar] [CrossRef]
- Zhang, L.; Hu, Z.-Y.; Yin, W.-B.; Huang, D.; Ma, W.-G.; Dong, L.; Wu, H.-P.; Li, Z.-X.; Xiao, L.-T.; Jia, S.-T. Recent progress on laser-induced breakdown spectroscopy for the monitoring of coal quality and unburned carbon in fly ash. Front. Phys. 2012, 7, 690–700. [Google Scholar] [CrossRef]
- Romero, C.E.; De Saro, R.; Craparo, J.; Weisberg, A.; Moreno, R.; Yao, Z. Laser-induced breakdown spectroscopy for coal characterization and assessing slagging propensity. Energy Fuels 2010, 24, 510–517. [Google Scholar] [CrossRef]
- Wang, Z.; Liu, R.; Deguchi, Y.; Tanaka, S.; Tainaka, K.; Tanno, K.; Watanabe, H.; Yan, J.; Liu, J. Detection improvement of unburned carbon content in fly ash flow using LIBS with a two-stage cyclone measurement system. Energy Fuels 2019, 33, 7805–7812. [Google Scholar] [CrossRef]
- Zhang, T.; Yan, C.; Qi, J.; Tang, H.; Li, H. Classification and discrimination of coal ash by laser-induced breakdown spectroscopy (LIBS) coupled with advanced chemometric methods. J. Anal. At. Spectrom. 2017, 32, 1960–1965. [Google Scholar] [CrossRef]
- Sanghapi, H.K.; Ayyalasomayajula, K.K.; Yueh, F.Y.; Singh, J.P.; McIntyre, D.L.; Jain, J.C.; Nakano, J. Analysis of slags using laser-induced breakdown spectroscopy. Spectrochim. Acta Part B 2016, 115, 40–45. [Google Scholar] [CrossRef] [Green Version]
- Ctvrtnickova, T.; Mateo, M.P.; Yañez, A.; Nicolas, G. Laser induced breakdown spectroscopy application for ash characterisation for a coal fired power plant. Spectrochim. Acta Part B 2010, 65, 734–737. [Google Scholar] [CrossRef]
- Gaft, M.; Dvir, E.; Modiano, H.; Schone, U. Laser induced breakdown spectroscopy machine for online ash analyses in coal. Spectrochim. Acta Part B 2008, 63, 1177–1182. [Google Scholar] [CrossRef]
- Badawy, T.; Hamza, M.; Mansour, M.S.; Abdel-Hafez, A.-H.H.; Imam, H.; Abdel-Raheem, M.A.; Wang, C.; Lattimore, T. Lean partially premixed turbulent flame equivalence ratio measurements using laser-induced breakdown spectroscopy. Fuel 2019, 237, 320–334. [Google Scholar] [CrossRef]
- Jun, H.M.; Kim, J.H.; Lee, S.H.; Yoh, J.J. Towards simplified monitoring of instantaneous fuel concentration in both liquid and gas fueled flames using a combustor injectable LIBS plug. Energy 2018, 160, 225–232. [Google Scholar] [CrossRef]
- McGann, B.; Carter, C.D.; Ombrello, T.; Do, H. Direct spectrum matching of laser-induced breakdown for concentration and gas density measurements in turbulent reacting flows. Combust. Flame 2015, 162, 4479–4485. [Google Scholar] [CrossRef]
- Letty, C.; Pastore, A.; Mastorakos, E.; Balachandran, R.; Couris, S. Comparison of electrical and laser spark emission spectroscopy for fuel concentration measurements. Exp. Therm. Fluid Sci. 2010, 34, 338–345. [Google Scholar] [CrossRef]
- Phuoc, T.X. Laser-induced spark for simultaneous ignition and fuel-to-air ratio measurements. Opt. Lasers Eng. 2006, 44, 520–534. [Google Scholar] [CrossRef]
- Shin, S.; Moon, Y.; Lee, J.; Jang, H.; Hwang, E.; Jeong, S. Signal processing for real-time identification of similar metals by laser-induced breakdown spectroscopy. Plasma Sci. Technol. 2019, 21, 034011. [Google Scholar] [CrossRef]
- He, X.; Li, R.; Wang, F. Elemental analysis of copper alloy by high repetition rate LA-SIBS using compact fiber spectrometer. Plasma Sci. Technol. 2019, 21, 034005. [Google Scholar] [CrossRef]
- Jiang, Y.; Li, R.; Chen, Y. Elemental analysis of copper alloys with laser-Ablation spark-induced breakdown spectroscopy based on a fiber laser operated at 30 kHz pulse repetition rate. J. Anal. At. Spectrom. 2019, 34, 1838–1845. [Google Scholar] [CrossRef]
- Mal, E.; Junjuri, R.; Gundawar, M.K.; Khare, A. Optimization of temporal window for application of calibration free-laser induced breakdown spectroscopy (CF-LIBS) on copper alloys in air employing a single line. J. Anal. At. Spectrom. 2019, 34, 319–330. [Google Scholar] [CrossRef]
- Tang, Z.; Zhou, R.; Hao, Z.; Ma, S.; Zhang, W.; Liu, K.; Li, X.; Zeng, X.; Lu, Y. Micro-destructive analysis with high sensitivity using double-pulse resonant laser-induced breakdown spectroscopy. J. Anal. At. Spectrom. 2019, 34, 1198–1204. [Google Scholar] [CrossRef]
- Zhao, S.; Zhang, L.; Hou, J.; Zhao, Y.; Yin, W.; Ma, W.; Dong, L.; Xiao, L.; Jia, S. Accurate quantitative CF-LIBS analysis of both major and minor elements in alloys via iterative correction of plasma temperature and spectral intensity. Plasma Sci. Technol. 2018, 20, 035502. [Google Scholar] [CrossRef] [Green Version]
- Guarnaccio, A.; Parisi, G.P.; Mollica, D.; De Bonis, A.; Teghil, R.; Santagata, A. Fs-ns double-pulse laser induced breakdown spectroscopy of copper-based-alloys: Generation and elemental analysis of nanoparticles. Spectrochim. Acta Part B 2014, 101, 261–268. [Google Scholar] [CrossRef]
- De Giacomo, A.; Dell’Aglio, M.; De Pascale, O.; Gaudiuso, R.; Santagata, A.; Teghil, R. Laser induced breakdown spectroscopy methodology for the analysis of copper-based-alloys used in ancient artworks. Spectrochim. Acta Part B 2008, 63, 585–590. [Google Scholar] [CrossRef]
- Imashuku, S.; Taguchi, H.; Fujieda, S.; Suzuki, S.; Wagatsuma, K. Three-dimensional lithium mapping of graphite anode using laser-induced breakdown spectroscopy. Electrochim. Acta 2019, 293, 78–83. [Google Scholar] [CrossRef]
- Cheng, L.; Hou, H.; Lux, S.; Kostecki, R.; Davis, R.; Zorba, V.; Mehta, A.; Doeff, M. Enhanced lithium ion transport in garnet-type solid state electrolytes. J. Electroceram. 2017, 38, 168–175. [Google Scholar] [CrossRef] [Green Version]
- Wang, Y.; Yu, J.; Wu, J.; Wang, Z. Rapid analysis of platinum and nafion loadings using laser induced breakdown spectroscopy. J. Electrochem. Soc. 2017, 164, F1294–F1300. [Google Scholar] [CrossRef]
- Smyrek, P.; Pröll, J.; Seifert, H.J.; Pfleging, W. Laser-induced breakdown spectroscopy of laser-structured Li(NiMnCo)O2 electrodes for lithium-ion batteries. J. Electrochem. Soc. 2016, 163, A19–A26. [Google Scholar] [CrossRef]
- Hou, H.; Cheng, L.; Richardson, T.; Chen, G.; Doeff, M.; Zheng, R.; Russo, R.; Zorba, V. Three-dimensional elemental imaging of Li-ion solid-state electrolytes using fs-laser induced breakdown spectroscopy (LIBS). J. Anal. At. Spectrom. 2015, 30, 2295–2302. [Google Scholar] [CrossRef]
- Peng, L.; Sun, D.; Su, M.; Han, J.; Dong, C. Rapid analysis on the heavy metal content of spent zinc-manganese batteries by laser-induced breakdown spectroscopy. Opt. Laser Technol. 2012, 44, 2469–2475. [Google Scholar] [CrossRef]
- Dib, S.R.; Nespeca, M.G.; Santos Junior, D.; Ribeiro, C.A.; Crespi, M.S.; Gomes Neto, J.A.; Ferreira, E.C. CN diatomic emission for N determination by LIBS. Microchem. J. 2020, 157, 105107. [Google Scholar] [CrossRef]
- Nicolodelli, G.; Cabral, J.; Menegatti, C.R.; Marangoni, B.; Senesi, G.S. Recent advances and future trends in LIBS applications to agricultural materials and their food derivatives: An overview of developments in the last decade (2010–2019). Part I. Soils and fertilizers. TrAC Trends Anal. Chem. 2019, 115, 70–82. [Google Scholar] [CrossRef]
- de Morais, C.P.; Barros, A.I.; Bechlin, M.A.; Silva, T.V.; Júnior, D.S.; Senesi, G.S.; Crespi, M.S.; Ribeiro, C.A.; Gomes Neto, J.A.; Ferreira, E.C. Laser-induced breakdown spectroscopy determination of K in biochar-based fertilizers in the presence of easily ionizable element. Talanta 2018, 188, 199–202. [Google Scholar] [CrossRef] [Green Version]
- Jull, H.; Künnemeyer, R.; Schaare, P. Nutrient quantification in fresh and dried mixtures of ryegrass and clover leaves using laser-induced breakdown spectroscopy. Precis. Agric. 2018, 19, 823–839. [Google Scholar] [CrossRef]
- Liao, S.-Y.; Wu, X.-L.; Li, G.-H.; Wei, M.; Zhang, M. Quantitative Analysis of P in fertilizer by laser-induced breakdown spectroscopy with multivariate nonlinear method. Spectrosc. Spectr. Anal. 2018, 38, 271–275. [Google Scholar]
- Sha, W.; Niu, P.; Zhen, C.; Lu, C.; Jiang, Y. Analysis of phosphorus in fertilizer using laser-induced breakdown spectroscopy. J. Appl. Spectrosc. 2018, 85, 653–658. [Google Scholar] [CrossRef]
- Andrade, D.F.; Sperança, M.A.; Pereira-Filho, E.R. Different sample preparation methods for the analysis of suspension fertilizers combining LIBS and liquid-to-solid matrix conversion: Determination of essential and toxic elements. Anal. Methods 2017, 9, 5156–5164. [Google Scholar] [CrossRef]
- Senesi, G.S.; Romano, R.A.; Marangoni, B.S.; Nicolodelli, G.; Villas-Boas, P.R.; Benites, V.M.; Milori, D.M.B.P. Laser-induced breakdown spectroscopy associated with multivariate analysis applied to discriminate fertilizers of different nature. J. Appl. Spectrosc. 2017, 84, 923–928. [Google Scholar] [CrossRef] [Green Version]
- Nunes, L.C.; De Carvalho, G.G.A.; Santos, D., Jr.; Krug, F.J. Determination of Cd, Cr and Pb in phosphate fertilizers by laser-induced breakdown spectroscopy. Spectrochim. Acta Part B 2014, 97, 42–48. [Google Scholar] [CrossRef]
- Lu, W.; Lu, J.; Yao, S.; Chen, K. Synchronization detection of nitrogen phosphorus potassium in compound fertilizer with laser induced breakdown spectroscopy. Chin. J. Lasers 2011, 38, 1008003. [Google Scholar]
- Groisman, Y.; Gaft, M. Online analysis of potassium fertilizers by laser-induced breakdown spectroscopy. Spectrochim. Acta Part B 2010, 65, 744–749. [Google Scholar] [CrossRef]
- Yao, S.; Lu, J.; Li, J.; Chen, K.; Li, J.; Dong, M. Multi-elemental analysis of fertilizer using laser-induced breakdown spectroscopy coupled with partial least squares regression. J. Anal. At. Spectrom. 2010, 25, 1733–1738. [Google Scholar] [CrossRef]
- Hussain, T.; Gondal, M.A.; Yamani, Z.H.; Baig, M.A. Measurement of nutrients in green house soil with laser induced breakdown spectroscopy. Environ. Monit. Assess. 2007, 124, 131–139. [Google Scholar] [CrossRef]
- Akin, P.A.; Sezer, B.; Bean, S.R.; Peiris, K.; Tilley, M.; Apaydin, H.; Boyaci, I.H. Analysis of corn and sorghum flour mixtures using laser-induced breakdown spectroscopy. J. Sci. Food. Agric. 2021, 101, 1076–1084. [Google Scholar] [CrossRef] [PubMed]
- Tian, Y.; Chen, Q.; Lin, Y.; Lu, Y.; Li, Y.; Lin, H. Quantitative determination of phosphorus in seafood using laser-induced breakdown spectroscopy combined with machine learning. Spectrochim. Acta Part B 2021, 175, 106027. [Google Scholar] [CrossRef]
- Costa, V.C.; Amorim, F.A.C.; de Babos, D.V.; Pereira-Filho, E.R. Direct determination of Ca, K, Mg, Na, P, S, Fe and Zn in bivalve mollusks by wavelength dispersive X-ray fluorescence (WDXRF) and laser-induced breakdown spectroscopy (LIBS). Food Chem. 2019, 273, 91–98. [Google Scholar] [CrossRef] [PubMed]
- Yang, P.; Zhou, R.; Zhang, W.; Yi, R.; Tang, S.; Guo, L.; Hao, Z.; Li, X.; Lu, Y.; Zeng, X. High-sensitivity determination of cadmium and lead in rice using laser-induced breakdown spectroscopy. Food Chem. 2019, 272, 323–328. [Google Scholar] [CrossRef]
- Alfarraj, B.A.; Sanghapi, H.K.; Bhatt, C.R.; Yueh, F.Y.; Singh, J.P. Qualitative analysis of dairy and powder milk using laser-induced breakdown spectroscopy (LIBS). Appl. Spectrosc. 2018, 72, 89–101. [Google Scholar] [CrossRef] [PubMed]
- Atta, B.M.; Saleem, M.; Haq, S.U.; Ali, H.; Ali, Z.; Qamar, M. Determination of zinc and iron in wheat using laser-induced breakdown spectroscopy. Laser Phys. Lett. 2018, 15, 125603. [Google Scholar] [CrossRef]
- Chen, C.-T.; Banaru, D.; Sarnet, T.; Hermann, J. Two-step procedure for trace element analysis in food via calibration-free laser-induced breakdown spectroscopy. Spectrochim. Acta Part B 2018, 150, 77–85. [Google Scholar] [CrossRef] [Green Version]
- Sezer, B.; Bilge, G.; Boyaci, I.H. Capabilities and limitations of LIBS in food analysis. TrAC Trends Anal. Chem. 2017, 97, 345–353. [Google Scholar] [CrossRef]
- Peng, J.; Liu, F.; Zhou, F.; Song, K.; Zhang, C.; Ye, L.; He, Y. Challenging applications for multi-element analysis by laser-induced breakdown spectroscopy in agriculture: A review. TrAC Trends Anal. Chem. 2016, 85, 260–272. [Google Scholar] [CrossRef]
- Barnett, C.; Bell, C.; Vig, K.; Akpovo, A.C.; Johnson, L.; Pillai, S.; Singh, S. Development of a LIBS assay for the detection of salmonella enterica serovar typhimurium from food. Anal. Bioanal. Chem. 2011, 400, 3323–3330. [Google Scholar] [CrossRef]
- Lei, W.Q.; El Haddad, J.; Motto-Ros, V.; Gilon-Delepine, N.; Stankova, A.; Ma, Q.L.; Bai, X.S.; Zheng, L.J.; Zeng, H.P.; Yu, J. Comparative measurements of mineral elements in milk powders with laser-induced breakdown spectroscopy and inductively coupled plasma atomic emission spectroscopy. Anal. Bioanal. Chem. 2011, 400, 3303–3313. [Google Scholar] [CrossRef] [PubMed]
- Augusto, A.S.; Castro, J.P.; Sperança, M.A.; Pereira-Filho, E.R. Combination of multi-energy calibration (MEC) and laser-induced breakdown spectroscopy (LIBS) for dietary supplements analysis and determination of Ca, Mg and K. J. Braz. Chem. Soc. 2019, 30, 804–812. [Google Scholar] [CrossRef]
- dos Santos Augusto, A.; Barsanelli, P.L.; Pereira, F.M.V.; Pereira-Filho, E.R. Calibration strategies for the direct determination of Ca, K, and Mg in commercial samples of powdered milk and solid dietary supplements using laser-induced breakdown spectroscopy (LIBS). Food Res. Int. 2017, 94, 72–78. [Google Scholar] [CrossRef] [Green Version]
- Agrawal, R.; Kumar, R.; Rai, S.; Pathak, A.K.; Rai, A.K.; Rai, G.K. LIBS: A quality control tool for food supplements. Food Biophys. 2011, 6, 527–533. [Google Scholar] [CrossRef]
- Parigger, C.G. Review of spatiotemporal analysis of laser-induced plasma in gases. Spectrochim. Acta Part B 2021, 179, 106122. [Google Scholar] [CrossRef]
- Chan, G.C.-Y.; Martin, L.R.; Trowbridge, L.D.; Zhu, Z.; Mao, X.; Russo, R.E. Analytical characterization of laser induced plasmas towards uranium isotopic analysis in gaseous uranium hexafluoride. Spectrochim. Acta Part B 2021, 176, 106036. [Google Scholar] [CrossRef]
- McGann, B.; Ombrello, T.M.; Peterson, D.M.; Hassan, E.; Hammack, S.D.; Carter, C.D.; Lee, T.; Do, H. Lean fuel detection with nanosecond-gated laser-induced breakdown spectroscopy. Combust. Flame 2021, 224, 209–218. [Google Scholar] [CrossRef]
- Yang, G.; Liu, L.; Wang, T.; Fan, L.; Huang, X.; Tian, D.; Jiang, L.; Silvain, J.-F.; Lu, Y. Laser-induced breakdown spectroscopy of ammonia gas with resonant vibrational excitation. Opt. Express 2020, 28, 1197–1205. [Google Scholar] [CrossRef] [PubMed]
- Zhang, Z.; Li, T.; Xue, X.; Huang, S. Simultaneous measurements of fuel concentration and temperature in gas jets by laser induced breakdown spectroscopy. Spectrochim. Acta Part B 2019, 161, 105706. [Google Scholar] [CrossRef]
- Deguchi, Y.; Kamimoto, T.; Wang, Z.Z.; Yan, J.J.; Liu, J.P.; Watanabe, H.; Kurose, R. Applications of laser diagnostics to thermal power plants and engines. Appl. Therm. Eng. 2014, 73, 1453–1464. [Google Scholar] [CrossRef]
- Eseller, K.; Yueh, F.; Singh, J.; Melikechi, N. Helium detection in gas mixtures by LIBS. Appl. Opt. 2012, 51, B171–B175. [Google Scholar] [CrossRef]
- Sturm, V.; Brysch, A.; Noll, R. Online multielement analysis of the top gas of a blast furnace by laser-induced breakdown spectroscopy (LIBS). Berg. Huettenmaenn. Monatsh. 2007, 152, 28–32. [Google Scholar] [CrossRef]
- D’Ulivo, A.; Onor, M.; Pitzalis, E.; Spiniello, R.; Lampugnani, L.; Cristoforetti, G.; Legnaioli, S.; Palleschi, V.; Salvetti, A.; Tognoni, E. Determination of the deuterium/hydrogen ratio in gas reaction products by laser-induced breakdown spectroscopy. Spectrochim. Acta Part B 2006, 61, 797–802. [Google Scholar] [CrossRef]
- Ferioli, F.; Puzinauskas, P.V.; Buckley, S.G. Laser-induced breakdown spectroscopy for on-line engine equivalence ratio measurements. Appl. Spectrosc. 2003, 57, 1183–1189. [Google Scholar] [CrossRef]
- Haisch, C.; Niessner, R.; Matveev, O.I.; Panne, U.; Omenetto, N. Element-specific determination of chlorine in gases by Laser-Induced-Breakdown-Spectroscopy (LIBS). Fresenius’ J. Anal. Chem. 1996, 356, 21–26. [Google Scholar] [CrossRef] [PubMed]
- Corzo, R.; Hoffman, T.; Ernst, T.; Trejos, T.; Berman, T.; Coulson, S.; Weis, P.; Stryjnik, A.; Dorn, H.; Pollock, E.; et al. An interlaboratory study evaluating the interpretation of forensic glass evidence using refractive index measurements and elemental composition. Forensic Chem. 2021, 22, 100307. [Google Scholar] [CrossRef]
- Gerhard, C.; Taleb, A.; Pelascini, F.; Hermann, J. Quantification of surface contamination on optical glass via sensitivity-improved calibration-free laser-induced breakdown spectroscopy. Appl. Surf. Sci. 2021, 537, 147984. [Google Scholar] [CrossRef]
- Devangad, P.; Unnikrishnan, V.K.; Yogesha, M.; Kulkarni, S.D.; Chidangil, S. Plasma spectroscopy + chemometrics: An ideal approach for the spectrochemical analysis of iron phosphate glass samples. J. Chemom. 2020, 34, e3310. [Google Scholar] [CrossRef]
- Teklemariam, T.A.; Gotera, J. Application of laser induced breakdown spectroscopy in food container glass discrimination. Spectrochim. Acta Part B 2019, 155, 34–43. [Google Scholar] [CrossRef]
- Skruibis, J.; Balachninaite, O.; Butkus, S.; Vaicaitis, V.; Sirutkaitis, V. Multiple-pulse Laser-induced breakdown spectroscopy for monitoring the femtosecond laser micromachining process of glass. Opt. Laser Technol. 2019, 111, 295–302. [Google Scholar] [CrossRef]
- Chappell, J.; Martinez, M.; Baudelet, M. Statistical evaluation of spectral interferences in laser-induced breakdown spectroscopy. Spectrochim. Acta Part B 2018, 149, 167–175. [Google Scholar] [CrossRef]
- Ewusi-Annan, E.; Surmick, D.M.; Melikechi, N.; Wiens, R.C. Simulated laser-induced breakdown spectra of graphite and synthetic shergottite glass under martian conditions. Spectrochim. Acta Part B 2018, 148, 31–43. [Google Scholar] [CrossRef]
- Motto-Ros, V.; Syvilay, D.; Bassel, L.; Negre, E.; Trichard, F.; Pelascini, F.; El Haddad, J.; Harhira, A.; Moncayo, S.; Picard, J.; et al. Critical aspects of data analysis for quantification in laser-induced breakdown spectroscopy. Spectrochim. Acta Part B 2018, 140, 54–64. [Google Scholar] [CrossRef]
- Sánchez-Aké, C.; García-Fernández, T.; Benítez, J.L.; de la Mora, M.B.; Villagrán-Muniz, M. Intensity enhancement of LIBS of glass by using Au thin films and nanoparticles. Spectrochim. Acta Part B 2018, 146, 77–83. [Google Scholar] [CrossRef]
- Devangad, P.; Unnikrishnan, V.K.; Tamboli, M.M.; Shameem, K.M.M.; Nayak, R.; Choudhari, K.S.; Santhosh, C. Quantification of Mn in glass matrices using laser induced breakdown spectroscopy (LIBS) combined with chemometric approaches. Anal. Methods 2016, 8, 7177–7184. [Google Scholar] [CrossRef]
- Klus, J.; Pořízka, P.; Prochazka, D.; Novotný, J.; Novotný, K.; Kaiser, J. Effect of experimental parameters and resulting analytical signal statistics in laser-induced breakdown spectroscopy. Spectrochim. Acta Part B 2016, 126, 6–10. [Google Scholar] [CrossRef]
- Bridge, C.M.; Powell, J.; Steele, K.L.; Williams, M.; MacInnis, J.M.; Sigman, M.E. Characterization of automobile float glass with laser-induced breakdown spectroscopy and laser ablation inductively coupled plasma mass spectrometry. Appl. Spectrosc. 2006, 60, 1181–1187. [Google Scholar] [CrossRef] [PubMed]
- Matiaske, A.-M.; Gornushkin, I.B.; Panne, U. Double-pulse laser-induced breakdown spectroscopy for analysis of molten glass. Anal. Bioanal. Chem. 2012, 402, 2597–2606. [Google Scholar] [CrossRef]
- Craparo, J.C.; Weisberg, A.; De Saro, R. Measurements of batch and cullet using laser induced breakdown spectroscopy. Ceram. Eng. Sci. Proc. 2006, 27, 105–118. [Google Scholar] [CrossRef]
- Yun, J.-I.; Klenze, R.; Kim, R. Laser-induced breakdown spectroscopy for the on-line multielement analysis of highly radioactive glass melt simulants. Part II: Analyses of molten glass samples. Appl. Spectrosc. 2002, 56, 852–858. [Google Scholar] [CrossRef]
- Dawood, A.; Bashir, S. Characterizing laser induced plasma and ablation of Mg-alloy in the presence and absence of magnetic field. Optik 2018, 170, 353–367. [Google Scholar] [CrossRef]
- Xin, Y.; Sun, L.-X.; Yang, Z.-J.; Zeng, P.; Cong, Z.-B.; Qi, L.-F. In situ analysis of magnesium alloy using a standoff and double-pulse laser-induced breakdown spectroscopy system. Front. Phys. 2016, 11, 115207. [Google Scholar] [CrossRef]
- Qi, L.; Sun, L.; Xin, Y.; Cong, Z.; Li, Y.; Yu, H. Application of stand-off double-pulse laser-induced breakdown spectroscopy in elemental analysis of magnesium alloy. Plasma Sci. Technol. 2015, 17, 676–681. [Google Scholar] [CrossRef]
- Latkoczy, C.; Ghislain, T. Simultaneous LIBS and LA-ICP-MS analysis of industrial samples. J. Anal. At. Spectrom. 2006, 21, 1152–1160. [Google Scholar] [CrossRef]
- Gesing, A.; Torek, P.; Dalton, R.; Wolanski, R. Assuring recyclability of automotive magnesium alloys: Chemical composition-based sorting of magnesium shredded scrap. TMS Annu. Meet. 2003, 15–23. [Google Scholar]
- Gudmundsson, S.H.; Matthiasson, J.; Björnsson, B.M.; Gudmundsson, H.; Leosson, K. Quantitative in-situ analysis of impurity elements in primary aluminum processing using laser-induced breakdown spectroscopy. Spectrochim. Acta Part B 2019, 158, 105646. [Google Scholar] [CrossRef]
- Xin, Y.; Li, Y.; Cai, Z.-R.; Yang, M.; Yang, Z.-J.; Sun, L.-X. On-line monitoring of elemental composition in molten aluminum by laser-induced breakdown spectroscopy online analyzer for liquid metal composition. Metall. Anal. 2019, 39, 15–20. [Google Scholar]
- Hudson, S.W.; Craparo, J.; Desaro, R.; Apelian, D. Inclusion detection in aluminum alloys via laser-induced breakdown spectroscopy. Metall. Mater. Trans. B 2018, 49, 658–665. [Google Scholar] [CrossRef]
- Rai, A.K.; Yueh, F.-Y.; Singh, J.P. Laser-induced breakdown spectroscopy of molten aluminum alloy. Appl. Opt. 2003, 42, 2078–2084. [Google Scholar] [CrossRef]
- Paksy, L.; Nemet, B.; Lengyel, A.; Kozma, L. Production control of metal alloys by laser spectroscopy of the molten metals. Part I. Preliminary investigations. Spectrochim. Acta Part B 1996, 51, 279–290. [Google Scholar] [CrossRef]
- Maury, C.; Sirven, J.-B.; Tabarant, M.; L’Hermite, D.; Courouau, J.-L.; Gallou, C.; Caron, N.; Moutiers, G.; Cabuil, V. Analysis of liquid sodium purity by laser-induced breakdown spectroscopy. Modeling and correction of signal fluctuation prior to quantitation of trace elements. Spectrochim. Acta Part B 2013, 82, 28–35. [Google Scholar] [CrossRef]
- Cui, M.; Deguchi, Y.; Yao, C.; Wang, Z.; Tanaka, S.; Zhang, D. Carbon detection in solid and liquid steel samples using ultraviolet long-short double pulse laser-induced breakdown spectroscopy. Spectrochim. Acta Part B 2020, 167, 105839. [Google Scholar] [CrossRef]
- Lednev, V.N.; Grishin, M.Y.; Sdvizhenskii, P.A.; Asyutin, R.D.; Tretyakov, R.S.; Stavertiy, A.Y.; Pershin, S.M. Sample temperature effect on laser ablation and analytical capabilities of laser induced breakdown spectroscopy. J. Anal. At. Spectrom. 2019, 34, 607–615. [Google Scholar] [CrossRef]
- Zhao, T.; Fan, Z.; Lian, F.; Liu, Y.; Lin, W.; Mo, Z.; Nie, S.; Wang, P.; Xiao, H.; Li, X.; et al. Using laser-induced breakdown spectroscopy on vacuum alloys-production process for elements concentration analysis. Spectrochim. Acta Part B 2017, 137, 64–69. [Google Scholar] [CrossRef]
- Sun, L.; Yu, H.; Cong, Z.; Xin, Y.; Li, Y.; Qi, L. In situ analysis of steel melt by double-pulse laser-induced breakdown spectroscopy with a cassegrain telescope. Spectrochim. Acta Part B 2015, 112, 40–48. [Google Scholar] [CrossRef]
- Tusset, V. Future of the online control of molten metal. Metall. Anal. 2013, 33, 13–20. [Google Scholar]
- Mathy, G.; Monfort, G.; Vanderheyden, B.; Tusset, V. Measurement of composition and temperature in blast furnace runners by using laser induced breakdown spectroscopy. Metall. Anal. 2011, 31, 21–23. [Google Scholar]
- Gruber, J.; Heitz, J.; Arnold, N.; Bäuerle, D.; Ramaseder, N.; Meyer, W.; Hochörtler, J.; Koch, F. In situ analysis of metal melts in metallurgic vacuum devices by laser-induced breakdown spectroscopy. Appl. Spectrosc. 2004, 58, 457–462. [Google Scholar] [CrossRef]
- Peter, L.; Sturm, V.; Noll, R. Liquid steel analysis with laser-induced breakdown spectrometry in the vacuum ultraviolet. Appl. Opt. 2003, 42, 6199–6204. [Google Scholar] [CrossRef] [PubMed] [Green Version]
- Aragón, C.; Aguilera, J.A.; Campos, J. Determination of carbon content in molten steel using laser-induced breakdown spectroscopy. Appl. Spectrosc. 1993, 47, 606–608. [Google Scholar] [CrossRef]
- Carlhoff, C.; Kirchhoff, S. Laser-induced emission spectroscopy for on-line analysis of molten metal in a steel converter. Laser Und Optoelektron. 1991, 23, 50–52. [Google Scholar]
- Tecnar. Available online: https://www.tecnar.com/online-chemistry-analyser/ (accessed on 12 February 2021).
- Sabsabi, M.; St-Onge, L.; Detalle, V.; Lucas, J.M. Laser-Induced Breakdown Spectroscopy: A New Tool for Process Control. In Proceedings of the 16th World Conference on Non Destructive Testing, H2Z 1H2, Montreal, QC, Canada, August 30 – September 3 2004; Available online: http://www.ndt.net/article/wcndt2004/pdf/in-process_ndt-nde/679_sabsabi.pdf (accessed on 14 July 2021).
- Guo, M.-T.; Sun, L.-X.; Dong, W.; Wang, J.-C.; Cong, Z.-B.; Zheng, L.-M. Classification and identification of scrap metals based on laser-induced breakdown spectroscopy. Metall. Anal. 2020, 40, 72–78. [Google Scholar] [CrossRef]
- Shin, S.; Moon, Y.; Lee, J.; Kwon, E.; Park, K.; Jeong, S. Improvement in classification accuracy of stainless steel alloys by laser-induced breakdown spectroscopy based on elemental intensity ratio analysis. Plasma Sci. Technol. 2020, 22, 074011. [Google Scholar] [CrossRef]
- Noll, R.; Fricke-Begemann, C.; Connemann, S.; Meinhardt, C.; Sturm, V. LIBS analyses for industrial applications-an overview of developments from 2014 to 2018. J. Anal. At. Spectrom. 2018, 33, 945–956. [Google Scholar] [CrossRef] [Green Version]
- Bauer, A.J.R.; Laska, C. LIBS for Automated Aluminum Scrap Sorting. Application Note LIBS-028 (US), 2018. 2018. Available online: www.tsi.com (accessed on 25 June 2021).
- Bohling, C.; Feierabend, A.; Günther, J.-U.; John, A.; Singer, A.; Cordts, L. Operation of LIBS elemental analysers for inline analysis of aluminium scrap and industrial products. In Proceedings of the 9th European Metallurgical Conference (EMC 2017), Leipzig, Germany, 25–28 June 2017; Volume 4, pp. 1819–1830. [Google Scholar]
- Grifoni, E.; Legnaioli, S.; Lorenzetti, G.; Pagnotta, S.; Palleschi, V. Applying LIBS to metals processing. Spectroscopy 2015, 30, 20–31. Available online: https://www.spectroscopyonline.com/view/applying-libs-metals-processing (accessed on 28 January 2019).
- Kashiwakura, S.; Wagatsuma, K. Rapid sorting of stainless steels by open-air laser-induced breakdown spectroscopy with detecting chromium, nickel, and molybdenum. ISIJ Int. 2015, 55, 2391–2396. [Google Scholar] [CrossRef] [Green Version]
- Merk, S.; Scholz, C.; Florek, S.; Mory, D. Increased identification rate of scrap metal using laser induced breakdown spectroscopy echelle spectra. Spectrochim. Acta Part B 2015, 112, 10–15. [Google Scholar] [CrossRef]
- Noharet, B.; Sterner, C.; Irebo, T.; Gurell, J.; Bengtson, A.; Vainik, R.; Karlsson, H.; Illy, E. A compact LIBS system for industrial applications. SPIE-Int. Soc. Opt. Eng. Proc. 2015, 9369, 936904. [Google Scholar] [CrossRef]
- Gurell, J.; Bengtson, A.; Falkenström, M.; Hansson, B.A.M. Laser induced breakdown spectroscopy for fast elemental analysis and sorting of metallic scrap pieces using certified reference materials. Spectrochim. Acta Part B 2012, 74–75, 46–50. [Google Scholar] [CrossRef]
- Sturm, V.; Eilers, D.; Werheit, P.; Noll, R.; Chiarotti, U.; Volponi, V.; Moroli, V.; DeMiranda, U.; Zanforlin, M.; Zani, M.; et al. Elemental monitoring of steel scrap loading an electrical arc furnace. In Proceedings of the 8th International Workshop on Progress in Analytical Chemistry & Materials Characterisation in the Steel and Metals Industries, Luxembourg City, Luxembourg, 17–19 May 2011; pp. 55–61. [Google Scholar]
- Cabalín, L.M.; González, A.; Ruiz, J.; Laserna, J.J. Assessment of statistical uncertainty in the quantitative analysis of solid samples in motion using laser-induced breakdown spectroscopy. Spectrochim. Acta Part B 2010, 65, 680–687. [Google Scholar] [CrossRef]
- Vieitez, M.O.; Hedberg, J.; Launila, O.; Berg, L.-E. Elemental analysis of steel scrap metals and minerals by laser-induced breakdown spectroscopy. Spectrochim. Acta Part B 2005, 60, 920–925. [Google Scholar] [CrossRef]
- Lawley, C.J.M.; Somers, A.M.; Kjarsgaard, B.A. Rapid geochemical imaging of rocks and minerals with handheld laser induced breakdown spectroscopy (LIBS). J. Geochem. Explor. 2021, 222, 106694. [Google Scholar] [CrossRef]
- Müller, S.; Meima, J.A.; Rammlmair, D. Detecting REE-rich areas in heterogeneous drill cores from storkwitz using LIBS and a combination of k-means clustering and spatial raster analysis. J. Geochem. Explor. 2021, 221, 106697. [Google Scholar] [CrossRef]
- Wiens, R.C.; Maurice, S.; Robinson, S.H.; Nelson, A.E.; ·Cais, P.; ·Bernardi, P.; Newell, R.T.; ·Clegg, S.; Sharma, S.K.; ·Storms, S.; et al. The supercam instrument suite on the NASA mars 2020 rover: Body unit and combined system tests. Space Sci. Rev. 2021, 217, 4. [Google Scholar] [CrossRef]
- Fabre, C. Advances in laser-induced breakdown spectroscopy analysis for geology: A critical review. Spectrochim. Acta Part B 2020, 166, 105799. [Google Scholar] [CrossRef]
- Harmon, R.S.; Lawley, C.J.M.; Watts, J.; Harraden, C.L.; Somers, A.M.; Hark, R.R. Laser-induced breakdown spectroscopy—An emerging analytical tool for mineral exploration. Minerals 2019, 9, 718. [Google Scholar] [CrossRef] [Green Version]
- Díaz, D.; Molina, A.; Hahn, D. Effect of laser irradiance and wavelength on the analysis of gold- and silver-bearing minerals with laser-induced breakdown spectroscopy. Spectrochim. Acta Part B 2018, 145, 86–95. [Google Scholar] [CrossRef]
- Fabre, C.; Devismes, D.; Moncayo, S.; Pelascini, F.; Trichard, F.; Lecomte, A.; Bousquet, B.; Cauzid, J.; Motto-Ros, V. Elemental imaging by laser-induced breakdown spectroscopy for the geological characterization of minerals. J. Anal. At. Spectrom. 2018, 33, 1345–1353. [Google Scholar] [CrossRef]
- McMillan, N.J.; Curry, A.J.; Dutrow, B.L.; Henry, D.J. Identification of the host lithology of tourmaline using laser-induced breakdown spectroscopy for application in sediment provenance and mineral exploration. Can. Mineral. 2018, 56, 393–410. [Google Scholar] [CrossRef]
- Rifai, K.; Laflamme, M.; Constantin, M.; Vidal, F.; Sabsabi, M.; Blouin, A.; Bouchard, P.; Fytas, K.; Castello, M.; Kamwa, B.N. Analysis of gold in rock samples using laser-induced breakdown spectroscopy: Matrix and heterogeneity effects. Spectrochim. Acta Part B 2017, 134, 33–41. [Google Scholar] [CrossRef]
- Yang, G.; Han, X.; Wang, C.; Ding, Y.; Liu, K.; Tian, D.; Yao, L. The basicity analysis of sintered ore using laser-induced breakdown spectroscopy (LIBS) combined with random forest regression (RFR). Anal. Methods 2017, 9, 5365–5370. [Google Scholar] [CrossRef]
- Kuhn, K.; Meima, J.A.; Rammlmair, D.; Ohlendorf, C. Chemical mapping of mine waste drill cores with laser-induced breakdown spectroscopy (LIBS) and energy dispersive X-ray fluorescence (EDXRF) for mineral resource exploration. J. Geochem. Explor. 2015, 161, 72–84. [Google Scholar] [CrossRef]
- Senesi, G.S. Laser-Induced Breakdown Spectroscopy (LIBS) applied to terrestrial and extraterrestrial analogue geomaterials with emphasis to minerals and rocks. Earth-Sci. Rev. 2014, 139, 231–267. [Google Scholar] [CrossRef]
- Gaft, M.; Nagli, L.; Gornushkin, I.; Groisman, Y. Doubly ionized ion emission in laser-induced breakdown spectroscopy in air. Anal. Bioanal. Chem. 2011, 400, 3229–3237. [Google Scholar] [CrossRef] [PubMed]
- Fricke-Begemann, C.; Noll, R.; Wotruba, H.; Schmitz, C. Laser-based material analysis for sorting of minerals. In Applications of Sensor-Based Sorting in the Raw Material Industry; Schriftenreihe zur Aufbereitung und Veredlung, Pretz, T., Quicker, P., Wotruba, H., Eds.; Shaker: Aachen, Germany, 2011; Volume 42, pp. 65–70. ISBN1 978-3-8440-0585-1. Available online: https://www.shaker.eu/en/index.asp?lang=en (accessed on 18 June 2017)ISBN2 978-3-8440-0585-1.
- Gaft, M.; Sapir-Sofer, I.; Modiano, H.; Stana, R. Laser induced breakdown spectroscopy for bulk minerals online analyses. Spectrochim. Acta Part B 2007, 62, 1496–1503. [Google Scholar] [CrossRef]
- McMillan, N.J.; Harmon, R.S.; De Lucia, F.C.; Miziolek, A.M. Laser-induced breakdown spectroscopy analysis of minerals: Carbonates and silicates. Spectrochim. Acta Part B 2007, 62, 1528–1536. [Google Scholar] [CrossRef]
- Rosenwasser, S.; Asimellis, G.; Bromley, B.; Hazlett, R.; Martin, J.; Pearce, T.; Zigler, A. Development of a method for automated quantitative analysis of ores using LIBS. Spectrochim. Acta Part B 2001, 56, 707–714. [Google Scholar] [CrossRef]
- Payré, V.; Siebach, K.L.; Dasgupta, R.; Udry, A.; Rampe, E.B.; Morrison, S.M. Constraining ancient magmatic evolution on mars using crystal chemistry of detrital igneous minerals in the sedimentary bradbury group, gale crater, mars. J. Geophys. Res.: Planets 2020, 125, e2020JE006467. [Google Scholar] [CrossRef]
- Laville, S.; Sabsabi, M.; Doucet, F.R. Multi-elemental analysis of solidified mineral melt samples by laser-induced breakdown spectroscopy coupled with a linear multivariate calibration. Spectrochim. Acta Part B 2007, 62, 1557–1566. [Google Scholar] [CrossRef] [Green Version]
- Abdul Kalam, S.; Balaji Manasa Rao, S.V.; Jayananda, M.; Venugopal Rao, S. Standoff femtosecond filament-induced breakdown spectroscopy for classification of geological materials. J. Anal. At. Spectrom. 2020, 35, 3007–3020. [Google Scholar] [CrossRef]
- Fahad, M.; Ali, S.; Iqbal, Y. Plasma diagnostics by optical emission spectroscopy on manganese ore in conjunction with XRD, XRF and SEM-EDS. Plasma Sci. Technol. 2019, 21, 08550. [Google Scholar] [CrossRef]
- Bhatt, C.R.; Jain, J.C.; Goueguel, C.L.; McIntyre, D.L.; Singh, J.P. Determination of rare earth elements in geological samples using laser-induced breakdown spectroscopy (LIBS). Appl. Spectrosc. 2018, 72, 114–121. [Google Scholar] [CrossRef] [PubMed]
- Khajehzadeh, N.; Haavisto, O.; Koresaar, L. On-stream mineral identification of tailing slurries of an iron ore concentrator using data fusion of LIBS, reflectance spectroscopy and XRF measurement techniques. Miner. Eng. 2017, 113, 83–94. [Google Scholar] [CrossRef]
- Romppanen, S.; Häkkänen, H.; Kaski, S. Singular value decomposition approach to the yttrium occurrence in mineral maps of rare earth element ores using laser-induced breakdown spectroscopy. Spectrochim. Acta Part B 2017, 134, 69–74. [Google Scholar] [CrossRef]
- Pořízka, P.; Demidov, A.; Kaiser, J.; Keivanian, J.; Gornushkin, I.; Panne, U.; Riedel, J. Laser-induced breakdown spectroscopy for in situ qualitative and quantitative analysis of mineral ores. Spectrochim. Acta Part B 2014, 101, 155–163. [Google Scholar] [CrossRef]
- Michaud, D.; Leclerc, R.; Proulx, E. Influence of particle size and mineral phase in the analysis of iron ore slurries by laser-induced breakdown spectroscopy. Spectrochim. Acta Part B 2007, 62, 1575–1581. [Google Scholar] [CrossRef]
- Coffey, P.; Smith, N.; Lennox, B.; Kijne, G.; Bowen, B.; Davis-Johnston, A.; Martin, P.A. Robotic arm material characterisation using LIBS and Raman in a nuclear hot cell decommissioning environment. J. Hazard. Mater. 2021, 412, 125193. [Google Scholar] [CrossRef] [PubMed]
- Rollin, E.; Musset, O.; Cardona, D.; Sirven, J.-B. Laser-induced breakdown spectroscopy of uranium in the vacuum ultraviolet range. Spectrochim. Acta Part B 2020, 166, 105796. [Google Scholar] [CrossRef]
- Ararat-Ibarguen, C.E.; Lucia, A.; Corvalan, C.; Di Lalla, N.; Iribarren, M.J.; Rinaldi, C.A.; Pérez, R. Laser induced breakdown spectroscopy application to reaction-diffusion studies in nuclear materials. Spectrochim. Acta Part B 2020, 166, 105798. [Google Scholar] [CrossRef]
- Wu, J.; Qiu, Y.; Li, X.; Yu, H.; Zhang, Z.; Qiu, A. Progress of laser-induced breakdown spectroscopy in nuclear industry applications. J. Phys. D Appl. Phys. 2020, 53, 023001. [Google Scholar] [CrossRef]
- Maurya, G.S.; Marín-Roldán, A.; Veis, P.; Pathak, A.K.; Sen, P. A review of the LIBS analysis for the plasma-facing components diagnostics. J. Nucl. Mater. 2020, 541, 152417. [Google Scholar] [CrossRef]
- Horsfall, J.P.O.; Trivedi, D.; Smith, N.T.; Martin, P.A.; Coffey, P.; Tourniere, S.; Banford, A.; Li, L.; Whitehead, D.; Lang, A.; et al. A new analysis workflow for discrimination of nuclear grade graphite using laser-induced breakdown spectroscopy. J. Environ. Radioact. 2019, 199–200, 45–57. [Google Scholar] [CrossRef] [Green Version]
- Bhatt, B.; Hudson Angeyo, K.; Dehayem-Kamadjeu, A. LIBS development methodology for forensic nuclear materials analysis. Anal. Methods 2018, 10, 791–798. [Google Scholar] [CrossRef]
- Manard, B.T.; Wylie, E.M.; Willson, S.P. Analysis of rare earth elements in uranium using handheld laser-induced breakdown spectroscopy (HH LIBS). Appl. Spectrosc. 2018, 72, 1653–1660. [Google Scholar] [CrossRef]
- Xiaolin, L.; Zhixing, G.; Hongzhi, S. Experimental condition optimization for plutonium oxide surrogate by LIBS. Laser Optoelectron. Prog. 2018, 55, 121408. [Google Scholar] [CrossRef]
- Williams, A.; Phongikaroon, S. Laser-induced breakdown spectroscopy (LIBS) measurement of uranium in molten salt. Appl. Spectrosc. 2018, 72, 1029–1039. [Google Scholar] [CrossRef]
- Choi, D.; Han, B.-Y.; Park, S.H.; Kim, H.-D.; Park, G.-I.; Ku, J.-H. Effect of radiation on the transmission rate of emission intensity of optical fiber cable used in a nuclear material facility. Nucl. Technol. 2017, 197, 320–328. [Google Scholar] [CrossRef]
- Manard, B.T.; Derrick Quarles, C.; Wylie, E.M.; Xu, N. Laser ablation-inductively couple plasma-mass spectrometry/laser induced break down spectroscopy: A tandem technique for uranium particle characterization. J. Anal. At. Spectrom. 2017, 32, 1680–1687. [Google Scholar] [CrossRef]
- Li, C.; Feng, C.-L.; Oderji, H.Y.; Luo, G.-N.; Ding, H.-B. Review of LIBS application in nuclear fusion technology. Front. Phys. 2016, 11, 114214. [Google Scholar] [CrossRef]
- Skrodzki, P.J.; Becker, J.R.; Diwakar, P.K.; Harilal, S.S.; Hassanein, A. A comparative study of single-pulse and double-pulse laser-induced breakdown spectroscopy with uranium-containing samples. Appl. Spectrosc. 2016, 70, 467–473. [Google Scholar] [CrossRef] [PubMed]
- Mauchien, P.; Pailloux, A.; Vercouter, T. Applications of laser spectroscopy in the nuclear research and industry. In Laser Spectroscopy for Sensing: Fundamentals, Techniques and Applications, 1st ed.; Baudelet, M., Ed.; Woodhead: Cambridge, UK, 2014; pp. 522–543. [Google Scholar] [CrossRef]
- Judge, E.J.; Barefield II, J.E.; Berg, J.M.; Clegg, S.M.; Havrilla, G.J.; Montoya, V.M.; Le, L.A.; Lopez, L.N. Laser-induced breakdown spectroscopy measurements of uranium and thorium powders and uranium ore. Spectrochim. Acta Part B 2013, 83–84, 28–36. [Google Scholar] [CrossRef]
- Martin, M.Z.; Allman, S.; Brice, D.J.; Martin, R.C.; Andre, N.O. Exploring laser-induced breakdown spectroscopy for nuclear materials analysis and in-situ applications. Spectrochim. Acta Part B 2012, 74–75, 177–183. [Google Scholar] [CrossRef]
- Chinni, R.C.; Cremers, D.A.; Radziemski, L.J.; Bostian, M.; Navarro-Northrup, C. Detection of uranium using laser-induced breakdown spectroscopy. Appl. Spectrosc. 2009, 63, 1238–1250. [Google Scholar] [CrossRef] [PubMed]
- Whitehouse, A.I. Laser-induced breakdown spectroscopy and its application to the remote characterisation of hazardous materials. Spectrosc. Eur. 2006, 18, 14–21. [Google Scholar] [CrossRef]
- Whitehouse, A.I.; Young, J.; Botheroyd, I.M.; Lawson, S.; Evans, C.P.; Wright, J. Remote material analysis of nuclear power station steam generator tubes by laser-induced breakdown spectroscopy. Spectrochim. Acta Part B 2001, 56, 821–830. [Google Scholar] [CrossRef]
- Vinić, M.; Aruffo, E.; Andreoli, F.; Ivković, M.; Lazic, V. Quantification of heavy metals in oils with μL volume by laser induced breakdown spectroscopy and minimazing of the matrix effect. Spectrochim. Acta Part B 2020, 164, 105765. [Google Scholar] [CrossRef]
- Ding, Y.; Xia, G.; Ji, H.; Xiong, X. Accurate quantitative determination of heavy metals in oily soil by laser induced breakdown spectroscopy (LIBS) combined with interval partial least squares (IPLS). Anal. Methods 2019, 11, 3657–3664. [Google Scholar] [CrossRef]
- Aints, M.; Paris, P.; Laan, M.; Piip, K.; Riisalu, H.; Tufail, I. Determination of heating value of estonian oil shale by laser-induced breakdown spectroscopy. J. Spectrosc. 2018, 2018, 4605925. [Google Scholar] [CrossRef] [Green Version]
- Harhira, A.; El Haddad, J.; Blouin, A.; Sabsabi, M. Rapid determination of bitumen content in athabasca oil sands by laser-induced breakdown spectroscopy. Energy Fuels 2018, 32, 3189–3193. [Google Scholar] [CrossRef] [Green Version]
- Rendón-Sauz, F.G.; Flores-Reyes, T.; Costa, C. Laser induced breakdown spectroscopy (LIBS) for express identification of crude oils. Rev. Cuba. Fis. 2018, 35, 19–23. [Google Scholar]
- Xiu, J.-S.; Liu, Y.-Y.; Dong, L.-L.; Qin, H. The detection of trace wear elements in engine oil using indirect ablation-laser induced breakdown spectroscopy. Spectrosc. Spectr. Anal. 2017, 37, 2885–2890. [Google Scholar]
- Trichard, F.; Forquet, V.; Gilon, N.; Lienemann, C.-P.; Baco-Antoniali, F. Detection and quantification of sulfur in oil products by laser-induced breakdown spectroscopy for on-line analysis. Spectrochim. Acta Part B 2016, 118, 72–80. [Google Scholar] [CrossRef]
- Fichet, P.; Mauchien, P.; Wagner, J.-F.; Moulin, C. Quantitative elemental determination in water and oil by laser induced breakdown spectroscopy. Anal. Chim. Acta 2001, 429, 269–278. [Google Scholar] [CrossRef]
- Hassan, M.; Abdelhamid, M.; Nassef, O.A.; Abdel Harith, M. Spectrochemical analytical follow up of phytoremediation of oil-contaminated soil. Soil Sediment. Contam. 2018, 27, 485–500. [Google Scholar] [CrossRef]
- Rehan, I.; Gondal, M.A.; Rehan, K. Determination of lead content in drilling fueled soil using laser induced spectral analysis and its cross validation using ICP/OES method. Talanta 2018, 182, 443–449. [Google Scholar] [CrossRef]
- Khumaeni, A.; Budi, W.S.; Wardaya, A.Y.; Hedwig, R.; Kurniawan, K.H. Rapid detection of oil pollution in soil by using laser-induced breakdown spectroscopy. Plasma Sci. Technol. 2016, 18, 1186–1191. [Google Scholar] [CrossRef]
- Fortes, F.J.; Ctvrtnícková, T.; Mateo, M.P.; Cabalín, L.M.; Nicolas, G.; Laserna, J.J. Spectrochemical study for the in situ detection of oil spill residues using laser-induced breakdown spectroscopy. Anal. Chim. Acta 2010, 683, 52–57. [Google Scholar] [CrossRef]
- Gondal, M.A.; Hussain, T.; Yamani, Z.H.; Baig, M.A. Detection of heavy metals in Arabian crude oil residue using laser induced breakdown spectroscopy. Talanta 2006, 69, 1072–1078. [Google Scholar] [CrossRef] [PubMed]
- Shakeel, H.; Haq, S.U.; Contreras, V.; Abbas, Q.; Nadeem, A. Analysis of alloy and solar cells with double-pulse calibration-free laser-induced breakdown spectroscopy. Optik 2020, 211, 164627. [Google Scholar] [CrossRef]
- Banerjee, S.P.; Sarnet, T.; Siozos, P.; Loulakis, M.; Anglos, D.; Sentis, M. Characterization of organic photovoltaic devices using femtosecond laser induced breakdown spectroscopy. Appl. Surf. Sci. 2017, 418, 542–547. [Google Scholar] [CrossRef]
- Diego-Vallejo, D.; Ashkenasi, D.; Lemke, A.; Eichler, H.J. Selective ablation of copper-indium-diselenide solar cells monitored by laser-induced breakdown spectroscopy and classification methods. Spectrochim. Acta Part B 2013, 87, 92–99. [Google Scholar] [CrossRef]
- Sarkar, A.; Aggarwal, S.K.; Alamelu, D. Laser induced breakdown spectroscopy for rapid identification of different types of paper for forensic application. Anal. Methods 2010, 2, 32–36. [Google Scholar] [CrossRef]
- Trejos, T.; Flores, A.; Almirall, J.R. Micro-spectrochemical analysis of document paper and gel inks by laser ablation inductively coupled plasma mass spectrometry and laser induced breakdown spectroscopy. Spectrochim. Acta Part B 2010, 65, 884–895. [Google Scholar] [CrossRef]
- Häkkänen, H.; Houni, J.; Kaski, S.; Korppi-Tommola, J.E.I. Analysis of paper by laser-induced plasma spectroscopy. Spectrochim. Acta Part B 2001, 56, 737–742. [Google Scholar] [CrossRef]
- Purohit, P.; Fortes, F.J.; Laserna, J.J. Optical trapping as a morphologically selective tool for in situ LIBS elemental characterization of single nanoparticles generated by laser ablation of bulk targets in air. Anal. Chem. 2021, 93, 2635–2643. [Google Scholar] [CrossRef] [PubMed]
- Niu, C.; Cheng, X.; Zhang, T.; Wang, X.; He, B.; Zhang, W.; Feng, Y.; Bai, J.; Li, H. Novel method based on hollow laser trapping-libs-machine learning for simultaneous quantitative analysis of multiple metal elements in a single microsized particle in air. Anal. Chem. 2021, 93, 2281–2290. [Google Scholar] [CrossRef]
- Ji, H.; Ding, Y.; Zhang, L.; Hu, Y.; Zhong, X. Review of aerosol analysis by laser-induced breakdown spectroscopy. Appl. Spectros. Rev. 2021, 56, 193–220. [Google Scholar] [CrossRef]
- Girón, D.; Delgado, T.; Ruiz, J.; Cabalín, L.M.; Laserna, J.J. In-situ monitoring and characterization of airborne solid particles in the hostile environment of a steel industry using stand-off LIBS. Meas. J. Int. Meas. Confed. 2018, 115, 1–10. [Google Scholar] [CrossRef]
- O’Neil, M.; Niemiec, N.A.; Demko, A.R.; Petersen, E.L.; Kulatilaka, W.D. Laser-induced-breakdown-spectroscopy-based detection of metal particles released into the air during combustion of solid propellants. Appl. Opt. 2018, 57, 1910–1917. [Google Scholar] [CrossRef]
- Redoglio, D.A.; Palazzo, N.; Migliorini, F.; Dondè, R.; De Iuliis, S. Laser-induced breakdown spectroscopy analysis of lead aerosol in nitrogen and air atmosphere. Appl. Spectrosc. 2018, 72, 584–590. [Google Scholar] [CrossRef] [PubMed]
- Boudhib, M.; Hermann, J.; Dutouquet, C. Compositional analysis of aerosols using calibration-free laser-induced breakdown spectroscopy. Anal. Chem. 2016, 88, 4029–4035. [Google Scholar] [CrossRef] [PubMed]
- Xiong, G.; Li, S.; Zhang, Y.; Buckley, S.G.; Tse, S.D. Phase-selective laser-induced breakdown spectroscopy of metal-oxide nanoparticle aerosols with secondary resonant excitation during flame synthesis. J. Anal. At. Spectrom. 2016, 31, 482–491. [Google Scholar] [CrossRef]
- Yoshiie, R.; Yamamoto, Y.; Uemiya, S.; Kambara, S.; Moritomi, H. Simple and rapid analysis of heavy metals in sub-micron particulates in flue gas. Powder Technol. 2008, 180, 135–139. [Google Scholar] [CrossRef]
- Rusak, D.A.; Clara, M.; Austin, E.E.; Visser, K.; Niessner, R.; Smith, B.W.; Winefordner, J.D. Investigation of the effect of target water content on a laser-induced plasma. Appl. Spectrosc. 1997, 51, 1628–1631. [Google Scholar] [CrossRef]
- Oki, H.; Suyanto, H.; Kurniawan, H.; Lie, T.J.; Lee, Y.I.; Sakan, F.; Idris, N.; Kagawa, K. Water analysis by laser-induced shock wave plasma spectroscopy using re-crystallized KBr powder confined in a cylindrical tube. Jpn. J. Appl. Phys. 2004, 43, 1036–1037. [Google Scholar] [CrossRef]
- Liangying, Y.; Jidong, L.; Wen, C.; Ge, W.; Kai, S.; Wei, F. Analysis of pulverized coal by laser-induced breakdown spectroscopy. Plasma Sci. Technol. 2005, 7, 3041–3044. [Google Scholar] [CrossRef]
- Pedarnig, J.D.; Haslinger, M.J.; Bodea, M.A.; Huber, N.; Wolfmeir, H.; Heitz, J. Sensitive detection of chlorine in iron oxide by single pulse and dual pulse laser-induced breakdown spectroscopy. Spectrochim. Acta Part B 2014, 101, 183–190. [Google Scholar] [CrossRef]
- Díaz, D.; Hahn, D.W.; Molina, A. Evaluation of laser-induced breakdown spectroscopy (LIBS) as a measurement technique for evaluation of total elemental concentration in soils. Appl. Spectrosc. 2012, 66, 99–106. [Google Scholar] [CrossRef]
- Asgill, M.E.; Brown, M.S.; Frische, K.; Roquemore, W.M.; Hahn, D.W. Double-pulse and single-pulse laser-induced breakdown spectroscopy for distinguishing between gaseous and particulate phase analytes. Appl. Opt. 2010, 49, C110–C119. [Google Scholar] [CrossRef]
- Strauss, N.; Fricke-Begemann, C.; Noll, R. Size-resolved analysis of fine and ultrafine particulate matter by laser-induced breakdown spectroscopy. J. Anal. At. Spectrom. 2010, 25, 867–874. [Google Scholar] [CrossRef]
- Stehrer, T.; Praher, B.; Viskup, R.; Jasik, J.; Wolfmeir, H.; Arenholz, E.; Heitz, J.; Pedarnig, J.D. Laser-induced breakdown spectroscopy of iron oxide powder. J. Anal. At. Spectrom. 2009, 24, 973–978. [Google Scholar] [CrossRef]
- Viskup, R.; Praher, B.; Stehrer, T.; Jasik, J.; Wolfmeir, H.; Arenholz, E.; Pedarnig, J.D.; Heitz, J. Plasma plume photography and spectroscopy of Fe—Oxide materials. Appl. Surf. Sci. 2009, 255, 5215–5219. [Google Scholar] [CrossRef]
- Lasheras, R.-J.; Paules, D.; Escudero, M.; Anzano, J.; Legnaioli, S.; Pagnotta, S.; Palleschi, V. Quantitative analysis of major components of mineral particulate matter by calibration free laser-induced breakdown spectroscopy. Spectrochim. Acta Part B 2020, 171, 105918. [Google Scholar] [CrossRef]
- Viskup, R.; Wolf, C.; Baumgartner, W. Qualitative and quantitative characterisation of major elements in particulate matter from in-use diesel engine passenger vehicles by LIBS. Energies 2020, 13, 368. [Google Scholar] [CrossRef] [Green Version]
- Viskup, R.; Baumgartner, W. Measurement of the main compounds present in the diesel particulate matter exhaust emissions generated from the real Diesel combustion engine passenger vehicles. SPIE-Int. Soc. Opt. Eng., Proc. 2018, 10680, 1068017. [Google Scholar] [CrossRef]
- Williams, A.; Bryce, K.; Phongikaroon, S. Measurement of cerium and gadolinium in solid lithium chloride–potassium chloride salt using laser-induced breakdown spectroscopy (LIBS). Appl. Spectrosc. 2017, 71, 2302–2312. [Google Scholar] [CrossRef] [PubMed]
- Purohit, P.; Fortes, F.J.; Laserna, J.J. Atomization efficiency and photon yield in laser-induced breakdown spectroscopy analysis of single nanoparticles in an optical trap. Spectrochim. Acta Part B 2017, 130, 75–81. [Google Scholar] [CrossRef]
- Saari, S.; Järvinen, S.; Reponen, T.; Mensah-Attipoe, J.; Pasanen, P.; Toivonen, J.; Keskinen, J. Identification of single microbial particles using electro-dynamic balance assisted laser-induced breakdown and fluorescence spectroscopy. Aerosol Sci. Technol. 2016, 50, 126–132. [Google Scholar] [CrossRef] [Green Version]
- Ahmed, N.; Liaqat, U.; Rafique, M.; Baig, M.A.; Tawfik, W. Detection of toxicity in some oral antidiabetic drugs using LIBS and LA-TOF-MS. Microchem. J. 2020, 155, 104679. [Google Scholar] [CrossRef]
- Smith, J.P.; Zou, L.; Liu, Y.; Bu, X. Investigation of minor elemental species within tablets using in situ depth profiling via laser-induced breakdown spectroscopy hyperspectral imaging. Spectrochim. Acta Part B 2020, 165, 105769. [Google Scholar] [CrossRef]
- Aldakheel, R.K.; Rehman, S.; Almessiere, M.A.; Khan, F.A.; Gondal, M.A.; Mostafa, A.; Baykal, A. Bactericidal and in vitro cytotoxicity of moringa oleifera seed extract and its elemental analysis using laser-induced breakdown spectroscopy. Pharmaceuticals 2020, 13, 193. [Google Scholar] [CrossRef] [PubMed]
- Zou, L.; Stenslik, M.J.; Giles, M.B.; Ormes, J.D.; Marsales, M.; Santos, C.; Kassim, B.; Smith, J.P.; Gonzalez, J.J.; Bu, X. Direct visualization of drug release in injectable implant by laser induced breakdown spectroscopy (LIBS). J. Anal. At. Spectrom. 2019, 34, 1351–1354. [Google Scholar] [CrossRef]
- Nisar, S.; Dastgeer, G.; Shafiq, M.; Usman, M. Qualitative and semi-quantitative analysis of health-care pharmaceutical products using laser-induced breakdown spectroscopy. J. Pharm. Anal. 2019, 9, 20–24. [Google Scholar] [CrossRef]
- Lednev, V.N.; Pershin, S.M.; Sdvizhenskii, P.A.; Grishin, M.Y.; Fedorov, A.N.; Bukin, V.V.; Oshurko, V.B.; Shchegolikhin, A.N. Combining Raman and laser induced breakdown spectroscopy by double pulse lasing. Anal. Bioanal. Chem. 2018, 410, 277–286. [Google Scholar] [CrossRef]
- Tiwari, P.K.; Awasthi, S.; Kumar, R.; Anand, R.K.; Rai, P.K.; Rai, A.K. Rapid analysis of pharmaceutical drugs using LIBS coupled with multivariate analysis. Lasers Med. Sci. 2018, 33, 263–270. [Google Scholar] [CrossRef] [PubMed]
- Zou, L.; Kassim, B.; Smith, J.P.; Ormes, J.D.; Liu, Y.; Tu, Q.; Bu, X. In situ analytical characterization and chemical imaging of tablet coatings using laser induced breakdown spectroscopy (LIBS). Analyst 2018, 143, 5000–5007. [Google Scholar] [CrossRef]
- Yang, C.S.C.; Jin, F.; Swaminathan, S.R.; Patel, S.; Ramer, E.D.; Trivedi, S.B.; Brown, E.E.; Hommerich, U.; Samuels, A.C. Comprehensive study of solid pharmaceutical tablets in visible, near infrared (NIR), and longwave infrared (LWIR) spectral regions using a rapid simultaneous ultraviolet/visible/NIR (UVN) + LWIR laser-induced breakdown spectroscopy linear arrays detection system and a fast acousto-optic tunable filter NIR spectrometer. Opt. Express 2017, 25, 26885–26897. [Google Scholar] [CrossRef] [PubMed]
- de Carvalho, G.G.A.; Nunes, L.C.; de Souza, P.F.; Krug, F.J.; Alegre, T.C.; Santos, D., Jr. Evaluation of laser induced breakdown spectrometry for the determination of macro and micronutrients in pharmaceutical tablets. J. Anal. At. Spectrom. 2010, 25, 803–809. [Google Scholar] [CrossRef]
- Dubey, A.; Keyvan, G.; Hsia, R.; Saranteas, K.; Brone, D.; Misra, T.; Muzzio, F.J. Analysis of pharmaceutical tablet coating uniformity by laser-induced breakdown spectroscopy (LIBS). J. Pharm. Innov. 2011, 6, 77–87. [Google Scholar] [CrossRef]
- St-Onge, L.; Kwong, E.; Sabsabi, M.; Vadas, E.B. Quantitative analysis of pharmaceutical products by laser-induced breakdown spectroscopy. Spectrochim. Acta Part B 2002, 57, 1131–1140. [Google Scholar] [CrossRef]
- Zeng, Q.; Sirven, J.-B.; Gabriel, J.-C.P.; Tay, C.Y.; Lee, J.-M. Laser induced breakdown spectroscopy for plastic analysis. TrAC Trends Anal. Chem. 2021, 140, 116280. [Google Scholar] [CrossRef]
- Chamradová, I.; Pořízka, P.; Kaiser, J. Laser-induced breakdown spectroscopy analysis of polymers in three different atmospheres. Polym. Test. 2021, 96, 107079. [Google Scholar] [CrossRef]
- Costa, V.C.; de Mello, M.L.; Babos, D.V.; Castro, J.P.; Pereira-Filho, E.R. Calibration strategies for determination of Pb content in recycled polypropylene from car batteries using laser-induced breakdown spectroscopy (LIBS). Microchem. J. 2020, 159, 105558. [Google Scholar] [CrossRef]
- Ledesma, R.; Palmieri, F.; Connell, J. Laser induced breakdown spectroscopy of polymer matrix composites for real-time analysis of trace surface contaminants: A review. Int. J. Adhes. Adhes. 2020, 98, 102528. [Google Scholar] [CrossRef]
- Brunnbauer, L.; Mayr, M.; Larisegger, S.; Nelhiebel, M.; Pagnin, L.; Wiesinger, R.; Schreiner, M.; Limbeck, A. Combined LA-ICP-MS/LIBS: Powerful analytical tools for the investigation of polymer alteration after treatment under corrosive conditions. Sci. Rep. 2020, 10, 12513. [Google Scholar] [CrossRef]
- Liu, K.; Tian, D.; Li, C.; Li, Y.; Yang, G.; Ding, Y. A review of laser-induced breakdown spectroscopy for plastic analysis. TrAC Trends Anal. Chem. 2019, 110, 327–334. [Google Scholar] [CrossRef]
- Bonta, M.; Limbeck, A. Metal analysis in polymers using tandem LA-ICP-MS/LIBS: Eliminating matrix effects using multivariate calibration. J. Anal. At. Spectrom. 2018, 33, 1631–1637. [Google Scholar] [CrossRef] [Green Version]
- Guo, Y.; Tang, Y.; Du, Y.; Tang, S.; Guo, L.; Li, X.; Lu, Y.; Zeng, X. Cluster analysis of polymers using laser-induced breakdown spectroscopy with K-means. Plasma Sci. Technol. 2018, 20, 065505. [Google Scholar] [CrossRef] [Green Version]
- Lazic, V.; Filella, M.; Turner, A. Determination of antimony concentrations in widely used plastic objects by laser induced breakdown spectroscopy (LIBS). J. Anal. At. Spectrom. 2018, 33, 1917–1924. [Google Scholar] [CrossRef]
- Ledesma, R.; Palmieri, F.; Connell, J.; Yost, W.; Fitz-Gerald, J. Surface characterization of carbon fiber reinforced polymers by picosecond laser induced breakdown spectroscopy. Spectrochim. Acta Part B 2018, 140, 5–12. [Google Scholar] [CrossRef]
- Tang, Y.; Guo, Y.; Sun, Q.; Tang, S.; Li, J.; Guo, L.; Duan, J. Industrial polymers classification using laser-induced breakdown spectroscopy combined with self-organizing maps and K-means algorithm. Optik 2018, 165, 179–185. [Google Scholar] [CrossRef]
- Negre, E.; Motto-Ros, V.; Pelascini, F.; Yu, J. Classification of plastic materials by imaging laser-induced ablation plumes. Spectrochim. Acta Part B 2016, 122, 132–141. [Google Scholar] [CrossRef]
- Grégoire, S.; Boudinet, M.; Pelascini, F.; Surma, F.; Detalle, V.; Holl, Y. Laser-induced breakdown spectroscopy for polymer identification. Anal. Bioanal. Chem. 2011, 400, 3331–3340. [Google Scholar] [CrossRef]
- Lasheras, R.J.; Bello-Gálvez, C.; Anzano, J. Identification of polymers by libs using methods of correlation and normalized coordinates. Polym. Test. 2010, 29, 1057–1064. [Google Scholar] [CrossRef]
- Khachatrian, A.; Dagdigian, P.J. Laser-induced breakdown spectroscopy with laser irradiation on mid-infrared hydride stretch transitions: Polystyrene. Appl. Phys. B: Lasers Opt. 2009, 97, 243–248. [Google Scholar] [CrossRef]
- Wang, Q.; Jander, P.; Fricke-Begemann, C.; Noll, R. Comparison of 1064 nm and 266 nm excitation of laser-induced plasmas for several types of plastics and one explosive. Spectrochim. Acta Part B 2008, 63, 1011–1015. [Google Scholar] [CrossRef]
- Sattmann, R.; Monch, I.; Krause, H.; Noll, R.; Couris, S.; Hatziapostolou, A.; Mavromanolakis, A.; Fotakis, C.; Larrauri, E.; Miguel, R. Laser-induced breakdown spectroscopy for polymer identification. Appl. Spectrosc. 1998, 52, 456–461. [Google Scholar] [CrossRef]
- Kim, E.; Choi, W.Z. Real-time identification of plastics by types using laser-induced breakdown spectroscopy. J. Mater. Cycles Waste Manag. 2019, 21, 176–180. [Google Scholar] [CrossRef]
- Liang, D.; Du, C.; Ma, F.; Shen, Y.; Wu, K.; Zhou, J. Degradation of polyacrylate in the outdoor agricultural soil measured by FTIR-PAS and LIBS. Polymers 2018, 10, 1296. [Google Scholar] [CrossRef] [Green Version]
- Roh, S.-B.; Park, S.-B.; Oh, S.-K.; Park, E.-K.; Choi, W.Z. Development of intelligent sorting system realized with the aid of laser-induced breakdown spectroscopy and hybrid preprocessing algorithm-based radial basis function neural networks for recycling black plastic wastes. J. Mater. Cycles Waste Manag. 2018, 20, 1934–1949. [Google Scholar] [CrossRef]
- Vahid Dastjerdi, M.; Mousavi, S.J.; Soltanolkotabi, M.; Nezarati Zadeh, A. Identification and sorting of PVC polymer in recycling process by laser-induced breakdown spectroscopy (LIBS) combined with support vector machine (SVM) model. Iran. J. Sci. Technol. Trans. A Sci. 2018, 42, 959–965. [Google Scholar] [CrossRef]
- Shameem, K.M.M.; Choudhari, K.S.; Bankapur, A.; Kulkarni, S.D.; Unnikrishnan, V.K.; George, S.D.; Kartha, V.B.; Santhosh, C. A hybrid LIBS–Raman system combined with chemometrics: An efficient tool for plastic identification and sorting. Anal. Bioanal. Chem. 2017, 409, 3299–3308. [Google Scholar] [CrossRef]
- Aquino, F.W.B.; Paranhos, C.M.; Pereira-Filho, E.R. Method for the production of acrylonitrile-butadiene-styrene (ABS) and polycarbonate (PC)/ABS standards for direct Sb determination in plastics from e-waste using laser-induced breakdown spectroscopy. J. Anal. At. Spectrom. 2016, 31, 1228–1233. [Google Scholar] [CrossRef]
- Huber, N.; Eschlböck-Fuchs, S.; Scherndl, H.; Freimund, A.; Heitz, J.; Pedarnig, J.D. In-line measurements of chlorine containing polymers in an industrial waste sorting plant by laser-induced breakdown spectroscopy. Appl. Surf. Sci. 2014, 302, 280–285. [Google Scholar] [CrossRef]
- Boudinet, M.; Grégoire, S.; Pelascini, F.; Surma, F.; Detalle, V.; Holl, Y. Identification of plastics in WEEE (waste electric and electronic equipment) by laser induced breakdown spectroscopy. In Proceedings of the 6th Euro Mediterranean Symposium on Laser Induced Breakdown Spectroscopy, Izmir, Turkey, 11–15 September 2011. [Google Scholar]
- Huber, N.; Viskup, R.; Linsmeyer, T.; Scherndl, H.; Heitz, J.; Pedarnig, J.D. Detection of heavy metals in waste polymers by laser-induced breakdown spectroscopy: A comparison of UV and IR lasers as ablation source. SPIE-Int. Soc. Opt. Eng. Proc. 2010, 7726, 77260G. [Google Scholar] [CrossRef]
- Gondal, M.A.; Siddiqu, M.N. Identification of different kinds of plastics using laser induced breakdown spectroscopy for waste management. J. Environ. Sci. Health Part A 2007, 42, 1989–1997. [Google Scholar] [CrossRef] [PubMed]
- Stepputat, M.; Noll, R. On-line detection of heavy metals and brominated flame retardants in technical polymers with laser-induced breakdown spectrometry. Appl. Opt. 2003, 42, 6210–6220. [Google Scholar] [CrossRef]
- Fink, H.; Panne, U.; Niessner, R. Analysis of recycled thermoplasts from consumer electronics by laser-induced plasma spectroscopy. Anal. Chim. Acta 2001, 440, 17–25. [Google Scholar] [CrossRef]
- Murakami, Y.; Matsuzaki, Y.; Kamimura, T.; Nishiura, T.; Masuda, K.; Shibayama, A.; Inoue, R. Erosion mechanism of refractories in a pyro-processing furnace for recycling lithium-ion secondary batteries. Ceram. Int. 2020, 46, 9281–9288. [Google Scholar] [CrossRef]
- Feierabend, A.; Stissel, S. Operation of LIBS elemental analyzers for inline analysis of mineral resources and industrial products. In Proceedings of the 7th Sensor-Based Sorting & Control, Aachen, Germany, 23–24 February 2016; pp. 93–104. [Google Scholar]
- Günther, J.-U.; Schilder, C.; Feierabend, A.; Bohling, C. Laser-induced breakdown spectroscopy (LIBS) in recycling of refractory material outbreak. In Proceedings of the Mineral Recycling Forum, Rotterdam, The Netherlands, 14–15 March 2016. [Google Scholar]
- Baryshnikov, A.; Groisman, Y.; Eliezer, N.; Gaft, M.; Akselrod, L.; Savchenko, A. Laser-induced breakdown spectroscopy as a powerful tool for online quality control in the refractory industry. China’s Refract. 2016, 25, 32–38. [Google Scholar]
- Knapp, H.; Horckmans, L.; Bouillot, F.; Fricke-Begemann, C.; Connemann, S.; Makowe, J.; Ducastel, A.; Stark, A. Sensor-based sorting of spent refractory bricks. In Proceedings of the 28th International Mineral Processing Congress (IMPC 2016), Québec City, QC, Canada, 11–15 September 2016. [Google Scholar]
- Gumpenberger, T.; Gruber, J.; Huber, N.; Dallinger, M. Sorting of refractory materials—A unique laser-based solution. In Applications of Sensor-Based Sorting in the Raw Material Industry, Schriftenreihe zur Aufbereitung und Veredlung; Pretz, T., Wotruba, H., Nienhaus, K., Eds.; Shaker: Aachen, Germany, 2011; Volume 42, pp. 227–239. [Google Scholar]
- Lucchi, J.; Gluck, D.; Rials, S.; Tang, L.; Baudelet, M. Tire classification by elemental signatures using laser-induced breakdown spectroscop. Appl. Spectrosc. 2021, 75, 747–752. [Google Scholar] [CrossRef]
- Kokkinaki, O.; Klini, A.; Polychronaki, M.; Mavrikakis, N.C.; Siderakis, K.G.; Koudoumas, E.; Pylarinos, D.; Thalassinakis, E.; Kalpouzos, K.; Anglos, D. Assessing the type and quality of high voltage composite outdoor insulators by remote laser-induced breakdown spectroscopy analysis: A feasibility study. Spectrochim. Acta Part B 2020, 165, 105768. [Google Scholar] [CrossRef]
- Trautner, S.; Lackner, J.; Spendelhofer, W.; Huber, N.; Pedarnig, J.D. Quantification of the vulcanizing system of rubber in industrial tire rubber production by laser-induced breakdown spectroscopy (LIBS). Anal. Chem. 2019, 91, 5200–5206. [Google Scholar] [CrossRef] [PubMed]
- Vinod, P.; Desai, B.M.A.; Sarathi, R.; Kornhuber, S. Investigation on the electrical, thermal and mechanical properties of silicone rubber nanocomposites. IEEE Trans. Dielectr. Electr. Insul. 2019, 26, 1876–1884. [Google Scholar] [CrossRef]
- Lin, Z.; Han, W.; Xiao, H.; Wang, X.; Jia, Z. Study of silicone rubber used at external insulation of high voltage with laser-induced breakdown spectroscopy (LIBS). In Proceedings of the 2016 IEEE International Power Modulator and High Voltage Conference (IPMHVC), San Francisco, CA, USA, 6–9 July 2016. [Google Scholar] [CrossRef]
- Trautner, S.; Jasik, J.; Parigger, C.G.; Pedarnig, J.D.; Spendelhofer, W.; Lackner, J.; Veis, P.; Heitz, J. Laser-induced optical breakdown spectroscopy of polymer materials based on evaluation of molecular emission bands. Spectrochim. Acta Part A 2017, 174, 331–338. [Google Scholar] [CrossRef] [PubMed]
- Wang, X.; Hong, X.; Chen, C.; Wang, H.; Jia, Z.; Zou, L.; Li, R. Elemental analysis of RTV and HTV silicone rubber with laser-induced breakdown spectroscopy. In Proceedings of the 2017 IEEE Electrical Insulation Conference (EIC), Baltimore, MD, USA, 11–14 June 2017. [Google Scholar] [CrossRef]
- Prochazka, D.; Bilík, M.; Prochazková, P.; Klus, J.; Pořízka, P.; Novotný, J.; Novotný, K.; Ticová, B.; Bradáč, A.; Semela, M.; et al. Detection of tire tread particles using laser-induced breakdown spectroscopy. Spectrochim. Acta Part B 2015, 108, 1–7. [Google Scholar] [CrossRef]
- Keuter, H.; Ackfeld, D.; Limper, A. RELMA—A quality assurance device in the mixing room. Kautsch. Gummi Kunstst. KGK 2000, 53, 566–573. [Google Scholar]
- Lorenzen, C.J.; Carlhoff, C.; Hahn, U.; Jogwich, M. Applications of laser-induced emission spectral analysis for industrial process and quality control. J. Anal. At. Spectrom. 1992, 7, 1029–1035. [Google Scholar] [CrossRef]
- Davari, S.A.; Taylor, P.A.; Standley, R.W.; Mukherjee, D. Detection of interstitial oxygen contents in Czochralski grown silicon crystals using internal calibration in laser-induced breakdown spectroscopy (LIBS). Talanta 2019, 193, 192–198. [Google Scholar] [CrossRef] [PubMed]
- Patatut, L.; Serasset, M.; Lignier, H.; Pelletier, D.; Bouchard, P.; Sabsabi, M.; Benmansour, M. In-situ chemical analysis of molten photovoltaic silicon by laser induced breakdown spectroscopy. In Proceedings of the 2015 IEEE 42nd Photovoltaic Specialist Conference (PVSC 2015), New Orleans, LA, USA, 14–19 June 2015; Available online: http://toc.proceedings.com/28560webtoc.pdf (accessed on 28 January 2019).
- Darwiche, S.; Benmansour, M.; Eliezer, N.; Morvan, D. Laser-induced breakdown spectroscopy for photovoltaic silicon wafer analysis. Prog. Photovolt. Res. Appl. 2012, 20, 463–471. [Google Scholar] [CrossRef]
- Romero, D.; Laserna, J.J. Surface and tomographic distribution of carbon impurities in photonic-grade silicon using laser-induced breakdown spectrometry. J. Anal. At. Spectrom. 1998, 13, 557–560. [Google Scholar] [CrossRef]
- Petersson, J.; Gilbert-Gatty, M.; Bengtson, A. Rapid chemical analysis of steel slag by laser-induced breakdown spectroscopy for near-the-line applications. J. Anal. At. Spectrom. 2020, 35, 1848–1858. [Google Scholar] [CrossRef]
- Gornushkin, I.B.; Völker, T.; Kazakov, A.Y. Extension and investigation by numerical simulations of algorithm for calibration-free laser induced breakdown spectroscopy. Spectrochim. Acta Part B 2018, 147, 149–163. [Google Scholar] [CrossRef]
- Demidov, A.; Eschlböck-Fuchs, S.; Kazakov, A.Y.; Gornushkin, I.B.; Kolmhofer, P.J.; Pedarnig, J.D.; Huber, N.; Heitz, J.; Schmid, T.; Rössler, R.; et al. Monte carlo standardless approach for laser induced breakdown spectroscopy based on massive parallel graphic processing unit computing. Spectrochim. Acta Part B 2016, 125, 97–102. [Google Scholar] [CrossRef]
- Kolmhofer, P.J.; Eschlböck-Fuchs, S.; Huber, N.; Rössler, R.; Heitz, J.; Pedarnig, J.D. Calibration-free analysis of steel slag by laser-induced breakdown spectroscopy with combined UV and VIS spectra. Spectrochim. Acta Part B 2015, 106, 67–74. [Google Scholar] [CrossRef]
- Sturm, V.; Fleige, R.; De Kanter, M.; Leitner, R.; Pilz, K.; Fischer, D.; Hubmer, G.; Noll, R. Laser-induced breakdown spectroscopy for 24/7 automatic liquid slag analysis at a steel works. Anal. Chem. 2014, 86, 9687–9692. [Google Scholar] [CrossRef]
- Pedarnig, J.D.; Kolmhofer, P.; Huber, N.; Praher, B.; Heitz, J.; Rössler, R. Element analysis of complex materials by calibration-free laser-induced breakdown spectroscopy. Appl. Phys. A Mater. Sci. Process. 2013, 112, 105–111. [Google Scholar] [CrossRef]
- Praher, B.; Rössler, R.; Arenholz, E.; Heitz, J.; Pedarnig, J.D. Quantitative determination of element concentrations in industrial oxide materials by laser-induced breakdown spectroscopy. Anal. Bioanal. Chem. 2011, 400, 3367–3375. [Google Scholar] [CrossRef]
- Sturm, V.; Schmitz, H.-U.; Reuter, T.; Fleige, R.; Noll, R. Fast vacuum slag analysis in a steel works by laser-induced breakdown spectroscopy. Spectrochim. Acta Part B 2008, 63, 1167–1170. [Google Scholar] [CrossRef]
- Palagas, C.; Stavropoulos, P.; Couris, S.; Angelopoulos, G.N.; Kolm, I.; Papamantellos, D.C. Investigation of the parameters influencing the accuracy of rapid slag analysis with laser-induced breakdown spectroscopy. Steel Res. Int. 2007, 78, 693–703. [Google Scholar] [CrossRef]
- Zhang, W.; Zhou, R.; Liu, K.; Li, Q.; Tang, Z.; Zhu, C.; Li, X.; Zeng, X.; He, C. Silicon determination in steel with molecular emission using laser-induced breakdown spectroscopy combined with laser-induced molecular fluorescence. J. Anal. At. Spectrom. 2021, 36, 375–379. [Google Scholar] [CrossRef]
- Zhang, Y.; Sun, C.; Gao, L.; Yue, Z.; Shabbir, S.; Xu, W.; Wu, M.; Yu, J. Determination of minor metal elements in steel using laser-induced breakdown spectroscopy combined with machine learning algorithms. Spectrochim. Acta Part B 2020, 166, 105802. [Google Scholar] [CrossRef]
- Cui, M.; Deguchi, Y.; Wang, Z.; Tanaka, S.; Fujita, Y.; Zhao, S. Improved analysis of manganese in steel samples using collinear long–short double pulse laser-induced breakdown spectroscopy (LIBS). Appl. Spectrosc. 2019, 73, 152–162. [Google Scholar] [CrossRef]
- Lednev, V.N.; Dormidonov, A.E.; Sdvizhenskii, P.A.; Ya Grishin, M.; Fedorov, A.N.; Savvin, A.D.; Safronova, E.S.; Pershin, S.M. Compact diode-pumped Nd:YAG laser for remote analysis of low-alloy steels by laser-induced breakdown spectroscopy. J. Anal. At. Spectrom. 2018, 33, 294–303. [Google Scholar] [CrossRef] [Green Version]
- Wang, Z.; Deguchi, Y.; Shiou, F.; Yan, J.; Liu, J. Application of laser-induced breakdown spectroscopy to real-time elemental monitoring of iron and steel making processes. ISIJ Int. 2016, 56, 723–735. [Google Scholar] [CrossRef] [Green Version]
- Li, C.; Hao, Z.; Zou, Z.; Zhou, R.; Li, J.; Guo, L.; Li, X.; Lu, Y.; Zeng, X. Determinations of trace boron in superalloys and steels using laser-induced breakdown spectroscopy assisted with laser-induced fluorescence. Opt. Express 2016, 24, 7850–7857. [Google Scholar] [CrossRef]
- Boué-Bigne, F. Laser-induced breakdown spectroscopy and multivariate statistics for the rapid identification of oxide inclusions in steel products. Spectrochim. Acta Part B 2016, 119, 25–35. [Google Scholar] [CrossRef]
- Meinhardt, C.; Sturm, V.; Fleige, R.; Fricke-Begemann, C.; Noll, R. Laser-induced breakdown spectroscopy of scaled steel samples taken from continuous casting blooms. Spectrochim. Acta Part B 2016, 123, 171–178. [Google Scholar] [CrossRef]
- Pořízka, P.; Klus, J.; Prochazka, D.; Képeš, E.; Hrdlička, A.; Novotný, J.; Novotný, K.; Kaiser, J. Laser-induced breakdown spectroscopy coupled with chemometrics for the analysis of steel: The issue of spectral outliers filtering. Spectrochim. Acta Part B 2016, 123, 114–120. [Google Scholar] [CrossRef]
- Zeng, Q.; Guo, L.; Li, X.; Shen, M.; Zhu, Y.; Li, J.; Yang, X.; Li, K.; Duan, J.; Zeng, X.; et al. Quantitative analyses of Mn, V, and Si elements in steels using a portable laser-induced breakdown spectroscopy system based on a fiber laser. J. Anal. At. Spectrom. 2016, 31, 767–772. [Google Scholar] [CrossRef]
- Zhang, T.; Xia, D.; Tang, H.; Yang, X.; Li, H. Classification of steel samples by laser-induced breakdown spectroscopy and random forest. Chemom. Intell. Lab. Syst. 2016, 157, 196–201. [Google Scholar] [CrossRef]
- Li, J.; Guo, L.; Zhao, N.; Yang, X.; Yi, R.; Li, K.; Zeng, Q.; Li, X.; Zeng, X.; Lu, Y. Determination of cobalt in low-alloy steels using laser-induced breakdown spectroscopy combined with laser-induced fluorescence. Talanta 2016, 151, 234–238. [Google Scholar] [CrossRef] [PubMed]
- Li, K.; Guo, L.; Li, C.; Li, X.; Shen, M.; Zheng, Z.; Yu, Y.; Hao, R.; Hao, Z.; Zeng, Q.; et al. Analytical-performance improvement of laser-induced breakdown spectroscopy for steel using multi-spectral-line calibration with an artificial neural network. J. Anal. At. Spectrom. 2015, 30, 1623–1628. [Google Scholar] [CrossRef]
- Li, C.M.; Zou, Z.M.; Yang, X.Y.; Hao, Z.Q.; Guo, L.B.; Li, X.Y.; Lu, Y.F.; Zeng, X.Y. Quantitative analysis of phosphorus in steel using laser-induced breakdown spectroscopy in air atmosphere. J. Anal. At. Spectrom. 2014, 29, 1432–1437. [Google Scholar] [CrossRef]
- Liang, L.; Zhang, T.; Wang, K.; Tang, H.; Yang, X.; Zhu, X.; Duan, Y.; Li, H. Classification of steel materials by laser-induced breakdown spectroscopy coupled with support vector machines. Appl. Opt. 2014, 53, 544–552. [Google Scholar] [CrossRef] [PubMed]
- Zaytsev, S.M.; Popov, A.M.; Chernykh, E.V.; Voronina, R.D.; Zorov, N.B.; Labutin, T.A. Comparison of single- and multivariate calibration for determination of Si, Mn, Cr and Ni in high-alloyed stainless steels by laser-induced breakdown spectrometry. J. Anal. At. Spectrom. 2014, 29, 1417–1424. [Google Scholar] [CrossRef]
- Zhang, T.; Liang, L.; Wang, K.; Tang, H.; Yang, X.; Duan, Y.; Li, H. A novel approach for the quantitative analysis of multiple elements in steel based on laser-induced breakdown spectroscopy (LIBS) and random forest regression (RFR). J. Anal. At. Spectrom. 2014, 29, 2323–2329. [Google Scholar] [CrossRef]
- Khater, M.A. Laser-induced breakdown spectroscopy for light elements detection in steel: State of the art. Spectrochim. Acta Part B 2013, 81, 1–10. [Google Scholar] [CrossRef]
- Noll, R.; Sturm, V.; Aydin, Ü.; Eilers, D.; Gehlen, C.; Höhne, M.; Lamott, A.; Makowe, J.; Vrenegor, J. Laser-induced breakdown spectroscopy—From research to industry, new frontiers for process control. Spectrochim. Acta Part B 2008, 63, 1159–1166. [Google Scholar] [CrossRef]
- Boué-Bigne, F. Analysis of oxide inclusions in steel by fast laser-induced breakdown spectroscopy scanning: An approach to quantification. Appl. Spectrosc. 2007, 61, 333–337. [Google Scholar] [CrossRef]
- Lopez-Moreno, C.; Amponsah-Manager, K.; Smith, B.W.; Gornushkin, I.B.; Omenetto, N.; Palanco, S.; Laserna, J.J.; Winefordner, J.D. Quantitative analysis of low-alloy steel by microchip laser induced breakdown spectroscopy. J. Anal. At. Spectrom. 2005, 20, 552–556. [Google Scholar] [CrossRef]
- Bulajic, D.; Cristoforetti, G.; Corsi, M.; Hidalgo, M.; Legnaioli, S.; Palleschi, V.; Salvetti, A.; Tognoni, E.; Green, S.; Bates, D.; et al. Diagnostics of high-temperature steel pipes in industrial environment by laser-induced breakdown spectroscopy technique: The LIBSGRAIN project. Spectrochim. Acta Part B 2002, 57, 1181–1192. [Google Scholar] [CrossRef]
- Palanco, S.; Cabalín, L.M.; Romero, D.; Laserna, J.J. Infrared laser ablation and atomic emission spectrometry of stainless steel at high temperatures. J. Anal. At. Spectrom. 1999, 14, 1883–1887. [Google Scholar] [CrossRef]
- Aguilera, J.A.; Aragón, C.; Campos, J. Determination of carbon content in steel using laser-induced breakdown spectroscopy. Appl. Spectrosc. 1992, 46, 1382–1387. [Google Scholar] [CrossRef]
- Taparlia, U.A.; Kannengiesser, T.; Cieslik, K.; Mory, D.; Griesche, A. In situ chemical composition analysis of a tungsten-inert-gas austenitic stainless steel weld measured by laser-induced breakdown spectroscopy. Spectrochim. Acta Part B 2020, 167, 105826. [Google Scholar] [CrossRef]
- Jandaghi, M.; Parvin, P.; Torkamany, M.J.; Sabbaghzadeh, J. Alloying elemental change of SS-316 and Al-5754 during laser welding using real time laser induced breakdown spectroscopy (LIBS) accompanied by EDX and PIXE microanalysis. Phys. Procedia 2010, 5, 107–114. [Google Scholar] [CrossRef] [Green Version]
- Zhang, Y.; Shipway, P.H.; Boue-Bigne, F. Characterisation of creep-weak zones (white bands) in grade 91 weld metal. Sci. Technol. Weld. Join. 2009, 14, 542–548. [Google Scholar] [CrossRef]
- Mirapeix, J.M.; Cobo, A.; Conde, O.M.; Jauregui, C.; López-Higuera, J.M. Robust technique for spectroscopic plasma analysis with application in real-time arc welding quality monitoring. Opt. Eng. 2006, 45, 083002. [Google Scholar] [CrossRef]
- Dong, L.; Liu, S.; Xiu, J. Quantitative analysis of cu(in,ga)se2 thin films deposited by magnetron sputtering technology using laser-induced breakdown spectroscopy. Laser Optoelectron. Prog. 2021, 57, 233003. [Google Scholar] [CrossRef]
- Choi, J.-H.; Lee, H.-J.; Lee, S.-H.; In, J.-H.; Jeong, S. Effects of spot size variation on the laser induced breakdown spectroscopy analysis of Cu(In,Ga)Se2 solar cell. Thin Solid Film. 2018, 660, 314–319. [Google Scholar] [CrossRef]
- Lee, S.-H.; Kim, C.-K.; Shim, H.-S.; Yoo, J.-H.; Russo, R.E.; Jeong, S. Ablation and spectroscopic characteristics of thin CuIn1-xGaxSe2 solar cell films fabricated by coevaporation and co-sputtering processes. Int. J. Precis. Eng. Manuf. Green Technol. 2014, 1, 17–24. [Google Scholar] [CrossRef] [Green Version]
- Lee, S.H.; Shim, H.S.; Kim, C.K.; Yoo, J.H.; Russo, R.E.; Jeong, S. Analysis of the absorption layer of CIGS solar cell by laser-induced breakdown spectroscopy. Appl. Opt. 2012, 51, B115–B120. [Google Scholar] [CrossRef]
- Kowalczyk, J.M.D.; Perkins, J.; Kaneshiro, J.; Gaillard, N.; Chang, Y.; DeAngelis, A.; Mallory, S.A.; Bates, D.; Miller, E. Measurement of the sodium concentration in CIGS solar cells via laser induced breakdown spectroscopy. In Proceedings of the 35th IEEE Photovoltaic Specialists Conference (PVSC), Honolulu, HI, USA, 20–25 June 2010; pp. 1742–1744. Available online: http://toc.proceedings.com/09471webtoc.pdf (accessed on 9 May 2015).
- Diego-Vallejo, D.; Eichler, H.J.; Ashkenasi, D. Inspection of thin-film solar cell processing by laser induced breakdown spectroscopy and neural networks. In Proceedings of the 2012 International Symposium on Optomechatronic Technologies (ISOT 2012), Paris, France, 29–31 October 2012. [Google Scholar] [CrossRef]
- Garcia, J.A.; da Silva, J.R.A.; Pereira-Filhoa, E.R. LIBS as an alternative method to control an industrial hydrometallurgical process for the recovery of Cu in waste from electro-electronic equipment (WEEE). Microchem. J. 2021, 164, 106007. [Google Scholar] [CrossRef]
- Costa, V.C.; Castro, J.P.; Andrade, D.F.; Victor Babos, D.; Garcia, J.A.; Sperança, M.A.; Catelani, T.A.; Pereira-Filho, E.R. Laser-induced breakdown spectroscopy (LIBS) applications in the chemical analysis of waste electrical and electronic equipment (WEEE). TrAC Trends Anal. Chem. 2018, 108, 65–73. [Google Scholar] [CrossRef]
- Rabasovic, M.S.; Marinkovic, B.P.; Sevic, D. Time-resolved analysis of pure indium sample and LCD displays. Opt. Quantum Electron. 2018, 50, 236. [Google Scholar] [CrossRef]
- Costa, V.C.; Aquino, F.W.B.; Paranhos, C.M.; Pereira-Filho, E.R. Identification and classification of polymer e-waste using laser-induced breakdown spectroscopy (LIBS) and chemometric tools. Polym. Test. 2017, 59, 390–395. [Google Scholar] [CrossRef]
- Aquino, F.W.B.; Pereira-Filho, E.R. Analysis of the polymeric fractions of scrap from mobile phones using laser-induced breakdown spectroscopy: Chemometric applications for better data interpretation. Talanta 2015, 134, 65–73. [Google Scholar] [CrossRef]
- Martin, M.Z.; Fox, R.V.; Miziolek, A.W.; DeLucia, F.C.; André, N. Spectral analysis of rare earth elements using laser-induced breakdown spectroscopy. SPIE-Int. Soc. Opt. Eng. Proc. 2015, 9482, 94820G. [Google Scholar] [CrossRef]
- Fink, H.; Panne, U.; Niessner, R. Process analysis of recycled thermoplasts from consumer electronics by laser-induced plasma spectroscopy. Anal. Chem. 2002, 74, 4334–4342. [Google Scholar] [CrossRef]
- Meng, D.; Zhao, N.; Wang, Y.; Ma, M.; Fang, L.; Gu, Y.; Jia, Y.; Liu, J. On-line/on-site analysis of heavy metals in water and soils by laser induced breakdown spectroscopy. Spectrochim. Acta Part B 2017, 137, 39–45. [Google Scholar] [CrossRef]
- Karpate, T.; Muhammed Shameem, K.M.; Nayak, R.; Unnikrishnan, V.K.; Santhosh, C. LIBS: A potential tool for industrial/agricultural waste water analysis. SPIE-Int. Soc. Opt. Eng. Proc. 2016, 9893, 989317. [Google Scholar] [CrossRef]
- Yao, M.; Lin, J.; Liu, M.; Xu, Y. Detection of chromium in wastewater from refuse incineration power plant near Poyang lake by laser induced breakdown spectroscopy. Appl. Opt. 2012, 51, 1552–1557. [Google Scholar] [CrossRef]
- Lin, Z.-X.; Chang, L.; Li, J.; Liu, L.-M. Determination of as in industrial wastewater by laser-induced breakdown spectroscopy. Spectrosc. Spectr. Anal. 2009, 29, 1675–1677. [Google Scholar] [CrossRef]
- Rai, N.K.; Rai, A.K. LIBS—An efficient approach for the determination of Cr in industrial wastewater. J. Hazard. Mater. 2008, 150, 835–838. [Google Scholar] [CrossRef] [PubMed]
- Martin, M.Z.; Labbe, N.; Wagner, R.J. Applications of high resolution laser: Induced breakdown spectroscopy for environmental and biological samples. Springer Ser. Opt. Sci. 2014, 182, 439–456. [Google Scholar] [CrossRef]
- Wen, G.; Sun, D.; Su, M.; Dong, C. LIBS detection of heavy metal elements in liquid solutions by using wood pellet as sample matrix. Plasma Sci. Technol. 2014, 16, 598–601. [Google Scholar] [CrossRef]
- Aono, Y.; Ando, K.; Hattori, N. Rapid identification of CCA-treated wood using laser-induced breakdown spectroscopy. J. Wood Sci. 2012, 58, 363–368. [Google Scholar] [CrossRef]
- Martin, M.Z.; Labbe´, N.; Rials, T.G.; Wullschleger, S.D. Analysis of preservative-treated wood by multivariate analysis of laser-induced breakdown spectroscopy spectra. Spectrochim. Acta Part B 2005, 60, 1179–1185. [Google Scholar] [CrossRef]
- Solo-Gabriele, H.M.; Townsend, T.G.; Hahn, D.W.; Moskal, T.M.; Hosein, N.; Jambeck, J.; Jacobi, G. Evaluation of XRF and LIBS technologies for on-line sorting of CCA-treated wood waste. Waste Manag. 2004, 24, 413–424. [Google Scholar] [CrossRef]
- Moskal, T.M.; Hahn, D.W. On-Line sorting of wood treated with chromated copper arsenate using laser-induced breakdown spectroscopy. Appl. Spectrosc. 2002, 56, 1337–1344. [Google Scholar] [CrossRef]
- Hull, G.; McNaghten, E.D.; Coffey, P.; Martin, P. Isotopic analysis and plasma diagnostics for lithium detection using combined laser ablation–tuneable diode laser absorption spectroscopy and laser-induced breakdown spectroscopy. Spectrochim. Acta Part B 2021, 177, 106051. [Google Scholar] [CrossRef]
- Angerer, G.; Erdmann, L.; Marscheider-Weidemann, F.; Scharp, M.; Lüllmann, A.; Handke, V.; Marwede, M. Rohstoffe für Zukunftstechnologien; Fraunhofer IRB: Stuttgart, Germany, 2009; ISBN 978-3-8167-7957-5. [Google Scholar]
- Source of Data: Gartner. Available online: https://www.statista.com (accessed on 8 February 2021).
- Hagelüken, C. Lagerstätten auf Rädern, intelligente recyclingkonzepte könnten wesentlich zur versorgungssicherheit bei technologiemetallen beitragen. ReSource 2010, 3, 30–33. [Google Scholar]
- Source of Data: U.S, Geological Survey. National Minerals Information Center. Available online: https://www.usgs.gov/centers/nmic/mineral-commodity-summaries (accessed on 8 February 2021).
- Hagelüken, C.; Meskers, C.E.M. Mining our computers—Opportunities and challenges to recover scarce and valuable metals from end-of-life electronic devices. In Electronics Goes Green 2008+; Reichel, H., Nissen, N.F., Müller, J., Deubzer, O., Eds.; Fraunhofer IRB: Stuttgart, Germany, 2008; pp. 623–628. [Google Scholar]
- U.S. Geological Survey, Mineral Commodity Summaries. 2018. Available online: https://minerals.usgs.gov/minerals/pubs/mcs/index.html (accessed on 24 January 2019).
- British Geological Survey. Risk List. 2015. Available online: http://www.bgs.ac.uk/mineralsuk/statistics/riskList.html (accessed on 28 January 2019).
- Goldmann, D. Recycling im Fokus. ReSource 2010, 2, 8–14. [Google Scholar]
- PlasticsEurope. Plastics—The Facts 2019: An Analysis of European Plastics Production, Demand and Waste Data. Available online: https://www.plasticseurope.org (accessed on 16 June 2021).
- Marine Litter Solutions. Microplastics. Available online: https://www.marinelittersolutions.com/ (accessed on 16 June 2021).
- European Commission. Communication from the Commission to the European Parliament, the Council, the European Economic and Social Committee and the Committee of the regions: A European Strategy for Plastics in a Circular Economy. 2018. Available online: https://eur-lex.europa.eu/legal-content/EN/TXT/?uri=COM%3A2018%3A28%3AFIN (accessed on 17 June 2021).
- Volk, R.; Stallkamp, C.; Steins, J.J.; Yogish, S.P.; Müller, R.C.; Stapf, D.; Schultmann, F. Techno-economic assessment and comparison of different plastic recycling pathways. A German case study. J. Ind. Ecol. 2021, 1–20. [Google Scholar] [CrossRef]
- McKinsey & Company. Towards the Circular Economy: Economic and Business Rationale for an Accelerated Transition. 2012. Available online: https://www.ellenmacarthurfoundation.org/ (accessed on 15 January 2012).
- Prammer, H.K.; Schrack, D. Including reducts into material flow cost accounting for detecting inefficiency in small and medium sized recycling and disposal companies. In Proceedings of the International Conference ‘SMEs: Moving toward Business Sustainability’, Montreal, QC, Canada, 20–23 October 2011; pp. 269–285. [Google Scholar]
- Prammer, H.K. Integriertes Umweltkostenmanagement; Springer Gabler: Wiesbaden, Germany, 2009; ISBN 978-3-8349-1690-7. [Google Scholar]
- Swiss Federal Institute of Technology Zurich, Database Ecoinvent 2012. Available online: https://www.ecoinvent.org/database/ (accessed on 5 July 2012).
- Hagelüken, C. High-tech recycling of critical metals: Opportunities and challenges. In Proceedings of the AAAS Annual Meeting, Chicago, IL, USA, 13–17 February 2014. [Google Scholar]
- Robben, M.; Gaastra, M.; Kleine, C.; Maul, A.; Mavroudis, F.; Raulf, K.; Warcholik, M. Intelligent sensor systems: Efficient use of raw materials by applying innovative sensor technologies. Aufbereit. Miner. Process. 2011, 52, 40–53. Available online: https://www.at-minerals.com/ (accessed on 9 October 2013).
- Araujo-Andrade, C.; Bugnicourt, E.; Philippet, L.; Rodriguez-Turienzo, L.; Nettleton, D.; Hoffmann, L.; Schlummer, M. Review on the photonic techniques suitable for automatic monitoring of the composition of multi-materials wastes in view of their posterior recycling. Waste Manag. Res. 2021, 39, 631–651. Available online: https://0-doi-org.brum.beds.ac.uk/10.1177/0734242X21997908 (accessed on 10 June 2021). [CrossRef] [PubMed]
- The World Bank Group. Data from International Energy Agency (IEA) Statistics, OECD/IEA (2014). Available online: https://data.worldbank.org/indicator/EG.ELC.COAL.ZS?end=2019&start=1960 (accessed on 21 June 2021).
- Wang, Z.; Hou, Z.; Zhang, L.; Yao, S.; Sheta, S.; Afgan, M.S. Coal analysis. In Laser-Induced Breakdown Spectroscopy, 2nd ed.; Singh, J.P., Thakur, S.N., Eds.; Elsevier: Amsterdam, Netherlands, 2020; pp. 473–498. [Google Scholar] [CrossRef]
- Romero, C.E.; De Saro, R. LIBS Analysis for Coal. In Laser-Induced Breakdown Spectroscopy: Theory and Applications, Springer Series in Optical Sciences; Musazzi, S., Perini, U., Eds.; Springer: Berlin/Heidelberg, Germany, 2014; Volume 182, pp. 511–530. ISBN 978-3-642-45085-3. [Google Scholar]
- Romero, C.E.; Yao, Z.; De Saro, R.; Craparo, J.; Lam, S.; Silfies, R.; Plangemann, R.; Lyter, F. Development and demonstration of laser-induced breakdown spectroscopy for in-situ, on-line coal analysis. In Proceedings of the International Pittsburgh Coal Conference, Pittsburgh, PA, USA, 12–15 September 2011; pp. 1–12. Available online: https://www.lehigh.edu/energy/research/PDF/On-Line%20Coal%20Monitoring_Paper%202.pdf (accessed on 18 June 2021).
- Zhang, L.; Ma, W.; Dong, L.; Yan, X.; Hu, Z.; Li, Z.; Zhang, Y.; Le, W.; Yin, W.; Jia, S. Development of an apparatus for on-line analysis of unburned carbon in fly ash using laser-induced breakdown spectroscopy (LIBS). Appl. Spectrosc. 2011, 65, 790–796. [Google Scholar] [CrossRef] [PubMed]
- Blevins, L.G.; Shaddix, C.R.; Sickafoose, S.M.; Walsh, P.M. Laser-induced breakdown spectroscopy at high temperatures in industrial boilers and furnaces. Appl. Opt. 2003, 42, 6107–6118. [Google Scholar] [CrossRef] [PubMed]
- US Geological Survey. Minerals Yearbook—Metals and Minerals. Available online: https://www.usgs.gov/centers/nmic/minerals-yearbook-metals-and-minerals (accessed on 24 June 2021).
- US Environmental Protection Agency. Available online: https://www.norstar.com.au/benefits/ (accessed on 24 June 2021).
- The Aluminum Association. Available online: https://www.aluminum.org (accessed on 25 June 2021).
- ITER—The Way to New Energy. Available online: https://www.iter.org/ (accessed on 28 June 2021).
- Li, C.; Zhao, D.; Hu, Z.; Wu, X.; Luo, G.N.; Hu, J.; Ding, H. Characterization of deuterium retention and co-deposition of fuel with lithium on the divertor tile of EAST using laser induced breakdown spectroscopy. J. Nucl. Mater. 2015, 463, 915–918. [Google Scholar] [CrossRef]
- Horckmans, L.; Nielsen, P.; Dierckx, P.; Ducastel, A. Recycling of refractory bricks used in basic steelmaking: A review. Resour. Conserv. Recycl. 2019, 140, 297–304. [Google Scholar] [CrossRef]
- International Rubber Study Group IRSG; Rubber Statistical Bulletin. Available online: https://www.rubberstudy.com/ (accessed on 10 February 2021).
- Cabalín, L.M.; Delgado, T.; Ruiz, J.; Mier, D.; Laserna, J.J. Stand-off laser-induced breakdown spectroscopy for steel-grade intermix detection in sequence casting operations. At-line monitoring of temporal evolution versus predicted mathematical model. Spectrochim. Acta Part B 2018, 146, 93–100. [Google Scholar] [CrossRef]
- Ruiz, J.; Delgado, T.; Cabalín, L.M.; Laserna, J.J. At-line monitoring of continuous casting sequences of steel using discriminant function analysis and dual-pulse laser-induced breakdown spectroscopy. J. Anal. At. Spectrom. 2017, 32, 1119–1128. [Google Scholar] [CrossRef]
- Lorenzetti, G.; Legnaioli, S.; Grifoni, E.; Pagnotta, S.; Palleschi, V. Laser-based continuous monitoring and resolution of steel grades in sequence casting machines. Spectrochim. Acta Part B 2015, 112, 1–5. [Google Scholar] [CrossRef]
- Doujak, G.; Mertens, R.; Ramb, W.; Flock, J.; Geyer, J.; Lüngen, S. Slag analysis by laser-induced breakdown spectroscopy. Stahl Eisen 2001, 121, 53–58. [Google Scholar]
- Burakov, V.S.; Kiris, V.V.; Naumenkov, P.A.; Raikov, S.N. Calibration-free laser spectral analysis of glasses and copper alloys. J. Appl. Spectrosc. 2004, 71, 740–746. [Google Scholar] [CrossRef]
- Pershin, S.M.; Colao, F.; Spizzichino, V. Quantitative analysis of bronze samples by laser-induced breakdown spectroscopy (LIBS): A new approach, model, and experiment. Laser Phys. 2006, 16, 455–467. [Google Scholar] [CrossRef]
- Aguilera, J.A.; Aragón, C.; Cristoforetti, G.; Tognoni, E. Application of calibration-free laser-induced breakdown spectroscopy to radially resolved spectra from a copper-based alloy laser-induced plasma. Spectrochim. Acta Part B 2009, 64, 685–689. [Google Scholar] [CrossRef]
- Herrera, K.K.; Tognoni, E.; Gornushkin, I.B.; Omenetto, N.; Smith, B.W.; Winefordner, J.D. Comparative study of two standard-free approaches in laser-induced breakdown spectroscopy as applied to the quantitative analysis of aluminum alloy standards under vacuum conditions. J. Anal. At. Spectrom. 2009, 24, 426–438. [Google Scholar] [CrossRef]
- Colao, F.; Fantoni, R.; Lazic, V.; Paolini, A.; Fabbri, F.; Ori, G.G.; Marinangeli, L.; Baliva, A. Investigation of LIBS feasibility for in situ planetary exploration: An analysis on Martian rock analogues. Planet. Space Sci. 2004, 52, 117–123. [Google Scholar] [CrossRef]
- Sallé, B.; Lacour, J.L.; Mauchien, P.; Fichet, P.; Maurice, S.; Manhes, G. Comparative study of different methodologies for quantitative rock analysis by laser-induced breakdown spectroscopy in a simulated Martian atmosphere. Spectrochim. Acta Part B 2006, 61, 301–313. [Google Scholar] [CrossRef]
- De Giacomo, A.; Dell’Aglio, M.; De Pascale, O.; Longo, S.; Capitelli, M. Laser induced breakdown spectroscopy on meteorites. Spectrochim. Acta Part B 2007, 62, 1606–1611. [Google Scholar] [CrossRef]
- Singh, V.K.; Singh, V.; Rai, A.K.; Thakur, S.N.; Rai, P.K.; Singh, J.P. Quantitative analysis of gallstones using laser-induced breakdown spectroscopy. Appl. Opt. 2008, 47, G38–G47. [Google Scholar] [CrossRef]
- Pandhija, S.; Rai, A.K. In situ multielemental monitoring in coral skeleton by CF-LIBS. Appl. Phys. B Lasers Opt. 2009, 94, 545–552. [Google Scholar] [CrossRef]
- Praher, B.; Palleschi, V.; Viskup, R.; Heitz, J.; Pedarnig, J.D. Calibration free laser-induced breakdown spectroscopy of oxide materials. Spectrochim. Acta Part B 2010, 65, 671–679. [Google Scholar] [CrossRef]
- Eschlböck-Fuchs, S.; Haslinger, M.J.; Hinterreiter, A.; Kolmhofer, P.; Huber, N.; Rössler, R.; Heitz, J.; Pedarnig, J.D. Influence of sample temperature on the expansion dynamics and the optical emission of laser-induced plasma. Spectrochim. Acta Part B 2013, 87, 36–42. [Google Scholar] [CrossRef]
- Gornushkin, I.B.; Shabanov, S.V.; Merk, S.; Tognoni, E.; Panne, U. Effects of non-uniformity of laser induced plasma on plasma temperature and concentrations determined by the Boltzmann plot method: Implications from plasma modeling. J. Anal. At. Spectrom. 2010, 25, 1643–1653. [Google Scholar] [CrossRef]
- Andrade, D.F.; Romanelli, J.P.; Pereira-Filho, E.R. Past and emerging topics related to electronic waste management: Top countries, trends, and perspectives. Environ. Sci. Pollut. Res. 2019, 26, 17135–17151. [Google Scholar] [CrossRef]
- European Project, Horizon 2020. Next Generation Urban Mining—Automated Disassembly, Separation and Recovery of Valuable Materials from Electronic Equipment (ADIR). Available online: https://www.adir.eu/ (accessed on 9 July 2021).
- Schwödiauer, G.; Trautner, S.; Teichert, G.; Krziwanek, T.; Pedarnig, J.D. Detection of contaminants (PVC, Al, Fe) in recycled PET flakes with laser-induced breakdown spectroscopy. In Proceedings of the 11th International Conference on Laser-Induced Breakdown Spectroscopy, Kyoto, Japan, 20–25 September 2020. [Google Scholar]
- Godoi, Q.; Santos, D., Jr.; Nunes, L.C.; Leme, F.O.; Rufini, I.A.; Agnelli, J.A.M.; Trevizian, L.C.; Krug, F.J. Preliminary studies of laser-induced breakdown spectrometry for the determination of Ba, Cd, Cr and Pb in toys. Spectrochim. Acta Part B 2009, 64, 573–581. [Google Scholar] [CrossRef]
- Radivojevic, I.; Niessner, R.; Haisch, C.; Florek, S.; Becker-Ross, H.; Panne, U. Detection of bromine in thermoplasts from consumer electronics by laser-induced plasma spectroscopy. Spectrochim. Acta Part B 2004, 59, 335–343. [Google Scholar] [CrossRef]
- SCOPUS (2021). Available online: http://www.scopus.com (accessed on 17 June 2021).


Publisher’s Note: MDPI stays neutral with regard to jurisdictional claims in published maps and institutional affiliations. |
© 2021 by the authors. Licensee MDPI, Basel, Switzerland. This article is an open access article distributed under the terms and conditions of the Creative Commons Attribution (CC BY) license (https://creativecommons.org/licenses/by/4.0/).
Share and Cite
Pedarnig, J.D.; Trautner, S.; Grünberger, S.; Giannakaris, N.; Eschlböck-Fuchs, S.; Hofstadler, J. Review of Element Analysis of Industrial Materials by In-Line Laser—Induced Breakdown Spectroscopy (LIBS). Appl. Sci. 2021, 11, 9274. https://0-doi-org.brum.beds.ac.uk/10.3390/app11199274
Pedarnig JD, Trautner S, Grünberger S, Giannakaris N, Eschlböck-Fuchs S, Hofstadler J. Review of Element Analysis of Industrial Materials by In-Line Laser—Induced Breakdown Spectroscopy (LIBS). Applied Sciences. 2021; 11(19):9274. https://0-doi-org.brum.beds.ac.uk/10.3390/app11199274
Chicago/Turabian StylePedarnig, Johannes D., Stefan Trautner, Stefan Grünberger, Nikolaos Giannakaris, Simon Eschlböck-Fuchs, and Josef Hofstadler. 2021. "Review of Element Analysis of Industrial Materials by In-Line Laser—Induced Breakdown Spectroscopy (LIBS)" Applied Sciences 11, no. 19: 9274. https://0-doi-org.brum.beds.ac.uk/10.3390/app11199274