
Statistical Optimization of a Hyper Red, Deep Blue, and White LEDs Light Combination for Controlled Basil Horticulture


Abstract
:Featured Application
Abstract
1. Introduction
2. Materials and Methods
2.1. Materials
2.2. Statistical Methods
2.3. Experimental Methods
2.4. Characterizations
3. Results and Discussion
3.1. Preliminary Consideration
3.2. Anova Analysis
4. Conclusions
Author Contributions
Funding
Institutional Review Board Statement
Informed Consent Statement
Data Availability Statement
Acknowledgments
Conflicts of Interest
References
- Fraąszczak, B.; Golcz, A.; Zawirska-Wojtasiak, R.; Janowska, B. Growth rate of sweet basil and lemon balm plants grown under fluorescent lamps and led modules. Acta Sci. Pol. Hortorum Cultus 2014, 13, 3–13. [Google Scholar]
- Shahak, Y.; Gussakovsky, E.E.; Cohen, Y.; Lurie, S.; Stern, R.; Kfir, S.; Naor, A.; Atzmon, I.; Doron, I.; Greenblat-Avron, Y. Colornets: A new approach for light manipulation in fruit trees. In Proceedings of the Acta Horticulturae; International Society for Horticultural Science (ISHS), Leuven, Belgium, 11 March 2004; pp. 609–616. [Google Scholar]
- Chang, X.; Alderson, P.G.; Wright, C.J. Solar irradiance level alters the growth of basil (Ocimum basilicum L.) and its content of volatile oils. Environ. Exp. Bot. 2008, 63, 216–223. [Google Scholar] [CrossRef]
- Stagnari, F.; Di Mattia, C.; Galieni, A.; Santarelli, V.; D’Egidio, S.; Pagnani, G.; Pisante, M. Light quantity and quality supplies sharply affect growth, morphological, physiological and quality traits of basil. Ind. Crops Prod. 2018, 122, 277–289. [Google Scholar] [CrossRef]
- Natesh, H.N.; Abbey, L.; Sk, A. An overview of nutritional and anti nutritional factors in green leafy vegetables. Horticult. Int. J. 2017, 1, 58–65. [Google Scholar] [CrossRef] [Green Version]
- Stagnari, F.; Galieni, A.; Speca, S.; Pisante, M. Scientia Horticulturae Water stress effects on growth, yield and quality traits of red beet. Sci. Hortic. 2014, 165, 13–22. [Google Scholar] [CrossRef]
- Bantis, F.; Ouzounis, T.; Radoglou, K. Artificial LED lighting enhances growth characteristics and total phenolic content of Ocimum basilicum, but variably affects transplant success. Sci. Hortic. 2016, 198, 277–283. [Google Scholar] [CrossRef] [Green Version]
- Hossain, M.A.; Kabir, M.J.; Salehuddin, S.M.; Rahman, S.M.M.; Das, A.K.; Singha, S.K.; Alam, M.K.; Rahman, A. Antibacterial properties of essential oils and methanol extracts of sweet basil Ocimum basilicum occurring in Bangladesh. Pharm. Biol. 2010, 48, 504–511. [Google Scholar] [CrossRef] [PubMed]
- Kathirvel, P.; Ravi, S. Chemical composition of the essential oil from basil (Ocimum basilicum Linn.) and its in vitro cytotoxicity against HeLa and HEp-2 human cancer cell lines and NIH 3T3 mouse embryonic fibroblasts. Nat. Prod. Res. 2012, 26, 1112–1118. [Google Scholar] [CrossRef]
- Sipos, L.; Boros, I.F.; Csambalik, L.; Székely, G.; Jung, A.; Balázs, L. Horticultural lighting system optimalization: A review. Sci. Hortic. 2020, 273, 109631. [Google Scholar] [CrossRef]
- Jao, R.C.; Fang, W. An Adjustable Light Source for Photo–Phyto Related Research and Young Plant Production. Appl. Eng. Agric. 2003, 19, 601. [Google Scholar] [CrossRef]
- Yeh, N.; Chung, J.P. High-brightness LEDs-Energy efficient lighting sources and their potential in indoor plant cultivation. Renew. Sustain. Energy Rev. 2009, 13, 2175–2180. [Google Scholar] [CrossRef]
- Morrow, R.C. LED lighting in horticulture. HortScience 2008, 43, 1947–1950. [Google Scholar] [CrossRef] [Green Version]
- Barta, D.J.; Tibbitts, T.W.; Bula, R.J.; Morrow, R.C. Evaluation of light emitting diode characteristics for a space-based plant irradiation source. Adv. Sp. Res. 1992, 12, 141–149. [Google Scholar] [CrossRef]
- Bula, R.J.; Morrow, R.C.; Tibbitts, T.W.; Barta, D.J.; Ignatius, R.W.; Martin, T.S. Light-emitting diodes as a radiation source for plants. HortScience 1991, 26, 203–205. [Google Scholar] [CrossRef] [PubMed] [Green Version]
- Piovene, C.; Orsini, F.; Bosi, S.; Sanoubar, R.; Bregola, V.; Dinelli, G.; Gianquinto, G. Optimal red: Blue ratio in led lighting for nutraceutical indoor horticulture. Sci. Hortic. 2015, 193, 202–208. [Google Scholar] [CrossRef]
- Hasan, M.M.; Bashir, T.; Ghosh, R.; Lee, S.K.; Bae, H. An overview of LEDs’ effects on the production of bioactive compounds and crop quality. Molecules 2017, 22, 1420. [Google Scholar] [CrossRef] [PubMed] [Green Version]
- Dou, H.; Niu, G.; Gu, M.; Masabni, J.G. Effects of light quality on growth and phytonutrient accumulation of herbs under controlled environments. Horticulturae 2017, 3, 36. [Google Scholar] [CrossRef] [Green Version]
- Olle, M.; Alsina, I. Influence of wavelength of light on growth, yield and nutritional quality of greenhouse vegetables. Proc. Latv. Acad. Sci. Sect. B Nat. Exact Appl. Sci. 2019, 73, 1–9. [Google Scholar] [CrossRef] [Green Version]
- Huché-Thélier, L.; Crespel, L.; Le Gourrierec, J.; Morel, P.; Sakr, S.; Leduc, N. Light signaling and plant responses to blue and UV radiations-Perspectives for applications in horticulture. Environ. Exp. Bot. 2016, 121, 22–38. [Google Scholar] [CrossRef]
- Wang, J.; Lu, W.; Tong, Y.; Yang, Q. Leaf morphology, photosynthetic performance, chlorophyll fluorescence, stomatal development of lettuce (Lactuca sativa L.) exposed to different ratios of red light to blue light. Front. Plant Sci. 2016, 7, 250. [Google Scholar] [CrossRef] [Green Version]
- Miao, Y.; Wang, X.; Gao, L.; Chen, Q.; Qu, M. Blue light is more essential than red light for maintaining the activities of photosystem II and I and photosynthetic electron transport capacity in cucumber leaves. J. Integr. Agric. 2016, 15, 87–100. [Google Scholar] [CrossRef] [Green Version]
- Jishi, T.; Kimura, K.; Matsuda, R.; Fujiwara, K. Effects of temporally shifted irradiation of blue and red LED light on cos lettuce growth and morphology. Sci. Hortic. 2016, 198, 227–232. [Google Scholar] [CrossRef]
- Johkan, M.; Shoji, K.; Goto, F.; Hahida, S.; Yoshihara, T. Effect of green light wavelength and intensity on photomorphogenesis and photosynthesis in Lactuca sativa. Environ. Exp. Bot. 2012, 75, 128–133. [Google Scholar] [CrossRef]
- Rahman, M.M.; Vasiliev, M.; Alameh, K. LED Illumination Spectrum Manipulation for Increasing the Yield of Sweet Basil (Ocimum basilicum L.). Plants 2021, 10, 344. [Google Scholar] [CrossRef]
- Casal, J.J. Photoreceptor Signaling Networks in Plant Responses to Shade. Annu. Rev. Plant Biol. 2013, 64, 403–427. [Google Scholar] [CrossRef]
- Demotes-Mainard, S.; Péron, T.; Corot, A.; Bertheloot, J.; Le Gourrierec, J.; Pelleschi-Travier, S.; Crespel, L.; Morel, P.; Huché-Thélier, L.; Boumaza, R.; et al. Plant responses to red and far-red lights, applications in horticulture. Environ. Exp. Bot. 2016, 121, 4–21. [Google Scholar] [CrossRef]
- Barbi, S.; Barbieri, F.; Bertacchini, A.; Barbieri, L.; Montorsi, M. Effects of different LED light recipes and NPK fertilizers on basil cultivation for automated and integrated horticulture methods. Appl. Sci. 2021, 11, 2497. [Google Scholar] [CrossRef]
- Montgomery, D.C. Design and Analysis of Experiments, 8th ed.; Wiley: Hoboken, NJ, USA, 2012; Volume 2, ISBN 9781118146927. [Google Scholar]
- Italian Republic, Legislative Decree n. 75/2010 concerning fertilizers. Gazz. Uff. Ser. Gen. n.218 del 17-09-2013, 2010.
- Intelligent Led Solutions Petunia Led Modules. Available online: https://i-led.co.uk/PDFs/Kits/12Multi-OslonSSL-PetuniaColourV3.pdf (accessed on 1 July 2021).
- OSRAM LH CP7P 660 nm Hyper Red LED. Available online: https://www.osram.com/ecat/OSLON®SSL80LHCP7P/com/en/class_pim_web_catalog_103489/prd_pim_device_2402508/ (accessed on 1 July 2021).
- OSRAM LD CQ7P 451 nm Deep Blue LED. Available online: https://www.osram.com/ecat/OSLON®SSL80LDCQ7P/com/en/class_pim_web_catalog_103489/prd_pim_device_2402502/ (accessed on 1 July 2021).
- OSRAM LCW CQDP.EC 3000 K Warm White LED. Available online: https://media.digikey.com/PDF/Data%20Sheets/Osram%20PDFs/LCW_CQDP.EC.pdf (accessed on 1 July 2021).
- Lighting Analysts Inc. AGi32 Software Documentation. Available online: https://support.agi32.com/support/solutions/articles/22000211885-computing-ppfd-factors-from-spd-data (accessed on 1 July 2021).
- AMS. AS7341 Spectral Sensor. Available online: https://ams.com/as7341 (accessed on 1 July 2021).
- LEDiL C12528 PETUNIA Lens. Available online: https://www.ledil.com/product-card/?product=C12528_PETUNIA (accessed on 1 July 2021).
- Eriksson, L.; Johansson, E.; Kettaneh-Wold, N.; WikstrÄom, C.; Wold, S. Design of Experiments: Principles and Applications; Umetrics Academy: Umeå, Sweden, 2008; ISBN 10:9197373044. [Google Scholar]
- Morris, P.; John, P.W.M. Statistical Design and Analysis of Experiments. Math. Gaz. 1999, 83, 189. [Google Scholar] [CrossRef]
- Lee, M.-J.; Son, K.-H.; Oh, M.-M. Increase in biomass and bioactive compounds in lettuce under various ratios of red to far-red LED light supplemented with blue LED light. Hortic. Environ. Biotechnol. 2016, 57, 139–147. [Google Scholar] [CrossRef]
- Murchie, E.H.; Pinto, M.; Horton, P. Agriculture and the new challenges for photosynthesis research. New Phytol. 2008, 181, 532–552. [Google Scholar] [CrossRef] [PubMed]


| Module Type | Module Code 1 | Total Number of LEDs | Total Number of HR 1 LEDs | Total Number of DB 2 LEDs | Total Number of WW 3 LEDs |
|---|---|---|---|---|---|
| 1 | 5HR:1DB:6WW | 12 | 5 | 1 | 6 |
| 2 | 9HR:3DB | 12 | 9 | 3 | - |
| 3 | 6HR:6DB | 12 | 6 | 6 | - |
| 4 | 3HR:9DB | 12 | 3 | 6 | - |
| LED Type | Peak Emission Wavelength | Spectral Bandwidth at 50% | Correlated Color Temperature | PPF [µmol/s] |
|---|---|---|---|---|
| HR | 660 nm | 25 nm | - | 2.01 1 |
| DB | 451 nm | 20 nm | - | 2.26 2 |
| WW | - | - | 3000 K | 1.47 3 |
| Module’s Code | PPF HR [µmol/s] | PPF DB [µmol/s] | PPF WW [µmol/s] | Total PPFmodule_calc [µmol/s] | %PPF HR | %PPF DB | %PPF White |
|---|---|---|---|---|---|---|---|
| 5HR:1DB:6WW | 10.07 | 2.26 | 8.84 | 21.17 | 47.57 | 10.69 | 41.74 |
| 9HR:3DB | 18.13 | 6.79 | - | 24.92 | 72.76 | 27.24 | - |
| 6HR:6DB | 12.08 | 13.57 | - | 25.65 | 47.10 | 52.90 | - |
| 3HR:9DB | 6.04 | 20.36 | - | 26.40 | 22.88 | 77.12 | - |
| Module’s Code | PPFETO [µmol/s] | PPFmodule_calc [µmol/s] | Error 1 [%] |
|---|---|---|---|
| 5HR:1DB:6WW | 19.48 | 21.17 | 7.98 |
| 9HR:3DB | 23.61 | 24.91 | 5.23 |
| 6HR:6DB | 24.63 | 25.66 | 4.00 |
| 3HR:9DB | 24.19 | 26.40 | 8.38 |
| Factor | Type | Levels | Minimum | Zero-Point | Maximum |
|---|---|---|---|---|---|
| Distance | Numeric/Discrete | 3 | 60 cm | 70 cm | 80 cm |
| HR:DB ratio 1 | Numeric/Discrete | 3 | 1HR:3DB | 1HR:1DB | 3HR:1DB |
| White | Categoric/Nominal | 2 | YES | - | NO |
| DoE VARIABLES | LIGHT COMBINATION 4 | ||||||
|---|---|---|---|---|---|---|---|
| #Test | d1 [cm] | HR:DB Ratio 2 | White | COMBINATION’S CODE 3 | # of HR LEDs | # of DB LEDs | # of WW LEDs |
| LEDs | |||||||
| 1 | 80 | 1:03 | YES | LR14 | 8 | 10 | 6 |
| 2 | 80 | 1:03 | YES | LR14 | 8 | 10 | 6 |
| 3 | 80 | 1:01 | YES | LR13 | 11 | 7 | 6 |
| 4 | 80 | 3:01 | YES | LR12 | 14 | 4 | 6 |
| 5 | 80 | 1:03 | NO | LR44 | 6 | 18 | 0 |
| 6 | 80 | 1:01 | NO | LR33 | 12 | 12 | 0 |
| 7 | 80 | 3:01 | NO | LR22 | 18 | 6 | 0 |
| 8 | 70 | 1:03 | YES | LR14 | 8 | 10 | 6 |
| 9 | 70 | 1:01 | YES | LR13 | 11 | 7 | 6 |
| 10 | 70 | 3:01 | YES | LR12 | 14 | 4 | 6 |
| 11 | 70 | 1:03 | NO | LR44 | 6 | 18 | 0 |
| 12 | 70 | 1:01 | NO | LR33 | 12 | 12 | 0 |
| 13 | 70 | 1:01 | NO | LR33 | 12 | 12 | 0 |
| 14 | 70 | 3:01 | NO | LR22 | 18 | 6 | 0 |
| 15 | 60 | 1:03 | YES | LR14 | 8 | 10 | 6 |
| 16 | 60 | 1:01 | YES | LR13 | 11 | 7 | 6 |
| 17 | 60 | 3:01 | YES | LR12 | 14 | 4 | 6 |
| 18 | 60 | 1:03 | NO | LR44 | 6 | 18 | 0 |
| 19 | 60 | 1:01 | NO | LR33 | 12 | 12 | 0 |
| 20 | 60 | 3:01 | NO | LR22 | 18 | 6 | 0 |
| Light Combination’s Code 1 | # of HR LEDs | # of DB LEDs | # of WW LEDs | PPF TOTAL 2 | %PPF | %PPF | %PPF White |
|---|---|---|---|---|---|---|---|
| [µmol/s] | HR | DB | |||||
| LR12 | 14 | 4 | 6 | 46.08 | 61.19 | 19.64 | 19.18 |
| LR13 | 11 | 7 | 6 | 46.83 | 47.31 | 33.82 | 18.87 |
| LR14 | 8 | 10 | 6 | 47.57 | 33.87 | 47.56 | 18.58 |
| LR22 | 18 | 6 | - | 49.82 | 72.76 | 27.74 | 0 |
| LR33 | 12 | 12 | - | 51.31 | 47.1 | 52.9 | 0 |
| LR44 | 6 | 18 | - | 52.8 | 22.88 | 77.12 | 0 |
| Sample | High | Wet Mass | Dry Mass | Number of Leaves | Stem Length | Stem Wet Mass | Stem Dry Mass | Leaves Wet Mass | Stem Diameter | Number of Plants | LAI | SLA | Water | Days of Germination |
|---|---|---|---|---|---|---|---|---|---|---|---|---|---|---|
| [mm] | [g] | [g] | [mm] | [g] | [g] | [g] | [mm] | [mm] | [%] | [g/cm2] | [g] | |||
| 1 | 64.705 | 2.0107 | 0.1977 | 4 | 51.577 | 0.387 | 0.029 | 1.61 | 2.397 | 4 | 2.745 | 335.714 | 500 | 14 |
| 2 | 36.555 | 0.9905 | 0.0725 | 3 | 27.52 | 0.203 | 0.014 | 0.77 | 1.745 | 4 | 1.496 | 510.03 | 460 | 9 |
| 3 | 47.912 | 1.4652 | 0.1272 | 4 | 35.467 | 0.2462 | 0.0165 | 1.2 | 2.215 | 4 | 2.131 | 382.482 | 440 | 9 |
| 4 | 34.163 | 0.8396 | 0.0696 | 3.33 | 25.54 | 0.171 | 0.013 | 0.66 | 1.803 | 3 | 1.081 | 508.694 | 420 | 8 |
| 5 | 30.227 | 0.4682 | 0.0378 | 2 | 21.737 | 0.111 | 0.009 | 0.34 | 1.372 | 4 | 0.825 | 585.481 | 400 | 15 |
| 6 | 35.732 | 0.8258 | 0.0665 | 3 | 25.297 | 0.168 | 0.012 | 0.72 | 1.747 | 4 | 1.357 | 497.334 | 420 | 8 |
| 7 | 58.768 | 1.6572 | 0.1426 | 4 | 44.514 | 0.305 | 0.018 | 1.38 | 2.109 | 5 | 3.081 | 427.778 | 480 | 10 |
| 8 | 70.392 | 2.5177 | 0.2727 | 5 | 59.105 | 0.478 | 0.061 | 2.01 | 2.405 | 4 | 3.388 | 323.199 | 520 | 9 |
| 9 | 24.45 | 0.4826 | 0.0383 | 2 | 16.913 | 0.11 | 0.009 | 0.36 | 1.536 | 3 | 0.587 | 527.777 | 410 | 11 |
| 10 | 33.03 | 0.9076 | 0.0733 | 3.33 | 23.03 | 0.16 | 0.009 | 0.74 | 1.753 | 3 | 1.092 | 451.222 | 460 | 11 |
| 11 | 34.76 | 0.8867 | 0.0745 | 2.25 | 21.1 | 0.154 | 0.009 | 0.73 | 1.945 | 4 | 1.54 | 470.328 | 440 | 12 |
| 12 | 25.557 | 0.5888 | 0.0495 | 2 | 17.947 | 0.133 | 0.01 | 0.45 | 1.6 | 4 | 0.932 | 466.9 | 420 | 9 |
| 13 | 47.84 | 1.9922 | 0.1854 | 4 | 32.912 | 0.295 | 0.026 | 1.69 | 2.564 | 5 | 3.18 | 356.697 | 480 | 12 |
| 14 | 38.24 | 1.1395 | 0.0817 | 3 | 24.73 | 0.214 | 0.014 | 0.91 | 1.982 | 4 | 1.725 | 500.773 | 420 | 17 |
| 15 | 70.368 | 1.6722 | 0.1712 | 4.4 | 54.75 | 0.376 | 0.032 | 1.28 | 2.148 | 5 | 2.967 | 400.627 | 480 | 10 |
| 16 | 29.103 | 0.5283 | 0.0406 | 2 | 18.373 | 0.121 | 0.012 | 0.4 | 1.673 | 3 | 0.67 | 616.623 | 400 | 13 |
| 17 | 35.016 | 0.8626 | 0.0673 | 3.33 | 22.833 | 0.154 | 0.011 | 0.69 | 1.883 | 3 | 1.069 | 508.54 | 400 | 7 |
| 18 | 40.2 | 1.2056 | 0.1049 | 2.8 | 28.422 | 0.221 | 0.0154 | 0.97 | 2.056 | 5 | 2.387 | 427.278 | 440 | 11 |
| 19 | 56.042 | 2.2845 | 0.2596 | 4 | 46.81 | 0.436 | 0.0516 | 1.83 | 2.522 | 5 | 3.678 | 328.818 | 480 | 9 |
| 20 | 51.716 | 1.7271 | 0.1696 | 4 | 36.866 | 0.27 | 0.019 | 1.44 | 2.35 | 3 | 1.85 | 321.679 | 440 | 8 |
| Response | R2 | Pred-R2 | Equation | |
| White = YES | White = NO | |||
| Number of plants | 0.44 | 0.32 | -- | |
| Days for germination | 0.12 | 0.07 | -- | |
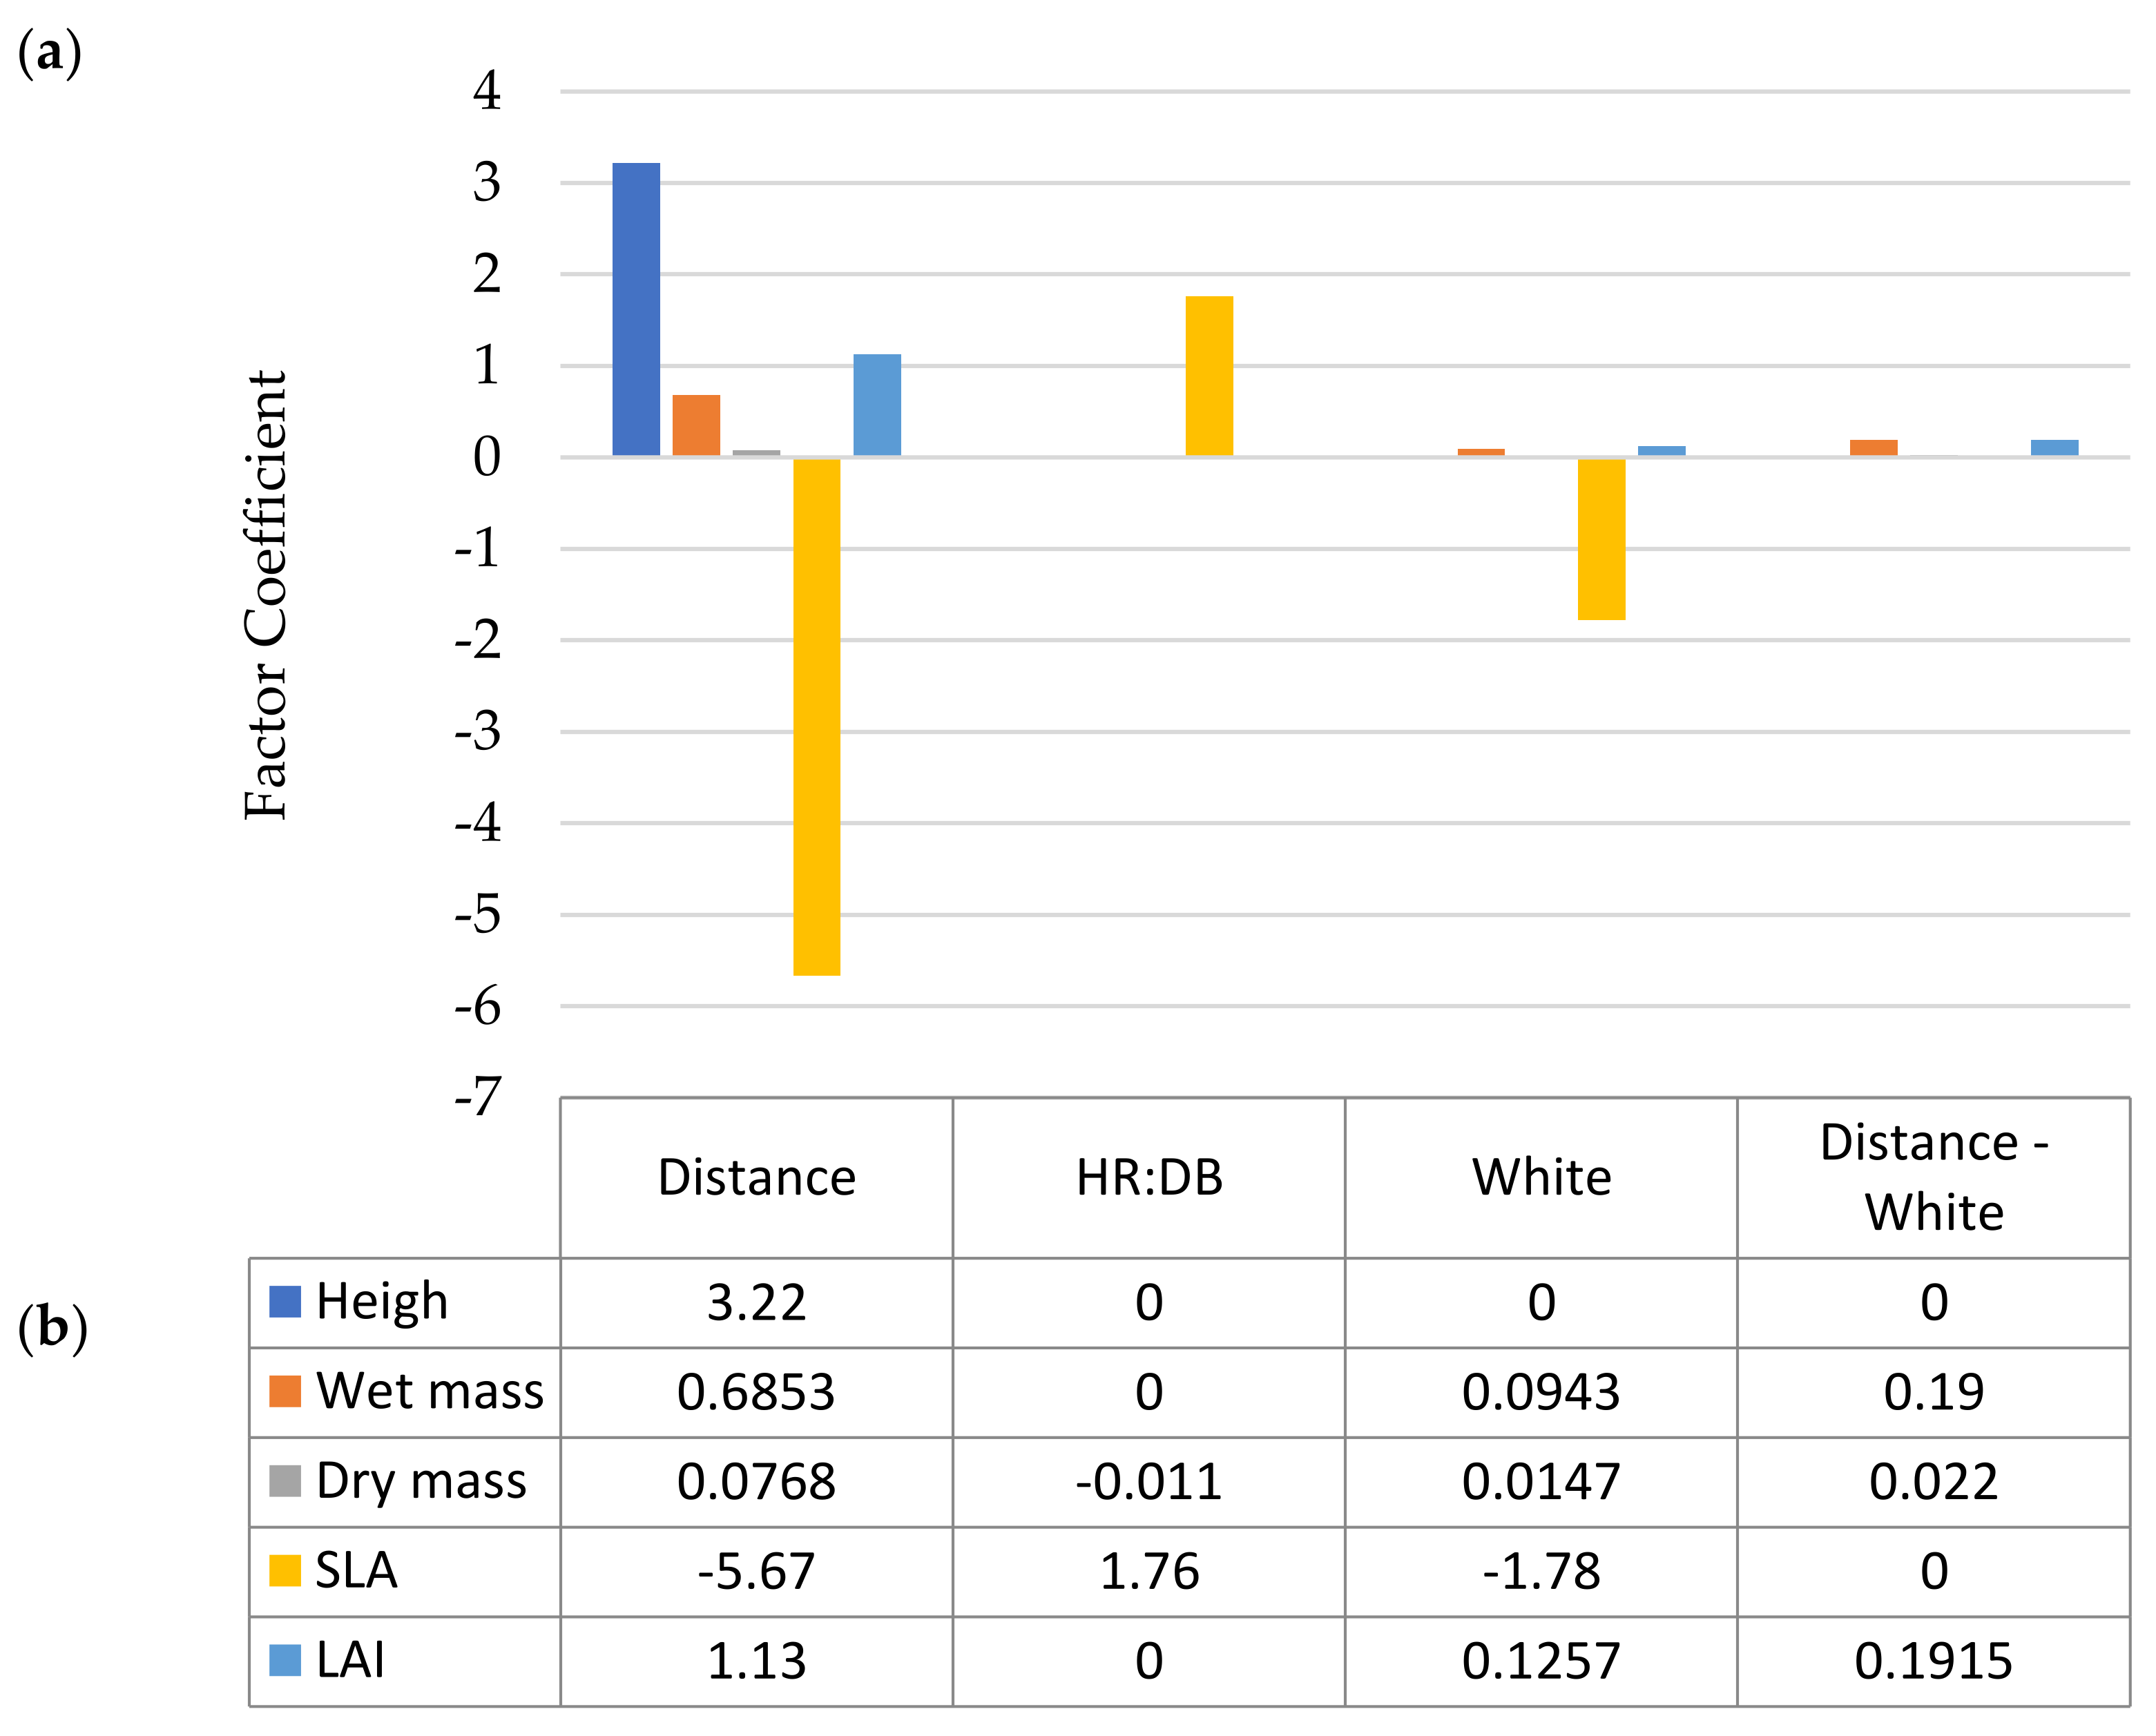
| Height | 0.76 | 0.70 | =28.7796 + 15.2203 * Distance | |
| Wet mass | 0.88 | 0.83 | =0.6871 + 0.4952 * Distance | =0.4957 + 0.8752 * Distance |
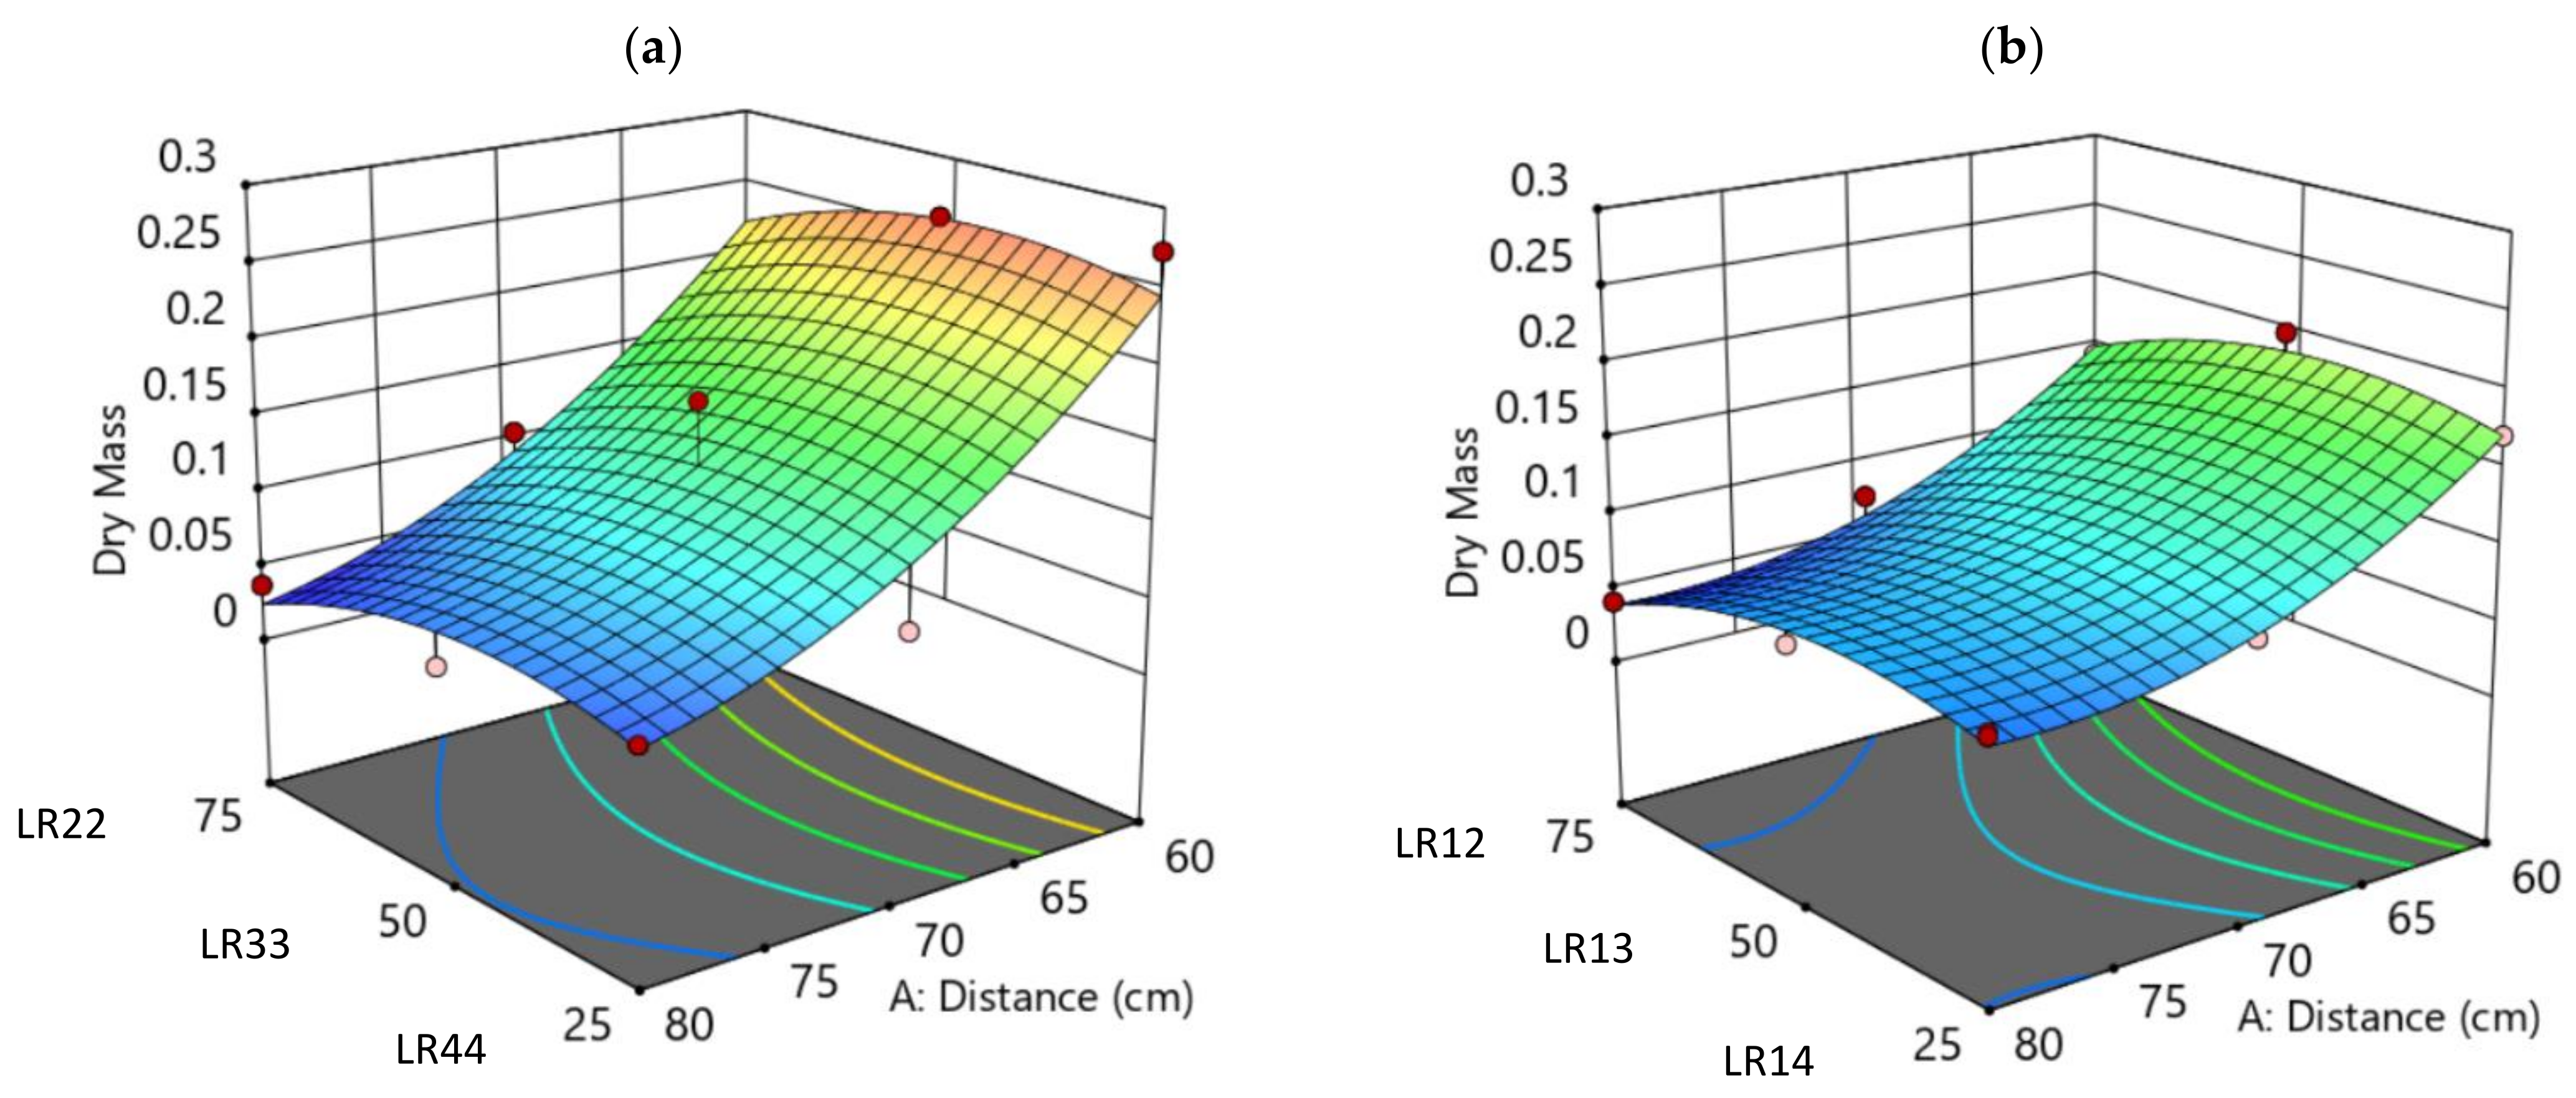
| Dry mass | 0.92 | 0.82 | =−0.0024 − 0.0093 * Distance + 0.003 * HR:DB + 0.0320 * Distance2 | =−0.0169 + 0.0346 * Distance + 0.0035 * HR:DB + 0.0320 * Distance2 |
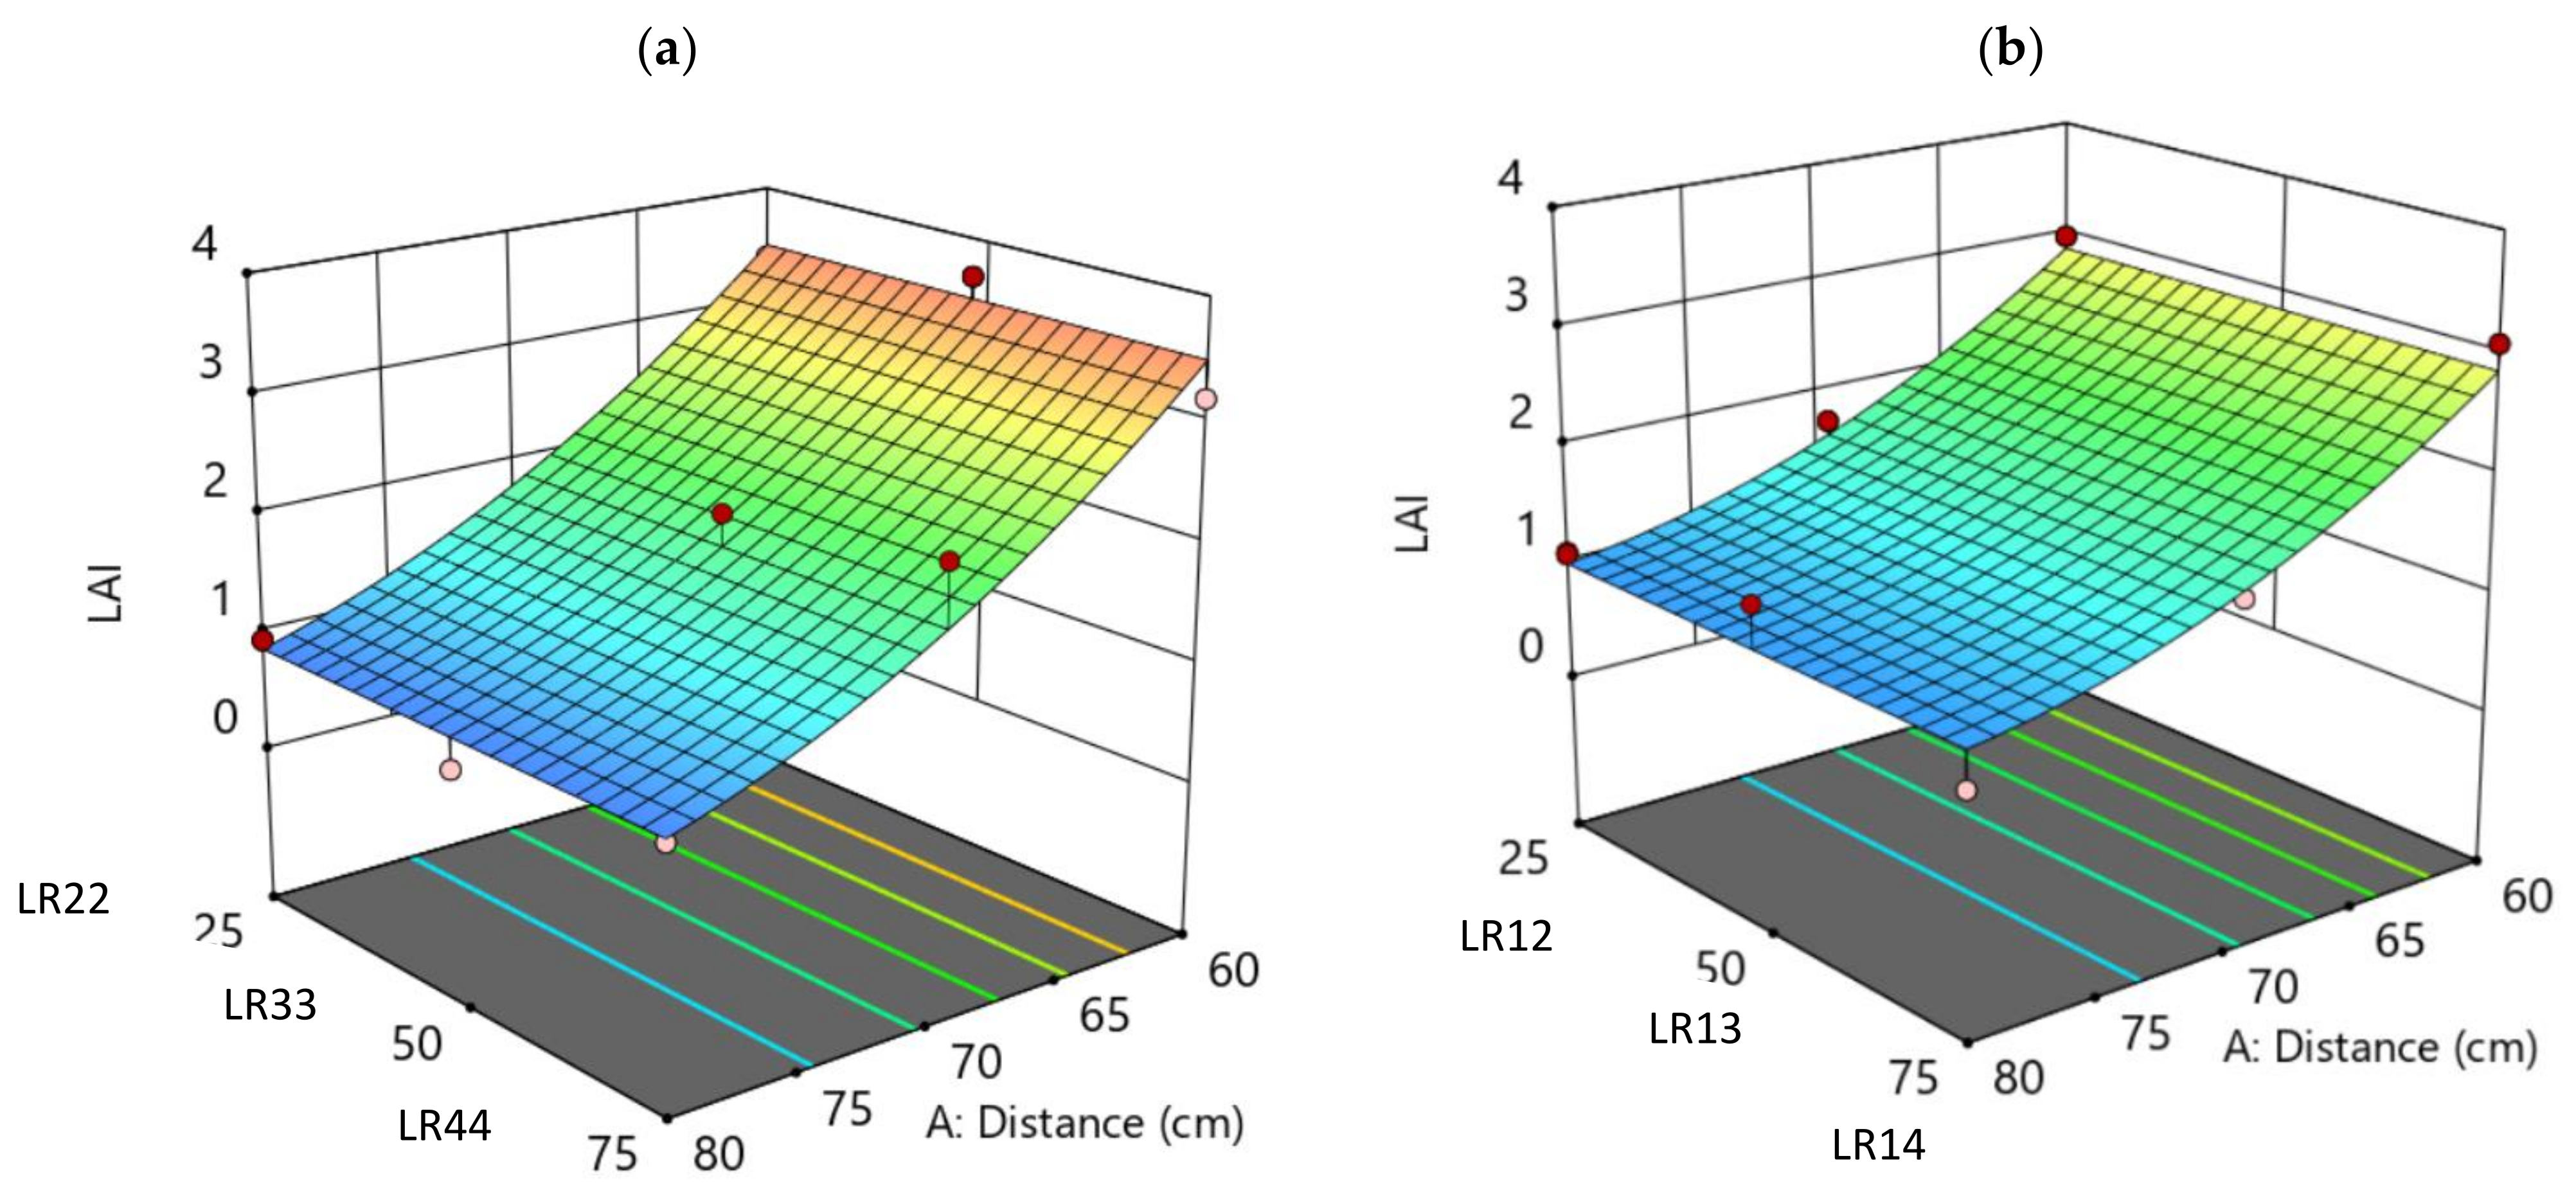
| LAI | 0.93 | 0.91 | =0.9884 + 0.2941 * Distance + 0.3199 * Distance2 | =0.8569 + 0.6771 * Distance + 0.3199 * Distance2 |
| SLA | 0.81 | 0.67 | =690.7412 − 82.6704 * Distance − 7.9299 * HR:DB + 0.0863 * HR:DB2 | =653.9108 − 82.6704 * Distance − 7.9299 * HR:DB + 0.0863 * HR:DB2 |
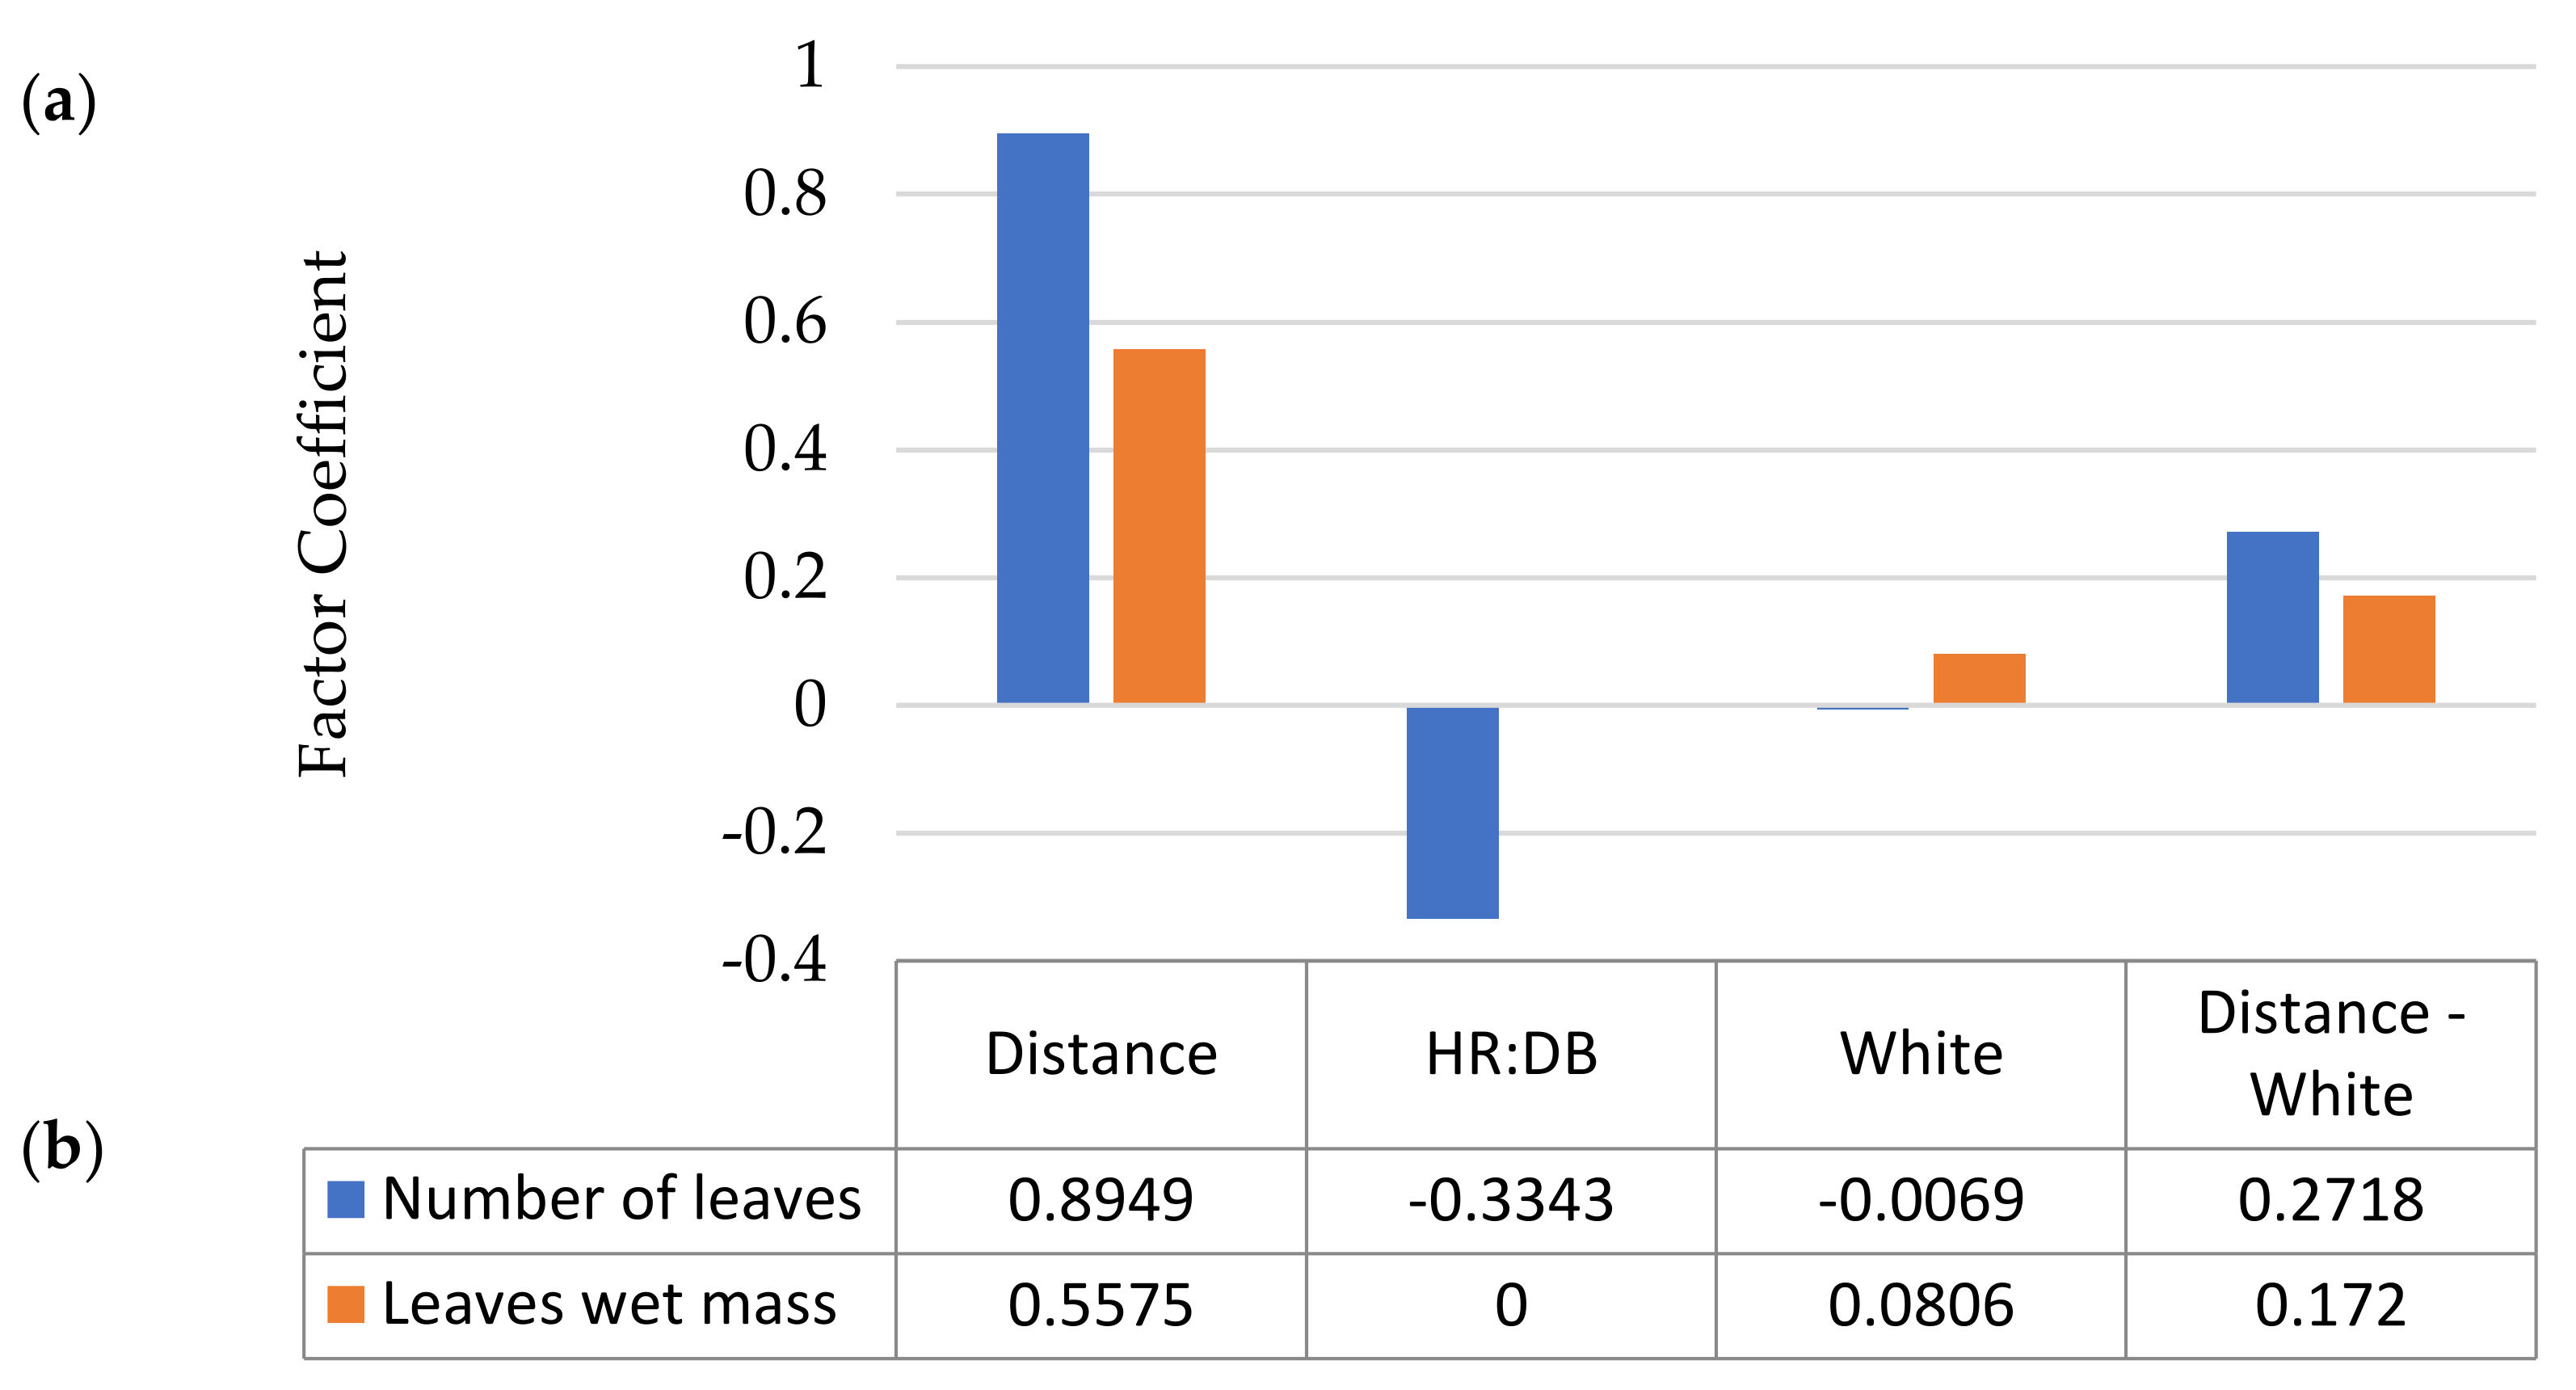
| Number of leaves | 0.77 | 0.63 | =3.3393 + 0.6230 * Distance − 0.0133 * HR:DB | =2.7819 + 1.1666 * Distance − 0.0135 * HR:DB |
| Leaves wet mass | 0.89 | 0.84 | =0.5612 + 0.3854 * Distance | =0.3784 + 0.7295 * Distance |
| Response | R2 | Pred-R2 | Equation | |
| White = YES | White = NO | |||
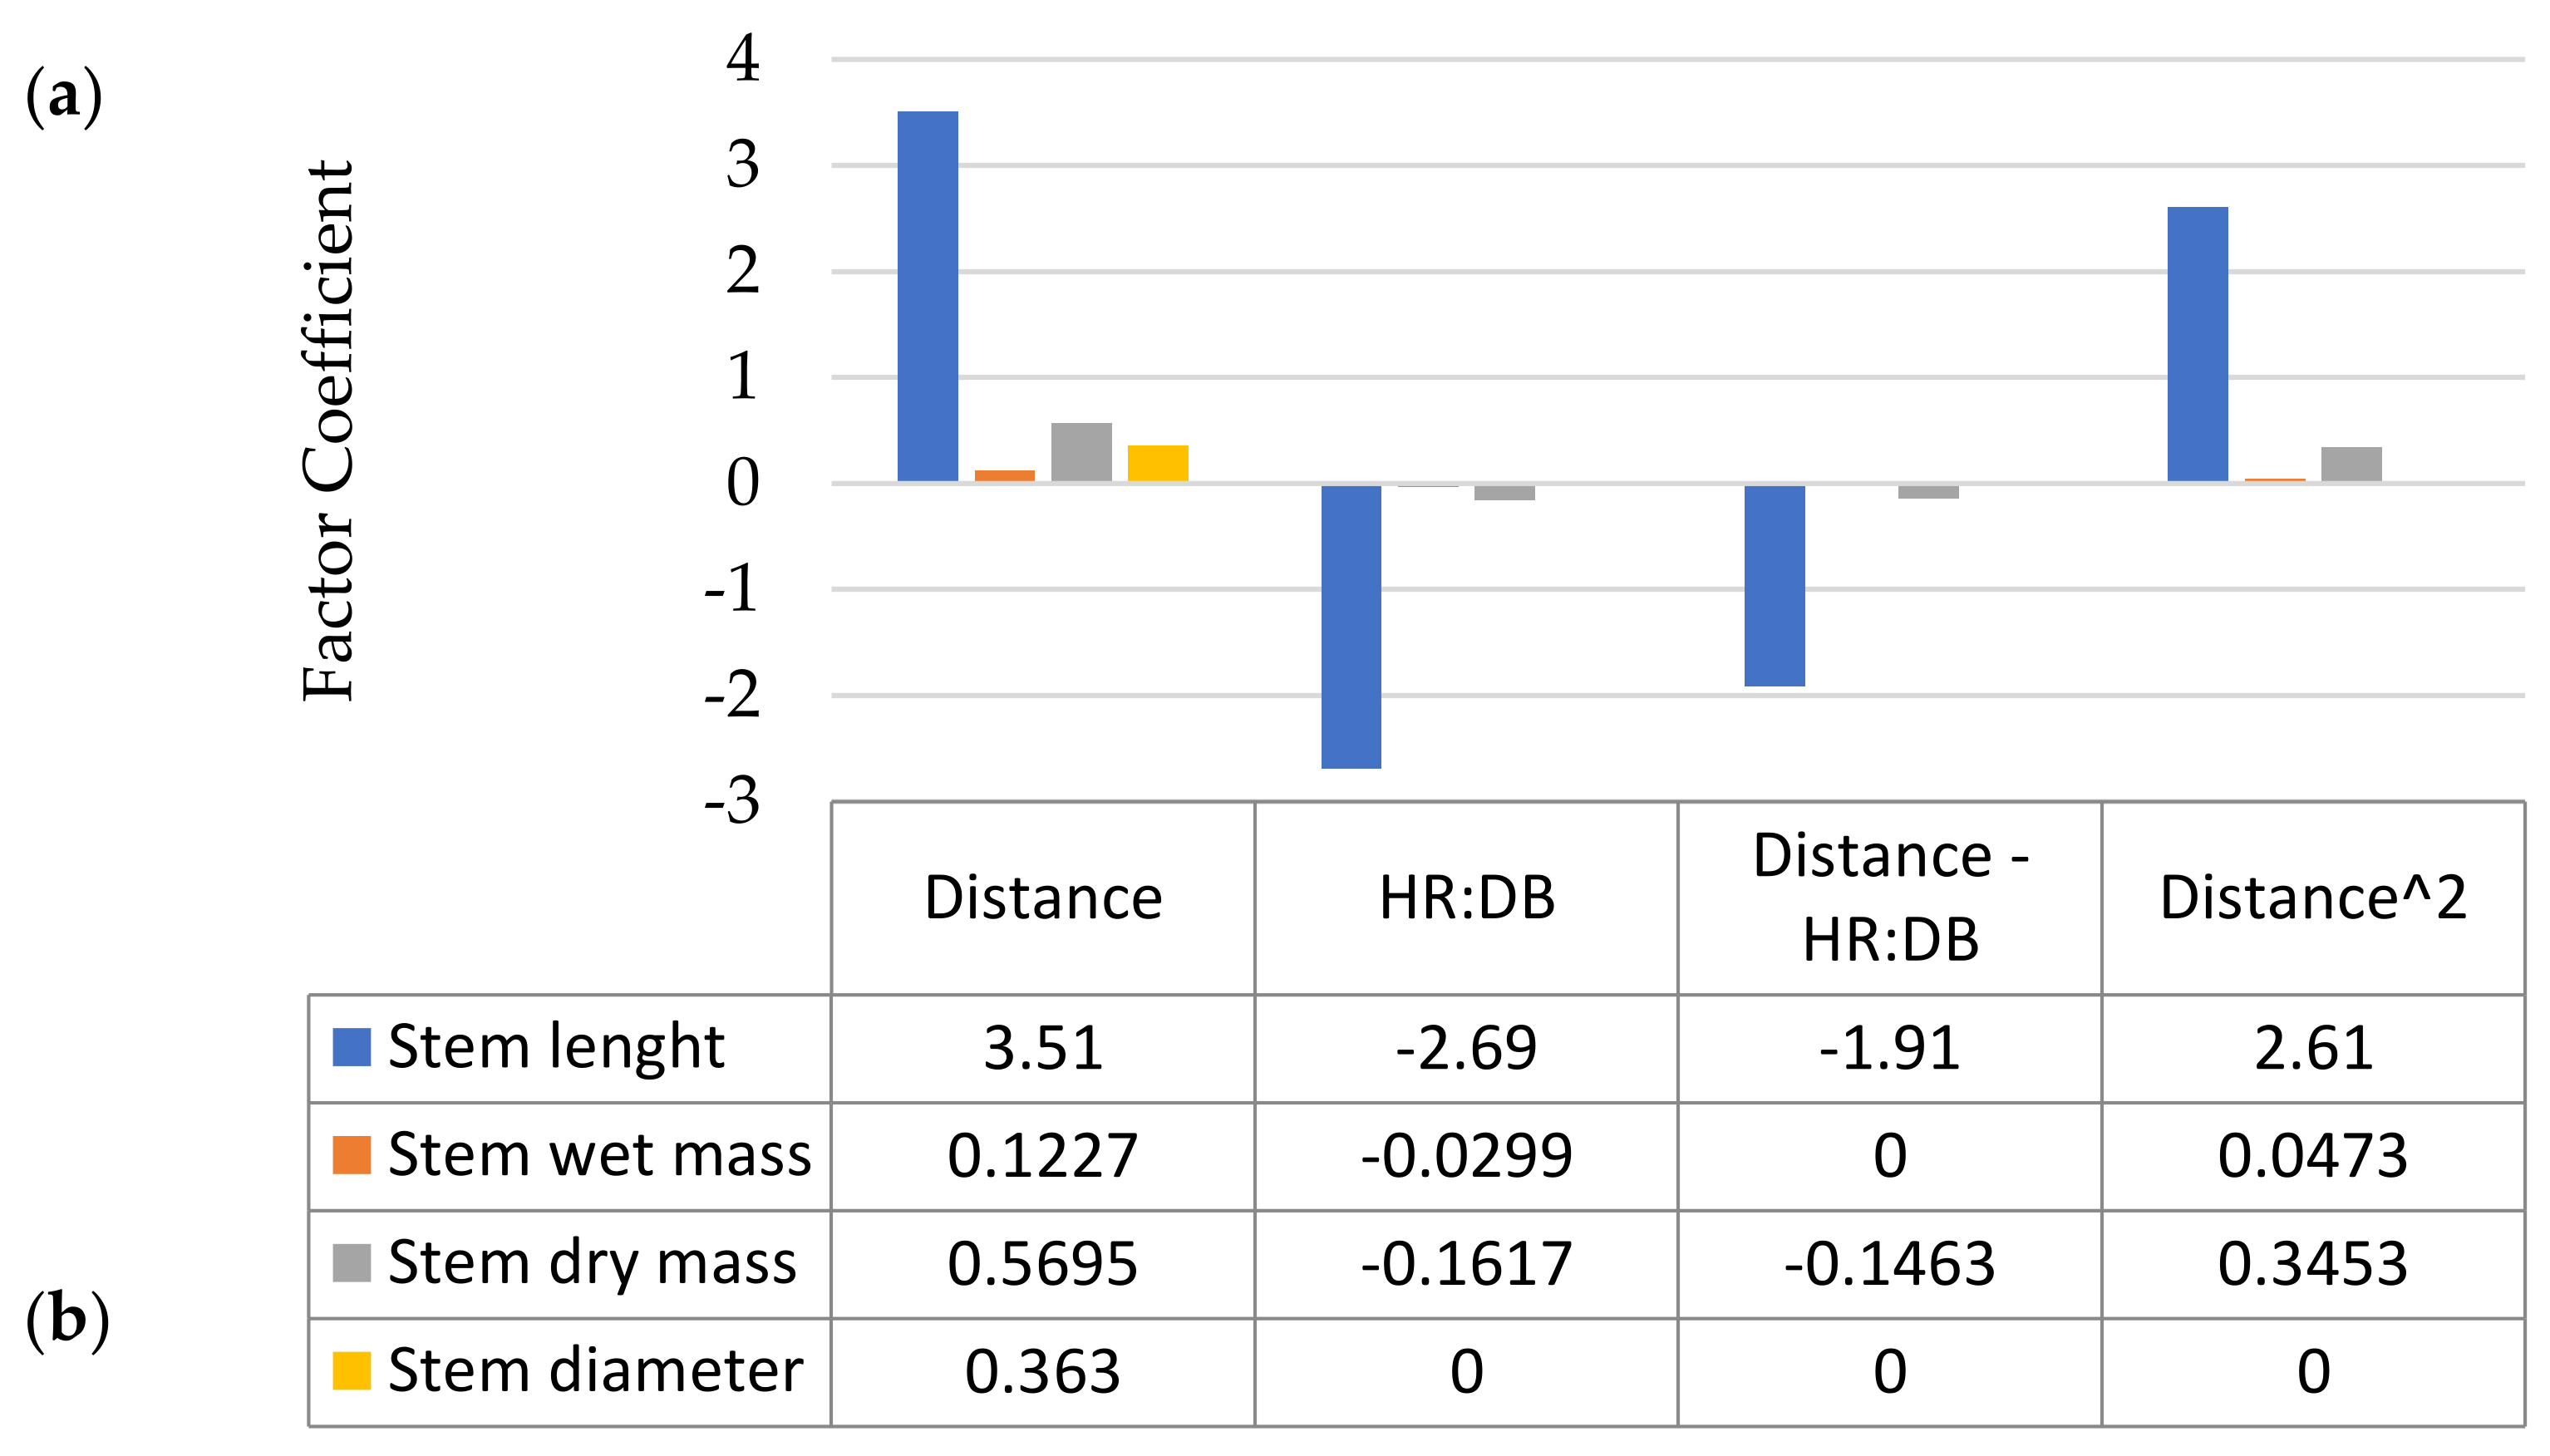
| Stem length | 0.86 | 0.76 | =20.8343 + 8.1046 * Distance + 0.0086 * HR:DB − 0.1563 * Distance * HR:DB 6.6094 * Distance2 | |
| Stem wet mass | 0.87 | 0.81 | =0.1941 + 0.0280 * Distance − 0.0011 * HR:DB + 0.0473 * Distance2 | |
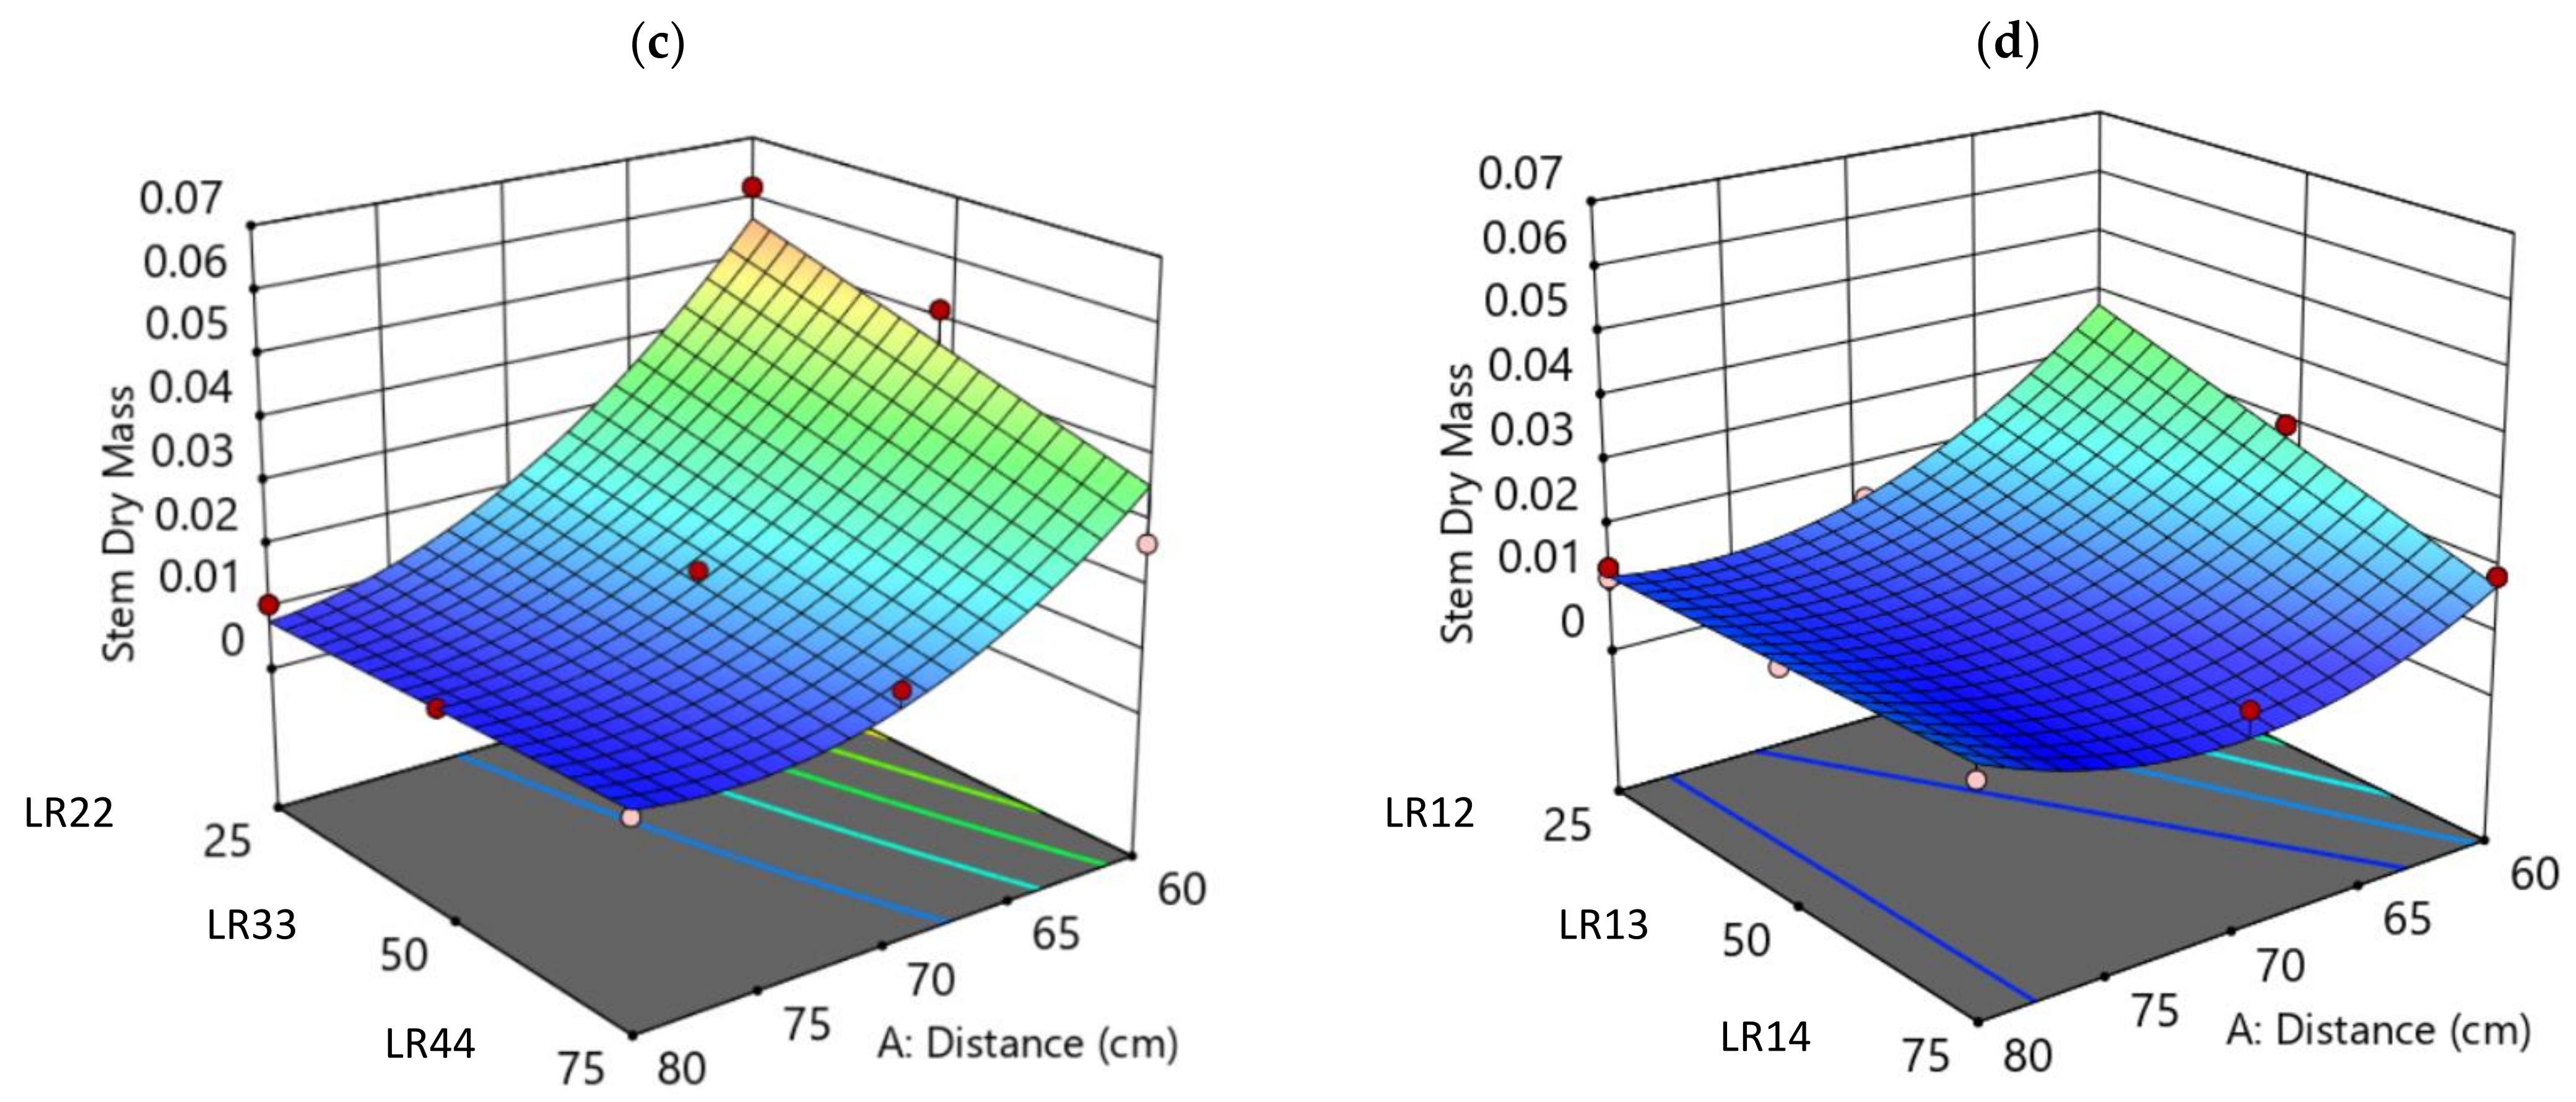
| Stem dry mass | 0.94 | 0.88 | =−4.4016 − 0.0272 * Distance − 0.0006 * HR:DB − 0.0058 * Distance * HR:DB + 0.3453 * Distance2 | =−4.5812 + 0.3701 * Distance − 0.0006 * HR:DB − 0.0058 * Distance * HR:DB + 0.3453 * Distance2 |
| Stem diameter | 0.83 | 0.76 | =1.7462 + 0.2290 * Distance | =1.5396 + 0.4969 * Distance |
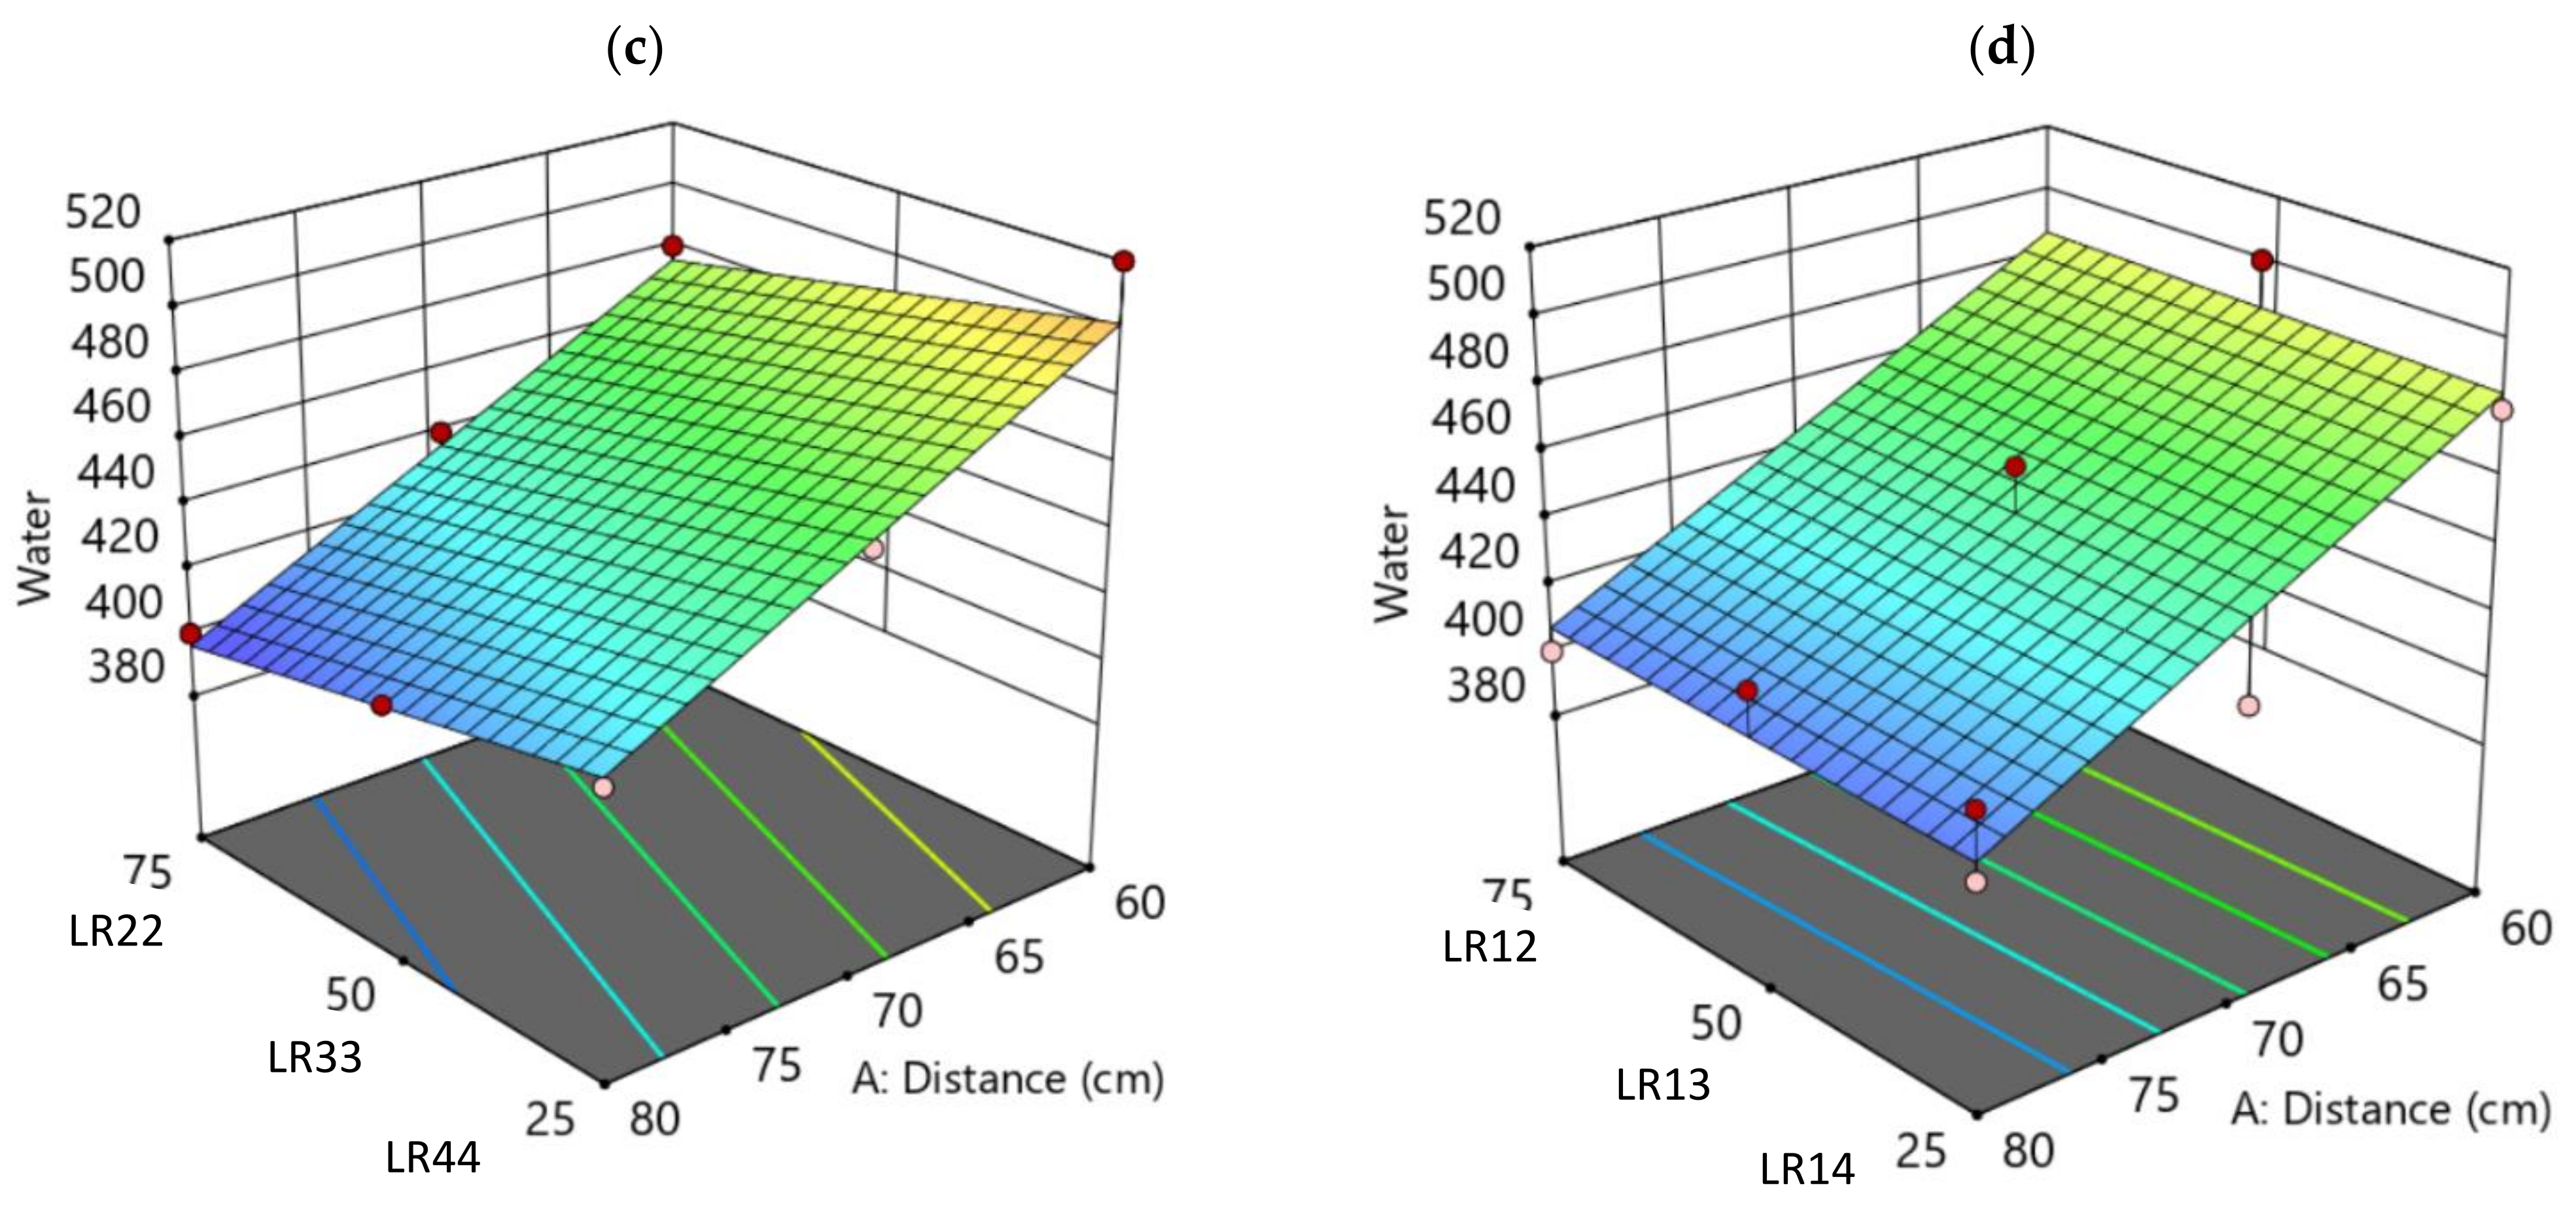
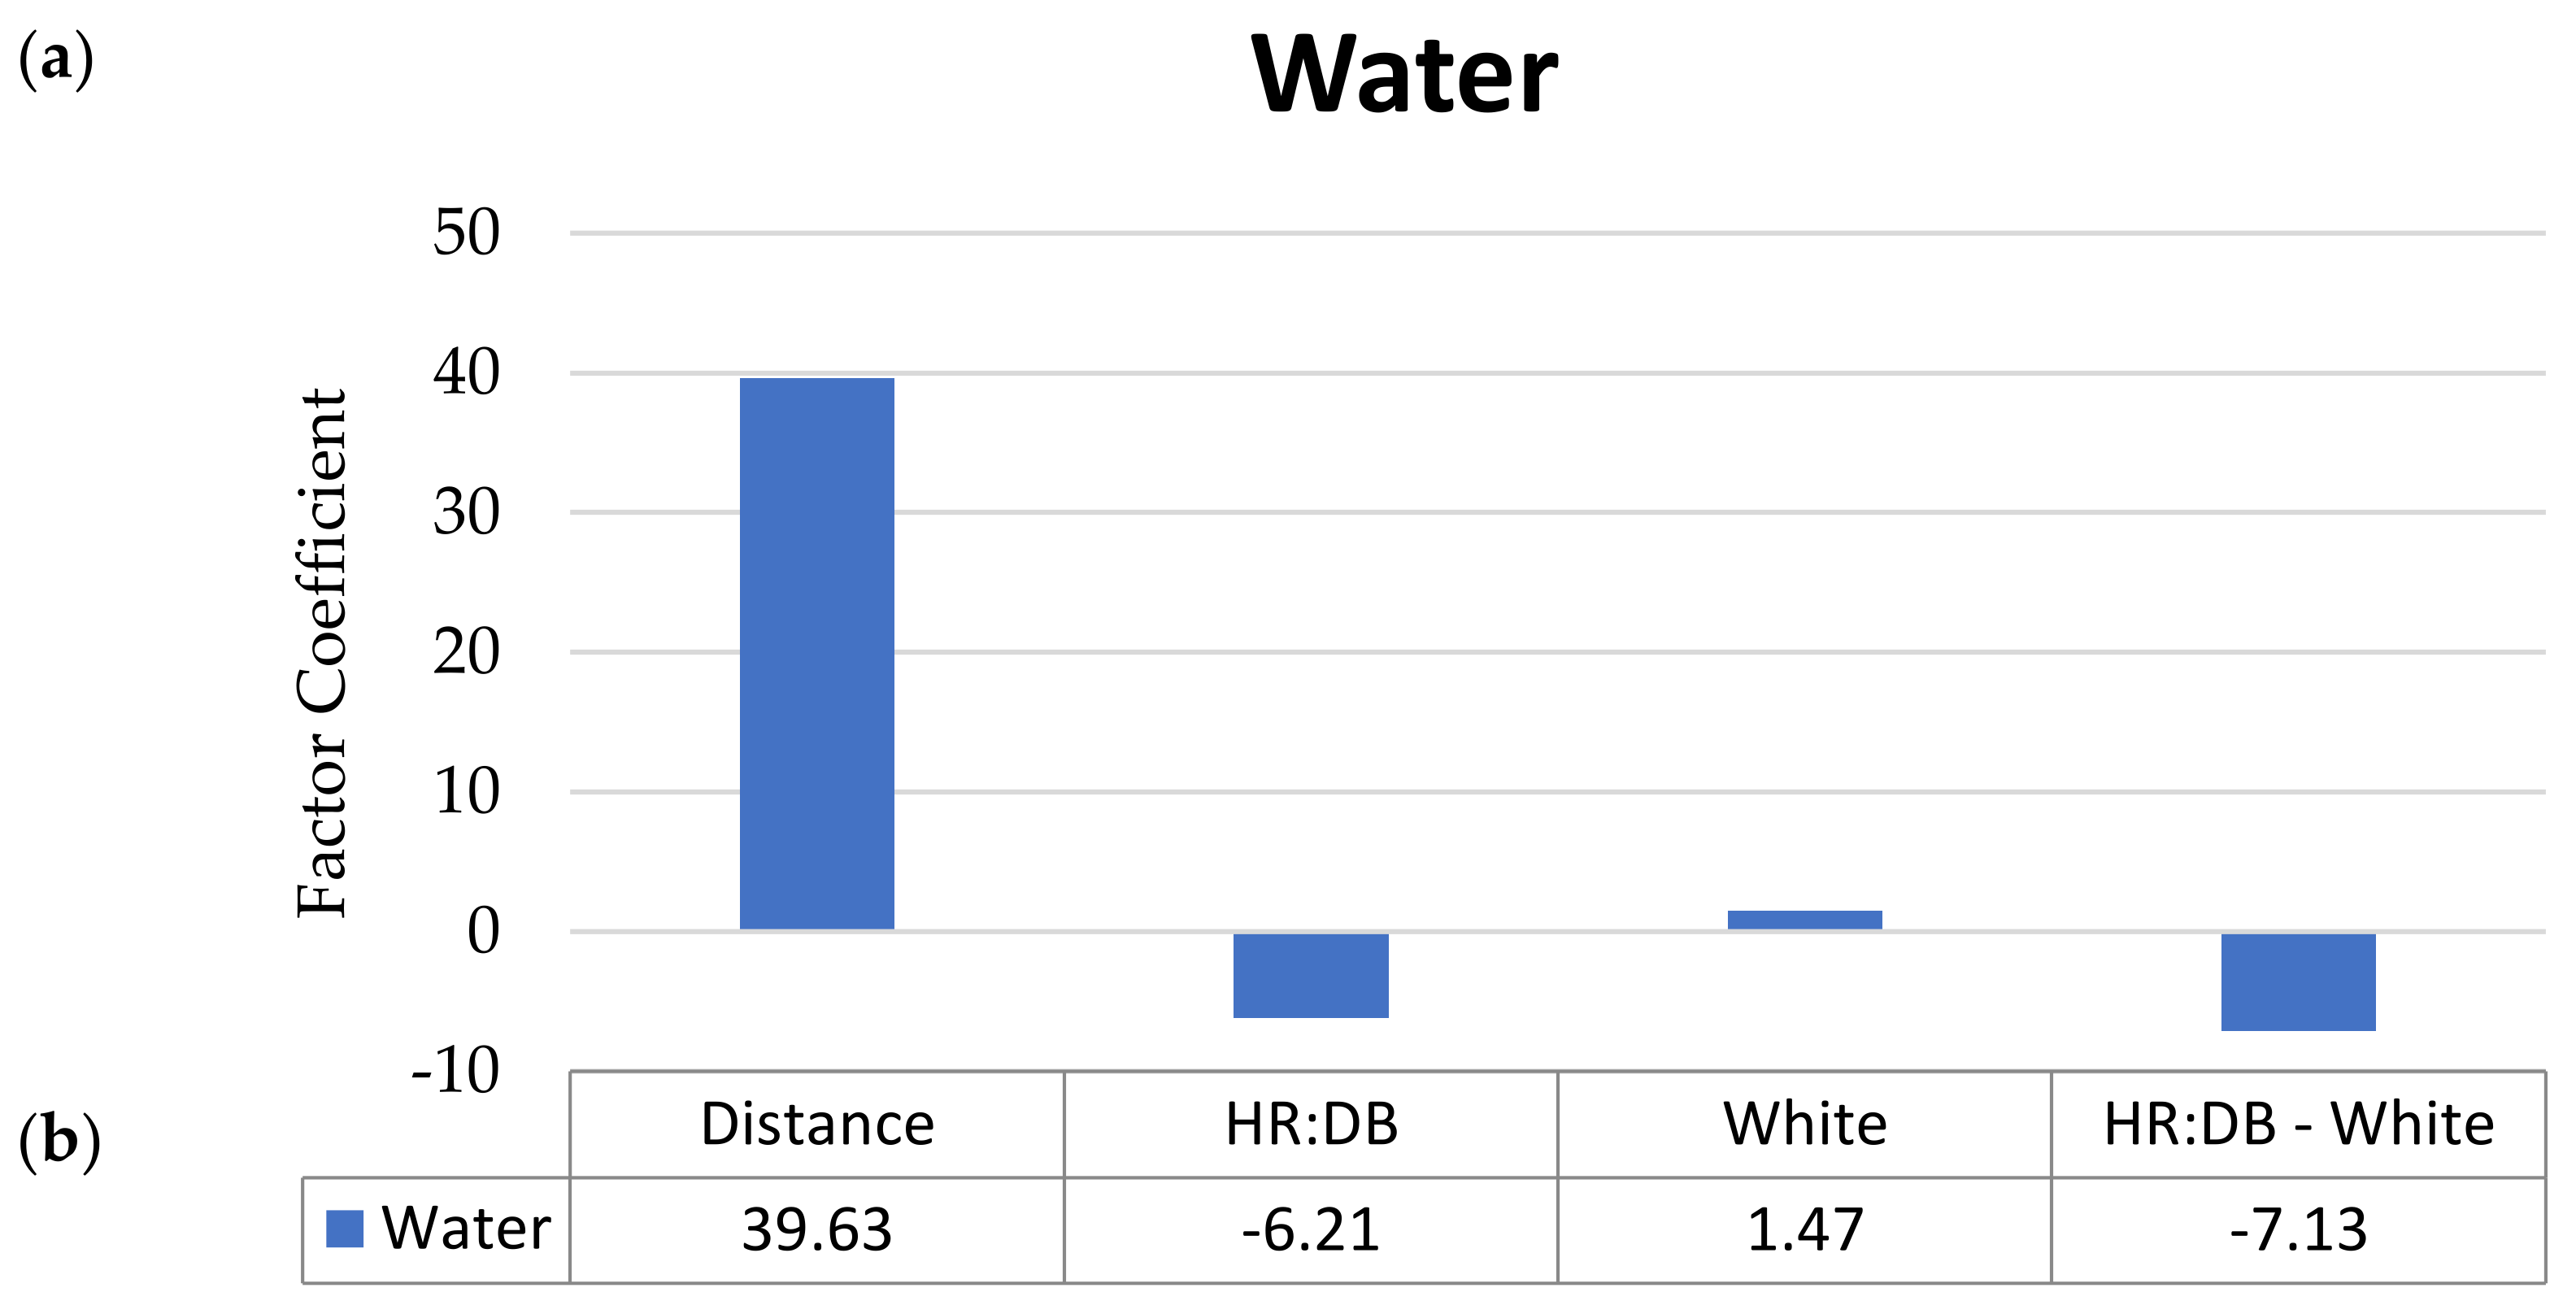
| Water | 0.90 | 0.83 | =404.5918 + 39.6258 * Distance + 0.0367 * HR:DB | =436.0408 + 39.6258 * Distance − 0.5333 * HR:DB |
| Responses | Goal | Importance |
|---|---|---|
| Height | maximize | 4 |
| Wet mass | maximize | 5 |
| Dry mass | maximize | 4 |
| LAI | maximize | 4 |
| SLA | maximize | 5 |
| Number of leaves | maximize | 4 |
| Leaves wet mass | maximize | 3 |
| Stem lenght | maximize | 3 |
| Stem wet mass | In range | 3 |
| Stem dry mass | In range | 3 |
| Stem diameter | maximize | 2 |
| Water | minimize | 5 |
Publisher’s Note: MDPI stays neutral with regard to jurisdictional claims in published maps and institutional affiliations. |
© 2021 by the authors. Licensee MDPI, Basel, Switzerland. This article is an open access article distributed under the terms and conditions of the Creative Commons Attribution (CC BY) license (https://creativecommons.org/licenses/by/4.0/).
Share and Cite
Barbi, S.; Barbieri, F.; Bertacchini, A.; Montorsi, M. Statistical Optimization of a Hyper Red, Deep Blue, and White LEDs Light Combination for Controlled Basil Horticulture. Appl. Sci. 2021, 11, 9279. https://0-doi-org.brum.beds.ac.uk/10.3390/app11199279
Barbi S, Barbieri F, Bertacchini A, Montorsi M. Statistical Optimization of a Hyper Red, Deep Blue, and White LEDs Light Combination for Controlled Basil Horticulture. Applied Sciences. 2021; 11(19):9279. https://0-doi-org.brum.beds.ac.uk/10.3390/app11199279
Chicago/Turabian StyleBarbi, Silvia, Francesco Barbieri, Alessandro Bertacchini, and Monia Montorsi. 2021. "Statistical Optimization of a Hyper Red, Deep Blue, and White LEDs Light Combination for Controlled Basil Horticulture" Applied Sciences 11, no. 19: 9279. https://0-doi-org.brum.beds.ac.uk/10.3390/app11199279