Article

I Explain, You Collaborate, He Cheats: An Empirical Study with Social Network Analysis of Study Groups in a Computer Programming Subject

by
Beatriz Barros
*,
Ricardo Conejo
,
Amparo Ruiz-Sepulveda
and
Francisco Triguero-Ruiz
Department of Languages and Computer Science, University of Malaga, 29071 Málaga, Spain
*
Author to whom correspondence should be addressed.
Submission received: 19 August 2021 / Revised: 27 September 2021 / Accepted: 27 September 2021 / Published: 8 October 2021
(This article belongs to the Special Issue Social Network Analysis)

Abstract

:
Students interact with each other in order to solve computer science programming assignments. Group work is encouraged because it has been proven to be beneficial to the learning process. However, sometimes, collaboration might be confused with dishonest behaviours. This article aimed to quantitatively discern between both cases. We collected code similarity measures from students over four academic years and analysed them using statistical and social network analyses. Three studies were carried out: an analysis of the knowledge flow to identify dishonest behaviour, an analysis of the structure of the social organisation of study groups and an assessment of the relationship between successful students and social behaviour. Continuous dishonest behaviour in students is not as alarming as many studies suggest, probably due to the strict control, automatic plagiarism detection and high penalties for unethical behaviour. The boundary between both is given by the amount of similar content and regularity along the course. Three types of study groups were identified. We also found that the best performing groups were not made up of the best individual students but of students with different levels of knowledge and stronger relationships. The best students were usually the central nodes of those groups.

1. Introduction

Studying in university involves class attendance, individual work and group work. Students interact in and out of the classroom because of previous friendships, affinities or the need for social interaction to study and to be part of the university community. Therefore, group work is usually inherent in the study process, both in the study of theory and in the implementation of practical exercises.
Students communicate, help each other and exchange knowledge (and it has always been so, although by other means). Thus, information interchange is very beneficial to the learning process. At the same time, teachers can encourage and promote group work, and they try to create situations in which collaboration is necessary, i.e., go beyond group work and foster communication, reflection and the construction of knowledge among students. All these technologies favour knowledge sharing and improve individual learning. In a broad sense, technology helps to maintain active learning communities. Unlike other configurations relating to group learning, in our case, the teacher does not organise the groups, the task or any communication tools. Groups and collaboration arise at the initiative of students when they study and do their assignments. This is called spontaneous collaborative learning (SCOLL) [1]. Its main features are that collaboration is not organised or initiated by the teacher but arises from students’ finding a benefit in it; groups are usually small and stable throughout the course; communication may or may not be mediated by technology.
Group work is encouraged and promoted, but after several years of observing the students, from the results, this promotion of collaboration is mistaken by some students as an open door for dishonest behaviour such as cheating, copying or colluding. We cannot really speak of misunderstanding or confusion, even though that is the excuse the student offers when caught in such a situation. Plagiarism and other dishonest behaviours are alarming at university, especially in computer science studies, as has been highlighted by other studies and journalists [2,3,4]. As teachers, we ask ourselves: where is the boundary among help, collaboration and plagiarism? Can we establish conditions or indicators that help to distinguish between the legitimate and the deceitful? These are the same questions addressed in [5]. In this case, three levels were posed—collaboration, collusion and plagiarism—and the boundaries among them were discussed. Its author concluded that the bounds vary depending on the assignment and the course policy. It ultimately resolved that professors should establish and clearly state what the boundaries are so that programming students know the course rules and are sure that they are not acting unethically. This conclusion is correct, but it is still fuzzy and not quantifiable. The present paper tries to shed light on this situation in a subject similar to the one addressed by Fraser’s article [5] with quantitative methods and real data.
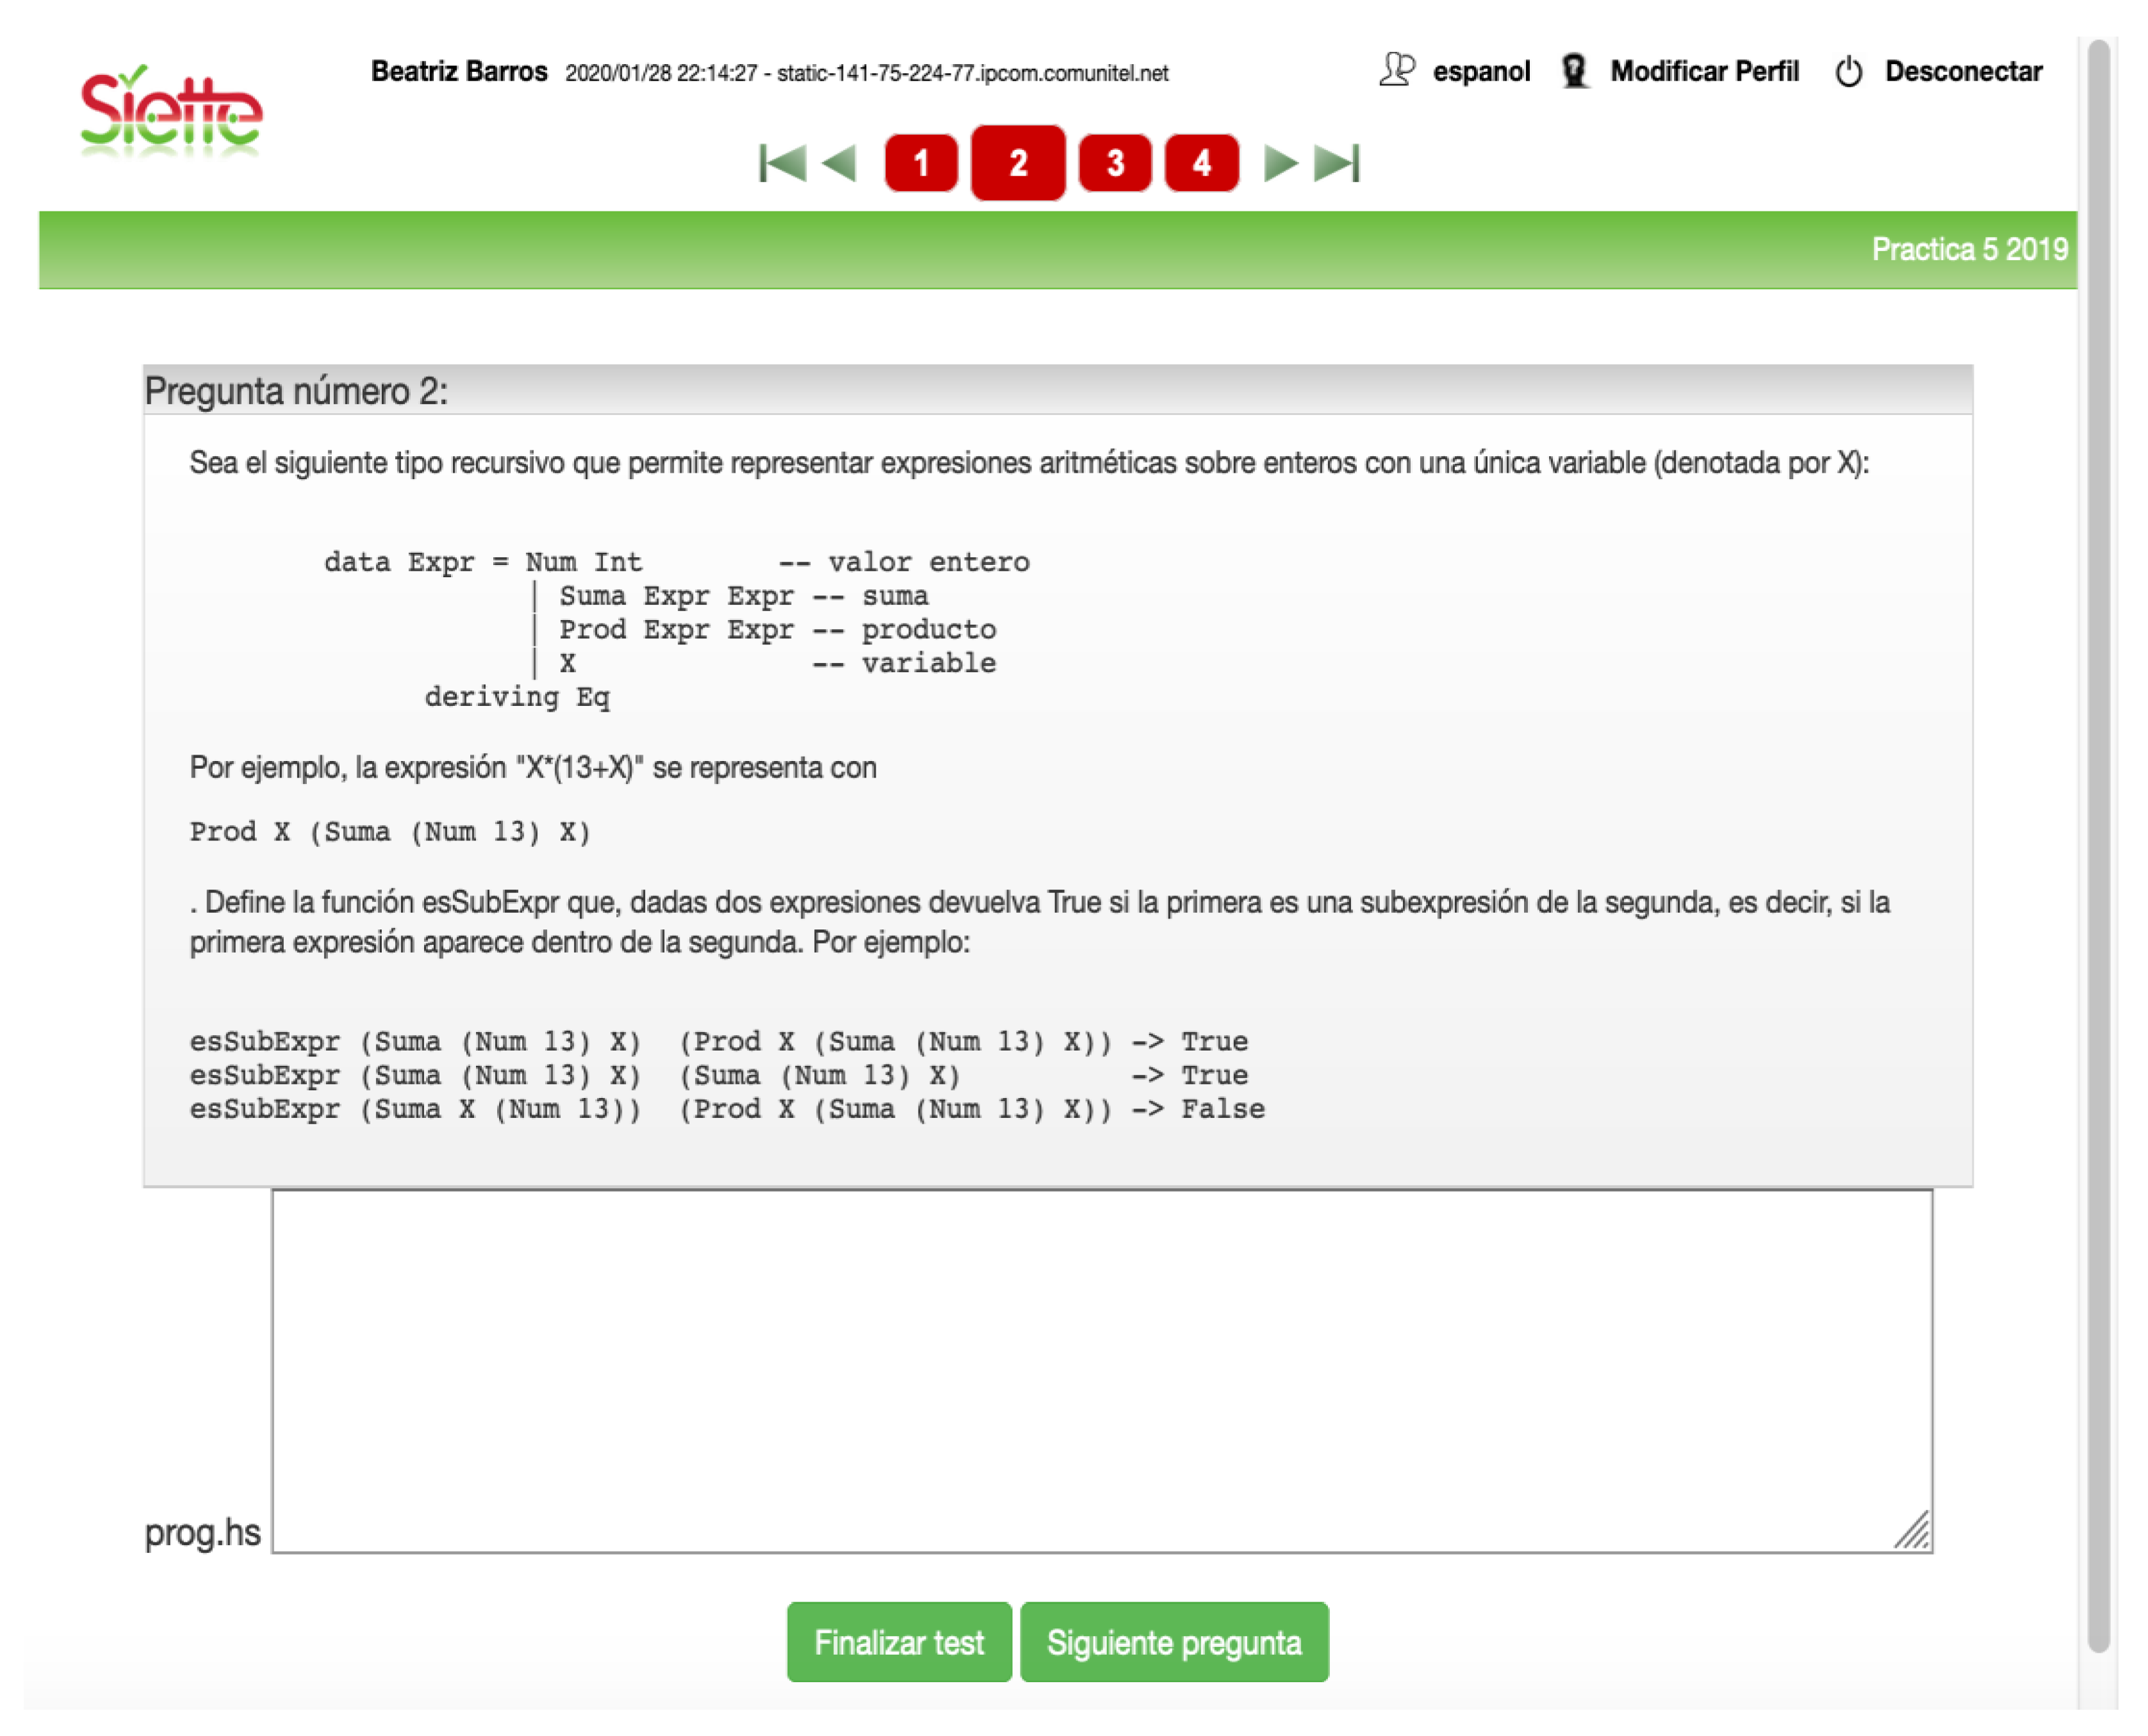
We present a study conducted over four years with Introduction to Programming, a first-year course in the Bachelor of Mathematics that uses Haskell as a programming language. The aim of the paper was to observe how group studies are formed and how they are organised over the course of an academic year. As a result, this article studies and characterises how students construct solutions to their practical programming tasks. Our method consists of looking for similarities among students’ solutions using automatic tools. We looked for answers to the following research questions:
  • Is it possible to quantify how students share knowledge in a classroom through SCOLL? How much of the work is entirely individual and how much is done with classmates?
  • Is it possible to identify study groups in a classroom? How large are they? Do they have ethical behaviour?
  • How are successful learners organised? How do they interact with their classmates in the classroom? Are they members of the study groups?
The rest of the paper is organised as follows: in the next section, a short literature review of topics related to the paper is presented. Then, in 
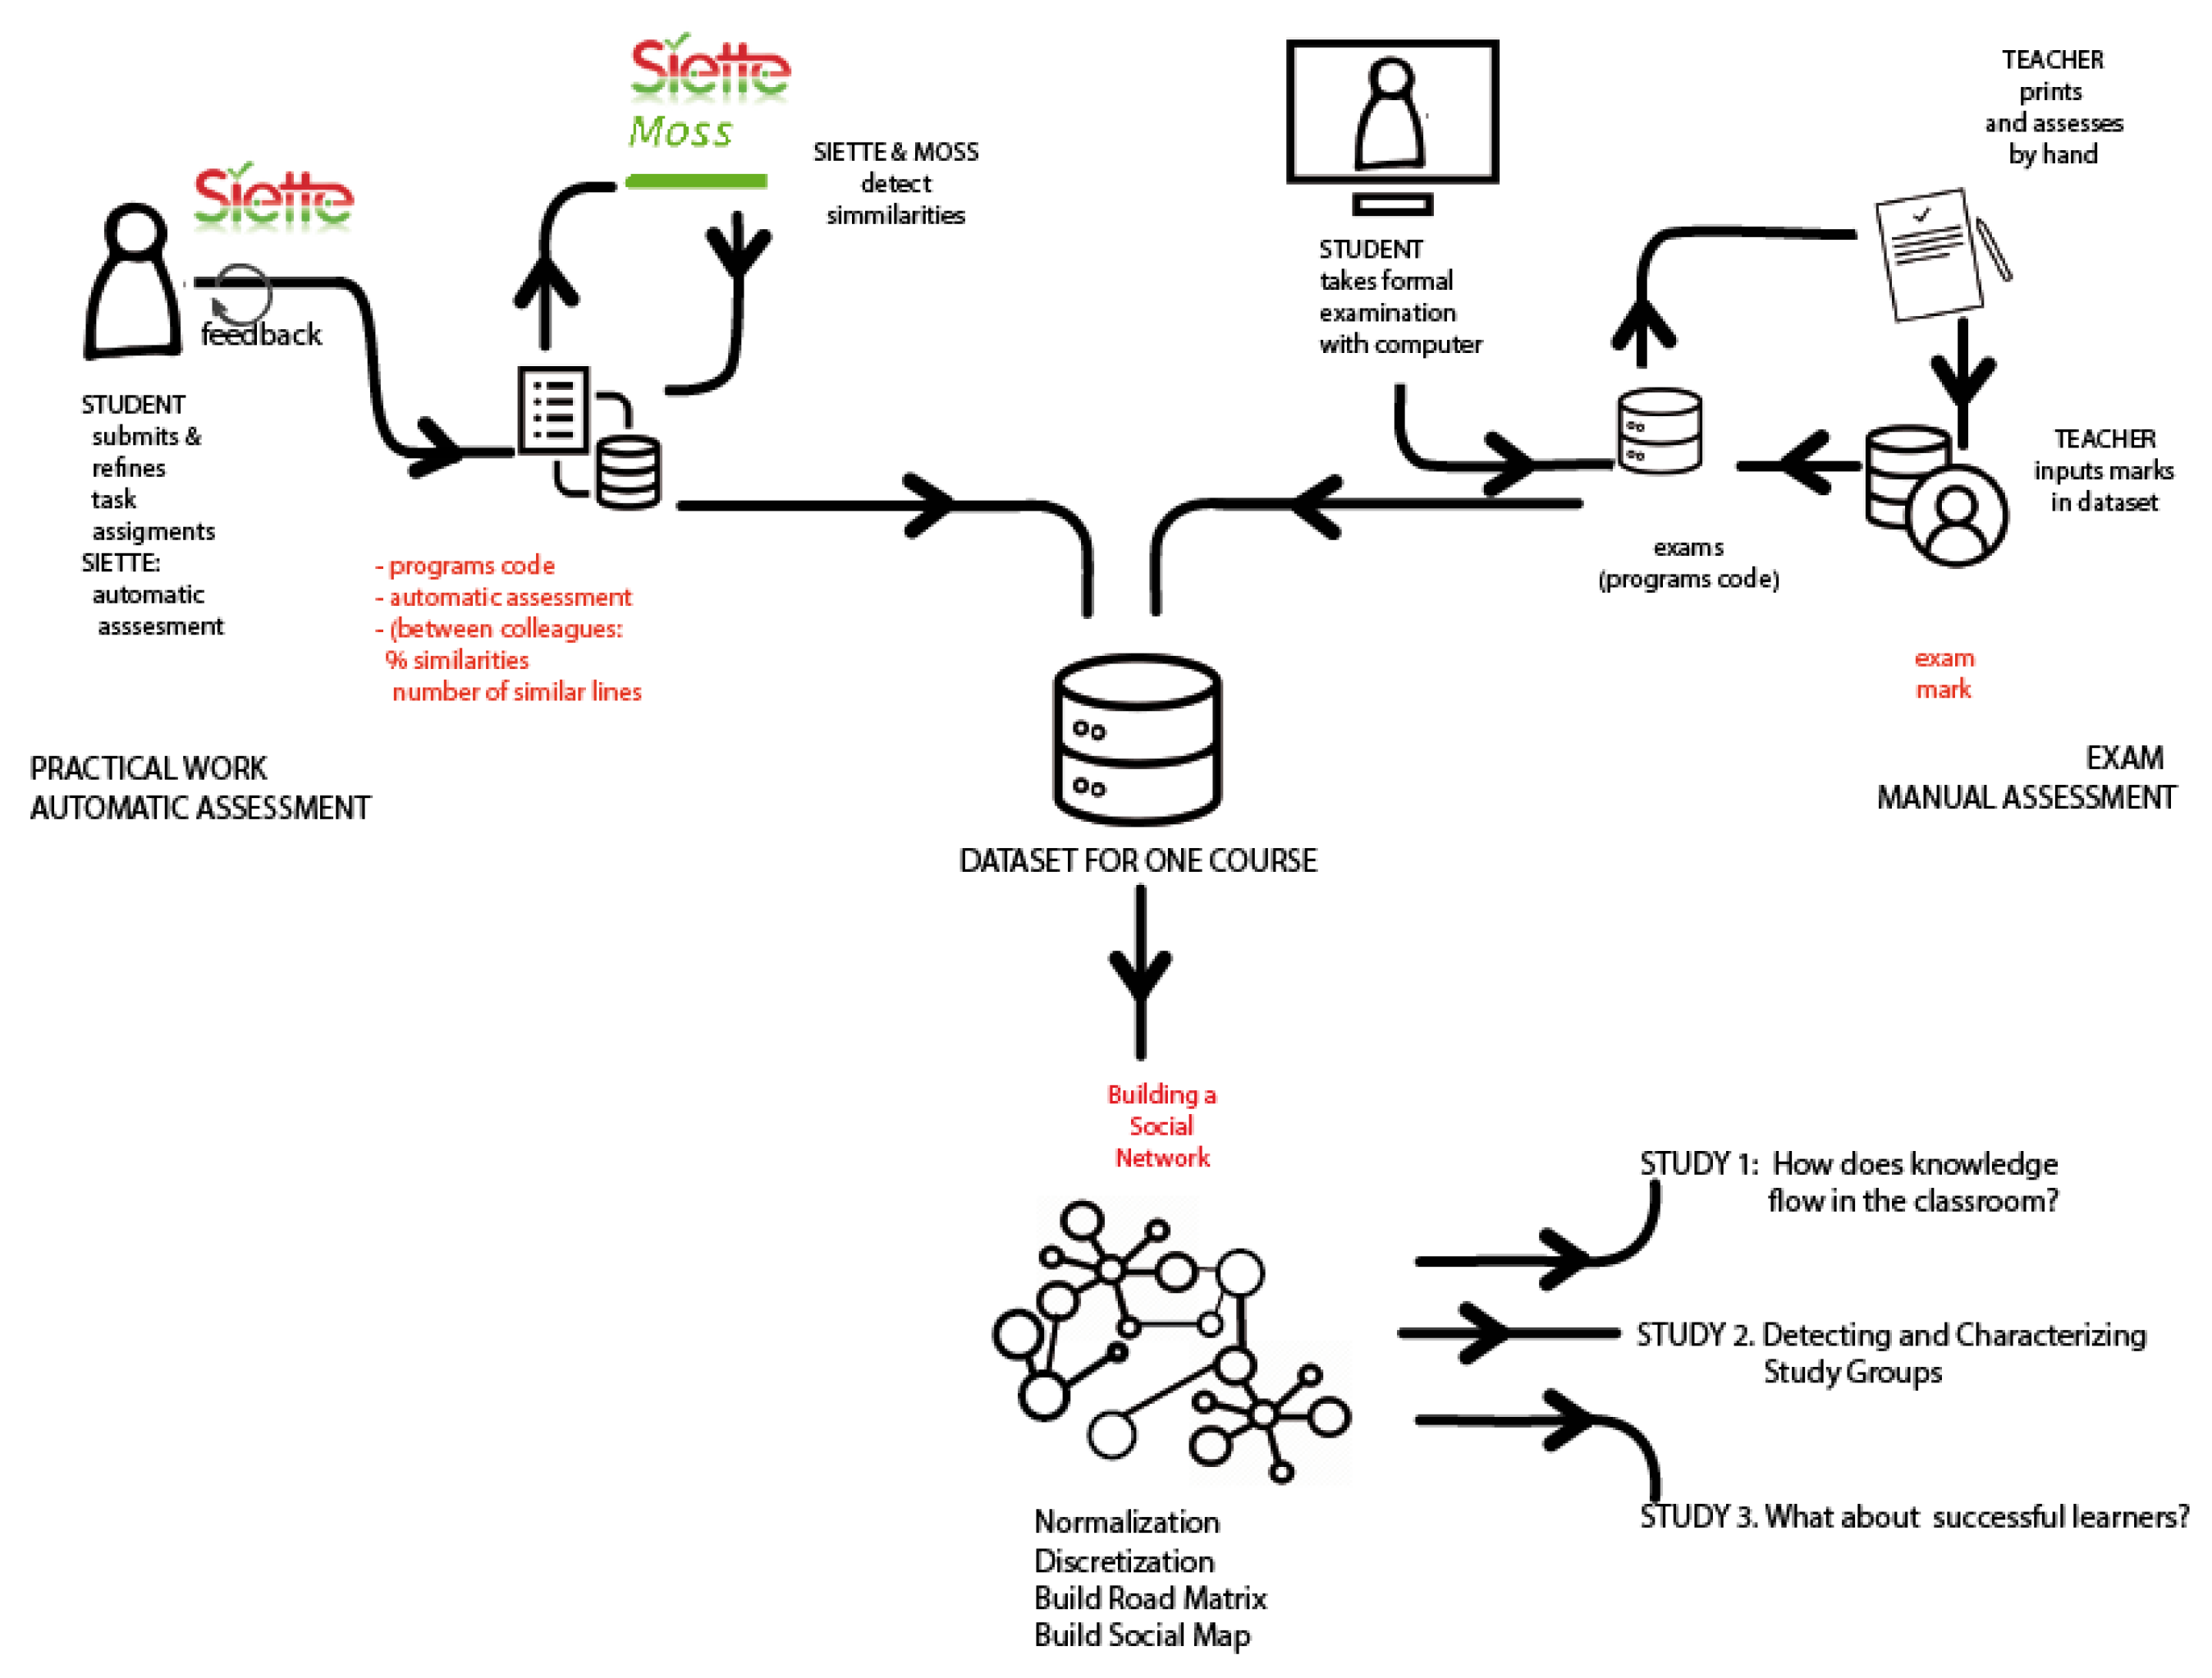
Section 3, we describe the tools and methodology followed in the collection and analysis of data for our study. Section 4 discusses the results obtained for each research question in studies 1, 2 and 3, respectively. The article ends with a set of conclusions and recommendations.

2. Literature Review

Automatic correction mechanisms and similarity detection were used to establish relationships between pairs of students. Social network analysis (SNA) and other data analysis tools were used to study what these groups were like. With all this information, we will tried to outline where the difference lies between students’ collaboration and dishonest behaviour when solving programming exercises.

2.1. Automatic Assessment of Program Assignments and Plagiarism Detection

Programming is a practical task. Automatic evaluation and punctuation of programming assignments is a complex activity. Several surveys, such as in [1,6,7,8] and recently in [9], summarised the functionalities of systems designed to carry out automatic assessment of practical assignments. Evaluation is usually carried out with a set of tests to which the student’s work is subjected, and according to the tests that are passed, a score is given.
In this article, we used the MOSS [10] software’s similarity detection. There were other options, such as Checksims [11], CODESIGHT [12], SID [13] or JPlag [14]. We used MOSS because it has a module specifically for the Haskell language and has interoperability options to integrate it with SIETTE. MOSS works on the basis of the search for similarities by the number of lines, number of spaces, control structures, change in variable names or structure of programs and aspects that allow you to see not only the copy but, in part, the programming style. This program is described briefly in Section 3.2.2. This paper does not make any contribution to the Automatic Assessment of Program Assignments and Plagiarism Detection.

2.2. Social Relationships and Social Network Analysis in Higher Education

Techniques derived from SNA [15] are widely used to identify communities of all kinds and are of great use in education [16]. There are many studies in classrooms [17], massive online open courses (MOOCs) [18,19] or entire universities [20]. SNAs can be used to identify the level of engagement students have with online learning [21]; study classroom interactions [22]; place students of a subject in face-to-face exams, minimizing student cheating [23]; to detect friends on campus [20], among many other applications. Some of these works are for communities in the order of hundreds of people, and others are for larger communities, in the order of thousands of people. The type of measurements and algorithms are different. Our research was of the former type—our groups were in the order of less than two hundred students.
As far as we know, there are no other previous studies that use plagiarism data or work similarity measures as a source for SNA to elucidate relationships among students.

2.3. Academic Dishonesty

There are unethical behaviours that are part of university studies, especially when it comes to copying or misusing the work of others. Dishonest behaviour is sometimes considered as limited to plagiarism, but this is not exact. There are several nuances and related concepts that will be described below and that were taken into account in the experimental study to which this article refers.
The first concept to address is common knowledge. It ”refers to information that the average, educated reader would accept as reliable without having to look it up” [24]. This is part of the knowledge of a subject that is handled by all students, and its use does not indicate bad practices in any case.
In [25], plagiarism is defined as “the passing off of another person’s work as if it were one’s own, by claiming credit for something that was actually done by someone else”. They identified four categories: accidental, unintentional, intentional and self-plagiarism.
Another nuance is collusion, in which [5] states that “collusion may be regarded as the middle ground in a spectrum of practices ranging from collaboration to outright plagiarism, and it is best defined as unpermitted collaboration”. It can be understood as “the passing off of another’s work as one’s own for one’s own benefit and in order to deceive another. Collusion is a form of plagiarism” [26].
Thirdly, there is cheating. It can be defined as “pretending that somebody else’s work is yours so that you can get a higher mark than your own work merits” [27]. In the academic world, cheating is associated with the theft of ideas and/or material for personal gain, primarily a better score. “Cheating takes place only when there is an intention to commit this act. So, it is a dishonest act with intention” [28]. Cheating includes, among others, copying, using non-permitted resources or using someone else’s work [27].
Finally, academic misconduct can be defined as “the abuse of academic conventions; the use of dishonest academic behaviour to one’s own benefit. The term includes examination cheating, plagiarism and collusion” [26,29].
There are many studies on plagiarism and unethical behaviour in document writing (recent examples include Taerungruang [30] and Chauhan [31]) or computer programming. It is true that program writing can be equated in some ways with document writing but only to a certain degree. This is because the writing of programs (coding) is related to the design of solutions, structuring of problems, efficiency of the result, to name a few. Source-code similarity detection and source-code plagiarism [32] have been studied for more than thirty years by Hall and Martin, Faidhi and Robinson, Lancaster and Culwin, Lukashenko et al., Novak et al. and Karnalim and Simon [29,33,34,35,36,37], among others. They have provided a rich variety of solutions based on conceptual models, mathematical models, artificial intelligence or a combination of several techniques.
Other interesting aspects concern the frameworks that formalise academic ethics [38], the motivation and reasons of students in relation to this issue [39,40] and the relationship between the two [41].
Most previous studies in this area are qualitative and are based on observational data collected manually. This article took a quantitative approach and tried to automatically determine the boundaries between ethical and unethical behaviour obtained from students’ work similarities over time.

3. Materials and Methods

3.1. Participants

Students in this study were from a first-year subject in the Faculty of Mathematics and were aged 18–20. Data were collected from one course. Data collected over four school years were analysed in this study, and a total of 459 authors were considered. Students were represented as two different authors if they repeated the course. The study involved a total of 315 students—189 men and 126 women. These students carried out a total of 6 practical assignments, each one with 5-8 programs on average. They used the university’s virtual campus to access their subjects, in our case, “Introduction to Haskell Programming”. Students began the study of the subject without prior programming knowledge. It was the first semester of the first year of their university degree, which meant that the majority did not know each other before the beginning of the course. The data analysed were from the years 2015–2016, 2016–2017, 2017–2018 and 2018–2019. Data from the 2019–2020 academic year were not considered. This was because the course was not carried out in the same way as the others due to the COVID-19 health emergency’s mobility restrictions.

3.2. Instruments and Settings

In this research, we used several instruments. On the one hand, the SIETTE [42] framework assessed the students’ practices and implemented a web call to the MOSS plagiarism detection tool. It is described in Section 3.2.2. Then, social network analyses with NodeXL (NodeXL Basic (http://nodexl.codplex.com accessed on 19 August 2021) from the Social Media Research Foundation (http://www.amfoundation.org accessed on 19 August 2021)) [43] were used to calculate indicators and elements necessary for our analysis.

3.2.1. Formalisation of the Evaluation Space

We differentiated between students and authors. A given student can be represented as two different authors if they participate in two different courses. This happens whenever a student does not pass the course and must repeat it the next academic year.
First, we performed a formal characterisation to identify the different elements involved in the interaction process. We considered an examination space as an n-tuple S = {A, e, d, c, q, s, iv, g}, where:
A is the set of authors: A = {ai, i = 1…nA};
e is the set of program exercises (assignments) to be answered: e = {ek, k = 1…ne};
d is the set of answers to the different exercises of e: d = {dki, k = 1…np; I = 1…nA}; they are referred to as documents;
c is a classification category for each pair of matched documents: c = {Cm, m = 1…nC}; when two documents are compared, two percentages of similarity are returned (comparing the proportion of one document included in the other and vice versa); those percentages were discretised and summarised into these classes with the following interpretation: C1 = no relation; C2 = weak relation; C3 = strong relation; C4 = obvious copy;
q represents a set of behaviour categories: q = {Qindividuals, Qsoft, Qhard, Qcheat} of network nodes;
s is the final score obtained by each author: s = {si, i = 1…nA}; it is a number in the interval [0,10], which is the scale used in the Spanish academic system;
iv represents the set of discrete values of the intensity of a mutual relationship;
g represents a set of clusters of authors: g = {1, …, ng}.
Given S, we can now establish the relationships between its elements, ℕ being the set of natural numbers. Let F be the set of functions, F = {Auth, Sol, Similar, Similar_cod, Similar Intensity, Author_behaviour, Path_matrix, Group}, being:
Sol: A × ed. This function assigns the answer of the author to a given exercise. This is called a document throughout this article.
Auth: dA. This auxiliary function assigns its author to each document.
Similar: d × d → [0,1] × [0,1] × {null, left, right}. This function assigns to each pair of documents the two percentages of similarity and the orientation of the potential copy. This is discussed in Section 3.3.1.
Similar_intensity: [0,1] × [0,1] × {null, left, right} → iv. This function assigns an intensity value for each pair of document similarity percentages. It is a measure of the strength of the relationship between both.
Similar_cod: ivc. This function transforms the intensity value into a classification category. Compounding Similar_intensity and Similar_cod, a classification category can be obtained for each pair of documents. This is detailed in Section 3.3.1.
Author_behaviour: Aq. Author_behaviour assigns a behaviour category to each author, taking into account the average of all the intensity values of all documents authored by A and any other author. This is detailed in Section 3.3.2.
Path_matrix: A × A × q → {0, 1}. Path_matrix(a, b, Qm) = {1, if exists dia, djb, Auth(dia) = a and Auth(dib) = b | Similar_cod(dia, djb) = Qm; 0 otherwise}.
Group: Ag. The Group function assigns a cluster to each author.
For all assignments solved by an author, it is possible to obtain, by composing the appropriate functions, data such as:
Authors whose documents have a Cm-like classification category:
{aiA such that exist ajA and exist k∊e where (Similar_code○Similar_intensity○Similar)(dki,dkj) = Cm}
A set of authors with a Qk-like behaviour category:
{aiA such that Author_behaviour(ai) = Qk}.
We note here that there were two basic elements in our approach: the documents and the authors. The Author_behaviour function aggregated the documents of an author and established a behaviour category for that author. The Similar_cod function established a classification category for each document relationship. We detail this feature in the construction of the social network (Section 3.2.2.).
In this paper, we speak of a direct relationship when there is a meaningful connection (soft, hard or cheat) between two learners. There is a mediated relationship between two learners when there are one or more individuals in between (i.e., one can go from one learner to another through the network, and there are one or more nodes between them) and a mixed one when two learners are related both with a direct relationship and with some intermediary relationship.

3.2.2. Automatic Detection of Similarities with SIETTE and MOSS

SIETTE [9] is a framework used to collect and correct the students’ exercises. SIETTE is also connected to the MOSS [10] system to compare the code of all the students’ exercises and to generate the relationships between them according to the degree of similarity of their files.
The procedure is as follows: Students send their solutions to the practical exercises using SIETTE. Subsequently, the solution is delivered to each practice question (Figure 1); then, the system compiles the solution and automatically evaluates the solution by passing a battery of tests [9], before taking an output that gives feedback to students: compilation errors and execution errors, indicating a list of cases in which the program does not work. The student can continue with the next question or change the program and send it again. The number of times that an exercise can be re-sent is not limited as long as the deadline is not passed. The mark for the exercise is calculated by adding all the exercise scores and dividing them by the number of exercises. Figure 2 shows the workflow of the research.
Once the exercise is delivered, the teacher passes a copy control procedure to all of the exercises using the MOSS system (directly connected to the SIETTE system by web services). Each exercise is compared with all the ones given by the students. We obtained two values per pair (programi, programj): % of similarity between programs and number of matching lines in the file. All results were saved in a database. Figure 3 shows the output for a practical exercise. Students were notified of the correction, but they were not notified of the conclusions derived from the copy control analysis before the end of the course, when the final marks were published.

3.3. Methods

The duration of the Haskell course is one semester. Each year, a set of new authors enrol in the Haskell course and some more are allowed to repeat the course because they did not pass it the year before. Approximately 10–20% of students repeat the subject. In our experiment, we considered the students of each academic course as different authors. Further refinement can be conducted by analysing the behaviour of a given student over years or his/her behaviour according to his/her repeater/non-repeater condition, but for this first study, we considered only the whole list of students.

3.3.1. Statistical Analysis of Document Similarities

The data set we handled comprised data on document similarity obtained with SIETTE and MOSS. Each pair of documents for each exercise authored by two authors, A and B, now had two similarity categories (pi, pj) obtained from their corresponding quartiles from the first and second authors, where pi ≥ pj. There are 10 different possible combinations shown in Table 1. This table is, in fact, the function Similar_cod: [0,1] × [0,1] × nullc, described in the previous section. Intensity values were defined as discrete ordered values in the numerical interval [0,3], so we could later obtain average values.

3.3.2. Social Network Analysis

We used a pathway matrix that identifies the interrelationship among the different authors. This allowed us to know the main actors in the network and permitted us to analyse each type of relationship identified separately.
Construction of a path matrix. A matrix was constructed where the authors of the selected activity were crossed. A matrix was constructed by combining two by two all of the documents for the same statement for all of the authors. The result was a binary matrix, where 0 meant that there was no relationship of the selected type (Ci) and 1 meant that on existed. A relationship was obtained when there was a Ci-like collaboration between them in one or more of the selected documents (exercises). This matrix was used to identify the communities of authors for each type of collaboration. With the data from the path matrix, we constructed social network clusters of author collaborations based on undirected graphs.
Construction of the social network graph. As already mentioned in Section 3.2.1., the Author_behaviour function was computed from the average of all intensity values of every pair of documents where the author was involved. Depending on the resulting average intensity, a behaviour category was assigned to each author. Table 2 shows the boundaries and the interpretation of each behaviour category:
Each relationship obeys a type of behaviour of a pair of authors with that pair of documents, which we describe as follows:
  • Qindividuals: It corresponds to pairs of exercises that have a very low degree of similarity. They are from authors working individually. It is admitted that they have a certain similarity derived from having the same teacher and a similar programming style—a common background. This group included 59% of all the documents compared.
  • Qsoft: It corresponds to pairs of exercises that had similarities but in a slight way. We think that they were authors who asked their classmates when they were stuck, shared partial solutions but made the effort to understand the problem and solve it. It also corresponds to the fact that, in programming, some solutions are drawn from similar problems solved in class. This form of case-based learning or mutual help in a group is not a bad thing—quite the opposite. Discussing and sharing parts of the solutions can be a form of collaborative learning that many experts have highlighted as productive and beneficial for learners.
  • Qhard: This relationship indicates mild dishonest behaviour. It corresponds to pairs of exercises where the level of similarity was high. These were papers that mostly performed peer work, but the author tried to disguise this attitude, changing part of the solution to try to erase any trace. This was the group of papers where it was not clear whether there was collaboration or dishonest behaviour.
  • Qcheat: This relationship indicates unequivocally dishonest behaviour. These were pairs of code files regarded by MOSS as too similar. This relationship also considered cases where distracting techniques, such as renaming variables and functions, adding more lines or writing more comments, were applied.
The social network graph was composed of nodes and edges. Nodes represent authors and edges the relationship among them based on mutual average intensity value, which was defined as the average of the intensity value relation of each pair of documents authored by both students for the same exercise.
Appendix A (Table A1, Table A2 and Table A3) includes a detailed description of the elements and properties of the graph representing the collaborative social network.

4. Results

Once we built our network with all the duly organised and labelled relationships of the students over the four academic years, we proceeded to the analysis of the results for each of the studies proposed in this research.

4.1. Study 1: Is It Possible to Quantify How Students Share Knowledge in a Classroom through SCOLL?

In this first study, we looked at the intensity of knowledge flowing between each pair of documents for each assignment during the course. This work allowed us to move from the documents to the authors, accumulating for each individual the similarities of their documents with others’. With these values, a relationship could be established between each author and his/her classmates. With these data structures, we could see how authors worked. In the previous section, we defined four behaviours that allowed us to establish four types of relationships between pairs of authors (individuals, soft, hard and cheat). With these types of behaviours, we studied the results for each course. Specifically, how many of them worked alone? How many displayed dishonest behaviour? What academic result did each type of author obtain?

4.1.1. Analysis of Similarities between Pairs of Authors

The data provided by MOSS was transposed and discretised in quartiles as explained in Section 3.3.2. Table A4 shows the absolute frequencies of occurrence of each percentage of similarity transformed into quartiles. Data were separated between the highest and lower percentages (first and second author). For instance, out of the total of 26,035 pairs of documents compared, 3693 reported a similarity between 75% and 100% (p4) as the highest similarity percentage and 2614 as having the lowest similarity percentage.
Table A5 shows the relative frequencies of classification category after the application of the function Similar_cod to the total pairs of documents (a total of 26,035 pairs). The largest number of document pairs (close to 50%) were unrelated because they had similarities that could be attributed to common knowledge as discussed in Section 2.2. On the other hand, a dishonest behaviour (Ccopy) was only observed in 10% of the comparisons. Most authors were assigned a “weak” type of behaviour (Cweak). From an inter-annual point of view, we could highlight a certain stability in the percentages, with a greater difference in the central years 2016–2018, where weak relationships increased, strong relationships decreased slightly and dishonest behaviour decreased with greater intensity. This may be a consequence of the actions adopted in the 2016–2017 academic year to avoid dishonest behaviour, after analysing the results of the 2015–2016 academic year. However, the upturn in the 2018–2019 academic year shows that there was an adaptation to the measures initially adopted, so it seems necessary to adopt additional measures to avoid dishonest behaviour.
Figure 4 (see Table A6) shows statistics on the authors obtained by applying the Author_behaviour function. Here, it can be seen that the most common behaviour (82%) was that of a “soft” type of relationship. This means that authors shared common study resources. It can also be observed that “individual” behaviour (9%) and “hard” behaviour (8%) were at the extremes and had very close values. It should be noted that dishonest behaviour (“cheat”) reduced to 1%, while in the document comparison it was 10%. These data allow us to venture that most of the comparisons with dishonest behaviour were carried out by only 1% of authors. From a dynamic point of view, we can observe that soft behaviour has been increasing, to the detriment of hard and cheat behaviours. We can see in the data for the last academic year (2018–2019) that there was a shift from soft behaviour to individuals. To be able to conclude that this was a change in trend, as in the statistics of comparative documents, it would be necessary to study the subsequent courses. We do not have the data to draw such a conclusion, but it could be interesting for future research.
Figure 5 (see Table A7) shows the aggregated data on author dyads, obtained from the path_matrix. If we compare these data (about authors) with those in Table A5 and Table A6 (about documents), it can be seen that 1% of cheat authors were present in 6% of the pairs and 10% of the documents compared with dishonest behaviour. However, the boundary between individual and soft behaviour was fuzzier, denoting a non-stable behaviour throughout the course by these authors between one type of study and the other. Hard behaviour, on the other hand, such as cheating, seemed more defined, with 8% of the authors with this profile participating in 10% of the documents compared and 11% of the hard-type pairs.

4.1.2. Global Network Metrics

We obtained a network with aggregated data. Nodes were author identifiers. Relationships were measurements of similarities between the documents generated by learners. Table 3 shows the global metrics of the network for each course. In these metrics, we observed how the density of the network was higher in the courses during 2015–2016 and 2017–2018 than in the other courses. This measure indicates the intensity of the interrelation, and it was conditioned by the number of authors and by the follow-up of the subject. Thus, in courses in 2015–2016 and 2017–2018, the number of authors was lower, and the achievement of the tasks set during the course was higher.
Regarding modularity, the courses in 2015–2016 and 2016–2017 showed a lower modularity, while the course in 2016–2017 stands out for its higher modularity (0.16), i.e., for its greater ability to separate vertices into clusters. This measure illustrates the sharpness of the boundaries between clusters.
The geodesic distance, the number of vertices necessary for a vertex to connect with any other SNA vertex, was between 1 and 2 for all of the courses, with the average being higher in the courses in 2016–2017 and 2017–2018, with a value of 1.73. However, the 2018–2019 course had a diameter of 4, while in the 2016–2017 course, the value was 3. We see, again, a similarity between the years 2015–2016 and 2017–2018 and the years 2016–2017 and 2018–2019.
On the other hand, from the calculation of the averages of the vertex metrics in each course, we can underline that all their values were significant and reinforced the similarity of behaviour between the courses in 2015–2016 and 2017–2018 as well as between the courses in 2016–2017 and 2018–2019. However, it can also be emphasised how in the degree metrics, despite the lower number of authors in the years 2015–2016 and 2017–2018, the values were higher, especially higher than in the academic year 2018–2019. These data reinforce that the follow up of the subject by the authors in the 2018–2019 course was lower than in the rest of the courses. We can observe that betweenness centrality was higher in the courses in 2016–2017 and 2018–2019, an element that undoubtedly influenced the greater number of authors and the need for a greater number of intermediaries to maintain the maximum geodesic distance at a value between 3 and 4. The eigenvector and PageRank values did not provide differential information between courses.
On the other hand, the clustering coefficient, which indicates the degree of connection between the neighbouring nodes of a given vertex, indicated that the courses in 2015–2016 and 2017–2018 had similar and higher values than in the other courses, which suggests that the neighbouring nodes of each vertex were connected to each other (clique in terms of graphs). That is, there was a direct interrelationship between neighbouring nodes. This feature indicates the ease of identifying groups with high density and could vary substantially if we consider individual questions instead of aggregates as was the case in this section.
Another noteworthy aspect was the average type of the network vertices. Specifically, all courses were around 1 (relationship “soft type”, Qsoft) with slight oscillations, which reinforces the conclusions highlighted in this regard in previous sections.
The relationship between SNA metrics and performance was considered. In our case, the performance assessed was the final exam score of the subject. Table A8 shows the results of the correlation analysis between the degree, betweenness, closeness, and test score metrics for each course. In the table, we can observe that the correlations were mostly statistically significant and, in all cases, except for the Mutual Average intensity metrics, the correlation was positive. There was a high correlation between the degree (number of arcs) and closeness (closeness, diffusion velocity) metrics, which is consistent with the definition of these metrics. To a lesser extent, there was a high correlation between betweenness (betweenness, centre of flow distribution) and degree and closeness. In relation to performance, measured by the score obtained in the final exam, it had a significant correlation with the rest of the attributes, except for in 2016–2017 where it was substantially lower than in the previous cases. The highest correlation was observed, in this case, between the degree and closeness metrics. However, the Mutual Average intensity attribute had a negative correlation with the rest of the metrics, including test score, which suggests that the intensity of the flow of knowledge between nodes was contrary to the number of links in the node. This seems to indicate that authors with better results tended to help their peers but always with ethical behaviour. This aspect is explored in more detail in Section 4.3.
In the network (Figure 6), the colour of the node varied from green to red depending on the betweenness value of the vertex. Lighter green indicates less betweenness between its links, red indicates more betweenness, and in between are the intermediate values. The size of the node varies according to its proximity to the centroid of the graph (which we can interpret as leadership, as it indicates the speed with which the information arrives at the centroid of the graph). Accordingly, the thickest points on the map corresponded to the authors who had the most interactions in the network. In Figure 6, where the year 2015–2016 is represented, the nodes were very similar in size, but the larger the size of the node, the more information the individual generated or received from its direct links. The relationships (edges) are the aggregation of all the similarity measures of all the exercises of the course between each pair of authors. These relationships are differentiated by colour and line style (mutual average intensities) and by thickness (mutual aggregate intensity). The colour is represented from lightest to darkest in the brown range. When the colour is softer, it indicates a less than average flow of knowledge, and when it is darker, a more intense flow of knowledge is implied. The line pattern varies from a solid line (for clear copy relationship) to dotted line and from more intense to less intense. The attribute that established this was the classification category (relationship Similar_Code, Table 1).

4.1.3. Boundary between Collaboration and Dishonest Behaviour

To answer our question on how to distinguish collaboration as a learning activity from dishonest behaviour, or what amounts to the difference between dishonest and ethical behaviour, we modelled two criteria teachers use to detect copying: one-off but very blatant copying (very high similarity) or continuous copying but less similarity.
The study groups were the two central relationships Qsoft and Qhard. Dishonest behaviour is indicated by the ratio Qcheat. On the other hand, dishonest behaviour can be considered to occur in two ways: either with few copied lines but with a very high similarity or with many continuous copied lines but with a medium–high similarity, regardless of who is the copying student. In the end, to detect both cases, we considered a cumulative measure for all the solutions delivered throughout the course. From this perspective, we consider a student to be unethical when he/she repeated his/her bad behaviour, sometimes by copying from different classmates. According to this, in our interpretation, the difference between collaboration and dishonest behaviour was an isolated act of copying with a very high similarity value (Qcheat) or a Qhard relationship continued over time by an individual with his peers (not necessarily always the same, but continuous).

4.2. Study 2: Is It Possible to Identify Study Groups in a Classroom?

The study groups that emerge in a classroom are of great interest for the learning process. In this research, we looked at those groups by comparing authors’ documents. The similarities gave us the relationships. The study of those relationships allowed us to obtain subgroups in the global network. Throughout this study, we analysed these sub-networks and their features. These data were compared with the academic results obtained by the authors. The objective was to characterise the groups, to see their performance and to obtain a quantitative measure between ethical and dishonest behaviour.

4.2.1. Types of Behaviour

This section contrasts the authors’ results (final score, mark generated by the teacher in a non-automatic way) in relation to their behaviour category. Figure 7 plots the results for each course per author, with the final score on the x-axis and the mutual average intensity value on the y-axis. The boundaries of the different categories (on the y-axis, from bottom to top) {Qindividuals, Qsoft, Qhard and Qcheat} are marked with a red line. From the observation of the graphs, we can highlight that the best marks were obtained for the academic year 2017–2018, while for the rest of the academic years, the best marks were between 7 and 8. In general, it can be underlined that most of the authors were in the soft range (values on the y-axis between 0.5 and 1.5) including those who obtained the best marks. This result shows that most of the authors had an honest collaborative behaviour. In the case of the top scorers, we can observe a different behaviour in their collaboration patterns for each year, which we study in more detail in Section 4.3.
In Figure 7, the vertices with high knowledge transfer relationships (Qhard and Qcheat) were concentrated in authors with very low academic performance, with the authors in the Qcheat category practically at 0, i.e., these authors “absorb” the results of the exercises developed by other authors without contributing any knowledge. This indicated that they did not acquire any knowledge in the development of the subject and, in some cases, substituted the effort of studying and following up on the subject with dishonest behaviour. It is precisely on the Qhard vs. Qcheat borderline that we placed the dishonest behaviour practised by authors in the Qcheat category.
Another interesting result is that the regression of the data showed a slight linear trend with very low explanatory power of the variability (R2), which even in the 2016–2017 academic year means that the regression parameters were not significantly different from 0.
We now look at the relationships among authors resulting from the accumulation of similarities with the documents generated by their classmates. The relationships were considered according to the values in Table 1 (Similar_cod). If there was more than one relationship (i.e., similarity was higher than 1 in more than one document), the values were added, obtaining the “mutual aggregate intensity”. In addition, we recorded the number of documents in which there was some similarity in the categories considered, and we obtained the attribute “documents number”. Taking into account both attributes, we calculated the value of the attribute “mutual average intensities”. The summary by academic year of the metrics for the different behaviours is shown in Table 4.
In this social network, there was a group of authors whose practical work had a very low similarity with their peers, i.e., those in the “Individuals’’ category (Qindividuals). These were authors who effectively carried out their practical work individually. They are not represented in the graph. The others were grouped together and were studied separately. In these study groups, there were subgroups of authors who, among themselves, had stronger relationships with some peers and weaker relationships with the rest. The analysis of these results is given in the next section.
This social map was built for each course, given that the practical assignments were different from course to course, so that authors cannot copy from students from previous years. Figure 8, as an example, shows the details of the social map displayed in Figure 6 for the academic year 2015–2016. In this figure, nodes represent the authors and edges are relationships between them in terms of “similarities of knowledge”. Node colour represents betweenness centrality, that is, the number of times a node acts as a bridge along the shortest path between two other nodes, which in this case means the author actively intermediates in the knowledge flow. An edges’ width represents the mutual average intensity (see Appendix A, Table A2).

4.2.2. Study Groups

If we group authors who shared knowledge across their documents, “study groups” can be formed. The clustering algorithm applying the Wakita–Tsurumi algorithm [43] of Node XL was used to identify groups that were clearly differentiated. This type of social mapping allowed us to characterise study groups and clusters, i.e., students who were related, by some criterion, to other authors. Table 5 shows the groups obtained for each course with their corresponding metrics. The label of the groups includes, first, the year of the start of the course and, after a hyphen, the order of the group generated. The metrics used were those relevant to the social network (Vertices, Edges, Maximum and Average Geodesic Distance and Graph Density) and the characteristics of the group (Best Final Score and Highest Mutual Average Intensity of each group).
From the detailed analysis of Table 6, it can be seen that there were three types of study groups according to their characteristics. In Type I, the authors were grouped around authors who achieved the best results; their average size was 18.5 authors, while their mutual average intensity was low. The reason for this grouping was to share study methods and knowledge from the best authors. On the other hand, there was a Type II group, where authors were grouped around authors with the best accredited achievements and with the best average in the group. Possibly, the members of these groups shared for other extra-academic reasons (school of origin, neighbourhood, social groups, etc.). The mutual average intensity of learning was slightly higher, but they did not engage in dishonest behaviour.
Ethical behaviour was a personal feature. In fact, different behaviours can be observed in the different groups. However, there were study groups that could be identified as unethical. We referred to those groups formed by authors with a profile that we called “jumpy fellow”. This was the Type III group, where authors took knowledge from one partner or another to construct their solutions. In the rest of the groups, given their non-homogeneous profile, we found nodes with different behaviours that were characterised by the category to which they belonged. Table 6 summarises the different groups generated with the assignment of typology and metrics.
Figure 9 illustrates the interrelationship between the groups for the 2015–2016 academic year (Figure 9a) and, ordered by marks on the abscissa axis and Betweenness on the ordinate axis, the details for group G15-1, Type I (Figure 9b), the details for group G15-4, Type II (Figure 9c) and the details for group G17-6.
In Figure 9a, the relationships between the different study groups can be observed. These relationships were more frequent (thickness) and intense (colour) among Type I groups (solid circle) and less so with the Type II group (solid square). Relationships with Type III groups (solid triangle) were weaker and less intense.
Figure 9b shows the group G15-1, Type I (with a good score for average results). In the graph, we can observe the existence of two nodes with a high final score (right), with several intermediary nodes (red) that distribute the knowledge (mesh of denser edges) to the rest of the nodes. From the perspective of exploitation, the nodes with the highest final score are where the knowledge is plausibly generated, while presumably the knowledge receivers correspond to a very low level of exploitation. It can also be observed that the most powerful intermediation nodes had a higher average final score. This group generated the most shared knowledge and, therefore, there was a well-organised structure for the circulation of knowledge. Although there may be dishonest behaviour in some members with very low performance on the exam, it was the group where the most stable and intensely shared ethical study habits were consolidated. On the other hand, the aim of the group was primarily academic and, therefore, its attitude helped to improve the performance of its members with ethical behaviour.
Figure 9c shows a Type II group with a medium level of intermediation. This means that, as a group, the range of the score was medium–low, as were the intermediation metrics and, therefore there were no significant intermediation nodes. Compared to Type I groups, the knowledge flow was less dense, the number of nodes was lower, and the brokering and leverage metrics had a medium–low rank. These behaviours of Type I and Type II clusters can be extrapolated to all clusters of their typology. This means that Type II groups were characterised by a less organised distribution of the flow of knowledge, the capacity to generate knowledge was medium and the mesh of relationships was less dense, so it was a group with a weak structure, and the reasons for its creation were not strictly academic in origin.
In Figure 9d, a Type III group, G17-6, is depicted in which a much less dense mesh and a number of very low and low intensity relationships can be observed. There were no intermediary nodes, because the relationships were more direct and with few intermediary nodes. This indicates that this group typology was not structured, and its creation was residual and with an almost null flow of knowledge. A more detailed study should be carried out for each question in order to obtain more information. The authors who belonged to groups of this type were authors with few social skills and who only occasionally established relationships. This characteristic can also be extrapolated to the rest of the groups of this typology but not to the level of use of its member nodes. The achievements of their nodes varied substantially in the different groups. Although most of the authors with higher marks had a denser mesh of relationships (Section 4.3), some of them did not exhibit this behaviour. This was the case for group G17-6.
We can highlight that the nodes with high flow distribution capacity were clustered in the middle range of marks. This conclusion was the result of comparing the different characteristics of the groups. The nodes with the best marks usually belonged to Type I clusters. It seems that the top performers were the cluster agglutination and, probably, they were also the origin of the knowledge flow circulating in the cluster.
From the point of view of origin–distribution–destination of knowledge, Type I clusters had a well-defined origin and destination with a relationship (distribution) in which there may be dishonest behaviour on the part of some receiving authors and with a well-organised flow distribution. The objective reason for the grouping was usually academic and focused on the proximity of authors with a final mark in the high range. Type II clusters, on the other hand, had a more diffuse origin and destination of knowledge and a less dense and organised knowledge distribution mesh, and, presumably, the origin of their clustering was more of a social (pre-existing) than an academic relationship. The number of nodes was medium and smaller than in the Type I group; knowledge flowed less and with more difficulty. The category of their relationships were soft and hard types, and especially the cheat type. Type III groups were very small, with few and not very intense relationships. There were no stable relationships with other nodes and/or groups, and they had a very broad node profile. This means that from the point of view of behaviour they had low relationships, and there was no room for dishonest behaviour, but neither did knowledge flow, so it did not favour the improvement in social interaction.
Another aspect to highlight in Figure 9 is that the best final scores can have different profiles, being integrated into groups of any type, although Type I groups were preferred. Finally, the relationships among groups were more significant between Type I and II groups, with the intensity and quantity of interrelationships between Type III groups and the rest reduced. Therefore, the groups that influenced the improvement in achievement were mainly those of Type I and, to a lesser extent, those of Type II.

4.3. Study 3: How Are Successful Learners Organised?

As seen in Table 5, the top performers had few intense communications. This means that some knowledge flows to peers but with honest behaviour. On the other hand, it was observed that some authors were grouped around them. This tells us that the most successful authors interacted with other authors a lot, but they did not pass on their solutions as they were, i.e., they dd not copy or allow copying but helped their peers. In other words, they were more ethical. This conclusion is interesting and has led us to carry out a detailed study of the authors who performed better in the final exam. The study consisted of analysing the behaviour of the group corresponding to the author (or authors) with the best final scores in each course and studying their direct knowledge flow within the group to which they belonged and with the rest of the vertices and/or groups.
Figure 10 shows, graphically, the relationship of the best scores or best final scores of a course with the rest of the members of its study group and/or with the rest of the groups of the course. The symbol for the reference node is a solid orange diamond. The label of the reference node is the identifier of the author, while for the rest of the related authors it is the exam mark; thus, we can directly identify the performances of the related authors with the authors obtaining the best marks. Figure 10 a shows the relationship of the top performers in the 2015–2016 academic year with the other members of his/her study group (G15-1). Figure 10b plots the relationships of the two top scorers from 2016–2017 with the other authors in their respective study groups (G16-3 and G16-6). Figure 10c,d plot the direct relationship of the best mark from 2017–2018 with the rest of the authors in their study group (G17-6) and with the other study groups in the course. Figure 10e,f plot the direct relationship of the two best final scores of the academic year 2018–2019 with the rest of the authors of the academic year and with the groups to which they belonged.

5. Discussion

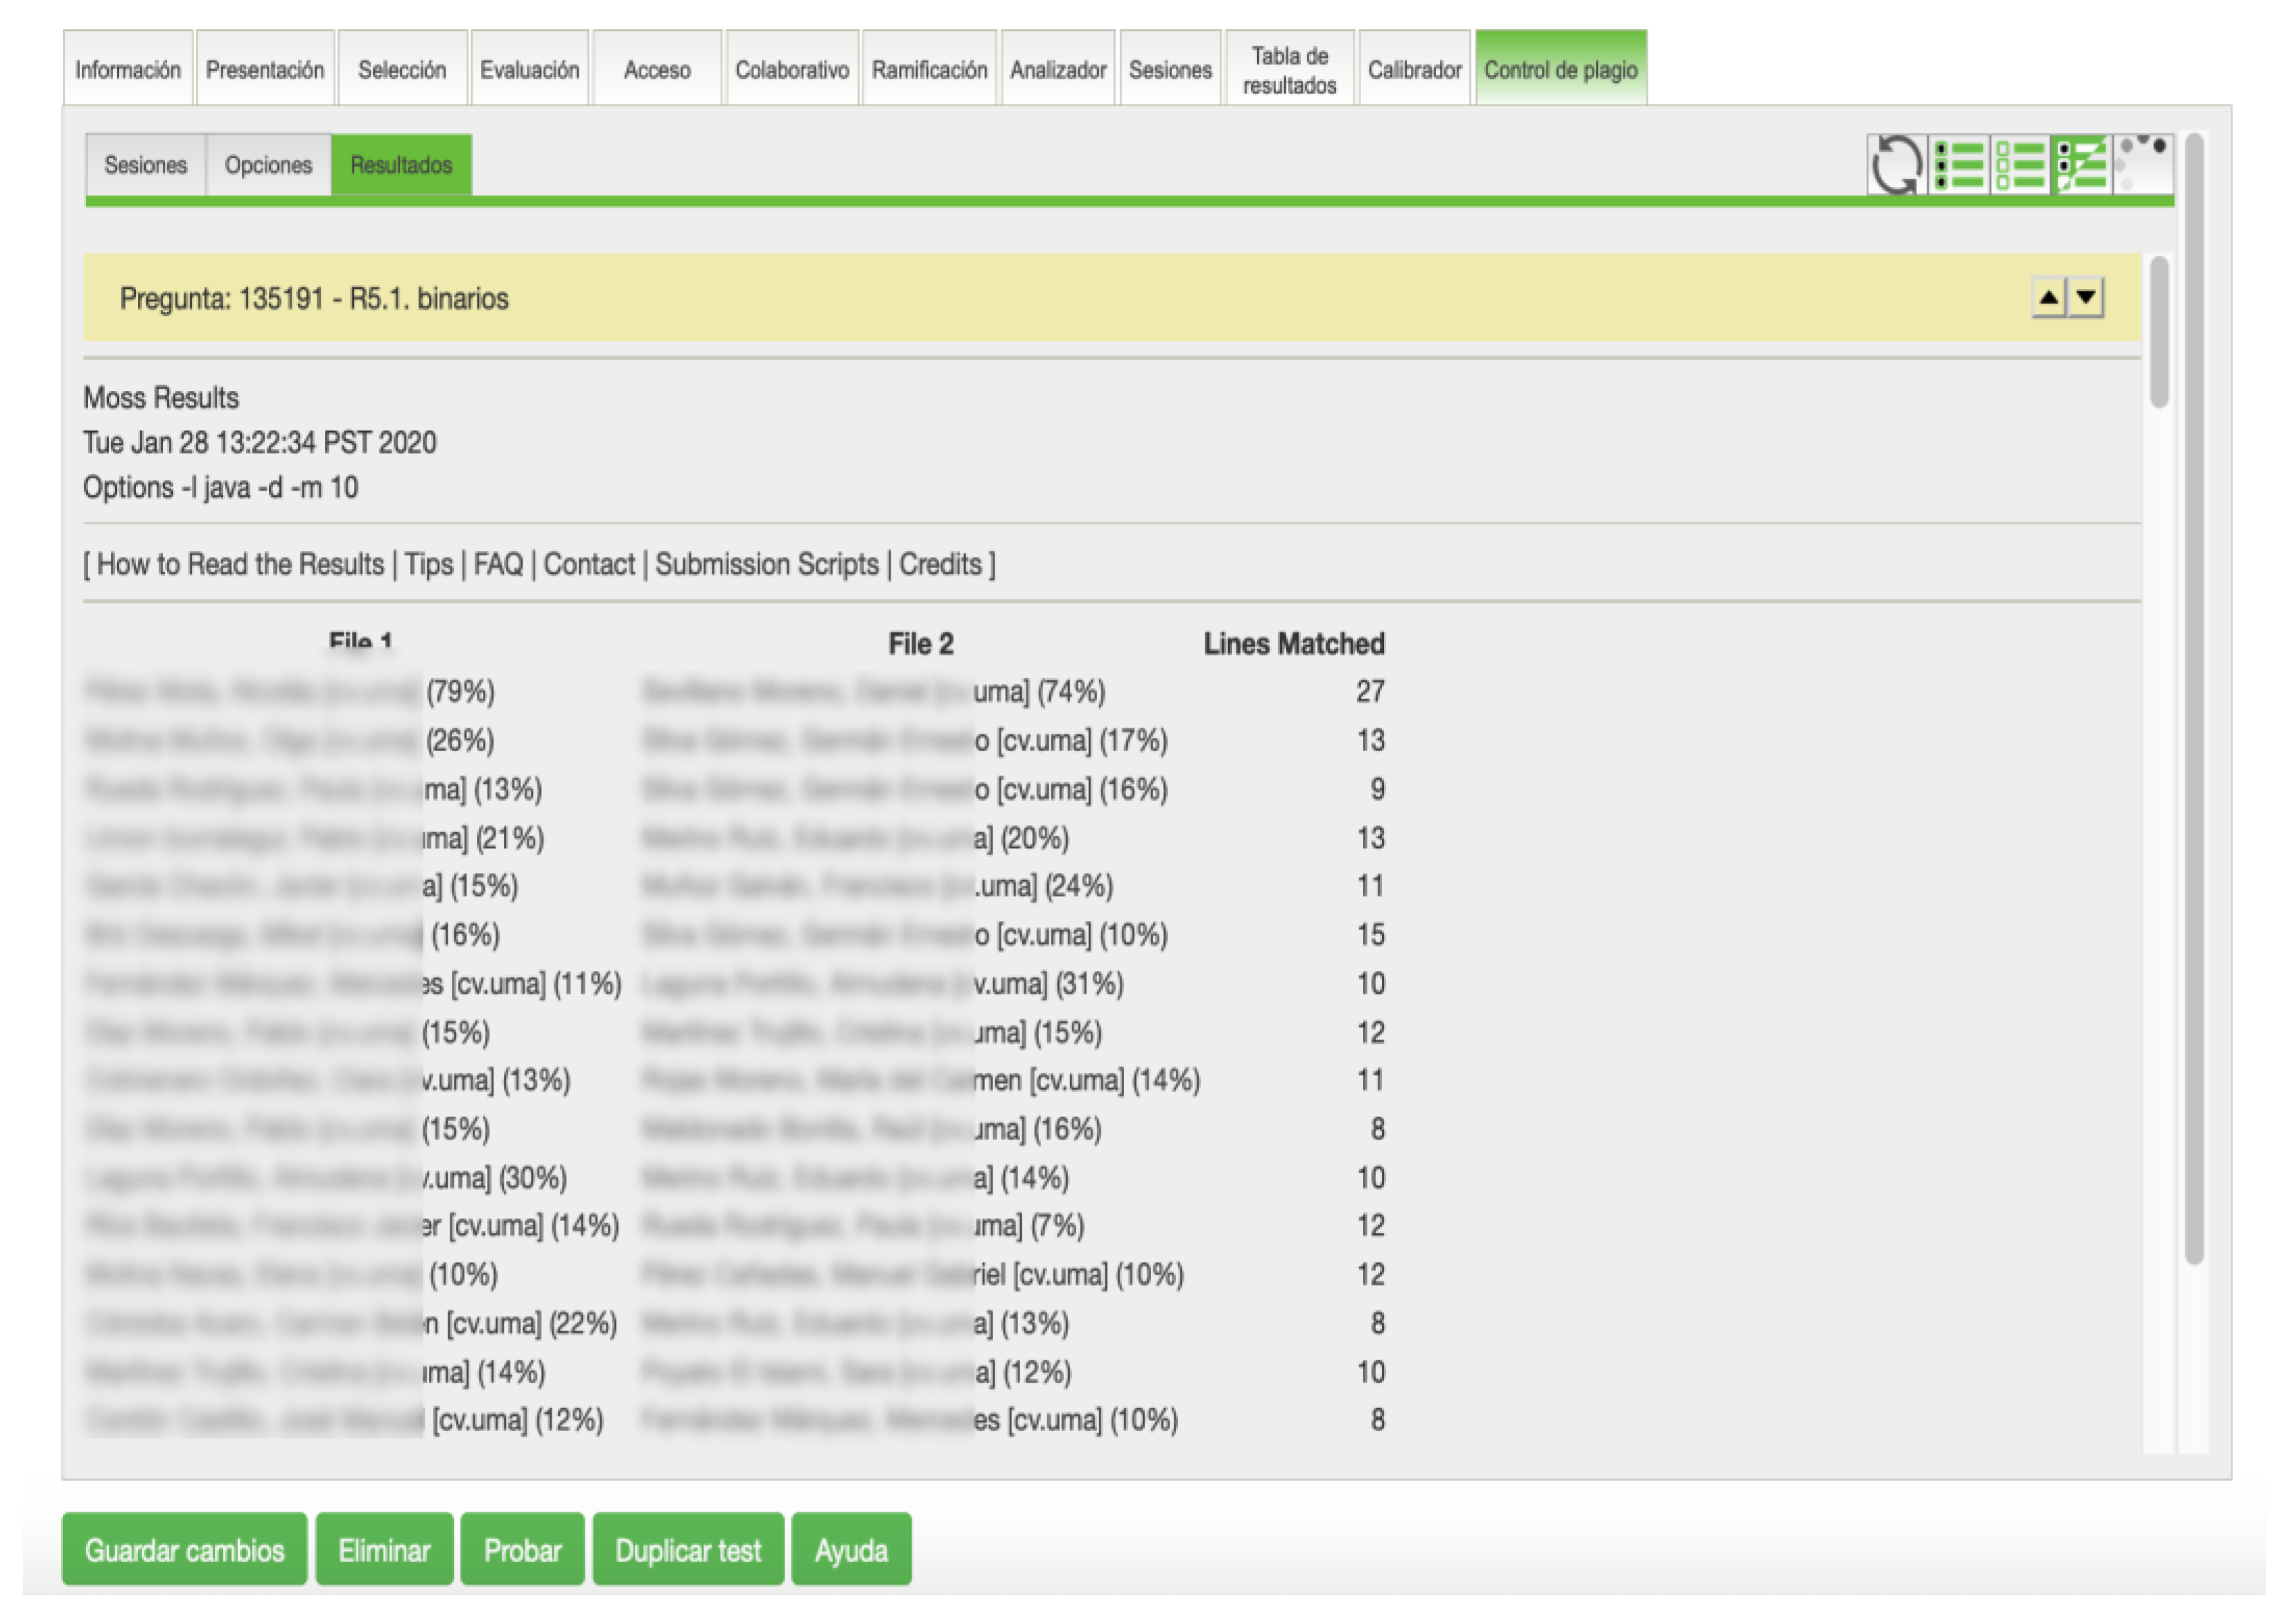
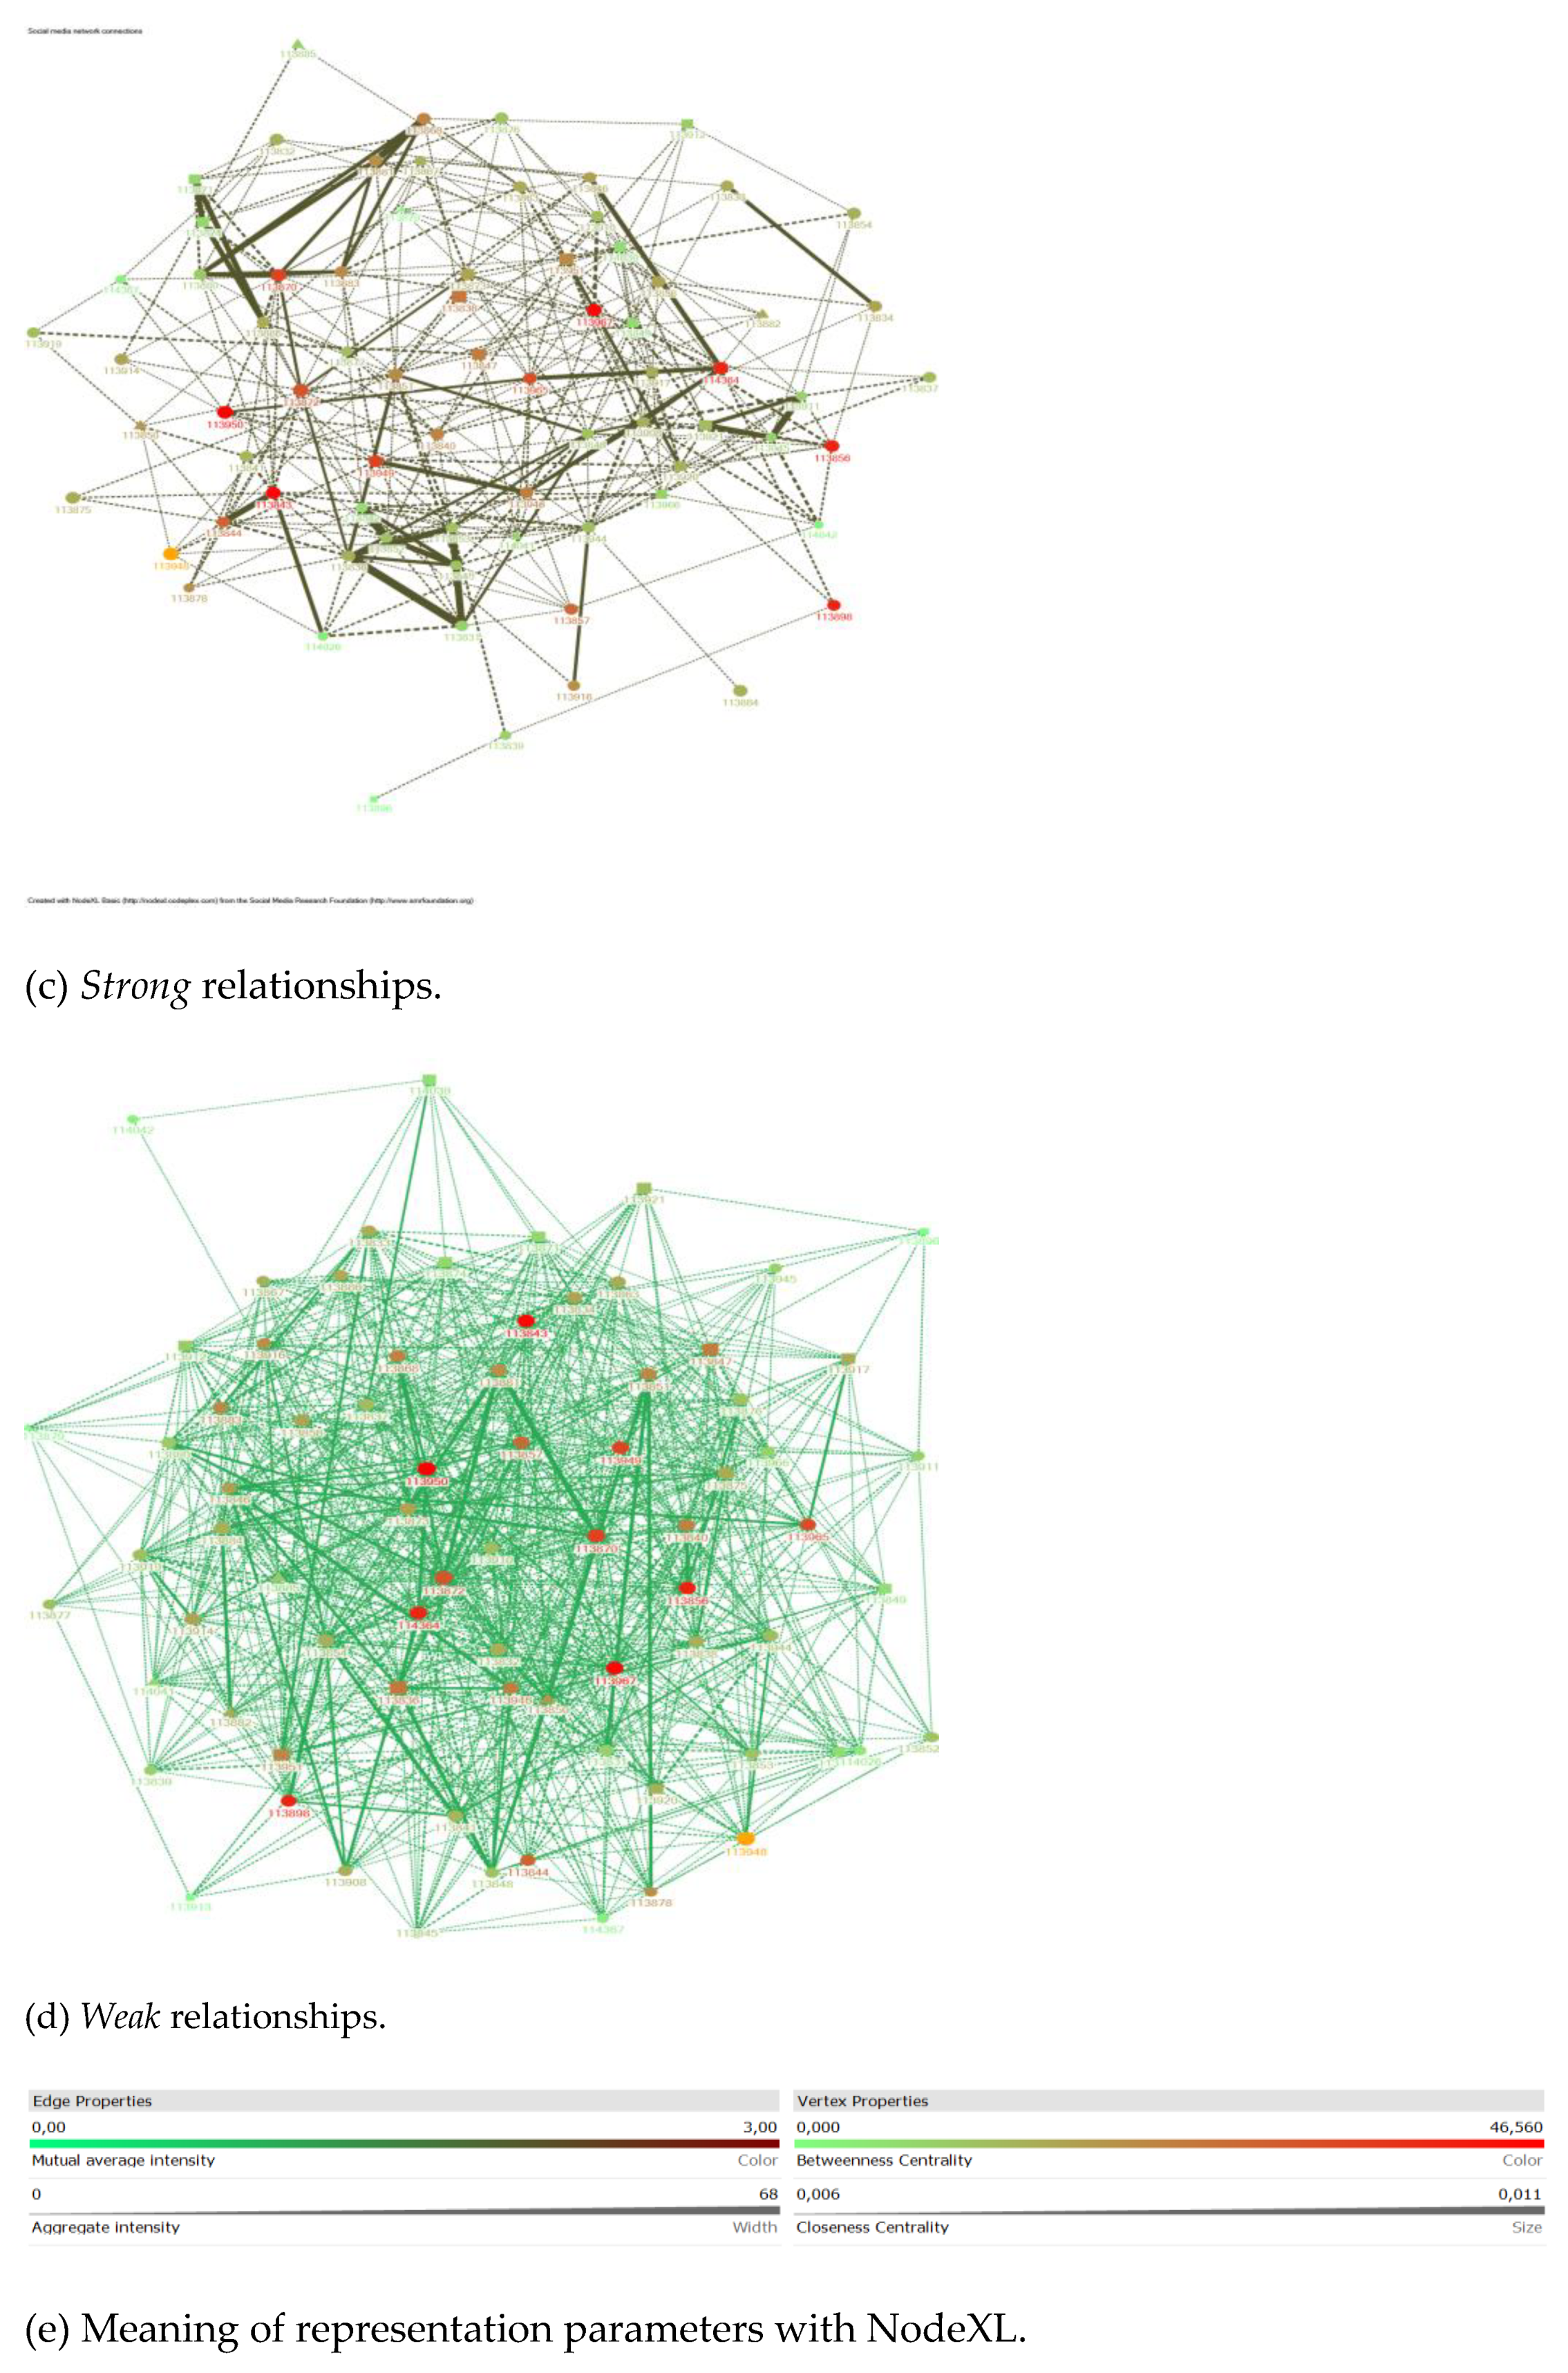
In the previous section, we described three studies that we conducted over four academic years on the same subject. Using a computer-based assessment environment (SIETTE) and an automatic plagiarism detection tool (MOSS), we collected data ono the relationships among the solutions given by the students during each course to a whole set of programming assignments. Programming assignments were different every academic year, but their average difficulty can be considered equivalent. Over the course, students were discouraged to copy their solutions for the sake of ethical conduct and to avoid a strong penalty in case they were caught, but they were encouraged to work together in study groups, helping each other and sharing their knowledge. This large amount of data was mined to discover behavioural patterns using statistical and social network analysis tools and analysing which strategies successful students followed.
Programming is an activity where each individual has his/her own style. Leaving aside the common knowledge of the activities carried out in class and the basics of programming, it is possible to analyse the partial similarities among documents and, from there, to infer groups of document types from which study groups can be obtained without asking the students or analysing virtual campus forums through the results they generate and deliver to the teacher.
In this paper, we showed that it is possible to characterise how much knowledge flow there is between one student and another (creating a relationship between them) by comparing documents by different authors. We formalised this concept and defined the Similar_cod function as well as all the tools necessary to study our data using this approach.
By analysing the intensity of the flow of knowledge among individuals in a course, we can also define the boundary between collaboration and dishonest behaviour. The answer lies in the amount of knowledge flowing from one individual to another in each practical exercise and its continuity over the course. We considered that a one-off flow was not the same as a continuous flow throughout the whole course. We also considered that “some flow” was not the same as “a lot of knowledge flow”. This is the reason why we made an aggregate sum of knowledge flows throughout the course. We used the resulting values to draw our conclusions. In the same way, we considered that a continuous but low flow was also ethical and beneficial. In the end, by adding up all the flows, we have classified the behaviour of the learners and inferred borderline values that allowed us to distinguish among the different behaviours of the learners. Therefore, the boundary was on the borderline between the Qhard groups and the Qcheat groups, which we quantified, with our data, in a cumulative value of document similarity between the first and second quartile of the course. This means that in the Qcheat groups there was help, discussion and exchange of knowledge among the bodies, but this exchange was much higher than in the Qhard groups, so much so that it cannot be considered very honest.
Concerning the behaviour of the individuals, we observed three types which we called dishonest behaviour, isolated behaviour and collaborative behaviour.
With the data we have, the dishonest behaviour of the students was not as alarming as many studies—especially those in Computer Science and Information Technology [2,3,4,5]—suggest. The low incidence of dishonest behaviour in this subject may be due to the strict control exerted over the solutions of all classmates. In general, “control causes self-control”. This conclusion is in line with the results obtained by other authors [
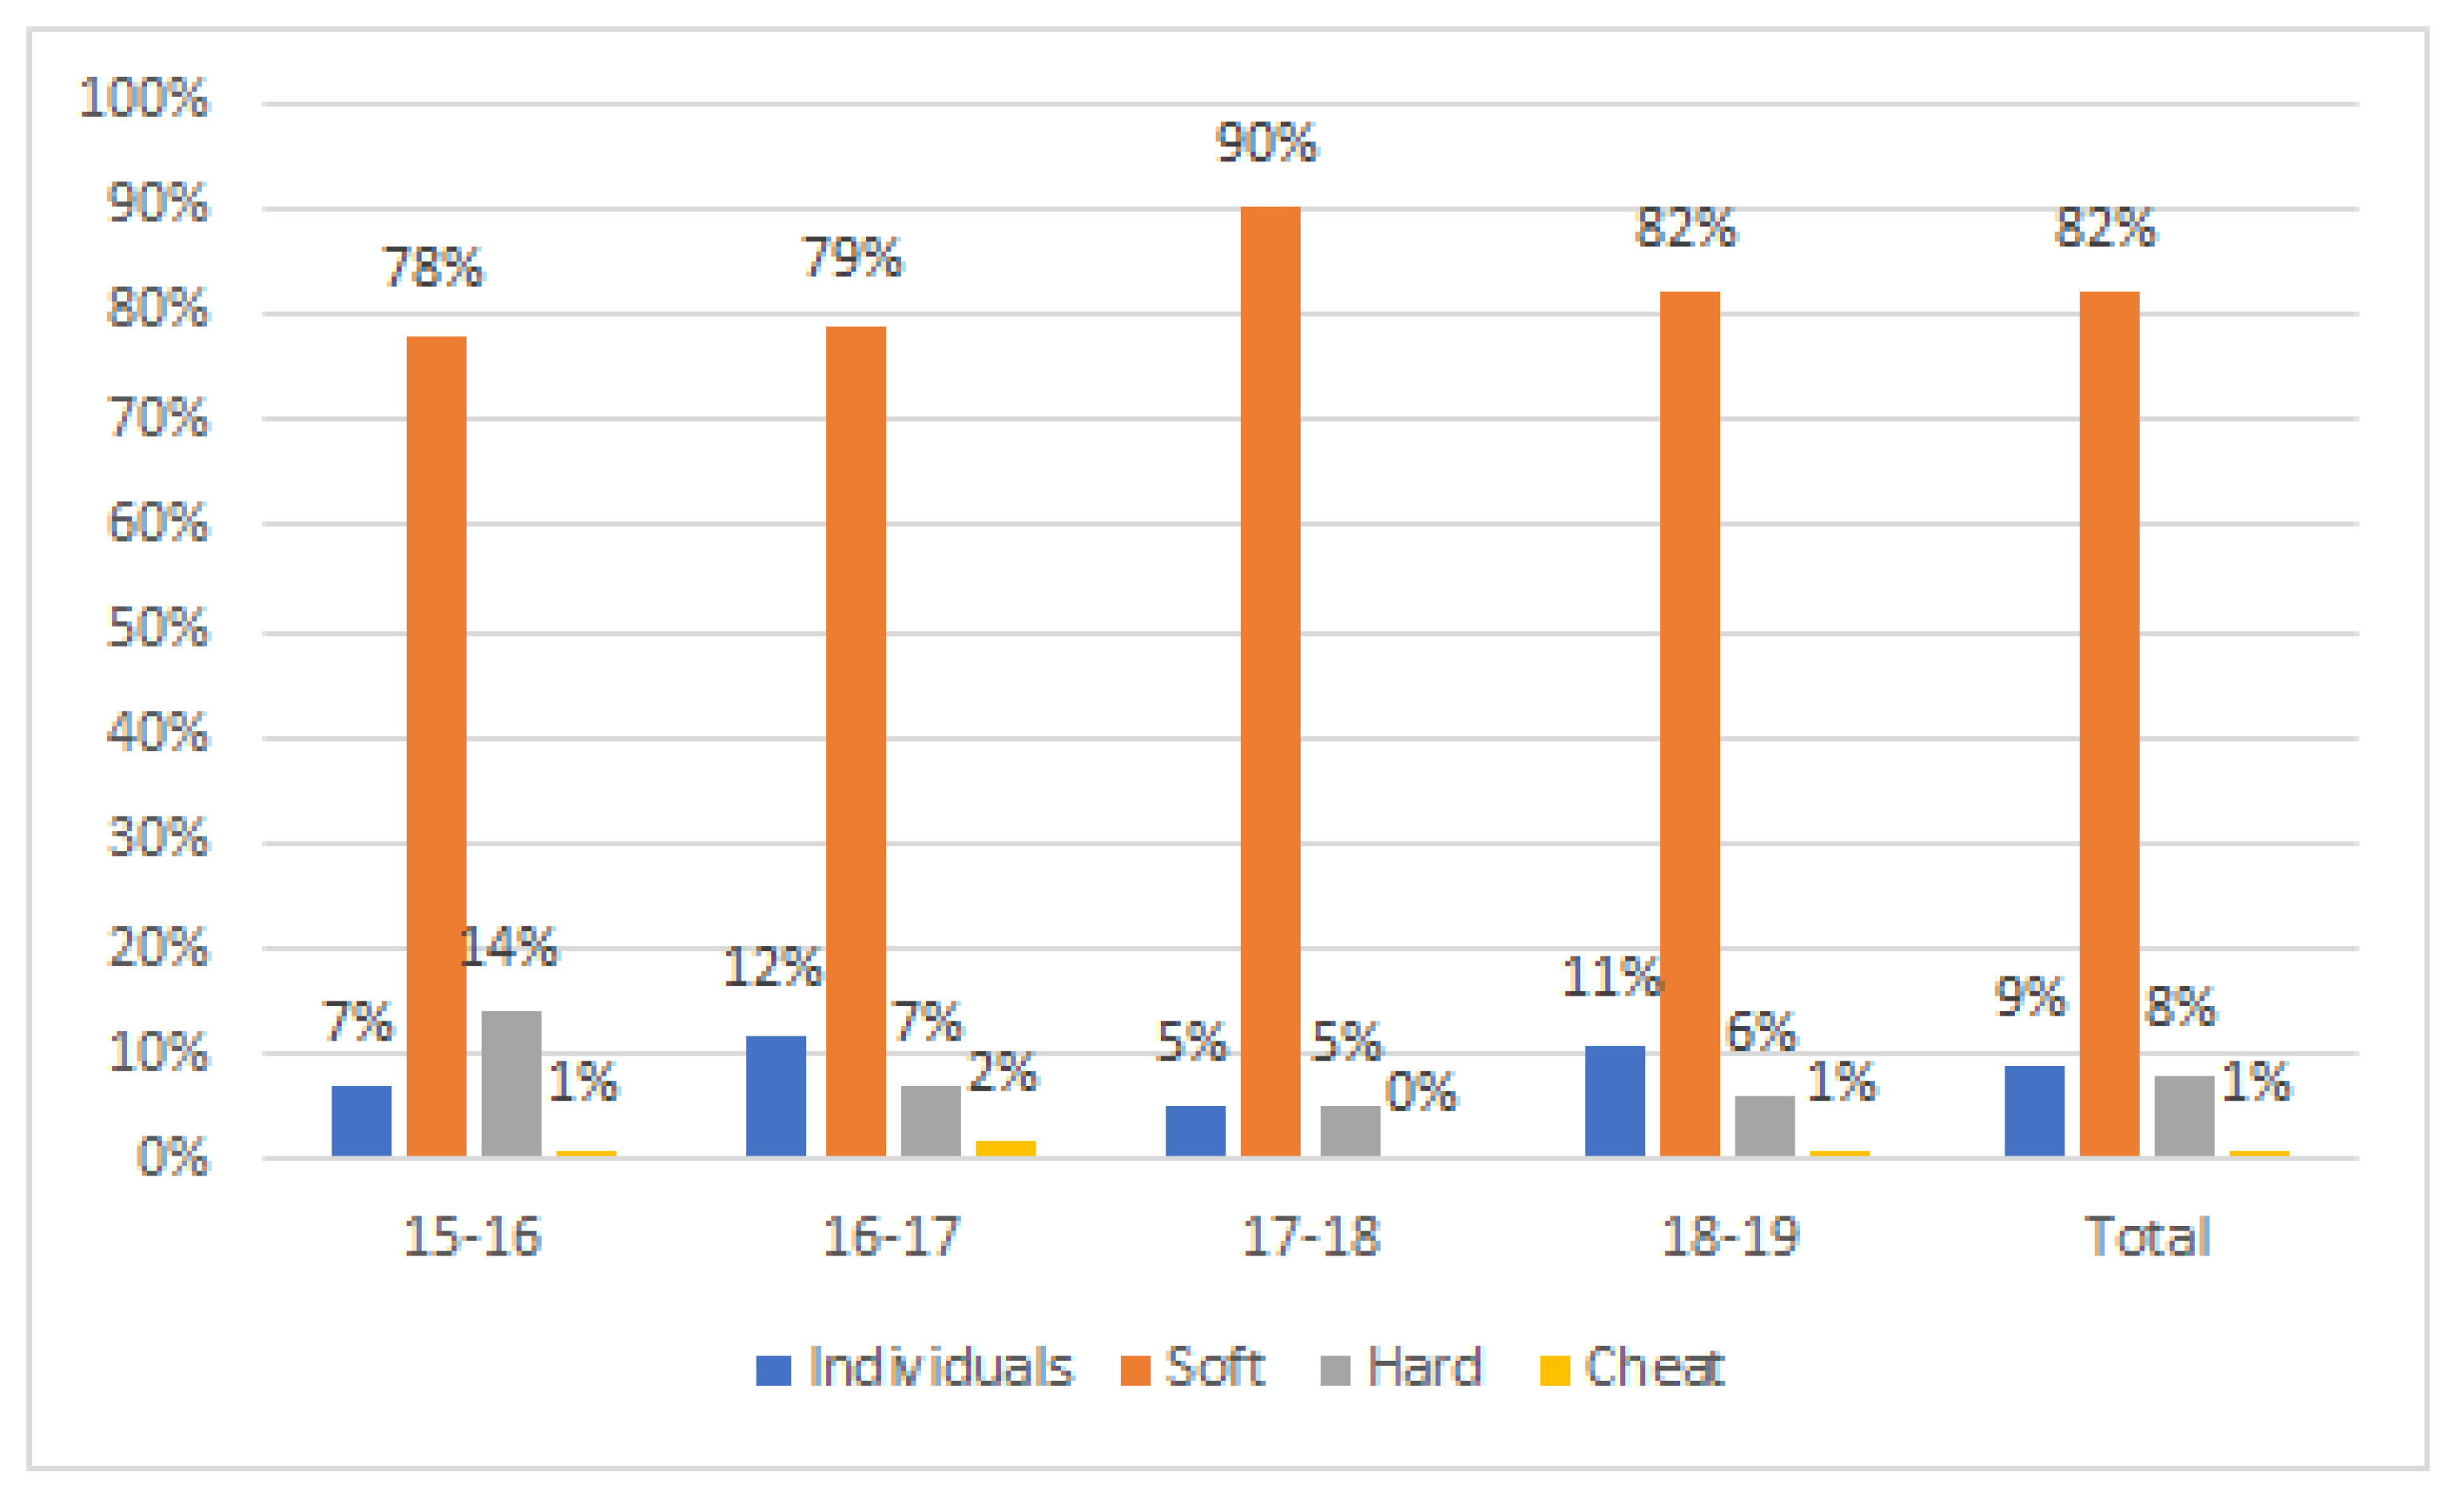
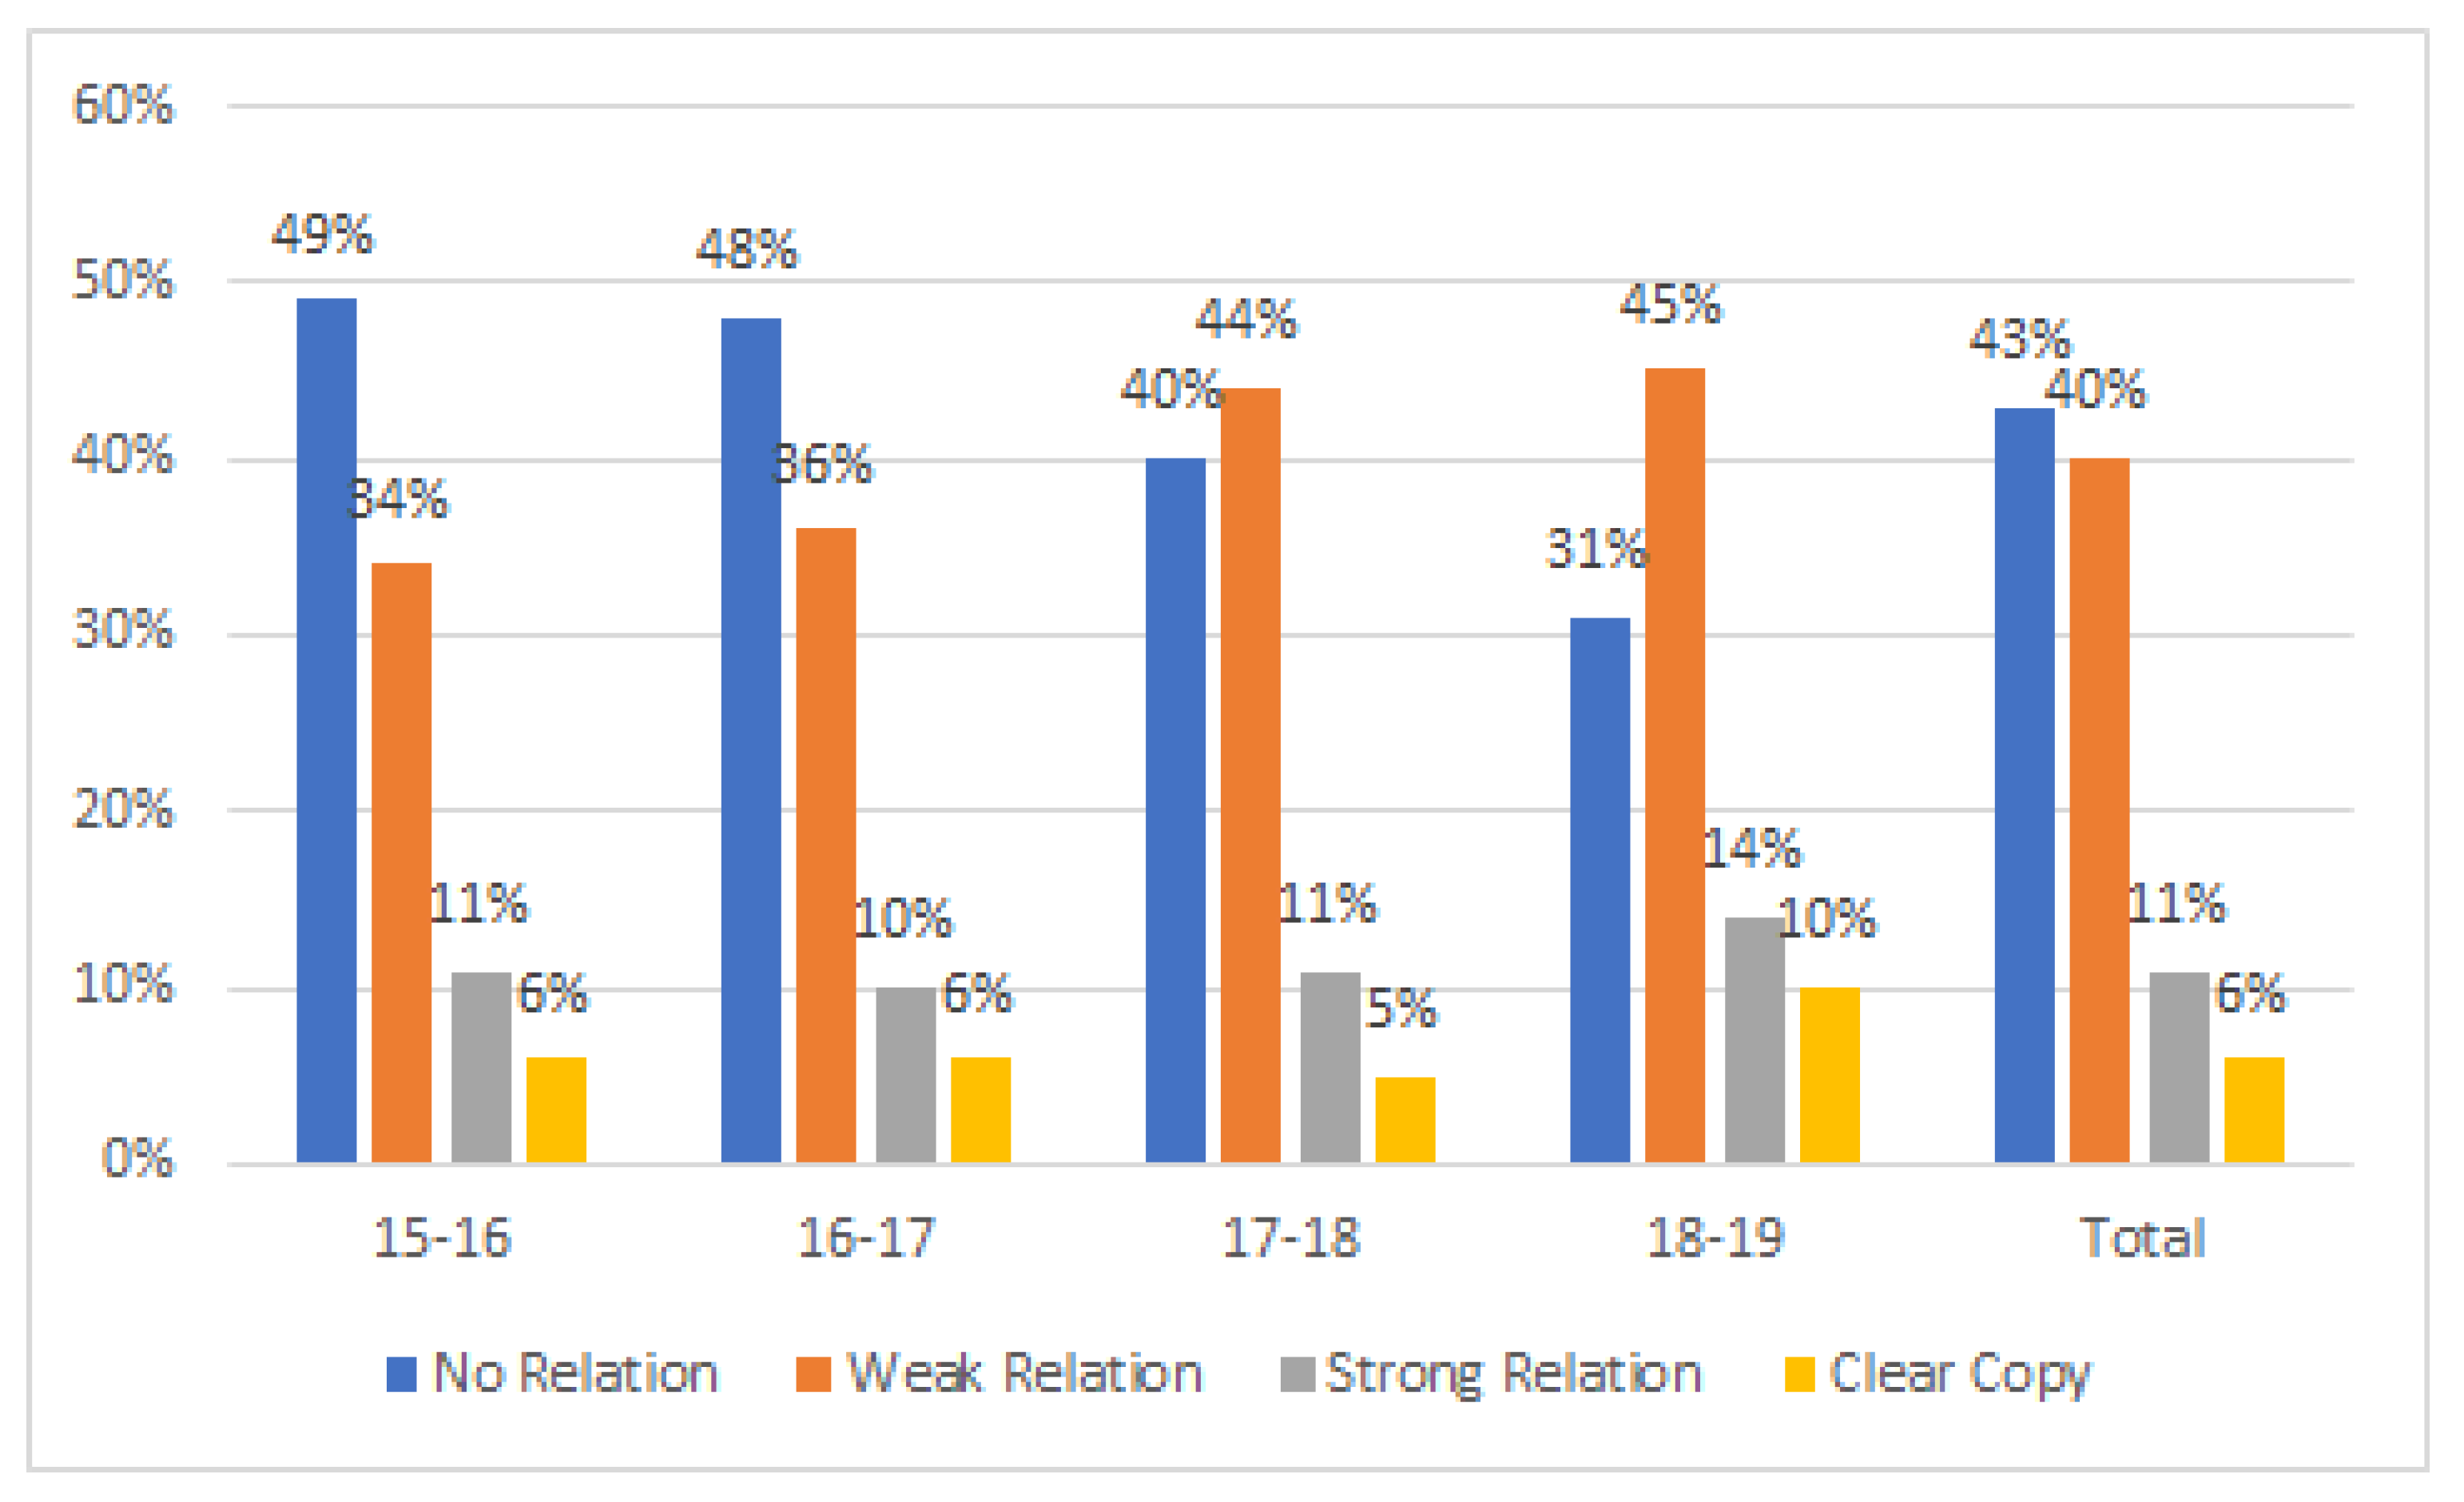
44], who also achieved a substantial decrease in their plagiarism rates in programming tasks thanks to the announced use of automatic copy detection tools (from 14% to 5% or 7%, similar to our results). Works such as [45] also defend the need to inform students about plagiarism control and the consequences this approach has on their academic curriculum.
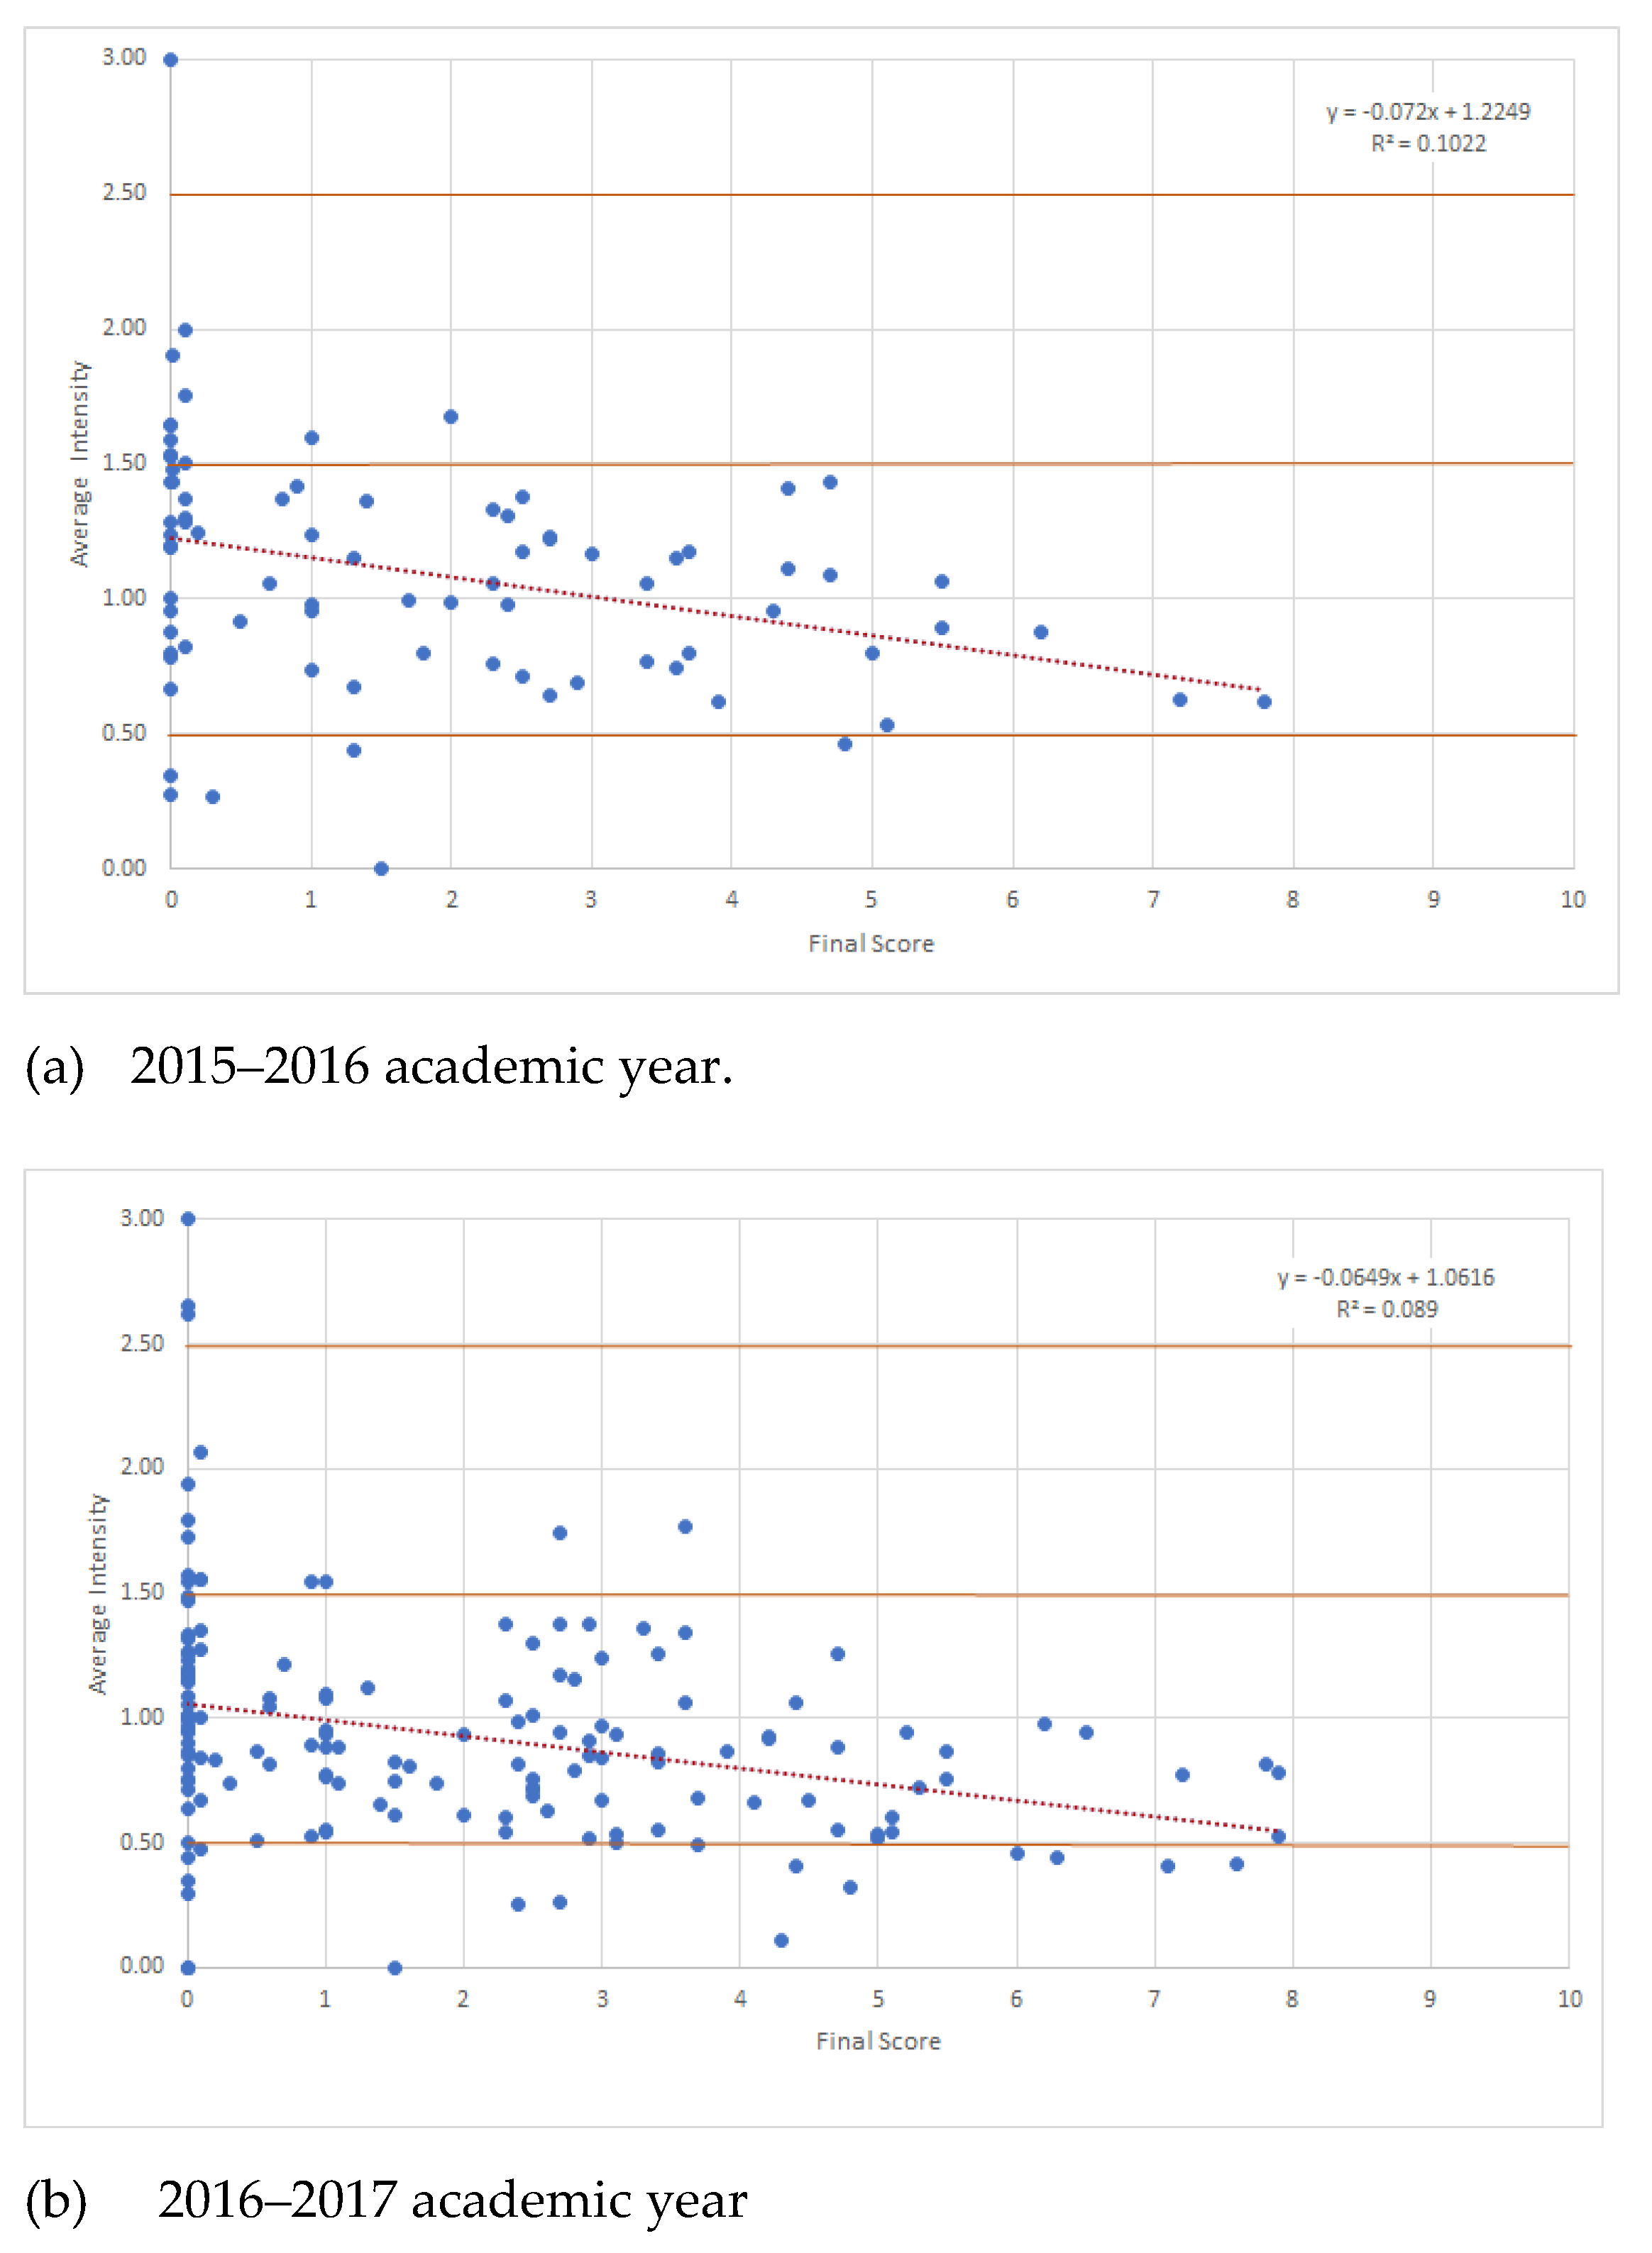
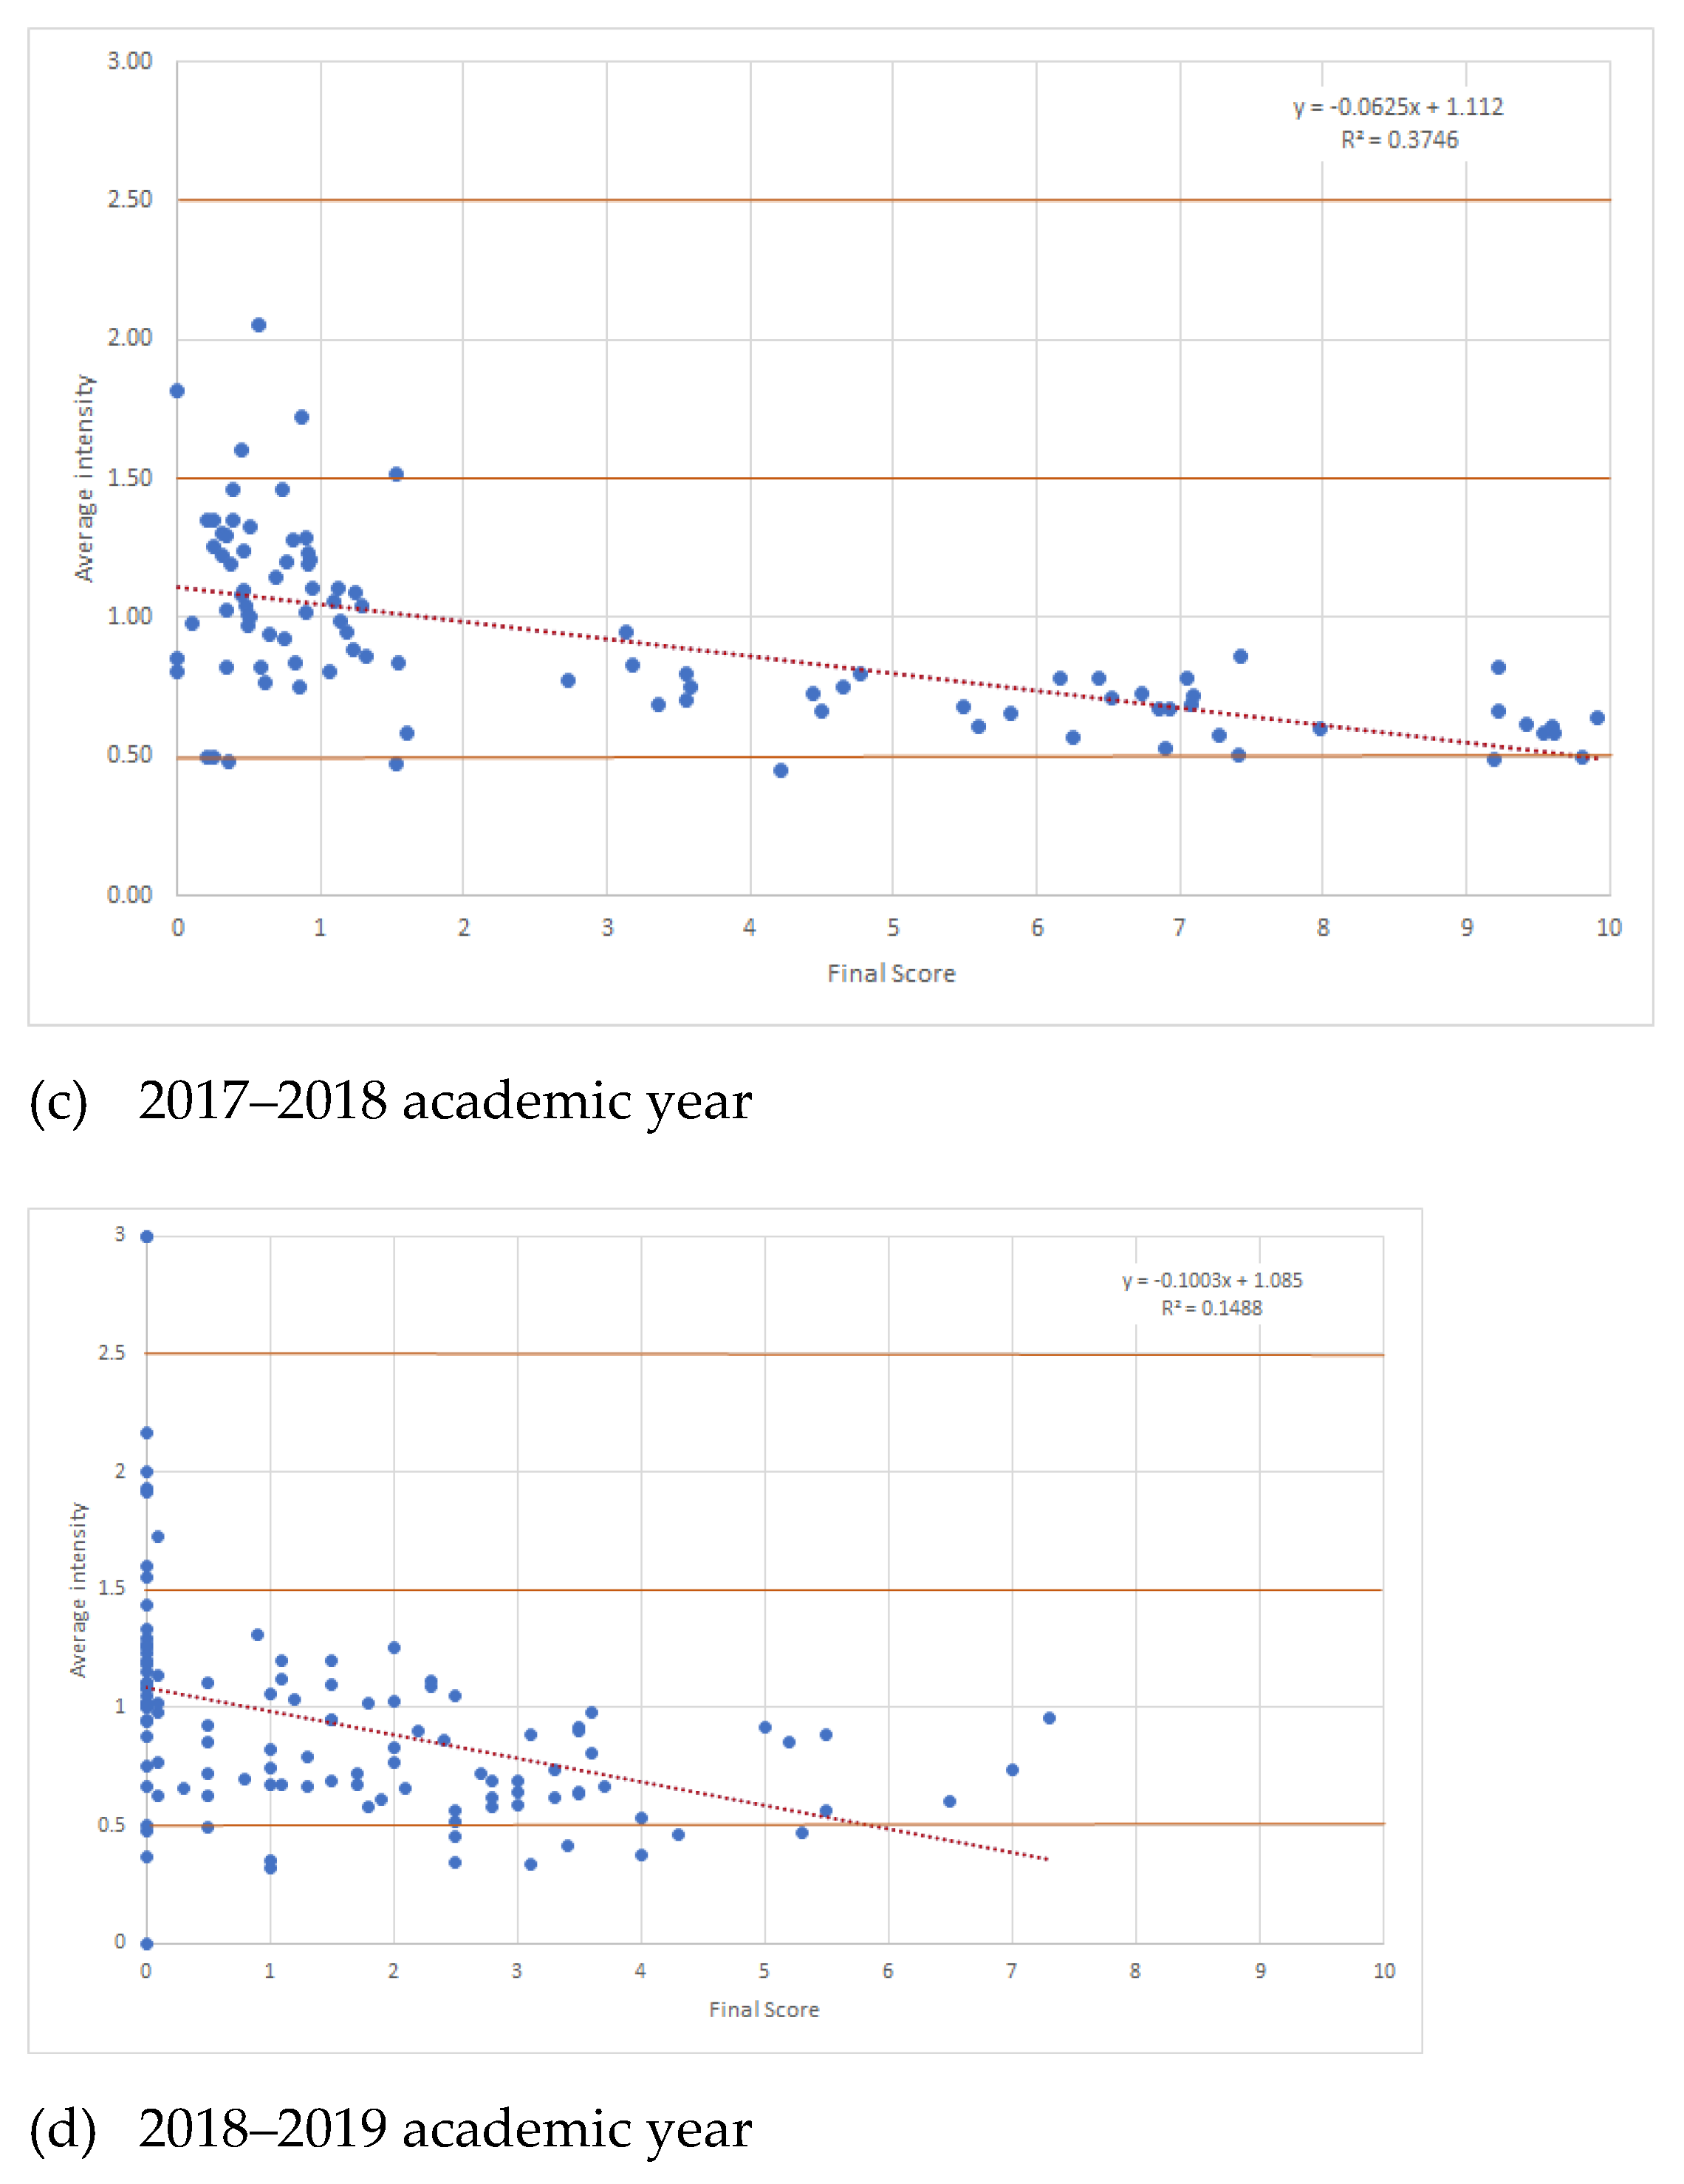
At the other extreme was isolated behaviour in which students did the assignments individually as requested in the course requirements. The similarity between the exercises of these students and their peers was what we called the common background. In general, there was a lot of discussion about the dishonest behaviour of the students, but it can be seen that there was a group of individuals who made an effort to follow the rules, work individually and succeed via their own efforts to pass the subject satisfactorily, although the best students were not always in this group. As we have already shown in this study, these students usually passed the course in their first try with a final score of 7 over 10, often with difficulty, except for the 2017–2018 academic year.
This aspect was discussed among the students, and they claimed that the practical work was very time-consuming. In general, they recognised that they had learned and were satisfied with the knowledge achieved, but because they worked alone, they did not know as many tricks or shortcuts to solve the problems on the theory exam in the time allotted for it. The programs they wrote reached a correct solution, but they did not usually finish all sections of the exam. This was the reason for why their results were good but not the best.
In the middle were the students who helped each other, collaborated and studied together, and we distinguished between those who studied together and those “who study and pass information to each other”, which corresponded to Qhard and Qsoft in our study. We posit that these learners self-organise into study groups that give rise to small learning communities. Collaboration is beneficial for learning [46]. It is a form of study that conforms to a social and active learning method in which learners discuss their own and their peers’ knowledge and help each other with explanations or tricks in order to reach the goal. This process of social construction of knowledge [7,47,48] is an effective way of learning and should not be penalised but encouraged among students, especially if they are at the university level.
The comparison of the documents clearly indicated that a small number of students were responsible for most of the document similarities; that is, there were a set of students that decided to engage in unethical behaviour throughout the course, regardless of the consequences. The analysis clearly identified them as a marginal problem (1%). The data obtained for each academic year were similar, which reinforces these conclusions.
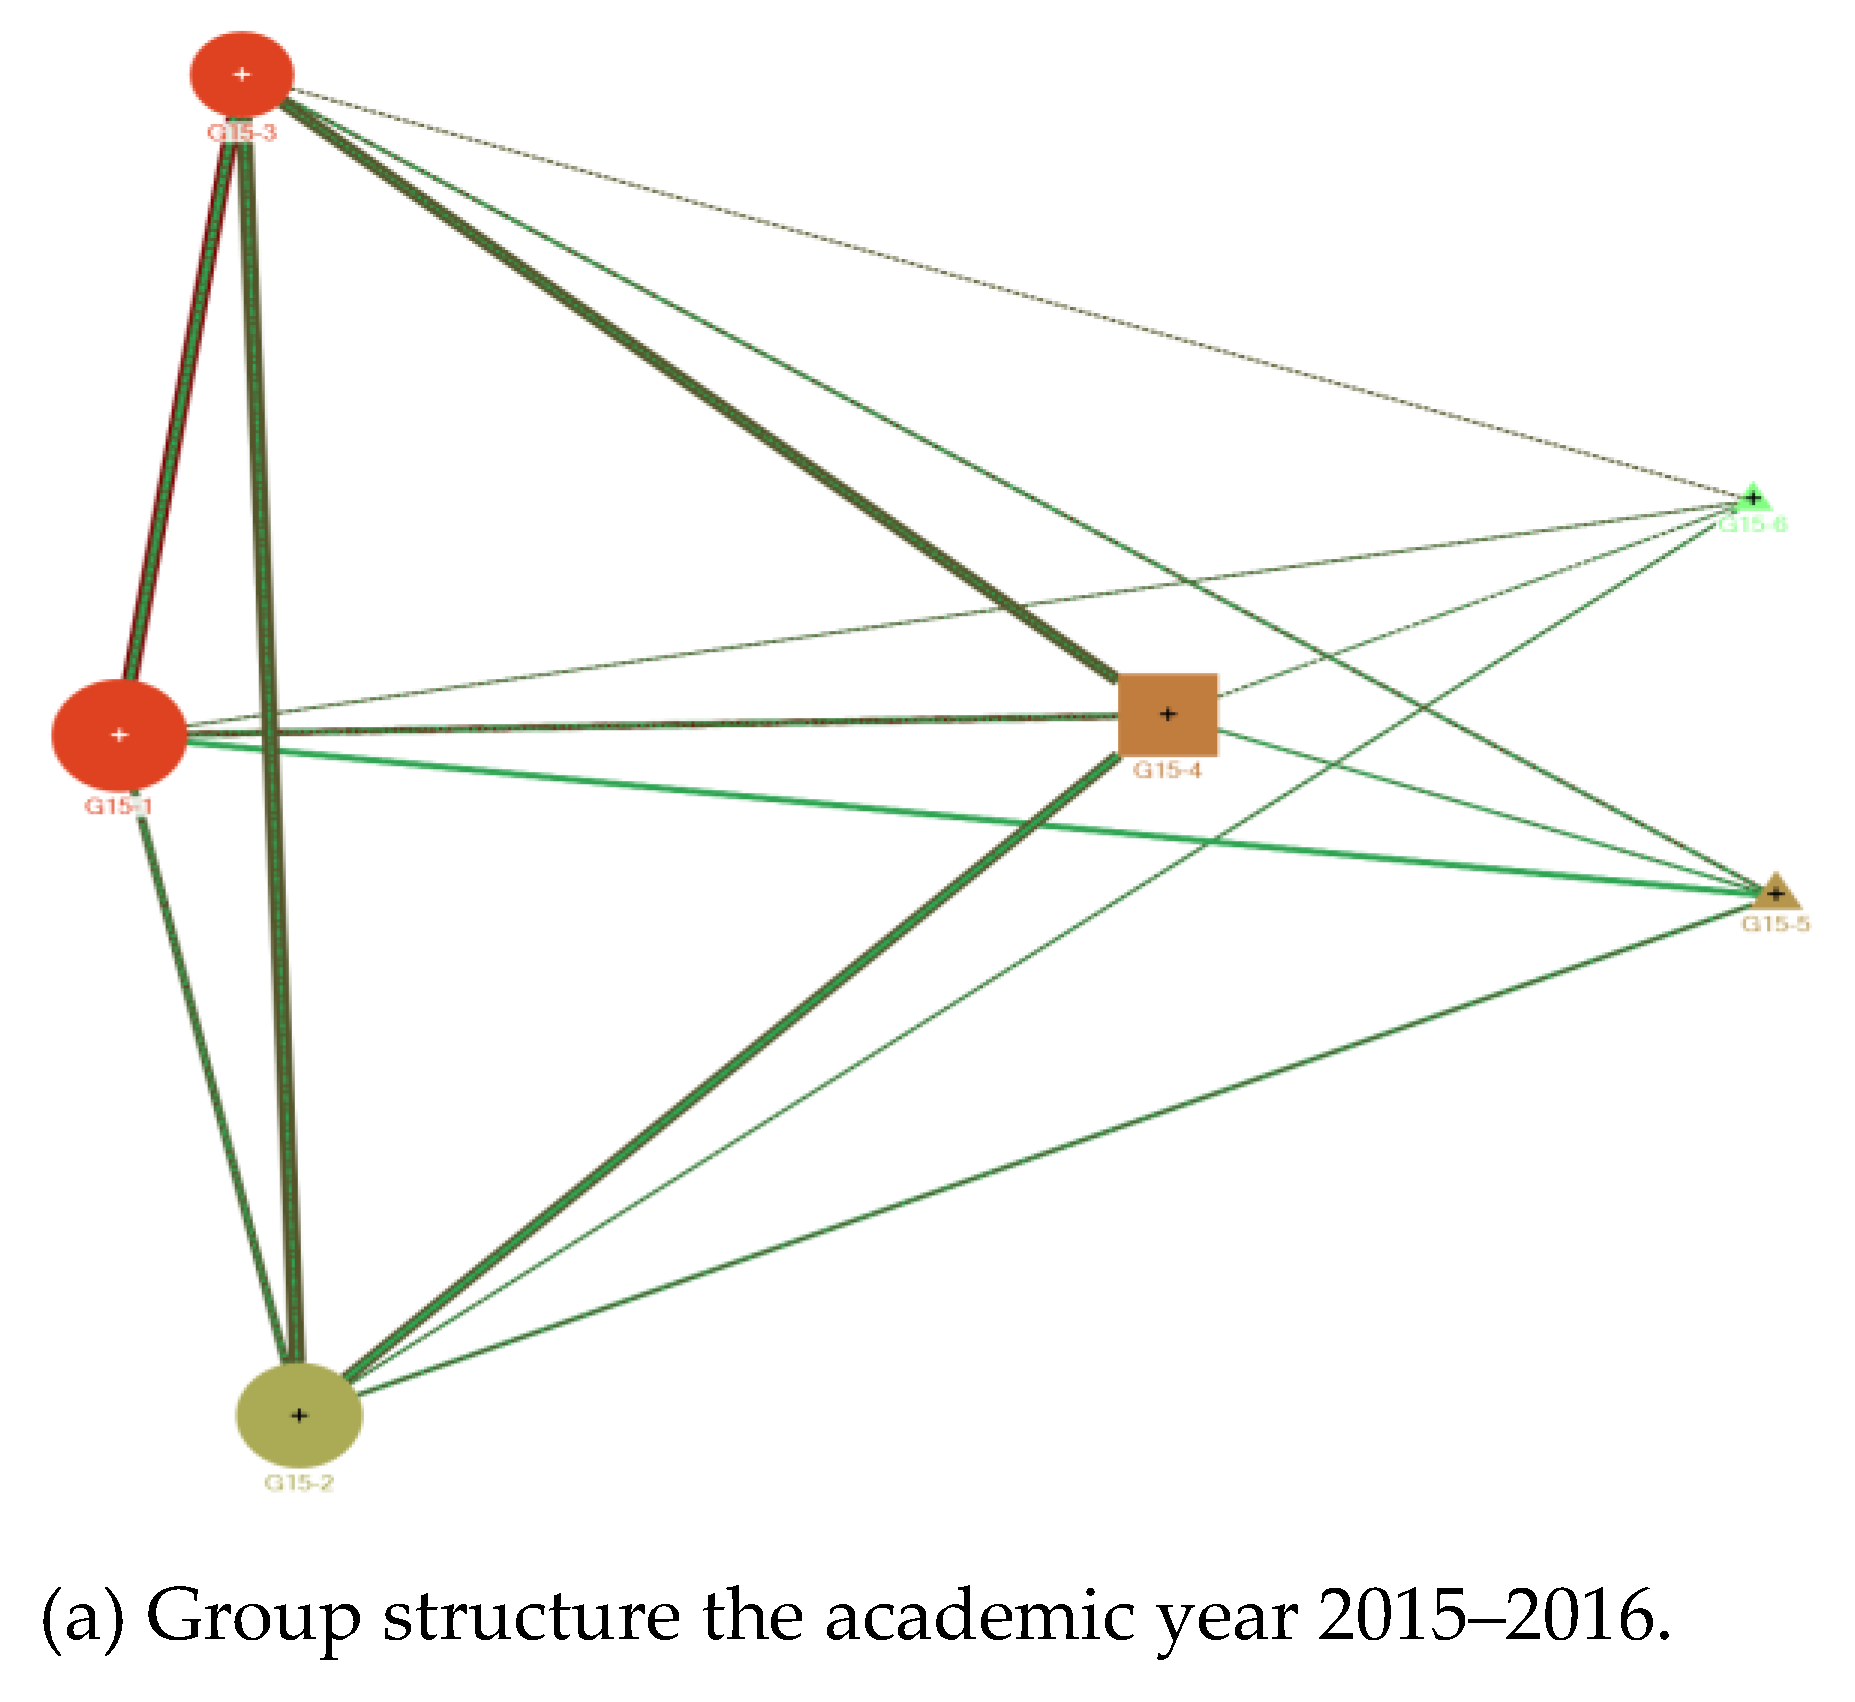
The second study tried to determine how students organise themselves in study groups. Using the Wakita–Tsurumi algorithm, study groups emerged from the data. The number of groups varied from academic year to academic year, and they also varied in the number of students and in their statistical and SNA measures (Table 5). However, the groups of students can be further classified into three different types (Table 6) according to a supervised clustering technique.
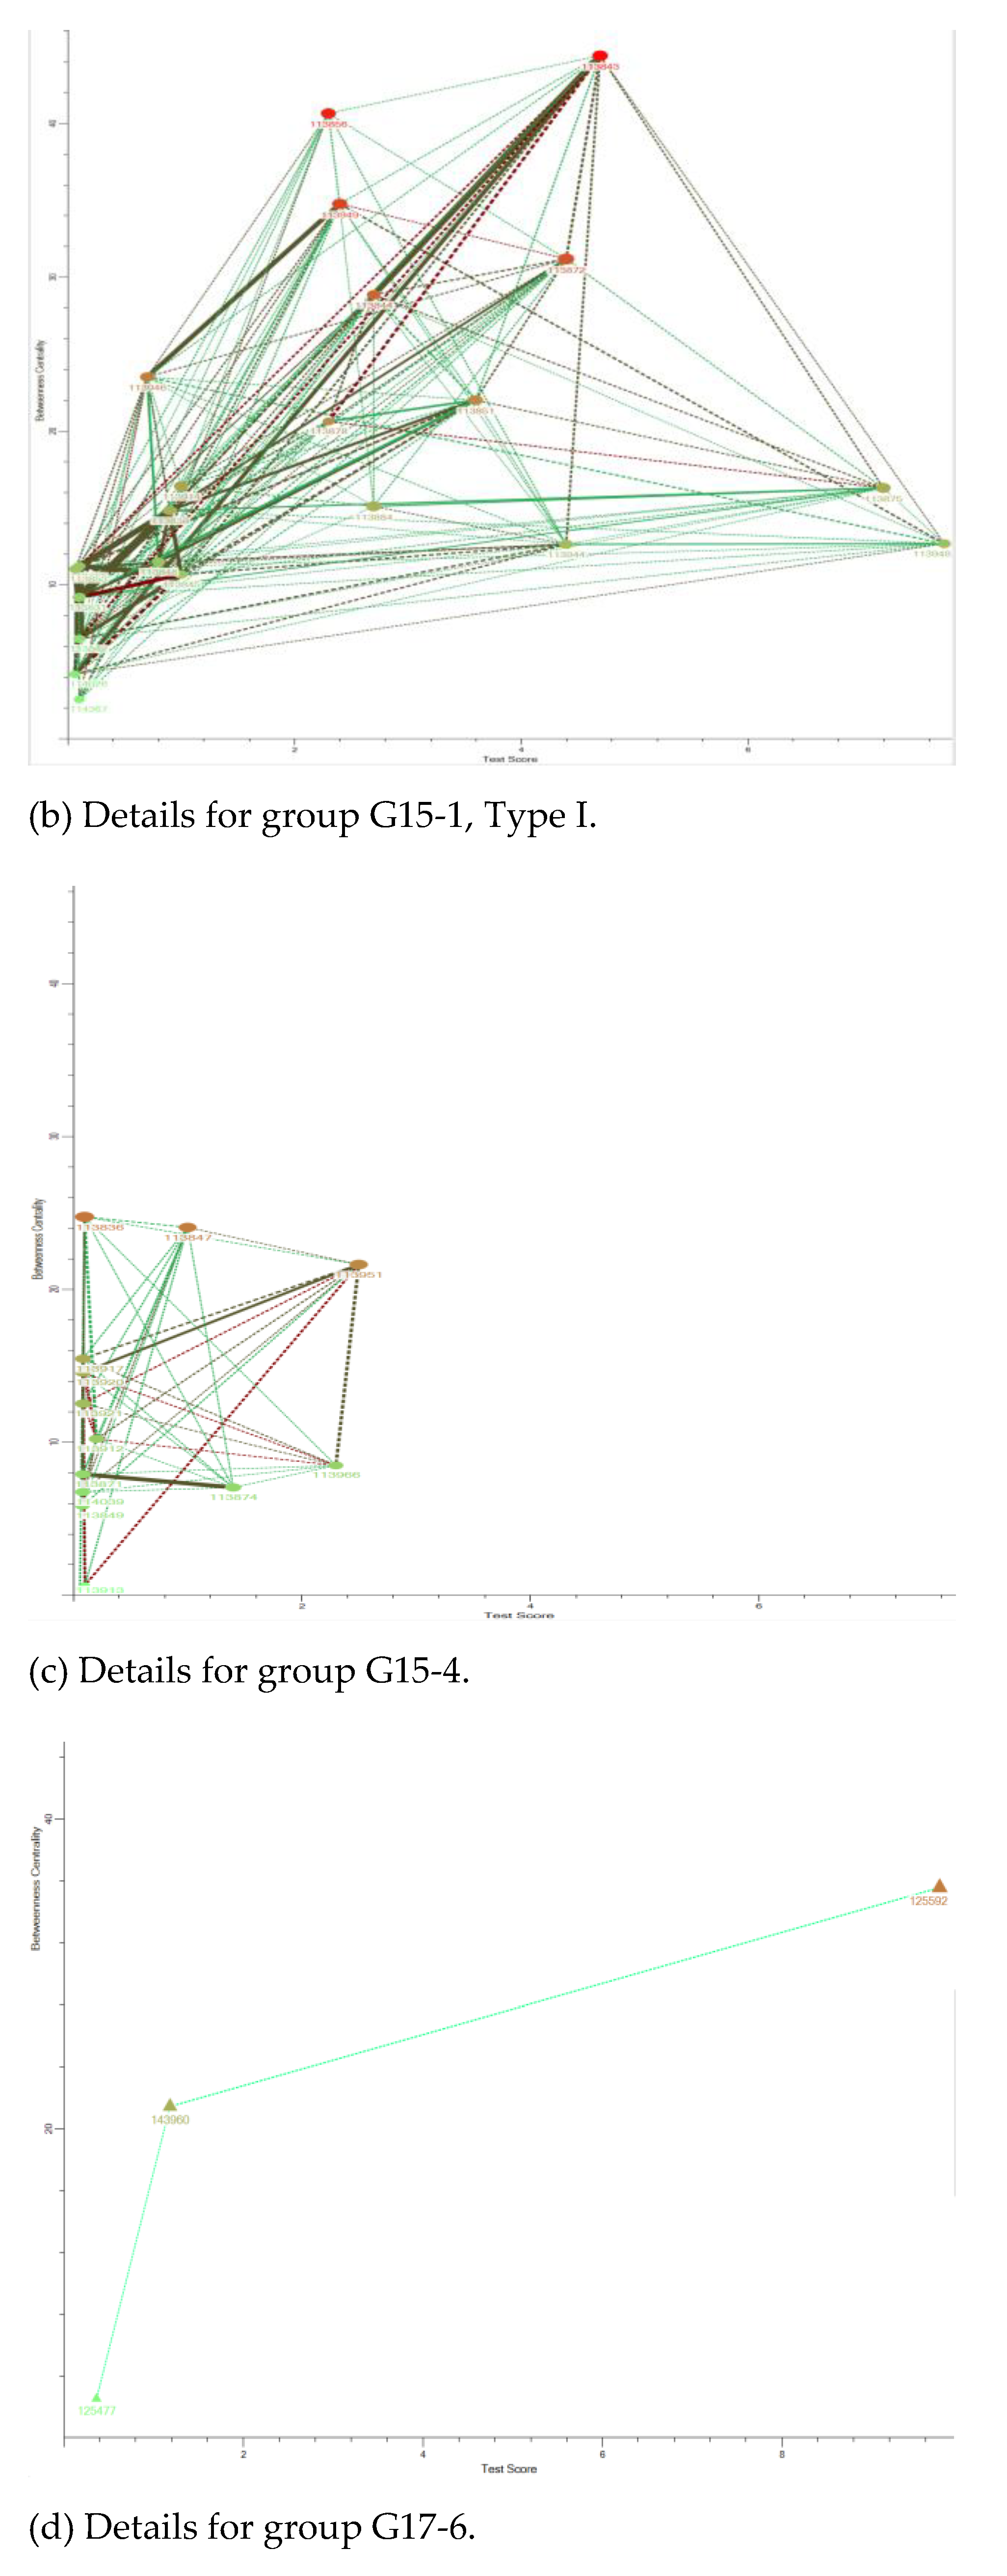
The study groups had an average size of more than 10 and less than 15, which indicates the number of individuals in the class with whom some of the individuals related to on an ongoing basis throughout the course. The relationship was not the same in every case, but each individual mixed better with some classmates than with others. If we consider the groups that emerged, it can be seen that there were direct relationships and relationships of relationships in the group. We identified three types of study groups. Those in Type I were those with the best results, with a more continuous and stable relationship throughout the course. They were students who have a soft relationship with their classmates and who were in study groups with an average size of 18.6, although these students had an average of 6.22 direct relationships in the study group, higher than the average for the network (4.46), compared to 4.22 for the type II group and 0.75 for type III. It could be said that their knowledge flowed more towards the group.
Our third research question was regarding the students with the best results. We saw that they had a Qsoft-type relationship in medium-sized study groups, and that their most continuous relationships were with students in their group at a similar level, while their Qhard relationships were few and with students in their group who had poor results. This leads us to posit that the student who knows less benefits (sometimes dishonestly) from the student who knows more. Another way of interpreting these results is to think that a student who understands the subject and interacts a lot with their classmates but in an honest way (possibly explaining and helping in the practical exercises) has better results in the exam. We understand that this is because they have reflected more on their knowledge, practiced and knew more methods to answer all the exam questions correctly in the exam’s period of time. There were also students who performed very poorly in Type I groups. Here, we can clearly infer which students were the source of knowledge and which were the recipients. In this case, the exam scores were very low, and there was a lot of similarity (Qhard or Qcheat relationships in the subnetwork of that study group) with the peers in the group (not necessarily with the top scorers but in a chain of relationships from one to another).
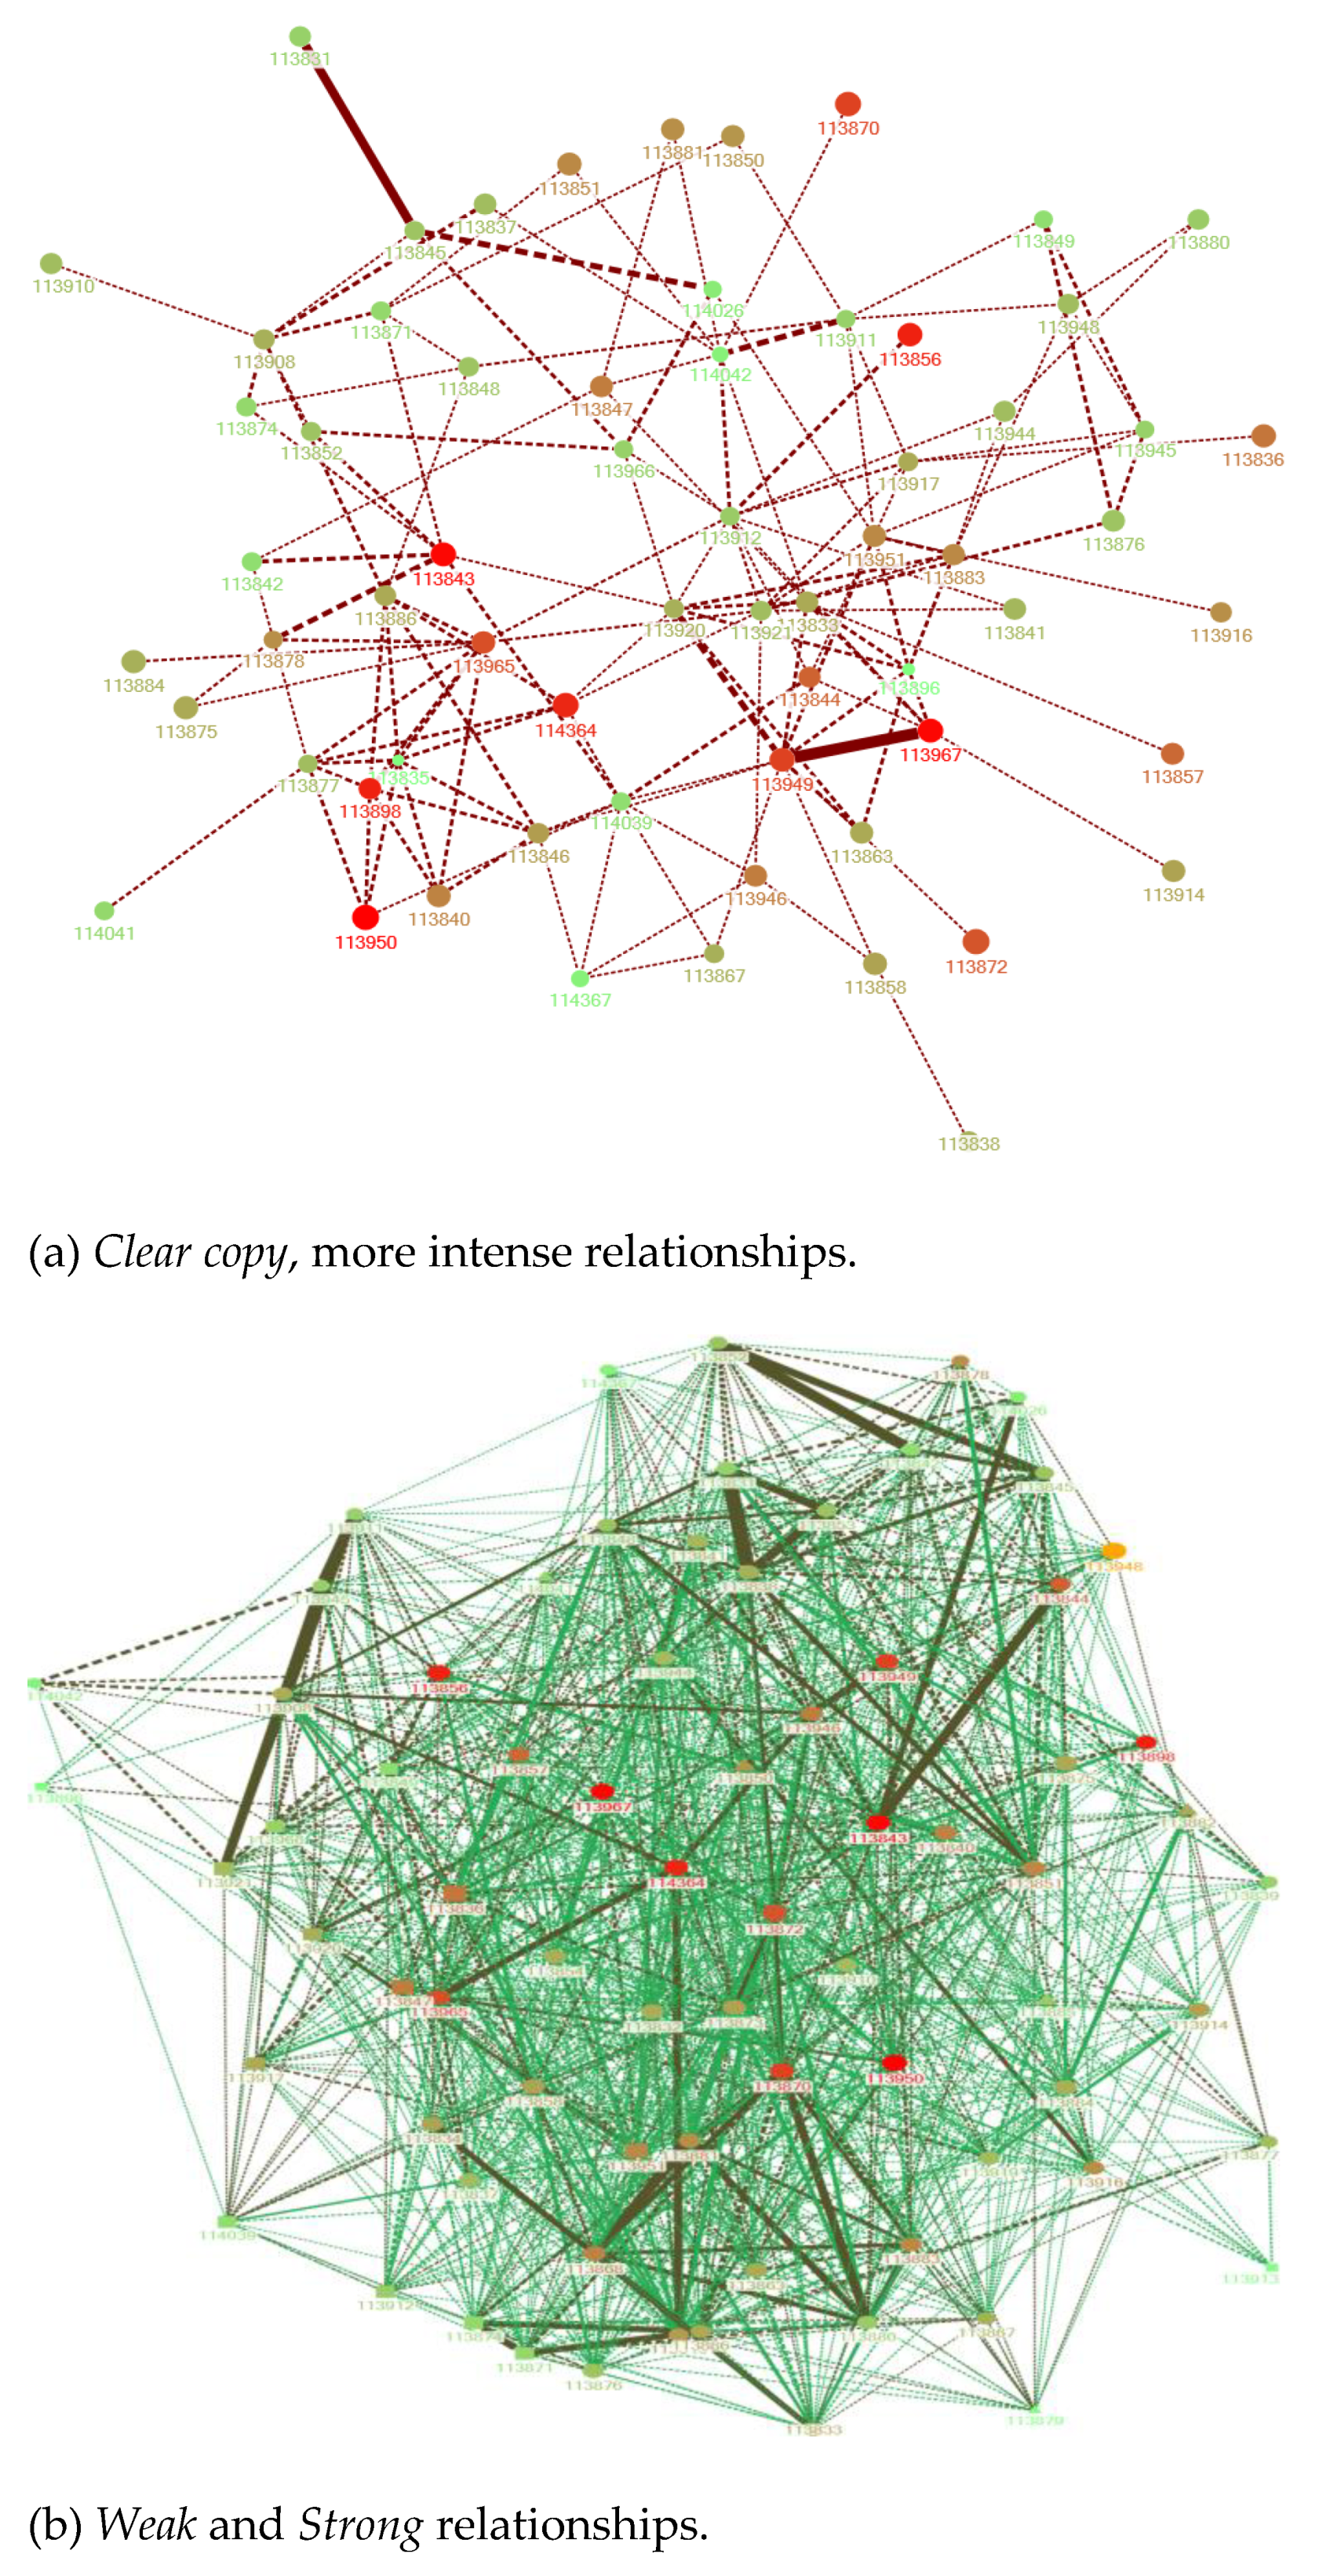
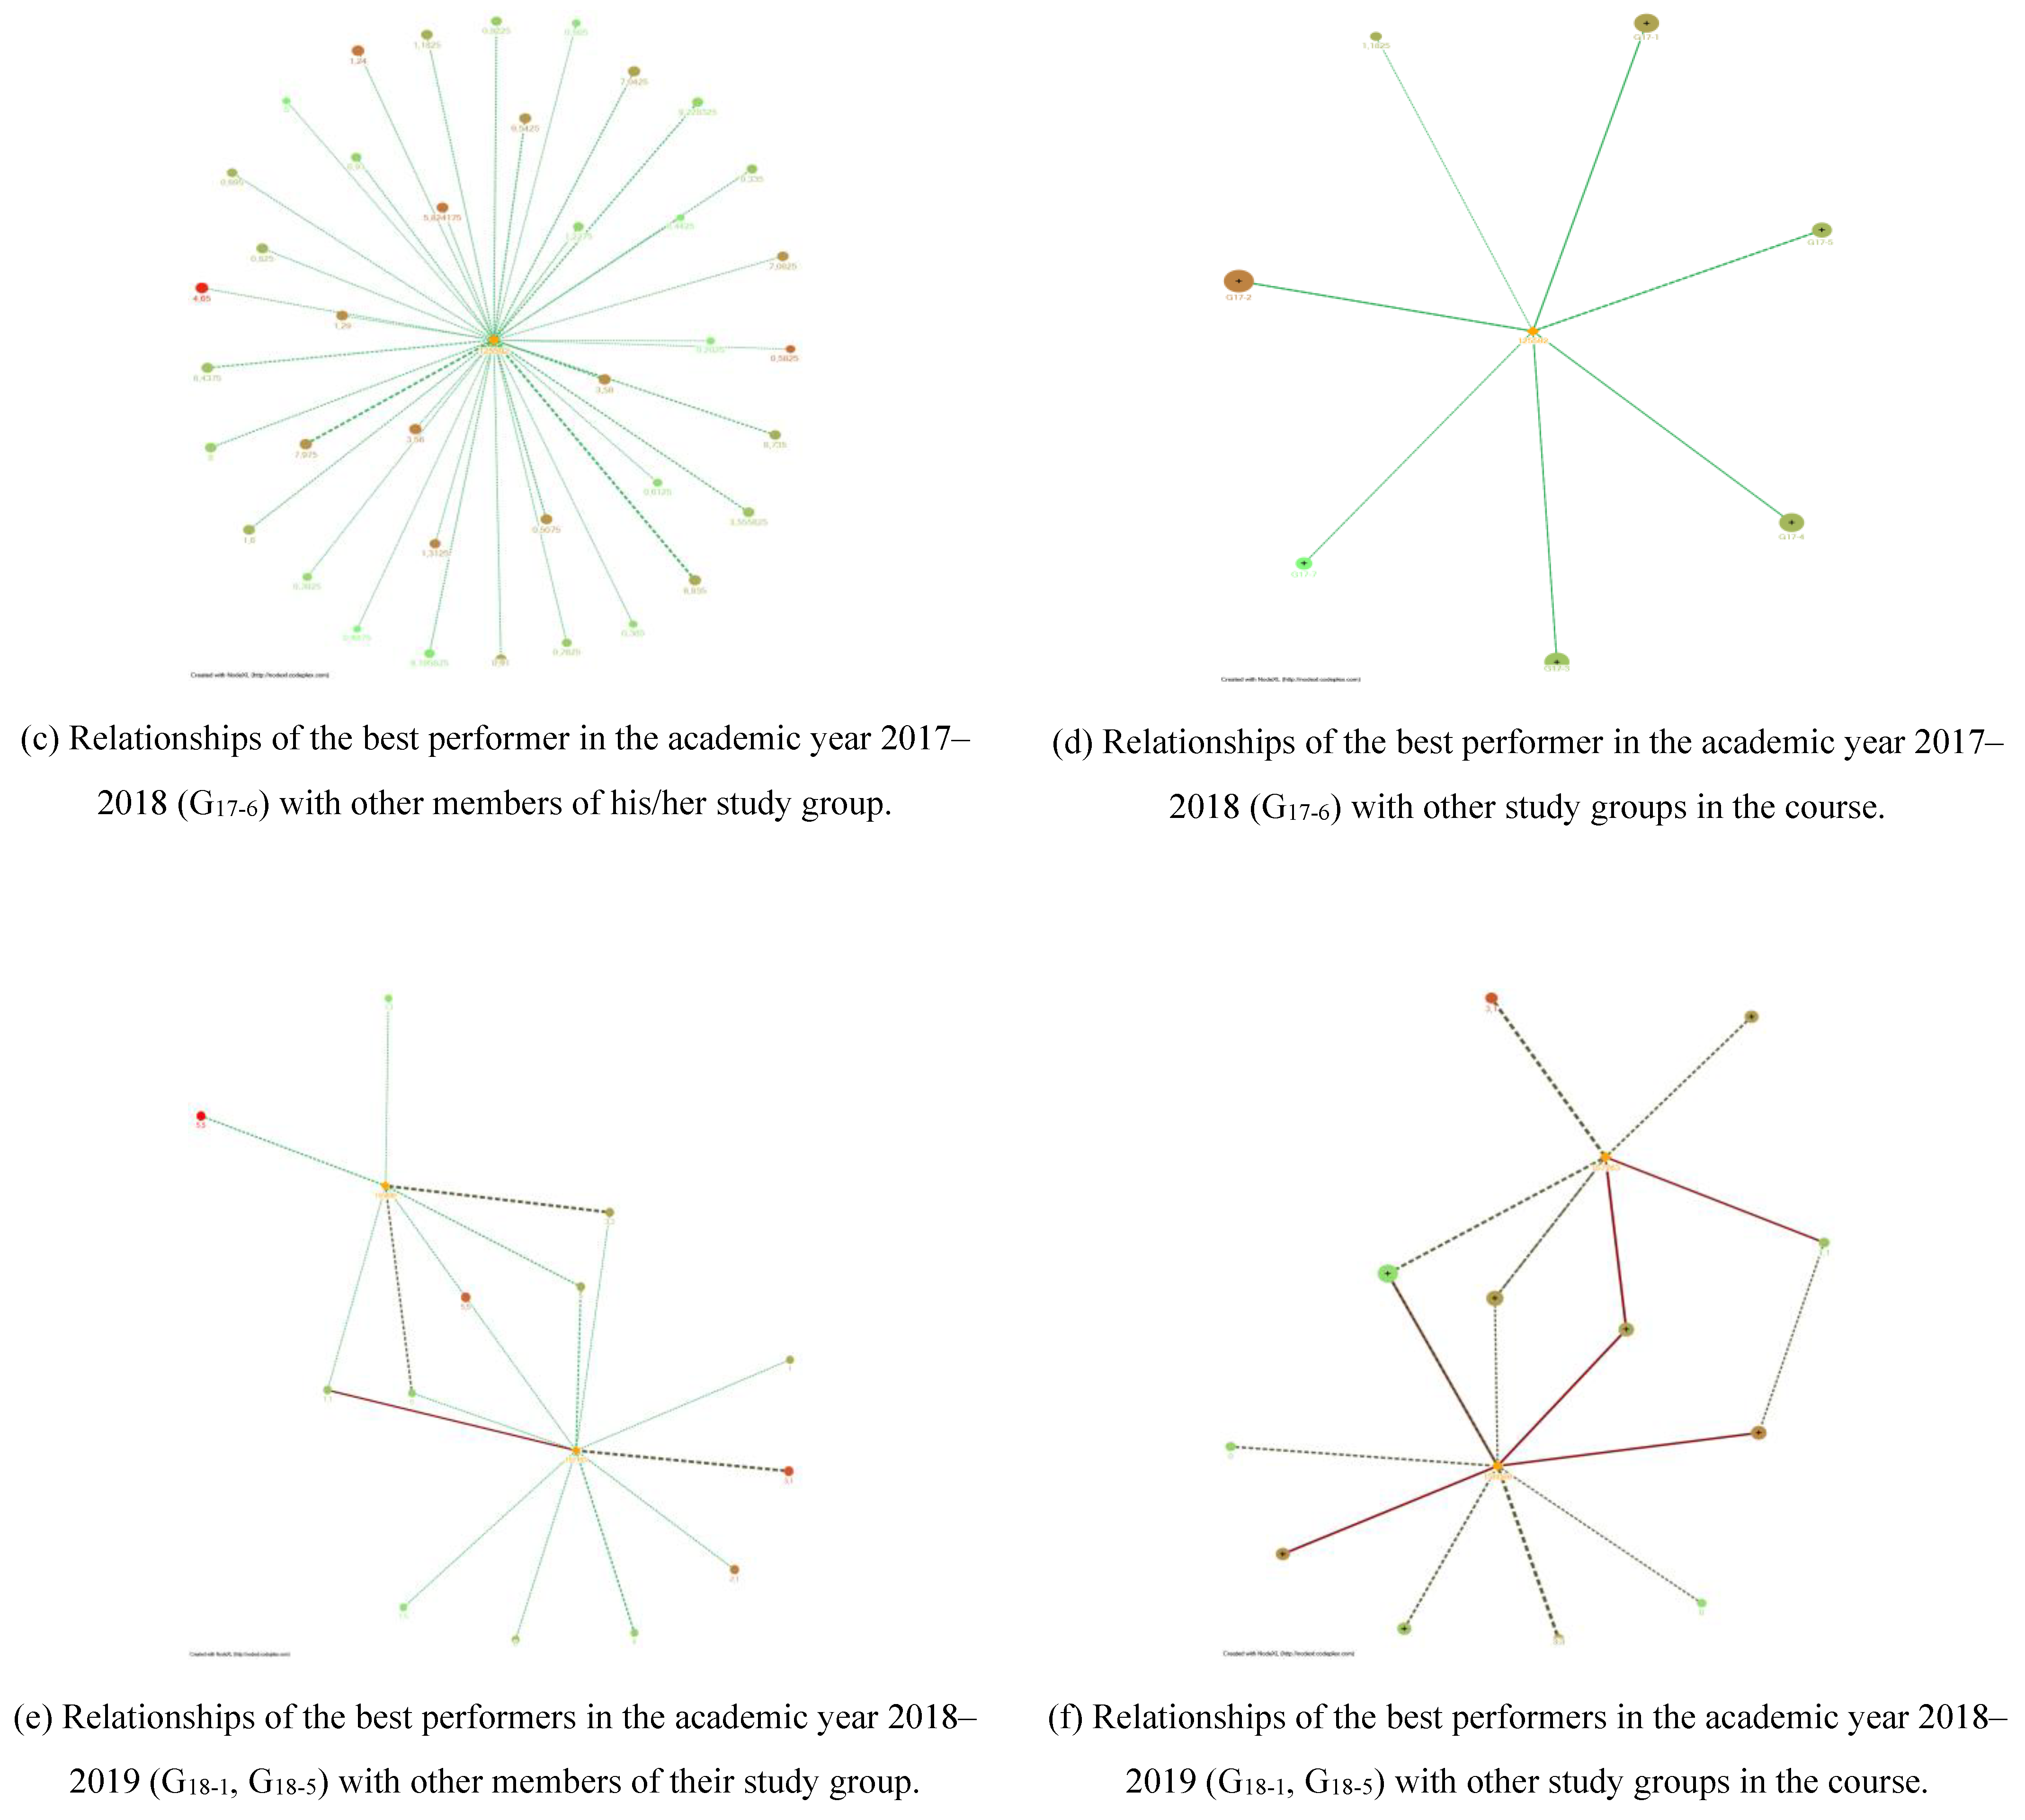
As we have seen in Figure 10, the students with the best marks agglutinated in their direct relationships with students with very different profiles, and they always had some direct link to a node with high intermediation capacity (red) that allowed them to spread their knowledge among the rest of the group. The intensity of the direct relationships of an outstanding student with his peers varied from soft to cheat. This means that they interacted with their peers in different ways, but it can be interpreted as the advanced learner helping, explaining or even being copied by their peers. On the other hand, the intermediary nodes they interacted with had medium achievement, while the rest of the nodes had low achievement. This means that they interacted with students of the same level, and with these there was never a dishonest relationship. The relationship between nodes with higher marks usually did not exist or was of very low intensity, which tells us that the students gained an advantage in talking about their knowledge of the subject, but there was no evidence of transfer of material (no high similarity indexes). We can conclude that successful students had ethical behaviour and tried to help their colleagues. This conclusion is supported by analysing their social network. They were central nodes in the network and commonly belong to Type I study groups.

5.1. Limitations and Future Work

The present work was extensive and thorough, and the quantity and richness of the data we have allow us to carry out other studies that are also of great interest. We plan, for example, to conduct a study during the entire course to see how each student evolves in relation to the study groups and how the study groups themselves evolve. The first exercises were simple so that the student becomes familiar with the programming language, the programming environment and the automatic evaluation system. As they were first-year students, they did not have many acquaintances in the group at first. The difficulty increased as the course progressed, and so did the social relationships among students. This posed the challenge of establishing whether it was possible to infer from the data how the study groups were formed, how they evolved over time and their stability, performance and level of interaction. To address this task, we used TMOSS [49], which analyses how students’ solutions evolve over time. Research is needed to define several phases over time, as well as a set of measures including exercise complexity modelling for the analysis.
In this article, the focus was on successful students and their relationship with the study groups. A detailed study of individuals and their behaviour in the groups remains to be conducted. It would be interesting to understand more about why they have little interaction with peers in the classroom. In the analysis of their documents, the scarce similarity that can be observed was due to the common background and the working style of the teacher. Are they shy students, are they socially integrated with their classmates? Do they show the same behaviour in other subjects? Is it because it is their first year at university?
An interesting aspect of the study’s topic that was not covered here concerns the reasons why students group together or why they cheat. Authors have worked on this topic (Sprajt et al., 2017) by asking students through questionnaires. We propose to model and automate the process with a mixed approach (quantitative and qualitative) to automatically detect situations that allow us to infer motives for some type of unethical behaviour in groups or individually.
An even more ambitious task would be to study a group throughout their entire degree. That would require observing students in at least one subject each year. The challenge is to see how long study groups last and what conditions make them effective for learning.

5.2. Implications

This research promotes the use of plagiarism control tools to obtain social relations between individuals and, from there it is possible to carry out sociological studies on how students work together. This approach is relevant because it proposes a new mechanism for grouping students—since most collaborative learning studies are carried out with groups distributed by the teacher—with specific conditions that aim to favour group work.
Another implication derived from this work is that, in Computer Science studies, students do not copy as much as the teacher initially perceives. Students often help each other, collaborate and share algorithms. However, they did this not in order to save time or improve their marks but as part of the training and learning process. The implication that follows from this conclusion concerns teachers: (1) it is necessary, so the students know how to act and to establish the boundaries between collaboration and cheating; (2) it is also the teacher’s task to propose work and conditions that favour the group’s learning process but that, at the same time, make it possible to differentiate between ethical and unethical behaviour.
It was found that the best performing groups were not made up of the best individual students but of students with different levels of knowledge. Moreover, they were not the largest or the smallest. Study groups arose for reasons more than just knowledge exchange; they were also grouped by social affinity. This implies that study groups were more of a social grouping. Apparently, the exchange of knowledge arises from the disparity of levels, which promotes group work and mutual help.

6. Conclusions

Our study focused on identifying and analysing the flow of knowledge that was produced and how it was produced for the realisation of different practical exercises in the course. The process was based on the similarity between the codes generated by each student. Therefore, the analysis carried out was quantitative in nature, but the social relationships that were established did not have a single goal. In fact, the groups that arose naturally in the classroom may be prompted by mutual convenience or for reasons of friendship, social affinity or other causes, which can only be established through multidisciplinary projects.
The first conclusion is that the study groups were beneficial, as collaboration is good. On the other hand, the affinity characteristics that promote grouping facilitate communication and learning mechanisms. Thus, those who were lagging behind benefited from the support of their peers, while those who were more advanced reinforced their learning by explaining or deepening their knowledge of the different topics. In this work, we identified, taking into account the metrics used, three different types of groups: Type I, II, and III.
Type I groups were characterised by a well-organised structure. They shared the task of knowledge generation and circulation. In this group, the most stable ethical study habits were consolidated, with a greater intensity of flow. In addition, Type I groups had a mainly academic objective, so they improved the performance of their members with ethical behaviour. Type II groups were characterised by a less organised circulation of knowledge flow and generated a less dense network with a weaker structure. On the other hand, a plausible hypothesis is that they may have had an origin external to the subject—a previous relationship or one built within the scope of the course—and therefore did not have an exclusively academic purpose. The most pronounced characteristic of Type III groups was that they formed a very loose network, with a very weak structure and low-intensity relationships. A plausible hypothesis could be that they were made up of students that cheated occasionally.
The social origin of the groups, in any case, requires another study to identify the psycho-social characteristics of the participants and relate them to the corresponding metrics of similarity, intensity and categories. Regarding the ethics of the observed behaviours, we can draw some interesting conclusions. There were not many cases of continuous dishonest behaviour among the students throughout the course.
Finally, in the subject under study, dishonest behaviour was low among the students. This is contrary to other studies on the subject in Computer Science and Engineering. As has already been discussed, we believe that this was due to the fact that the students knew that there was serious and strict control of the results they handed in, the penalties were harsh and the assignments were new every year. This leads us to think that avoiding dishonest behaviour is a task that affects both the students and the teaching staff, and by extension, the institution that certifies their degrees, i.e., their university.

Author Contributions

Conceptualisation, B.B. and F.T.-R.; Data curation, B.B. and A.R.-S.; Formal analysis, F.T.-R.; Investigation, B.B.; Methodology, B.B. and F.T.-R.; Project administration, B.B.; Resources, R.C.; Software, R.C.; Supervision, A.R.-S.; Validation, R.C.; Visualisation, A.R.-S.; Writing—original draft, B.B. and F.T.-R.; Writing—review and editing, R.C. All authors have read and agreed to the published version of the manuscript.

Funding

This research received no external funding.

Institutional Review Board Statement

Not applicable.

Informed Consent Statement

Not applicable.

Data Availability Statement

Anonymised data are available upon request to the corresponding author.

Acknowledgments

Not applicable.

Conflicts of Interest

The authors declare no conflict of interest.

Appendix A

Elements and properties for the graph representing the collaborative social network.
The graph representing the collaborative social network had the following elements and properties.
Table A1. Vertices (Nodes): authors (students).
FeatureValueDescription
LabelStudent identifierA randomly assigned 6 digit student identification code
Label Fill ColourFinal scoreScore obtained in a final exam
ColourBetweenness centralityNumber of times a node acts as a bridge along the shortest path between two other nodes (standard SNA measure)
SizeCloseness centralityStandardised length of paths to disseminate information from the reference node to all the other nodes sequentially (standard SNA measure)
VisibilityBehaviour categoryA measure of the average intensity of the relation between the documents of this author and the documents of others. Defined in Section 3.2.1.
Table A2. Edges represent the relationship between two authors (students) based on the comparison of all the pairs of documents (answers to the same exercises).
FeatureValueDescription
ColourMutual average intensityAverage intensity code across documents authored by two authors
WidthMutual aggregate intensityAggregate intensity, sum of all relation intensities for each author dyad
StyleNumber of documentsNumber of documents matched between vertices of the edge
VisibilityThreshold for mutual average intensityThreshold
Table A3. Metrics: The metrics we used to characterise the social network are.
MetricsDescription
Number of verticesNumber of authors
Number of edgesNumber of authors related at least by one document
Geodesic distanceDistance between two vertices along the shortest path between them
Maximum geodesic distance (diameter)The maximum lengths of geodesic trajectories between dyads (pairs of nodes) in data set
Average geodesic distanceIndicator of whole network cohesion
Graph densityDegree of network connectivity. This is a ratio that compares the number of edges in the graph with the maximum number of edges the graph would have if all the vertices were connected to each other.
ModularityIt measures the network’s capacity for sub-community division
DegreeNumber of edges that are directly connected to the reference node
Betweenness centralityNumber of times a node acts as a bridge along the shortest path between two other nodes
Closeness centralityStandardised length of paths to disseminate information from the reference node to all other nodes sequentially
Eigenvector centralityThe eigenvector centrality network metrics takes into consideration not only how many connections a vertex has (i.e., its degree) but also the centrality of the vertices that it is connected to
Clustering coefficientIt measures how connected a vertex’s neighbours are to one another
PageRankNot applicable, only directed graphs

Appendix B

Table A4. Frequencies of document percentile similarities.
Academic
Year
Documents
Matched
Documents
Highest SimilarityLowest Similarity
p1p2p3p4p1p2p3p4
2015–201670681839284411401245289423558151004
2016–20177862271228391305100641042213825720
2017–2018751128802748104284143251999673514
2018–20193594837151664060115871198433376
Total26,035826899474127369312,910776527462614
Table A5. Matched document statistics.
Academic YearDocuments
Matched
Documents
No RelationWeak
Relation
Strong
Relation
Clear Copy
2015–201670683103 (44%)2210 (31%)773 (11%)982 (14%)
2016–201778624249 (54%)2124 (27%)788 (10%)701 (9%)
2017–201875114325 (58%)1999 (27%)673 (9%)514 (6%)
2018–201935941587 (44%)1198 (33%)433 (12%)376 (11%)
Total26,03513,264 (51%)7531 (29%)2667 (10%)2573 (10%)
Table A6. Author statistics.
Academic YearNodes (Authors)
NumberIndividualsSoftHardCheat
2015–2016826 (7%)64 (78%)11 (14%)1 (1%)
2016–201716119 (12%)127 (79%)12(7%)3 (2%)
2017–2018975 (5%)87(90%)5 (5%)0 (0%)
2018–201911913 (11%)97 (82%)7 (6%)2 (1%)
Total45943 (9%)375 (82%)35 (8%)6 (1%)
Table A7. Statistics on the related author dyads.
Academic YearEdges—Authors Dyads
NumberNo RelationWeak
Relation
Strong
Relation
Clear Copy
2015–201620231001 (49%)684 (34%)221 (11%)117 (6%)
2016–201739901922 (48%)1444 (36%)414 (10%)210 (6%)
2017–201827381094 (40%)1209 (44%)290 (11%)145 (5%)
2018–20192300722 (31%)1036 (45%)311 (14%)231 (10%)
Total11,0514739 (43%)4373 (40%)1236 (11%)703 (6%)

Appendix C

Table A8. Correlations matrix per course among the most important attributes.
MetricsDegreeBetweenness CentralityCloseness CentralityAverage IntensityFinal ScoreDegreeBetweenness CentralityCloseness CentralityAverage intensityFinal Score
2015–20162016–2017
Degree1 1
Betweenness Centrality0.761 ***1 0.568 ***1
Closeness Centrality0.989 ***0.805 ***1 0.983 ***0.553 ***1 ***
Average Intensity−0.048−0.045−0.0751 −0.172 **−0.081−0.1041
Final Score0.471 ***0.377 ***0.49 ***−0.32 ***10.182 **0.010.185 **−0.298 ***1
2017–20182018–2019
Degree1 1
Betweenness Centrality0.725 ***1 0.669 ***1
Closeness Centrality0.993 ***0.741 ***1 0.974 ***0.661 ***1
Average Intensity−0.449 ***−0.287 ***−0.463 ***1 −0.517 ***−0.333 ***−0.54 ***1
Final Score0.544 ***0.385 ***0.553 ***−0.612 ***10.547 ***0.376 ***0.515 ***−0.386 ***1
*** Significant at p < 0.01; ** significant at p < 0.05.

References

  1. Tang, K.C.C. Spontaneous Collaborative Learning: A New Dimension in Student Learning Experience? High. Educ. Res. Dev. 1993, 12, 115–130. [Google Scholar] [CrossRef]
  2. Duffy-Marsan, C. Cheating vs. Collaboration: It’s a Fine Line for Computer Science Students. Available online: https://www.networkworld.com/article/2207623/cheating-vs--collaboration--it-s-a-fine-line-for-computer-science-students.html (accessed on 30 June 2020).
  3. Duffy-Marsan, C. Why Computer Science Students Cheat. Available online: https://www.networkworld.com/article/2207189/why-computer-science-students-cheat.html (accessed on 20 June 2020).
  4. Bidgood, J.; Merrill, M. As Computer Coding Classes Swell, So Does Cheating. 2017. Available online: https://www.nytimes.com/2017/05/29/us/computer-science-cheating.html (accessed on 12 January 2021).
  5. Fraser, R. Collaboration, Collusion and Plagiarism in Computer Science Coursework. Inform. Educ. 2014, 13, 179–195. [Google Scholar] [CrossRef] [Green Version]
  6. Wilcox, P.; Winn, S.; Fyvie-Gauld, M. It Was Nothing to Do with the University, It Was Just the People’: The Role of Social Support in the First-Year Experience of Higher Education. Stud. High. Educ. 2005, 30, 707–722. [Google Scholar] [CrossRef] [Green Version]
  7. Jonassen, D.; Mayes, T.; McAleese, R. A Manifesto for a Constructivist Approach to Uses of Technology in Higher Education. In Designing Environments for Constructive Learning; Duffy, T.M., Lowyck, J., Jonassen, D.H., Welsh, T.M., Eds.; Springer: Berlin/Heidelberg, Germany, 1993; pp. 231–247. [Google Scholar]
  8. Douce, C.; Livingstone, D.; Orwell, J. Automatic Test-Based Assessment of Programming: A Review. J. Educ. Resour. Comput. 2005, 5, 4-es. [Google Scholar] [CrossRef]
  9. Conejo, R.; Barros, B.; Bertoa, M.F. Automated Assessment of Complex Programming Tasks Using SIETTE. IEEE Trans. Learn. Technol. 2019, 12, 470–484. [Google Scholar] [CrossRef]
  10. Aiken, A. Plagiarism Detection. Available online: https://theory.stanford.edu/~aiken/moss/ (accessed on 16 December 2020).
  11. Heon, M.; Murvihill, D. Program Similarity Detection with Checksims. Bachelor’s Thesis, Faculty of Worcester, Worcester, MA, USA, 2015; p. 66. [Google Scholar]
  12. Bejarano, A.M.; García, L.E.; Zurek, E.E. Detection of Source Code Similitude in Academic Environments. Comput. Appl. Eng. Educ. 2015, 23, 13–22. [Google Scholar] [CrossRef]
  13. Chen, X.; Francia, B.; Li, M.; McKinnon, B.; Seker, A. Shared Information and Program Plagiarism Detection. IEEE Trans. Inf. Theory 2004, 50, 1545–1551. [Google Scholar] [CrossRef]
  14. Prechelt, L.; Malpohl, G.; Philippsen, M. Finding Plagiarisms among a Set of Programs with JPlag. J. Univers. Comput. Sci. 2002, 8, 1016–1038. [Google Scholar] [CrossRef]
  15. Knoke, D.; Yang, S. Social Network Analysis, 2nd ed.; Sage Publications: Thousand Oaks, CA, USA, 2008. [Google Scholar]
  16. Carolan, B.V. Social Network Analysis and Education: Theory, Methods & Applications; Sage Publications: Los Angeles, CA, USA, 2013; ISBN 978-1-4129-9947-2. [Google Scholar]
  17. Grunspan, D.Z.; Wiggins, B.L.; Goodreau, S.M. Understanding Classrooms through Social Network Analysis: A Primer for Social Network Analysis in Education Research. LSE 2014, 13, 167–178. [Google Scholar] [CrossRef]
  18. Castilho, D.; Vaz de Melo, P.O.S.; Benevenuto, F. The Strength of the Work Ties. Inf. Sci. 2017, 375, 155–170. [Google Scholar] [CrossRef]
  19. Gasevic, D.; Tsai, Y.-S.; Dawson, S.; Pardo, A. How Do We Start? An Approach to Learning Analytics Adoption in Higher Education. Int. J. Inf. Learn. Technol. 2019, 36, 342–353. [Google Scholar] [CrossRef] [Green Version]
  20. Yang, Z.; Su, Z.; Liu, S.; Liu, Z.; Ke, W.; Zhao, L. Evolution Features and Behavior Characters of Friendship Networks on Campus Life. Expert Syst. Appl. 2020, 158, 113519. [Google Scholar] [CrossRef]
  21. Liu, C.-C.; Chen, Y.-C.; Diana Tai, S.-J. A Social Network Analysis on Elementary Student Engagement in the Networked Creation Community. Comput. Educ. 2017, 115, 114–125. [Google Scholar] [CrossRef]
  22. Marínez, A.; Dimitriadis, Y.; Rubia, B.; Gómez, E.; de la Fuente, P. Combining Qualitative Evaluation and Social Network Analysis for the Study of Classroom Social Interactions. Comput. Educ. 2003, 41, 353–368. [Google Scholar] [CrossRef] [Green Version]
  23. Topîrceanu, A. Breaking up Friendships in Exams: A Case Study for Minimizing Student Cheating in Higher Education Using Social Network Analysis. Comput. Educ. 2017, 115, 171–187. [Google Scholar] [CrossRef]
  24. Brennecke, P. Academic Integrity at the Massachusetts Institute of Technology: A Handbook for Students; Massachusetts Institute of Technology: Cambridge, MA, USA, 2019. [Google Scholar]
  25. Maurer, H.; Kappe, F.; Zaka, B. Plagiarism—A Survey. J. Univers. Comput. Sci. 2006, 12, 1050–1084. [Google Scholar] [CrossRef]
  26. Moon, J. Academic Honesty, Plagiarism and Cheating:A Self-Instruction Unit for Level 3 Student; Bournemouth University: Dorset, UK, 2006. [Google Scholar]
  27. Jordan, D.K. Academic Integrity and Cheating. Available online: https://pages.ucsd.edu/~dkjordan/resources/cheat.html (accessed on 25 July 2021).
  28. Hosny, M.; Fatima, S. Attitude of Students Towards Cheating and Plagiarism: University Case Study. J. Appl. Sci. 2014, 14, 748–757. [Google Scholar] [CrossRef] [Green Version]
  29. Hall, J.; Martin, B.R. Towards a Taxonomy of Research Misconduct: The Case of Business School Research. Res. Policy 2019, 48, 414–427. [Google Scholar] [CrossRef]
  30. Taerungruang, S.; Aroonmanakun, W. Constructing an Academic Thai Plagiarism Corpus for Benchmarking Plagiarism Detection Systems. GEMA Online J. Lang. Stud. 2018, 18. [Google Scholar] [CrossRef]
  31. Chauhan, P. Plagiarism Detection: A Data Search Challenge. Computer 2020, 53, 129–132. [Google Scholar] [CrossRef]
  32. Cosma, G.; Joy, M. Source-Code Plagiarism: A UK Academic Perspective. Source-Code Plagiarism 2006. [Google Scholar]
  33. Faidhi, J.A.W.; Robinson, S.K. An Empirical Approach for Detecting Program Similarity and Plagiarism within a University Programming Environment. Comput. Educ. 1987, 11, 11–19. [Google Scholar] [CrossRef]
  34. Lancaster, T.; Culwin, F. Classifications of Plagiarism Detection Engines. Innov. Teach. Learn. Inf. Comput. Sci. 2005, 4, 1–16. [Google Scholar] [CrossRef]
  35. Lukashenko, R.; Graudina, V.; Grundspenkis, J. Computer-Based Plagiarism Detection Methods and Tools: An Overview. In Proceedings of the 2007 International Conference on Computer Systems and Technologies, Rousse, Bulgaria, 14–15 June 2007; Volume 40, pp. 1–6. [Google Scholar] [CrossRef]
  36. Novak, M.; Joy, M.; Kermek, D. Source-Code Similarity Detection and Detection Tools Used in Academia: A Systematic Review. ACM Trans. Comput. Educ. 2019, 19, 1–37. [Google Scholar] [CrossRef]
  37. Karnalim, O. Simon Syntax Trees and Information Retrieval to Improve Code Similarity Detection. In Proceedings of the Twenty-Second Australasian Computing Education Conference, Melbourne, Australia, 3–7 February 2020; New York, NY, USA, 2020; pp. 48–55, ISBN ISBN 978-1-4503-7686-0. [Google Scholar]
  38. DiPietro, M. 14 Theoretical Frameworks for Academic Dishonesty. Improv. Acad. A J. Educ. Dev. 2010, 28. [Google Scholar] [CrossRef]
  39. Šprajc, P.; Urh, M.; Jerebic, J.; Trivan, D.; Jereb, E. Reasons for Plagiarism in Higher Education. Organizacija 2017, 50, 33–45. [Google Scholar] [CrossRef] [Green Version]
  40. Błachnio, A. Don’t Cheat, Be Happy. Self-Control, Self-Beliefs, and Satisfaction with Life in Academic Honesty: A Cross-Sectional Study in Poland. Scand. J. Psychol. 2019, 60, 261–266. [Google Scholar] [CrossRef]
  41. Krou, M.R.; Fong, C.J.; Hoff, M.A. Achievement Motivation and Academic Dishonesty: A Meta-Analytic Investigation. Educ. Psychol. Rev. 2021, 33, 427–458. [Google Scholar] [CrossRef]
  42. Conejo, R.; Guzmán, E.; Trella, M. The SIETTE Automatic Assessment Environment. Int. J. Artif. Intell. Educ. 2016, 26, 270–292. [Google Scholar] [CrossRef] [Green Version]
  43. Smith, M.A.; Shneiderman, B.; Milic-Frayling, N.; Mendes Rodrigues, E.; Barash, V.; Dunne, C.; Capone, T.; Perer, A.; Gleave, E. Analyzing (Social Media) Networks with NodeXL. In Proceedings of the Fourth International Conference on Communities and Technologies, New York, NY, USA, 25–27 June 2009; pp. 255–264. [Google Scholar]
  44. Mason, T.; Gavrilovska, A.; Joyner, D.A. Collaboration Versus Cheating: Reducing Code Plagiarism in an Online MS Computer Science Program. In Proceedings of the 50th ACM Technical Symposium on Computer Science Education, New York, NY, USA, 22 February 2019; 2019; pp. 1004–1010. [Google Scholar]
  45. Simon; Sheard, J.; Morgan, M.; Petersen, A.; Settle, A.; Sinclair, J. Informing students about academic integrity in programming. In Proceedings of the 20th Australasian Computing Education Conference, New York, NY, USA, 30 January–2 February 2018; pp. 113–122, ISBN 978-1-4503-6340-2. [Google Scholar]
  46. Sabin, R.E.; Sabin, E.P. Collaborative Learning in an Introductory Computer Science Course. In Proceedings of the twenty-fifth SIGCSE Symposium on Computer Science Education, New York, NY, USA, 10–12 March 1994; pp. 304–308. [Google Scholar]
  47. Gergen, K.J. Social Constructionist Inquiry: Context and Implications. In The Social Construction of the Person; Gergen, K.J., Davis, K.E., Eds.; Springer Series in Social Psychology; Springer: New York, NY, USA, 1985; pp. 3–18. ISBN 978-1-4612-5076-0. [Google Scholar]
  48. Moscovici, S. On Social Representations. In Social Cognition; Fargas, J.P., Ed.; Academic Press: London, UK, 1981; pp. 181–210. [Google Scholar]
  49. Yan, L.; McKeown, N.; Sahami, M.; Piech, C. TMOSS: Using Intermediate Assignment Work to Understand Excessive Collaboration in Large Classes. In Proceedings of the 49th ACM Technical Symposium on Computer Science Education, New York, NY, USA, 21–24 February 2018; pp. 110–115. [Google Scholar]
Figure 1. SIETTE framework.
Applsci 11 09328 g001
Figure 2. Workflow of the research.
Applsci 11 09328 g002
Figure 3. Output of MOSS embedded in SIETTE.
Applsci 11 09328 g003
Figure 4. Descriptive study: frequency of behaviour categories {Qindividual, Qsoft, Qhard, Qcheat} for each academic year.
Applsci 11 09328 g004
Figure 5. Frequency of aggregated data on author dyads comparison by percentile for each academic year.
Applsci 11 09328 g005
Figure 6. Complete social map with data from the course in 2015–2016. Nodes are authors.
Applsci 11 09328 g006
Figure 7. Global view of authors’ behaviour and final score; x: final score, y: average intensity (behaviour). Horizontal red lines separate the four classes of behaviour categories {Qindividual, Qsoft, Qhard, Qcheat}.
Applsci 11 09328 g007aApplsci 11 09328 g007b
Figure 8. Global map for the course in 2015–2016 by relationships type.
Applsci 11 09328 g008aApplsci 11 09328 g008b
Figure 9. Details for the different types of study groups.
Applsci 11 09328 g009aApplsci 11 09328 g009b
Figure 10. Sub-chart of the direct relationships of the student(s) with the best final scores in each course.
Applsci 11 09328 g010aApplsci 11 09328 g010b
Table 1. Edges code (Similar_cod + Similar_intensity).
Classification CategoriesDescriptionRelationship between DocumentsIntensity Value
C1No Relationshipp1, p10
p2, p10.25
C2Soft Relationshipp3, p10.5
p4, p10.75
p2, p21
p3, p21.25
C3Strong Relationshipp4, p21.75
p3, p32
C4Clear Copyp4, p32.5
p4, p43
Table 2. Authors behaviour category (Author_behaviour).
Similarity
Behaviour CategoryAverage Intensity ValueInterpretation
Qindividuals[0.0–0.5]Each student coded separately
Qsoft[0.5–1.25]Authors studied together, shared ways of coding but worked on their own
Qhard[1.25–2.5]Authors shared a large amount of code and tried hard to disguise it by making changes
Qcheat[2.5–3.0]Authors engaged in dishonest behaviour
Table 3. Metrics on social networks for each course.
Academic YearGlobalVertices
Average of Vertices (Mean ± Standard Error)
Graph DensityModularityAverage Geodesic DistanceMaximum Geodesic Distance (Diameter)DegreeBetweenness CentralityCloseness CentralityClustering CoefficientAverage Intensity
2015–20160.610.061.38349.34 ± 1.6815.93 ± 1.210.009 ± 00.74 ± 0.011.09 ± 0.05
2016–20170.310.161.73349.57 ± 1.9359.31 ± 6.720.004 ± 00.55 ± 0.010.93 ± 0.04
2017–20180.580.051.40356.45 ± 1.8820 ± 1.30.007 ± 00.72 ± 0.010.87 ± 0.04
2018–20190.330.091.73438.66 ± 1.7443.9 ± 3.350.005 ± 00.53 ± 0.010.93 ± 0.04
Table 4. Indicators for the social map of authors throughout the four courses.
Academic YearBehaviour CategoryAverage of Vertices
DegreeBetweennessClusteringAverage IntensityFinal Score
2015–2016Qindividuals22.505.000.810.304.80
Qsoft54.1418.520.731.047.80
Qhard39.828.260.761.672.00
Qcheat8.000.001.003.000.00
2016–2017Qindividuals34.2131.030.480.307.60
Qsoft54.4768.380.550.917.90
Qhard30.8322.290.581.703.60
Qcheat14.002.420.772.760.00
2017–2018Qindividuals52.4011.250.800.489.82
Qsoft58.1821.150.720.909.92
Qhard30.408.800.661.741.53
Qcheat-----
2018–2019Qindividuals43.6944.180.600.375.30
Qsoft40.7947.450.530.897.30
Qhard9.866.690.381.840.10
Qcheat3.000.000.503.000.00
Table 5. Study groups per course and their metrics.
Academic YearGroup IDVerticesEdgesSingle-Vertex Connected ComponentsMaximum Geodesic Distance (Diameter)Average Geodesic DistanceGraph DensityBest Final ScoreHighest Average Intensity
2015–2016G15-123222021.070.887.801.64
G15-221175021.110.835.503.00
G15-318130021.090.855.501.90
G15-41465031.200.712.502.00
G15-558020.960.806.200.98
G15-6101---0.000.95
2016–2017G16-150571031.510.477.201.94
G16-237330031.520.505.201.75
G16-332359021.240.727.903.00
G16-41354021.210.697.601.26
G16-51251021.130.776.301.55
G16-6824021.000.867.901.18
G16-746010.751.002.501.47
G16-844021.000.677.801.12
G16-9101---3.601.76
2017–2018G17-123225021.060.899.611.12
G17-222196021.100.859.821.32
G17-319125021.200.737.281.48
G17-41795031.250.704.652.01
G17-51042020.960.937.981.71
G17-633010.671.009.920.89
G17-721010.501.000.511.05
G17-8101---0.000.77
2018–2019G18-11876031.490.507.003.00
G18-218122021.140.805.201.06
G18-31769031.440.516.501.43
G18-41564021.300.614.003.00
G18-51568031.270.657.301.56
G18-61352021.230.673.601.31
G18-7927021.110.752.801.13
G18-844021.000.673.501.00
G18-933010.671.001.901.20
G18-1032020.890.675.302.00
G18-1121010.501.000.101.73
G18-1221010.501.000.501.19
Table 6. Study groups: clusters in the SNA.
Custer TypologySymbolCharacterisationGroupsSizeAverage of Highest Final ScoreAverage Intensity
Type ISolid circleClustering around students with good scoresG15-1, G15-2, G15-3, G15-5, G16-1, G16-3, G16-4, G16-6, G16-8, G17-1, G17-2, G17-5, G18-1, G18-3, G18-51518.67.440.89
Type IISolid squareClustering among previously known people/friendsG15-4, G16-2, G16-5, G16-7, G17-3, G17-4, G18-2, G18-4, G18-6, G18-7, G18-101114.64.480.99
Type IIISolid triangleNo defined linkageG15-6, G16-9, G17-6, G17-7, G17-8, G18-8, G18-9, G18-11, G18-1292.12.231.06
Publisher’s Note: MDPI stays neutral with regard to jurisdictional claims in published maps and institutional affiliations.

