Article

Mineral Additives to Enhance Early-Age Crack Resistance of Concrete under a Large-Temperature-Difference Environment

1
School of Water Conservancy Engineering, Zhengzhou University, Zhengzhou 450001, China
2
China Construction Seventh Engineering Division Co., Ltd., Zhengzhou 450001, China
3
Henan Water & Power Engineering Consulting Co., Ltd., Zhengzhou 450001, China
*
Authors to whom correspondence should be addressed.
Submission received: 7 September 2021 / Revised: 28 September 2021 / Accepted: 29 September 2021 / Published: 8 October 2021

Abstract

:
The large temperature difference condition in Northwest China threatens a myriad of concrete structures during construction, with the daily temperature varying by around 40 °C. To investigate the macro-mechanical properties and microstructural characteristics of concrete containing different amounts of mineral admixtures under such harsh conditions, this investigation used an environmental chamber to simulate a saline soil erosion environment with a large temperature difference. Four types of concrete containing different proportions of fly ash and slag were prepared and exposed in the environmental chamber with a daily temperature change of −5~40 °C to investigate their compressive strength, flexural strength, and fracture properties. Moreover, the X-ray diffraction (XRD) characteristics, microscopic morphological characteristics, pore structure characteristics, and post-erosion chloride ion distribution characteristics were also observed and recorded. Results showed that the mineral admixture could improve the early strength development of the concrete and effectively improve the fracture performance of the concrete. The average compressive strength growth rate of concrete from day 3 to day 14 was 83.25% higher than that of ordinary concrete (OC) when 15% fly ash and 15% slag were added. In addition, the fracture energy of the concrete was maximized when 15% fly ash and 20% slag were added, which was 50.67% higher than that of OC; furthermore, the internal compactness and pore structure were optimized, and the resistance to saline soil erosion was strong. This provides a basis for the practical application of compounded mineral admixture-modified concrete in an arid environment with a large temperature difference and saline soil erosion.

1. Introduction

Since the implementation of the “Western Development Strategy” and the “One Belt, One Road” initiative, infrastructure construction in the western part of China has been developing rapidly. A large number of infrastructure projects, including the “Qinghai–Tibet Railway”, have been built, and a large number of infrastructure projects, including the “South–North Water Transfer Project” and other water transfer projects, will be developed or are being developed in the western part of China. The western region is rapidly developing, both economically and socially. Infrastructure construction has made great progress, gradually resolving the issue of unbalanced and insufficient development in the east and west of China. The natural environment in the western region of China is complex and harsh, compared with mild climate areas, and there is a large temperature difference between day and night (the temperature difference between day and night in Xinjiang was previously close to 40 °C), low humidity, dryness, and other characteristics [1], which is not conducive to the development of concrete strength and durability. In dry and low humidity environments, early drying of concrete adversely affects the strength, impermeability, and durability of concrete. Moisture migrates and evaporates from within the concrete [2], which is not conducive to continued hydration reactions; the evaporation of water at an early stage leads to more shrinkage [3], and localized water loss increases capillary stresses, leading to further drying shrinkage [4]. The early heating during the hydration of concrete is affected by large changes in temperature [5], generating uneven temperature stresses, and as the temperature difference increases, the concrete becomes more susceptible to cracking [6,7] and its mechanical properties decrease as the number of cycles with a large temperature differences increases [8]. In addition, more than 1000 different types of salt lakes are located in the western region, and their surrounding saline soils are widely distributed [9] and contain a large number of aggressive ions, such as Cl and SO42− [10]. As concrete has initial defects such as initial cracks and pores, aggressive ions from the environment enter the concrete interior, causing corrosion of reinforcements and producing expansive defects causing concrete cracking [11,12], which affect the durability and safety of concrete structures.
Recently, there have been more studies on the effects of temperature cycling changes on concrete properties. Ye Zhongzhi et al. [13] investigated the effect of sub-temperature cycles (normal temperature ~200 °C) on the mechanical properties of concrete. Under sub-temperature cycles, the evaporation of free water from concrete led to the formation of micro-pores and micro-cracks, which caused degradation in the mechanical properties of concrete, such as compressive strength, modulus of elasticity, and Poisson’s ratio. In the process of temperature cycling, the first temperature cycle led to the worst degradation of the mechanical properties of concrete, and the subsequent temperature cycles had a gradually decreasing effect on the properties of concrete. M.M. Shokrieh et al. [14] investigated the effect of different temperature cycles on the strength of concrete, where the compressive strength and the shear strength of concrete were reduced by 4.9% and 17.4%, respectively, under cycles in the range of 25 to 70 °C. An Mingzhe et al. [15] found that the splitting strength of concrete was most sensitive to temperature cycling from 20 to 65 °C. The change in thermal stresses generated by the temperature cycling led to cracks in the interface transition zone first, and further temperature cycling led to the expansion and connection of cracks in the interface transition zone with cracks in the cement matrix. Ambient humidity has an important influence on the microstructure and macroscopic properties of concrete [16]. Li Shuguang et al. [17] tested the mechanical properties of three groups of concrete specimens placed in a dry environment after 3, 7, and 28 days of standard curing, and they found that the compressive strength and the splitting tensile strength of concrete dried for 28 days after 3 and 7 days of standard curing were not significantly different from those after 28 days of standard curing. However, after 90 days, the compressive strength and the splitting tensile strength of concrete dried after 3 days of standard curing were 11% and 13% lower than those of concrete dried after 28 days of standard curing, respectively. Zhang Guohui et al. [18] found that, with the increase in drying temperature, the compressive strength of concrete showed a trend of decreasing first and then increasing, while the splitting tensile strength decreased. Wei Ya et al. [19] found that the compressive strength and the flexural strength of ordinary concrete and internally cured concrete exposed to a dry environment were both significantly reduced, which showed that the technology of internal curing could not significantly improve the cracking resistance of concrete, and the negative impact on the development of the properties and strength of concrete in a dry environment was significant. The erosion of concrete by saline soils is more severe in low-humidity environments with large temperature cycles. When the concrete produces defects such as cracks and pores due to temperature changes, on the one hand, the sulfate ions in the saline soil enter the concrete interior and react with the hydration products to produce expansive erosion products—ettringite (AFt) or gypsum [20]—or transform into bulky crystalline hydrates [21] and some sulfate crystals [22], which produces swelling stresses and leads to concrete cracking. On the other hand, chloride ions in saline soils enter the concrete interior and destroy the oxide film on the surface of the reinforcement, leading to corrosion of the reinforcement, which makes the bond interface between the reinforcement and the concrete swell and crack, leading to concrete cracking [23,24,25]. Among the methods used to investigate the macro-mechanical properties of concrete under conditions of different temperatures and humidity, most studies have used the fracture test method. Francesca Ceroni et al. [26] used the shear test and beam test (three-point bending test) to investigate the effect of temperature and humidity on the bonding properties of composite materials, and the three-point bending test was effective in reflecting the bonding properties of the material. Dario De Domenico et al. [27] conducted a three-point bending test using notched beams in their study of the effect of different temperatures on the bonding performance and ultimate load-carrying capacity of strengthening composite systems at 100% humidity, which was more in line with the results of the single-lap or double-lap shear tests widely used in the study.
Mineral admixtures such as fly ash and slag can partially replace ordinary silicate cement, which can improve the pore structure of concrete [28], improve the durability of concrete, reduce the risk of cracking [29], and reduce the amount of cement used and CO2 emissions during the generation of ordinary silicate cement [30]. Zhao Yanhua et al. [31] found that fly ash and slag could decrease the total shrinkage of high-performance concrete significantly, but increased the self-shrinkage. Kou Shicong et al. [32] prepared recycled concrete with 25%, 35%, and 55% of fly ash and found that the highest compressive strength and elastic modulus of concrete were achieved with 55% fly ash, which effectively improved the resistance of concrete to chloride ion penetration. Therefore, this study uses concrete modified by compound mineral admixtures (fly ash and slag) and a large temperature difference as the object of study, which is in line with the actual engineering conditions.
Current research on the effects of low humidity, temperature differences, and saline soil erosion on concrete structures is mainly focused on durability and strength, and most studies on the early crack resistance of mineral admixtures under the combined effects of low humidity, temperature differences, and saline soil erosion have been carried out under standard curing conditions, which are different from the actual situation. Therefore, this paper uses an environmental chamber to simulate the natural environment of large temperature differences and saline soil erosion in Northwest China and investigates the compressive strength, flexural strength, and fracture properties of concrete modified by fly ash and slag at different ages under such harsh curing conditions. The study provides a basis for the practical application of concrete modified by fly ash and slag in Northwest China and other similar environments. The observations presented here might enhance the understanding of the toughened mechanism of mineral admixtures in real civil engineering.

2. Experimental Program

2.1. Materials

Portland cement (P.O.42.5) was used as the main binding material in this study. The physical properties and the chemical components of the cement are shown in Table 1. Fly ash (Grade I) and slag (Grade S95) were used as the mineral admixtures. The physical properties of fly ash and slag are shown in Table 2. Natural river sand was used as a fine aggregate, with a fineness modulus of 2.85 and an apparent density of 2640 kg/m3. The coarse aggregate was made of natural crushed stone with a particle size of 5~20 mm and an apparent density of 2760 kg/m3. Common tap water was used for concrete pouring and salt solution configuration. Sodium chloride and sodium sulfate produced by a company in Zhengzhou were used in the salt solution as the important solute. A high-range water reducer was used to improve the fluidity of the concrete mixture. Actual projections projects showed that the fly ash content can be controlled within 20% and the slag content can be controlled within 40% under good curing conditions. However, under harsh curing conditions, the fly ash content and slag content should be controlled within 15% and 20%, respectively, and more than 10% fly ash can effectively improve the sulfate resistance of concrete [33]. In this study, concrete specimens were placed in an environment simulating the erosion of saline soil and a large temperature difference, and four groups of concrete with different fly ash and slag content were set. Fly ash and slag were mixed in equal quantities instead of cement, and the water–binder ratio (W/B) was 0.4. The mix proportions of concrete are given in Table 3.

2.2. Specimen Preparation

According to the “Test code for hydraulic concrete” (SL/T352-2020) [34], the coarse aggregate, fine aggregate, cement, fly ash, and slag were successively added into the concrete mixer to be mixed for 2 min, and then water and water reducer were mixed for 2 min in the concrete mixer. After the concrete mixture met the slump requirement, the concrete mixture was injected into the test molds, and they were vibrated for 1 min on a shaking table and then placed in a forming room, and the surface of the test molds was covered with plastic film to prevent water loss. After 24 h, the concrete specimens were separated from the molds and placed into the environmental chamber, as shown in Figure 1.

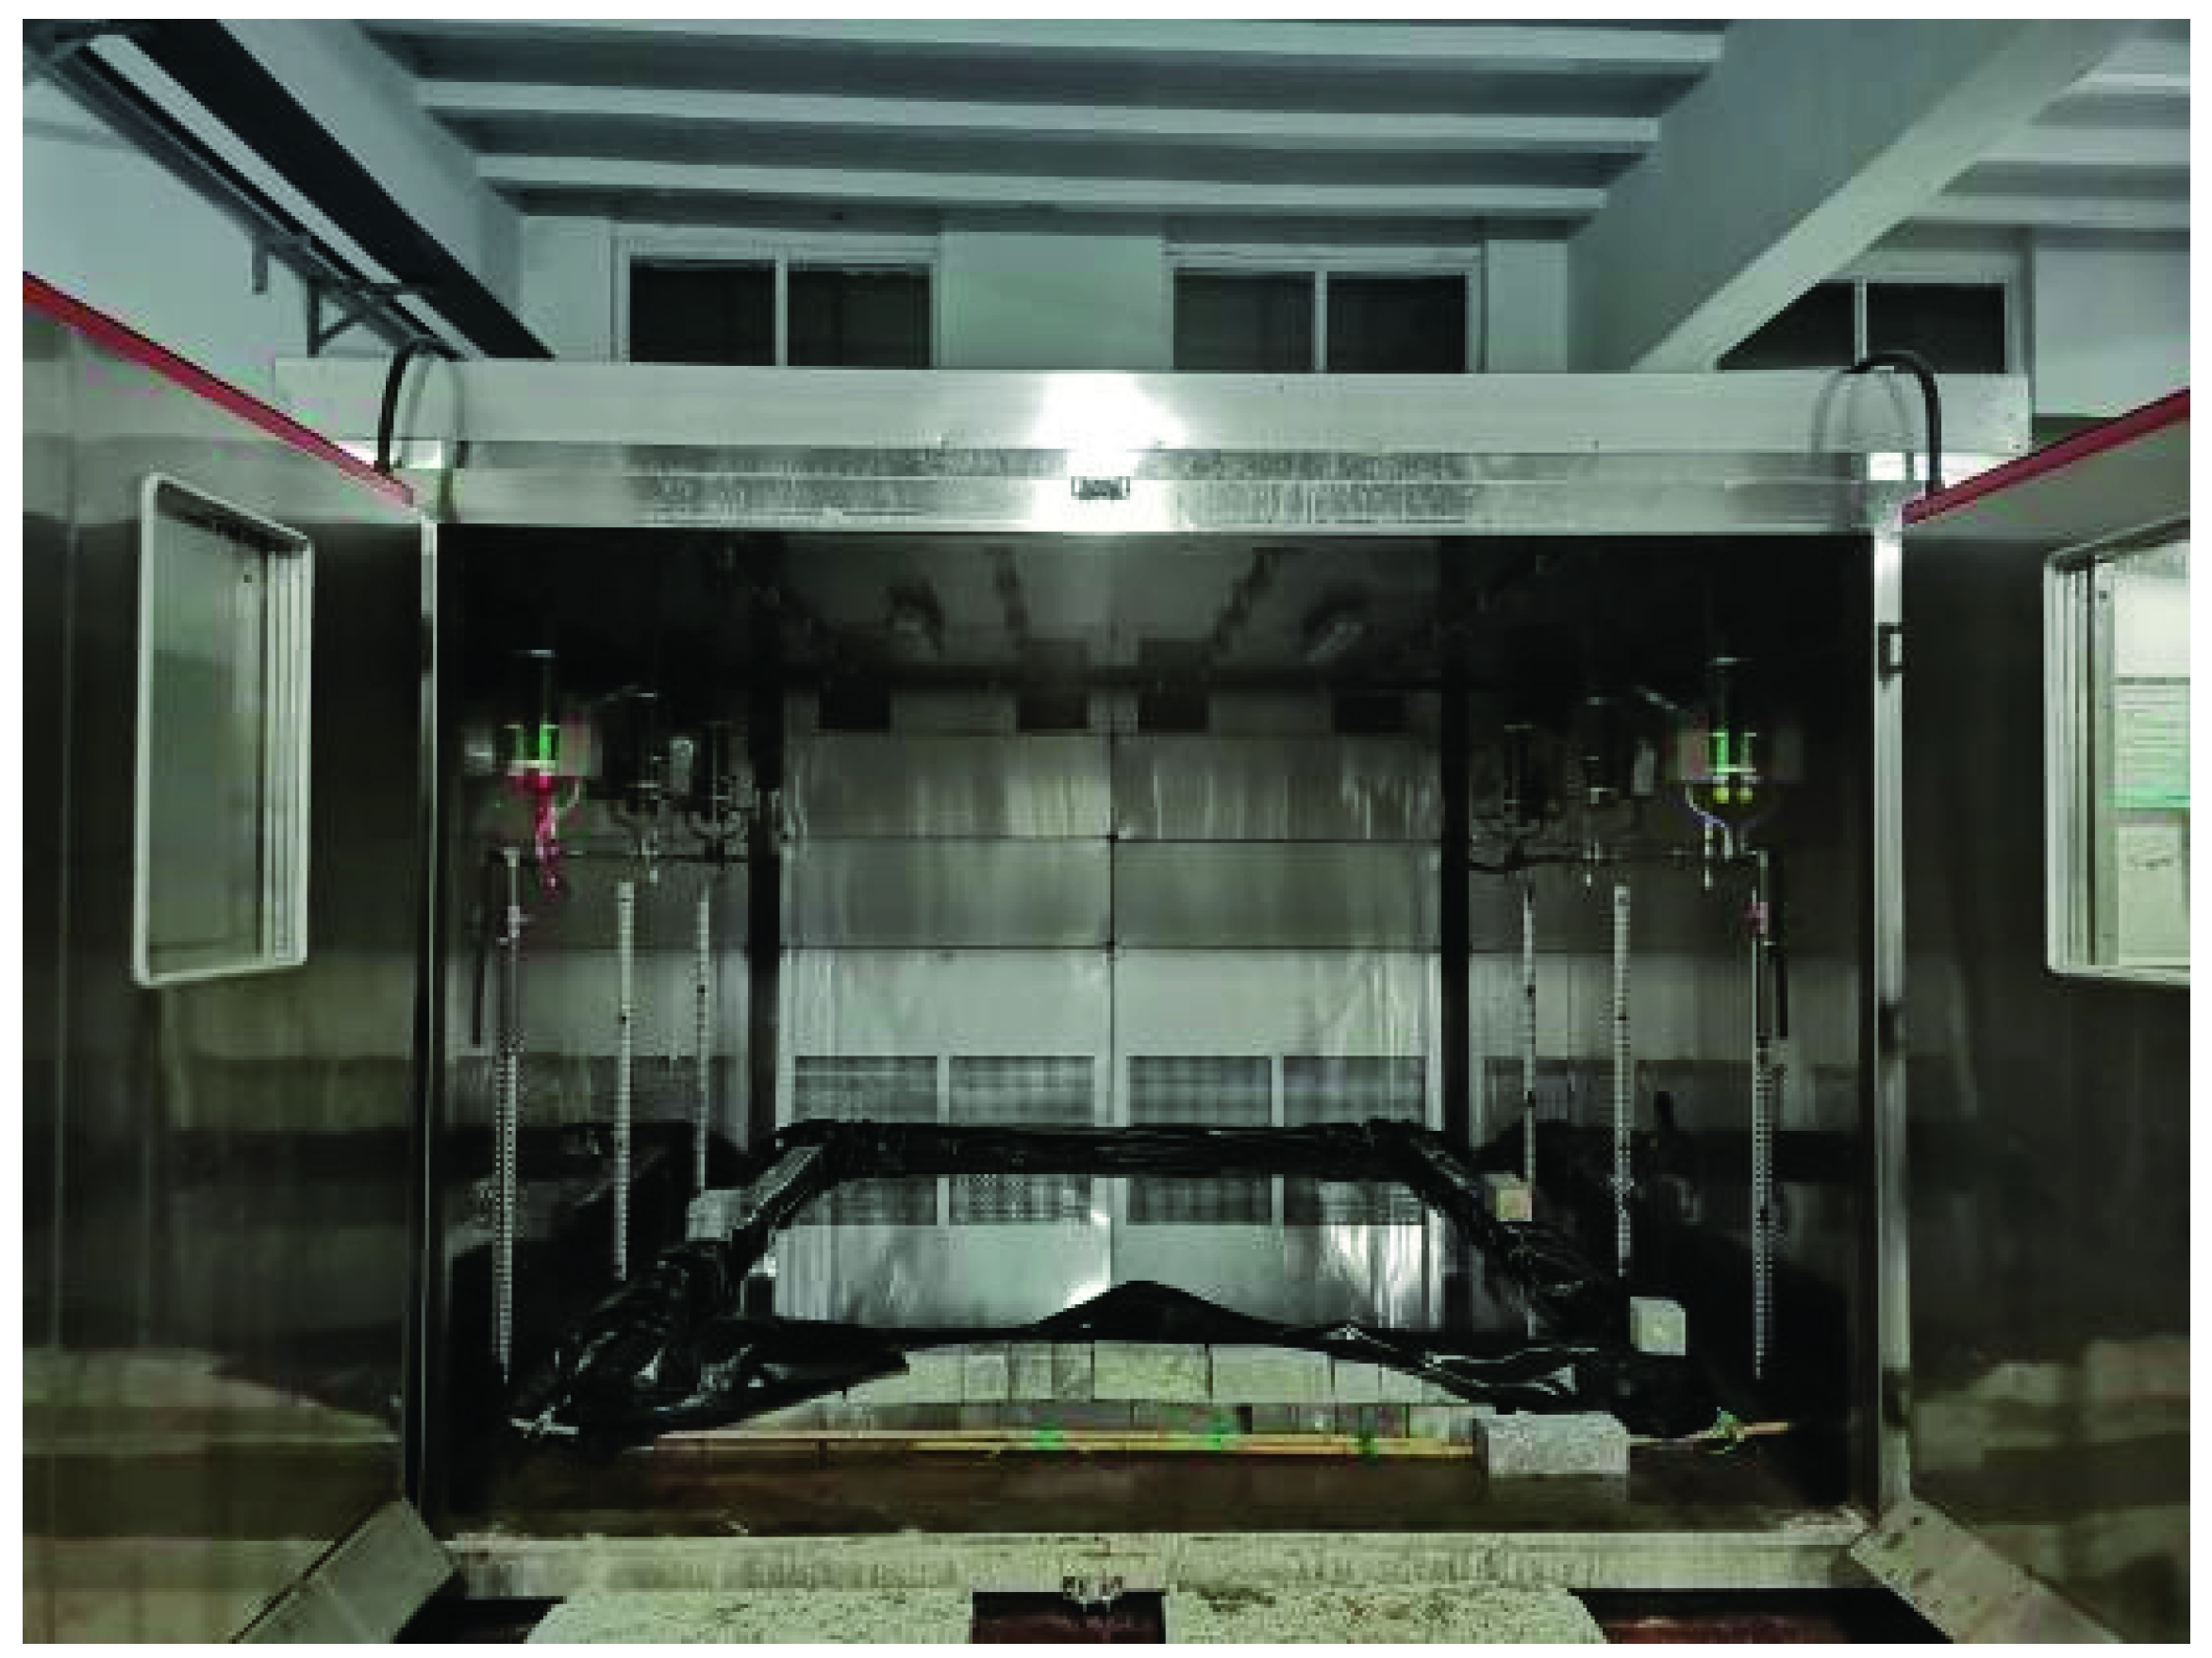
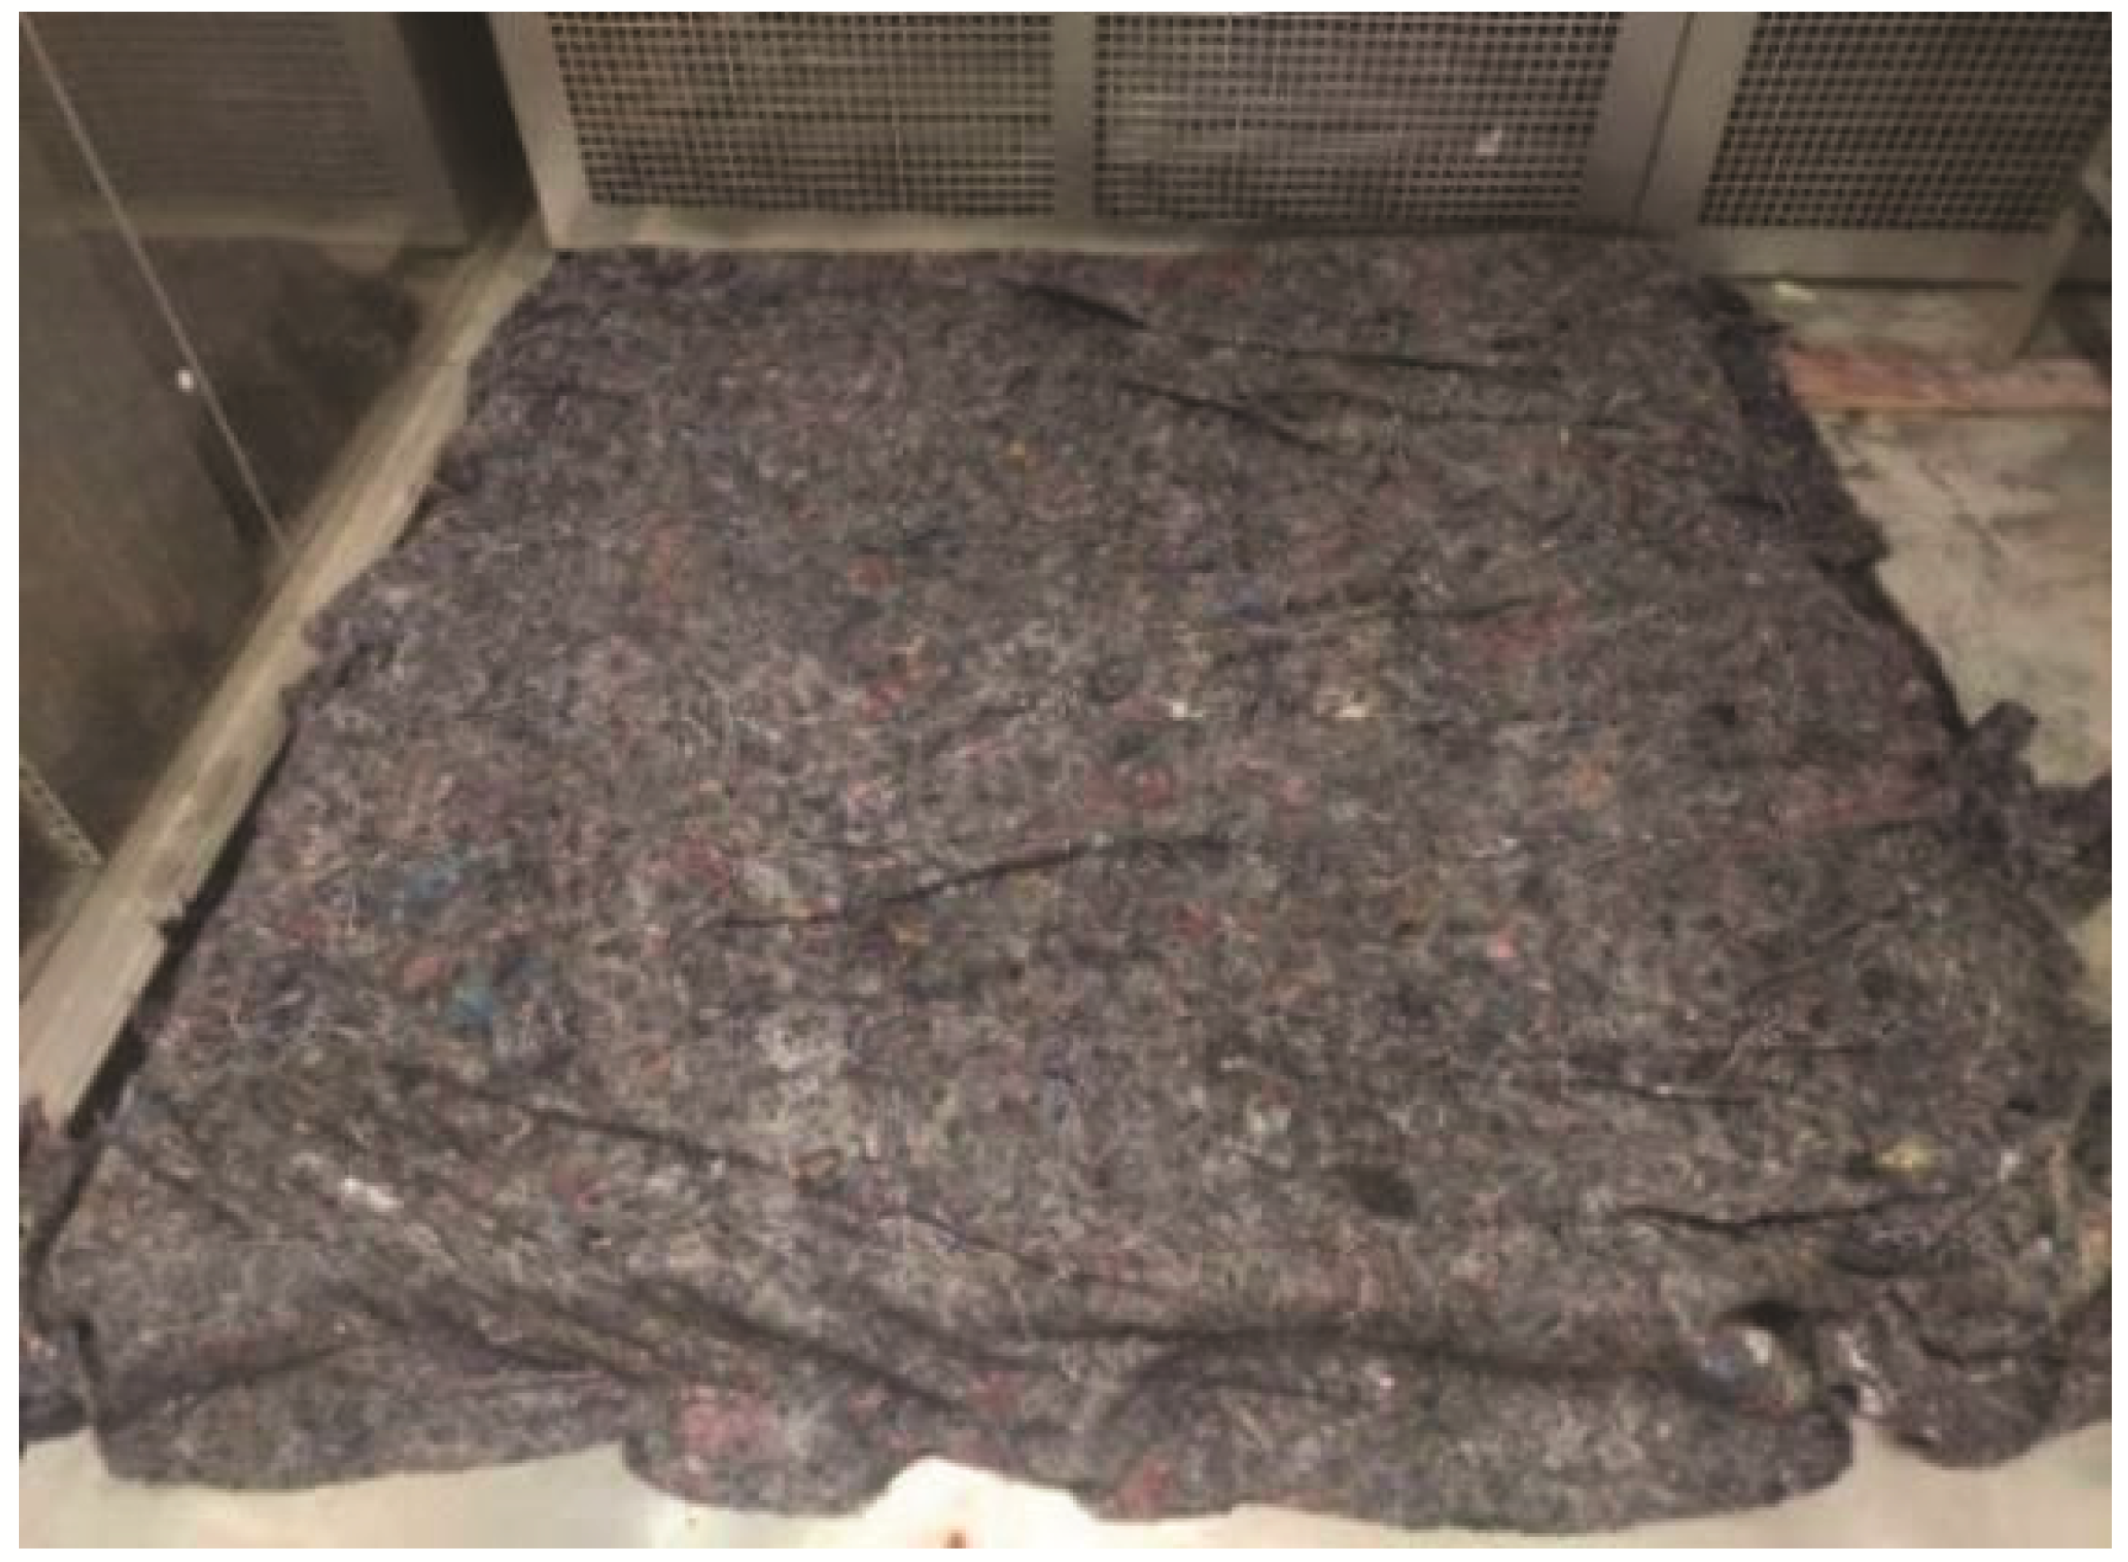
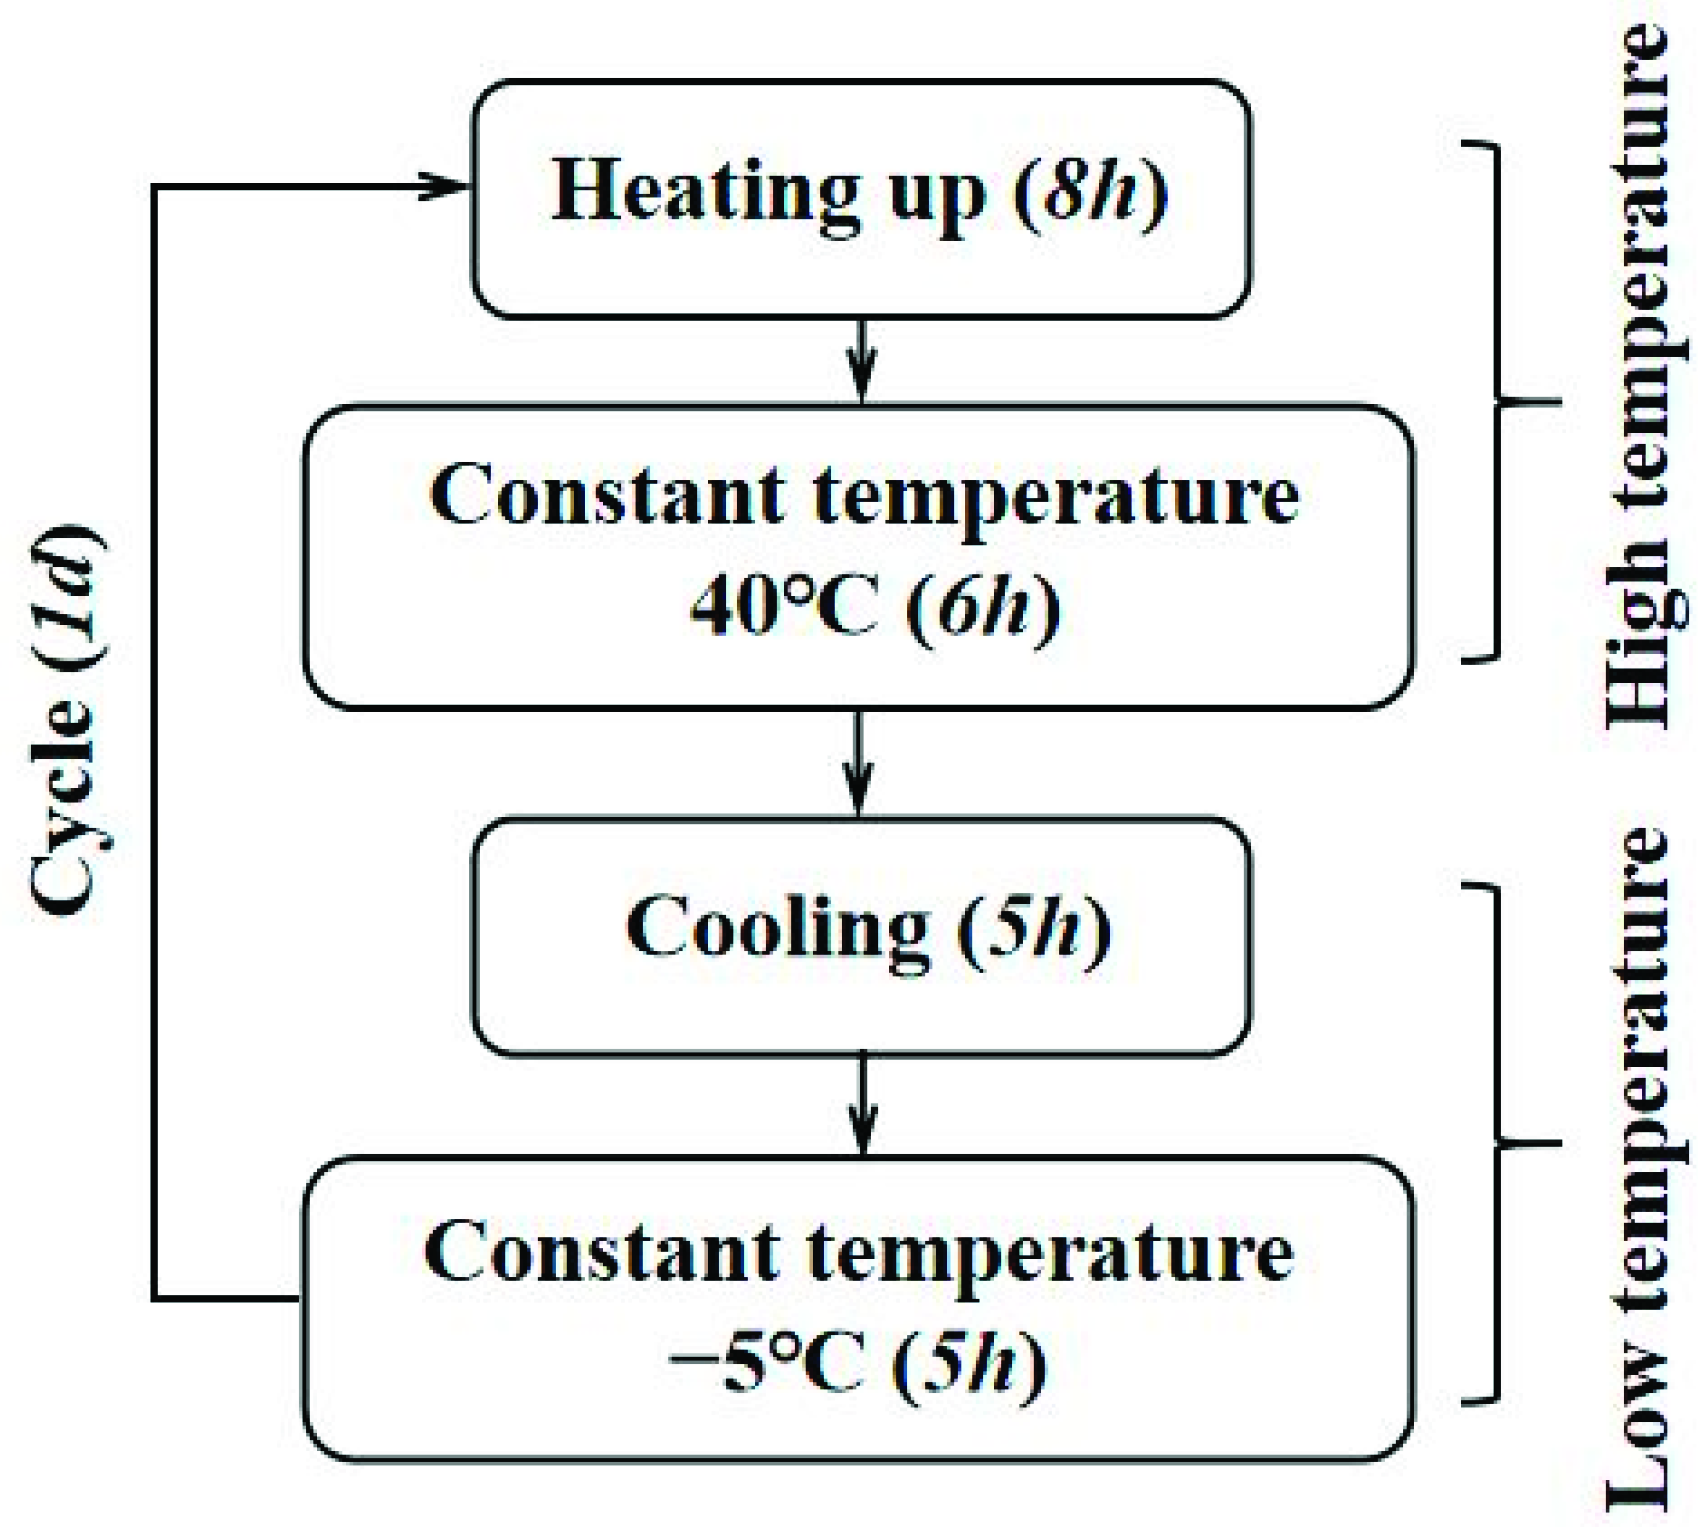
2.3. Concrete Curing and Exposure Conditions

The conditions of the construction site in Western China, where the temperature difference is large and concrete structures are eroded by saline soil, were simulated to achieve the curing conditions of the concrete in this study. Geotextiles saturated with water were used to cover the specimens, as shown in Figure 2, water was sprayed onto the specimens regularly every day for concrete curing, and the curing time was set to 14 d. After 14 d, the geotextiles were removed to expose the specimens to the environment of low humidity, large temperature difference, and saline soil erosion. The simulated environmental humidity was 35%, and the temperature was −5~40 °C. The temperature took 1 day as a cycle, including an 8 h heating period, 6 h high-temperature constant-temperature period, 5 h cooling period, and 5 h low-temperature constant-temperature period, as shown in Figure 3. The environmental condition of concrete eroded by saline soil was achieved by spraying salt solution. For the preparation of the salt solution, the chloride ion penetration resistance test and sulfate attack resistance test in the “Standard for test methods of long-term performance and durability of ordinary concrete” (GB/T 50082-2009) [35] were referred to. Moreover, the mass fractions of sodium chloride and sodium sulfate solutions were selected as 3% and 5%, respectively.

2.4. Experimental Methods

2.4.1. Compressive Strength Test

The compressive strength test of concrete was carried out by the “Standard for test methods of concrete physical and mechanical properties” (GB/T 50081-2019) [36]. The concrete specimen size was 100 mm × 100 mm × 100 mm. A WHY-2000 microcomputer-controlled pressure testing machine with a bearing capacity of 2000 kN was used, and the loading rate was set at 0.6 MPa/s to test the compressive strength of the concrete on the 3rd, 7th, 14th, and 28th day, respectively. The compressive strength of a concrete cube, fcc (MPa), was calculated by Equation (1):
f cc = P A
where P (N) is the failure load of the specimen and A (mm2) is the bearing area of the specimen.

2.4.2. Flexural Strength Test

The flexural strength test of concrete was carried out by the “Standard for test methods of concrete physical and mechanical properties” (GB/T 50081-2019) [36]. The concrete specimen size was 100 mm × 100 mm × 400 mm. The span of the specimen was 300 mm. The WHY-2000 microcomputer-controlled pressure testing machine with the bearing capacity of 2000 kN was used. “Four-point loading test method” was taken in this test. During the test, the side of the concrete specimen was selected as the compression surface. The specimen was placed on the test stand support, and the position of the specimen was adjusted so that the concrete span between the two support heads was 300 mm, with 50 mm left on each side. The two loading heads were located at the two triplets of the specimen span. Then, the geometric parameters of the concrete specimens were input, the loading rate was set to 0.06 MPa/s, and the servo system was activated in order to carry out the flexural strength test on the 3rd, 7th, 14th, and 28th day, respectively. A schematic diagram of the test is shown in Figure 4. The flexural strength of concrete, fr (MPa), was calculated by Equation (2):
f r = F l b h 2
where F (N) is the failure load of the specimen, l (mm) is the span between supports, b (mm) is the width of the specimen section, and h (mm) is the height of the specimen section.

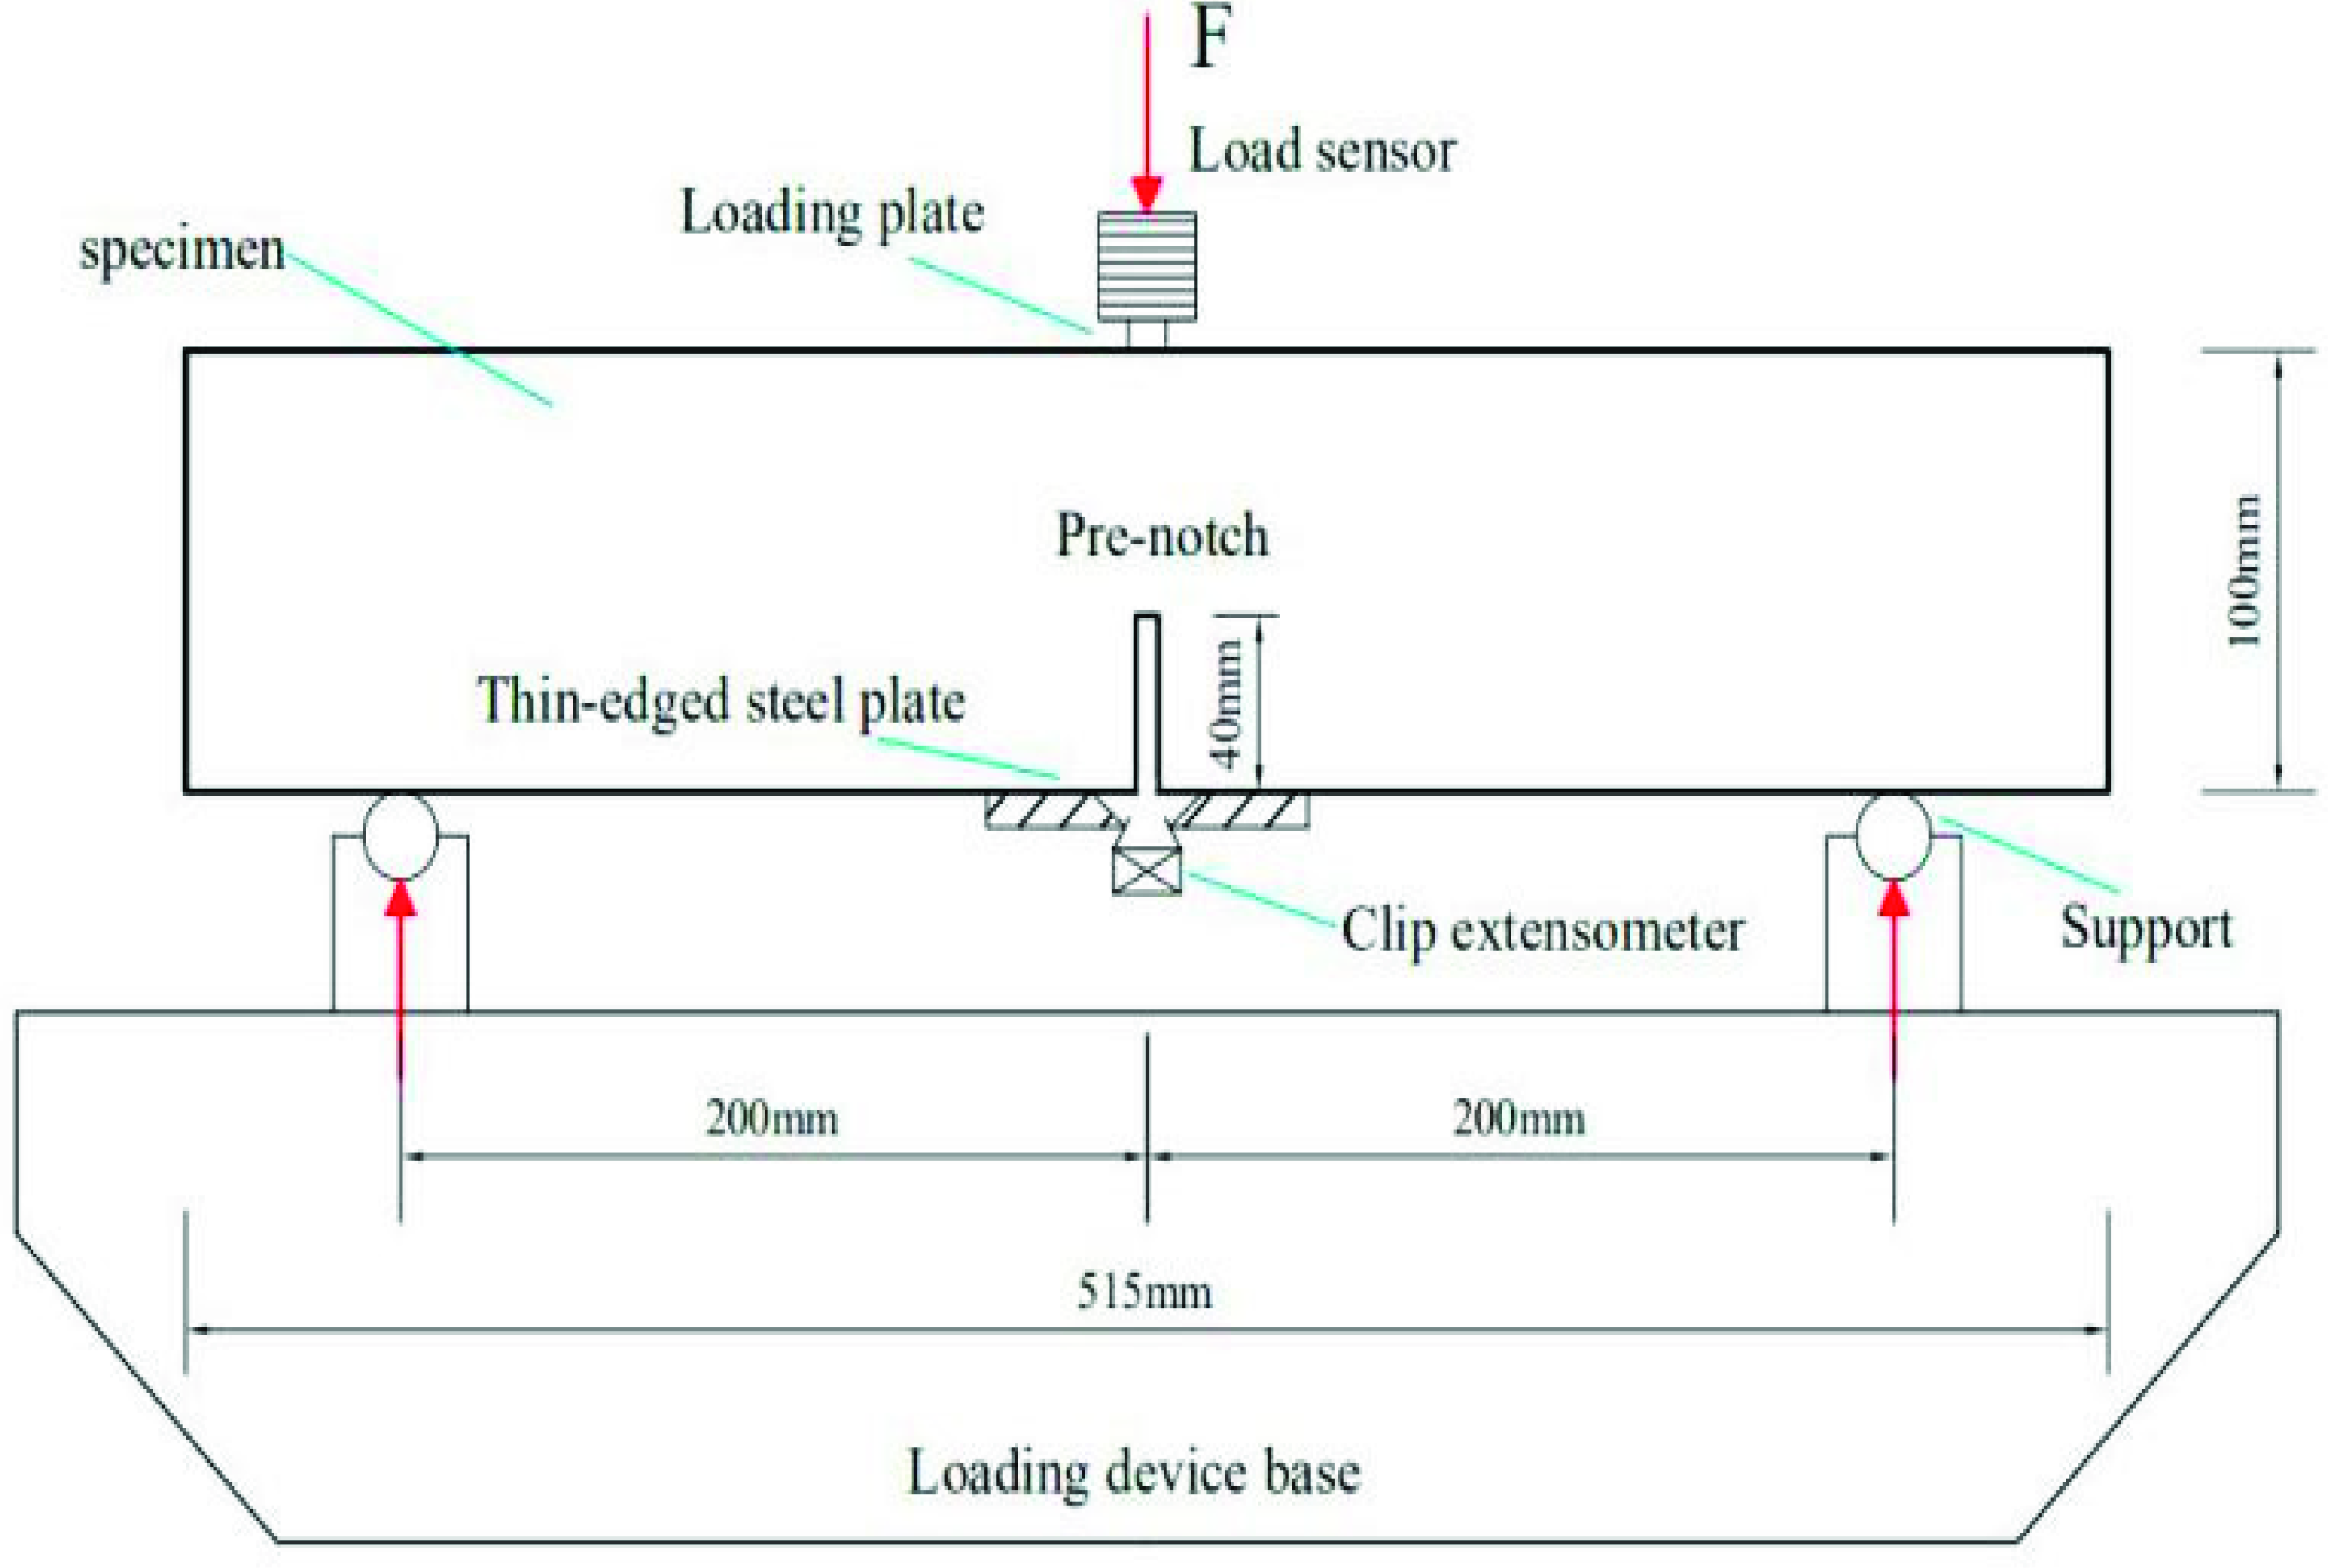
2.4.3. Fracture Performance Test

The fracture performance test of concrete was carried out by the “Norm for fracture test of hydraulic concrete” (DL/T5332-2005) [37]. The concrete specimen size was 100 mm × 100 mm × 515 mm. The WAW-1000 electro-hydraulic servo universal testing machine was used. A three-point bending loading device was adopted, whose loading pad was a steel bar of 120 mm × 10 mm × 5 mm. A load sensor of model JLBU-30 was adopted, whose measuring range was 30 kN. The YHD-30 displacement sensor was used to record the mid-span deflection of the specimen. The clip extensometer fixed by a 0.5 mm blade on both sides of the prefabricated crack of the specimen was used to measure the crack mouth opening displacement (CMOD) value of concrete crack tensile opening displacement. A DH3818Y static strain tester was used to collect the above data. Before the test, it was necessary to record the parameters, such as the size, quality, and length of the prefabricated crack of the specimen. Then, the specimen was installed on the supports. A steel sheet was pasted at the bottom of the other side of the specimen to install the displacement sensor, and then a loading pad and load sensor were placed on the top of the specimen. The test loading device is shown in Figure 5. The equipment was started during the test, and the data acquisition system was open when the load sensor was almost in contact with the loading device. The equipment was loaded at a rate of 0.1 mm/min until the specimen was destroyed. The initial fracture toughness, instable fracture toughness, and fracture energy were calculated using the double-K fracture model [37,38].
The initial fracture toughness, KQIC(MPa.m1/2), and instable fracture toughness, KSIC(MPa.m1/2), were calculated by Equation (3) and Equation (4), respectively. The initial fracture toughness is:
K IC Q = 1.5 ( F Q + 0.5 m g × 10 2 ) × 10 3 S a c t h 2 f ( α )
The instable fracture toughness is:
K IC S = 1.5 ( F max + 0.5 m g × 10 2 ) × 10 3 S a c t h 2 f ( α )
where f(α) is calculated according to Equation (5):
f ( α ) = 1.99 α ( 1 α ) ( 2.15 3.93 α + 2.7 α 2 ) ( 1 + 2 α ) ( 1 α ) 1.5 ; α = a c h
where FQ (kN) is the initial cracking load; Fmax (kN) is the maximum load; m (kg) is the quality of the specimen between the beam supports; g is the acceleration of gravity, which is 9.81 m/s2; t (m) is the thickness of the specimen; h (m) is the height of the specimen. ac (m) is the effective crack length, which is calculated by Equation (6):
α c = 2 π ( h + h 0 ) arctan t E V c 32.6 F max 0.1135 h 0
where h0 (m) is the thickness of the blade steel plate; Vc (μm) is the critical value of crack opening displacement. a0 (m) is the initial crack length; E (GPa) is the calculated elastic modulus, which is calculated by Equation (7):
E = 1 t c i [ 3.70 + 32.60 tan 2 ( π 2 a 0 + h 0 h + h 0 ) ]
where a0 (m) is the initial crack length; ci = Vi/Fi (μm/kN) is calculated from any point in the straight segment of the rising section of the F–V curve. The fracture energy is expressed by the area that is enclosed by the load–deflection curve (F~δ curve) of the three-point bending test, i.e., the energy required for crack growth per unit area. Fracture energy GF (N/m) can be calculated by Equation (8):
G F = W 0 + m g δ 0 A
where W0 (N.m) is the area enclosed by the F~δ curve; m (kg) is the sum of m1 (the mass of the specimen between the two supports) and m2 (the mass of the loading component not connected to the testing machine); g is the acceleration of gravity, which is 9.81 m/s2; A (m2) is the cross-sectional area of the specimen ligament.

2.4.4. Test Methods for Scanning Electron Microscopy (SEM)

Samples of appropriate size were cut from the concrete specimens by a cutting machine. The samples were dried in a vacuum oven at 60 °C for 24 h and then placed in anhydrous ethanol to prevent hydration. During the test, concrete samples were dried at 60 °C for 6 h in an oven. After being taken out and cooled to room temperature, a layer of metal film was coated on the surfaces of the concrete samples by an ion sputtering instrument, and then the samples were observed in a vacuum chamber by a scanning electron microscope.

2.4.5. Test Methods for XRD Diffraction

The Empyrean-type XRD diffractometer produced by the Panaco company in the Netherlands was used to test the change in concrete phase composition. The target material of the light tube was the Cu target. The working voltage was 45 kV, working current was 40 mA. The scanning parameters were set as follows: scan speed 0.16 s/step, step size = 0.013, and scan angle range from 5° to 70°.

2.4.6. Test Methods for Pore Structure

According to the test method of bubble parameters of hardened concrete in “Test code for hydraulic concrete” (SL/T352-2020) [34], the straight-line traverse method was adopted to measure the geometric parameters of pores in concrete. A 90 mm × 90 mm area in the middle of the specimen was the observation area. The specific steps were as follows:
(1)
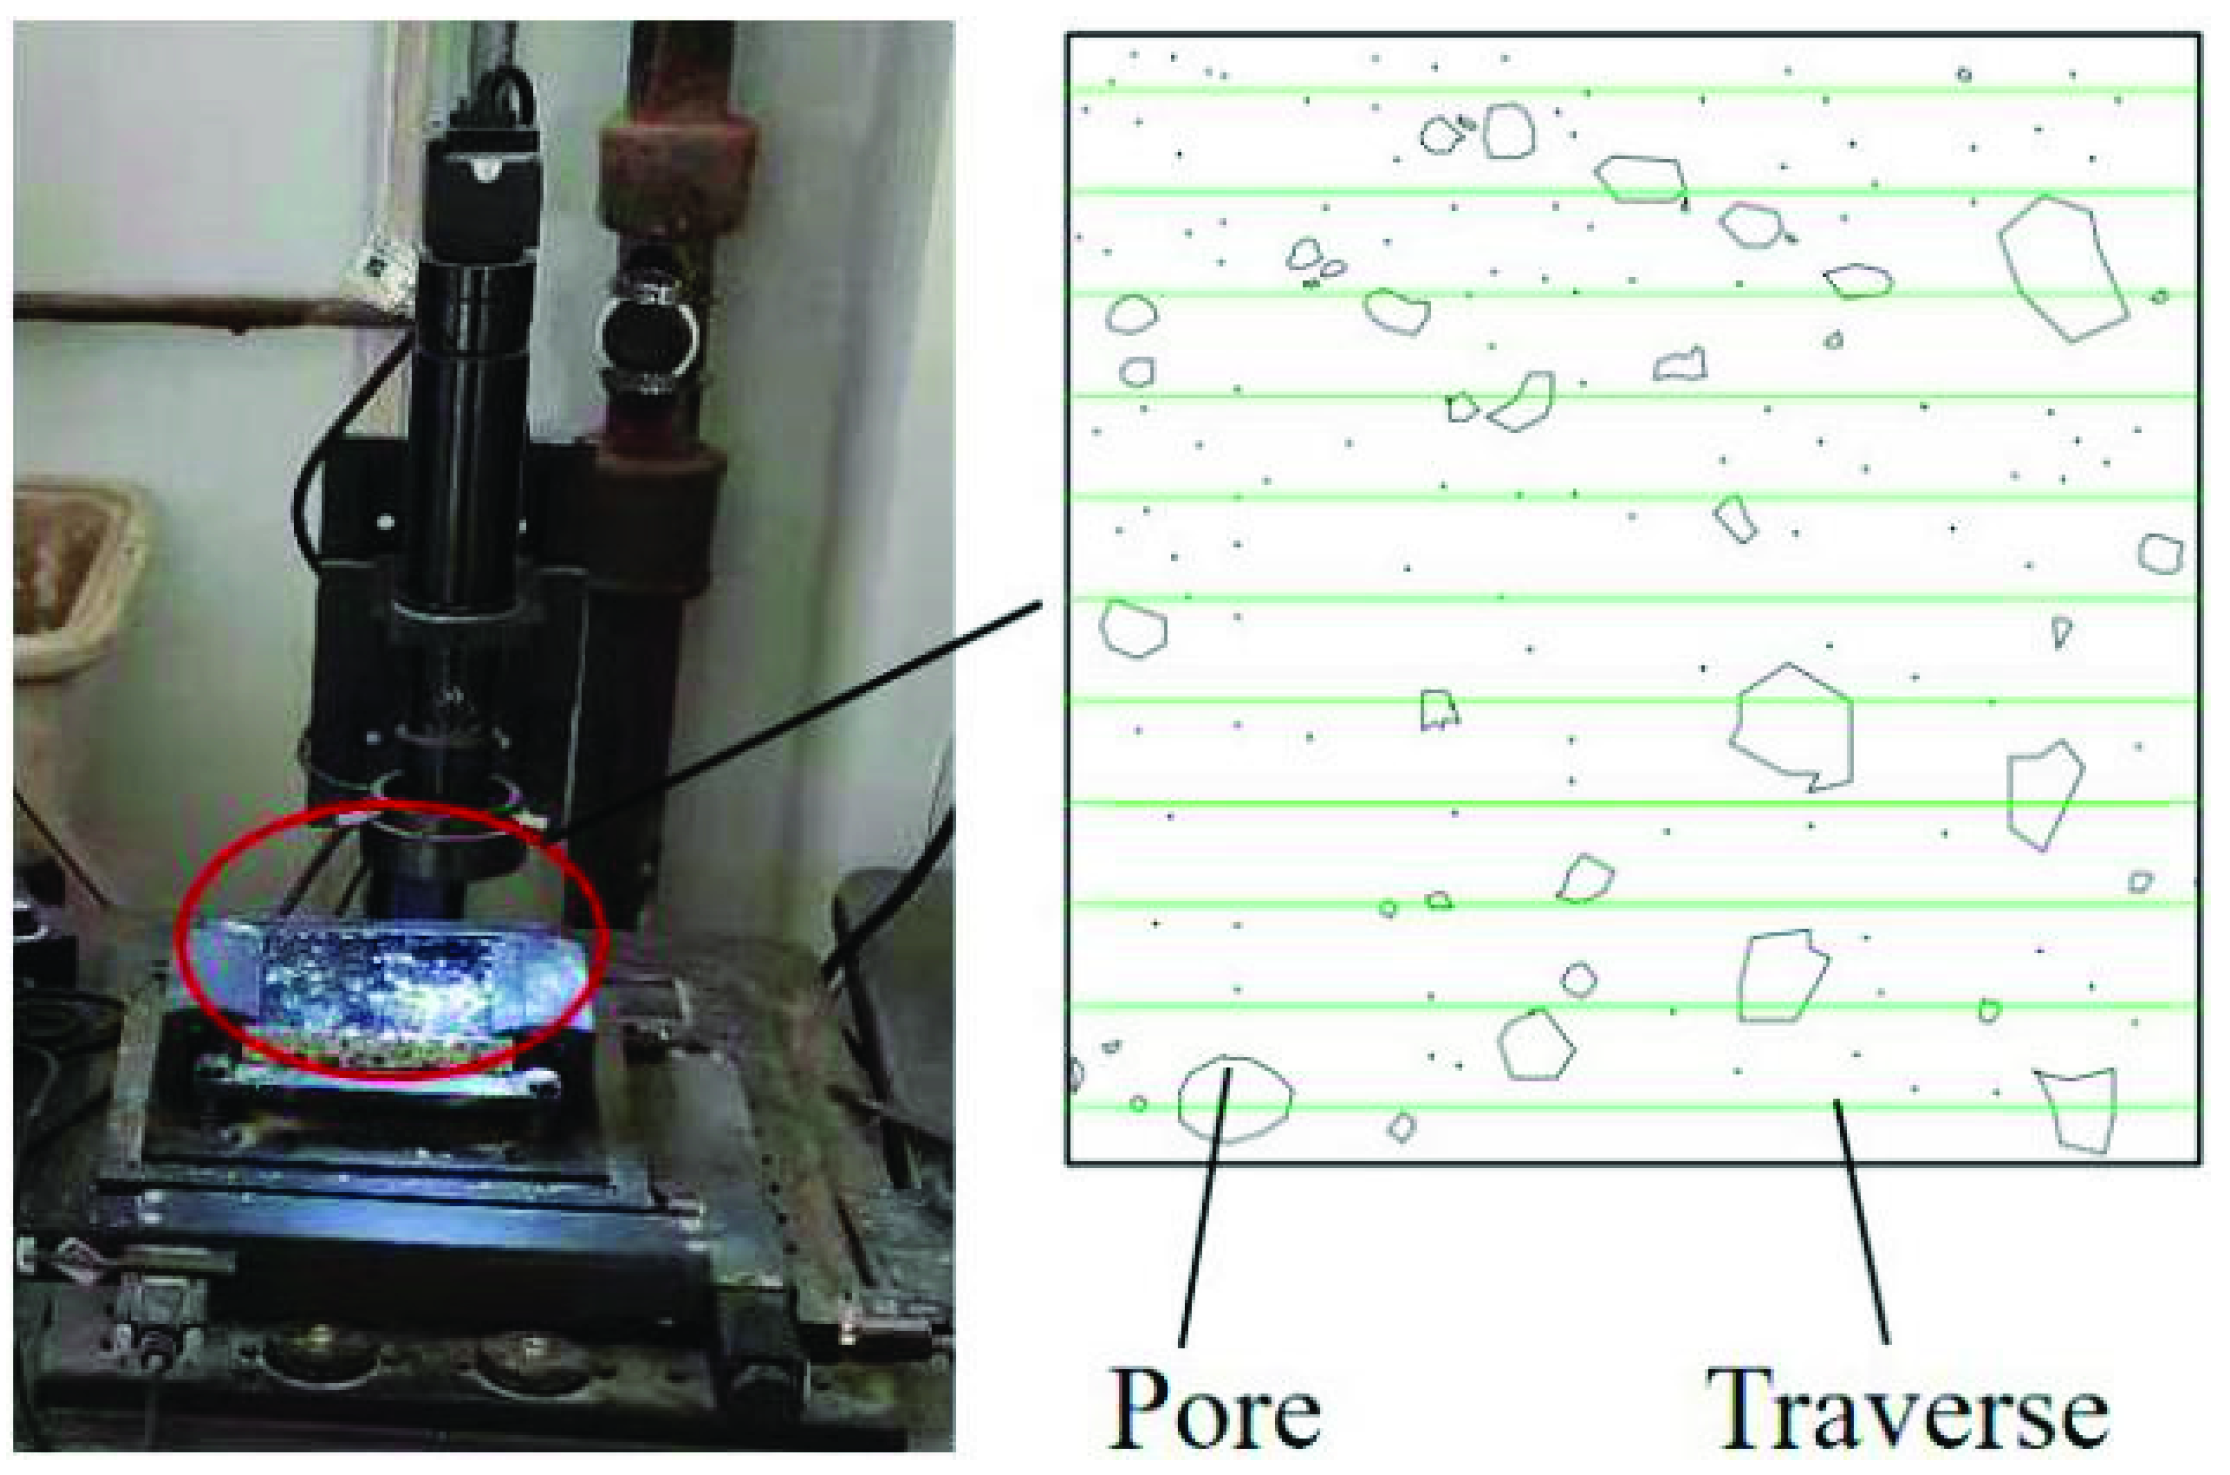
The specimen whose observation surface was perpendicular to the casting surface was cut from the cube concrete specimen, with a total observation area of no less than 7000 mm2 and a total traverse length of no less than 2300 mm. The observation surface of the specimen was cleaned. When irradiation light was applied to the observation surface at a low angle, the observation surface was flat except for the bubble section and aggregate pores, and the bubble edge was clear. Then, the specimen was placed in the oven (105 ± 5 °C) to dry.
(2)
The hardened concrete pore structure analyzer was used to observe the concrete surface and the traverses were drawn, which are shown in Figure 6. The number of pores and the chord length of bubbles in the field of view were observed and measured from the starting point of the first traverse.
(3)
According to the data collected, the pore parameters of concrete were calculated, including porosity, average air-void size, and pore spacing coefficient.
The geometric parameters of the pore structure were calculated according to Equations (9)–(12) in the “Test code for hydraulic concrete” (SL/T352-2020).
A = Σ l T
l ¯ = Σ l n
r = 3 4 l ¯
L ¯ = { 3 A 4 n 1 [ 1.4 ( P A + 1 ) 1 / 3 1 ] ( P A 4.33 ) P 4 n 1 ( P A < 4.33 )
where A (%) is the porosity; Σl (mm) is the sum of all traverses cutting the bubble chord length; T (mm) is the total length of traverses; l ¯ (mm) is the average chord length of bubbles; n is the total number of bubbles cut by all traverses; r (mm) is the average radius of bubbles; L ¯ (mm) is the pore spacing factor; P (%) is the slurry content in concrete; n1 is the average number of bubbles cut per 10 mm traverse.

2.4.7. Test Methods for Chloride Ion Content

According to the determination method of water-soluble chloride ion content in the “Test code for hydraulic concrete” (SL/T352-2020) [34], the content of free Cl in the modified concrete was measured. In this test, a depth of 10 mm from the concrete surface was selected to measure the chloride ion content. There were 10 layers, and each layer had a depth of 1 mm. Chloride ion content P (%) was calculated by Equation (13):
P = C AgNO 3 V × 35.45 G × 1000 × 100 %
where CAgNO3 (mol/L) is the concentration of AgNO3 solution, V (mL) is the volume of consumed AgNO3 standard solution, and G (g) is the mass of powder.

3. Results and Discussion

3.1. Mechanical Properties of Concrete

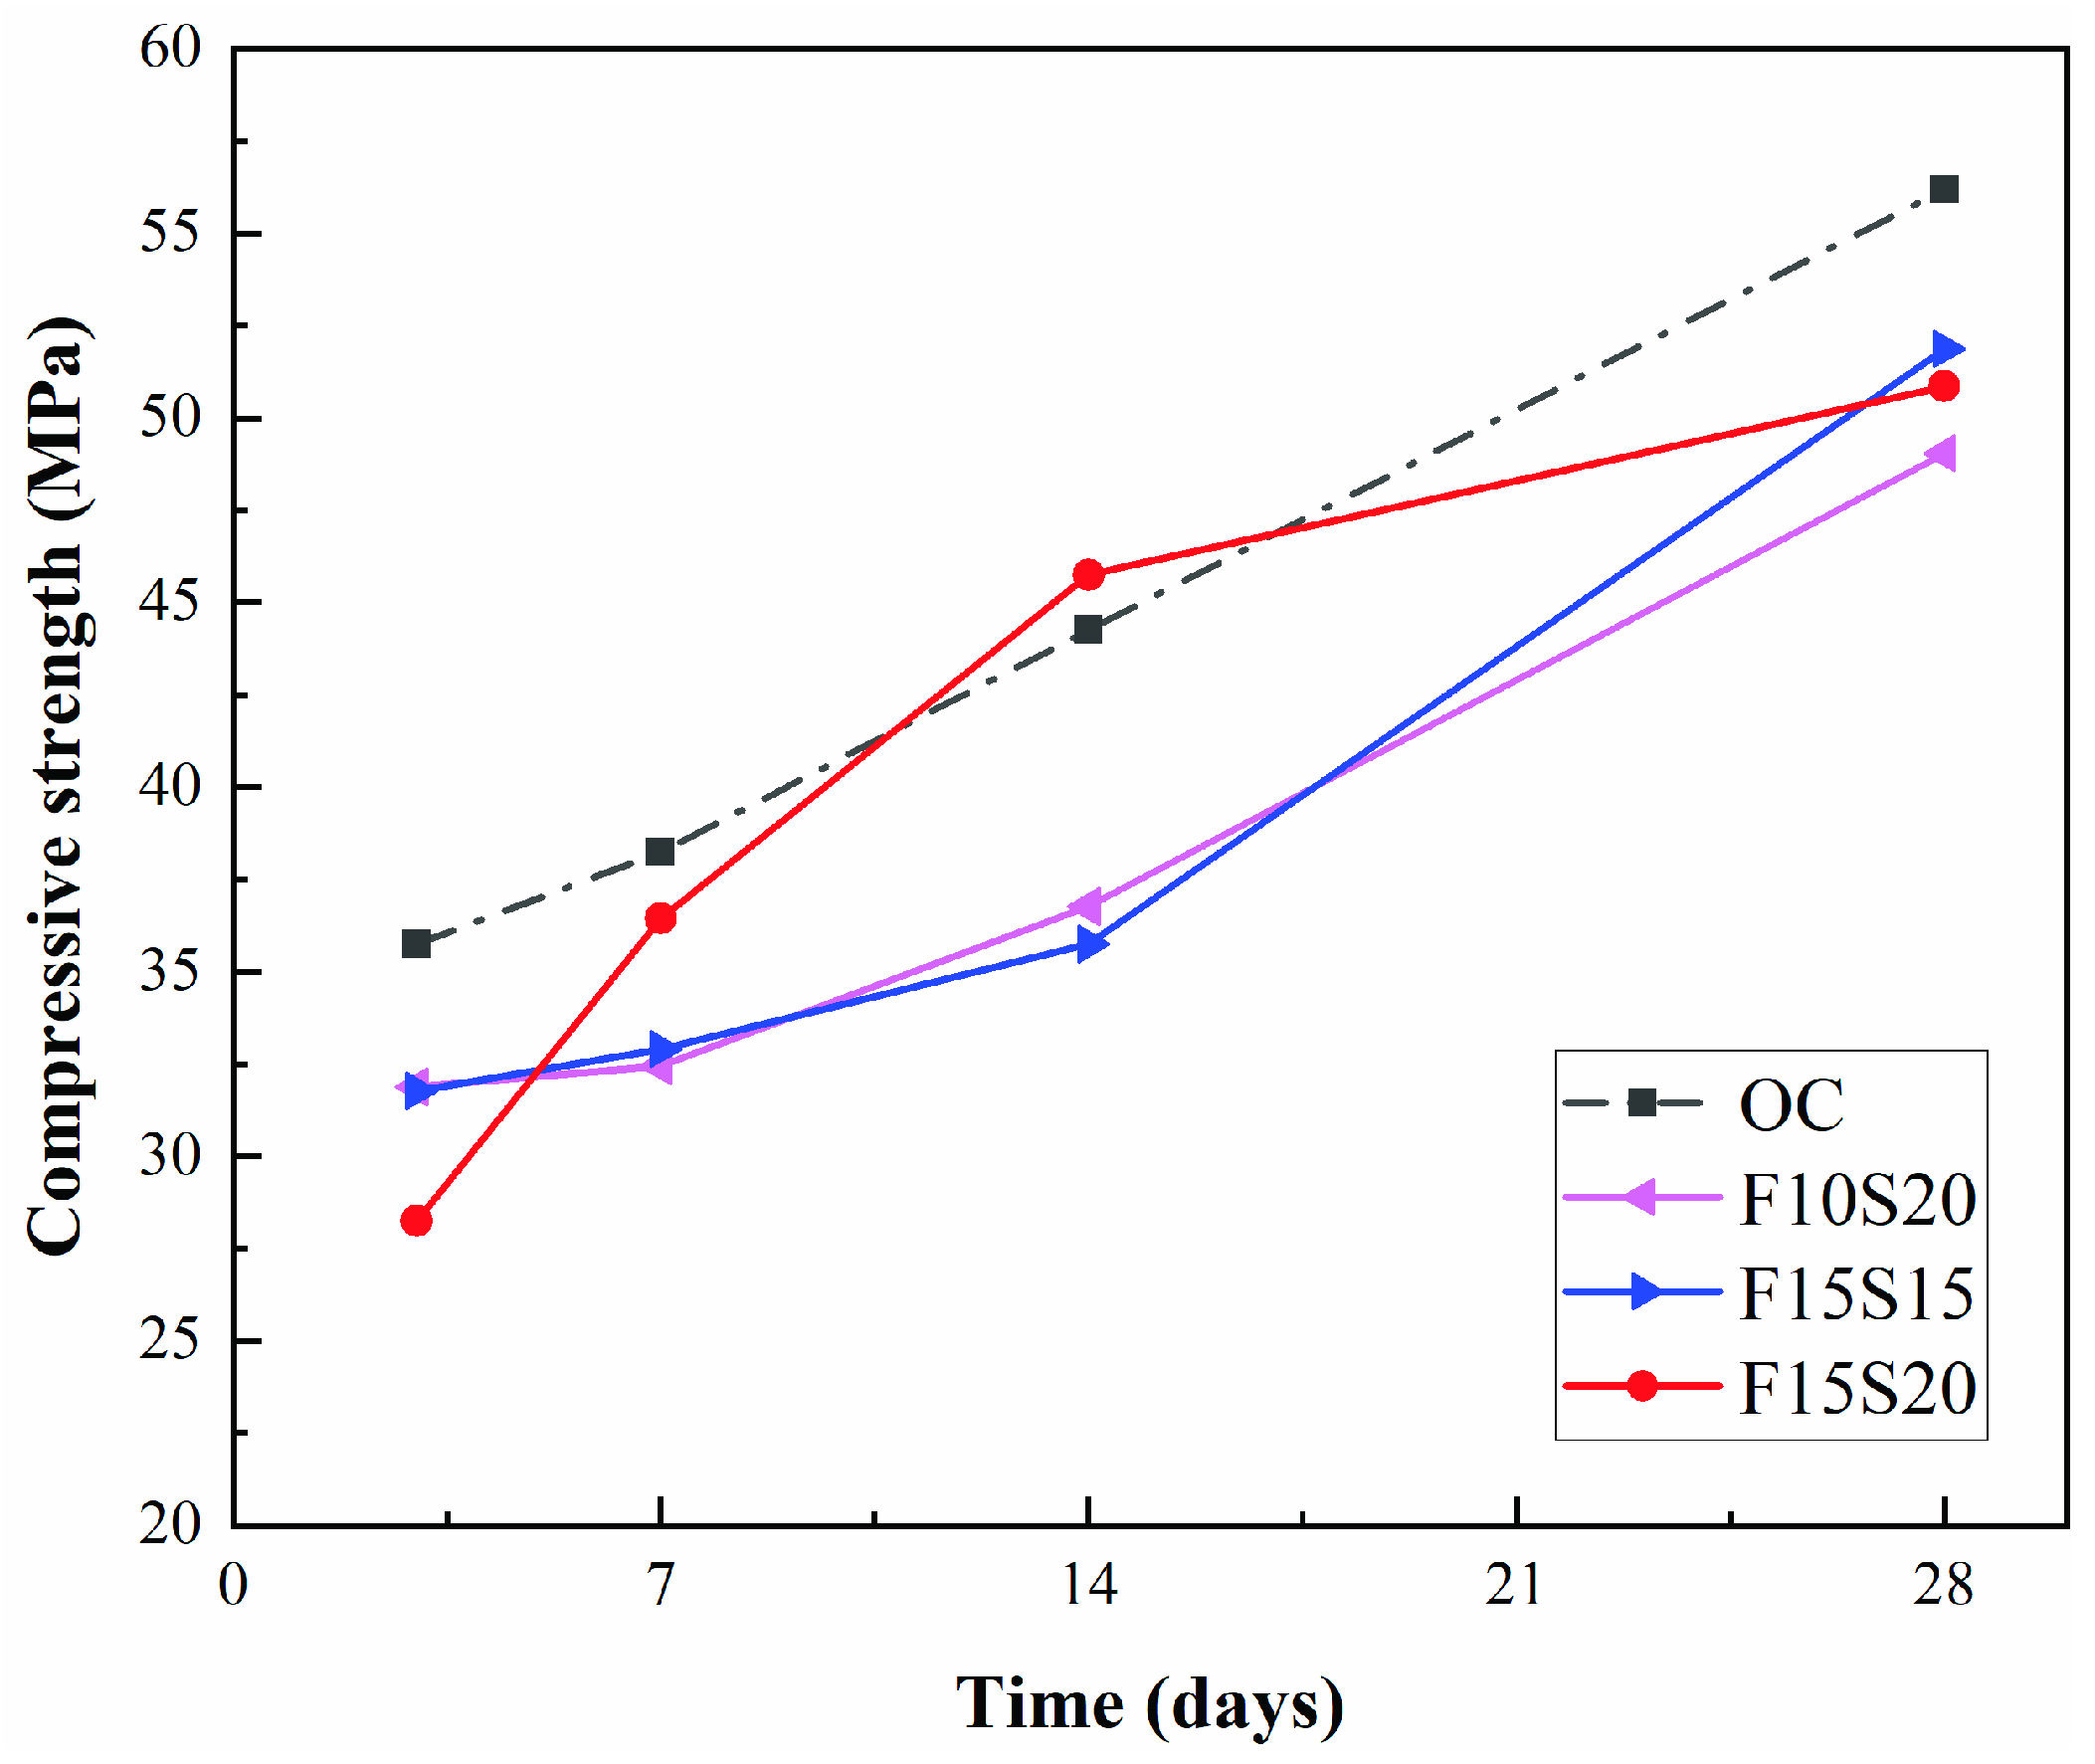
3.1.1. The Compressive Strength

The compressive strength of ordinary concrete and concrete containing different proportions of mineral admixtures in the environment with a large temperature difference and erosion by SO42− and Cl after 3, 7, 14, and 28 days is shown in Figure 7. At day 3 of curing, the compressive strength of the four groups of concrete was ranked from largest to smallest as OC > F15S15 > F10S20 > F15S20, which showed that the OC group hydrated faster and had high initial strength, and as the total amount of mineral admixture increased, the strength of the concrete became lower, which was because the mineral admixtures were not active initially and the strength of the concrete was mainly provided by the hydration of the cement. During the curing period of 3 to 14 days, the strength of the concrete continued to increase, with the OC group, F10S20 group, and F15S15 group having almost the same rate of strength growth, but the F15S20 group underwent a continuous increase in strength growth rate. During the period from 14 to 28 days, the compressive strength of the F15S20 group grew slowly and the compressive strength of the other three groups grew at similar rates, which was mainly because the OC group did not have a mineral admixture and the F10S20 and F15S15 groups had less mineral admixture than the F15S20 group; the internal pores of these three groups were larger and not as dense as those of the F15S20 group, resulting in the external environment of SO42− and other aggressive ions entering the concrete interior through the initial pores and cracks of the concrete and reacting with the mixed hydration products to generate swelling products such as ettringite and gypsum, which initially compacted the internal pores of the concrete and caused the compressive strength of the concrete to continue to rise [39]. Meanwhile, the total amount of mineral admixture in the F15S20 group was larger and the concrete interior was already relatively dense, so the external aggressive ions reacting with the internal hydration products produced less expansive erosion products and the compressive strength increased slowly. At the age of day 28, the compressive strength of the F10S20 group, F15S15 group, and F15S20 group accounted for 87.2%, 91.6%, and 90.6% of the compressive strength of the OC group, respectively, but was still greater than 45 MPa, indicating that concrete mixed with 30% to 35% mineral admixture in an environment with a large temperature difference and saline soil erosion would reduce the initial compressive strength of the concrete, but the reduction was not significant, and the strength of the concrete modified by mineral admixtures was expected to exceed that of the ordinary concrete because of the subsequent volcanic ash effect of the mineral admixtures. The compressive strength of the F15S20 group after 7 days was greater than that of the F10S20 group and the F15S15 group, which indicated that a certain range of mineral admixture content could increase the strength of concrete in the mid to late stages of strength development.

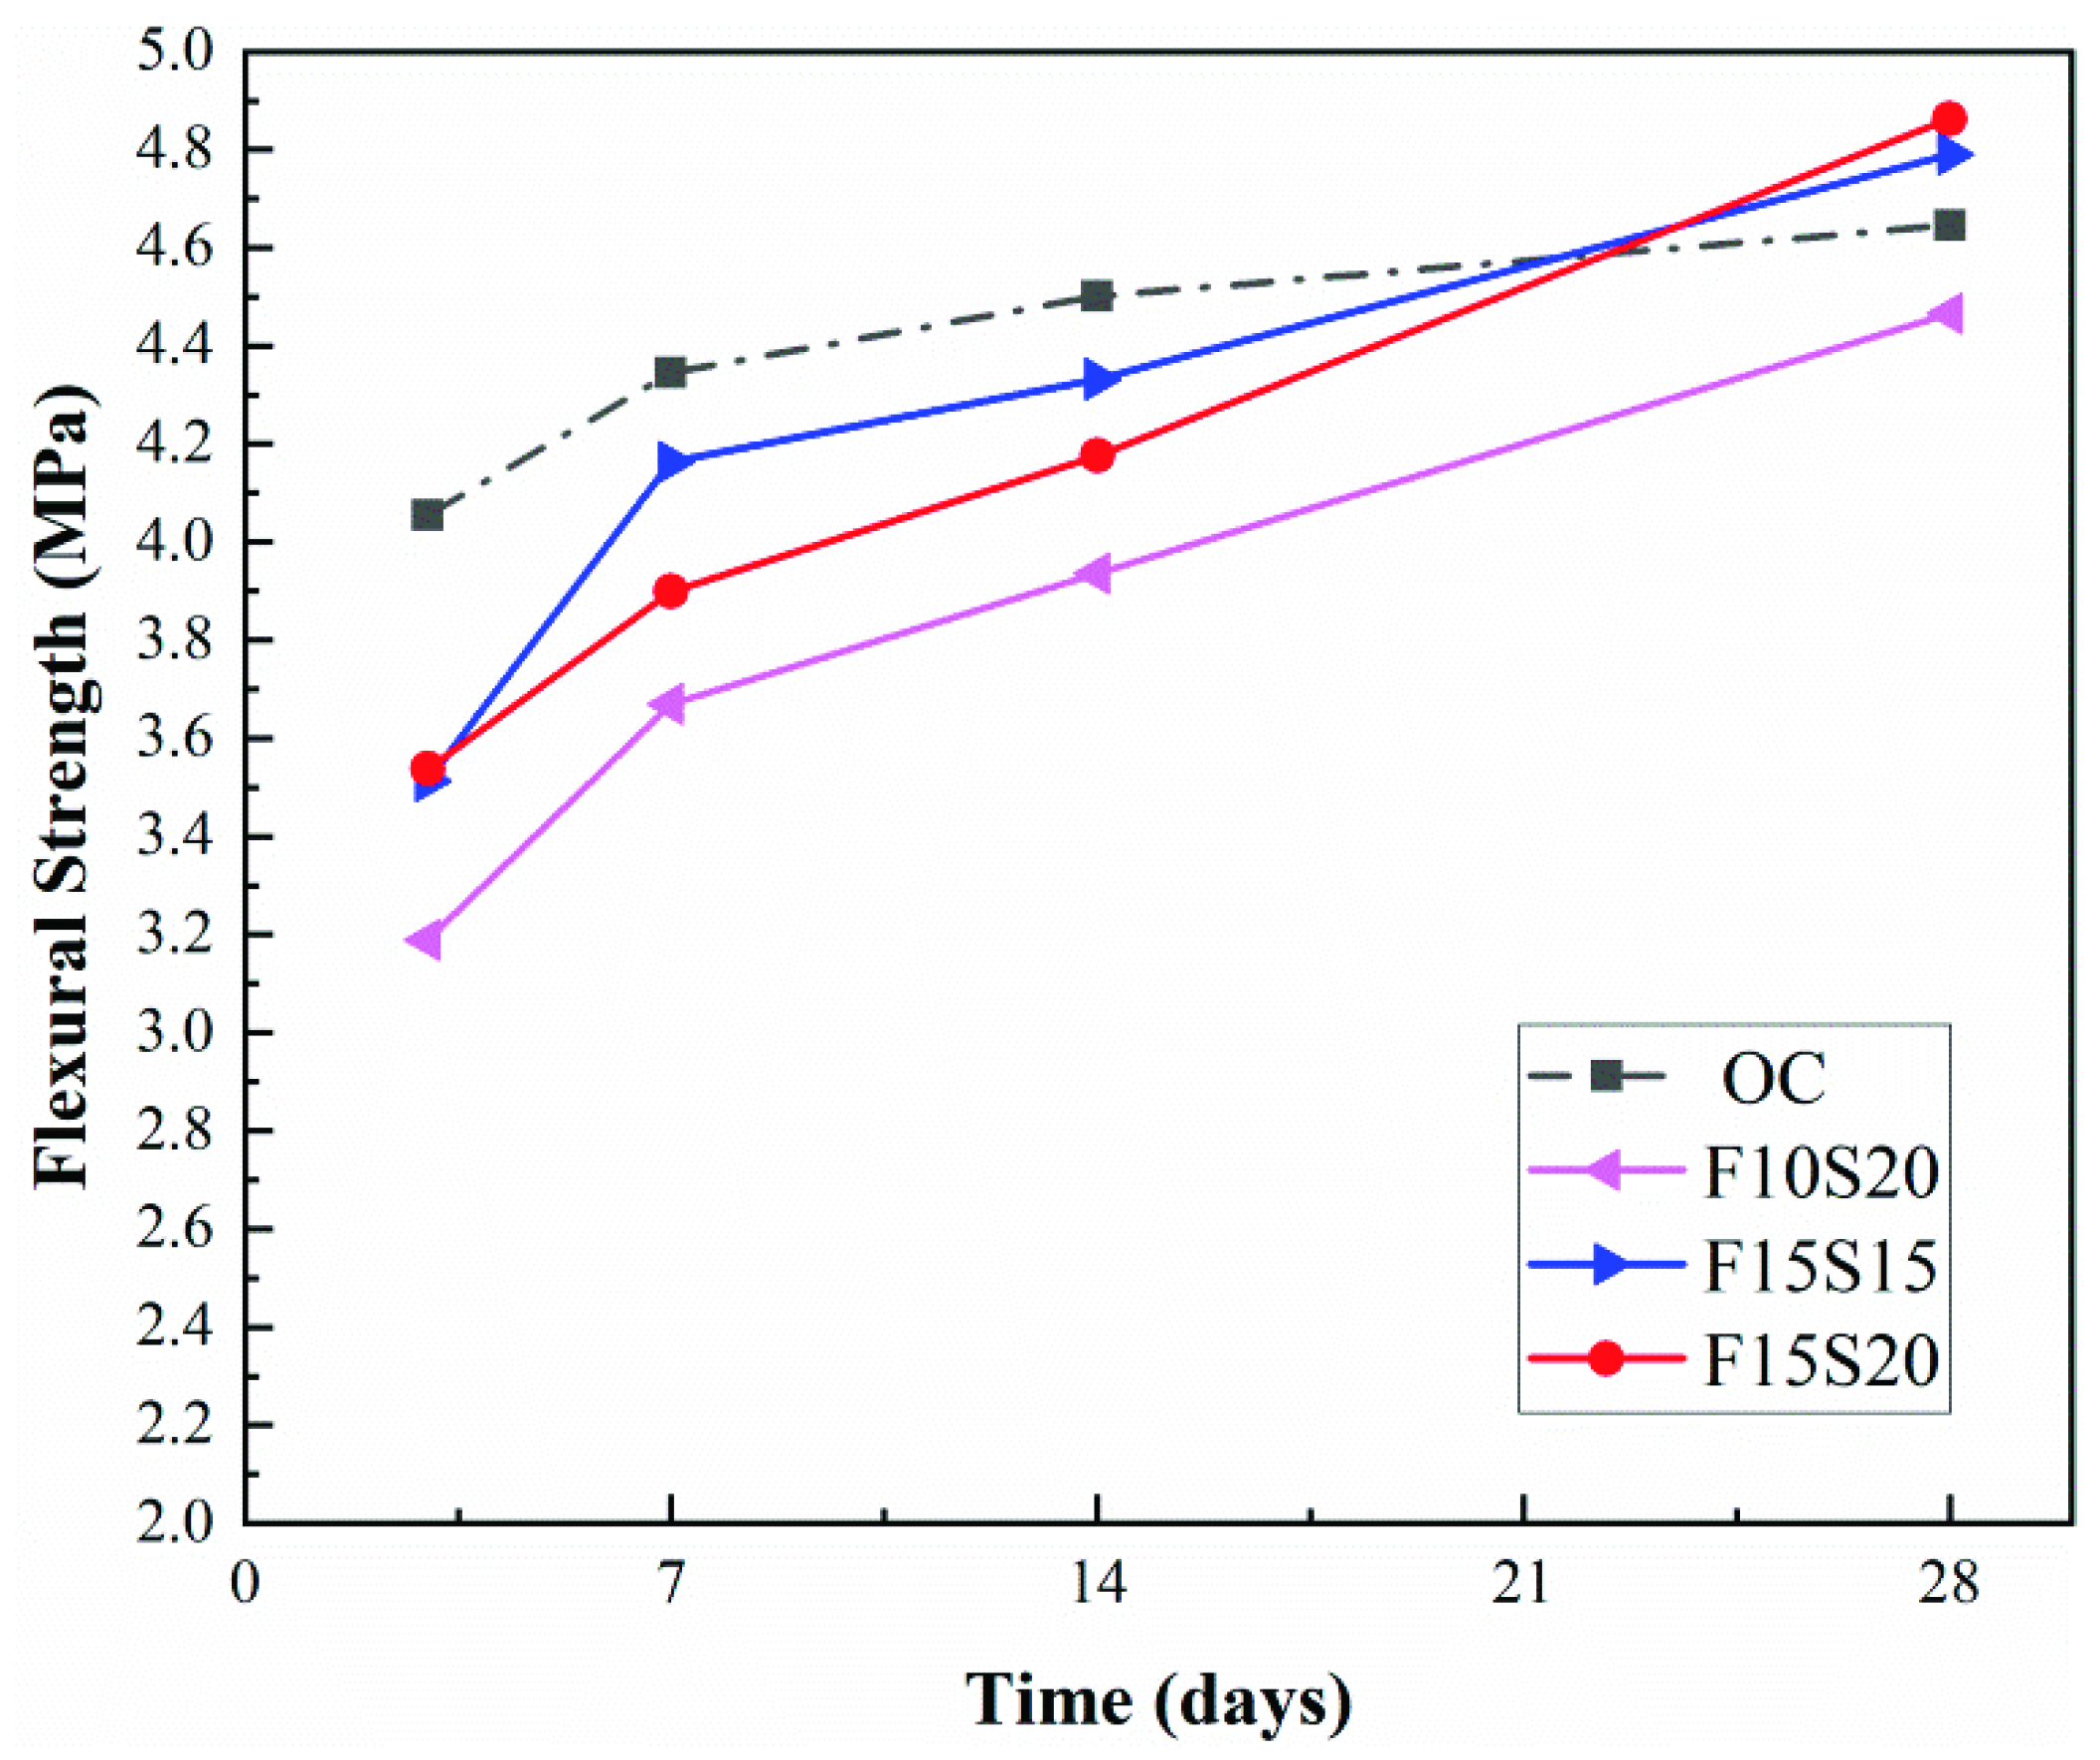
3.1.2. The Flexural Strength

As shown in Figure 8, the flexural strength of the concrete increased with age within 28 days in the environment with a large temperature difference and saline soil erosion. The flexural strength of the concrete developed faster within 7 days, accounting for 80% to 93.7% of the flexural strength of the concrete at day 28. This was because the mineral admixture was not very active in the initial stages and the strength development of the concrete depended on the hydration of the cement, and the saline soil erosion environment provided the concrete with curing moisture, which made the hydration more adequate, whereas the mineral admixture-doped concrete was relatively dense inside, resulting in poorer moisture absorption and hydration compared to the OC group. At 14~28 days of age, the flexural strength of the OC group developed slowly and the flexural strength of concrete mixed with mineral admixtures developed faster because the SO42− and Cl in the salt solution stimulated the potential activity of the mineral admixtures [40]. Secondary hydration of fly ash and slag with cement hydration products occurred in concrete [41], which filled the internal pores and increased the concrete strength, and fly ash could replace cement to extend the hydration process, allowing for higher strength development over time [42]. Studies have shown that the addition of fly ash and slag to concrete can inhibit the attack of sulfates. Consequently, ordinary concrete without any mineral admixtures would result in more sulfate ions penetrating into the concrete, especially in the surface layer, where they would be enriched. On the one hand, when the external temperature and humidity changed, the sodium sulfate in the concrete repeated the process of crystallization and dissolution; the sodium sulfate crystallization absorbed water and generated mirabilite, resulting in an increase in crystallization pressure and expansion, which caused stress accumulation and cracking of the concrete. On the other hand, the intrusion of sodium sulfate into the concrete occurred chemically to generate ettringite and gypsum and other expansive products; when too much product is generated, large expansion stresses are generated, which crack the concrete and reduce its flexural strength.

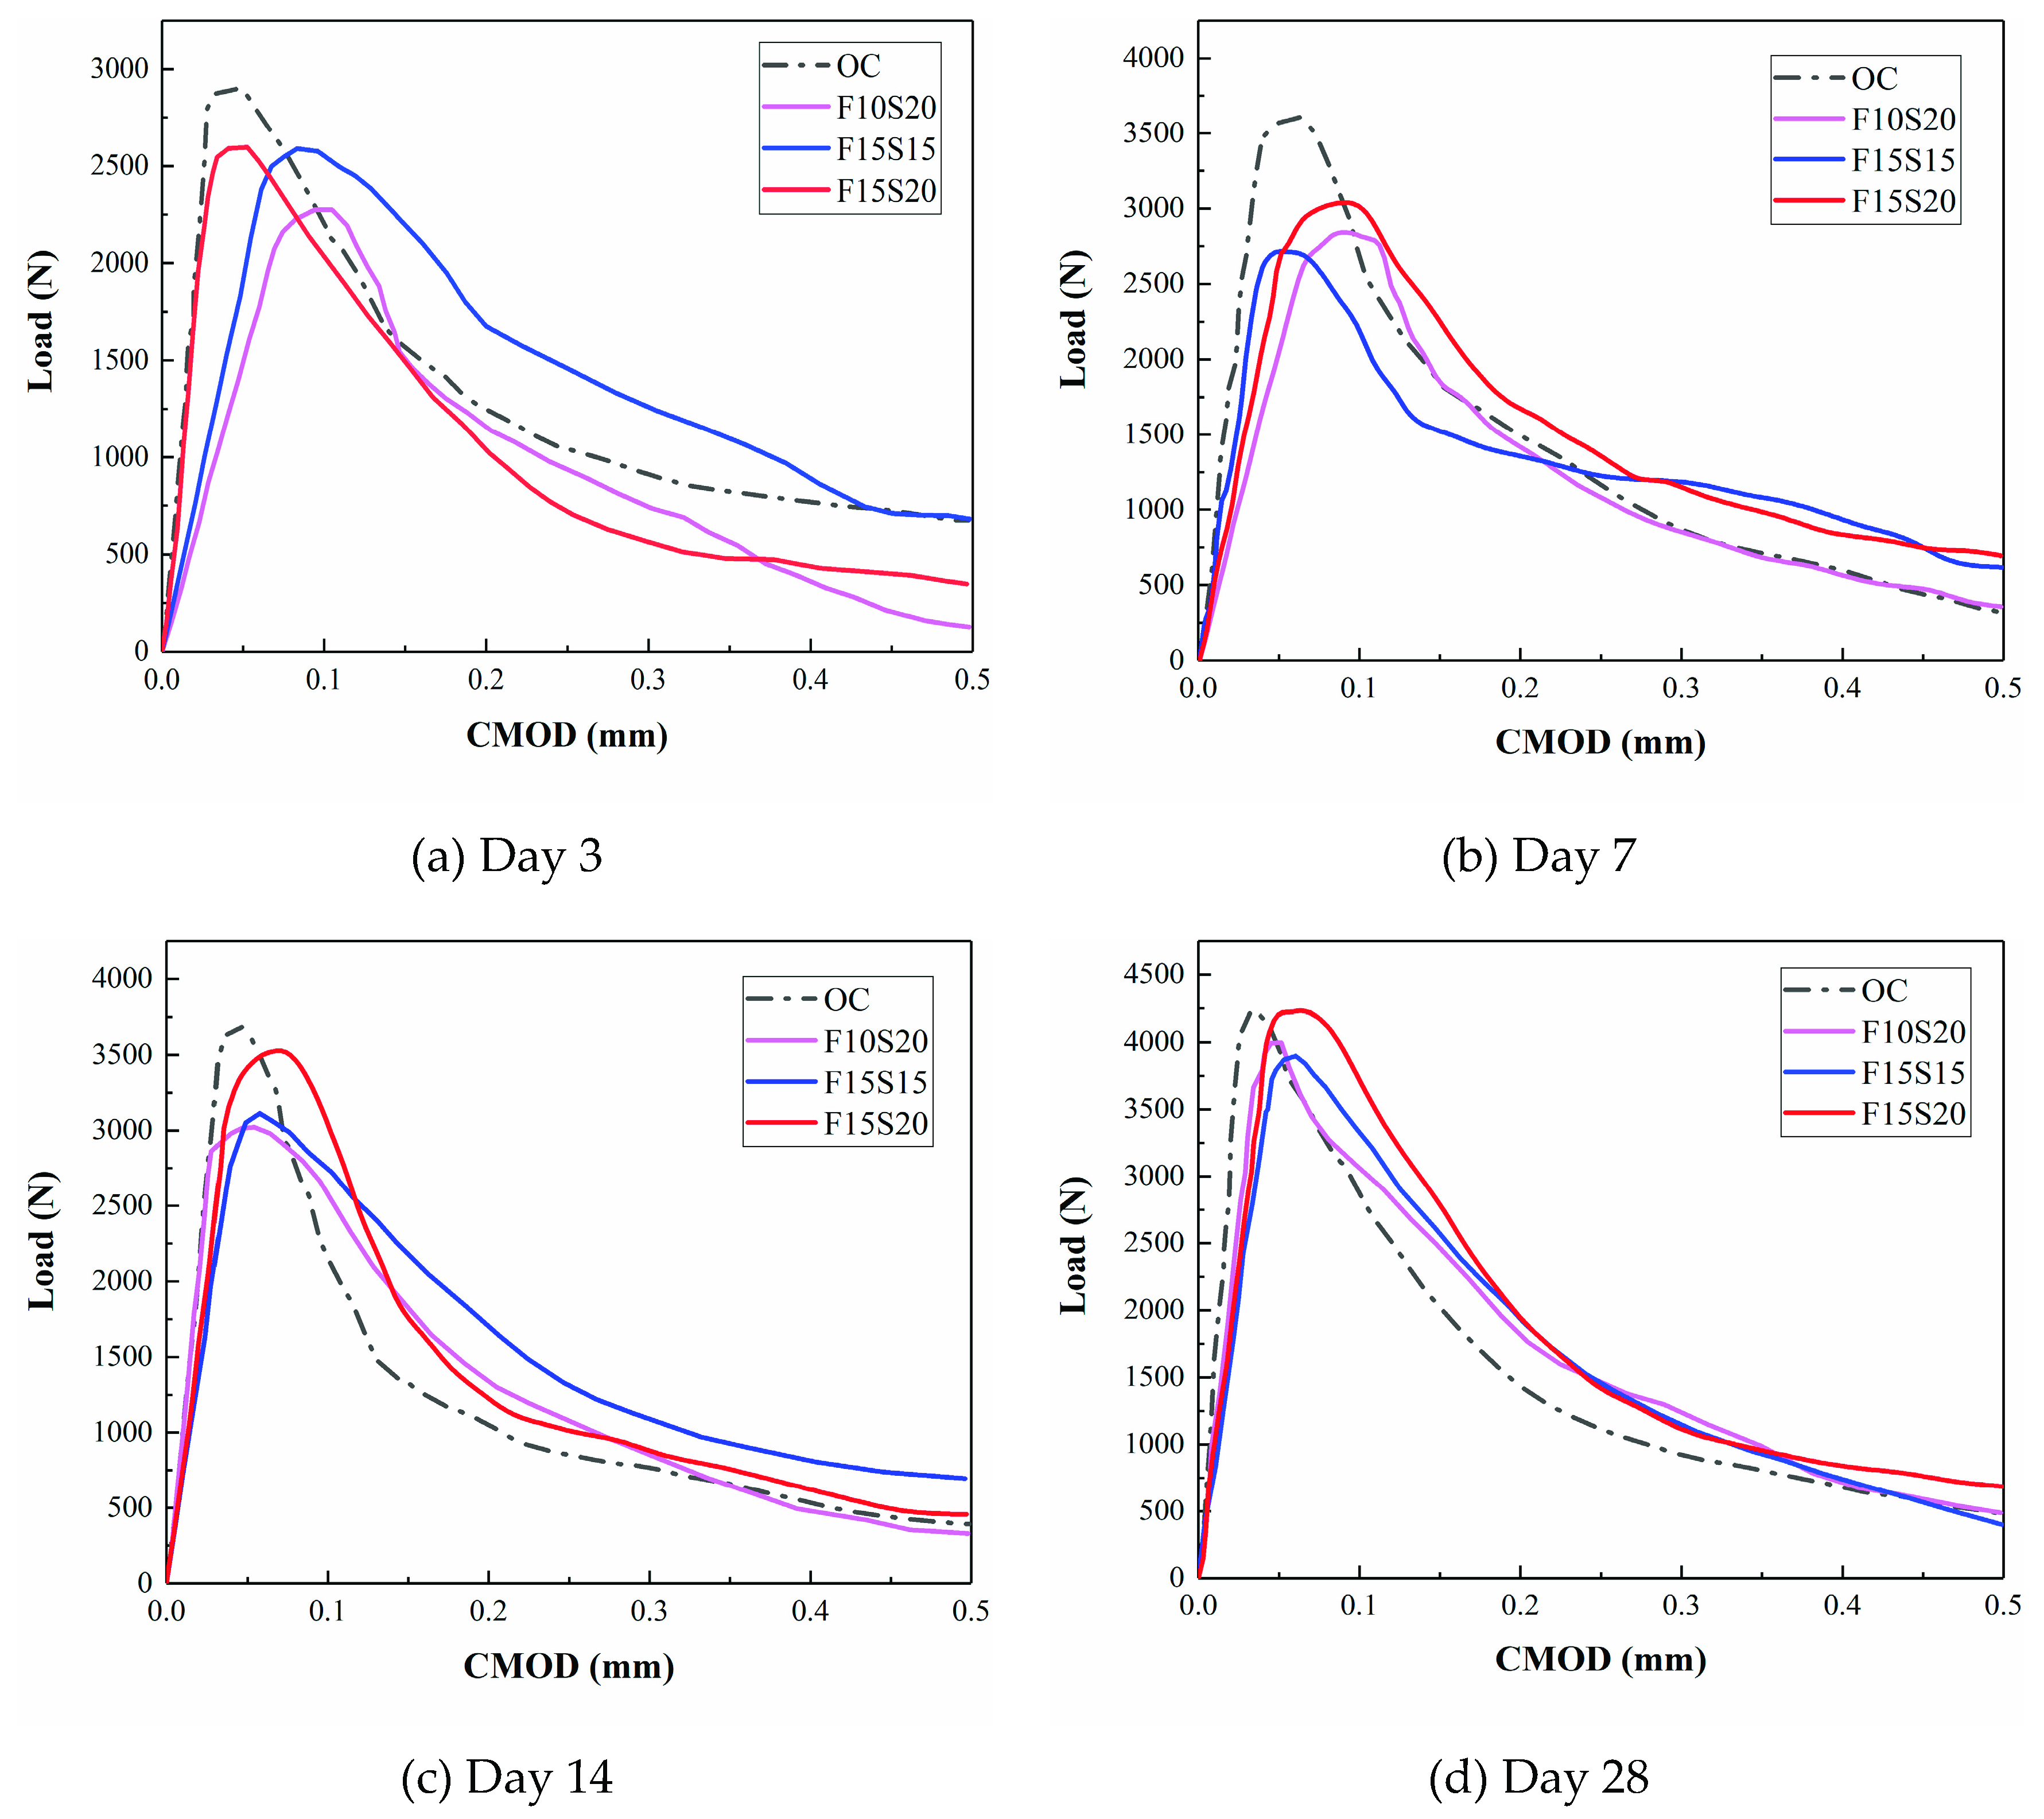
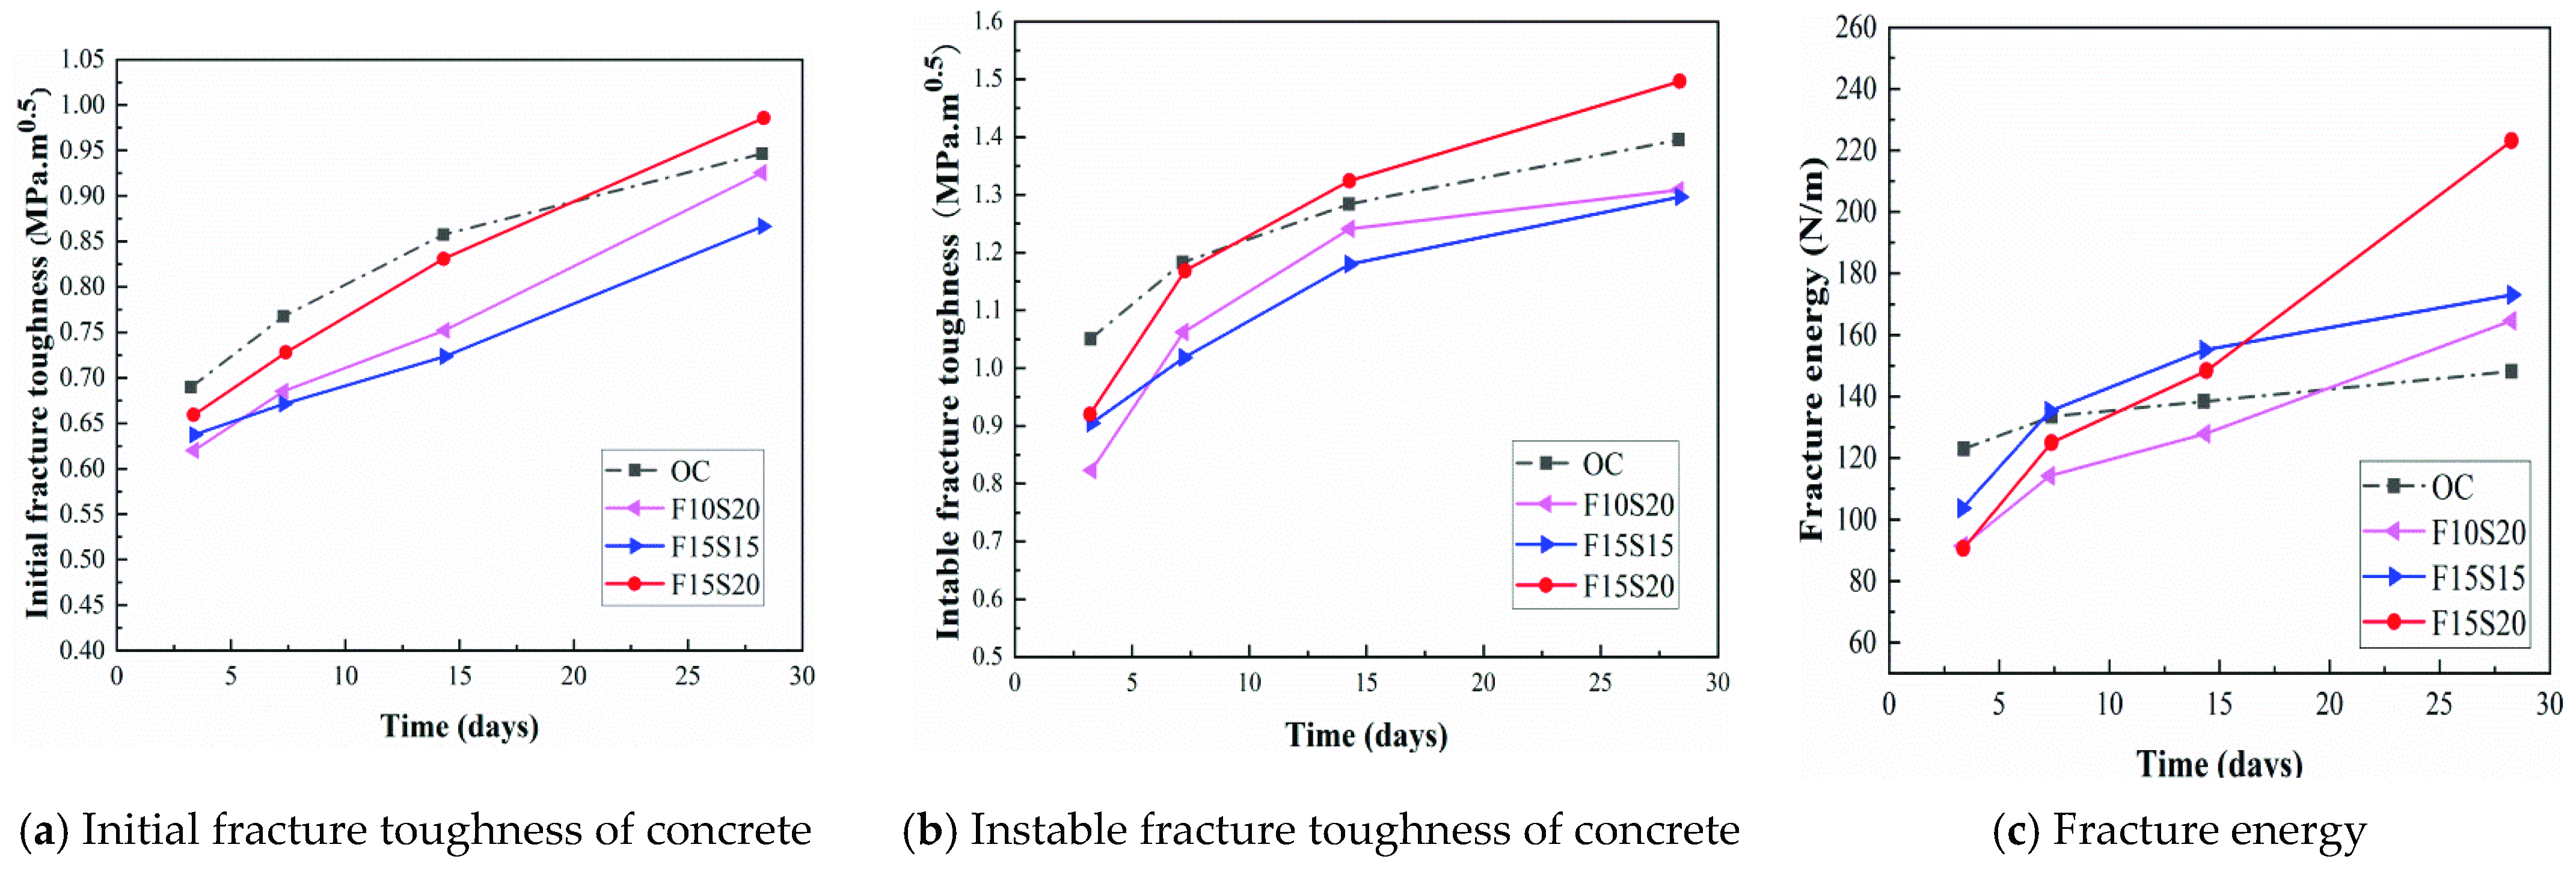
3.1.3. The Fracture Performance

Figure 9 plots the load–crack opening displacement (P-CMOD) curves for concrete with different mineral admixture content after 3, 7, 14, and 28 days, respectively. It can be seen that the peak loads of concrete with different mineral admixture content increased with age, indicating that the concrete continued to hydrate within 28 days, generating more hydration products and increasing bond strength, which was manifested as an increase in concrete strength. The peak loads of the mineral admixture-modified concrete were all smaller than those of the OC group, except for the F15S20 group, where the 28-day peak loads were greater than those of the OC group, which was due to the low initial activity of fly ash and slag, which contributed to the limited strength of the concrete. As can be seen from Figure 9b, the peak load values for the four groups of concrete on day 7 were 3.52 MPa, 2.85 MPa, 2.73 MPa, and 3.03 MPa for OC, F10S20, F15S15, and F15S20, respectively, and the gap in peak loads continued to decrease as the age increased, with the peak loads on day 28 being 4.20 MPa, 4.01 MPa, 3.91 MPa, and 4.24 MPa for F10S20, F15S15, and F15S20, respectively, which was due to the secondary hydration of active silica and alumina in the fly ash and slag in the concrete as the hydration reaction proceeded, consuming calcium hydroxide, improving the spatial composition of the interfacial transition zone, reducing the porosity of the concrete, and improving the performance of the concrete. It could also be found that the slope of the rising section of the concrete load–CMOD (P-CMOD) curve increased with age, indicating that the concrete had an increasing modulus of elasticity and improved resistance to deformation. Comparing concrete with different mineral admixture content, it was found that the slope of the rising section of the P-CMOD curve for the OC group was higher than that for mineral admixture concrete. The reason for this was that SO42− from the salt solution simulating saline soil erosion entered the concrete and reacted with the cement hydration products to form swelling products such as ettringite and gypsum, which filled the voids and made the concrete denser.
Figure 10a,b plot the variation curve of fracture toughness with age for concrete mixed with different mineral admixture content. It can be seen that the fracture toughness of concrete increased with age, the change trends of instable fracture toughness (KSIC) and initial fracture toughness (KQIC) were the same, and the initial fracture toughness of concrete in each group on day 3 was between 0.6 and 0.7 MPa.m0.5. The differences between instable fracture toughness and initial fracture toughness were OC: 0.378, F10S20: 0.203, F15S15: 0.266, and F15S20: 0.266. In practical engineering, when cracks are created in concrete, the larger this difference is, the greater the load required to carry the concrete structure from cracking to instability and the greater the ability of the concrete to resist crack expansion. On day 14, the OC group had the greatest initial fracture toughness and the F15S20 group had the greatest instable fracture toughness. Combining the analysis of the concrete P-CMOD curves and the fracture toughness formulae, it is clear that the main reason is that these two groups developed their own strength rapidly and were subjected to higher loads at fracture. The relationship between the initial fracture load and the instable fracture load of the four groups of concrete on day 28 was F15S20 > OC > F10S20 > F15S15, with the F15S20 group having the greatest initial fracture load and instable fracture load, indicating that this group was the least likely to crack under the external loading and showed the best cracking resistance.
Figure 10c plots the variation curve of fracture energy with age for concrete with different mineral admixture content. The increase in fracture energy with age for the OC group was small, the increase in fracture energy for the concrete containing mineral admixtures was faster until day 14, and the fracture energy of the four groups of concrete on day 3 was OC > F15S15 > S10S20 > F15S20; after 14 days, the increase in fracture energy for the F15S20 group was larger than that for the other three groups. The increase in fracture energy of the F15S20 group was larger than that of the other three groups, and the fracture energy of the four groups on day 28 was F15S20 > F15S15 > F10S20 > OC. Comparing the fracture energy of the four groups on day 3 and day 28, we found that the fracture energy of the OC group had already reached a larger value on day 3 and changed slowly thereafter. The addition of fly ash and slag to concrete can increase its fracture energy in the later stages, and in this study, the highest fracture energy was achieved with the addition of 15% fly ash and 20% slag.

3.2. Microstructure of Concrete

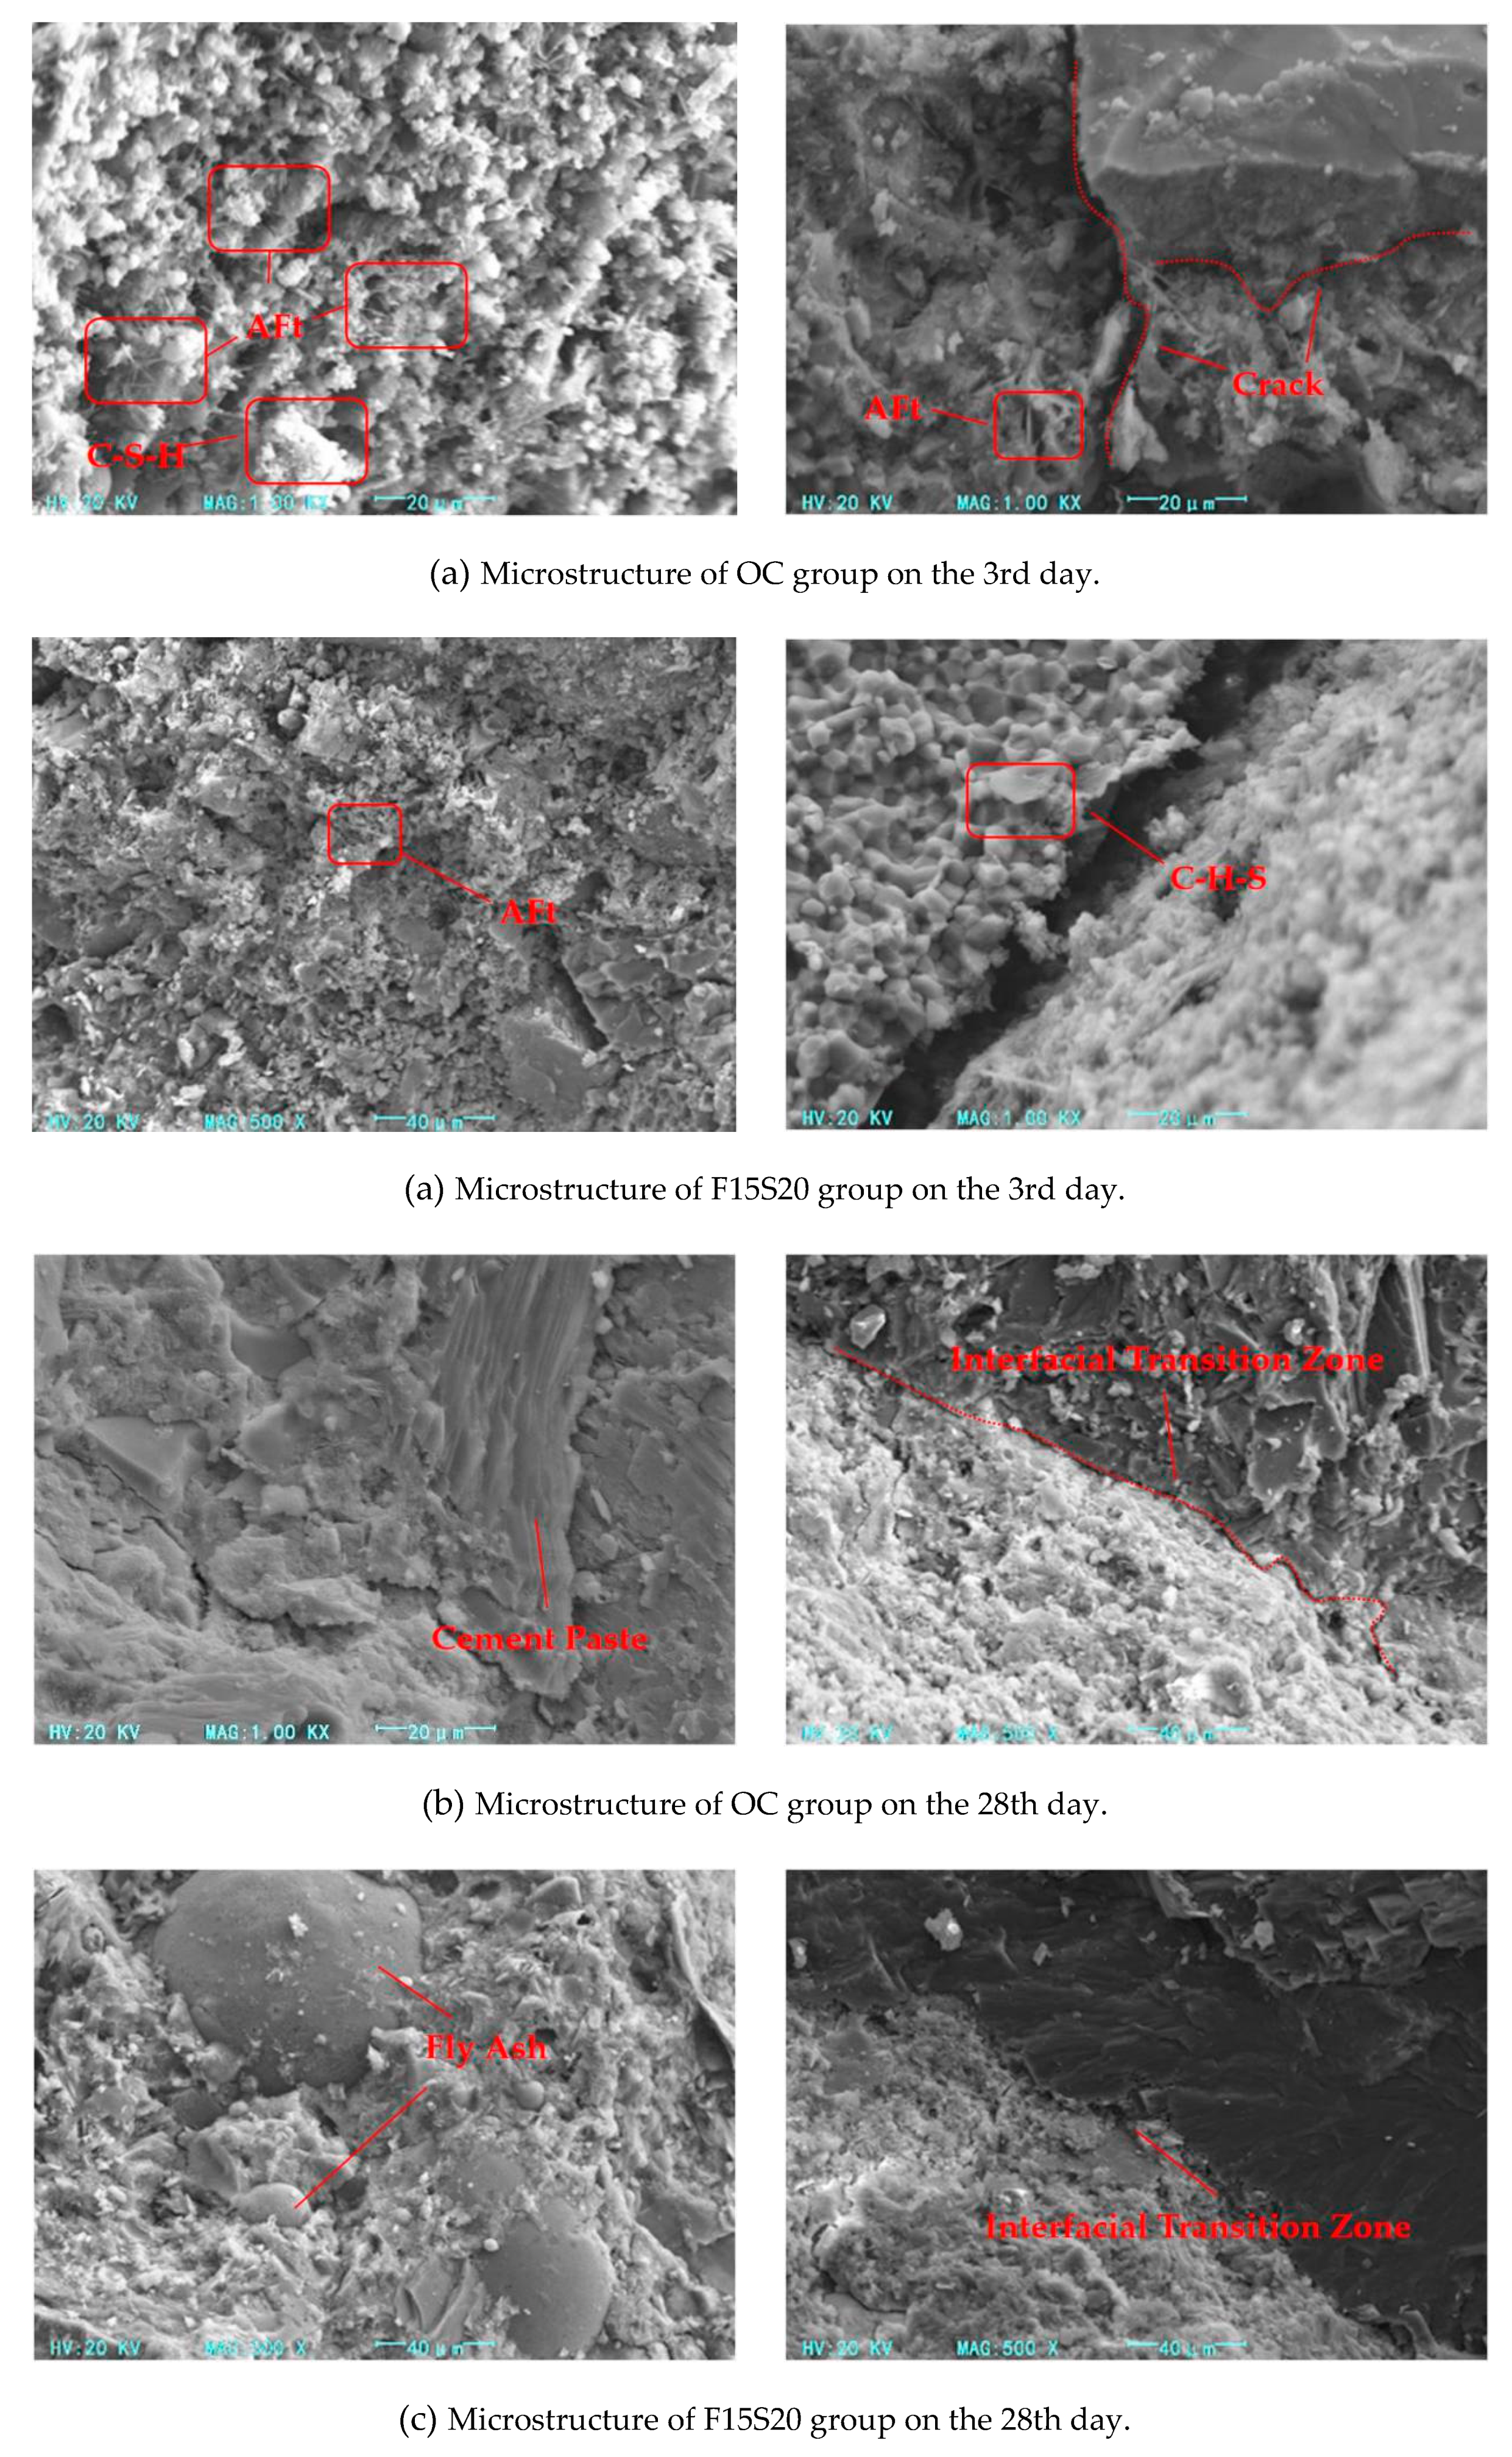
3.2.1. Microscopic Morphology Observation by SEM
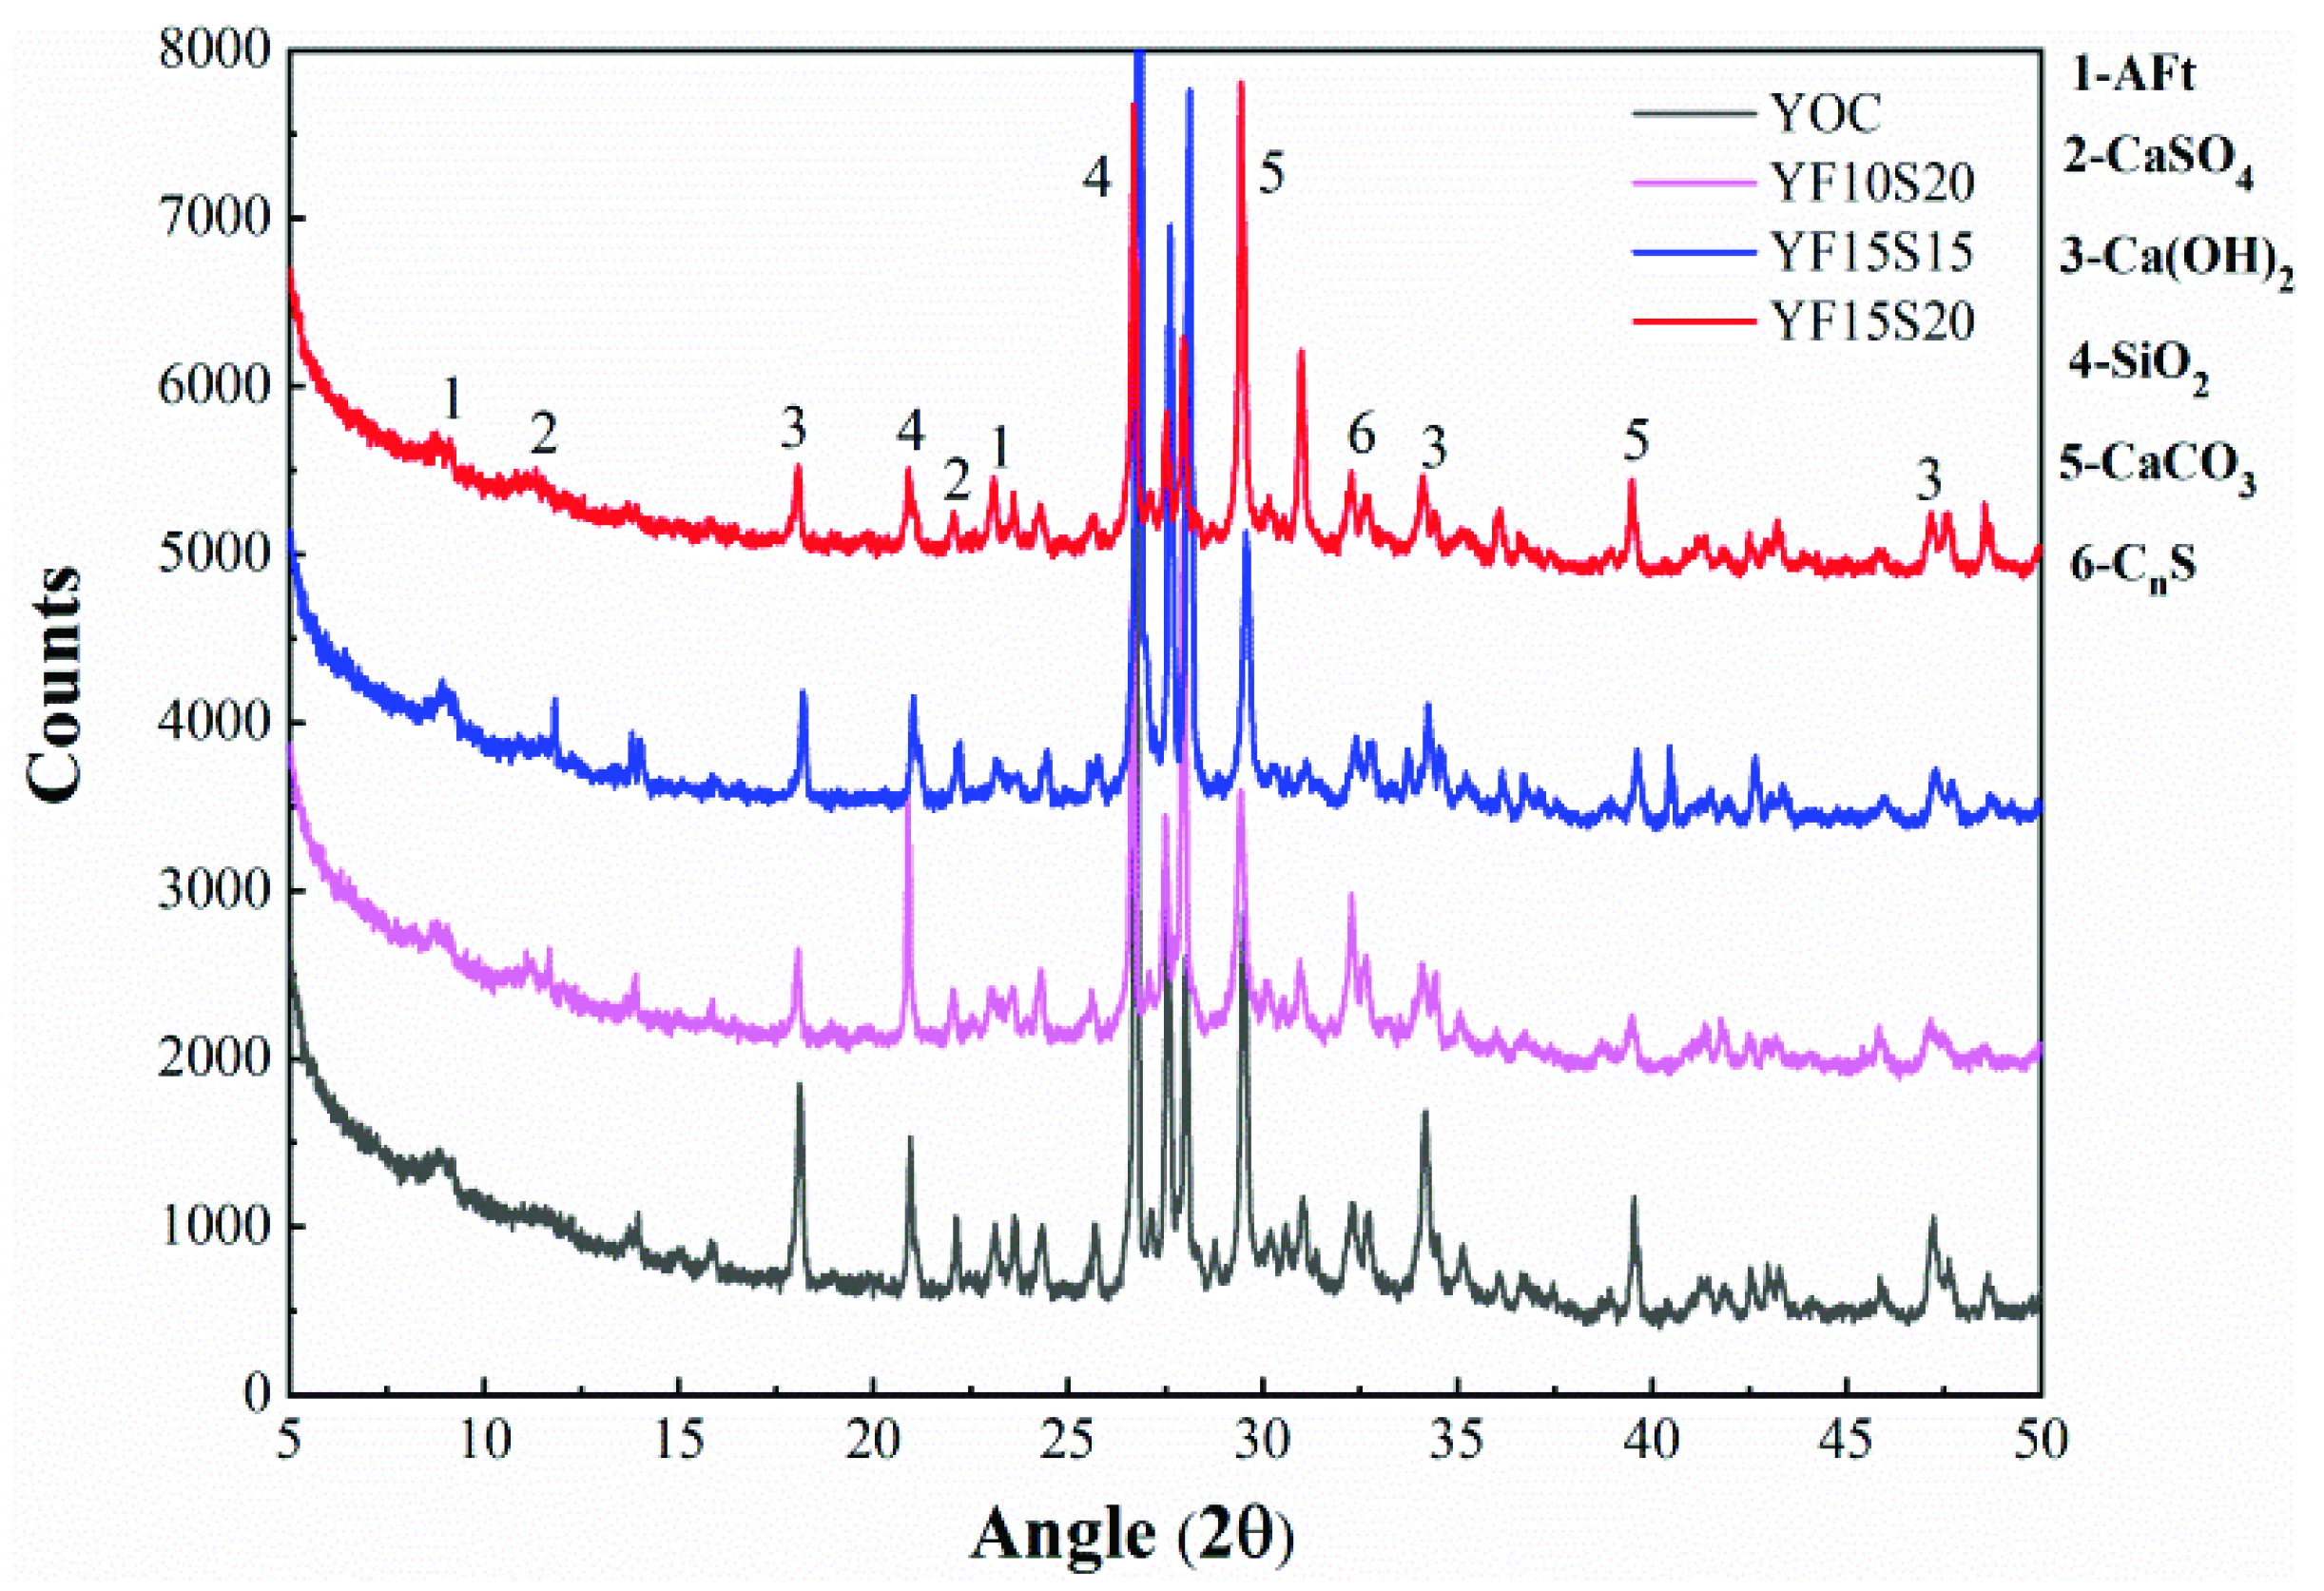
Figure 11a,b show the microstructures of the OC group and the F15S20 group on day 3, respectively, which show that the hydration products of the two groups formed clusters on day 3, with a large number of pores and cracks. This is because the fly ash and slag exerted a microaggregate effect, reducing the porosity of the concrete and improving the impermeability, while the OC group had poor impermeability and the sulfate ions reacted with the hydration products of the concrete to produce more ettringite. From Figure 11c,d, it can be seen that the internal structure of the concrete on day 28 was already quite dense as the cement hydrated and the clusters of hydrated calcium silicate products had bonded to each other to form a stable layer, and in Figure 11d, it can be seen that the fly ash was well bonded to the cement. As can be seen in Figure 11, there were obvious cracks in the transition zone between the cement paste and the aggregate at the age of day 3, and the width of the cracks was significantly reduced at the age of day 28. The main reason for this is that the enriched calcium hydroxide crystals at the interfacial transition zone were consumed to produce swelling products such as ettringite and gypsum, which improved the interfacial transition zone.

3.2.2. XRD Analysis

In order to analyze the physical phase components of the concrete modified by mineral admixtures at the age of day 28 in the environment with a large temperature difference and saline soil erosion, XRD diffraction patterns of the concrete with different mineral admixtures on day 28 were plotted, as shown in Figure 12. The calcium hydroxide diffraction peaks at 18°2θ and 34.2°2θ in the OC group on day 28 were significantly higher than those of the concrete containing fly ash and slag. The diffraction peaks of calcium hydroxide at both locations were, in descending order, OC > F15S15 > F10S20 > F15S20, indicating that the addition of fly ash and slag can replace part of the cement, reduce the amount of cement, and lower the calcium hydroxide content in the concrete. The lower calcium hydroxide content within the concrete in this environment compared to the large-temperature-difference environment suggests that the sulfate ions in the salt solution intruded into the concrete to excite the activity of the mineral admixtures and that the secondary hydration of fly ash and slag consumed the calcium hydroxide in the concrete, resulting in a smaller calcium hydroxide diffraction peak. As can be seen in Figure 12, the calcium silicate (C2S/C3S) content at the age of 32.3°2θ on day 28 was, from largest to smallest, F10S20 > OC > F15S15 > F15S20, with a lower peak value of unhydrated calcium silicate diffraction in the F15S20 group, which indicates a higher degree of hydration in the F15S20 group, a higher number of hydrated calcium silicate gels generated, and better concrete properties. This was also consistent with the macroscopic mechanical properties of the concrete.

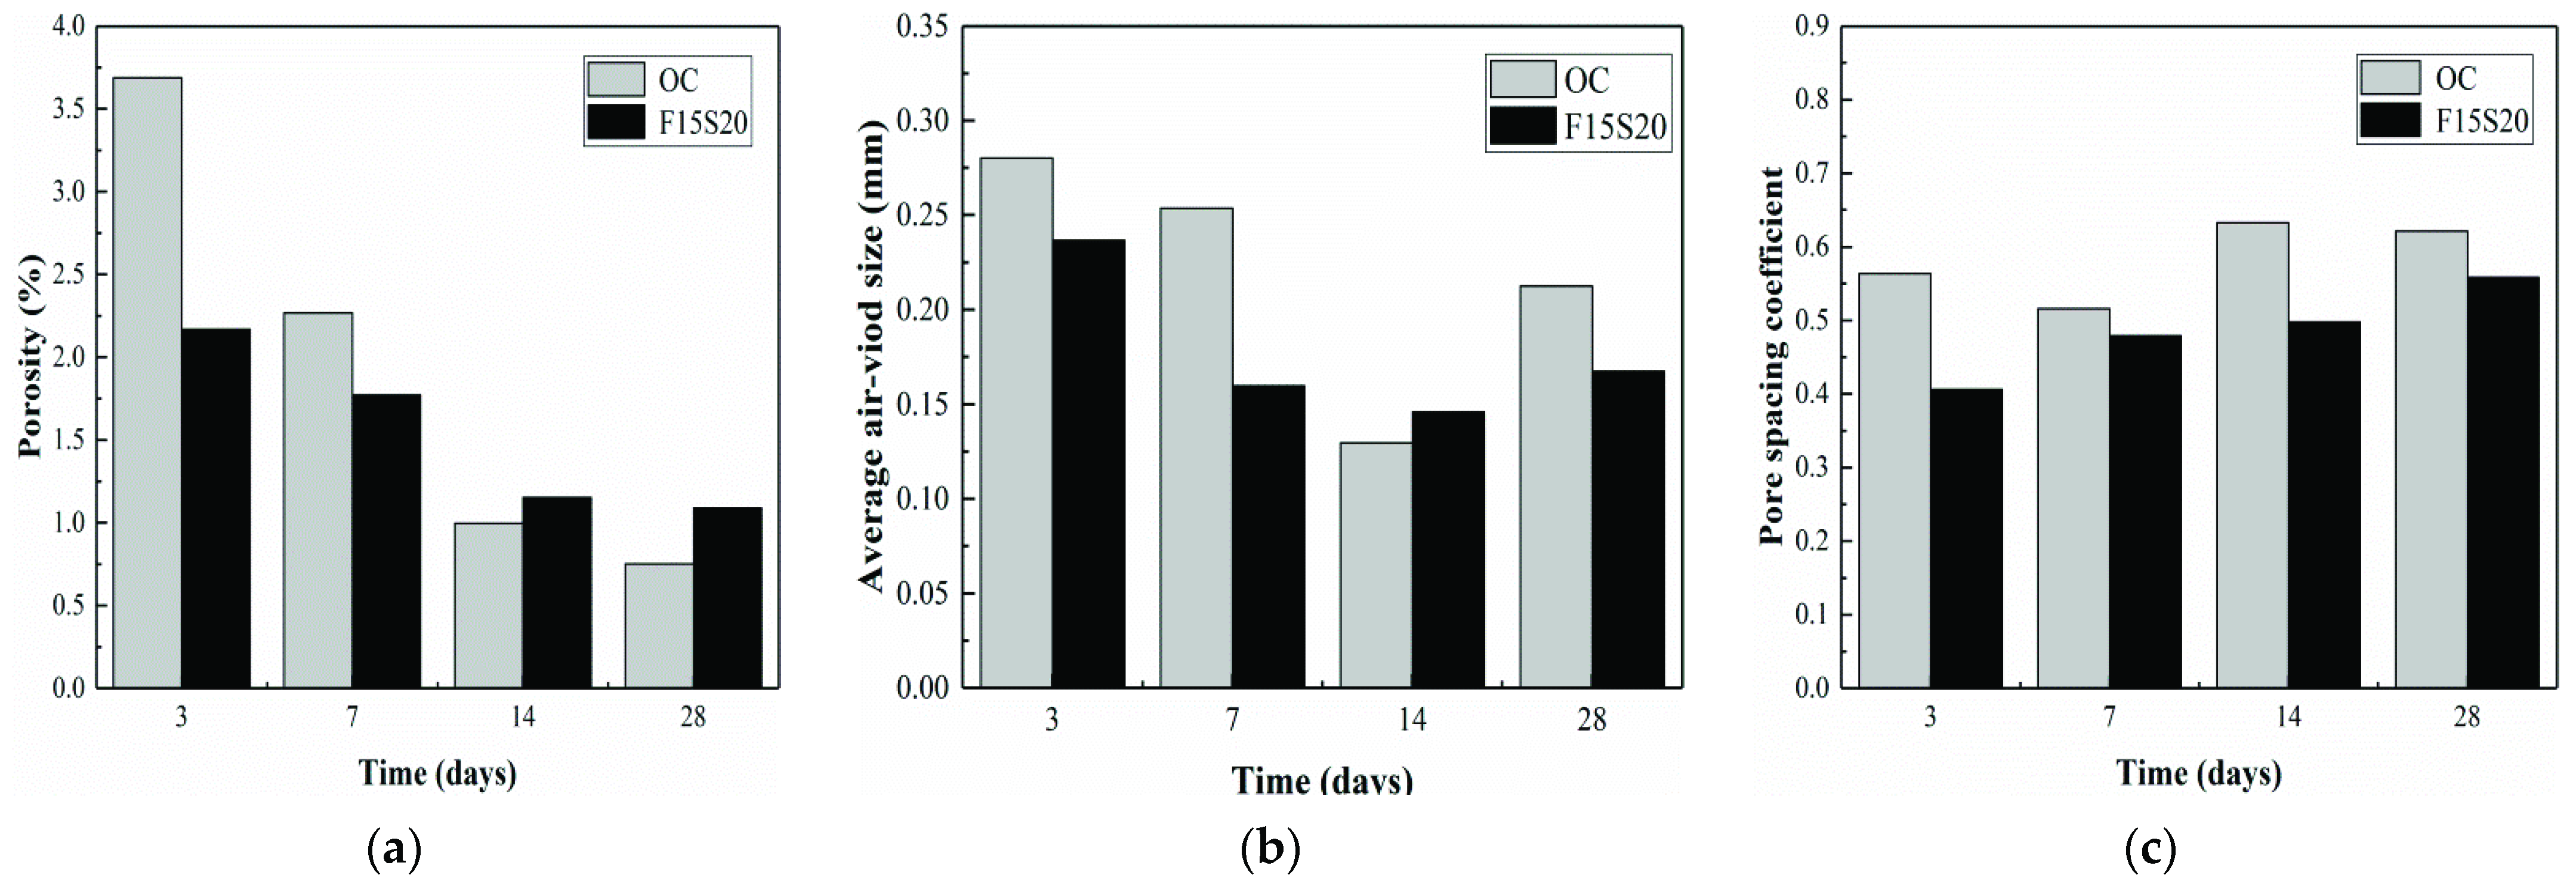
3.2.3. Pore Structure Analysis

The macroscopic properties and microscopic test results of the different groups of concrete show that the F15S20 group had better performance in the 28-day range, so the pore structure parameters of the OC group and the F15S20 group were analyzed here, mainly including porosity, average air-void size, and pore spacing coefficient. Figure 13a plots the porosity of the OC group and the F15S20 group at different ages. It can be seen that the porosity of concrete with different mineral admixture content showed a decreasing trend with increasing age. As the cement hydrated, the internal pores were continuously filled with hydration products and the porosity decreased. The porosity of the OC group was significantly higher than that of the F15S20 group at day 3 of age because the fly ash and slag added to the F15S20 group filled the concrete pores. Moreover, 14 days later, the porosity of the F15S20 group was less than that of the OC group because the fly ash and slag added to the F15S20 group caused the internal structure of the concrete to become dense by day 14, making it more difficult for the salt solution to invade the concrete, whereas in the OC group, due to the early porosity, more sulfate ions were invaded, and the cement hydration products produced swelling erosion products such as ettringite and gypsum, which reduced the porosity of the concrete.
Figure 13b shows the average air-void size of the concrete in the OC and F15S20 groups at different ages. The average air-void size in the OC group and the F15S20 group decreased and then increased as the age increased. The average air-void size of the concrete in both groups was the smallest on day 14 because the concrete was no longer cured by removing the geotextiles after day 14. The moisture inside the concrete evaporated faster under external conditions and the concrete underwent drying shrinkage. Micro-voids and micro-cracks were created, resulting in an increase in the average air-void size of the concrete.
Figure 13c plots the pore spacing coefficients for the OC group and the F15S20 group at different ages, which did not vary equally with age. The larger the pore spacing coefficient, the smaller the number of pores within a certain range. The increase in the pore spacing coefficient of the F15S20 group with age indicated that as the cement continued to hydrate, the internal pores of the F15S20 group continued to be filled with hydration products and became less porous. The pore spacing coefficient of the OC group decreased on day 7 and day 28; presumably, the rapid hydration reaction of the concrete from 3 to 7 days resulted in a large number of calcium hydroxide crystals generated in the interface transition zone, which were significantly oriented, resulting in an increase in concrete pore volume and an increase in the number of pores.
Figure 14 plots the percentage distribution of pore size for the OC group and the F15S20 group. From Figure 14a, it can be seen that the number of 1~30 μm pores in the OC group increased and then decreased as the age increased, the percentage of 1~30 μm pores increased before the 14th day due to the hydration of cement and slag, and the products filled the pores, showing the transformation of pores larger than 30 μm to 1~30 μm pores. Later, as the environment changed and the water in the concrete evaporated, the concrete developed temperature shrinkage and drying shrinkage, and the shrinkage stress in the weak areas was greater than the tensile strength, producing micro-cracks. The number of 1~30 μm pores increased with age in the F15S20 group. Compared to the OC group, the percentage of 1~30 μm pores was larger in the F15S20 group at day 3, mainly due to the filling effect of the mineral admixture, which reduced the percentage of large pores. The pore percentage values for the F15S20 group at day 28 age for 1~30 μm, 30~160 μm, and 160~1000 μm were 48%, 26%, and 26%, respectively, due to the intrusion of sulfate and chloride ions into the concrete, which stimulated the activity of fly ash and slag and promoted their secondary hydration to produce more hydrated calcium silicate and hydrated calcium aluminate, which filled the pores and compacted the concrete.

3.2.4. Chloride Ion Content in Concrete

Figure 15 plots the variation curve of chloride ion content with erosion depth at day 28 for the four groups of concrete. It can be seen that the chloride ion content within the concrete decreased as the depth of erosion increased. The difference in the chloride ion content in the first layer and the second layer within the concrete was greater because the salt solution caused salt crystals to adsorb to the concrete surface, resulting in a higher chloride ion concentration in the first layer. As the only cementitious material in the OC group consisted of cement, the pores between the mortar could only be filled by cement particles during the hydration process, which had a poor filling capacity, resulting in more pores in the concrete. The fly ash and slag were complementary to the cement particles due to their different particle sizes, filling the voids between the concrete mortar matrix, which improved the denseness of the concrete and its ability to resist the penetration of external chloride ions. As shown in Figure 15, the content of chloride ions within the same depth of the four groups of concrete was ranked as OC > F10S20 > F15S15 > F15S20, indicating that as the content of mineral admixture increased, the chloride ion content within the same depth of concrete decreased and the resistance of concrete to erosion by chloride ions was enhanced [43]. Moreover, when the content of slag was 20%, with the increase in the fly ash, the content of chloride ions within the concrete decreased, and when the total mineral admixture was 30%, increasing the content of fly ash and decreasing the content of slag were beneficial to enhance the resistance of concrete to erosion by chloride ions.

3.3. Fracture Resistance Mechanism of Fly Ash and Slag

The mineral admixture improved the fracture performance of the concrete under the conditions of a large temperature difference and saline soil (SO42− and Cl) attack. According to the macroscopic mechanical properties and microscopic characteristics of the concrete containing mineral admixtures under the harsh environment, the mechanism of fracture resistance of the fly ash and slag as the mineral admixture in the concrete could be analyzed. On the one hand, when the temperature changes are large every day, the temperature stress in concrete changes due to the temperature change, resulting in internal cracks. The cement in concrete is replaced in equal amounts by the mineral admixture, which reduces the amount of cement inside the concrete and the heat of hydration due to cement hydration. This can reduce the temperature stress of concrete in the temperature difference cycle when experiencing high temperatures, which can reduce the cracking of concrete and the internal defects of concrete, to improve the performance of concrete fracture resistance. On the other hand, fly ash and slag are fine enough to fill the pores between the cement particles, which makes the concrete denser inside and reduces the initial internal defects. Moreover, the secondary hydration products of the mineral admixture can further fill the internal pores of the concrete and continue to improve the bond strength between aggregates. In addition, compared with ordinary concrete, the impermeability of concrete mixed with mineral admixture is improved, and the permeability of SO42− and Cl under a harsh environment is reduced. At the same time, the secondary hydration of the mineral admixture consumes the Ca(OH)2 produced by the initial hydration of cement, to avoid the increase in internal pores and cracks in concrete caused by ion erosion, and to a certain extent, it plays the role of fracture resistance.
In the process of synergistic modification by fly ash and slag in concrete, the fly ash has higher activity than slag and can undertake more secondary hydration reactions. In addition, the secondary hydration products can fill the internal pores of the concrete to a greater extent and can resist the infiltration of corrosive ions. Therefore, the concrete with more fly ash content has lower Cl content in the results of this study. Fly ash mainly protects the mechanical properties of concrete from the negative effects of slag. By observing the compressive strength, flexural strength, and fracture energy of different groups of concrete, it can be seen that the concrete with more fly ash content has higher mechanical properties, which can guarantee the strength of mineral admixture concrete. The slag can improve the elastic modulus of concrete and the anti-deformation ability of concrete. Therefore, mixing concrete with fly ash and slag can provide the concrete with better fracture resistance through the modification advantages of fly ash and slag.

4. Conclusions

In this study, the compressive strength, flexural strength, and fracture performance of concrete modified by a mineral admixture in an environment with a large temperature difference and saline soil erosion were tested, and the microstructure, phase composition, and pore structure of the concrete were observed, the chloride ion content at different depths of concrete was measured, and the fracture resistance mechanism of fly ash and slag was also analyzed, which provides a reference for engineering applications. The main conclusions are as follows:
(1)
Both the compressive strength and the flexural strength of concrete increase with age. The results showed that the addition of the mineral admixture reduced the compressive strength of the concrete; compared with the OC group, the compressive strength of the F10S20, F15S15, and F15S20 groups decreased by 12.8%, 8.4%, and 9.4%, respectively, and the flexural strength of mineral admixture concrete was lower than that of ordinary concrete before 14 days, but its strength growth rate was greater than that of ordinary concrete, where the average growth rates in compressive strength from day 3 to day 14 for the four groups of concrete were: OC: 0.0406MPa/d, F10S20: 0.0679 MPa/d, F15S15: 0.0744 MPa/d, F15S20: 0.0580 MPa/d. The average growth rates in compressive strength from day 3 to day 14 for the F10S20, F15S15, and F15S20 groups were 67.24%, 83.25%, and 42.86% higher than those of the OC group, respectively.
(2)
Through the P-CMOD curve of concrete, it was found that the addition of a mineral admixture reduces the early fracture performance of concrete but has a more obvious effect on the later fracture performance of concrete. Moreover, the fracture toughness and fracture energy of concrete increase with age. Adding a mineral admixture can effectively improve the fracture energy of concrete after 28 days, and the fracture toughness of concrete mixed with 15% fly ash and 20% slag is the highest.
(3)
The microstructure of the concrete was observed using scanning electron microscopy, and it was found that as the age increased, the hydration products of the concrete changed from individually forming clusters to gradually bonding to form a laminar structure, and the fly ash was in a good state of bonding with the cement paste. The width of cracks in the transition zone at the interface of concrete at the age of day 28 decreased significantly. From the XRD diffraction patterns of the different groups of concrete at day 28, it could be seen that F15S20 concrete had the lowest C2S/C3S diffraction peaks and the concrete was more hydrated and had the best performance.
(4)
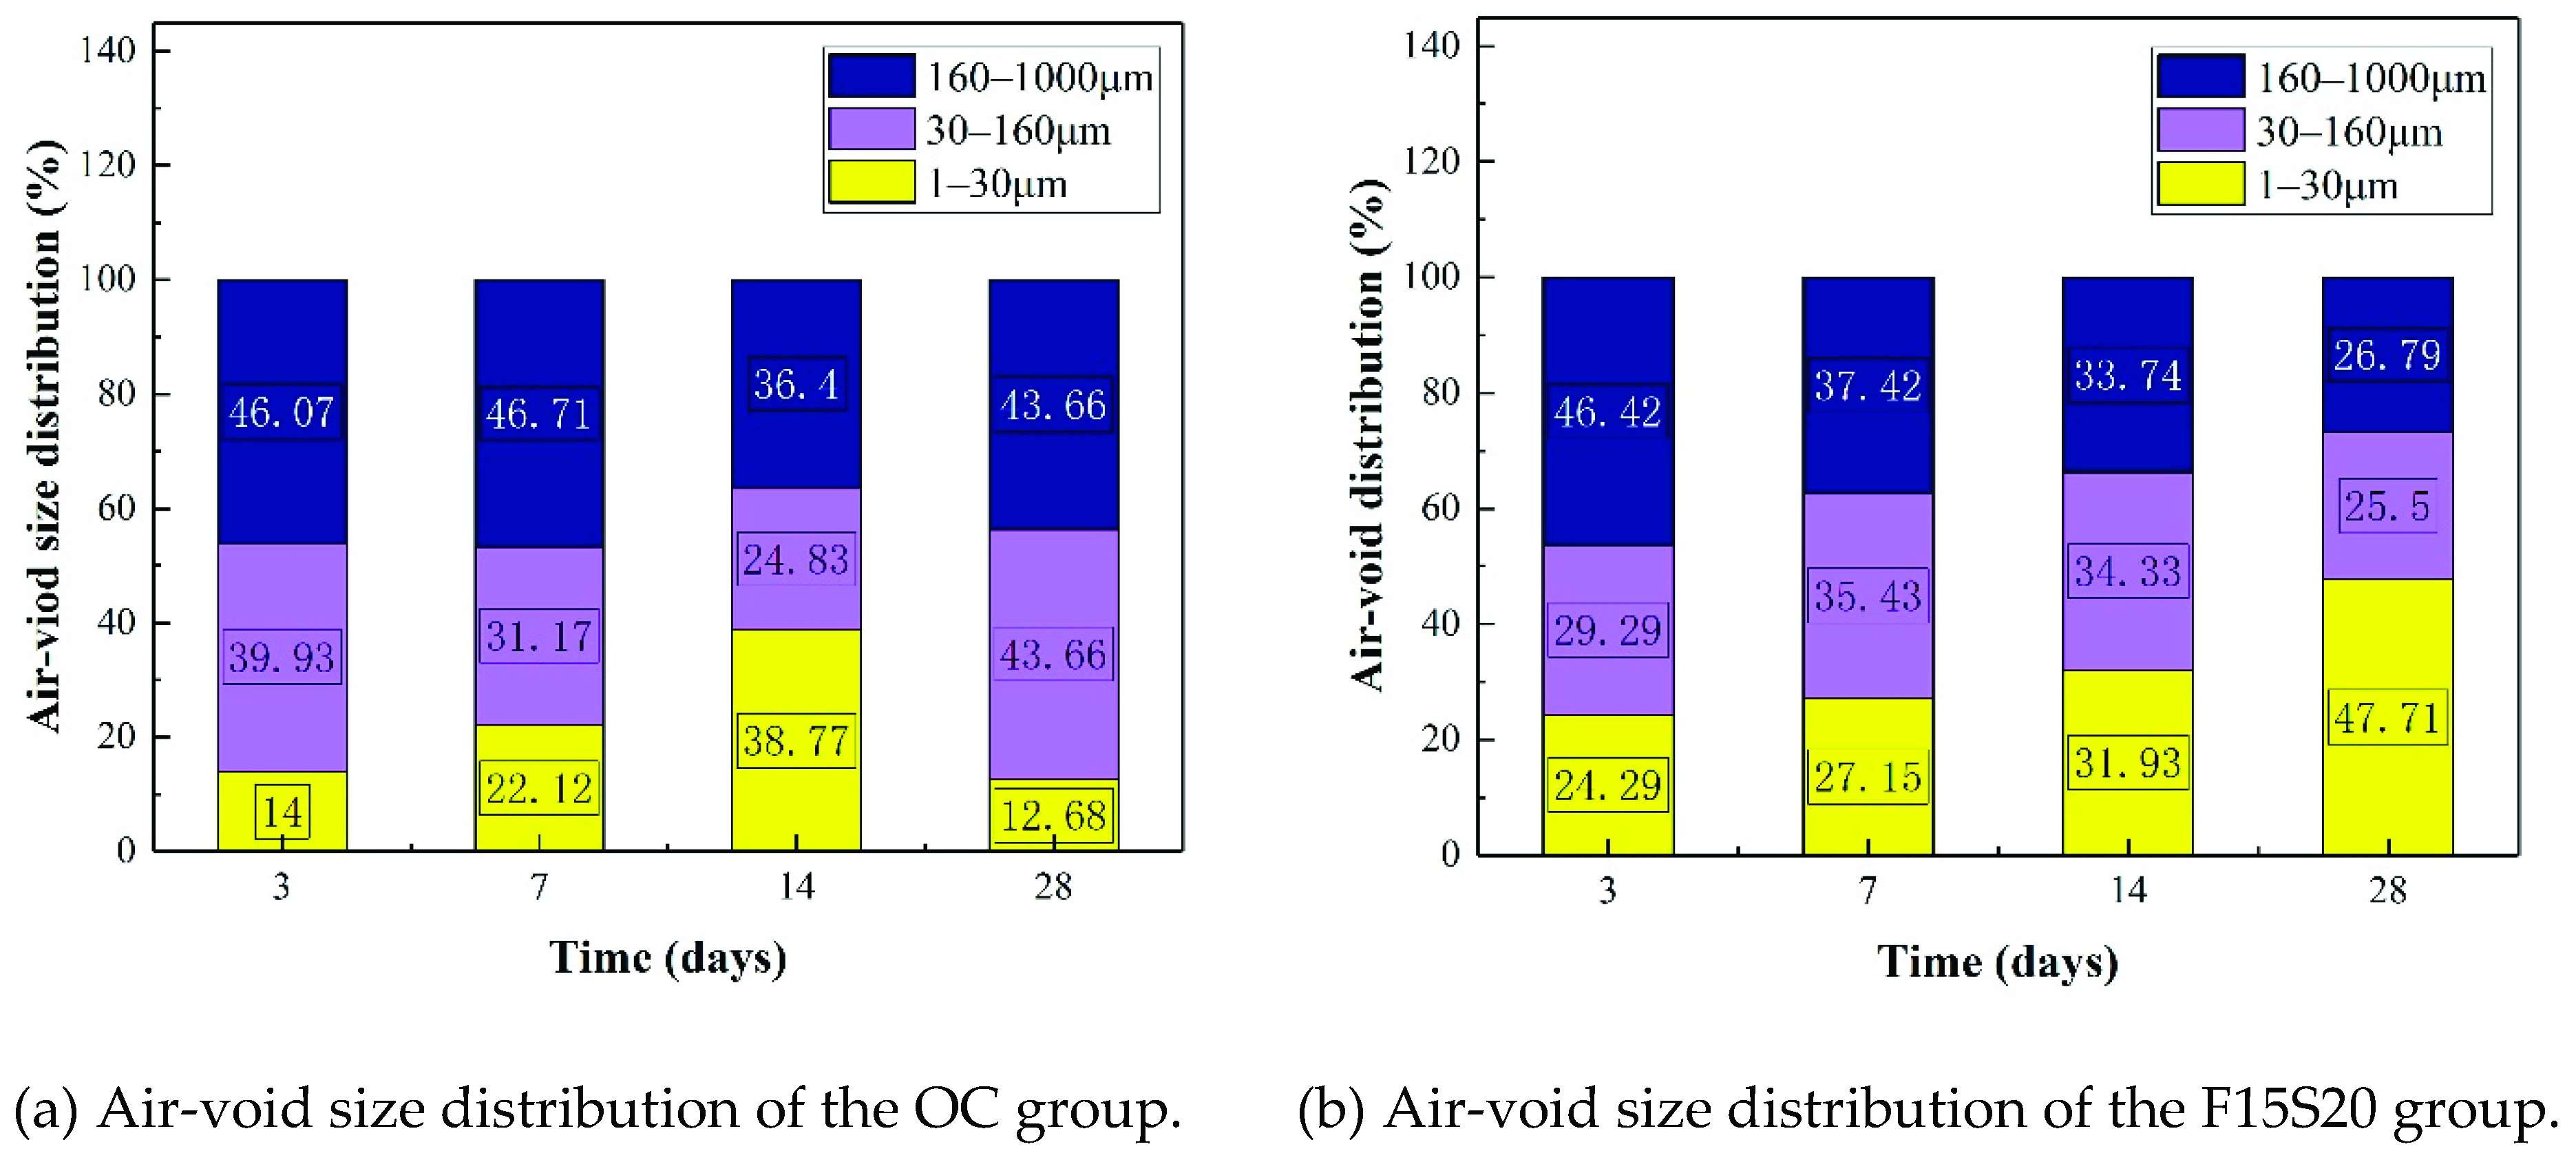
By analyzing the pore structure parameters of the OC group and the F15S20 group, it was found that with the increase in age, the porosity of the F15S20 group was slightly higher than that of the OC group, but the average air-void size was lower and the pore spacing coefficient was larger. The percentage values of the OC group and the F15S20 group from 1 μm to 30 μm on day 28 were 13% and 48%, respectively. The pore structure of the F15S20 group was better.
(5)
The addition of a mineral admixture can effectively reduce the Cl content in the concrete surface layer. The inhibition effect of fly ash on Cl infiltration is better than that of slag. By observing the XRD diffraction patterns at the 28th day in the different groups of concrete, it could be seen that the ettringite (AFt) content of concrete mixed with 15% fly ash and 20% slag was the lowest, indicating that its resistance to sulfate was stronger than ordinary concrete.
(6)
Under the conditions of large temperature differences, the macro-mechanical properties and microstructure of the concrete are combined, indicating that the concrete modified by mineral admixtures has higher resistance to this harsh environment than ordinary concrete, and the optimum admixture of mineral admixtures is 15% fly ash and 20% slag. In future studies, the effect of seasonal temperature difference variation on the mechanical properties and microstructure of mineral admixture concrete will be investigated. Furthermore, the optimal curing method of mineral admixture concrete under the conditions of large temperature differences will be explored to provide an alternative method for local engineering construction.

Author Contributions

Conceptualization, H.X.; Data curation, L.C.; Formal analysis, Q.M.; Funding acquisition, J.G. and H.X.; Investigation, H.X. and K.W.; Methodology, J.W. and K.W.; Project administration, J.G., J.W. and K.W.; Resources, J.G., J.W. and Q.M.; Software, H.X., Z.Z. and Q.M.; Supervision, K.W.; Validation, L.C., Y.Z. and H.L.; Visualization, H.L.; Writing—original draft, L.C.; Writing—review and editing, Y.Z., H.L., G.Q. and K.W. All authors have read and agreed to the published version of the manuscript.

Funding

This research was funded by the National Natural Science Foundation of China (No U2040224) and the Research and Development Project of China Construction Seventh Engineering Division. Co. Ltd. (No. CSCEC7b-2019-Z-6).

Institutional Review Board Statement

Not applicable.

Informed Consent Statement

Not applicable.

Data Availability Statement

Not applicable.

Conflicts of Interest

The authors declare no conflict of interest.

References

  1. Yu, B.T.; Wang, Q.C.; Zhou, L.X.; Zhang, F.Q. Experimental study on curing effect of concrete in arid and large diurnal temperature variation climate. Bull. Chin. Ceram. Soc. 2012, 31, 1398–1402. [Google Scholar]
  2. Yuasa, N.; Kasai, Y.; Matsui, I. Inhomogeneous distribution of the moisture content and porosity in concrete. In Concrete Durability and Repair Technology; Thomas Telford: London, UK, 1999; pp. 93–101. [Google Scholar]
  3. Soliman, A.M.; Nehdi, M.L. Effect of drying conditions on autogenous shrinkage in ultra-high performance concrete at early-age. Mater. Struct. 2011, 44, 879–899. [Google Scholar] [CrossRef]
  4. Holt, E. Contribution of mixture design to chemical and autogenous shrinkage of concrete at early ages. Cem. Concr. Res. 2004, 35, 464–472. [Google Scholar] [CrossRef]
  5. Schindler, A.K.; Folliard, K.J. Heat of Hydration Models for Cementitious Materials. Aci Mater. J. 2005, 102, 24–33. [Google Scholar]
  6. Jiang, X.P.; Wang, S.L.; Duan, S.X.; Sun, Y. Mechanism analysis of temperature crack appear of super mass concrete and new methods of anti-rack. Concrete 2007, 12, 98–102. [Google Scholar]
  7. Zhu, H.; Hu, Y.; Ma, R.; Wang, J.; Li, Q.B. Concrete thermal failure criteria, test method, and mechanism: A review. Constr. Build. Mater. 2021, 283, 122762. [Google Scholar] [CrossRef]
  8. Sun, J.; Jiang, Y.S.; Chen, C.; Guo, G.Q. Thermo-mechanic coupled damage simulation of idealized concrete material. J. Phys. Conf. Ser. 2021, 1978, 1. [Google Scholar]
  9. Xue, H.J.; Shen, X.D.; Wang, R.Y.; Liu, Q.; Liu, Z.; Han, C.; Yuan, Q. Mechanism anlysis of chloride-resistant erosion of acolian sand concrete under wing-sand erosion and dry-wet circulation. Trans. Chin. Soc. Agric. Eng. 2017, 33, 118–126. [Google Scholar]
  10. Guo, J.J.; Wang, K.; Guo, T. Effect of Dry–Wet Ratio on Properties of Concrete Under Sulfate Attack. Materials 2019, 12, 2755. [Google Scholar] [CrossRef] [Green Version]
  11. Shaikh, A.F.U. Effect of Cracking on Corrosion of Steel in Concrete. Int. J. Concr. Struct. Mater. 2018, 12, 53–64. [Google Scholar] [CrossRef] [Green Version]
  12. Wang, K.; Guo, J.J.; Wu, H.; Yang, L. Influence of dry-wet ratio on properties and microstructure of concrete under sulfate attack. Constr. Build. Mater. 2020, 263, 120635. [Google Scholar] [CrossRef]
  13. Ye, Z.Z.; Guo, G.Q.; Su, L.L.; Jiang, Y.S. Experimental study on mechanical properties of concrete under sub-high temperature cycles. J. Phys. Conf. Ser. 2021, 1978, 012007. [Google Scholar] [CrossRef]
  14. Shokrieh, M.M.; Heidari-Rarani, M.; Shakouri, M.; Kashizadeh, E. Effects of thermal cycles on mechanical properties of an optimized polymer concrete. Constr. Build. Mater. 2011, 25, 3540–3549. [Google Scholar] [CrossRef]
  15. An, M.Z.; Huang, H.F.; Wang, Y.; Zhao, G.Y. Effect of thermal cycling on the properties of high-performance concrete: Microstructure and mechanism. Constr. Build. Mater. 2020, 243, 118310. [Google Scholar] [CrossRef]
  16. Wu, Z.; Wong, H.S.; Buenfeld, N.R. Influence of drying-induced microcracking and related size effects on mass transport properties of concrete. Cem. Concr. Res. 2015, 68, 35–48. [Google Scholar] [CrossRef] [Green Version]
  17. Li, S.G.; Hao, W.N.; Chen, G.X.; Ji, G.J.; Qing, L.B. Influences of Initial Defects Caused by Drying on Macroscopic Performance of Concrete. J. Build. Mater. 2018, 21, 892–899. [Google Scholar]
  18. Zhang, G.H.; Li, Z.L.; Zhang, L.F.; Lv, C.F. Experimental Study on Concrete Strength for Different Drying Conditions. J. Build. Mater. 2015, 5, 840–846. [Google Scholar]
  19. Wei, Y.; Zheng, X.B.; Guo, W.Q. Shrinkage, Strength Development and Cracking of Internally Cured Concrete Exposed to Dry Conditions. J. Build. Mater. 2016, 19, 902–908. [Google Scholar]
  20. Nehdi, M.L.; Suleiman, A.R.; Soliman, A.M. Investigation of concrete exposed to dual sulfate attack. Cem. Concr. Res. 2014, 64, 42–53. [Google Scholar] [CrossRef]
  21. Sylvie, L.; Marie-Pierre, Y.-C.; Jérome, A. Sulfate transfer through concrete: Migration and diffusion results. Cem. Concr. Compos. 2011, 33, 735–741. [Google Scholar]
  22. Wang, K.; Guo, J.J.; Yang, L. Effect of dry–wet ratio on sulfate transport-reaction mechanism in concrete. Constr. Build. Mater. 2021, 302, 124418. [Google Scholar] [CrossRef]
  23. Figueira, R.B.; Sadovski, A.; Melo, A.P.; Pereira, E.V. Chloride Threshold Value to Initiate Reinforcement Corrosion in Simulated Concrete Pore Solutions: The Influence of Surface Finishing and pH. Constr. Build. Mater. 2017, 141, 183–200. [Google Scholar] [CrossRef]
  24. Shaheen, F.; Pradhan, B. Influence of sulfate ion and associated cation type on steel reinforcement corrosion in concrete powder aqueous solution in the presence of chloride ions. Cem. Concr. Res. 2017, 91, 73–86. [Google Scholar] [CrossRef]
  25. Okeniyi, J.O.; Popoola, A.P.I.; Loto, C.A. Corrosion-inhibition and compressive-strength performance of Phyllanthus muellerianus and triethanolamine on steel-reinforced concrete immersed in saline/marine simulating-environment. Energy Procedia 2017, 119, 972–979. [Google Scholar] [CrossRef]
  26. Ceroni, F.; Bonati, A.; Galimberti, V.; Occhiuzzi, A. Effects of environmental conditioning on the bond behavior of FRP and FRCM systems applied to concrete elements. J. Eng. Mechan. 2018, 144, 04017144. [Google Scholar] [CrossRef]
  27. De Domenico, D.; Urso, S.; Borsellino, C.; Spinella, N.; Recupero, A. Bond behavior and ultimate capacity of notched concrete beams 745 with externally-bonded FRP and PBO-FRCM systems under different environmental conditions. Constr. Build. Mater. 2020, 265, 121208. [Google Scholar] [CrossRef]
  28. Kou, S.; Poon, C.S. Compressive strength, pore size distribution and chloride-ion penetration of recycled aggregate concrete incorporating class-F fly ash. J. Wuhan Univ. Technol.-Mater. 2006, 21, 130–136. [Google Scholar]
  29. Berndt, M.L. Properties of sustainable concrete containing fly ash, slag and recycled concrete aggregate. Constr. Build. Mater. 2009, 23, 2606–2613. [Google Scholar] [CrossRef]
  30. Xie, J.H.; Wang, J.J.; Rao, R.; Wang, C.H.; Fang, C. Effects of combined usage of GGBS and fly ash on workability and mechanical properties of alkali activated geopolymer concrete with recycled aggregate. Compos. Part B. 2019, 164, 179–190. [Google Scholar] [CrossRef]
  31. Zhao, Y.H.; Gong, J.X.; Zhao, S.M. Experimental study on shrinkage of HPC containing fly ash and ground granulated blast-furnace slag. Constr. Build. Mater. 2017, 155, 145–153. [Google Scholar] [CrossRef]
  32. Kou, S.C.; Poon, C.S. Long-term mechanical and durability properties of recycled aggregate concrete prepared with the incorporation of fly ash. Cem. Concr. Compos. 2013, 37, 12–19. [Google Scholar] [CrossRef]
  33. Elahi, M.M.A.; Shearer, C.R.; Abu, N.R.R.; Saha, A.K.; Khan, M.N.N.; Hossain, M.M.; Sarker, P.K. Improving the sulfate attack resistance of concrete by using supplementary cementitious materials (SCMs): A review. Constr. Build. Mater. 2021, 281, 122628. [Google Scholar] [CrossRef]
  34. SL/T352-2020. Test Code for Hydraulic Concrete; China Water and Power Press: Beijing, China, 2020. [Google Scholar]
  35. GB/T 50082-2009. Standard for Test Methods of Long-Term Performance and Durability of Ordinary Concrete; China Architecture and Building Press: Beijing, China, 2009. [Google Scholar]
  36. GB/T 50081-2019. Standard for Test Methods of Concrete Physical and Mechanical Properties; China Architecture and Building Press: Beijing, China, 2019. [Google Scholar]
  37. DL/T 5332-2005. Norm for Fracture Test of Hydraulic Concrete; China Electric Power Press: Beijing, China, 2005. [Google Scholar]
  38. Guo, J.J.; Zhang, S.W.; Guo, T.; Zhang, P. Effects of UEA and MgO expansive agents on fracture properties of concrete. Constr. Build. Mater. 2020, 263, 120245. [Google Scholar] [CrossRef]
  39. Tixier, R.; Mobasher, B. Modeling of Damage in Cement-Based Materials Subjected to External Sulfate Attack. II: Comparison with Experiments. J. Mater. Civ. Eng. 2003, 15, 314–322. [Google Scholar] [CrossRef]
  40. Zhang, X.D.; Liang, Y.; Yue, Y. Experimental Study of Fly Ash Activator in the Application of Aeolian Soil. Adv. Mater. Res. 2011, 1279, 3361–3365. [Google Scholar] [CrossRef]
  41. Xiang, X.; Guo, J.C. Research on Microstructure of Activated Fly Ash Cement. J. Wuhan Univ. Technol. 2008, 30, 27–32. [Google Scholar]
  42. Nie, Q.K.; Zhou, C.J.; Shu, X.; He, Q.; Huang, B.S. Chemical, Mechanical, and Durability Properties of Concrete with Local Mineral Admixtures under Sulfate Environment in Northwest China. Materials 2014, 7, 3372–3785. [Google Scholar] [CrossRef]
  43. Li, F.X.; Chen, Y.Z.; Long, S.Z.; Chen, J. Properties and microstructure of marine concrete with composite mineral admixture. J. Wuhan Univ. Technol.-Mater. 2009, 24, 497–501. [Google Scholar] [CrossRef]
Figure 1. Environmental chamber.
Applsci 11 09338 g001
Figure 2. Geotextiles maintenance process.
Applsci 11 09338 g002
Figure 3. Daily temperature change cycle process.
Applsci 11 09338 g003
Figure 4. Schematic diagram of flexural resistance test.
Applsci 11 09338 g004
Figure 5. Schematic diagram of fracture test.
Applsci 11 09338 g005
Figure 6. The hardened concrete hole structure analyzer and the traverses.
Applsci 11 09338 g006
Figure 7. Compressive strength of the four groups of concrete under the erosion of SO42− and Cl and a large temperature difference.
Applsci 11 09338 g007
Figure 8. Flexural strength for the four groups of concrete under erosion of SO42− and Cl and a large temperature difference.
Applsci 11 09338 g008
Figure 9. P-CMOD curves of concrete at different ages: (a) day 3; (b) day 7; (c) day 14; (d) day 28.
Applsci 11 09338 g009
Figure 10. Fracture performance index of concrete with age: (a) initial fracture toughness of concrete; (b) unstable fracture toughness of concrete; (c) fracture energy.
Applsci 11 09338 g010
Figure 11. Microstructure of concrete at different ages: (a) microstructure of OC group on the 3rd day; (b) microstructure of F15S20 group on the 3rd day; (c) microstructure of OC group on the 28th day; (d) microstructure of F15S20 group on the 28th day.
Applsci 11 09338 g011
Figure 12. XRD pattern of concrete on the 28th day.
Applsci 11 09338 g012
Figure 13. Pore structure parameters of concrete at different ages: (a) porosity of concrete; (b) average air-void size of concrete; (c) pore spacing coefficients of concrete.
Applsci 11 09338 g013
Figure 14. Pore diameter distribution of concrete at different ages: (a) the OC group; (b) the F15S20 group.
Applsci 11 09338 g014
Figure 15. Variation curve of Cl content with depth in concrete on the 28th day.
Applsci 11 09338 g015
Table 1. The physical properties and chemical components of cement.
Physical PropertiesSpecific Surface Area (m2/kg)Compressive Strength 3/28 Days (MPa)Flexural Strength 3/28 Days (MPa)Initial Setting Time (min)Final Setting Time (min)
37433/556.7/8.7198247
Chemical componentsK2ONa2OFe2O3Al2O3SiO2CaOSO3MgOIgnition loss (%)
0.820.434.278.3824.5356.932.733.803.60
Table 2. The physical properties of fly ash and slag.
IndicatorsSpecific Surface Area (m2/kg)Ignition Loss (%)Density (g·cm−3)Water Content (%)
Fly ash2874.602.300.50
Slag4291.243.100.25
Table 3. The mix proportion of concrete.
GroupsW/BWater (kg/m3)Cement (kg/m3)Fly Ash (kg/m3)Slag (kg/m3)Sand (kg/m3)Stone (kg/m3)High-Range Water Reducer (kg/m3)
OC0.401604000069911411.2
F10S200.40160280408069911411.0
F15S150.40160280606069911411.0
F15S200.40160260608069911410.9
Note: OC means ordinary concrete, F10S20 means concrete with fly ash of 10% and slag of 20%, F15S15 means concrete with fly ash of 15% and slag of 15%, F150S20 means concrete with fly ash of 15% and slag of 20%.
Publisher’s Note: MDPI stays neutral with regard to jurisdictional claims in published maps and institutional affiliations.

