Next Article in Journal
A Local Search Maximum Likelihood Parameter Estimator of Chirp Signal
Next Article in Special Issue
Does Two-Class Training Extract Real Features? A COVID-19 Case Study
Previous Article in Journal
Object-Wise Video Editing
Previous Article in Special Issue
Hybrid Deep Learning-Based Epidemic Prediction Framework of COVID-19: South Korea Case
 
 
Erratum published on 12 April 2022, see Appl. Sci. 2022, 12(8), 3869.
Article

Accelerating Detection of Lung Pathologies with Explainable Ultrasound Image Analysis

1
Department of Biosystems Science and Engineering, ETH Zurich, 4058 Basel, Switzerland
2
Department of Computer Science, ETH Zurich, 8092 Zurich, Switzerland
3
Department of Mathematics and Computer Science, University of Barcelona, 08007 Barcelona, Spain
4
Brandenburg Medical School Theodor Fontane, 16816 Neuruppin, Germany
5
Pediatric Emergency Department, Hirslanden Clinique des Grangettes, 1224 Geneva, Switzerland
6
Department of Philosophy, University of Vienna, 1010 Vienna, Austria
7
Physik Department T35 and Bernstein Center for Computational Neuroscience, Technische Universität München, 85747 Garching bei München, Germany
8
Northumbria Specialist Emergency Care Hospital, Cramlington NE23 6NZ, UK
9
SIB Swiss Institute of Bioinformatics, 1015 Lausanne, Switzerland
*
Authors to whom correspondence should be addressed.
Shared first-authors.
Submission received: 19 December 2020 / Revised: 7 January 2021 / Accepted: 8 January 2021 / Published: 12 January 2021

Abstract

:
Care during the COVID-19 pandemic hinges upon the existence of fast, safe, and highly sensitive diagnostic tools. Considering significant practical advantages of lung ultrasound (LUS) over other imaging techniques, but difficulties for doctors in pattern recognition, we aim to leverage machine learning toward guiding diagnosis from LUS. We release the largest publicly available LUS dataset for COVID-19 consisting of 202 videos from four classes (COVID-19, bacterial pneumonia, non-COVID-19 viral pneumonia and healthy controls). On this dataset, we perform an in-depth study of the value of deep learning methods for the differential diagnosis of lung pathologies. We propose a frame-based model that correctly distinguishes COVID-19 LUS videos from healthy and bacterial pneumonia data with a sensitivity of 0.90 ± 0.08 and a specificity of 0.96 ± 0.04 . To investigate the utility of the proposed method, we employ interpretability methods for the spatio-temporal localization of pulmonary biomarkers, which are deemed useful for human-in-the-loop scenarios in a blinded study with medical experts. Aiming for robustness, we perform uncertainty estimation and demonstrate the model to recognize low-confidence situations which also improves performance. Lastly, we validated our model on an independent test dataset and report promising performance (sensitivity 0.806 , specificity 0.962 ). The provided dataset facilitates the validation of related methodology in the community and the proposed framework might aid the development of a fast, accessible screening method for pulmonary diseases. Dataset and all code are publicly available at: https://github.com/BorgwardtLab/covid19_ultrasound.

1. Introduction

To date, SARS-CoV-2 has infected more than 90 million and killed more than 1.9 million patients around the globe (https://0-coronavirus-jhu-edu.brum.beds.ac.uk/map.html (accessed on 11 January 2020)). Its long and dispersive incubation time calls for fast, accurate, and reliable techniques for early disease diagnosis to successfully fight the spread [1]. The standard genetic test (RT-PCR ) has a processing time of up to 2 days [2]. Several publications have reported sensitivity as low as 70% [3,4] and a meta-analysis estimated the false negative rate to be at least 20% over the course of the infection [5]. Medical imaging complements the diagnostic process that can guide further PCR-testing, especially in triage situations [6]. CT (Computed Tomography) scanning is the imaging gold standard for pulmonary diseases [7] and is considered reliable for COVID-19 diagnosis in some countries [4,8,9], although a significant amount of patients exhibit normal CT scans [10]. However, CT scanning is expensive and highly irradiating, carries significant risk of cross infection to healthcare workers and requires extensive, time-consuming sterilization [11]. It is furthermore reserved for developed countries; there are only ∼30 k CT scanners globally [12]. A chest X-ray (CXR) is the most common first line procedure in diagnostic imaging, despite reports of low specificity and sensitivity for COVID-19 (for example, Reference [13] found 89% normal CXR in 493 COVID-19 patients). Ultrasound (US), by contrast, is a cheap, safe, non-invasive and repeatable technique that can be performed with portable devices at patient bedside and is ubiquitously available around the globe [14]. Lung ultrasound (LUS) developed into an established tool to diagnose pulmonary diseases [15,16,17], as it is superior to CXR for detecting pulmonary conditions [18,19,20,21].
During the COVID-19 pandemic, the growing body of evidence for disease-specific patterns in lung US, mostly B-lines and pleural line irregularities, has led to the advocacy for an amplified role of LUS [22,23,24,25]. It was argued that LUS could be performed routinely in COVID-19 suspects and become part of the diagnostic toolkit for COVID-19 differential diagnosis [23,24,26,27]. Notably, in COVID-19 patients, LUS has a higher diagnostic sensitivity than CXR [28]. Moreover, radiologists reported inter and intra-observer agreement between US and CT findings [29,30]. Some studies found the diagnostic accuracy of LUS for COVID-19 to be on par with CT [31,32], and even more sensitive in detecting pulmonary imaging biomarkers [10]. Hence, in triage or resource limited settings, LUS can be a valuable technique [33,34] and serve as a globally available first-line examination method to guide downstream testing [35]. Despite this encouraging evidence, US is not (yet) widely adopted in clinical practice for cardiac or lung imaging and its wider deployment is hampered for a multitude of reasons such as operator-dependent acquisition [36]. Notably, a recent “perspective” paper in The Lancet has pointed out the adoption of deep learning (DL) technologies for the guidance and interpretation of US images as a major challenge for the digitation of medicine [26] Citing: “Theoretically, if these (POCUS) devices were widely used, rapid, point-of-care imaging could become routine and reduce the need for formal studies in a dedicated radiology suite. But that shift of adoption is predicated on the ability of clinicians to become facile in obtaining high-quality ultrasound scans. To date, that has not occurred for various reasons including cost of the devices, issues for reimbursement, and difficulty with performing image capture, which has historically been a specialised task for sonographers”. Moreover, the relevant LUS pattern can be hard to discern, requiring time and trained personal [37], This calls into play medical image analysis systems based on machine learning (ML) which aim to be utilized as clinical support tools for physicians that aid data acquisition, patient diagnostics or monitoring. Here, we release a novel LUS dataset with diverse pulmonary manifestations and perform a first study on the automatic detection of lung pathologies for differential diagnosis.

1.1. Related Work

Literature on exploiting medical image analysis and deep learning (DL) to classify or segment CT or CXR data of COVID-19 patients recently exploded (for reviews, see Ulhaq et al. [38], Shi et al. [39]). More than 300 publications on this topic appeared only in 2020 [40]. For instance, Mei et al. [2] achieved equal sensitivity (but lower specificity) compared to senior radiologists in detecting COVID-19 from CT and clinical information. A meta-analysis on COVID-19 revealed a mismatch between clinical and ML communities and found that US is significantly under-explored by ML researchers [40].
With the rise of deep learning in computer vision, learning-based approaches to medical ultrasound analysis became increasingly popular over the last years [41]. While more than 50 papers were published on deep learning on US in 2017 [41], sparse work has been done on lung US, with B-line detection/quantification being the most common task [42,43,44]. Others focus on pleural line extraction [45], subpleural pulomnary lesions [46] or lung cancer detection [47].
In our initial preprint dubbed POCOVID-Net [48], we were first to regard the problem of automatic differential diagnosis of COVID-19 from LUS data. The released dataset has been incorporated by several authors into their work [49,50,51,52]. Others developed a quality assessment module for COVID-19 pattern detection [53] or a classifier for typical LUS patterns of COVID-19 patients [54,55]. Especially related to our work is the preprint by Arntfield et al. [56] which proposed a model to differentiate types of B-lines according to the clinical diagnosis (COVID-19, non-COVID-19-ARDS, hydrostatic pulmonary edema). However, none of the above works have released their utilized datasets to the public.
An exception to the neglect of US during the first months of COVID-19 a deep learning approach for a severity assessment of COVID-19 from US data [57]. The work convincingly predicts disease severity and segments COVID-19 specific patterns building up on their previous work on localizing B-lines [42]. The paper claims to release a segmentation dataset of COVID-19 cases, but to date, only a small fraction of class-labelled data and no segmentation annotations are available. While their effort (and follow-ups [45,58,59]) on severity assessment are highly relevant for disease monitoring, they are not applicable for diagnosis, where the main problem lies in distinguishing COVID-19 from other lung pathologies (i.e., clinical diagnoses). We aim to close this gap with our approach to classify COVID-19, healthy, and bacterial pneumonia from LUS data.

1.2. Our Contributions

Figure 1 depicts a graphical overview of our contributions.
First, we release the largest to-date publicly-available dataset of lung US recordings, consisting of 202 videos and 59 images. Since the initial release of our database in a preprint [48], further research has used our dataset [52,60] or followed up on our approach with studies of different neural network architectures [55] or even leveraging robustness [49]. Our dataset is heterogeneous and includes clinical data from one hospital as well as data from public sources, which were curated manually and approved by two medical experts.
Second, we take a first step towards a tool for differential diagnosis of pulmonary diseases, here especially focused on bacterial and viral pneumonia, exemplified with COVID-19 as viral pneumonia. Specifically, we demonstrate that competitive performance can be achieved from raw US recordings, thereby challenging the current focus on irradiating imaging techniques. Moreover, we employ explainability techniques such as class activation maps or uncertainty estimates and present a roadmap towards an automatic detection system that can highlight relevant spatio-temporal patterns. Our proposed system presents a step towards a tool that aids medical care which, in the midterm, could potentially help to reduce time and cost in the clinical workflow, as shown for CT [2].

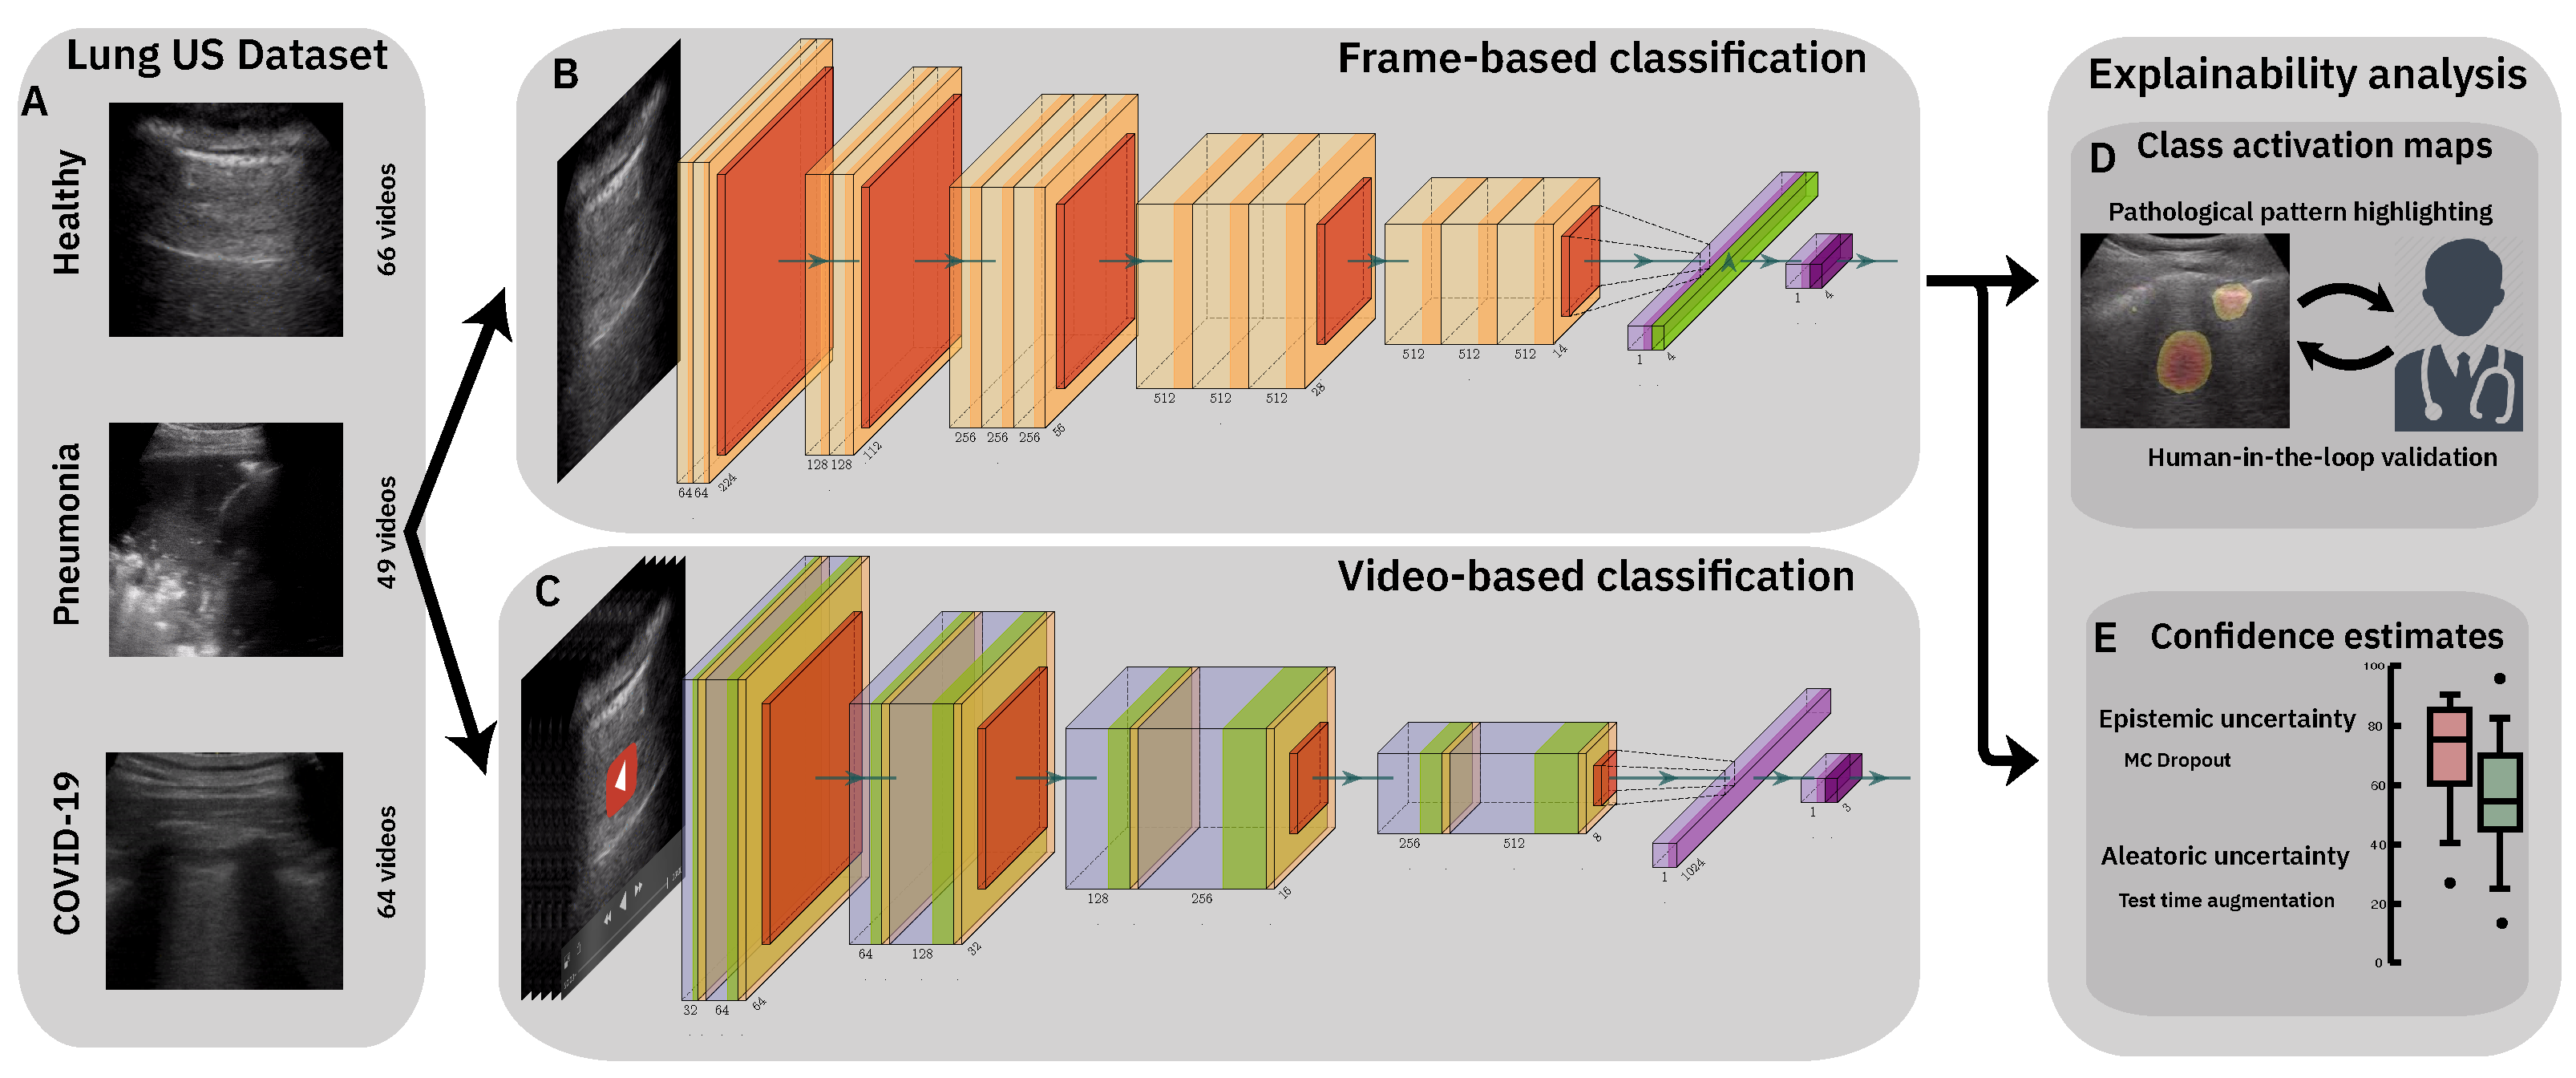
2. A Lung Ultrasound Dataset for COVID-19 Detection

2.1. Dataset Description

We release the largest publicly-available LUS dataset (https://github.com/BorgwardtLab/covid19_ultrasound), comprising samples of COVID-19 patients, patients with bacterial pneumonia, (non-COVID-19) viral pneumonia and healthy controls. As shown in Table 1, we collected and gathered 261 recordings (202 videos + 59 images) recorded with either convex or linear probes from a total of 216 patients. Linear probes are higher frequency, yielding a greater resolution that allows better to study abnormalities around the pleural line [61]. However, the linear probe penetrates the tissue less than the convex probe which can hamper the differentiation of B-lines [62] and does not allow the assessment of deeper lung tissue. In Section 5.2 we discuss limitations of our dataset regarding the heterogeneity of US probes in the data, as well as shortcomings with respect to the distinction of COVID-19 from other viral pneumonias. Note that due to the low number of samples (3 convex videos), we did not use the non-COVID-19 viral pneumonia data in the analysis, but instead only distinguish the remaining three classes.
Our dataset comprises clinical data donated from hospitals or academic ultrasound course instructors, as well as LUS recordings published in other scientific literature, community platforms, open medical repositories and health-tech companies. An overview about the sources and a full list of utilized publications is listed in the supplementary material (Table A1). The COVID-19 diagnosis was normally obtained via RT-PCR, but for details on individual recordings, we refer to the respective sources. We consider it a major contribution to assemble this dataset from 41 distinct sources, which included web scraping, labeling, pre-processing (cropping, artifact removal etc.), commenting and approving by medical professionals and US operators. The dataset is accompanied by extensive metadata table, listing the source URL, source ID, an anonymized patient ID and, when available, age, gender, disease symptoms and pathological patterns. Further technical details comprise image resolution, frame rate and the number of frames for each video after pre-processing. Importantly, all samples of our database were reviewed and approved by two medical experts (a paediatric physician with 10 + years of clinical LUS experience and an academic US course instructor) and annotated with visible LUS patterns.

2.2. Data Collection

2.2.1. Northumbria Data

Patient data was made available by the Northumbria Healthcare NHS Foundation Trust. The Trust serves a population of approximately 600,000 over a large geographical area in the North East of the United Kingdom. During the COVID-19 pandemic, inpatient respiratory services were centralised onto the acute care centre. Thoracic ultrasound was conducted with a convex probe Venue™ ultrasound machine by GE Healthcare (2–5 MHz). Patients were scanned according to the established BLUE protocol [62] which has high diagnostic sensitivity, specificity and accuracy for pleural effusions, alveolar consolidation and interstitial syndromes [63]. RT-PCR was done to confirm/reject COVID-19 diagnosis and standard care (including thoracic X-Ray and CT) was done to identify bacterial pneumonia. Local Caldicott approval was sought and granted. Patient were consented appropriately [64,65]. Recordings with appropriate pathology were stored, anonymized and electronically shared. A total of 70 videos and images from 44 male and 26 female patients were provided.

2.2.2. Neuruppin Data

As an independent control group, healthy volunteers were recruited at Brandenburg Medical School Theodor Fontane in Neuruppin, Germany. Data was acquired at a time of low prevalence. Similarly to the clinical data, LUS was conducted with a GE Healthcare US device and executed according to the BLUE protocol [62]. 31 videos (28 convex, 3 linear) from 6 patients (3M/3F) were provided.

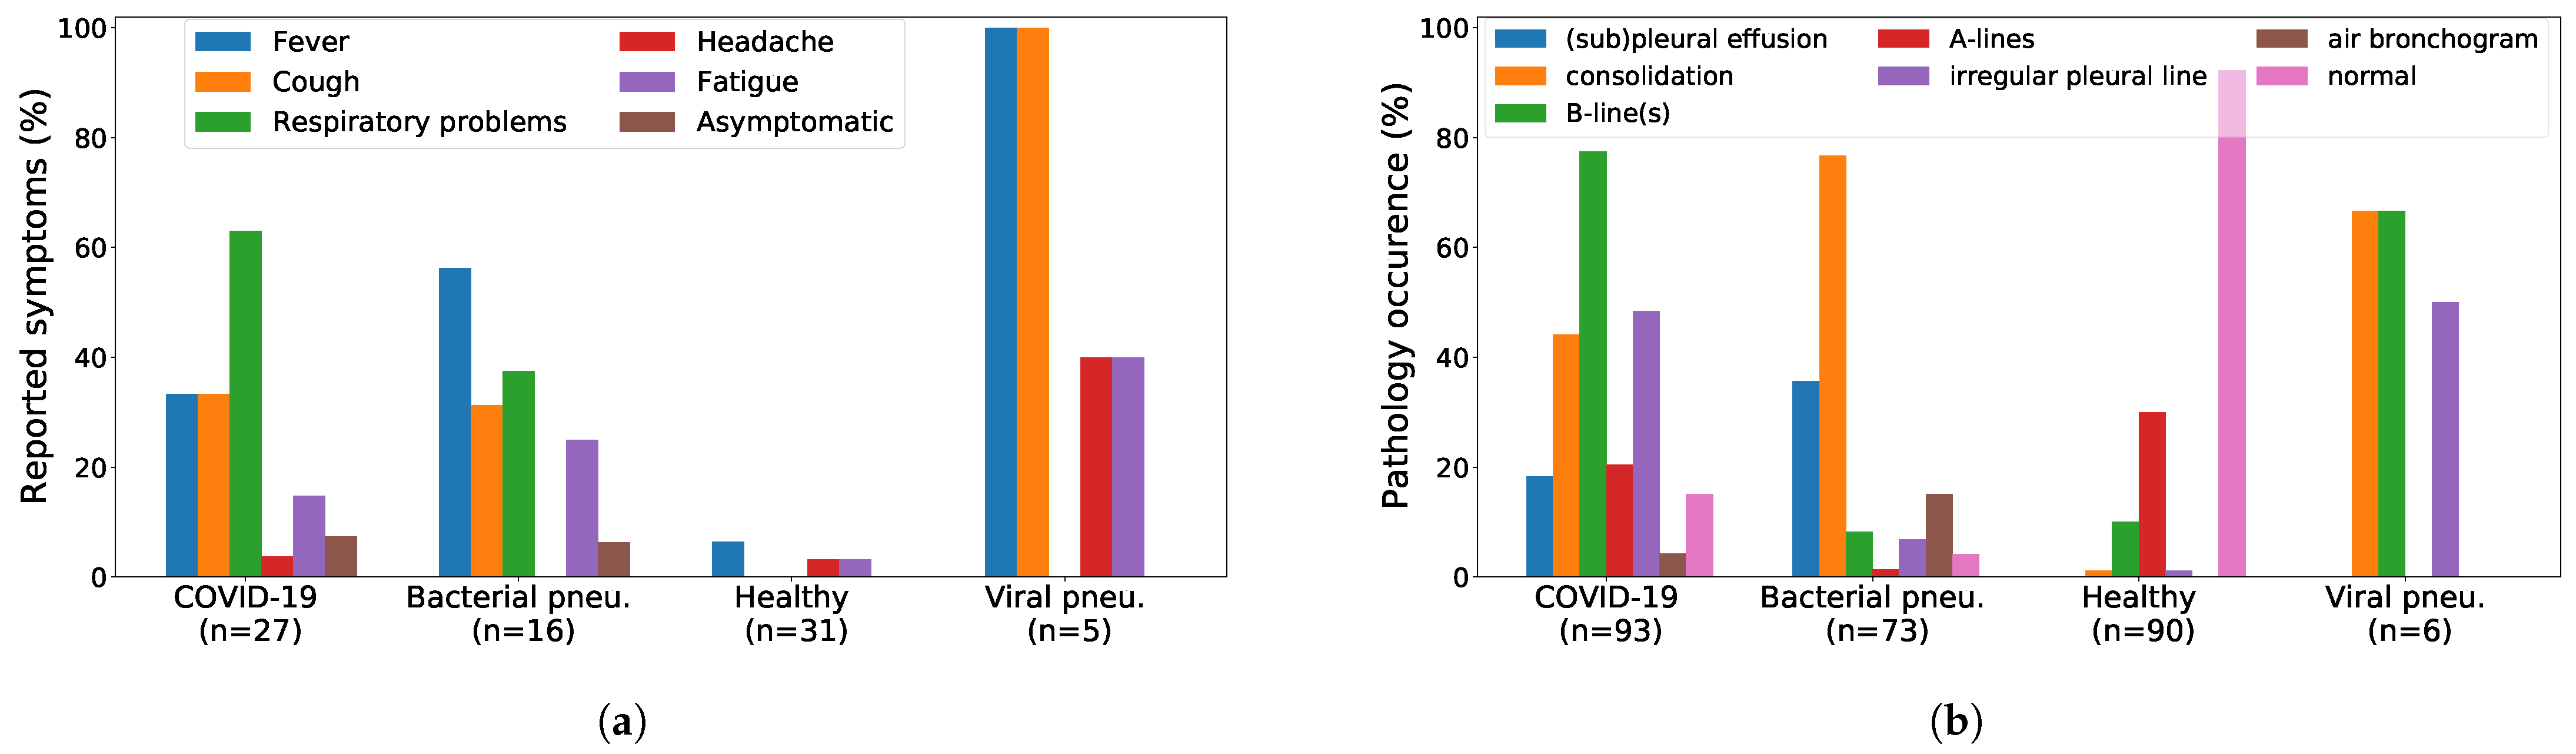
2.3. Dataset Analysis

In images and videos from 41 different sources, we count 216 distinct patients. Unfortunately, in many online sources or publications no patient metadata was given, but we were able to collect age and gender for 42% of the data. Out of those, 57% were male, and the average age is 41.3 years (median: 35, standard deviation: 24.7 ). Additionally, descriptions of symptoms were available for 30% of our LUS recordings and are distributed as shown in Figure 2a.
Last, the pathological patterns as annotated by the physicians are shown in Figure 2b. The results are in accordance with prior knowledge and corroborate the non-specificity of COVID-19 patterns compared to other viral pneumonia, a detriment shared across all imaging techniques [66,67].

3. Classification of Lung Ultrasound Data

3.1. Methods

3.1.1. Data Processing

Due to data availability, all experiments are conducted on the convex ultrasound probes. For the same reason we exclude the three non-COVID-19 viral pneumonia videos (Table 1) and focus on the distinction of healthy lungs, bacterial pneumonia and COVID-19 viral pneumonia. We manually processed all convex ultrasound recordings (179 videos and 53 images) and split the videos into images at a frame rate of 3 Hz (with maximal 30 frames per video, leading to a database of 1204 COVID-19, 704 bacterial pneumonia, and 1326 healthy images. The videos are diverse in length and kind ( 160 ± 144 frames) with a frame rate of 25 ± 10 Hz. All images were cropped to a quadratic window excluding measure bars, texts and artifacts on the borders before they were resized to 224 × 224 pixels (for examples see Figure 1A). Apart from the independent test data, all reported results were obtained in a 5-fold cross validation stratified by the number of samples per class. Data was split on a patient-level, hence it was ensured that the frames of a single video are present within a single fold only, and that the number of videos per class is similar in all folds. All models were trained to classify images as COVID-19, pneumonia, healthy, or uninformative. The latter consists of  ImageNet [68] pictures as well as neck US data [69]; added for the purpose of detecting out-of-distribution samples. This is particularly relevant for public web-based inference services. In this paper, we present all results omitting the uninformative class, as it is not relevant for the analysis of differential diagnosis performance and would bias the results, that is, lead to a higher classification accuracy due to the recall and precision of almost 100% for the uninformative class (please refer to Appendix C.1 for results including uninformative data). Furthermore, we use data augmentation, specifically flips and rotations (up to 10 ) and translations (up to 10%) to diversify the dataset and prevent overfitting.

3.1.2. Frame-Based Models

Our backbone neural architecture is a VGG-16 [70] that is compared to NasNET Mobile, a light-weight alternative [71] that uses less than 1 / 3 of the parameters of VGG-16 and was optimized for applications on portable devices. Both models are pre-trained on ImageNet and fine-tuned on the frames sampled from the videos. Specifically, we use two variants of VGG-16 that we name VGG and VGG-CAM. VGG-CAM has a single dense layer following the convolutions, thus enabling the usage of plain class activation maps (CAMs [72]), whereas VGG has an additional dense layer with ReLU activation and batch normalization. Considering the recent work of [57] on lung US segmentation and severity prediction for COVID-19, we investigated whether a segmentation-targeted network can also add value to the prediction in differential diagnosis. We implemented two approaches building upon the pre-trained model of [57], an ensemble of three separate U-Net-based models (U-Net, U-Net++, and DeepLabv3+, with a total of ∼19.5 M parameters). First, VGG-Segment is identical to VGG, however instead of training on the raw US data, we train on the segmented images from the ensemble (see example in Appendix B.1). Although it might seem unconventional, we hypothesized that the colouring entails additional information that might simplify classification. Secondly, in Segment-Enc the bottleneck layer of each of the three models is used as a feature encoding of the images, resulting in 560 filter maps that are fed through a two layer MLP with hidden layer sizes 512 and 256 respectively. The encoding weights are fixed during training. Both settings are compared to the other models that directly utilize the raw images. For more details on the architectures and the training procedure, please refer to Appendix B.

3.1.3. Video-Based Model
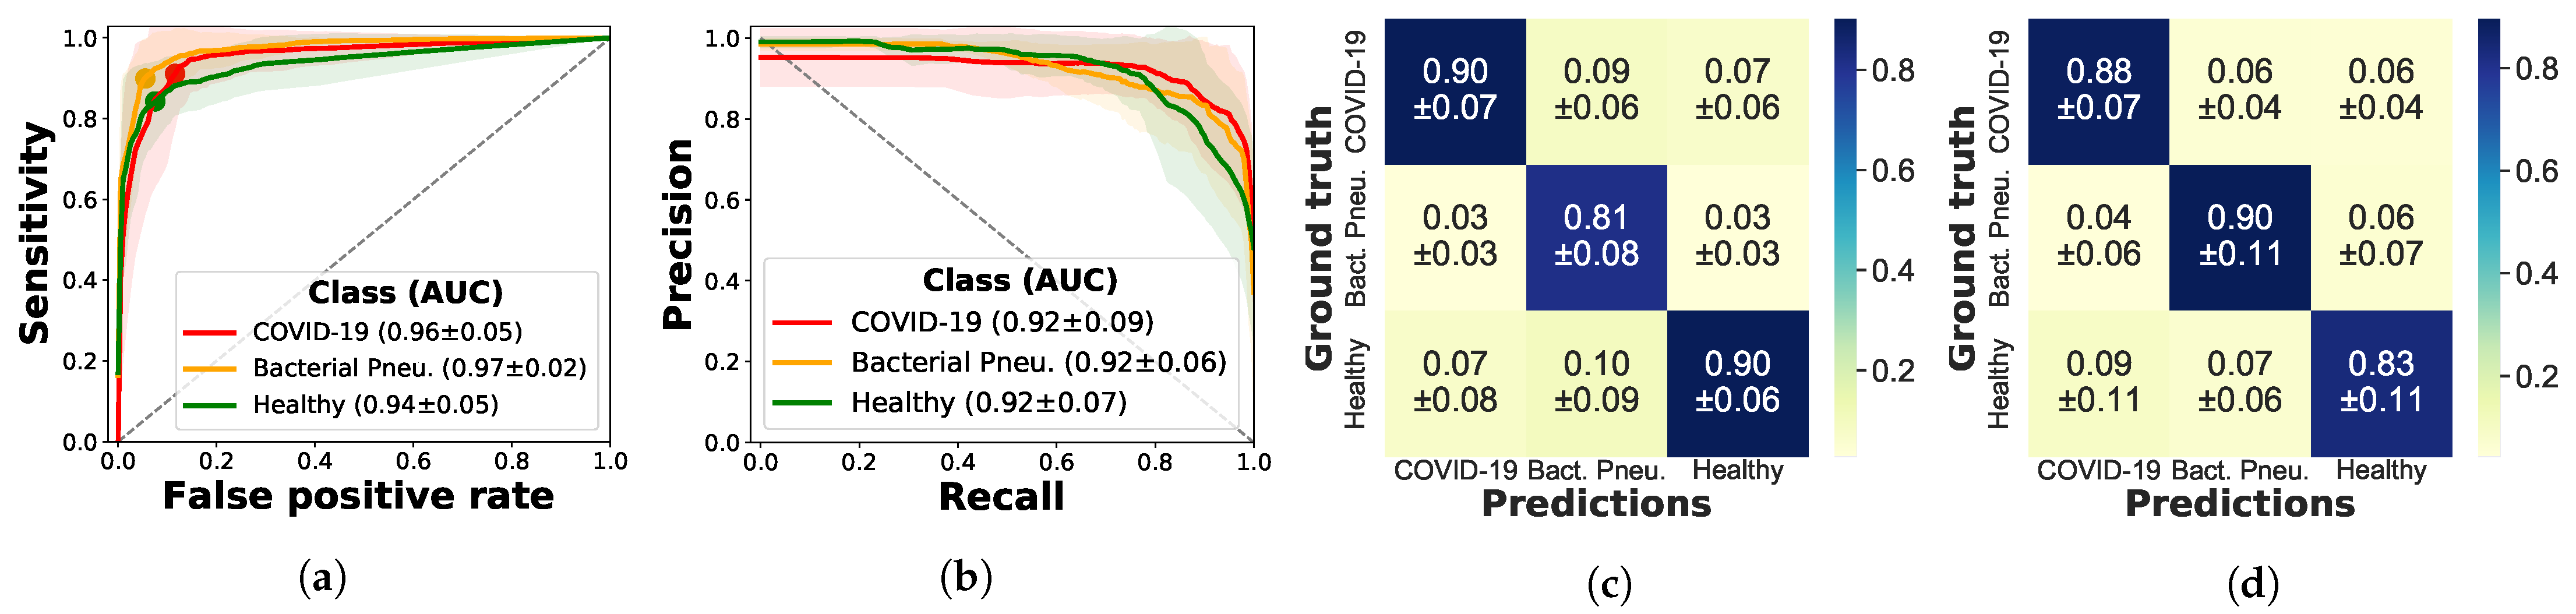
In comparison to a naïve, frame-based video classifier (obtained either by averaging scores or by related aggregation/selection schemes of all frames), we also investigate Models Genesis, a generic model for 3D medical image analysis pretrained on lung CT scans [73]. For Models Genesis, the videos are split into chunks of 5 frames each, sampled at a frame rate of 5Hz (input size: 224 × 224 × 5 ). Stratified 5-fold cross validation is performed using the same split as for frame-based classifiers. Individual images were excluded, leaving aside 178 videos which were split into 770 video chunks.

3.2. Results

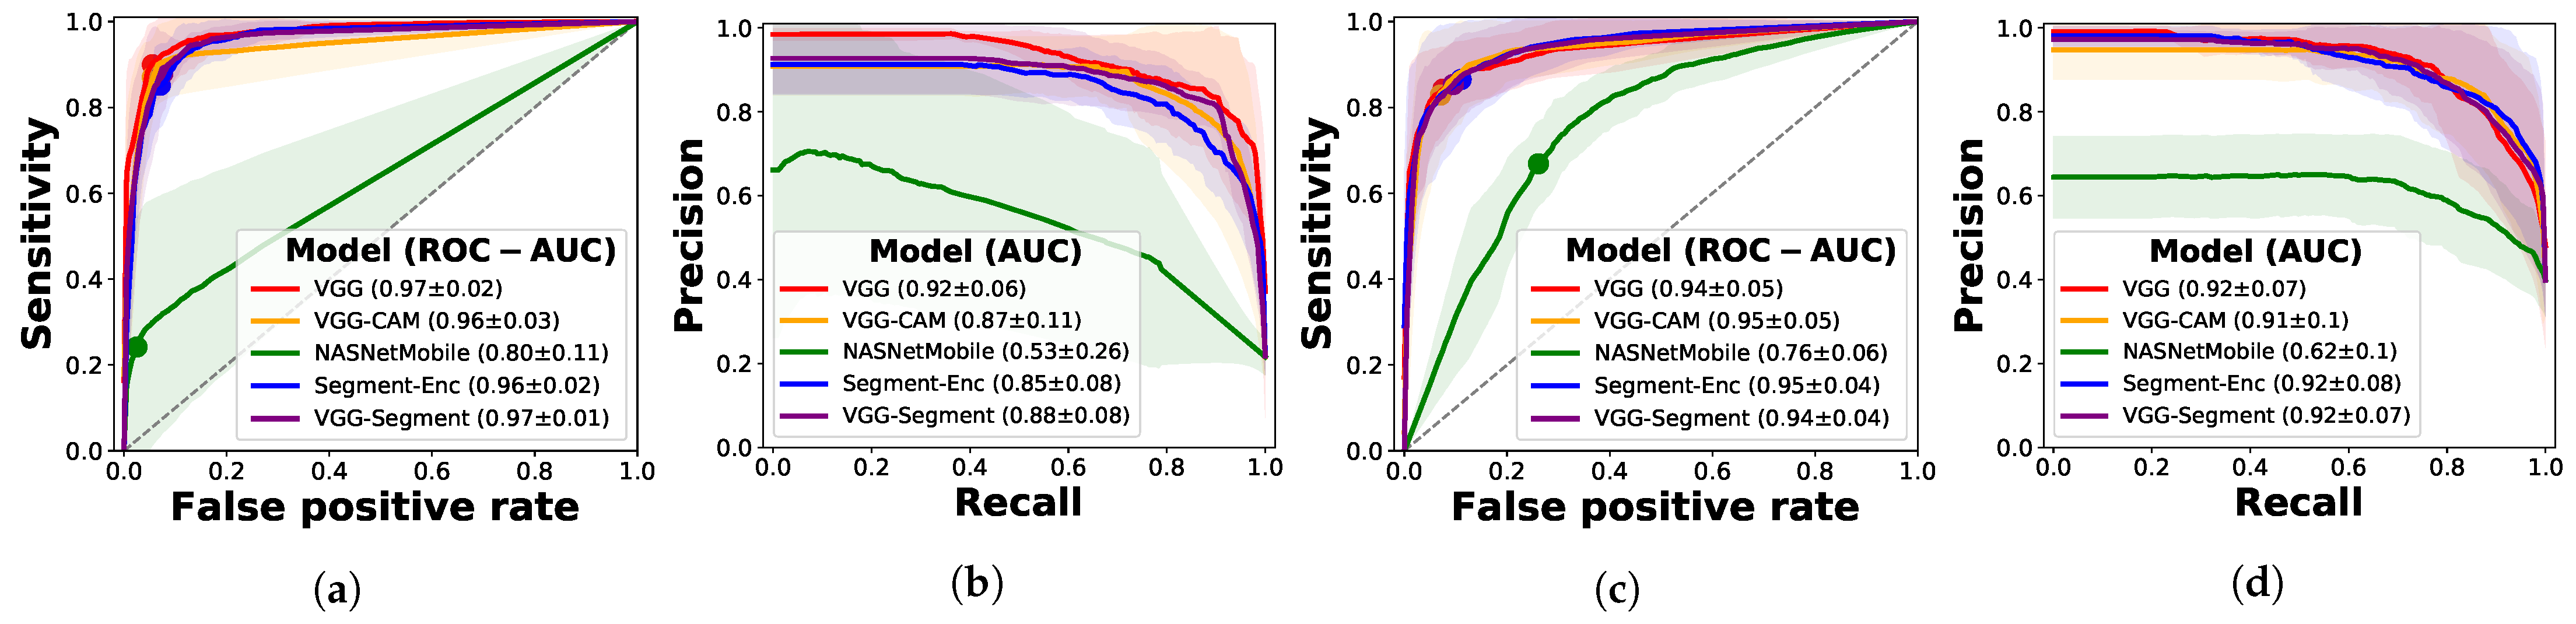
3.2.1. Frame-Based Experiments

Table 2 shows a detailed comparison of all trained models in terms of recall, precision, specificity and F1-scores, computed in a one-vs.-all fashion for all three classes. Overall, both VGG and VGG-CAM achieve promising performance with an accuracy of 88 ± 5 % on a 5-fold CV of 3234 frames. The results are sufficiently balanced across classes, with the best F1-score achieved for COVID-19 in VGG ( 0.89 ) and for healthy data ( 0.87 ) in VGG-CAM. Figure 3a visualizes the results of the best model, VGG, for each binary detection task as a ROC curve, showing ROC-AUC scores of 0.94 and above for all classes, while depicting the point where the accuracy is maximal for each class.
The false positive rate at the maximal-accuracy point is slightly larger for COVID-19 than for pneumonia and healthy patient. In a clinical setting, where false positives are less problematic than false negatives, this property is desirable. Since the data is imbalanced, we also plot the precision–recall curve in Figure 3b, which confirms that the imbalance is not of concern. In addition, the confusion matrices in Figure 3c,d further detail the predictions of VGG; we observe that the sensitivity of bacterial pneumonia is highest, but confusions occur to similar extent for each pair of classes. This complies with findings from Section 2 indicating that patients infected with COVID-19 might not show any abnormalities in LUS (e.g., for asymptomatic patients) or present similar patterns as bacterial pneumonia such as consolidated areas and effusions. For further results including the ROC- and precision–recall curves of all three models see Appendix C.

Ablation Study with Segmentation Models

Lung US recordings are noisy and operator-dependent, posing difficulties for the classification of raw data. Hence, we compare VGG and VGG-CAM to approaches from related work where all frames are segmented (i.e., classified on a pixel level into pathological patterns) with the model from [57]; see Appendix B for an example input image. The relevant rows in Table 2 exhibit mixed results, with Segment-Enc marginally outperforming VGG-Segment, but both obtaining substantially lower scores than VGG. The results are thus not encouraging to explore VGG-Segment further, since it comes at the cost of a much larger model, with an ensemble of three models (U-Net, U-Net++, and DeepLabv3+) segmenting the images prior to classification (restricting segmentation to a single model resulted in inferior performance). Possible reasons for the inferior performance of this approach are limited accuracy of the underlying segmentation model (Roy et al. [57] reported a Dice coefficient of 0.75 ) and the algorithm’s pathology-to-color mapping that may dispel a notion of similarity between types of patterns. Future work might explore other architecture along the lines of Segment-Enc, that is, a dense model classifying the encoding produced by a segmentation model.

Ablation Study on Other Architectures

Last, we tested several smaller networks such as MobileNet [74] as an additional ablation study, with NASNetMobile [71] performing best, obtaining 62.5 % accuracy, but still suffering from low precision and recall on data of bacterial pneumonia. As most ultrasound devices are portable and real-time inference on the devices is technically feasible, resource-efficient networks are highly relevant and could supersede web-based inference. In an attempt torward real-time on-device inference, our fine-tuned NASNetMobile requires less than a third of the parameters of VGG but does not yet yield satisfactory results ( 63 % accuracy).

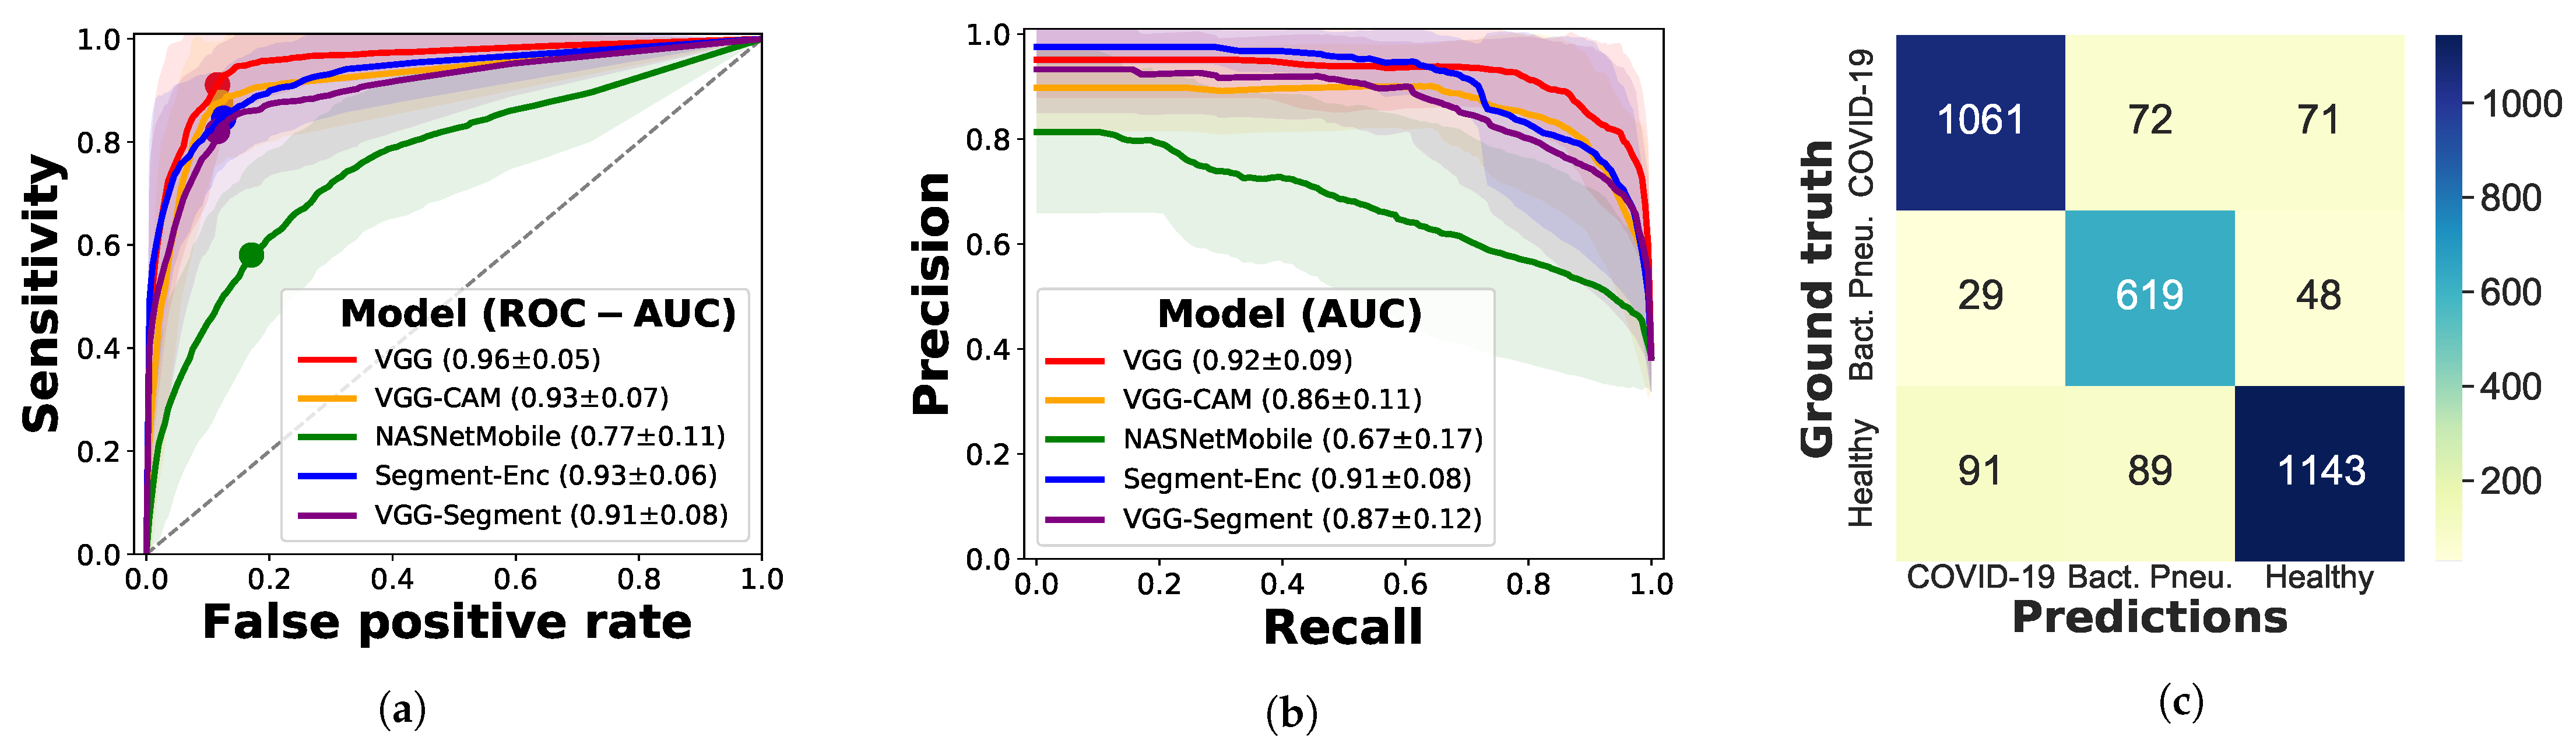
3.2.2. Video-Based Experiments

To investigate the need for a model with the ability to detect spatiotemporal patterns in lung US, we explored Models Genesis, a pretrained 3D-CNN designed for 3D medical image analysis [73]. Table 3 contrasts the frame-based performance of VGG model to Model Genesis. The video classifier is outperformed by VGG, with a video accuracy of 90% compared to 78%. Note that by summarizing frames of one video, the accuracy of VGG was improved, indicating that in some cases only a minority of the frames are misclassified. In particular, the sensitivity and precision of COVID-19 increases. In contrast, Model Genesis struggles with the classification of COVID-19 patients, obtaining an F1-score of only 0.75 . Notably, the varying frame rate across the videos was accounted for during data preparation and cannot serve as a reason to explain the performance gap. One caveat in Models Genesis that may hinder better generalization is that it was pretrained on 3D volumes rather than 2D time series. But considering that only 770 video-chunks were available for training Model Genesis, while 3234 images are used to train VGG-CAM, even extended through data augmentation techniques, it is plausible that video-based classification may improve with increasing data availability.

3.2.3. Evaluation on Independent Test Data

To the best of our knowledge, the only other publicly-available lung ultrasound database was released by the ICLUS initiative [57], comprising 60 lung US recordings from Italian patients suspected for COVID-19 (39 convex + 21 linear probes). The data was annotated by medical experts by observation, with severity scores from 0 to 3 (Roy et al. [57] “Score 0 indicates the presence of a continuous pleural-line accompanied by horizontal artifacts called A-lines [33], which characterize a healthy lung surface. In contrast, score 1 indicates the first) signs of abnormality, that is, the appearance of alterations in the pleural-line in conjunction with vertical artifacts. Scores 2 and 3 are representative of a more advanced pathological state, with the presence of small or large consolidations, respectively. Finally score 3 is associated with the presence of a wider hyperechogenic area below the pleural surface, which can be referred to as white lung”. We evaluated the performance of the VGG model on all 39 convex probes, predicting each frame as the average of the five VGG models trained in cross-validation. Since many frames in a raw lung US video are not informative, Roy et al. [57] train an aggregation layer to combine frame-based scores into a video prediction. Instead, we propose to use confidence estimates as explained in Section 4.2 and discard frames with low confidence. Discarding the 5% frames with lowest certainty, and assuming that a severity score of 0 corresponds to a healthy lung and severity of 1, 2 or 3 are patients infected with COVID-19, the ensemble achieves a frame-prediction accuracy of 72.9 % , and a video classification accuracy of 82.1 %. The sensitivity for COVID-19 is 0.806 and the specificity 0.962 .
We also compare the predicted probability of COVID-19 to the severity scores in Figure 4. Although, in contrast to their model, our model was not trained to assess severity, there is a clear correlation between the severity and the probability of our model (Pearson’s r = 0.36 ). At this point, we can safely conclude that test data performance is encouraging, but requires further validation with labeled data including healthy patients and patients infected with other pneumonias.

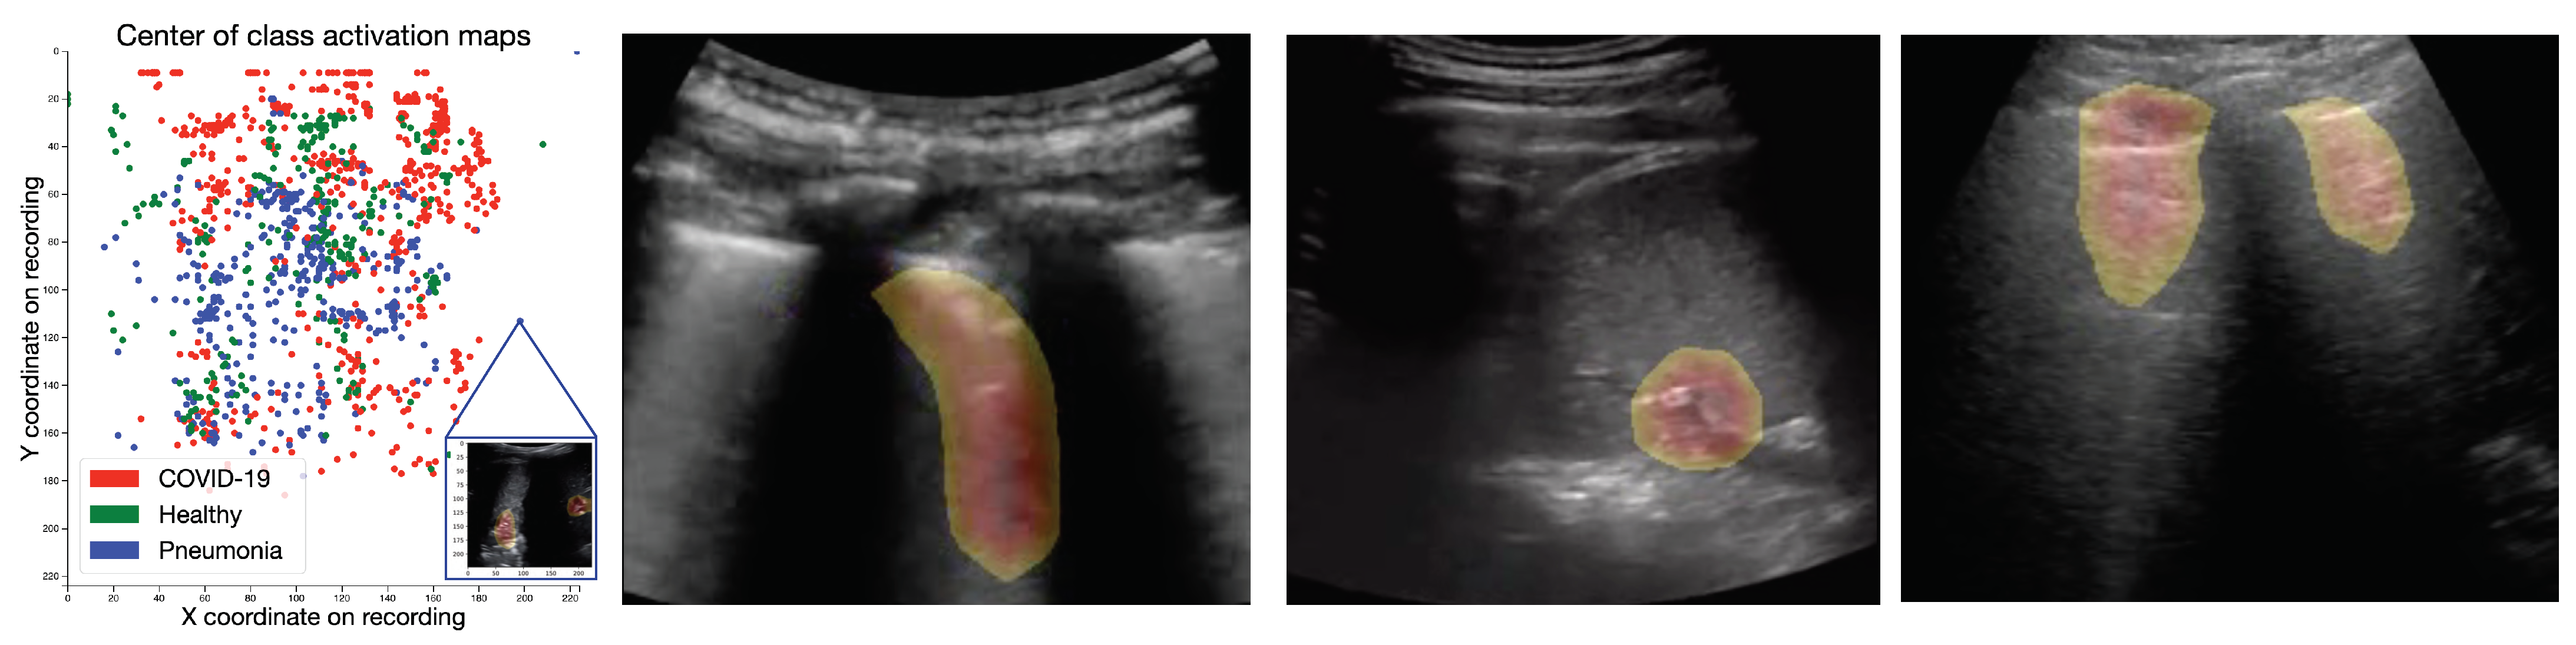
4. Model Explainability

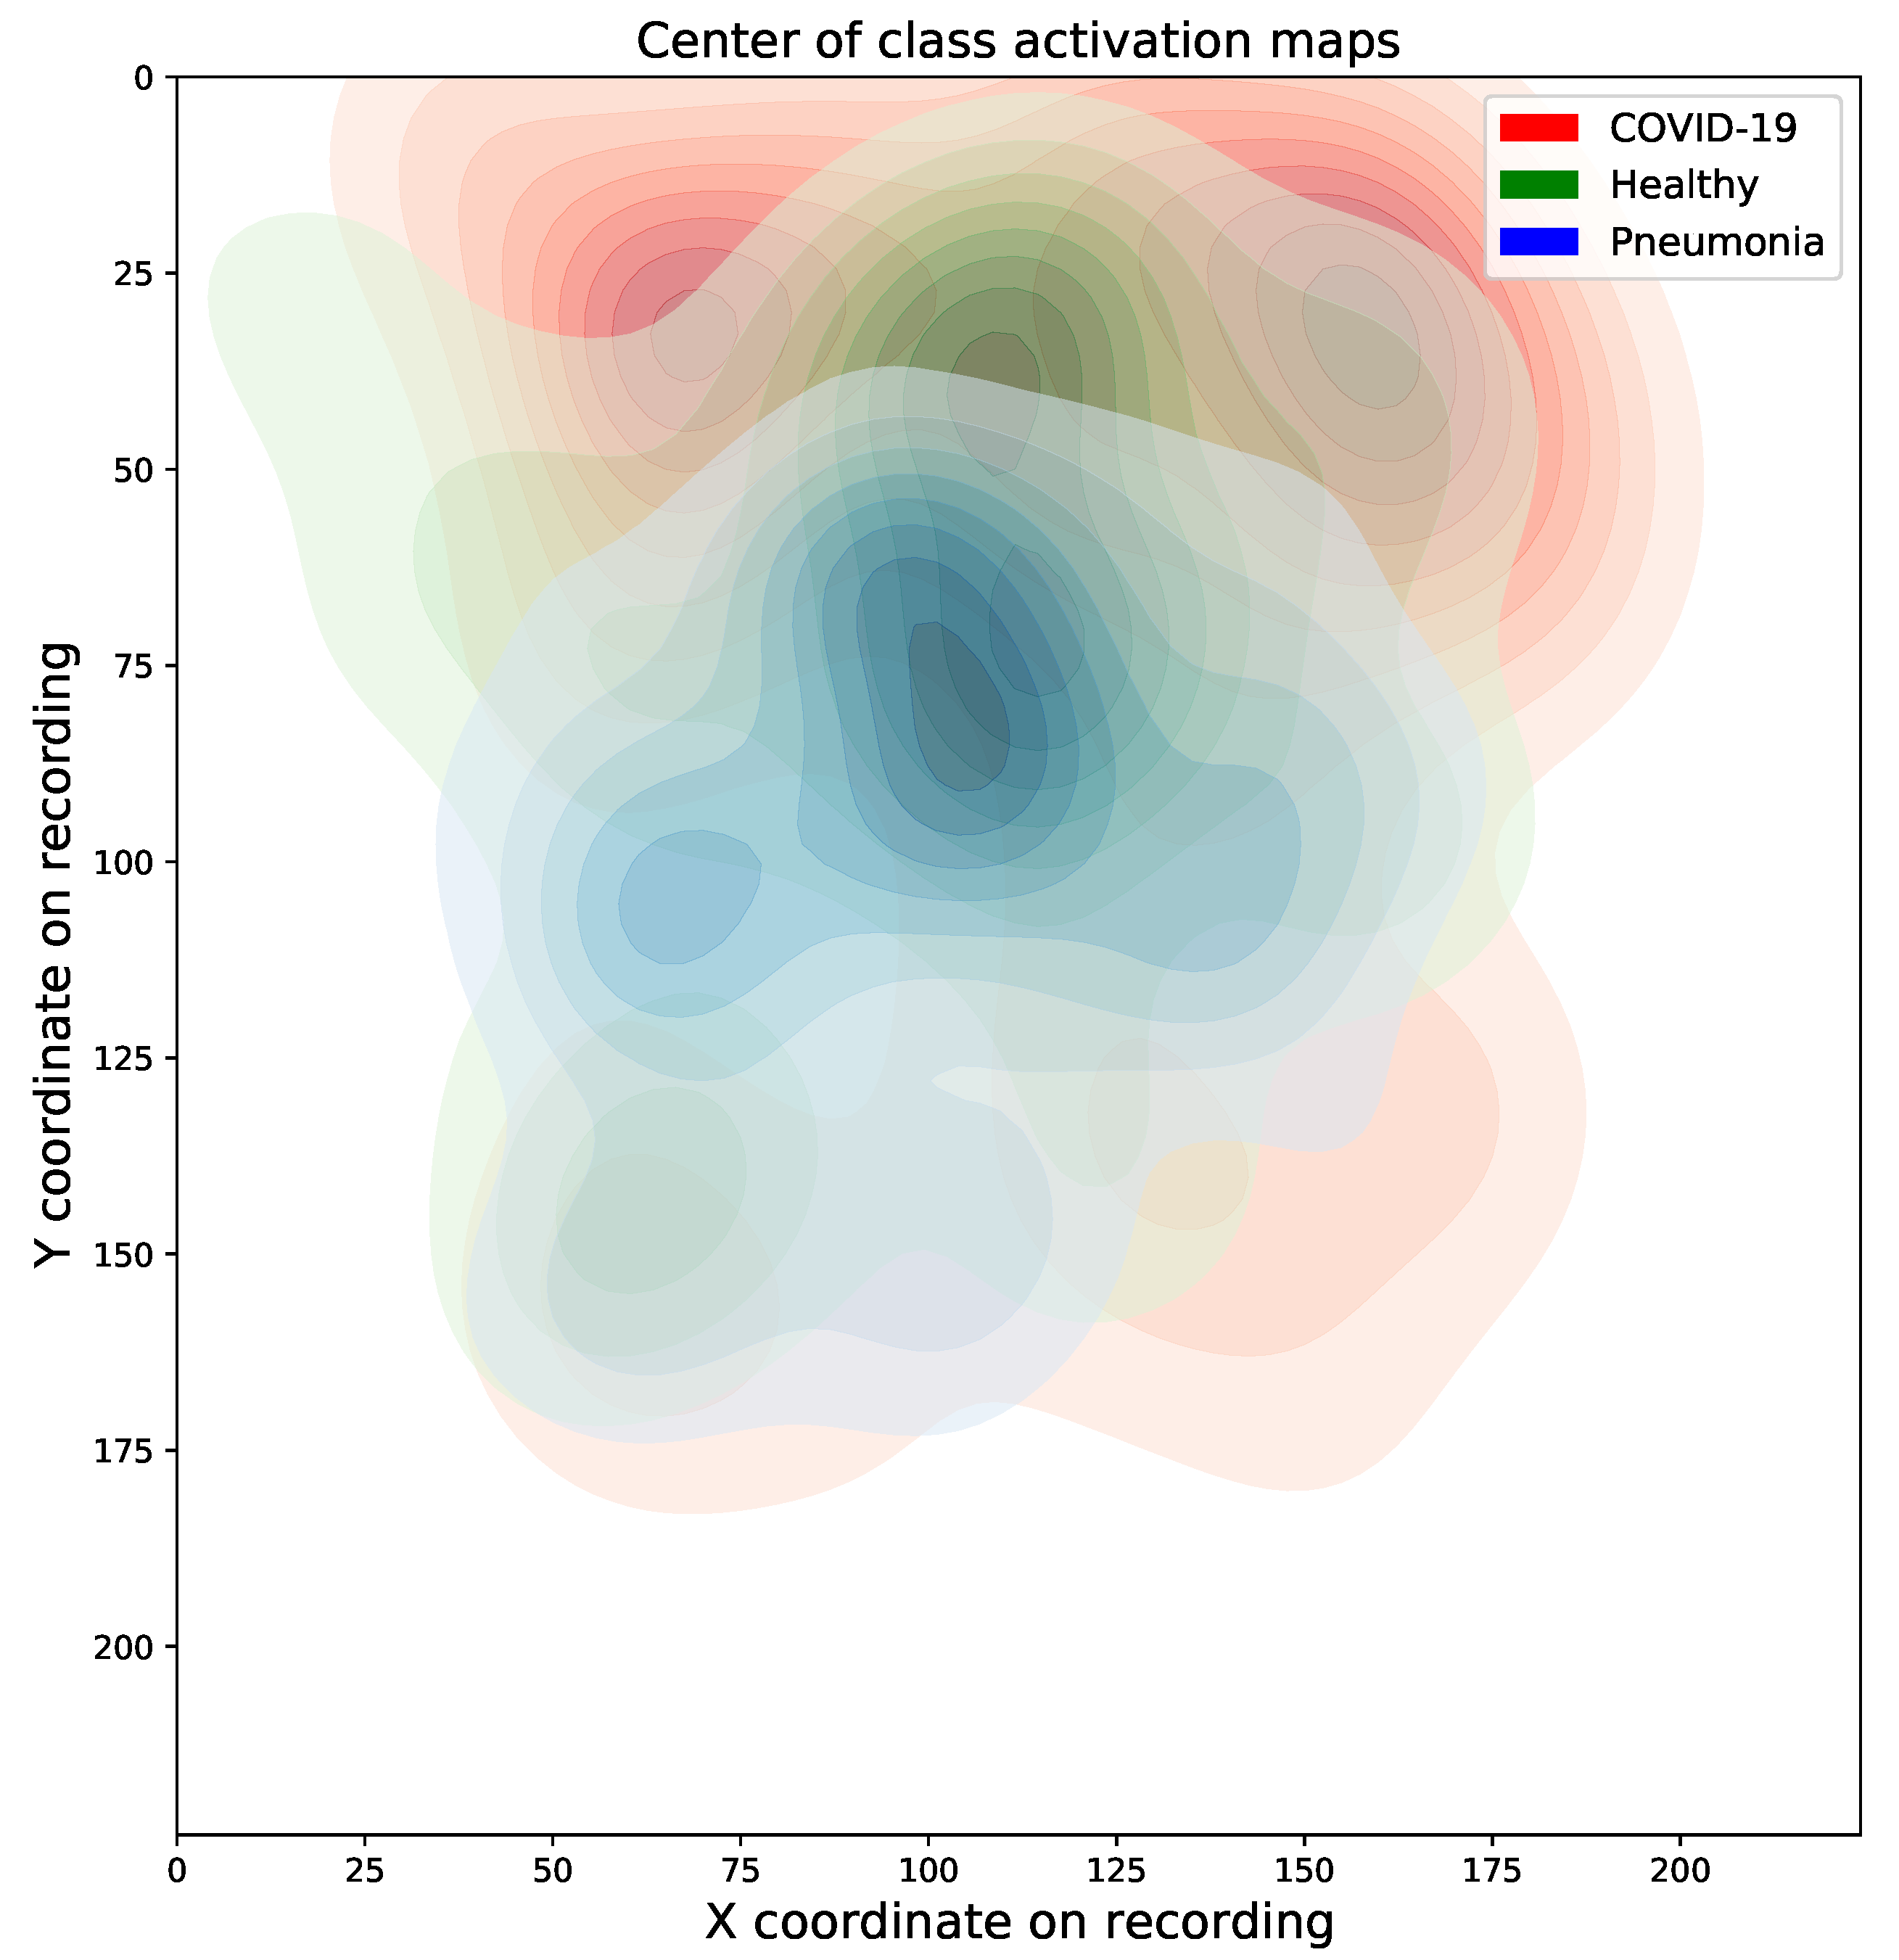
4.1. Class Activation Maps

Class activation mapping (CAM) is a popular technique for model explainability that exploits global average pooling and allows to compute class-specific heatmaps that indicate the discriminative regions of the image that caused the particular class activity of interest [72]. For healthcare applications, CAMs, or their generalization Grad-CAMs [75], can provide valuable decision support by unravelling whether a model’s prediction was based on visible pathological patterns. Moreover, CAMs can guide doctors and point to informative patterns, especially relevant in time-sensitive (triage) or knowledge-sensitive (third-world countries) situations. Here, the Grad-CAMs yielded with the VGG model were compared to CAMs of VGG-CAM, and the latter were found of better quality by observation. Since the accuracy of VGG-CAM is very similar to the one of VGG, we analyze only the outputs of VGG-CAM in this section as the most performant interpretable model.

4.1.1. Results

Figure 5 shows representative CAMs in the three rightmost panels. They highlight the most frequent US pattern for the three classes, COVID-19 (vertical B-lines), bacterial pneumonia (consolidations), and healthy (horizontal A-line). For a more quantitative estimate, we computed the points of maximal activation of the CAMs for each class (abbreviated as C , P , and H ) and all samples of the dataset (see Figure 5 left). While, in general, the heatmaps are fairly distributed across the probe, pneumonia related features were rather found in the center and bottom part, especially compared to COVID-19 and healthy patterns. Please refer to Appendix D for a density plot. The interactive HTML and a few exemplary CAM videos are available as Supplementary Material: https://bit.ly/2HH4sUt To assess to what extent the differences between the individual distributions are significant, we employed maximum mean discrepancy (MMD), a metric between statistical distributions [76] that enables the comparison of distributions via kernels, that is, generic similarity functions. Given two coordinates x , y R 2 and a smoothing parameter σ R , we use a Gaussian kernel k ( x , y ) : = exp ( x y 2 / σ 2 ) to assess the dissimilarity between x and y. Following [76], we set σ to the median distance in the aggregated samples (i.e., all samples, without considering labels). We then calculate MMD values for the distance between the three classes, that is, MMD ( C , P ) 0.0051 , MMD ( C , H ) 0.0061 , and MMD ( P , H ) 0.0065 . Repeating this calculation for 5000 bootstrap samples per class (see Figure A5 for the resulting histograms), we find that the observe achieved significance levels of the intra-class MMD values of well below an α = 0.05 significance level.

4.1.2. Expert Validation of CAMs for Human-in-the-Loop Settings

A potential application of our framework is a human-in-the-loop (HITL) setting with CAMs as a core component of the decision support tool that highlights pulmonary biomarkers and guides the decision makers. Since the performance of qualitative methods like CAMs can only be validated with the help of doctors, we conducted a blinded study with two medical experts experienced in the diagnostic process with ultrasound recordings (one physician with >10 years of clinical experience with LUS and one academic US course instructor). The experts were shown a set of 50 videos comprising non-proprietary video data which was correctly classified by the model. The class activation map for the respective class was computed two times, first with one of the four models that were trained on this video, and secondly only with the model that was not exposed to that video during training (called train- and test-CAMs in the following). Both experts were asked to compare both activation maps for all 50 videos, and to score them on a scale of 3 (“the heatmap is only distracting”) to 3 (“the heatmap is very helpful for diagnosis”).
First, the CAMs were overall perceived useful and the test CAMs were assigned a higher average score of 0.81 than the train CAMs ( 0.45 ). Secondly, disagreeing in only 8 % of the cases, both experts independently decided for the test-CAM with a probability of 56 % . Hence, the test-CAMs are superior to the train-CAMs, however non-significant in a Wilcoxon signed-rank test.
However, train- and test-CAM both scored best for videos of bacterial pneumonia, lacking performance for videos of healthy and COVID-19 patients. Specifically, test-CAM received an average score of 0.81 , divided into 0.25 for COVID-19, 2.05 for pneumonia, and 0 for healthy patients. Thirdly, the experts were asked to name the pathological patterns visible in general, as well as the patterns that were highlighted by the heatmap. Figure 6 shows the average ratio of pattern that were correctly highlighted by the CAM model, where the patterns listed by the more senior expert are taken as the ground truth for each video. Interestingly, the high performance of our model in classifying videos of bacterial pneumonia is probably explained by the model’s ability to detect consolidated areas, where 17 out of 18 are correctly classified. Moreover, A-lines are highlighted in ∼60% of the normal lung recordings. Problematically, in 13 videos mostly fat, muscles or skin is highlighted, which has to be studied and improved in future work.

4.2. Confidence Estimates

The ability to quantify states of high uncertainty is of crucial importance for medical image analysis and computer vision applications in healthcare. We assessed this via independent measures of epistemic (model) uncertainty (by drawing Monte Carlo samples from the approximate predictive posterior [77]) and aleatoric (data) uncertainty (by means of test time data augmentation [78]). The sample standard deviation of 10 forward passes is interpreted as inverse, empirical confidence score [ 0 , 1 ] . In detail, for both aleatoric and epistemic uncertainty, the confidence estimate c i of sample i is computed by scaling the sample’s standard deviation to [ 0 , 1 ] and interpreting it as an inverse precision:
c i = σ i , j σ m i n σ m a x σ m i n + 1 ,
where σ i , j is the sample standard deviation of the ten class probabilities of the winning class j, σ m i n is the minimal standard deviation (0, that is, all probabilities for the winning class are identical) and σ m a x is the maximal standard deviation, that is, 0.5 . Practically, for epistemic uncertainty, dropout was set to 0.5 across the VGG model and for aleatoric uncertainty the same transformations as during training are employed. The epistemic confidence estimate was found to be highly correlated with the correctness of the predictions ( ρ = 0.41 , p < 4 × 10 73 , mean confidence of 0.75 and 0.27 for correct and wrong predictions), while the aleatoric confidence was found correlated to a lesser extent ( ρ = 0.29 , p < 6 × 10 35 , mean confidence of 0.88 and 0.73 , respectively). Across the entire dataset, both scores are highly correlated ( ρ = 0.52 , p < 4 × 10 124 ), suggesting to exploit them jointly to detect and remove predictions of low confidence in a possible application. In the evaluation of our model on independent test data from the ICLUS initiative (see above), we found that the frame-wise classification accuracy improved monotonically from 72.2 % to 77.4 % with increasing exclusion of frames with insufficient confidence.

5. Discussion

5.1. Prediction Performance Evaluation

We provide strong evidence that automatic detection of COVID-19 is a promising future endeavour and competitive compared to CT and CXR based models, with a sensitivity of 90 % and a specificity of 96 % for COVID-19, achieved on our dataset of 202 lung US videos. In comparison, sensitivity up to 98 % and specificity up to 92 % was reported for CT [2,79]. We verified our results with independent test data, compared to other architectures and models of related work [57], studied model uncertainty and concluded a significant ability of our model to recognize low-confidence situations. If implemented and validated as a decision support tool, it might bring value to the diagnostic process of symptomatic patients, but could also pose risks as we expand on in Appendix E.
Certainly, there are many approaches yet to be explored in order to improve on the results presented here, including further work on video classification, improving prediction robustness [49], incorporating a LUS probe quality assessment module [53] or a pulmonary symptom classifier [54] which could be coupled with our disease classifier. Furthermore, differentiating COVID-19 from other viral pneumonias remains a key challenge for diagnostic imaging [67] and is beyond the scope of this work. Further work could explore the possibility to use interpretable methods to determine differences of COVID-19 to other viral pneumonia which could be exploited in (automatic) differential diagnosis. Here, we investigated the value of interpretable methods in a quantitative manner with the implementation and validation of class activation mapping in a study involving medical experts. While the analysis provides excellent evidence for the successful detection of pathological patterns like consolidations, A-lines and effusion, it reveals problems in the model’s “focal point” (e.g., missing B-lines and sometimes highlighting muscles instead of the lung) which should be further addressed using ultrasound segmentation techniques [42].

5.2. Dataset Limitations

Our dataset certainly suffers from certain limitations, as gathering data in an organized manner during a pandemic is a logistic and time-sensitive challenge. We ensured that the Northumbria and Neuruppin cohort used US devices from the same vendor, but this was not possible for external data from online sources and publications. Processing exemplary videos of publications carries the risk of population bias and may overestimate the frequency of stereotypical symptoms and pathologies. In general, the data inevitably remains heterogeneous and information is at least partially unknown, including patient metadata (age, gender, symptoms etc.), technical details (recording frequency, imaging depths) and disease progression (duration of symptoms at day of examination). While this heterogeneity may induce biases, it can also aid in developing robust methods, as models based on single-center data often fail to generalize [80]. Moreover, most types of patterns in LUS are, just like for CT or CXR, not disease-specific [66,67] (see also Figure 2b) and we by no means claim to develop a diagnostic tool in here. For the future, a more homogeneous dataset of LUS, associated with demographics and anamnesis of patients should be collected in a controlled manner from different hospitals. Conclusively however, given the non-availability of other public databases for LUS data in the context of COVID-19, this does not decrease the benefit of our dataset; but we do advise to be careful in drawing far-ranging conclusions from simulations on our dataset.

6. Conclusions

Lung ultrasound as an established diagnosis tool that is both safe and highly available constitutes a method with potentially huge impact that has nevertheless been neglected by the machine learning community. This work presents a novel LUS dataset for COVID-19 alongside new methods and analyses that pave the way towards computer vision-assisted differential diagnosis of COVID-19 from US. We provide an extensive analysis of interpretable methods that are relevant not only in the context of COVID-19, but in general for the diagnosis of viral and bacterial pneumonias.
Our published database is constantly updated and verified by medical experts and researchers are invited to contribute to our initiative. We strongly believe in the value of such open-source databases not only for follow-up work, but also for related fields. Our data in particular can be utilized for pre-training (transfer learning) in other US applications [41], as done in Model Genesis [73]. Even research on noise and artifact removal from US [81], or US image simulation [82] might benefit from the availability of US data. The available metadata also opens up opportunities for further analysis with respect to pre-conditions, symptoms and patterns, as we touched upon in Figure 2a,b.
We envision the proposed tool as a step toward a decision support system to aid diagnosis by providing a “second opinion” to increase reliability. The promising results of our model are to be validated in a controlled clinical study that investigates the predictive power of US for automatic detection of COVID-19, especially in comparison to CT and CXR.

Author Contributions

Conceptualization, J.B., N.W., M.C., G.B. and J.G.; methodology, J.B., N.W. and G.B.; software, J.B. and N.W.; validation, C.B., G.B., A.A., B.R. and K.B.; formal analysis, J.B. and N.W.; investigation, J.B. and N.W.; resources, J.B.; data curation, N.W., M.C., C.B., G.B., K.L. and J.G.; writing—original draft preparation, J.B., N.W. and M.C.; writing—review and editing, J.B., N.W., M.M., B.R. and K.B.; visualization, J.B. and N.W.; supervision, B.R. and K.B.; project administration, B.R. and K.B. All authors have read and agreed to the published version of the manuscript.

Funding

This study was funded in part by the Alfried Krupp Prize for Young University Teachers of the Alfried Krupp von Bohlen und Halbach-Stiftung (K.B.).

Institutional Review Board Statement

For the data collected in Northumbria, local caldicott approval was sought and granted with reference C3424.

Informed Consent Statement

Informed consent was obtained from all subjects from the Northumbria cohort. Consent was also obtained from the Neuruppin cohort of healthy controls. For data collected from public sources and related works, we must refer to the respective source for information on patient consent (see Table A1).

Data Availability Statement

All data presented used in this study are openly available from: https://github.com/BorgwardtLab/covid19_ultrasound. US recordings that were retrieved and processed from third party platforms (ThePocusAtlas, LIFTL, GrepMed, Radiopaedia.org) are available via Creative Commons License. The data from Butterfly was not available for non-commercial redistribution but can be obtained automatically with a script from our repository. The software code used to train the models and evaluate the results is also available at: https://github.com/BorgwardtLab/covid19_ultrasound.

Acknowledgments

The authors would like to thank Jeremie Roulin, Marion Disdier, Vijay Daita, Moritz Gruber and Laura Ramzy for help in data collection, useful discussions and feedback on the manuscript. Moreover, we thank Ruud van Sloun for sharing pre-trained segmentation models. We also appreciate the contribution of Francesco Civardi and Balzano Informatik AG, who donated 45 LUS videos recorded from COVID-19 suspects (this data was not included for the present analysis).

Conflicts of Interest

The authors declare no conflict of interest.

Abbreviations

   The following abbreviations are used in this manuscript:
CAMClass Activation Map
CNNConvolutional Neural Network
DLDeep Learning
LUSLung Ultrasound
PCRPolymerase Chain Reaction
RT-PCRReverse Transcription Polymerase Chain Reaction

Appendix A. Dataset

Table A1 gives a short overview of the most important sources, consisting of clinical data, self-recorded data of healthy volunteers, other scientific publications, educational websites and health-tech companies. Note that if not specified otherwise, the numbers for convex and linear data samples refer to videos. An extensive list of sources and metadata can be found on GitHub (https://github.com/BorgwardtLab/covid19_ultrasound/blob/master/data/dataset_metadata.csv). Notably, a significant portion of data (45 linear videos) obtained during home visits from Piacenza, Italy during spring 2020 was excluded from all presented analysis due to the lack of a confirmative RT-PCR, but is still released in our public repository in a designated folder marked as “label unclear”.
Table A1. Data sources. Overview of all data sources, including a comprehensive list of publications and educational websites that provide data included in our analysis.
Data SourceData SelectedDescription
Northumbria
(NH NHS-FT)
Convex: 47 videos and 23 images
(31 healthy and 39 bacterial pneumonia infected patients)
The Northumbria Healthcase NHS Foundation Trust (NH NHS-FT)
contributed patient data (images and videos) to our dataset
Neuruppin
(MHB)
Convex: 28 videos
Linear: 3 videos
(all healthy)
Ultrasoud course instructors from Medizinische Hochschule Brandenburg
Theodor Fontane (MHB) recorded volunteers that did not show
any symptoms of COVID-19 infections and were not tested positively
PublicationsConvex: 15 images and 30 videos from all classes
Linear: 4 images, 4 videos
Miscallaneous LUS videos and images were fetched from publications [19,83,84,85,86,87,88,89,90,91,92,93,94,95,96,97,98]
GrepMedConvex: 9 COVID-19, 9 pneumonia and 2 healthy
Linear: 3 COVID-19, 1 healthy (all videos)
GrepMed is a community-sourced, medical
image repository for referencing clinically relevant medical images
ButterflyConvex: 18 COVID-19 and 2 healthy videosButterfly is a vendor of a portable US device needing only a single
probe usable on the whole body that connects to a smartphone
ThePocusAtlasConvex: 8 COVID-19, 2 pneumonia and 3 healthy videos
Linear: 2 COVID-19 videos
ThePocusAtlas is a Collaborative Ultrasound Education Platform
LITFLConvex: 5 bacterial and 2 viral pneumonia (H1N1), 2 healthy
Linear: 1 H1N1 (all videos)
Australasian critical care physicians maintain an educational platform
and provide an ultrasound library with case studies
WebConvex: 15 images, 15 videos
Linear: 2 images, 6 videos
from all classes
Remaining online sources were:
https://www.stemlynsblog.org/, https://clarius.com/,
https://everydayultrasound.com/, https://radiopaedia.org,
https://www.acutemedicine.org, https://www.bcpocus.ca,
https://www.youtube.com, www.sonographiebilder.de/
Bolzano AG45 linear videos of probably COVID-19 infected patients
(Data not used for any analysis presented herein)Videos were recorded in spring 2020 in Piacenza (Italy) from patients
suspected of COVID-19. Diagnosis was not confirmed via PCR
or thorax imaging. Bolzano AG donated this data to our dataset.

Data License

The example images in Figure 1 are available via creative commons license (CC BY-NC 4.0) from: thepocusatlas.com (access date: 17 April 2020). All sources apart from Butterfly either agreed to our redistribution of the data on GitHub or licensed their data under CC license. The data from Butterfly can be easily added and pre-processed by running a shell script we provide. In addition we acknowledge the following contributions from US videos from https://radiopaedia.org Radiopaedia (access date: 17 April 2020): https://radiopaedia.org/cases/pneumonia-ultrasound-1 ‘Pneumonia-ultrasound’ from Dr. David Carroll and https://radiopaedia.org/cases/normal-anterior-lung-ultrasound-1 ‘Normal anterior lung (ultrasound)’ from Dr. David Carroll.

Appendix B. Model Architectures and Hyperparameter

As a base, we use the convolutional part of the established VGG-16 [70], pre-trained on Imagenet. The model we call VGG is followed by one hidden layer of 64 neurons with ReLU activation, dropout of 0.5, batch normalization and the output layer with softmax activation. The CAMs for this model were computed with Grad-CAM [75]. To compare Grad-CAMs with regular CAMs [72], we also tested VGG-CAM, a CAM-compatible VGG with a single dense layer following the global average pooling after the last convolutional layer. For both models, during training only the weights of the last three layers were fine-tuned, while the other ones were frozen to the values from pre-training. This results in a total of ∼2.4 M trainable and ∼12.4 M non-trainable parameters. The model is trained with a cross entropy loss function on the softmax outputs, and optimized with Adam with an initial learning rate of 1 e 4 . All models were implemented in TensorFlow and trained for 40 epochs with a batch size of 8 and early stopping was enabled.

Appendix B.1. Pretrained Segmentation Models

Figure A1 gives an example for the segmented ultrasound image with the model from [57]. In our work the segmented image serves as input to the VGG-Segment model.
Figure A1. Example snapshot from lung segmentation of COVID-19 patient. Left side shows the raw US recording and the right side shows the segmentation method from [57] highlighting the B-line. The images shown on the right were used as input for the VGG-Segment model. Blue, orange and red correspond to signs of healthy, moderate and heavily COVID-19 infected lungs.
Applsci 11 00672 g0a1

Appendix C. Results

Re-formulating the classification as a binary task, the ROC-curve and precision-recall curves can be computed for each class. Figure A2 and Figure A3 depict the performance per class, comparing all proposed models. Figure A3a,b show that all models show similar performance with the exception of NASNet. The performance for COVID-19 is better for VGG than for the segmentation based model (Figure A3a).
Figure A2. Binary classification results. All models achieve good precision and recall in pneumonia detection, but lower scores and higher variances are observed for data of healthy patients. (a) ROC-curve (Pneumonia), (b) Precision-recall (Pneumonia), (c) ROC-curve (Healthy), (d) Precision-recall (Healthy).
Applsci 11 00672 g0a2
Figure A3. COVID-19 detection and absolute confusion matrix. (a) ROC-curve (COVID-19), (b) Precision-recall-curve (COVID-19), (c) Absolute confusion matrix (VGG-CAM).
Applsci 11 00672 g0a3
Furthermore, in addition to the normalized confusion matrices we provide the absolute values here in Figure A3c (referring to VGG-CAM). Note that the number of COVID-19 images almost matches the number of healthy data, despite the novelty of the disease. Problematically, healthy and COVID-19 patients are confused in 162 images, whereas bacterial pneumonia is predicted rather reliably.

Appendix C.1. Uninformative Class

Although the main task is defined as differentiating COVID-19, bacterial pneumonia and healthy, we trained the model actually with a fourth “uninformative” class in order to identify out-of-distribution samples. This concerns both entirely different pictures (no ultrasound), as well as ultrasound images not showing the lung. Thus, we added 200 images from Tiny ImageNet (one per class taken from the test set) together with 200 neck ultrasound scans taken from the Kaggle ultrasound nerve segmentation challenge [69]. Note that the latter is data recorded with linear ultrasound probes, leading to very different ultrasound images.
Table A2 lists the results including these uninformative samples, where better accuracy is achieved due to the ease of distinguishing the uninformative samples from other data. In all cases except for experiments with the NASNetMobile model, precision and recall are higher than 0.98 with low standard deviation.
Table A2. Performance comparison including accuracy on the uninformative data. “Balanced” abbreviates balanced accuracy and Par. the number of parameters. The raw results are listed, including the uninformative class. Clearly, this fourth class is very distinctive and is learnt successfully, with almost all scores above 0.89.
ClassRecallPrecisionF1-ScoreSpecificity
VGGCOVID-19 0.88 ± 0.07 0.90 ± 0.07 0.89 ± 0.06 0.94 ± 0.05
Accuracy: 0.885Pneumonia 0.90 ± 0.11 0.81 ± 0.08 0.85 ± 0.08 0.94 ± 0.04
Balanced: 0.903Healthy 0.83 ± 0.11 0.90 ± 0.06 0.86 ± 0.08 0.94 ± 0.03
Par.: 14 747 971Uninformative 1.00 ± 0.00 1.00 ± 0.00 1.00 ± 0.00 1.00 ± 0.00
VGG-CAMCOVID-19 0.85 ± 0.11 0.86 ± 0.07 0.85 ± 0.08 0.92 ± 0.04
Accuracy: 0.88Pneumonia 0.86 ± 0.14 0.87 ± 0.06 0.86 ± 0.09 0.96 ± 0.03
Balanced: 0.894Healthy 0.86 ± 0.11 0.88 ± 0.09 0.87 ± 0.09 0.94 ± 0.04
#Param.: 14 716 227Uninformative 1.00 ± 0.00 0.98 ± 0.04 0.99 ± 0.02 1.00 ± 0.00
NASNetMobileCOVID-19 0.63 ± 0.22 0.59 ± 0.12 0.59 ± 0.15 0.75 ± 0.11
Accuracy: 0.588Pneumonia 0.22 ± 0.27 0.46 ± 0.42 0.28 ± 0.30 0.98 ± 0.03
Balanced: 0.42Healthy 0.80 ± 0.11 0.56 ± 0.06 0.65 ± 0.07 0.61 ± 0.12
#Param.: 4 814 487Uninformative 0.03 ± 0.05 0.20 ± 0.40 0.04 ± 0.09 1.00 ± 0.00
VGG-SegmentCOVID-19 0.81 ± 0.20 0.86 ± 0.08 0.82 ± 0.13 0.93 ± 0.05
Accuracy: 0.866Pneumonia 0.86 ± 0.08 0.84 ± 0.08 0.84 ± 0.03 0.95 ± 0.03
Balanced: 0.877Healthy 0.85 ± 0.12 0.86 ± 0.06 0.85 ± 0.08 0.91 ± 0.07
#Param.: 34 018 074Uninformative 0.99 ± 0.01 1.00 ± 0.00 0.99 ± 0.00 1.00 ± 0.00
Segment-EncCOVID-19 0.84 ± 0.11 0.89 ± 0.07 0.86 ± 0.07 0.94 ± 0.05
Accuracy: 0.873Pneumonia 0.89 ± 0.04 0.75 ± 0.10 0.81 ± 0.06 0.93 ± 0.03
Balanced: 0.886Healthy 0.82 ± 0.18 0.90 ± 0.05 0.85 ± 0.12 0.95 ± 0.02
Par.: 19 993 307Uninformative 1.00 ± 0.00 1.00 ± 0.00 1.00 ± 0.00 1.00 ± 0.00

Appendix D. Class Activation Maps

In addition to the scatter plot in Figure 5 we present the corresponding density plot in Figure A4, showing the area of the ultrasound image where the class activation is maximal for each class. It can be observed that the activation on healthy and COVID-19 videos is located further in the upper part of the image, where usually only muscles and skin are observed. Further work is thus necessary to analyze and improve the qualitative results of the model.
However, with respect to pathological patterns visible, the model does in many cases focus on the patterns that are interesting to medical experts. Table A3 breaks down the results presented in Figure 6 more in detail, and in particular separately for both medical experts. Note that with respect to the pleural line, we only consider the opinion of expert 2 since expert 1 did not mention it. With the exception of consolidations, the difference in responses is quite large, which is however unsurprising for such a qualitative task. Besides the patterns that were already named in Figure 6, the heatmaps also correctly highlighted air bronchograms (2 cases according to expert 1) and a pleural effusion in 1 out of 7 cases.
Table A3. Pathological patterns visible and highlighted by class activation maps of our model. Pneu abbreviated pneumonia. The model focuses on consolidations, A-lines and the pleural line.
ConsolidationsA-LinesB-LinesBronchogramEffusionPleural Line
Specific forBacterial Pne.HealthyCOVID-19
(Viral Pne.)
Bacterial Pne.Pne.Pne. If Irregular
Total visible1813122720 (expert 2)
CAM (expert 1)1760210
CAM (expert 2)17106009
Figure A4. Density plot of centers of class maps. Pneumonia-CAMs are rather centralized compared to other CAMs. Problematically, COVID-CAMs seem to exhibit a tendency for upper regions of the probe that do not necessarily belong to the lung.
Applsci 11 00672 g0a4

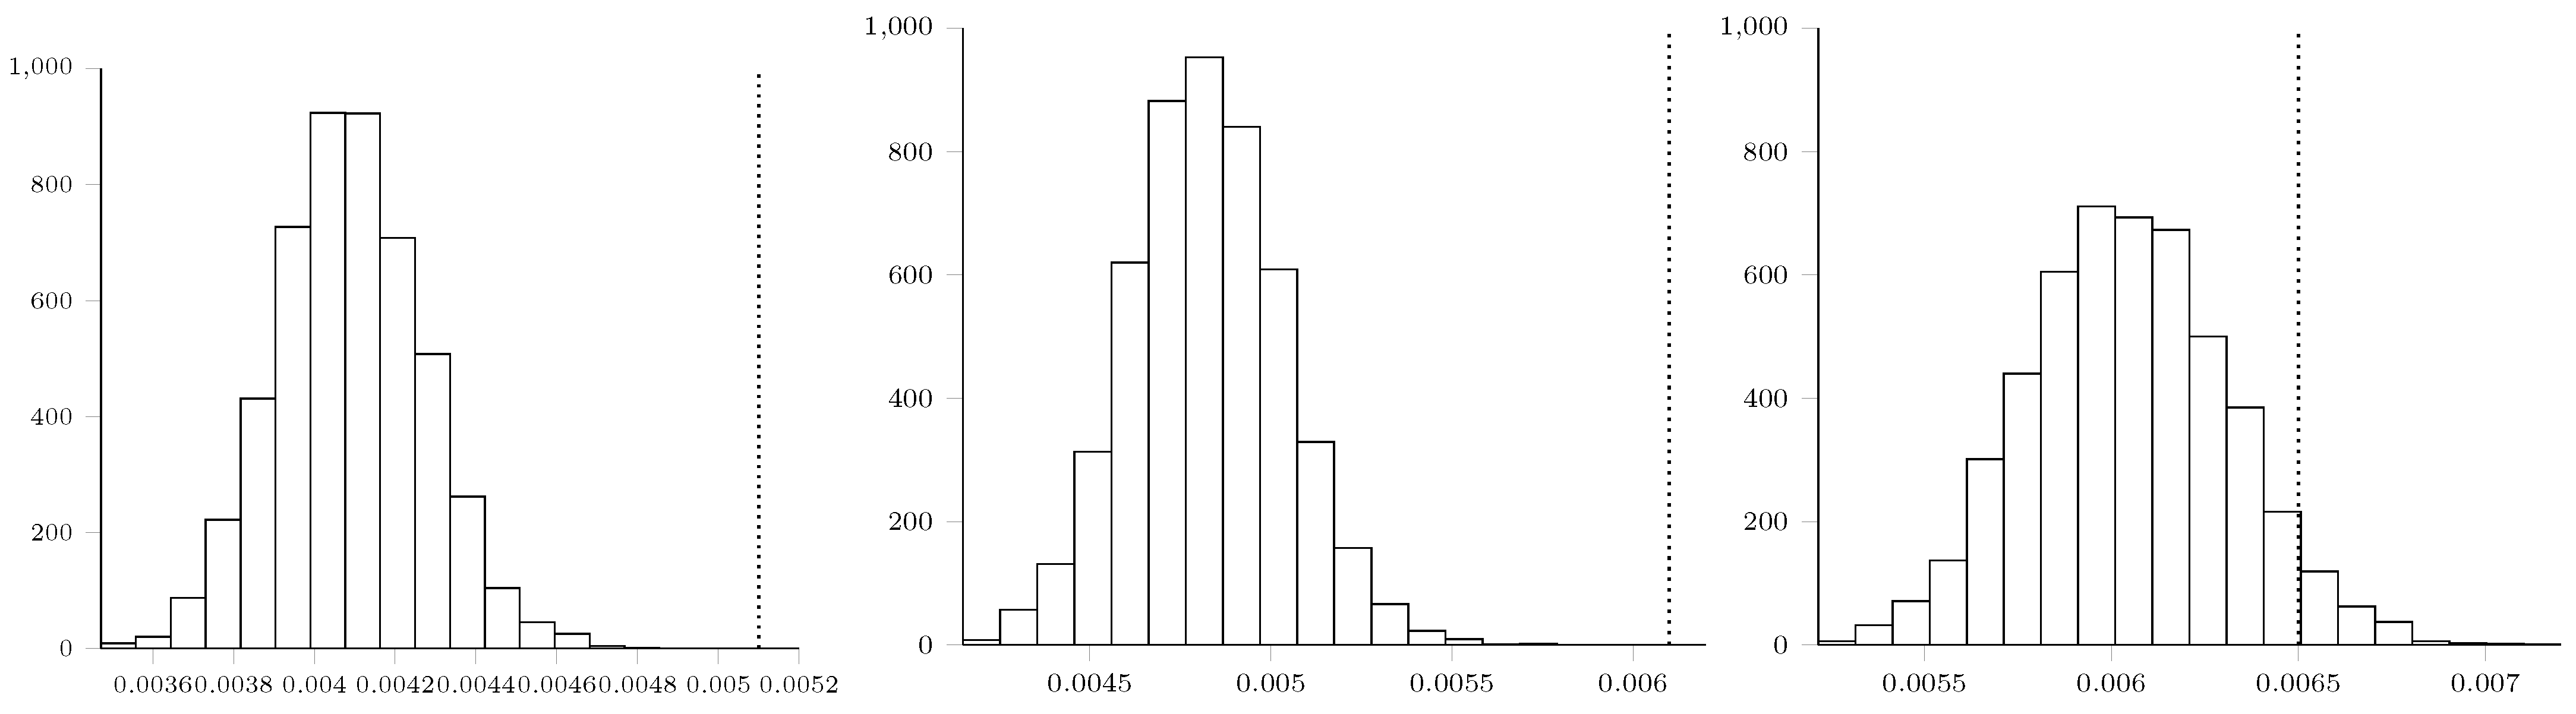
Maximum Mean Discrepancy Analysis

Figure A5 shows the histograms corresponding to experiments reported in Section 4.1.1.
Figure A5. Histograms depicting the empirical null distribution, obtained via bootstrapping 5000 samples, of the MMD values (from left to right): MMD ( C , P ) 0.0051 ; MMD ( C , H ) 0.0061 ; and MMD ( P , H ) 0.0065 . The corresponding true MMD values, that is, the ones we obtain by looking at the labels, are indicated as a dashed line in each histogram. We observe that these values are highly infrequent under the null distribution, indicating that the differences betwee the three classes are significant. Notably, the statistical distance between patients suffering from bacterial pneumonia and healthy patients (rightmost histogram) achieves a slightly lower empirical significance of ≈0.04. We speculate that this might be related to other pre-existing conditions in healthy patients that are not pertinent to this study.
Applsci 11 00672 g0a5

Appendix E. Statement of Broader Impact

The proposed methods could help to simplify and accelerate the diagnosis of COVID-19, as well as other viral and bacterial pneumonia. This could decrease the number of infections, improve disease management and patient care of both COVID-19 and future pandemics. If computer vision methods sufficiently increase the sensitivity of diagnosis with ultrasound, it could replace X-ray and CT as a first-line examination, as suggested in [7,21]. This would lower the risks for medical staff (due to simplicity of sterilization), decrease costs for health care, and avoid exposing patients to radiation. Most importantly, in developing countries ultrasound may be the only available and reliable test method.

Appendix E.1. Model Failure

In case of failure, false negatives are most problematic since the disease spread is accelerated if infected patients are not quarantined. In response, we first provide confidence estimates that allow to disregard low certainty predictions, secondly we feature explainable methods helping to discover decisions based on artifacts. Moreover, like any ML approach on lung imaging data, the applicability of our framework is naturally limited to symptomatic patients with infected lungs. From the practical perspective we want to stress that we envision our tool as a decision support system that can help to save the scarce time of physicians, who will always retain full control. The primary use will be first-line examination for patient stratification, followed by appropriate medical treatment with the proper diagnostic equipment (PCR, IGG-IGM detection or clinical assesment).

Appendix E.2. Impact on Society

Critics could point out the possibility of doctors being replaced by automatic systems. However, given that the proposed methods are aimed at interpretable decision support tools and not for standalone detection, such a scenario seems unlikely. Instead, such tools could increase the capacities of congested hospitals, or integrate general practitioners (who do not have access to PCR laboratories or other imaging devices) into the diagnostic process.

Appendix E.3. Biases and Validation

Since much of our data is taken from online sources, in some cases there is no patient information available. It is therefore possible or even likely that the data is biased to some extent. We verified our methods and data as good as possible, utilizing novel healthy-patient data as well as the only other COVID-19 ultrasound dataset [57]. In any case it is necessary to probe the methods in a clinical setting, and we already initiated a collaboration working toward a clinical study comparing ultrasound and automatic detection techniques to other imaging modalities. A challenge in this clinical study will be the fair representation of different patient age groups and ethnicities. However, as US is non-invasive there are hardly any known risk factors and it is thus inclusive for all patient subgroups, also those that are excluded from CT and CXR such as diabetics (due to sugar in the contrast material).
In conclusion, we regard our work as a step towards automation of a testing method with extremely positive impact if validated appropriately.

References

  1. Li, Q.; Guan, X.; Wu, P.; Wang, X.; Zhou, L.; Tong, Y.; Ren, R.; Leung, K.S.; Lau, E.H.; Wong, J.Y.; et al. Early transmission dynamics in Wuhan, China, of novel coronavirus–infected pneumonia. N. Engl. J. Med. 2020, 382, 1199–1207. [Google Scholar] [CrossRef]
  2. Mei, X.; Lee, H.C.; Diao, K.y.; Huang, M.; Lin, B.; Liu, C.; Xie, Z.; Ma, Y.; Robson, P.M.; Chung, M.; et al. Artificial intelligence–enabled rapid diagnosis of patients with COVID-19. Nat. Med. 2020, 26, 1224–1228. [Google Scholar] [CrossRef]
  3. Kanne, J.P.; Little, B.P.; Chung, J.H.; Elicker, B.M.; Ketai, L.H. Essentials for radiologists on COVID-19: An update—Radiology scientific expert panel. Radiology 2020, 296, E113–E114. [Google Scholar] [CrossRef] [Green Version]
  4. Ai, T.; Yang, Z.; Hou, H.; Zhan, C.; Chen, C.; Lv, W.; Tao, Q.; Sun, Z.; Xia, L. Correlation of chest CT and RT-PCR testing in coronavirus disease 2019 (COVID-19) in China: A report of 1014 cases. Radiology 2020, 296, E32–E40. [Google Scholar] [CrossRef] [PubMed] [Green Version]
  5. Kucirka, L.M.; Lauer, S.A.; Laeyendecker, O.; Boon, D.; Lessler, J. Variation in False-Negative Rate of Reverse Transcriptase Polymerase Chain Reaction–Based SARS-CoV-2 Tests by Time Since Exposure. Ann. Intern. Med. 2020, 173, 262–267. [Google Scholar] [CrossRef] [PubMed]
  6. Dong, D.; Tang, Z.; Wang, S.; Hui, H.; Gong, L.; Lu, Y.; Xue, Z.; Liao, H.; Chen, F.; Yang, F.; et al. The role of imaging in the detection and management of COVID-19: A review. IEEE Rev. Biomed. Eng. 2020. [Google Scholar] [CrossRef] [PubMed]
  7. Bourcier, J.E.; Paquet, J.; Seinger, M.; Gallard, E.; Redonnet, J.P.; Cheddadi, F.; Garnier, D.; Bourgeois, J.M.; Geeraerts, T. Performance comparison of lung ultrasound and chest x-ray for the diagnosis of pneumonia in the ED. Am. J. Emerg. Med. 2014, 32, 115–118. [Google Scholar] [CrossRef] [PubMed]
  8. Bao, C.; Liu, X.; Zhang, H.; Li, Y.; Liu, J. COVID-19 Computed Tomography Findings: A Systematic Review and Meta-Analysis. J. Am. Coll. Radiol. 2020, 17, 701–709. [Google Scholar] [CrossRef] [PubMed]
  9. Fang, Y.; Zhang, H.; Xie, J.; Lin, M.; Ying, L.; Pang, P.; Ji, W. Sensitivity of chest CT for COVID-19: Comparison to RT-PCR. Radiology 2020, 296, E115–E117. [Google Scholar] [CrossRef]
  10. Yang, Y.; Huang, Y.; Gao, F.; Yuan, L.; Wang, Z. Lung ultrasonography versus chest CT in COVID-19 pneumonia: A two-centered retrospective comparison study from China. Intensive Care Med. 2020, 46, 1761–1763. [Google Scholar] [CrossRef]
  11. Mossa-Basha, M.; Meltzer, C.C.; Kim, D.C.; Tuite, M.J.; Kolli, K.P.; Tan, B.S. Radiology department preparedness for COVID-19: Radiology scientific expert panel. Radiology 2020, 296, E106–E112. [Google Scholar] [CrossRef] [PubMed] [Green Version]
  12. Castillo, M. The industry of CT scanning. Am. J. Neuroradiol. 2012, 33, 583–585. [Google Scholar] [CrossRef] [PubMed] [Green Version]
  13. Weinstock, M.; Echenique, A.; Daugherty, S.R.; Russell, J. Chest x-ray findings in 636 ambulatory patients with COVID-19 presenting to an urgent care center: A normal chest x-ray is no guarantee. J. Urgent Care Med. 2020, 14, 13–18. [Google Scholar]
  14. Sippel, S.; Muruganandan, K.; Levine, A.; Shah, S. Use of ultrasound in the developing world. Int. J. Emerg. Med. 2011, 4, 1–11. [Google Scholar] [CrossRef] [Green Version]
  15. Lichtenstein, D.; Goldstein, I.; Mourgeon, E.; Cluzel, P.; Grenier, P.; Rouby, J.J. Comparative diagnostic performances of auscultation, chest radiography, and lung ultrasonography in acute respiratory distress syndrome. Anesthesiology 2004, 100, 9–15. [Google Scholar] [CrossRef]
  16. Chavez, M.A.; Shams, N.; Ellington, L.E.; Naithani, N.; Gilman, R.H.; Steinhoff, M.C.; Santosham, M.; Black, R.E.; Price, C.; Gross, M.; et al. Lung ultrasound for the diagnosis of pneumonia in adults: A systematic review and meta-analysis. Respir. Res. 2014, 15, 50. [Google Scholar] [CrossRef] [Green Version]
  17. Pagano, A.; Numis, F.G.; Visone, G.; Pirozzi, C.; Masarone, M.; Olibet, M.; Nasti, R.; Schiraldi, F.; Paladino, F. Lung ultrasound for diagnosis of pneumonia in emergency department. Intern. Emerg. Med. 2015, 10, 851–854. [Google Scholar] [CrossRef]
  18. Reali, F.; Papa, G.F.S.; Carlucci, P.; Fracasso, P.; Di Marco, F.; Mandelli, M.; Soldi, S.; Riva, E.; Centanni, S. Can lung ultrasound replace chest radiography for the diagnosis of pneumonia in hospitalized children? Respiration 2014, 88, 112–115. [Google Scholar] [CrossRef]
  19. Claes, A.S.; Clapuyt, P.; Menten, R.; Michoux, N.; Dumitriu, D. Performance of chest ultrasound in pediatric pneumonia. Eur. J. Radiol. 2017, 88, 82–87. [Google Scholar] [CrossRef] [Green Version]
  20. Abdalla, W.; Elgendy, M.; Abdelaziz, A.; Ammar, M. Lung ultrasound versus chest radiography for the diagnosis of pneumothorax in critically ill patients: A prospective, single-blind study. Saudi J. Anaesth. 2016, 10, 265. [Google Scholar] [CrossRef]
  21. Brogi, E.; Bignami, E.; Sidoti, A.; Shawar, M.; Gargani, L.; Vetrugno, L.; Volpicelli, G.; Forfori, F. Could the use of bedside lung ultrasound reduce the number of chest X-rays in the intensive care unit? Cardiovasc. Ultrasound 2017, 15, 23. [Google Scholar] [CrossRef] [PubMed]
  22. Buonsenso, D.; Pata, D.; Chiaretti, A. COVID-19 outbreak: Less stethoscope, more ultrasound. Lancet Respir. Med. 2020, 8, e27. [Google Scholar] [CrossRef] [Green Version]
  23. Smith, M.; Hayward, S.; Innes, S.; Miller, A. Point-of-care lung ultrasound in patients with COVID-19—A narrative review. Anaesthesia 2020, 75, 1096–1104. [Google Scholar] [CrossRef] [PubMed] [Green Version]
  24. Lepri, G.; Orlandi, M.; Lazzeri, C.; Bruni, C.; Hughes, M.; Bonizzoli, M.; Wang, Y.; Peris, A.; Matucci-Cerinic, M. The emerging role of lung ultrasound in COVID-19 pneumonia. Eur. J. Rheumatol. 2020, 7, S129–S133. [Google Scholar] [CrossRef]
  25. Sultan, L.R.; Sehgal, C.M. A review of early experience in lung ultrasound (LUS) in the diagnosis and management of COVID-19. Ultrasound Med. Biol. 2020, 46, 2530–2545. [Google Scholar] [CrossRef]
  26. Muse, E.D.; Topol, E.J. Guiding ultrasound image capture with artificial intelligence. Lancet 2020, 396, 749. [Google Scholar] [CrossRef]
  27. Volpicelli, G.; Lamorte, A.; Villén, T. What’s new in lung ultrasound during the COVID-19 pandemic. Intensive Care Med. 2020, 46, 1445–1448. [Google Scholar] [CrossRef]
  28. Pare, J.R.; Camelo, I.; Mayo, K.C.; Leo, M.M.; Dugas, J.N.; Nelson, K.P.; Baker, W.E.; Shareef, F.; Mitchell, P.M.; Schechter-Perkins, E.M. Point-of-care lung ultrasound is more sensitive than chest radiograph for evaluation of COVID-19. West. J. Emerg. Med. 2020, 21, 771. [Google Scholar] [CrossRef]
  29. Peng, Q.Y.; Wang, X.T.; Zhang, L.N.; Chinese Critical Care Ultrasound Study Group (CCUSG). Findings of lung ultrasonography of novel corona virus pneumonia during the 2019–2020 epidemic. Intensive Care Med. 2020, 46, 849–850. [Google Scholar] [CrossRef] [Green Version]
  30. Fiala, M. Ultrasound in COVID-19: A timeline of ultrasound findings in relation to CT. Clin. Radiol. 2020. [Google Scholar] [CrossRef]
  31. Lieveld, A.; Kok, B.; Schuit, F.; Azijli, K.; Heijmans, J.; van Laarhoven, A.; Assman, N.; Kootte, R.; Olgers, T.; Nanayakkara, P.; et al. Diagnosing COVID-19 pneumonia in a pandemic setting: Lung Ultrasound versus CT (LUVCT) A multi-centre, prospective, observational study. ERJ Open Res. 2020. [Google Scholar] [CrossRef]
  32. Tung-Chen, Y.; Martí de Gracia, M.; Díez-Tascón, A.; Alonso-González, R.; Agudo-Fernández, S.; Parra-Gordo, M.L.; Ossaba-Vélez, S.; Rodríguez-Fuertes, P.; Llamas-Fuentes, R. Correlation between Chest Computed Tomography and Lung Ultrasonography in Patients with Coronavirus Disease 2019 (COVID-19). Ultrasound Med. Biol. 2020, 46, 2918–2926. [Google Scholar] [CrossRef] [PubMed]
  33. Ellington, L.E.; Gilman, R.H.; Chavez, M.A.; Pervaiz, F.; Marin-Concha, J.; Compen-Chang, P.; Riedel, S.; Rodriguez, S.J.; Gaydos, C.; Hardick, J.; et al. Lung ultrasound as a diagnostic tool for radiographically-confirmed pneumonia in low resource settings. Respir. Med. 2017, 128, 57–64. [Google Scholar] [CrossRef] [PubMed] [Green Version]
  34. Amatya, Y.; Rupp, J.; Russell, F.M.; Saunders, J.; Bales, B.; House, D.R. Diagnostic use of lung ultrasound compared to chest radiograph for suspected pneumonia in a resource-limited setting. Int. J. Emerg. Med. 2018, 11, 8. [Google Scholar] [CrossRef] [Green Version]
  35. Stewart, K.A.; Navarro, S.M.; Kambala, S.; Tan, G.; Poondla, R.; Lederman, S.; Barbour, K.; Lavy, C. Trends in Ultrasound Use in Low and Middle Income Countries: A Systematic Review. Int. J. 2020, 9, 103–120. [Google Scholar]
  36. Di Serafino, M.; Notaro, M.; Rea, G.; Iacobellis, F.; Paoli, V.D.; Acampora, C.; Ianniello, S.; Brunese, L.; Romano, L.; Vallone, G. The lung ultrasound: Facts or artifacts? In the era of COVID-19 outbreak. La Radiol. Med. 2020, 125, 738–753. [Google Scholar] [CrossRef]
  37. Tutino, L.; Cianchi, G.; Barbani, F.; Batacchi, S.; Cammelli, R.; Peris, A. Time needed to achieve completeness and accuracy in bedside lung ultrasound reporting in intensive care unit. Scand. J. Trauma Resusc. Emerg. Med. 2010, 18, 44. [Google Scholar] [CrossRef] [Green Version]
  38. Ulhaq, A.; Born, J.; Khan, A.; Gomes, D.; Chakraborty, S.; Paul, M. COVID-19 Control by Computer Vision Approaches: A Survey. IEEE Access 2020, 8, 179437–179456. [Google Scholar] [CrossRef]
  39. Shi, F.; Wang, J.; Shi, J.; Wu, Z.; Wang, Q.; Tang, Z.; He, K.; Shi, Y.; Shen, D. Review of artificial intelligence techniques in imaging data acquisition, segmentation and diagnosis for COVID-19. IEEE Rev. Biomed. Eng. 2020. [Google Scholar] [CrossRef] [Green Version]
  40. Born, J.; Beymer, D.; Rajan, D.; Coy, A.; Mukherjee, V.V.; Manica, M.; Prasanna, P.; Ballah, D.; Shah, P.L.; Karteris, E.; et al. On the Role of Artificial Intelligence in Medical Imaging of COVID-19. medRxiv 2020. [Google Scholar] [CrossRef]
  41. Liu, S.; Wang, Y.; Yang, X.; Lei, B.; Liu, L.; Li, S.X.; Ni, D.; Wang, T. Deep learning in medical ultrasound analysis: A review. Engineering 2019, 5, 261–275. [Google Scholar] [CrossRef]
  42. van Sloun, R.J.; Demi, L. Localizing B-lines in lung ultrasonography by weakly-supervised deep learning, in-vivo results. IEEE J. Biomed. Health Inform. 2019, 24, 957–964. [Google Scholar] [CrossRef] [PubMed]
  43. Wang, X.; Burzynski, J.S.; Hamilton, J.; Rao, P.S.; Weitzel, W.F.; Bull, J.L. Quantifying lung ultrasound comets with a convolutional neural network: Initial clinical results. Comput. Biol. Med. 2019, 107, 39–46. [Google Scholar] [CrossRef] [PubMed]
  44. Kulhare, S.; Zheng, X.; Mehanian, C.; Gregory, C.; Zhu, M.; Gregory, K.; Xie, H.; Jones, J.M.; Wilson, B.K. Ultrasound-Based Detection of Lung Abnormalities Using Single Shot Detection Convolutional Neural Networks. In Simulation, Image Processing, and Ultrasound Systems for Assisted Diagnosis and Navigation; Springer: Berlin, Germany, 2018; Volume 11042, pp. 65–73. [Google Scholar] [CrossRef]
  45. Carrer, L.; Donini, E.; Marinelli, D.; Zanetti, M.; Mento, F.; Torri, E.; Smargiassi, A.; Inchingolo, R.; Soldati, G.; Demi, L.; et al. Automatic pleural line extraction and COVID-19 scoring from lung ultrasound data. IEEE Trans. Ultrason. Ferroelectr. Freq. Control 2020, 67, 2207–2217. [Google Scholar] [CrossRef] [PubMed]
  46. Xu, Y.; Zhang, Y.; Bi, K.; Ning, Z.; Xu, L.; Shen, M.; Deng, G.; Wang, Y. Boundary Restored Network for Subpleural Pulmonary Lesion Segmentation on Ultrasound Images at Local and Global Scales. J. Digit. Imaging 2020, 33, 1155–1166. [Google Scholar] [CrossRef] [PubMed]
  47. Chen, C.H.; Lee, Y.W.; Huang, Y.-S.; Lan, W.R.; Chang, R.F.; Tu, C.Y.; Chen, C.Y.; Liao, W.C. Computer-aided diagnosis of endobronchial ultrasound images using convolutional neural network. Comput. Methods Programs Biomed. 2019, 177, 175–182. [Google Scholar] [CrossRef]
  48. Born, J.; Brändle, G.; Cossio, M.; Disdier, M.; Goulet, J.; Roulin, J.; Wiedemann, N. POCOVID-Net: Automatic Detection of COVID-19 From a New Lung Ultrasound Imaging Dataset (POCUS). arXiv 2020, arXiv:2004.12084. [Google Scholar]
  49. Roberts, J.; Tsiligkaridis, T. Ultrasound Diagnosis of COVID-19: Robustness and Explainability. arXiv 2020, arXiv:2012.01145. [Google Scholar]
  50. Chen, Y.; Zhang, C.; Liu, L.; Feng, C.; Dong, C.; Luo, Y.; Wan, X. Effective Sample Pair Generation for Ultrasound Video Contrastive Representation Learning. arXiv 2020, arXiv:2011.13066. [Google Scholar]
  51. Hou, D.; Hou, R.; Hou, J. Interpretable Saab Subspace Network for COVID-19 Lung Ultrasound Screening. In Proceedings of the 2020 11th IEEE Annual Ubiquitous Computing, Electronics & Mobile Communication Conference (UEMCON), New York, NY, USA, 28–31 October 2020; pp. 0393–0398. [Google Scholar]
  52. Morteza, A.; Amirmazlaghani, M. A novel statistical approach for multiplicative speckle removal using t-locations scale and non-sub sampled shearlet transform. Digit. Signal Process. 2020, 107, 102857. [Google Scholar] [CrossRef]
  53. Baum, Z.; Bonmati, E.; Cristoni, L.; Walden, A.; Prados, F.; Kanber, B.; Barratt, D.C.; Hawkes, D.J.; Parker, G.J.; Wheeler-Kingshott, C.A.; et al. Image quality assessment for closed-loop computer-assisted lung ultrasound. arXiv 2020, arXiv:2008.08840. [Google Scholar]
  54. Liu, L.; Lei, W.; Luo, Y.; Feng, C.; Wan, X.; Liu, L. Semi-Supervised Active Learning for COVID-19 Lung Ultrasound Multi-symptom Classification. arXiv 2020, arXiv:2009.05436. [Google Scholar]
  55. Zhang, J.; Chng, C.B.; Chen, X.; Wu, C.; Zhang, M.; Xue, Y.; Jiang, J.; Chui, C.K. Detection and Classification of Pneumonia from Lung Ultrasound Images. In Proceedings of the 2020 5th International Conference on Communication, Image and Signal Processing (CCISP), Chengdu, China, 13–15 November 2020; pp. 294–298. [Google Scholar] [CrossRef]
  56. Arntfield, R.; VanBerlo, B.; Alaifan, T.; Phelps, N.; White, M.; Chaudhary, R.; Ho, J.; Wu, D. Development of a deep learning classifier to accurately distinguish COVID-19 from look-a-like pathology on lung ultrasound. medRxiv 2020. [Google Scholar] [CrossRef]
  57. Roy, S.; Menapace, W.; Oei, S.; Luijten, B.; Fini, E.; Saltori, C.; Huijben, I.; Chennakeshava, N.; Mento, F.; Sentelli, A.; et al. Deep learning for classification and localization of COVID-19 markers in point-of-care lung ultrasound. IEEE Trans. Med. Imaging 2020, 39, 2676–2687. [Google Scholar] [CrossRef]
  58. Bagon, S.; Galun, M.; Frank, O.; Schipper, N.; Vaturi, M.; Zalcberg, G.; Soldati, G.; Smargiassi, A.; Inchingolo, R.; Torri, E.; et al. Assessment of COVID-19 in lung ultrasound by combining anatomy and sonographic artifacts using deep learning. J. Acoust. Soc. Am. 2020, 148, 2736. [Google Scholar] [CrossRef]
  59. Yaron, D.; Keidar, D.; Goldstein, E.; Shachar, Y.; Blass, A.; Frank, O.; Schipper, N.; Shabshin, N.; Grubstein, A.; Suhami, D.; et al. Point of Care Image Analysis for COVID-19. arXiv 2020, arXiv:2011.01789. [Google Scholar]
  60. Jim, A.A.J.; Rafi, I.; Chowdhury, M.S.; Sikder, N.; Mahmud, M.P.; Rubaie, S.; Masud, M.; Bairagi, A.K.; Bhakta, K.; Nahid, A.A. An Automatic Computer-Based Method for Fast and Accurate Covid-19 Diagnosis. medRxiv 2020. [Google Scholar] [CrossRef]
  61. Soldati, G.; Smargiassi, A.; Inchingolo, R.; Buonsenso, D.; Perrone, T.; Briganti, D.F.; Perlini, S.; Torri, E.; Mariani, A.; Mossolani, E.E.; et al. Is there a role for lung ultrasound during the COVID-19 pandemic? J. Ultrasound Med. 2020, 39, 1459–1462. [Google Scholar] [CrossRef] [Green Version]
  62. Lichtenstein, D.A. Lung Ultrasound in the Critically Ill: The BLUE Protocol; Springer: Berlin, Germany, 2015. [Google Scholar]
  63. Jackson, K.; Butler, R.; Aujayeb, A. Lung ultrasound in the COVID-19 pandemic. Postgrad. Med J. 2020, 97. [Google Scholar] [CrossRef]
  64. Aujayeb, A.; Johnston, R.; Routh, C.; Wilson, P.; Mann, S. Consolidating medical ambulatory care services in the COVID-19 era. Int. J. Health Sci. 2020, 14, 1. [Google Scholar]
  65. Aujayeb, A. Consolidating malignant pleural and peritoneal services during the COVID-19 response. Future Healthc. J. 2020, 7, 161–162. [Google Scholar] [CrossRef] [PubMed] [Green Version]
  66. Altmayer, S.; Zanon, M.; Pacini, G.S.; Watte, G.; Barros, M.C.; Mohammed, T.L.; Verma, N.; Marchiori, E.; Hochhegger, B. Comparison of the Computed Tomography Findings in COVID-19 and Other Viral Pneumonia in Immunocompetent Adults: A Systematic Review and Meta-Analysis. Eur. Radiol. 2020, 30, 6485–6496. [Google Scholar] [CrossRef] [PubMed]
  67. Mendel, J.B.; Lee, J.T.; Rosman, D. Current Concepts Imaging in COVID-19 and the Challenges for Low and Middle Income Countries. J. Glob. Radiol. 2020, 6, 3. [Google Scholar] [CrossRef]
  68. Russakovsky, O.; Deng, J.; Su, H.; Krause, J.; Satheesh, S.; Ma, S.; Huang, Z.; Karpathy, A.; Khosla, A.; Bernstein, M.; et al. Imagenet large scale visual recognition challenge. Int. J. Comput. Vis. 2015, 115, 211–252. [Google Scholar] [CrossRef] [Green Version]
  69. Dataset, K. Ultrasound Nerve Segmentation, 206. Data Retrieved from Kaggle. Available online: https://www.kaggle.com/c/ultrasound-nerve-segmentation (accessed on 10 May 2020).
  70. Simonyan, K.; Zisserman, A. Very Deep Convolutional Networks for Large-Scale Image Recognition. In Proceedings of the 3rd International Conference on Learning Representations, San Diego, CA, USA, 7–9 May 2015. [Google Scholar]
  71. Zoph, B.; Vasudevan, V.; Shlens, J.; Le, Q.V. Learning transferable architectures for scalable image recognition. In Proceedings of the IEEE Conference on Computer Vision and Pattern Recognition, Salt Lake City, UT, USA, 18–23 June 2018; pp. 8697–8710. [Google Scholar]
  72. Zhou, B.; Khosla, A.; Lapedriza, A.; Oliva, A.; Torralba, A. Learning deep features for discriminative localization. In Proceedings of the IEEE Conference on Computer Vision and Pattern Recognition, Las Vegas, NV, USA, 27–30 June 2016; pp. 2921–2929. [Google Scholar]
  73. Zhou, Z.; Sodha, V.; Rahman Siddiquee, M.M.; Feng, R.; Tajbakhsh, N.; Gotway, M.B.; Liang, J. Models Genesis: Generic Autodidactic Models for 3D Medical Image Analysis. In Medical Image Computing and Computer Assisted Intervention–MICCAI 2019; Springer International Publishing: Cham, Switzerland, 2019; pp. 384–393. [Google Scholar]
  74. Howard, A.G.; Zhu, M.; Chen, B.; Kalenichenko, D.; Wang, W.; Weyand, T.; Andreetto, M.; Adam, H. Mobilenets: Efficient convolutional neural networks for mobile vision applications. arXiv 2017, arXiv:1704.04861. [Google Scholar]
  75. Selvaraju, R.R.; Cogswell, M.; Das, A.; Vedantam, R.; Parikh, D.; Batra, D. Grad-cam: Visual explanations from deep networks via gradient-based localization. In Proceedings of the IEEE International Conference on Computer Vision, Venice, Italy, 22–29 October 2017; pp. 618–626. [Google Scholar]
  76. Gretton, A.; Borgwardt, K.M.; Rasch, M.J.; Schölkopf, B.; Smola, A. A kernel two-sample test. J. Mach. Learn. Res. 2012, 13, 723–773. [Google Scholar]
  77. Gal, Y.; Ghahramani, Z. Dropout as a bayesian approximation: Representing model uncertainty in deep learning. In Proceedings of the 33rd International Conference on Machine Learning, New York, NY, USA, 19–24 June 2016; pp. 1050–1059. [Google Scholar]
  78. Ayhan, M.S.; Berens, P. Test-time data augmentation for estimation of heteroscedastic aleatoric uncertainty in deep neural networks. In Proceedings of the 1st Conference on Medical Imaging with Deep Learning (MIDL 2018), Amsterdam, The Netherlands, 4 July 2018. [Google Scholar]
  79. Butt, C.; Gill, J.; Chun, D.; Babu, B.A. Deep learning system to screen coronavirus disease 2019 pneumonia. Appl. Intell. 2020. [Google Scholar] [CrossRef]
  80. Barish, M.; Bolourani, S.; Lau, L.F.; Shah, S.; Zanos, T.P. External validation demonstrates limited clinical utility of the interpretable mortality prediction model for patients with COVID-19. Nat. Mach. Intell. 2020. [Google Scholar] [CrossRef]
  81. Vedula, S.; Senouf, O.; Bronstein, A.M.; Michailovich, O.V.; Zibulevsky, M. Towards CT-quality Ultrasound Imaging using Deep Learning. arXiv 2017, arXiv:1710.06304. [Google Scholar]
  82. Zhang, L.; Vishnevskiy, V.; Goksel, O. Deep Network for Scatterer Distribution Estimation for Ultrasound Image Simulation. arXiv 2020, arXiv:2006.10166. [Google Scholar] [CrossRef]
  83. Abrams, E.R.; Rose, G.; Fields, J.M.; Esener, D. Clinical Review: Point-of-Care Ultrasound in the Evaluation of COVID-19. J. Emerg. Med. 2020, 59, 403–408. [Google Scholar] [CrossRef] [PubMed]
  84. Volpicelli, G.; Gargani, L. Sonographic signs and patterns of COVID-19 pneumonia. Ultrasound J. 2020, 12, 1–3. [Google Scholar] [CrossRef] [PubMed]
  85. Denault, A.Y.; Delisle, S.; Canty, D.; Royse, A.; Royse, C.; Serra, X.C.; Gebhard, C.E.; Couture, É.J.; Girard, M.; Cavayas, Y.A.; et al. A proposed lung ultrasound and phenotypic algorithm for the care of COVID-19 patients with acute respiratory failure. Can. J. Anaesth. 2020, 67, 1393–1404. [Google Scholar] [CrossRef] [PubMed]
  86. Inchingolo, R.; Smargiassi, A.; Moro, F.; Buonsenso, D.; Salvi, S.; Del Giacomo, P.; Scoppettuolo, G.; Demi, L.; Soldati, G.; Testa, A.C. The Diagnosis of Pneumonia in a Pregnant Woman with COVID-19 Using Maternal Lung Ultrasound. Am. J. Obstet. Gynecol. 2020, 223, 9–11. [Google Scholar] [CrossRef] [PubMed]
  87. Huang, Y.; Wang, S.; Liu, Y.; Zhang, Y.; Zheng, C.; Zheng, Y.; Zhang, C.; Min, W.; Zhou, H.; Yu, M.; et al. A Preliminary Study on the Ultrasonic Manifestations of Peripulmonary Lesions of Non-Critical Novel Coronavirus Pneumonia (COVID-19). 2020. Available online: https://papers.ssrn.com/sol3/papers.cfm?abstract_id=3544750 (accessed on 28 March 2020).
  88. Irwin, Z.; Cook, J.O. Advances in point-of-care thoracic ultrasound. Emerg. Med. Clin. N. Am. 2016, 34, 151–157. [Google Scholar] [CrossRef] [PubMed]
  89. Bouhemad, B.; Zhang, M.; Lu, Q.; Rouby, J.J. Clinical review: Bedside lung ultrasound in critical care practice. Crit. Care 2007, 11, 205. [Google Scholar] [CrossRef]
  90. Lomoro, P.; Verde, F.; Zerboni, F.; Simonetti, I.; Borghi, C.; Fachinetti, C.; Natalizi, A.; Martegani, A. COVID-19 pneumonia manifestations at the admission on chest ultrasound, radiographs, and CT: Single-center study and comprehensive radiologic literature review. Eur. J. Radiol. Open 2020, 7, 100231. [Google Scholar] [CrossRef]
  91. Testa, A.; Soldati, G.; Copetti, R.; Giannuzzi, R.; Portale, G.; Gentiloni-Silveri, N. Early recognition of the 2009 pandemic influenza A (H1N1) pneumonia by chest ultrasound. Crit. Care 2012, 16, R30. [Google Scholar] [CrossRef] [Green Version]
  92. Yassa, M.; Birol, P.; Mutlu, A.M.; Tekin, A.B.; Sandal, K.; Tug, N. Lung Ultrasound Can Influence the Clinical Treatment of Pregnant Women with COVID-19. J. Ultrasound Med. 2020, 40. [Google Scholar] [CrossRef]
  93. Stadler, J.A.; Andronikou, S.; Zar, H.J. Lung ultrasound for the diagnosis of community-acquired pneumonia in children. Pediatr. Radiol. 2017, 47, 1412–1419. [Google Scholar] [CrossRef] [Green Version]
  94. Reissig, A.; Copetti, R. Lung ultrasound in community-acquired pneumonia and in interstitial lung diseases. Respiration 2014, 87, 179–189. [Google Scholar] [CrossRef] [PubMed]
  95. Tsung, J.W.; Kessler, D.O.; Shah, V.P. Prospective application of clinician-performed lung ultrasonography during the 2009 H1N1 influenza A pandemic: Distinguishing viral from bacterial pneumonia. Crit. Ultrasound J. 2012, 4, 1–10. [Google Scholar] [CrossRef] [PubMed] [Green Version]
  96. Vieira, A.L.S.; Júnior, J.M.P.; Bastos, M.G. Role of point-of-care ultrasound during the COVID-19 pandemic: Our recommendations in the management of dialytic patients. Ultrasound J. 2020, 12, 1–9. [Google Scholar] [CrossRef] [PubMed]
  97. Sofia, S.; Boccatonda, A.; Montanari, M.; Spampinato, M.; D’ardes, D.; Cocco, G.; Accogli, E.; Cipollone, F.; Schiavone, C. Thoracic ultrasound and SARS-COVID-19: A pictorial essay. J. Ultrasound 2020, 23, 217–221. [Google Scholar] [CrossRef] [Green Version]
  98. Rogoza, K.; Kosiak, W. Usefulness of lung ultrasound in diagnosing causes of exacerbation in patients with chronic dyspnea. Adv. Respir. Med. 2016, 84, 38–46. [Google Scholar] [CrossRef] [PubMed] [Green Version]
Figure 1. Flowchart of our contribution. (A): 3 samples from our public COVID-19 lung US dataset. Top: Healthy lung with horizontal A-lines, Middle: pneumonia infected lung with alveolar consolidations, Bottom: SARS-CoV-2 infected lung with subpleural consolidation and a focal B-line. (B,C): We present and compare frame- and video-based CNNs on this new dataset and demonstrate the feasibility of differential diagnosis from ultrasound. (D): Class activation maps highlight patterns that drove the model’s decision and are reviewed and evaluated for diagnostic value by medical experts. (E): Uncertainty techniques are employed and shown to equip the model with the ability to recognize samples with high error probability.
Applsci 11 00672 g001
Figure 2. Symptoms and pathological patterns are grouped by patient condition. (a) In the 30% of our dataset where symptoms were available fever, cough, and respiratory problems were reported most often for patients with bacterial or viral pneumonia. (b) Bacterial pneumonia is typically characterized by consolidated areas, while B-lines and pleural irregularities are usually indicative for viral infection. (a) Reported symptoms, (b) Pathological patterns.
Applsci 11 00672 g002
Figure 3. Performance of the VGG model. Per-class ROC-AUC, sensitivity, and precision are shown on the diagonals of the normalized confusion matrices, highlighting the model’s ability to distinguish COVID-19 from pneumonia and healthy lung images. It further demonstrates similar scores and balanced confusions between each pair of classes. (a) ROC-curves, (b) Precision-recall-curves, (c) Precision-confusion matrix, (d) Sensitivity-confusion matrix.
Applsci 11 00672 g003
Figure 4. Performance of our model on an independent test set. Predicted probability for COVID-19 of our model compared to the severity labels of ICLUS (colors correspond to COVID-19 severity).
Applsci 11 00672 g004
Figure 5. Class activation maps. (Left): Interactive scatterplot of the origins of the CAMs across the entire dataset, colored by class. While the data seems rather unstructured, pneumonia-CAMs have lower y-coordinates than COVID-19 and healthy samples. (Rest): Exemplary CAMs for COVID-19 (highlighting a B-line), bacterial pneumonia (highlighting pleural consolidations) and healthy lungs (highlighting A-lines).
Applsci 11 00672 g005
Figure 6. Pathological pattern highlighting. Patterns highlighted by CAMs compared to patterns visible in the video (colors correspond to success ratio in detection).
Applsci 11 00672 g006
Table 1. Dataset size. Number of videos and images in our dataset, per class and probe.
ConvexLinear
Vid.Img.Vid.Img.Sum
COVID-1964186492
Bacterial Pneu.49202273
Viral Pneu.336
Healthy6615990
Sum18253206261
Table 2. Comparison of the tested classification models on 5-fold cross validation for each class. Accuracy abbreviates accuracy, Bal. balanced accuracy, Coefficient and Par. the number of parameters (in millions). For each class and each column the best model is highlighted in bold. The accuracy of 88 % of VGG and VGG-CAM cannot be outperformed by pre-trained lung US segmentation models from [57], and unfortunately it cannot be matched by NASNetMobile, a model that is significantly smaller.
ClassRecall (Sens.)PrecisionF1-ScoreSpecificity
VGG
Accuracy: 87.8%COVID-19 0.88 ± 0.07 0.90 ± 0.07 0.89 ± 0.06 0.94 ± 0.05
Balanced: 87.1%Pneumonia 0.90 ± 0.11 0.81 ± 0.08 0.85 ± 0.08 0.94 ± 0.04
#Param: 14.7 MHealthy 0.83 ± 0.11 0.90 ± 0.06 0.86 ± 0.08 0.94 ± 0.03
VGG-CAM
Accuracy: 87.4%COVID-19 0.86 ± 0.11 0.86 ± 0.07 0.86 ± 0.08 0.91 ± 0.04
Balanced: 86.1%Pneumonia 0.87 ± 0.15 0.87 ± 0.06 0.86 ± 0.10 0.96 ± 0.03
#Param: 14.7 MHealthy 0.86 ± 0.11 0.88 ± 0.90 0.87 ± 0.90 0.93 ± 0.04
NASNetMobile
Accuracy: 62.5%COVID-19 0.63 ± 0.22 0.67 ± 0.14 0.63 ± 0.15 0.79 ± 0.12
Balanced: 55.2%Pneumonia 0.22 ± 0.27 0.46 ± 0.42 0.28 ± 0.30 0.98 ± 0.03
#Param: 4.8 MHealthy 0.80 ± 0.11 0.58 ± 0.05 0.67 ± 0.06 0.60 ± 0.13
VGG-Segment
Accuracy: 85.1%COVID-19 0.81 ± 0.20 0.86 ± 0.07 0.82 ± 0.13 0.91 ± 0.06
Balanced: 83.9%Pneumonia 0.86 ± 0.08 0.84 ± 0.07 0.85 ± 0.03 0.95 ± 0.04
#Param: 34.0 MHealthy 0.85 ± 0.12 0.86 ± 0.06 0.85 ± 0.08 0.90 ± 0.08
Segment-Enc
Accuracy: 85.7%COVID-19 0.84 ± 0.11 0.89 ± 0.07 0.86 ± 0.07 0.92 ± 0.07
Balanced: 84.4%Pneumonia 0.89 ± 0.04 0.75 ± 0.10 0.81 ± 0.06 0.92 ± 0.03
#Param: 20.0 MHealthy 0.82 ± 0.18 0.90 ± 0.05 0.85 ± 0.12 0.94 ± 0.02
Table 3. Video classification results. The frame-based model VGG-CAM outperforms the 3D CNN Models Genesis in all shown metrics, displaying high accuracy (94%), recall, precision for COVID-19 and pneumonia detection.
ClassRecallPrecisionF1-ScoreSpecificity
VGG
Accuracy: 90%COVID-19 0.90 ± 0.08 0.92 ± 0.07 0.91 ± 0.06 0.96 ± 0.04
Balanced: 90%Pneumonia 0.93 ± 0.10 0.88 ± 0.08 0.90 ± 0.08 0.95 ± 0.04
#Param.: 14.7 MHealthy 0.88 ± 0.06 0.91 ± 0.08 0.89 ± 0.06 0.95 ± 0.05
Models Genesis
Accuracy: 78%COVID-19 0.74 ± 0.17 0.77 ± 0.15 0.75 ± 0.15 0.87 ± 0.11
Balanced: 77%Pneumonia 0.79 ± 0.14 0.80 ± 0.15 0.78 ± 0.11 0.91 ± 0.07
#Param.: 7.6 MHealthy 0.78 ± 0.28 0.79 ± 0.12 0.77 ± 0.22 0.88 ± 0.08
Publisher’s Note: MDPI stays neutral with regard to jurisdictional claims in published maps and institutional affiliations.

