Properties of a Lightweight Fly Ash–Slag Alkali-Activated Concrete with Three Strength Grades


1
College of Civil Engineering and Architecture, Guangxi University, Nanning 530004, China
2
Key Laboratory of Disaster Prevention and Structural Safety of Ministry of Education, Nanning 530004, China
3
School of Civil Engineering, Central South University, Changsha 410075, China
4
Department of Civil and Environmental Engineering, The Hong Kong Polytechnic University, Kowloon, Hong Kong 999077, China
*
Author to whom correspondence should be addressed.
Appl. Sci. 2021, 11(2), 766; https://0-doi-org.brum.beds.ac.uk/10.3390/app11020766
Submission received: 24 November 2020
/
Revised: 6 January 2021
/
Accepted: 10 January 2021
/
Published: 14 January 2021
(This article belongs to the Special Issue Advances in High-Performance of Eco-Efficient Concrete)
Abstract
:Lightweight alkali-activated concrete (LAAC) is a type of highly environmentally friendly concrete, which can provide the benefits of both alkali-activated material and lightweight concrete. The study aimed to investigate the influence of different water/solid (W/S) ratios on the properties of normal-weight/lightweight fly ash–slag alkali-activated concrete manufactured at ambient temperature. The relative performance of the alkali-activated concrete (AAC) mixes with limestone and sintered fly ash lightweight aggregates as the coarse aggregates was also compared to the conventional ordinary Portland cement (OPC) concrete mix in terms of their compressive stress–strain relationship, splitting tensile strength and fracture parameters. The morphologies and microstructure of the four types of interfacial transition zones (ITZs) were characterized by scanning electron microscopy (SEM). Results indicated that the AAC had a higher tensile strength, stress intensity factor, brittleness and lower elastic modulus than its cement counterpart. With the decrease in the W/S ratio, the density, compressive and tensile strength, ultrasonic pulse velocity, fracture energy, brittleness and elastic modulus of the AAC increase. However, the influence of the W/S ratio on the mechanical properties of the LAAC with lightweight porous aggregates was less than that of the normal-weight AAC. Predictive models of the splitting tensile strength, fracture energy and elastic modulus of the AAC were also suggested, which were similar to those of the OPC concrete. Furthermore, the microstructure investigation showed that no wall effect occurred in the ITZ of the AAC. The ITZ structure of the hardened AAC was also more compact and uniform than that of the OPC concrete.
1. Introduction
Concrete is the most widely used building material on this planet, which is mainly produced by ordinary Portland cement (OPC), natural aggregates and other components. Cement production needs to consume natural resources and releases large amounts of carbon dioxide (CO2) into the environment. Schneider et al. [1] found the manufacturing process of OPC contributes 5–8% of global greenhouse gas emissions, and the annual worldwide cement production would increase to 4.38 billion tons by 2050 at an annual growth rate of 5%. Alkali-activated concrete (AAC), also known as “geopolymer concrete”, can be manufactured through an activation process between alkaline liquids and materials rich in silica and alumina, such as blast furnace slag powder (BFSP), which is a by-product from the steel making, and fly ash (FA), which is a by-product of coal combustion from coal-fired power plants. It has become a promising green construction material for sustainable development and attracted much attention from the academic field in recent years [2,3]. It was estimated that the use of AAC instead of OPC concrete can help to reduce CO2 emissions by 60% to 80% [4,5,6]. The comparison of mechanical properties and durability between AAC and OPC concrete has been widely reported [7,8,9,10,11], but most of these studies were focused on heat-cured fly ash-based AAC. Recent studies indicated that the combination of high calcium raw materials and low or no calcium raw materials can improve the early strength of the AAC and avoid heat-curing. Nath et al. [8] and Thomas et al. [9] found that a fly ash–slag-based AAC manufactured at room temperature could achieve the same setting time and compressive strength as OPC concrete, and had a higher splitting tensile strength and lower Young’s modulus and Poisson’s ratio. Some studies [12,13] found that the compressive strength of fly ash–slag-based AAC increased with the increase in slag content. A microstructure analysis of AAC indicated that the calcium content available for geopolymerization was closely related to the slag content in binder materials [14,15]. The polymerization of a low-calcium FA with an alkaline activator mainly produced sodium alumino-silicate hydrate gel (the NASH network), while the blended low-calcium FA and BFSP with a high calcium content was polymerized not only to generate the NASH network, but also to form calcium alumino-silicate hydrate gel (the CASH network). Therefore, it can be considered that fly ash–slag-based binder can be used to prepare an AAC with superior mechanical properties at room temperature. Islam et al. [16] and Nabeel et al. [17] investigated the relationships between the engineering properties of AAC and compressive strength, and found that the ultrasonic pulse velocity (UPV) increased with an increase in compressive strength. Some researchers compared the fracture properties between AAC and its cement counterpart, and found that the fracture energy of the AAC increased, whereas its characteristic length decreased with an increase in compressive strength [7,18,19,20].
The application of lightweight aggregates in structural concrete is an important development in concrete construction. The structural lightweight concrete has the advantages of a light self-weight, good heat insulation performance and high fire resistance; thus, it is very appealing, especially in the production of the smaller and lighter precast concrete members used in high-rise buildings. Sintered fly ash aggregate is an artificial lightweight aggregate that is produced by expanding the pulverized fuel ash at approximately 1200–1300 °C in a rotary kiln. The particle shape of the sintered fly ash aggregate is mainly spherical, with a dense outer shell and highly porous inner structure. A lightweight ordinary Portland cement concrete (LOPC) containing sintered fly ash aggregate has been recently studied in some research [21,22]. However, research on the lightweight alkali-activated concrete (LAAC) containing sintered fly ash aggregate as the structural materials is very limited. Junaid et al. [23] compared the uniaxial compressive behavior of a low-calcium fly ash-based AAC using two kinds of aggregates: normal-weight natural aggregates and non-pelletized lightweight fly ash aggregates. They found that the established relationship between the elastic modulus, strength and density for OPC concrete was not suitable for AAC and the stress–strain models for OPC concrete should be further modified to predict the behavior of the fly ash-based LAAC. Yang et al. [24] found that the compressive strength of the slag-based LAAC slightly improved with the increase in water and binder content with a fixed water/solid (W/S) ratio. However, the mechanical and fracture properties of the structural LAAC with a different strength class has not been investigated yet. Therefore, the mechanical and fracture properties of LAAC are still inadequately defined, requiring further research.
From the above literature review, it can be concluded that LAAC is a highly environmentally friendly concrete, which not only offer some valuable merits, such as recycling industrial by-products, reducing greenhouse gas emissions and natural resource exploitation and protecting the ecological environment, but also has similar merits than lightweight cement concrete. Therefore, this kind of concrete is worth popularizing in engineering applications. This study evaluated the compressive behavior, splitting tensile strength, modulus of elasticity, Poisson’s ratio, stress–strain curve and fracture properties for normal-weight alkali-activated concrete (NAAC) with limestone aggregates and LAAC with sintered fly ash aggregates, and the results were compared with the typical behavior of the corresponding OPC concrete. The effects of strength class on the properties of the NAAC and LAAC were also investigated.
2. Experimental Program
2.1. Materials and Sample Preparation
FA, BFSP and Portland cement were utilized as the binder materials here. The CEM I 42.5 R-type cement, complying with Chinese standard GB/T 175-2007 [25], which has a 28-day strength of 46.7 MPa, was used for making the OPC concrete. Table 1 depicted the chemical compositions and physical properties of the binder materials. In this study, two kinds of coarse aggregates were used: lightweight sintered fly ash aggregates, which was used as the coarse aggregate for the LOPC and LAAC, and conventional limestone aggregates, which were employed as the coarse aggregate for the normal-weight ordinary Portland cement concrete (NOPC) and NAAC.
Natural river sand with a fineness modulus of 2.4 was used as fine aggregates for all concrete mixtures. The particle size range, fineness modulus, specific gravity, water absorption, aggregate crushing value and cylinder compressive strength of the different aggregates were determined according to GB/T 17431-1998 [26] and listed in Table 2.
The alkali activator solution was prepared by dissolving sodium hydroxide (SH) pellets of 99% purity in a sodium silicate (SS) solution plus additional water and retained for 24 h before use. The chemical composition of the Na2SiO3 solution, as provided by the supplier, refers to the presence of 13.6% Na2O, 29.9% SiO2 and 56.5% water by mass. The specific gravity and the modulus of the Na2SiO3 solution is 1.35 and 3.0, respectively. Drinking tap water was used in all the concrete mixing, and a poly-carboxylic-type superplasticizer (SP) with a specific gravity of 1.18 and pH value of about 7 was used in the LOPC and LAAC mixtures to achieve the required workability.
The main purpose of this study is to investigate the effect of the concrete and binder types on the mechanical and fracture properties of concrete. The water/binder (W/B) ratio by weight for the control group with the OPC binder was fixed at 0.48 (NOPC) and 0.30 (LOPC), respectively. A lower water/binder ratio was adopted for the OPC-based lightweight aggregate concrete because a higher water/binder ratio will result in floating and segregation of the lightweight aggregates (LWAs) in the vibration process. In the investigation of LOPC, the trial and error methods of modifying the SP dosage were employed until the required slump value was achieved. The term water/solid (W/S) ratio in AAC is defined as the ratio of the total mass of water in the mixture to the sum of the mass of the blended FA–BFSP binder material and SH and SS solids. The strength of the AAC and its cement counterpart depends on the W/S ratio and W/B ratio respectively. With reference to the standards [27] and the technical specification for lightweight aggregate concrete [28], three strength grades of NAAC and LAAC were prepared by combining the loose volume method and trial blending method. Table 3 and Table 4 show the mix designs for the OPC concrete and AAC mixes. From preliminary trial blending tests, the FA–BFSP ratio and SS–SH solution ratio by weight in all the AAC mixes were fixed at about 1.5 and 2.5, respectively. The fine-aggregate to total-aggregate ratio by volume in all the concrete mixes was fixed at about 30%. The AAC was designed to achieve a slump value in the range of 15–22 cm. Therefore, the dosage of SP for each mixture with a different W/S ratio was modified to achieve the specified workability (specified slump value). In addition, the minimum targeted compressive strength of the LAAC of this study was more than 20 MPa, which is suitable for structural concrete members.
At present, there is no test standard for the mixing procedure of AAC, especially for structural-grade lightweight AAC. Here, the AAC mixing process begins with submerging the coarse aggregate in SS solution for 30 min, and then allowing the excess solution be discharged for about 10 min to prevent bonding the coarse aggregate particles into clusters. Thereafter, the coarse and fine aggregates were mixed with the binder material for about 2 min. Then the alkaline activator solution was added, including the former excess draining the SS solution, and mixed for another 1 min. Finally, the superplasticizer was added into the residual water, stirring the concrete again for 2 min until the mixture is uniform. All the AACs were infilled steel molds and vibrated on a shaking table for approximately 8 s. It is noted that the water glass treatment of the LWA in the casting procedure of the AAC can help to improve the quality of the LWA particle by reducing water absorption and increasing strength.
For each mixture, three 100 mm × 100 mm × 100 mm cubes, three 100 mm × 100 mm × 300 mm prisms and three 100 mm × 100 mm × 400 mm prisms were cast in steel molds. After 24 h, all the samples were demolded and placed into the curing room until the test day. The curing temperature was 25 ± 5 centigrade degrees, and the relative humidity was 50–55%.
2.2. Test Methods
The slump test of the fresh concretes was conducted according to the Chinese standard GB/T 50080-2016 [29]. After 28 days of standard curing, according to the test method prescribed by [28], the apparent wet density and dry density of all the concretes were measured with small cubes (100 mm × 100 mm × 100 mm). For the apparent wet density, the samples were directly measured on a dry surface in air. Before the dry density measurement, the sample was placed into an oven at 105 centigrade degrees until there was no more weight loss. Then, the dry density of the sample was calculated by measuring the weight and volume when the sample was cooled to room temperature under dry conditions. Ultrasonic pulse velocity (UPV) on the cube sample with the size of 100 mm × 100 mm × 100 mm was measured at 28 days using a PUNDIT (Portable Non-Destructive Indicating Tester) in accordance with ASTM C597-1640 (2009) [30]. A pair of transducers of 50 mm in diameter was performed across the cube at a frequency of 54 kHz, one as a transmitter and the other as a receiver. Since the moisture content of the concrete had an obvious effect on the UPV measurements, all samples were tested under the same saturated surface dry conditions to evaluate the measuring results of the different mixtures.
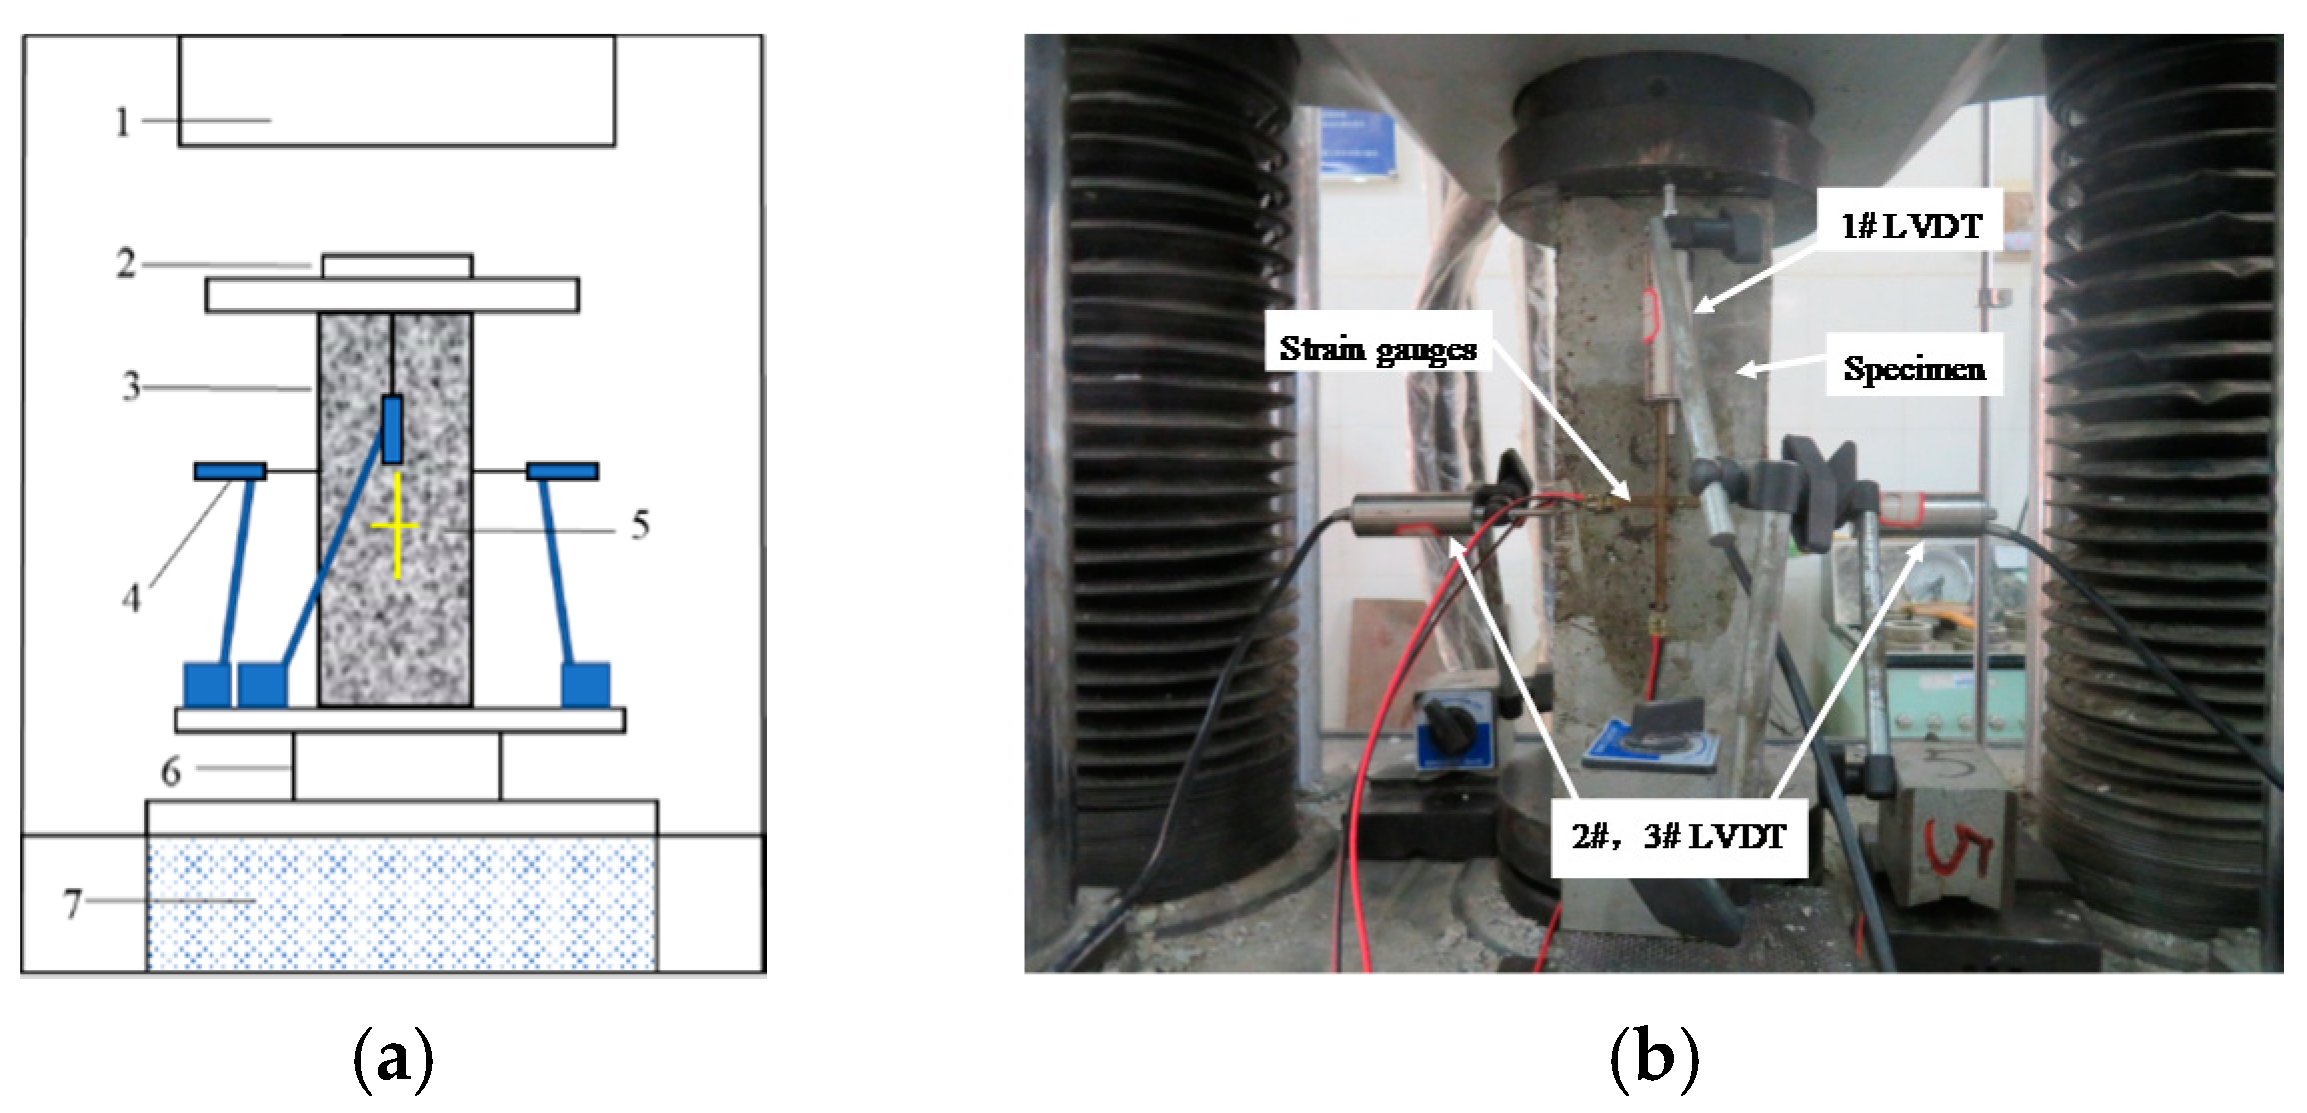
In line with the Chinese standard GB/T50081-2002 [31], the compressive stress–strain relationship tests were carried out with prismatic specimens. The form and size of these specimens were described above. Uniaxial compression tests in this study were performed on a HUALONG (Jinan, China) WAW-800 servo hydraulic testing machine. The maximum loading scope of the testing machine is 800 kN, the precision is 0.0015 kN and the loading rate ranges from 0.01 mm/min to 10 mm/min. Details of the test setup and measuring instruments are shown in Figure 1. Two linear variable differential transformers were placed vertically on two opposite sides of the specimen to measure the axial (vertical) displacement, which were labelled as “1#LVDT”. The 2# and 3# LVDTs were placed horizontally to monitor lateral displacement during loading. In the meantime, the axial and lateral strains of the control, NAAC and LAAC were also measured by the strain gauges, and Figure 1 also gives the arrangement of the strain gauges. The load was measured with a load sensor mounted on the top of the specimen. The load, strains, axial and lateral deformation of the specimens were collected and recorded by a Donghua-602 (Liyang, China) fully automatic data acquisition instrument, which has the capacity of record 100 data points per second. All the uniaxial compressive tests were performed at a displacement-controlling rate of 0.1 mm/min and ended when the load descended to 15% of the peak load. The axial deformation referred to in this study is the average value of the vertical LVDT and the axial strain gauges.
The modulus of elasticity, Ec, and Poisson’s ratio, μ, for the different concrete mixtures were also evaluated from the compressive stress–strain curves, as follows:
where ε1 = axial strain equal to 0.00050; σ1 = stress corresponding to ε1; σ2 = stress at the point of a 40% peak load; ε2 = axial strain at the point of a 40% peak load; and εt1 and εt2 = transverse strains corresponding to ε1 and ε2, respectively.
According to [31], the splitting-tension tests were performed on 100 mm × 100 mm × 100 mm cubic specimens for 28 days after casting, using the same testing machine as the compression test. The load was performed at a displacement-controlling rate of 0.1 mm/min. According to the test standard, plywood strips with a width 5 mm were used as the bearing strips at the bottom and top of each splitting specimens. The splitting tensile test was terminated when the specimen had been separated completely into two halves. Using the load-deflection relationship, recorded by a universal testing machine, the peak load of each splitting tensile specimen is obtained, and the splitting tensile strength is calculated according to Equation (3).
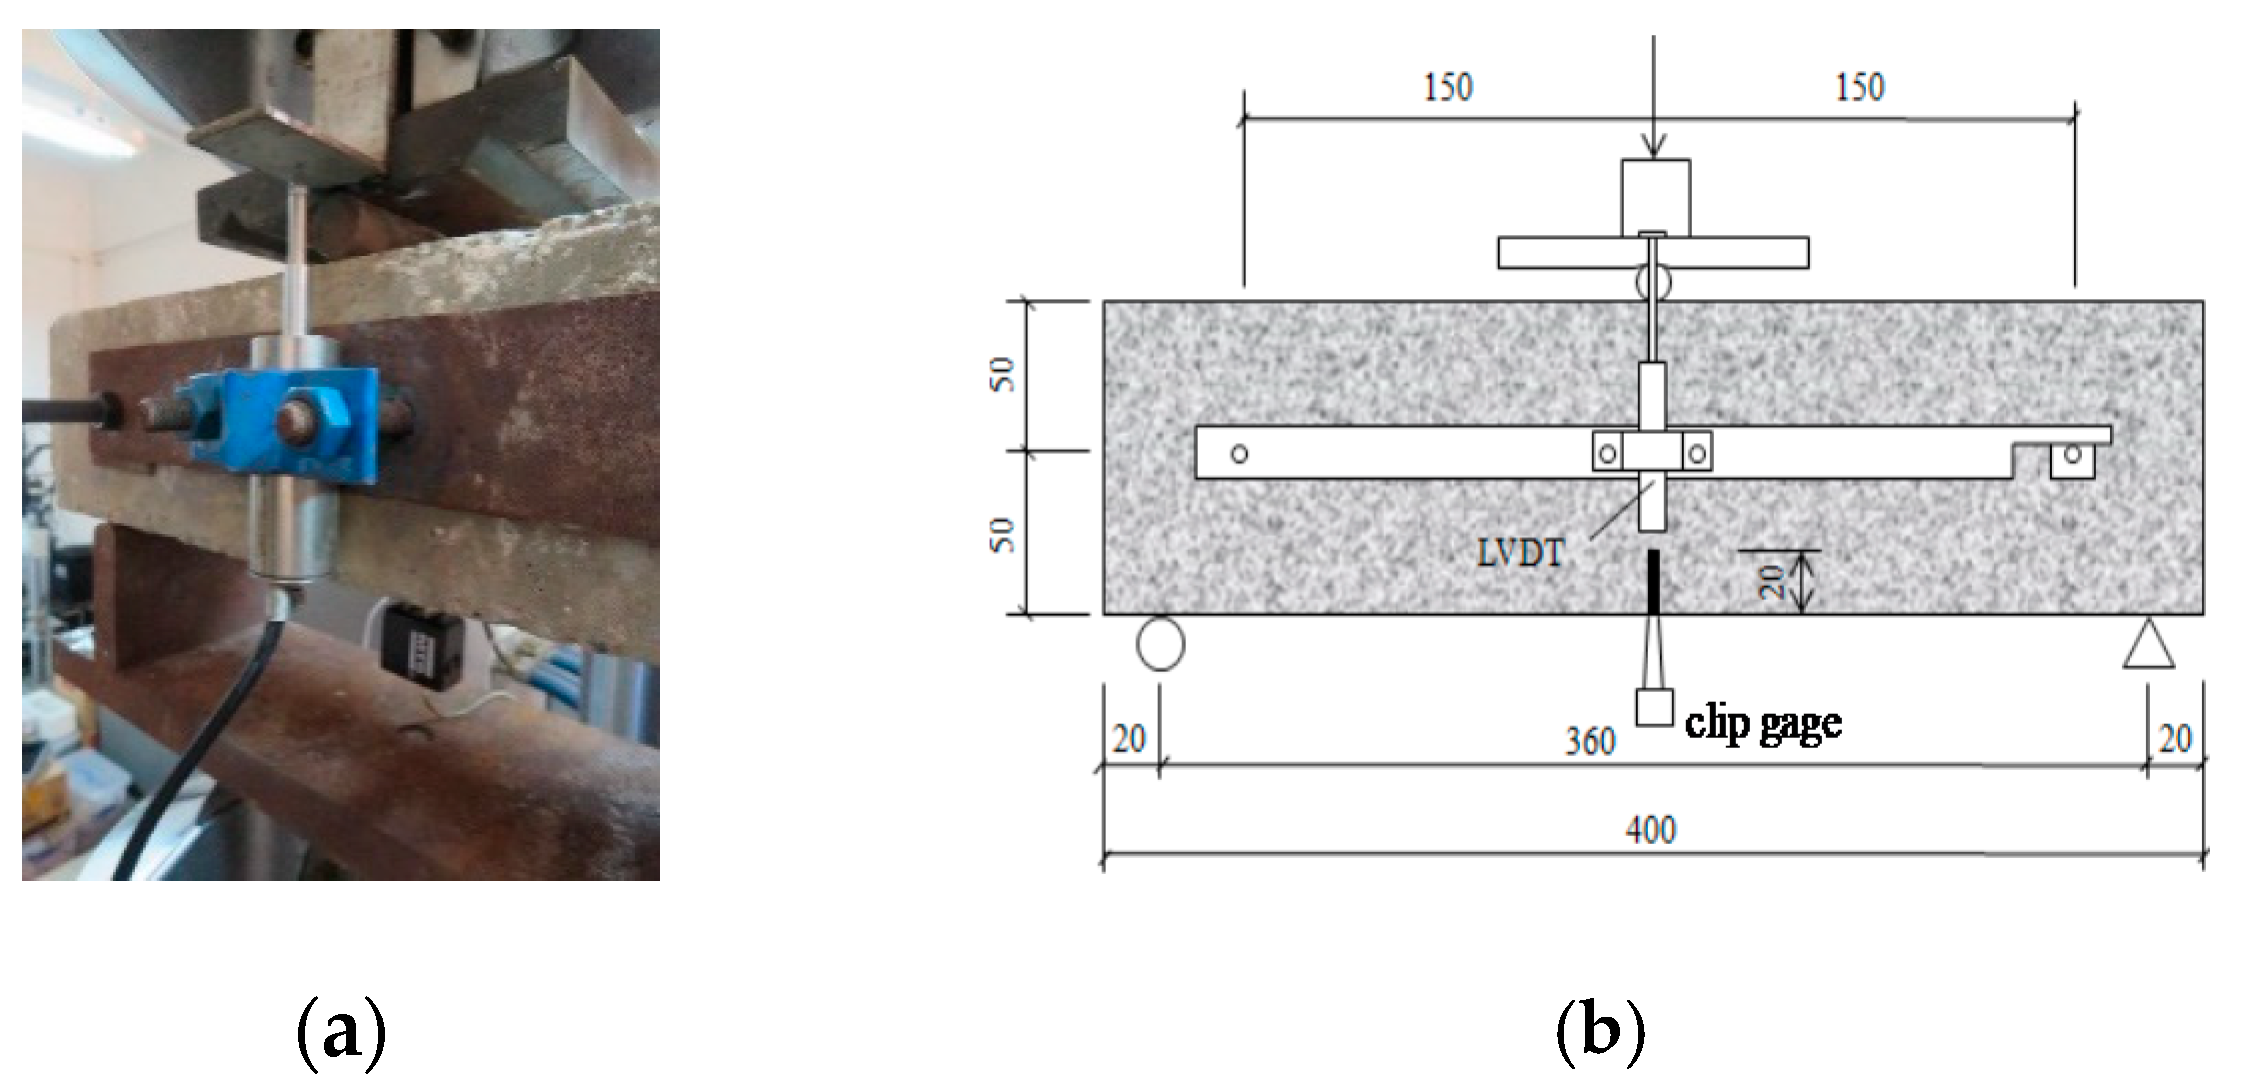
where P = peak load; and l = side length of the cube specimen, i.e., 100 mm. Khalilpour et al. [32] proposed different methods to evaluate the fracture parameters and analyze the crack propagation of concrete materials. The three-point bending test of a single-side notched beam is the most common for its simplicity, as recommended by the RILEM standard [33]. Figure 2 shows the three-point bending setup. As shown in the figure, the size of the small beam used in the test was 100 mm × 100 mm × 400 mm, and the clear span during the bending test was 360 mm. Before testing, according to the EN14651 standard [34], a diamond saw was used to cut a notch with a width of 3 mm and height of 20 mm at the mid-span of the beam. All notched beams were placed on a 300 kN closed-loop servo-hydraulic test machine (MTS809) for the three-point bending test. The specimen was monotonically loaded with a constant CMOD (crack mouth opening displacement) of 0.06 mm/min until the specimen was completely divided into two parts. During testing, the CMOD value was measured by a clamp gauge installed on the notch at the bottom edge of the beam. The midspan displacement of the specimen was measured by two LVDTs with a range of ±2.00 mm on both sides, which were mounted on a light-steel bracket attached to the specimen. The collected data include the mid-span LVDT readings (two readings) and the values of the loading and CMOD. For each mixture, three specimens were tested and the average load-deflection curve and load–CMOD curve were obtained.
2.3. Evaluation of Fracture Parameters
Fracture energy (GF) was the energy absorption per unit area in the crack propagation process determined according to the work calculation method, introduced by RILEM50-FMC [33]. Thus, GF was calculated as follows:
where W0 = area under the load-mid span displacement curve (N-m); m = mass of the beam sample within the clear span (kg); g = gravity acceleration (9.81 m/s2); δ0 = mid span displacement when the beam was completely ruptured (m); B = beam width (m); h = beam depth (m); and a = notch depth (m).
The stress intensity factor was used as an indicator of the crack-tip stress concentration at the at the beginning moment of crack propagation, and the critical stress intensity factor was used to describe the crack resistance of the concrete. According to the ASTM standard E399-90 [35], the mode I fracture toughness KIC of the different concrete mixtures was calculated by using Equation (5).
where P = peak load (N); and L = span length (m).
In order to describe the brittleness of the concrete, Hillerborg (1983) [33] introduced the characteristic length, lch, which was calculated according to Equation (6).
where Ec = elastic modulus of the specimen (GPa); and ft = tensile strength (MPa), which is replaced by the splitting tensile strength fts.
3. Experimental Results
3.1. Slump and Density
Table 5 shows the slump, density, and UPV test results and other mechanical properties of the different concrete mixtures. Each value in the table represent the average of the test results of at least three samples. The workability of the different mixtures measured by the slump test shows that the slump values of the blended fly ash–slag-based AAC (200–270 mm) are much larger than those of OPC concrete (60–90 mm) of the same grade. The reason for the increased slump of the AAC mixtures was that the fly ash replaces the OPC and the spherical-shaped fly ash particles increases the fluidity, thus improving the workability of the concrete [8]. Singh et al. [36] concluded that the rheology of the AAC mixtures was different from that of the OPC mixtures because the liquids used in the AAC had a higher viscosity. Therefore, the traditional measurement standard for the workability level in the OPC mixture was not suitable given the slump and flow test results of the AAC. Even with the same measurement value of slump as the OPC concrete, the workability of AAC was worse than that of its cement concrete counterpart. The literature [37,38] concluded that AAC with a slump value greater than 200 mm had reasonable workability and can be used for casting structural components (such as beams and columns). According to this point of view, the NAAC and LAAC mixtures developed in this study can be used in the fabrication of structural concrete members. As shown in Table 5, the slump value of the LAACs containing sintered fly ash aggregates is in the range of 237–268 mm, which is about 16–20% higher than that of the NAACs (205–223 mm) containing limestone. It may be that the relatively smoother and rounder surface of the lightweight aggregates enhanced the workability of the fresh AAC, compared with the traditional coarse aggregate containing more edges and corners.
The results show that the average dry density of the NAAC mixture ranged from 2351 to 2400 kg/m3 at 28 days, which was completely within the normal-weight concrete scope of 2155–2560 kg/m3, specified in the ACI building code [39]. According to JGJ12-2006 [40], the concrete with an oven dry density of less than 2000 kg/m3 and 28 days compressive strength greater than 20 MPa can be used as structural lightweight concrete. All the LOPC and LAAC mixtures list in Table 5 meet the requirements for structural lightweight concrete.
3.2. Uniaxial Compression
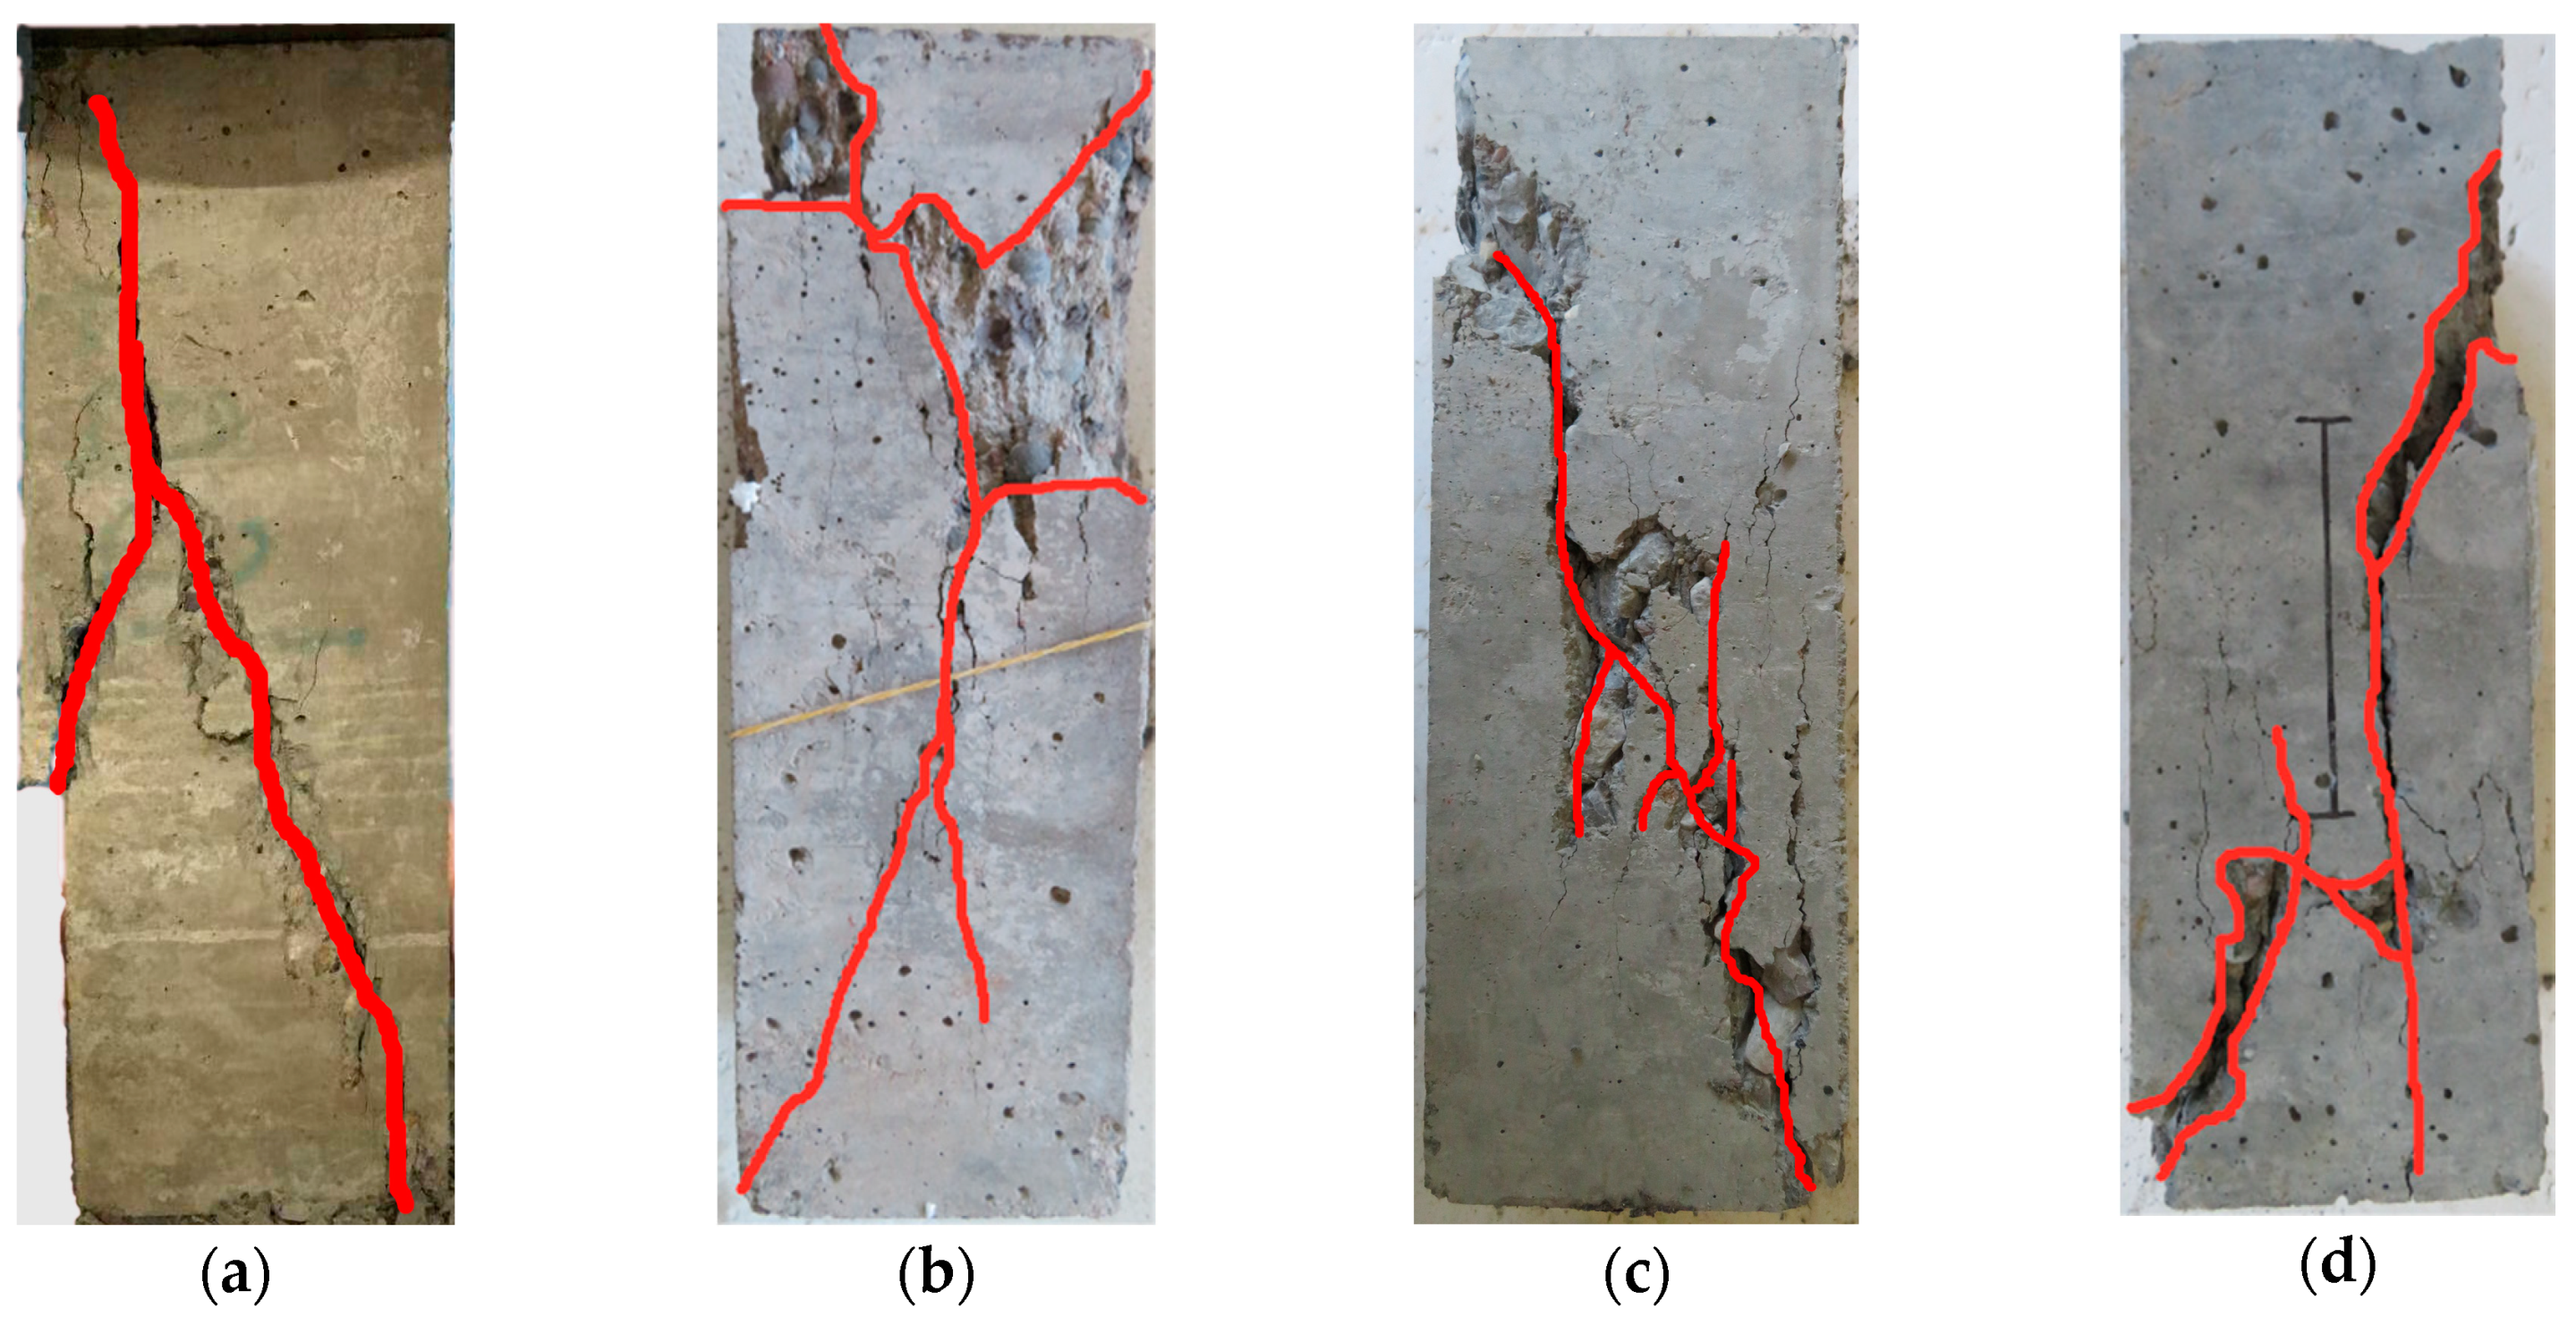
The failure characteristics of the OPC and AAC specimens were similar, which were inclined shear failure. The typical failure patterns are illustrated in Figure 3. The strength grade and coarse aggregate type had no obvious effect on the failure modes for AAC.
The stress–strain curves of all mixtures under axial compression are shown in Figure 4, in which the positive strain is the axial compressive strain and the negative one is the tensile strain in the transverse direction. Figure 4a demonstrated that the fly ash–BFSP-based NAAC and LAAC manufactured at ambient temperature exhibit a faster stress drop during the post-peak branch. This demonstrates that the compressive toughness is lower than that of the OPC concrete. However, the whole σ-ε curve of FA–BFSP-based NAAC and LAAC was not much different from that of corresponding OPC concretes. Previous findings [41] indicated that the σ-ε behavior of a heat-cured, low-calcium fly ash-based AAC was almost the same as that of a typical heat-cured, high-strength OPC concrete. On the other hand, Thomas et al. [9] confirmed that the stress–strain behavior of a BFSP-based AAC cured at room temperature was obviously different from that of OPC concrete. The BFSP-based AAC exhibited brittle failure in the post-peak branch, while the OPC concrete of the same strength grade displayed a gradual strain softening process following the peak. The high brittleness of the BFSP-based AAC was attributed to a large number of micro-cracks in the internal structure of the alkali-activated BFSP [17]. Figure 4a also shows that the ascending branch of σ-ε curve of the LOPC and LAAC has a more linear segment than that of the NOPC and NAAC, which is consistent with most research findings on lightweight OPC concrete [21,22]. From the above analysis of the test results, it can be concluded that the NAAC and LAAC with sufficient compressive strength and ductility can be produced by mixing fly ash and slag as a binder, and no thermal curing is required.
As mentioned above, the W/S ratio had a significant effect on the peak strength of fly ash–slag AAC. As can be seen from Table 5, the strength of the NAAC increased by 92.7% when the W/S ratio was reduced from 0.29 to 0.21, and the strength of the LAAC increased by 82.7% when the W/S ratio was reduced from 0.26 to 0.18. The peak stress of the LAAC using sintered fly ash aggregates was lower than that of the NAAC using crushed limestone; even the liquid/solid ratio was smaller for the LAAC with a similar grade. This was the same trend as for the LOPC in this study, compared to the NOPC with a similar grade. These trends can be explained by the fact that the strength and stiffness of the LWAs were smaller than those of the NWAs [21,22]. As shown in Figure 4b,c, the strength grades had an obvious effect on the stress–strain behavior of fly ash–slag-based AAC. With the increase in uniaxial compressive strength, the modulus of elasticity (stiffness) and axial strain corresponding to peak stress of NAAC and LAAC increased, and the descending section of the σ-ε curve became steeper, which was common in OPC concrete [42].
The modulus of elasticity and Poisson’s ratio of the OPC concrete mainly depend on the type and volume fraction of the aggregates [43]. In Table 5, the modulus of elasticity of the LOPC and LAAC with a compressive strength grade of 35 MPa was about 35.5% and 20.5% lower than that of the NOPC and NAAC with a similar compressive strength grade, respectively. This can be attributed to the fact that the stiffness of the LWA particles is generally lower than that of the NWA. In addition, compared with the spherical LWA particles, a stronger bond can be established between the NWA with an angular shape and cementitious materials (OPC or alkali-activated mortar).
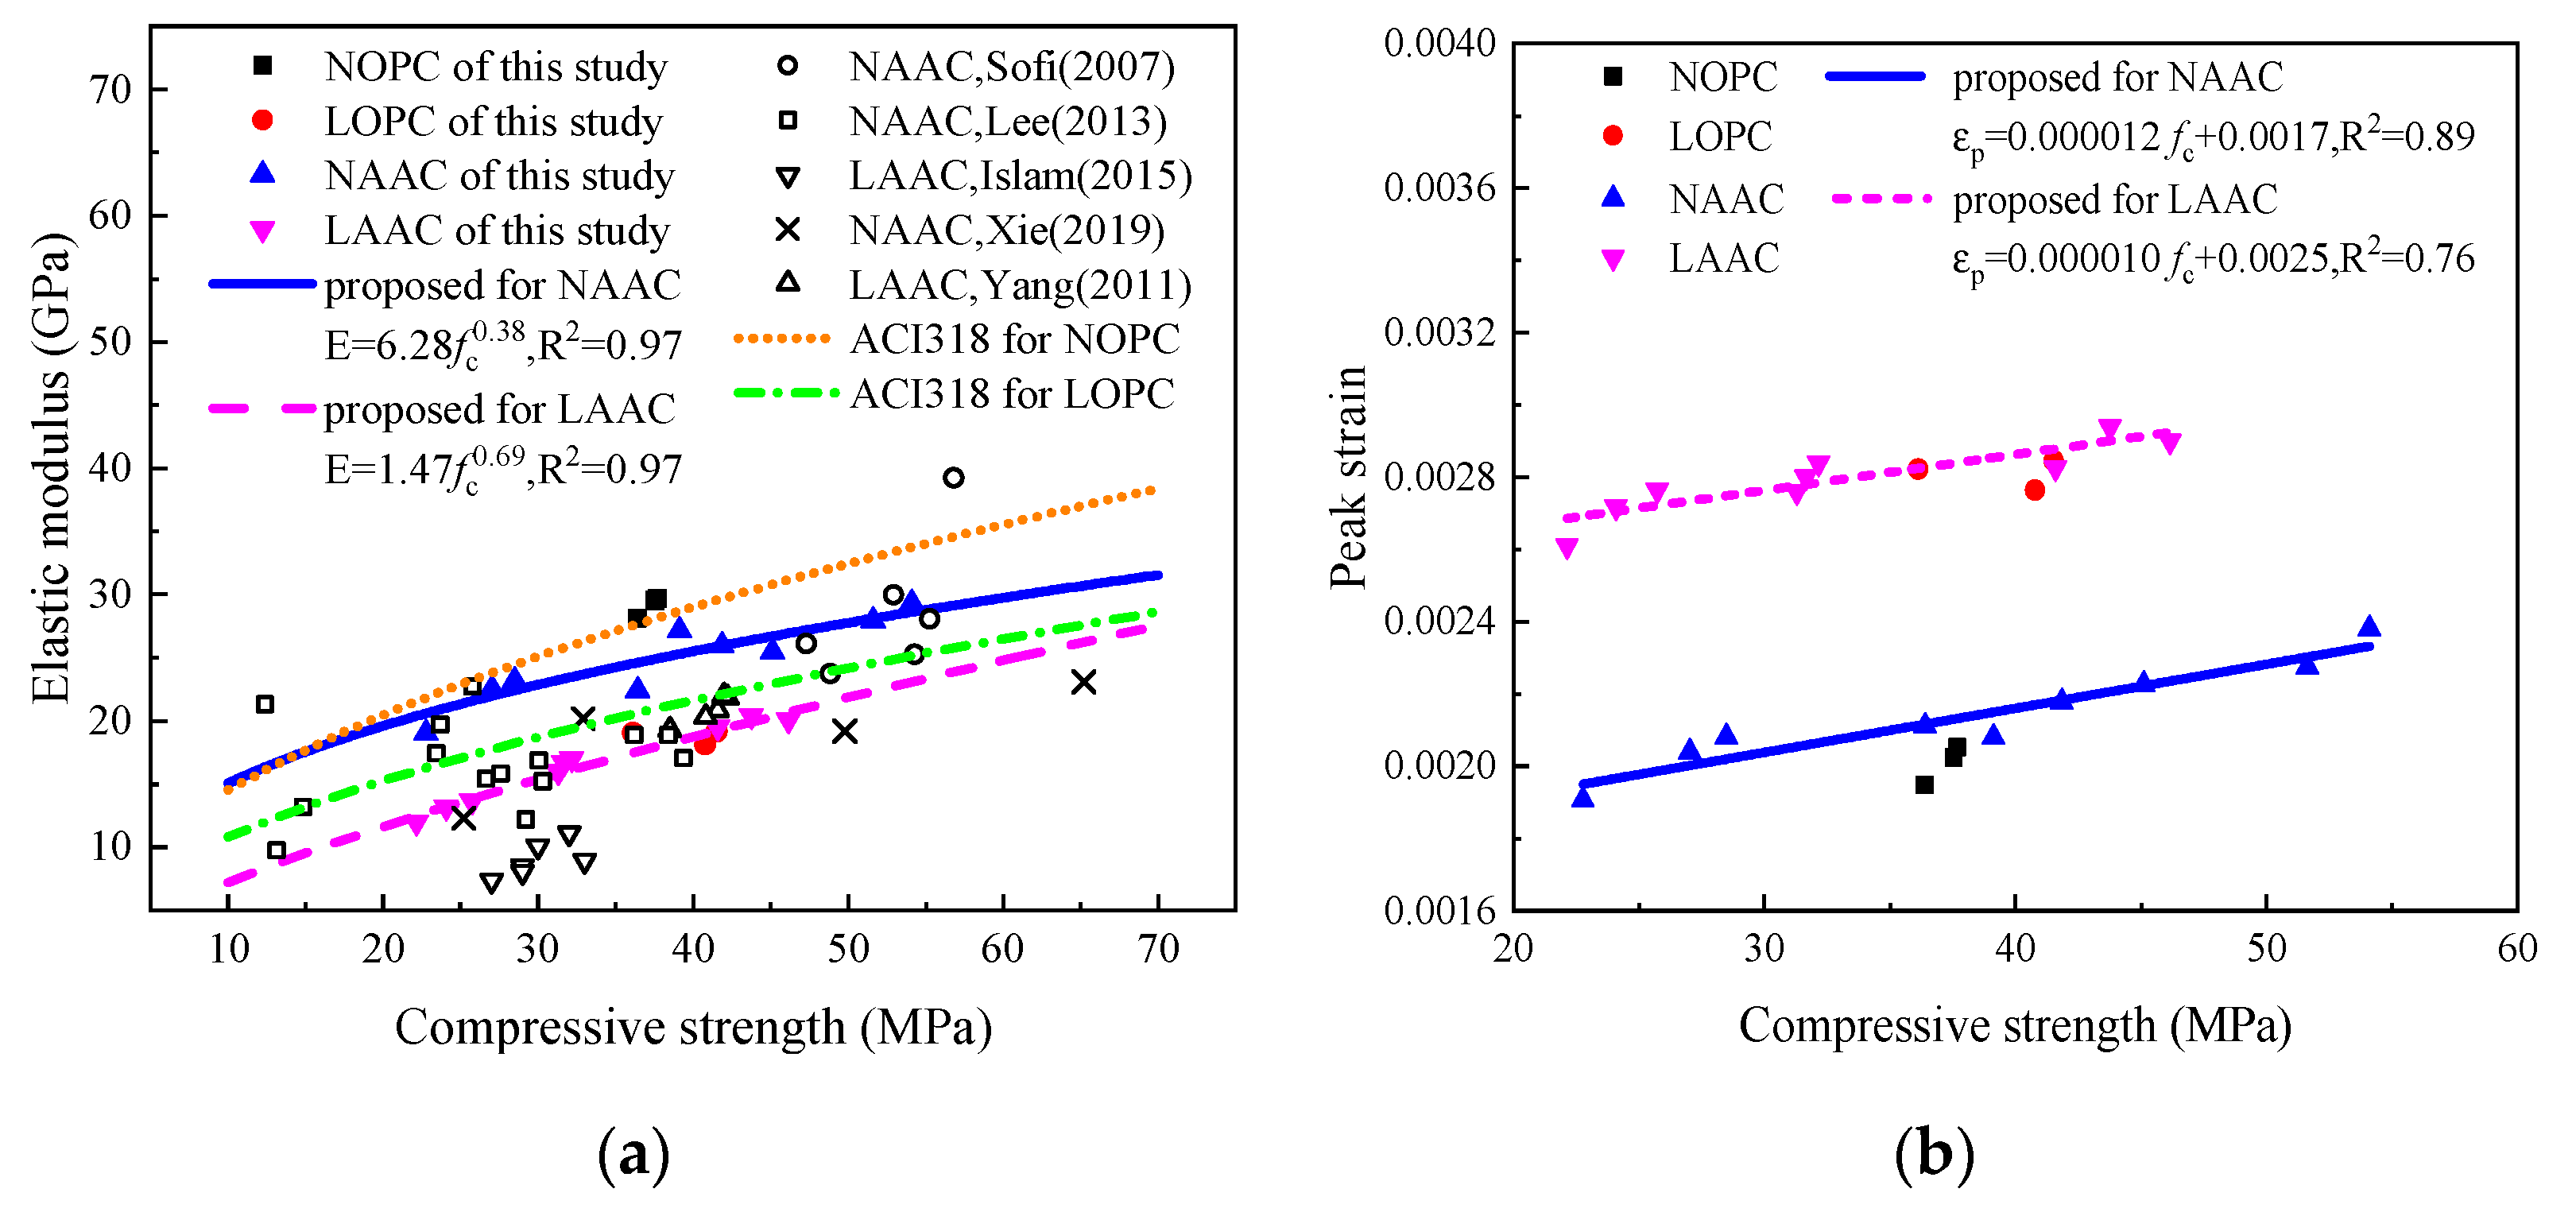
The measured elastic modulus of this study and those from other research [12,16,24,39,44,45] are plotted in Figure 5a, indicating significant differences in the experimental data. This is due to different raw materials, different type and concentration of the alkali activator and the different type and volume fraction of the lightweight aggregate used by the different researchers. However, similar to OPC concrete, the elastic modulus of the AAC increases with the increase in concrete strength grade. The modulus of elasticity of the OPC concrete can be estimated from the ACI 318 code [39] as
where E = modulus of elasticity of the concrete at 28 days (GPa); w = unit weight (kg/m3); and fc = average compressive strength at 28 days (MPa). The experimental values of the elastic modulus for the NAAC varied in the range of 19.03–29.32 GPa, which was below the predicted value of NOPC in ACI building code 318. The experimental values of the elastic modulus for the LAAC vary in the range of 12.0–20.43 GPa, which became close to the predictions for the LOPC of the ACI building code 318 as the compressive strength increases. Based on all the data obtained in this study (containing different aggregates), the following formula was determined to predict the elastic modulus of the fly ash–slag-based AAC:
where both m and n are parameters. The values of (m, n) for the NAAC and LAAC in this study by the least-squares linear regressions were (6.51, 0.368) and (1.31, 0.721), respectively.
As shown in Table 5, the Poisson’s ratio of all the AACs in this study slightly decreased with the increase in strength grades, and the values of Poisson’s ratio for the NAAC and LAAC were very close to the typical value of their cement counterparts with a similar compressive strength. The test results of [44] showed that the range of Poisson ratio of an FA–BFSP-based AAC was between 0.23 and 0.26, which was slightly higher than that of the OPC concrete with normal strength (0.11–0.21). Xie et al. [45] revealed that the Poisson’s ratio of an FA–BFSP-based AAC increased with the increase in BFSP content. Islam et al. [16] reported that the Poisson’s ratio of a palm oil fuel ash–slag-based LAAC was slightly lower than that of NAAC. Due to the limited number of samples in this study, this paper did not attempt to establish a model of the relationship between the Poisson’s ratio and strength class of the NAAC and LAAC.
The peak strains of the AAC with different strength grades are shown in Figure 5b. The axial strain corresponding to the peak stress increased with the strength grades, and the peak strains of the LAAC were higher than those of the NAAC mainly due to the lower Young’s modulus and higher compressibility of the LWAs. The reason for these effects of the strength grade on the peak strains could be attributed to the reducing volume fraction of the aggregates and increasing the content of cementitious material in the AAC of this study. However, Amin et al. [41] pointed out that the peak and ultimate strains of the FA-based AAC under compression decreased as the strength grades increased. Xie et al. [45] also observed that the axial strains corresponding to the peak stress of an FA–BFSP-based AAC decreased with an increase in BFSP content. Therefore, further study is needed on the quantitative relationship between the peak axial strain and compressive strength of AACs with different binder materials and alkali activators.
Because the shape of the σ-ε curve for the fly ash–slag-based AAC was similar to its cement counterpart, the analytical expression adopted by Chinese Code GB/T 50010-2010 [46], for the uniaxial compression of OPC concrete, was used for the AAC in this paper, as shown in Equation (9).
where fc is peak stress; ε0 is peak strain; α is a parameter of ascending branch, and its value is the ratio of initial stiffness and secant modulus at peak stress; and β is a parameter of the descending branch. The fitting of the stress–strain curves for the different groups are also shown in Figure 4b,c. The numerical results show that the compressive constitutive behavior model for the OPC concrete can also be applied to NAAC and LAAC.
3.3. UPV and Splitting Tensile Strength
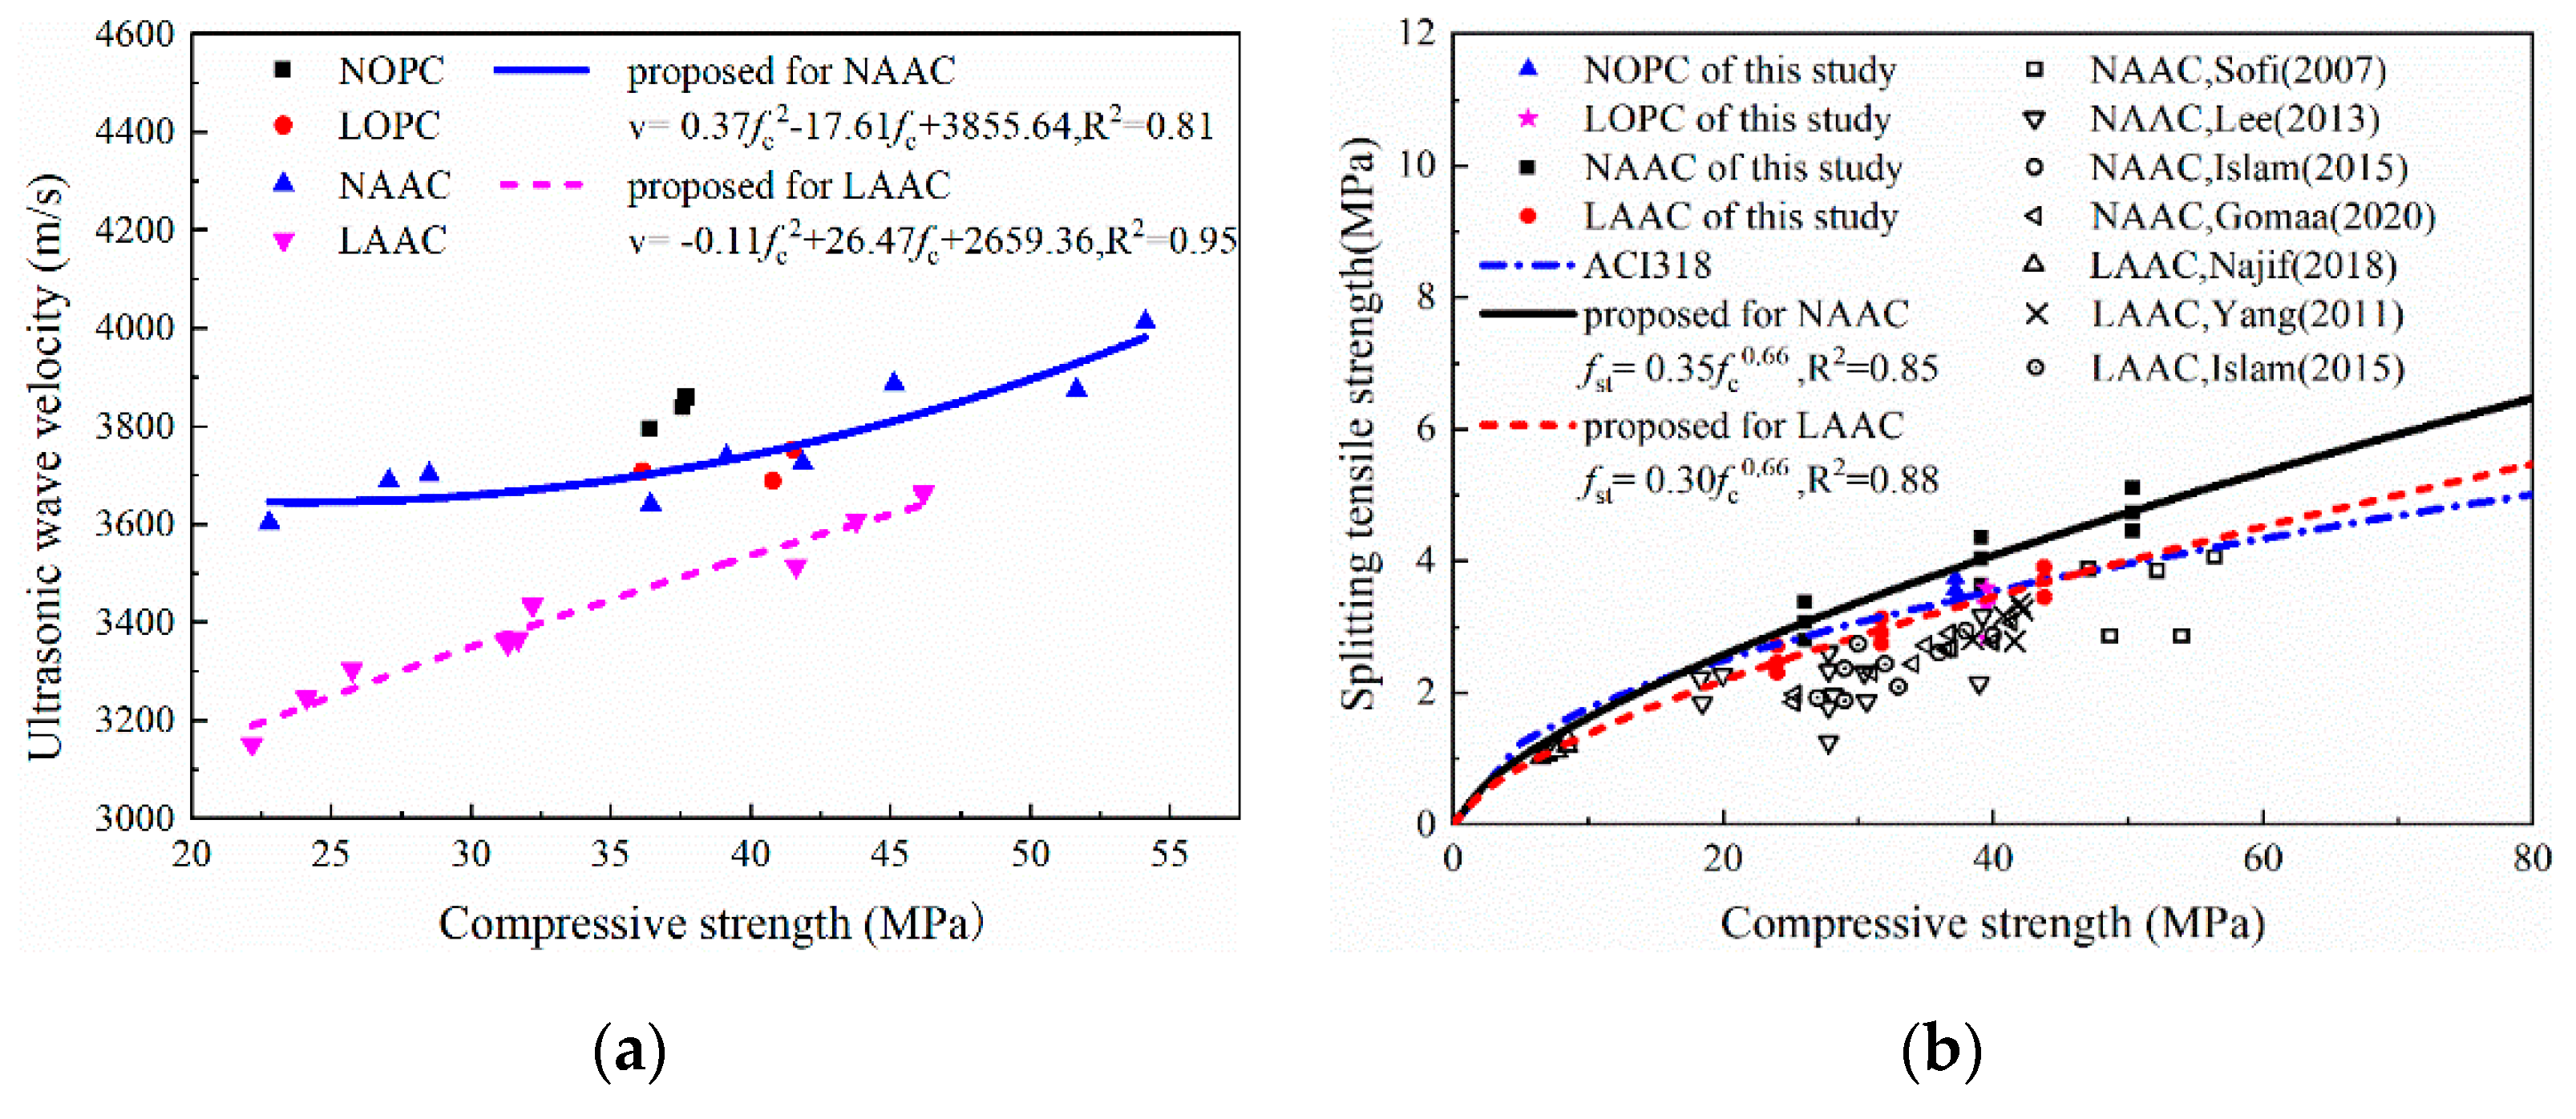
The 28-day UPV of the NOPC and NAAC, using normal-weight aggregate (NWA) ranges between 3.66 and 3.92 km/s (Table 5), indicate that the concrete quality is “good”. Since the 28-day UPV of the LAAC-3 and LOPC concrete ranged from 3.60 to 3.72 km/s, they can also be categorized as “good” quality concrete; while the 28-day UPV of the LAAC-1 and LAAC-2 concrete ranged between 3.23 and 3.39 km/s, which indicated that the quality of these two kinds of concrete was “medium” [30]. Nabeel et al. [17] reported that the 28-day UPV of an NOPC, fly ash-based AAC and slag-based AAC with a compressive strength of 35MPa was 3.52 km/s, 3.20 km/s and 3.31 km/s, respectively; while the 28-day UPV of the NOPC, fly ash-based AAC and slag-based AAC with a compressive strength of 65 MPa was 4.15 km/s, 3.93 km/s and 3.98 km/s, respectively. Islam et al. [16] reported that the 28-day UPV of palm oil fuel ash–slag-based NAAC with NWA (the compressive strength is 37–42 MPa) ranged between 3.51 and 3.76 km/s; while the 28-day UPV of palm oil fuel ash–slag-based LAAC using the oil palm shell LWA (the compressive strength is about 29–33 MPa) was between 3.19 and 3.48 km/s. The measured values of UPV of all kinds of concrete in this study are shown in Figure 6a, which indicated that the UPV of the NAAC and LAAC increased as the compressive strength increased. For the NAAC in this investigation, the average UPV increased by 107 m/s for each 10 MPa increase in compressive strength, while for the LAAC, the average UPV increased by 182 m/s for each 10 MPa increase in compressive strength. The ultrasonic pulse velocity (UPV) of the NAAC and LAAC was lower than that of the NOPC and LOPC with a similar compressive strength, which indicated that more internal voids exist in the AAC compared to its cement counterpart.
Figure 6b illustrates the measured values of the splitting tensile strength for all kinds of concrete used in this study and in previous studies. Table 5 and Figure 6b demonstrate that the splitting tensile strength of all the AACs increased with the compressive strength, and NAAC and LAAC achieved a higher splitting tensile strength than their cement counterparts with a similar compressive strength. ASTM C330/C330M-2014 specified that the splitting tensile strength of the structural grade lightweight aggregate concrete should be more than 2.0 MPa. All mixes in this study meet the minimum requirements of a structural lightweight aggregate concrete. In this study, the tensile/compressive strength ratio of the NAAC ranged from 9.47% to 11.80%, while that of the LAAC ranged from 8.42% to 10.46%, which was slightly lower than that of the NAAC. This may be due to the weaker stiffness of the spherical LWA particles used in LAAC than that of NWA used in the NAAC. Fang et al. [13] reported that the tensile strength of an FA-based AAC increased significantly when 10% to 30% BFSP was added to the AAC matrix. Sofi et al. [39] found that their measured splitting tensile strengths of an FA–BFSP-based AAC were mostly lower than the predictions of ACI building code 318 [39]. Lee et al. [12] found that their measured splitting tensile strengths of an FA–BFSP-based AAC were slightly lower than those obtained by [39]. Imasil et al. [47] reported the measured splitting tensile strengths of an FA–BFSP-based LAAC, using expanded clay LWAs with a 28-day compressive strength of 6.5–8.5 MPa, ranged from 1.02 MPa to 1.30 MPa, which were in good agreement with the predictions of ACI 318-08 code [39]. Gomaa et al. [48] investigated the FA-based high early strength AAC, and found that the measured splitting tensile strengths were lower than the prediction of ACI building code 318 [39]. Yang et al. [24] reported that the measured splitting tensile strengths of a slag-based LAAC (the compressive strengths were about 38.5–42 MPa), using expanded clay LWAs, varied in the range of 2.81–3.35 MPa, which were higher than the splitting strengths of LOPC with the same density and strength grade. Islam et al. [16] observed that the 28-day splitting tensile of a palm oil fuel ash–slag-based NAAC with NWAs (the compressive strength was 37–42 MPa) ranged between 2.61 and 2.94 MPa, while the palm oil fuel ash–slag-based LAAC using crushed or uncrushed oil palm shell LWAs (the compressive strength is about 29–33 MPa) had 28-day splitting tensile strengths between 1.88 and 2.94 MPa. In this study (Figure 6b), most of the measured values of the splitting tensile strength of the NAAC were higher than those predicted by the code [39], while most of the measured values of the splitting tensile strength of LAAC are very close to the predicted values of the ACI 318 code. Based on the test data of this study, the following formula for predicting the splitting tensile strength of an FA–BFS-based NAAC and LAAC was proposed:
where u and v are parameters. Through a regression analysis, the value of u and v for NAAC was 0.35 and 0.66, while the value of u and v for LAAC was 0.30 and 0.66. The comparative assessment between the predicted and experimental splitting tensile strength shows good agreement, as shown in Figure 6b. The equations proposed in this study are suitable for the NOPC and NAAC prepared with NWAs, LOPC and LAAC prepared with lightweight sintered fly ash aggregate.
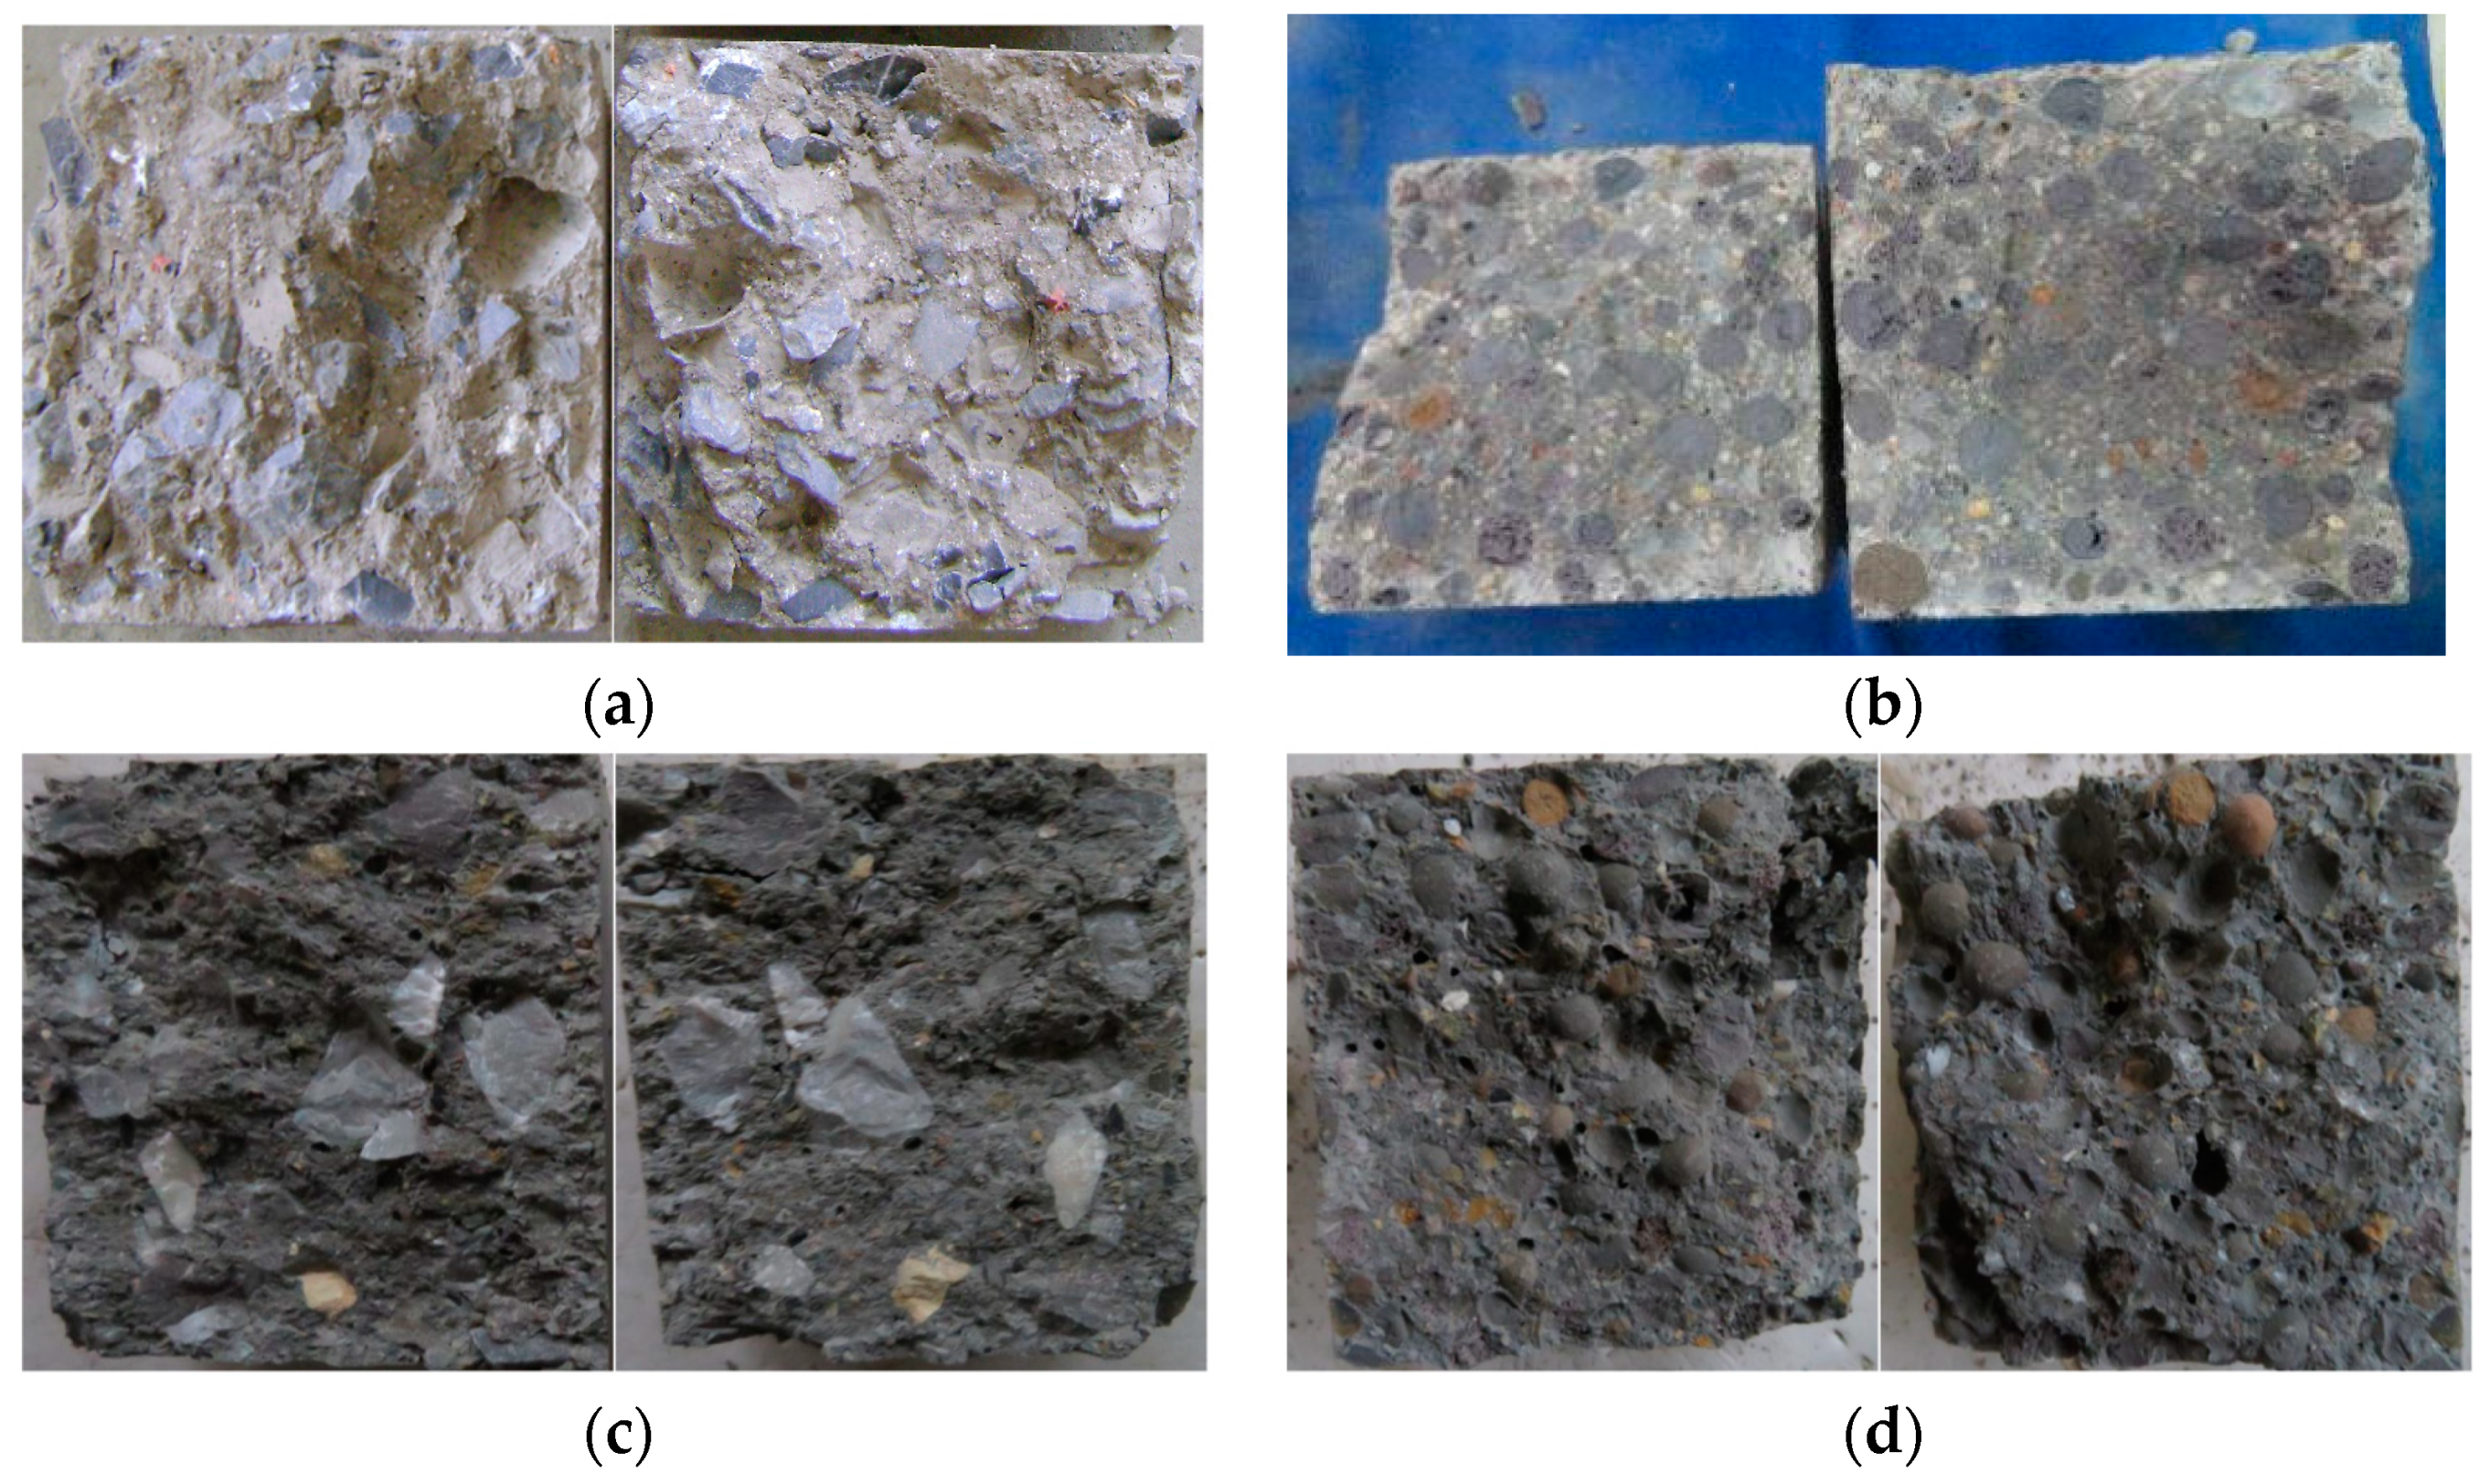
The typical splitting surface of the specimens are shown in Figure 7. The failure modes were almost the same for all types of concretes: the splitting surfaces were flat, and parts of the coarse aggregates were damaged. There were differences: the quantity of the damaged aggregate on the fracture surface of NAAC was larger than that of the corresponding NOPC, while the quantity of damaged aggregate on the fracture surface of LAAC was smaller than that of the corresponding LOPC concrete. The above experimental phenomena were related to the bond strength between the different types of coarse aggregate and different binder materials. The mechanism behind these experimental phenomena needs to be further studied in detail.
3.4. Fracture Properties
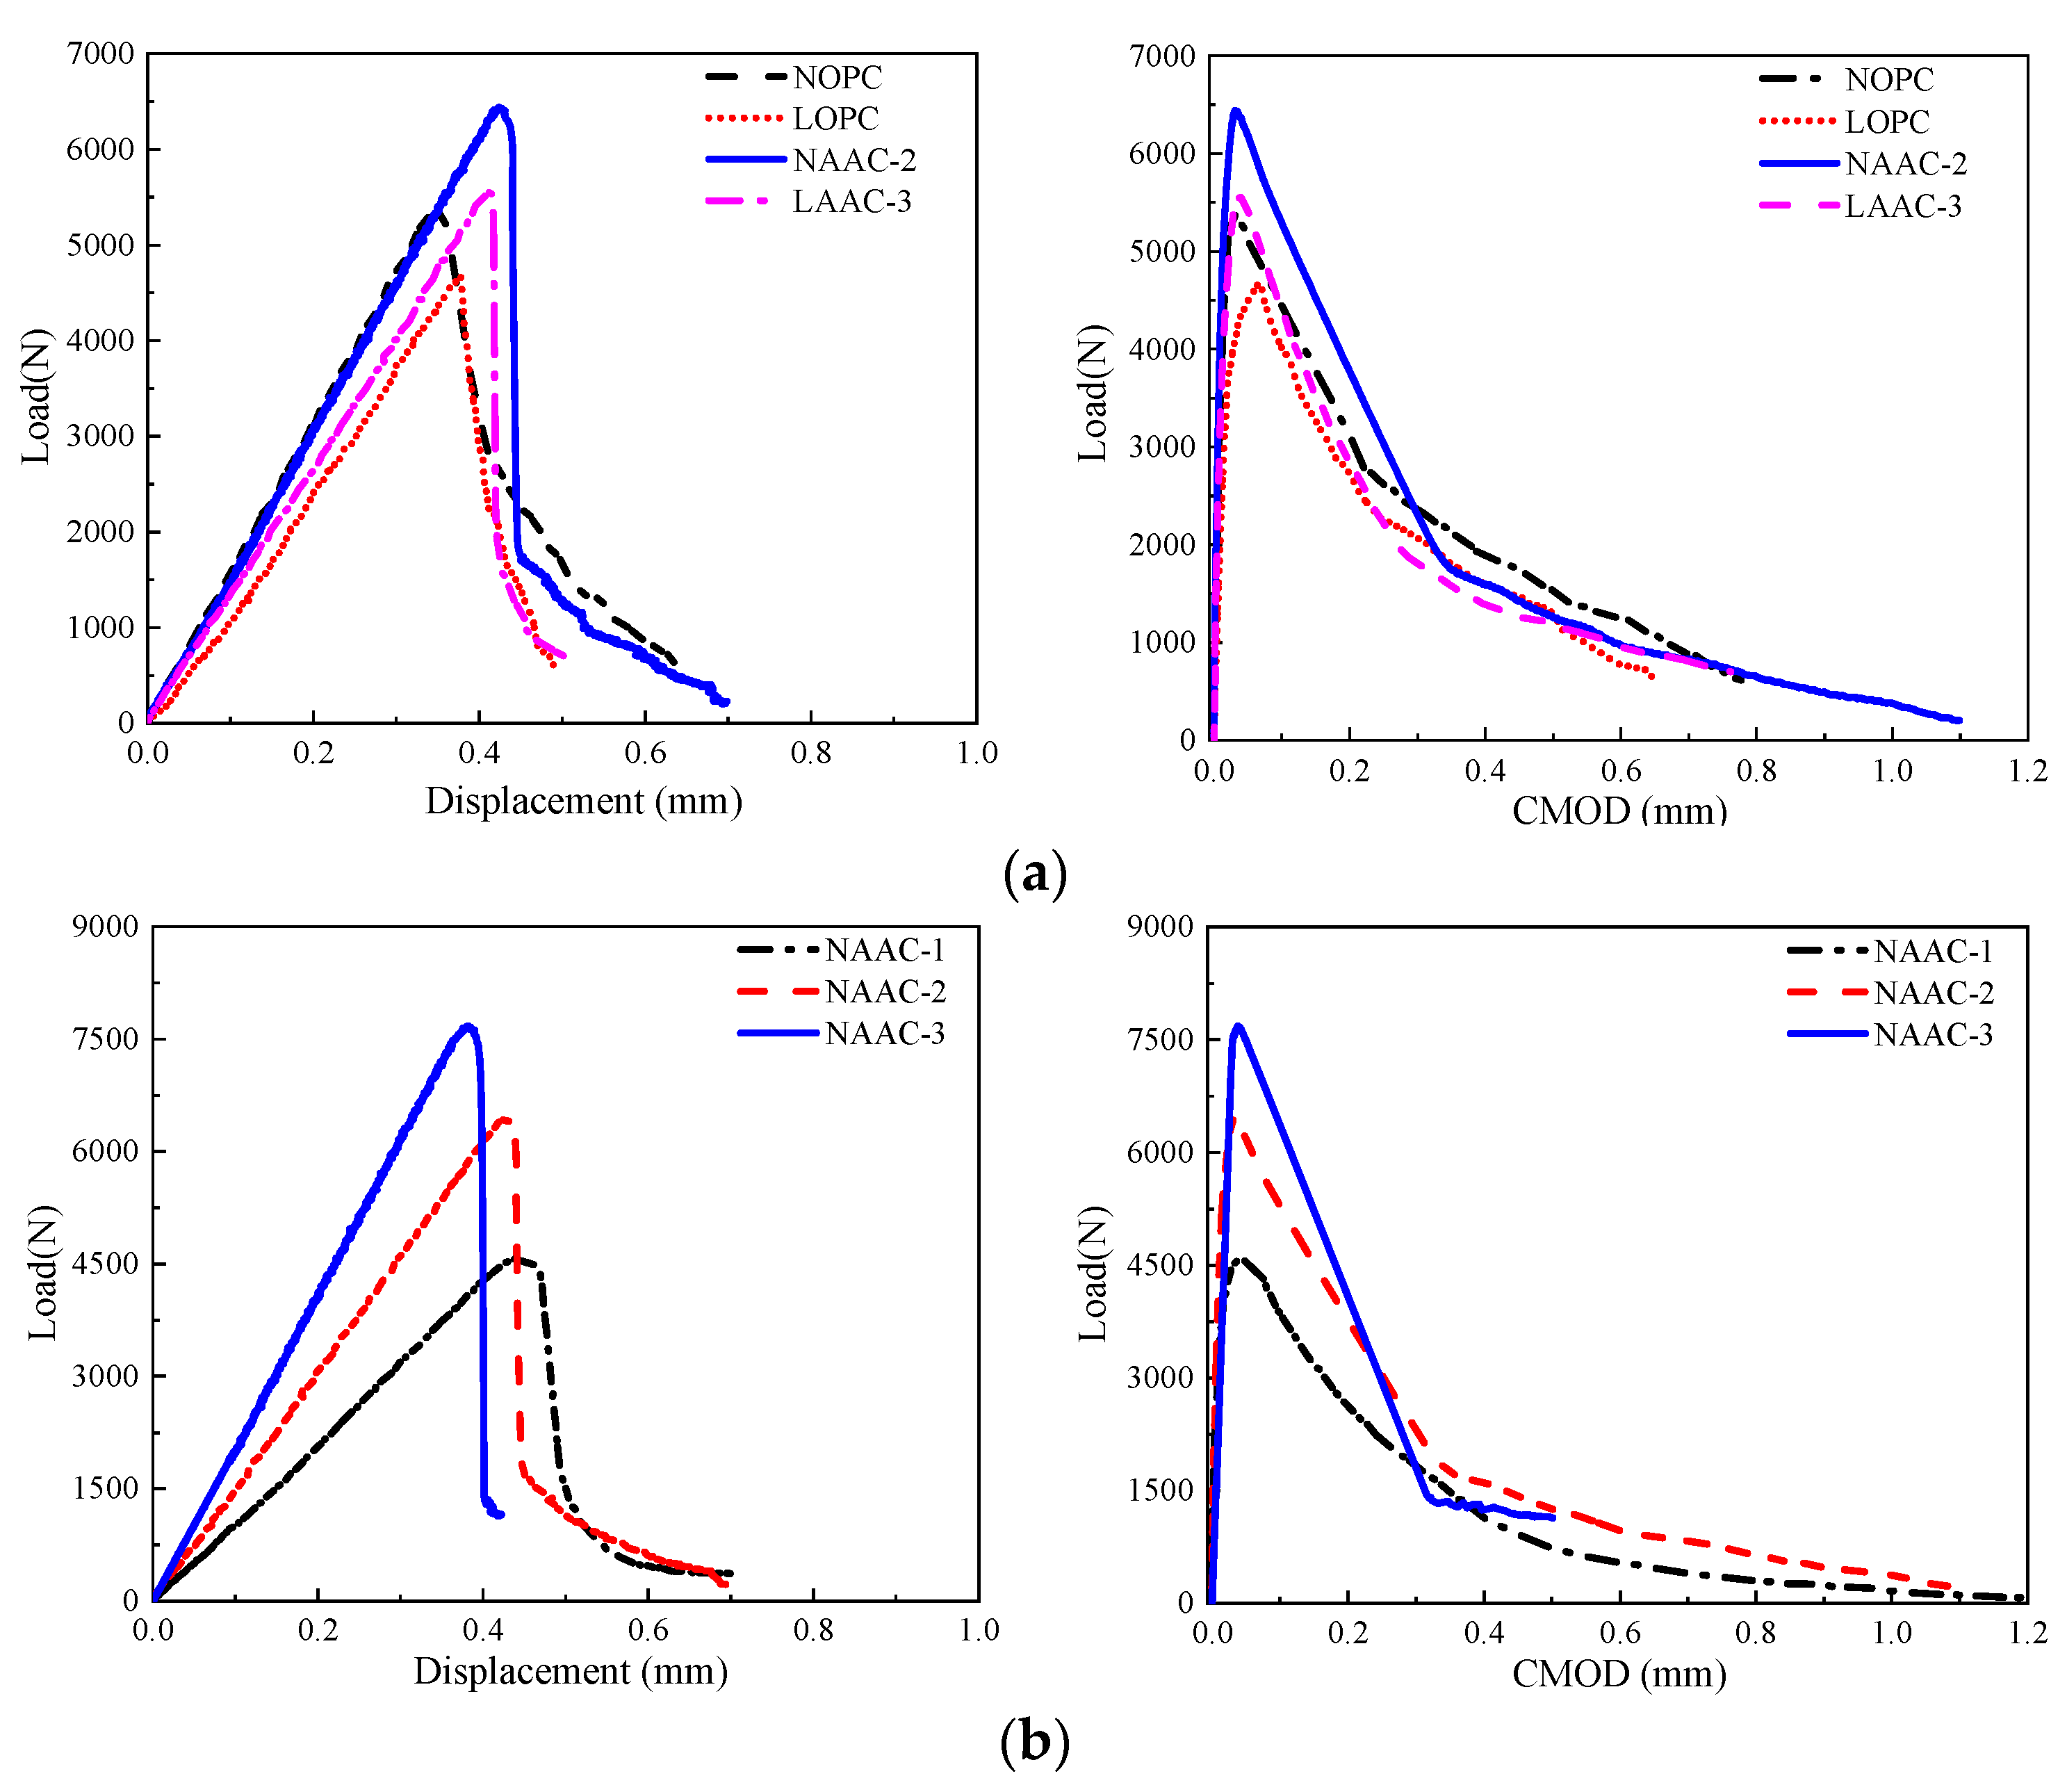
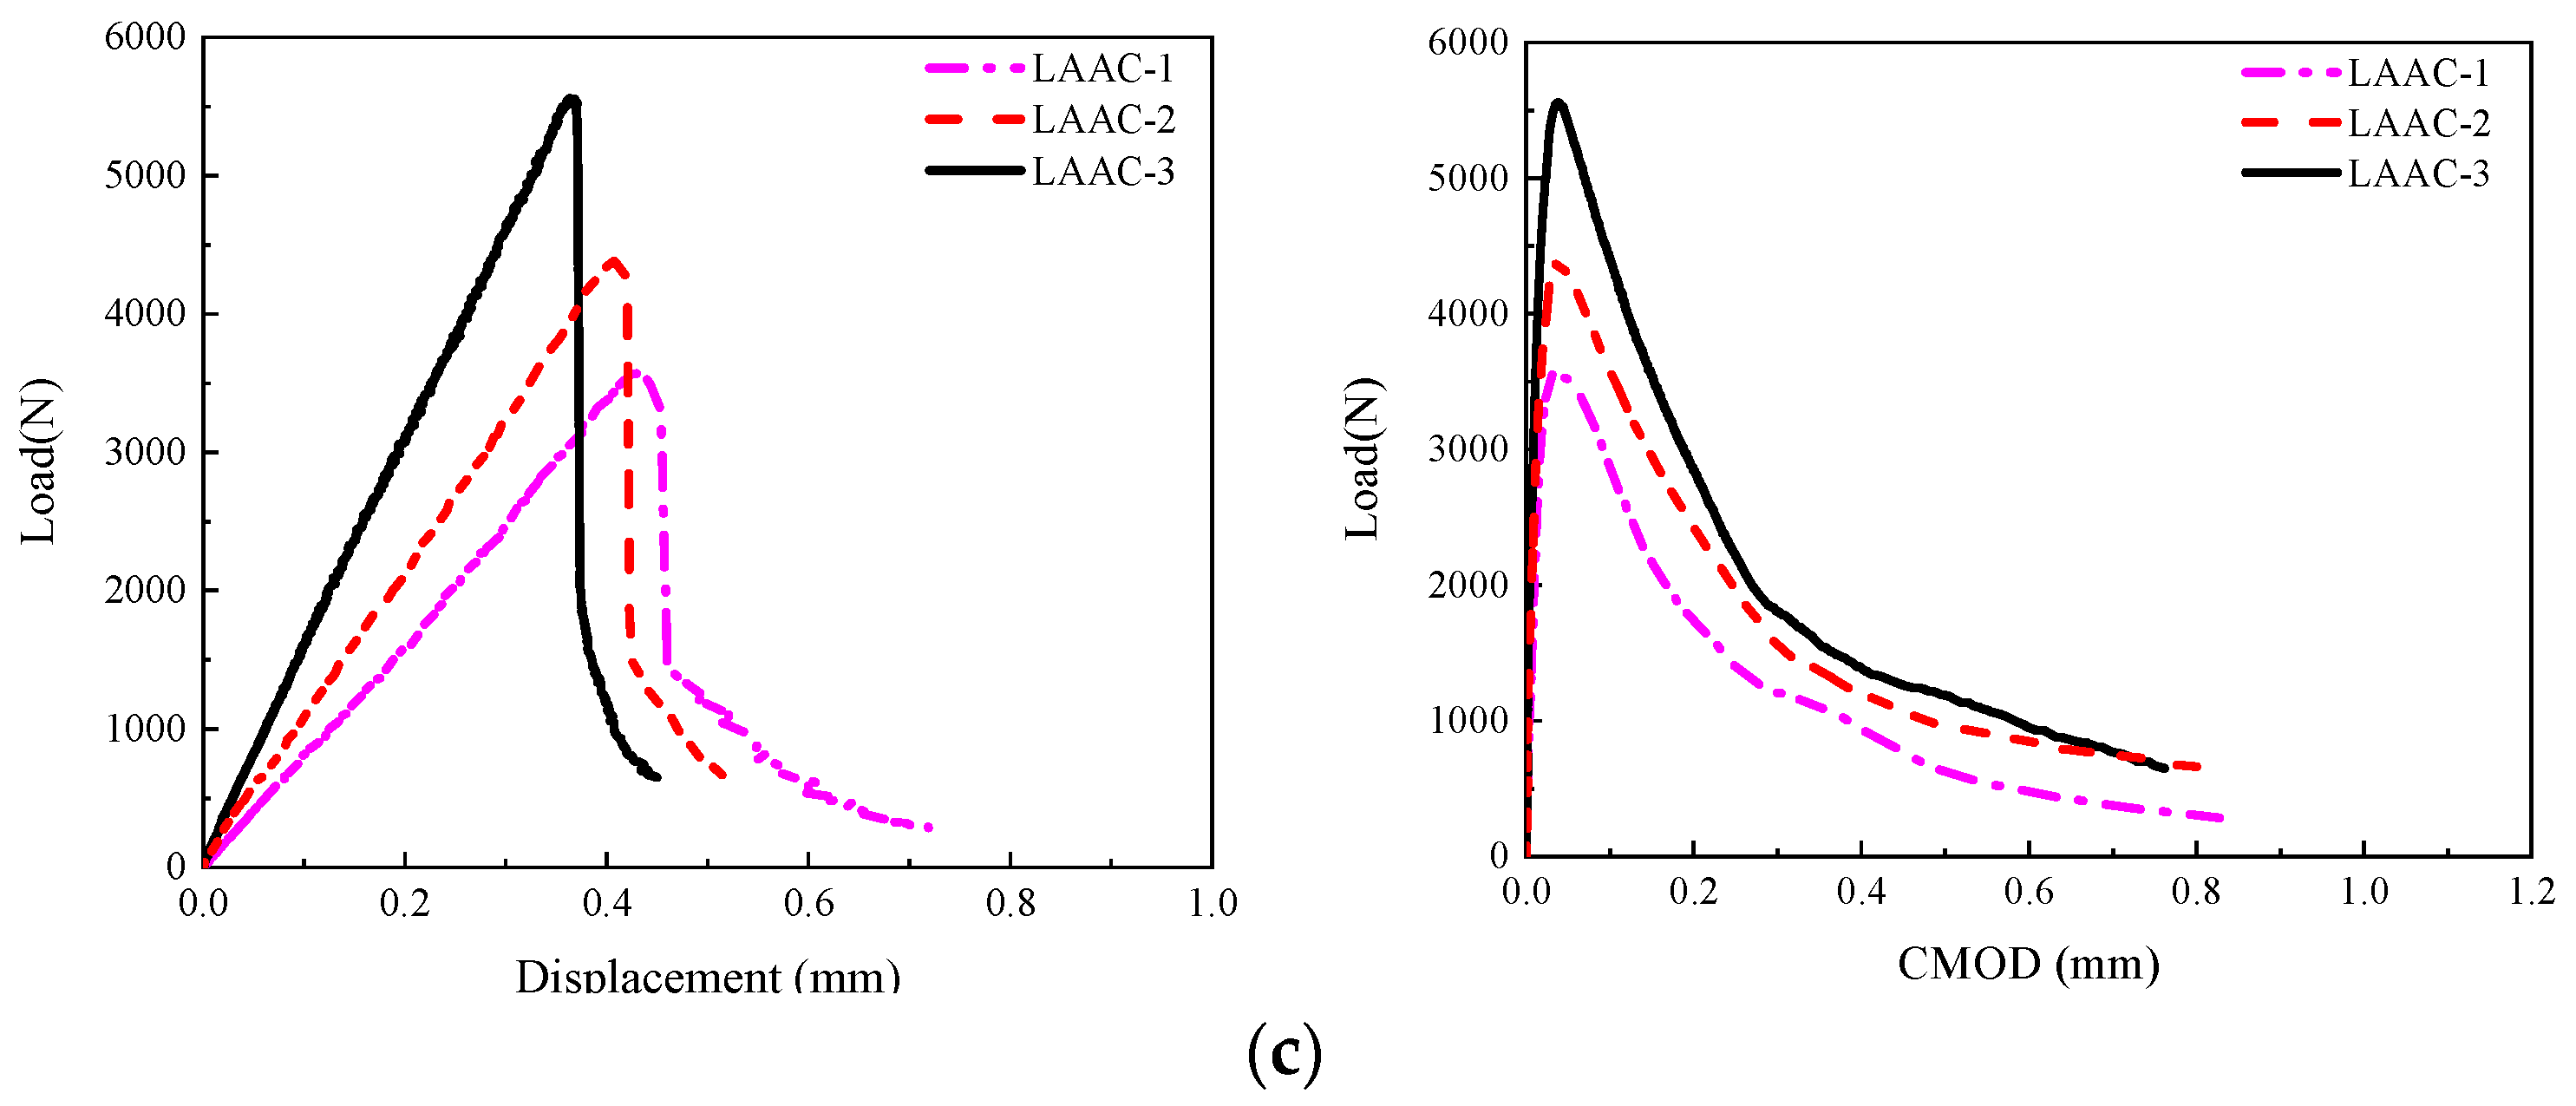
Table 6 summarized the fracture characteristics of AAC and OPC concrete obtained in terms of fracture energy, fracture toughness and characteristic length. Figure 8 presents the average load displacement curves and load–CMOD curves of the OPC concrete and AAC beams with three identical samples in each group. As shown in Figure 8a, the load–displacement curves and load–CMOD curves of the AAC were of similar shape as those of the OPC concrete. However, when the OPC in NOPC and LOPC was replaced by blended FA–BFSP, the peak load was improved with the activation of the SS and SH solution. For example, the peak load increased from 5.385 kN in the NOPC specimen to 6.444 kN in the NAAC specimen of a similar grade, and the peak load increased from 4.698 kN in the LOPC specimen to 5.559 kN in the LAAC specimen of a similar grade. Besides, in case of the AAC specimens, the pre-peak slopes of the load–displacement curves were slightly steeper, and the deformations at the peak load were slightly larger than that of the OPC concrete.
As demonstrated in Figure 8b,c, the slope of the linear branches of the load–displacement curves and load–CMOD curves and peak load increased with the strength for both the NAAC and LAAC. In addition, the strength grade of the AAC had little effect on the curvature of the post-peak curve; that is, with the increase in strength grade, the brittleness of the AAC increased slightly. However, the influence of the coarse aggregate type on the shape of the load deflection curve was greater than that of the binder type. The peak load and pre-peak slopes of the load-deflection curves of the LOPC and LAAC specimens with sintered fly ash LWAs were significantly lower than those of the NOPC and NAAC specimens with NWAs. The slopes of the post-peak curves of the LOPC and LAAC were steeper than those of the NOPC and NAAC. The literature [7,18] reported that, compared with OPC concrete, a thermally cured FA-based AAC exhibited a higher peak load and steeper slope in the post-peak curve. Nath et al. [19] stated that an ambient-cured BFSP-blended fly ash AAC showed a slightly higher peak load and almost similar post-peak behavior, as compared to a similar grade OPC concrete. Ding et al. [20] found that the peak load of an AAC in a three-point fracture tests was higher than that of an OPC concrete with a strength grade of C30; while the strength grade was C70, the peak load of the AAC in three-point fracture tests was less than that of its cement counterpart. The above literature further showed that the impact of binder type on the fracture properties of AAC was not as significant as that of the coarse aggregate type.
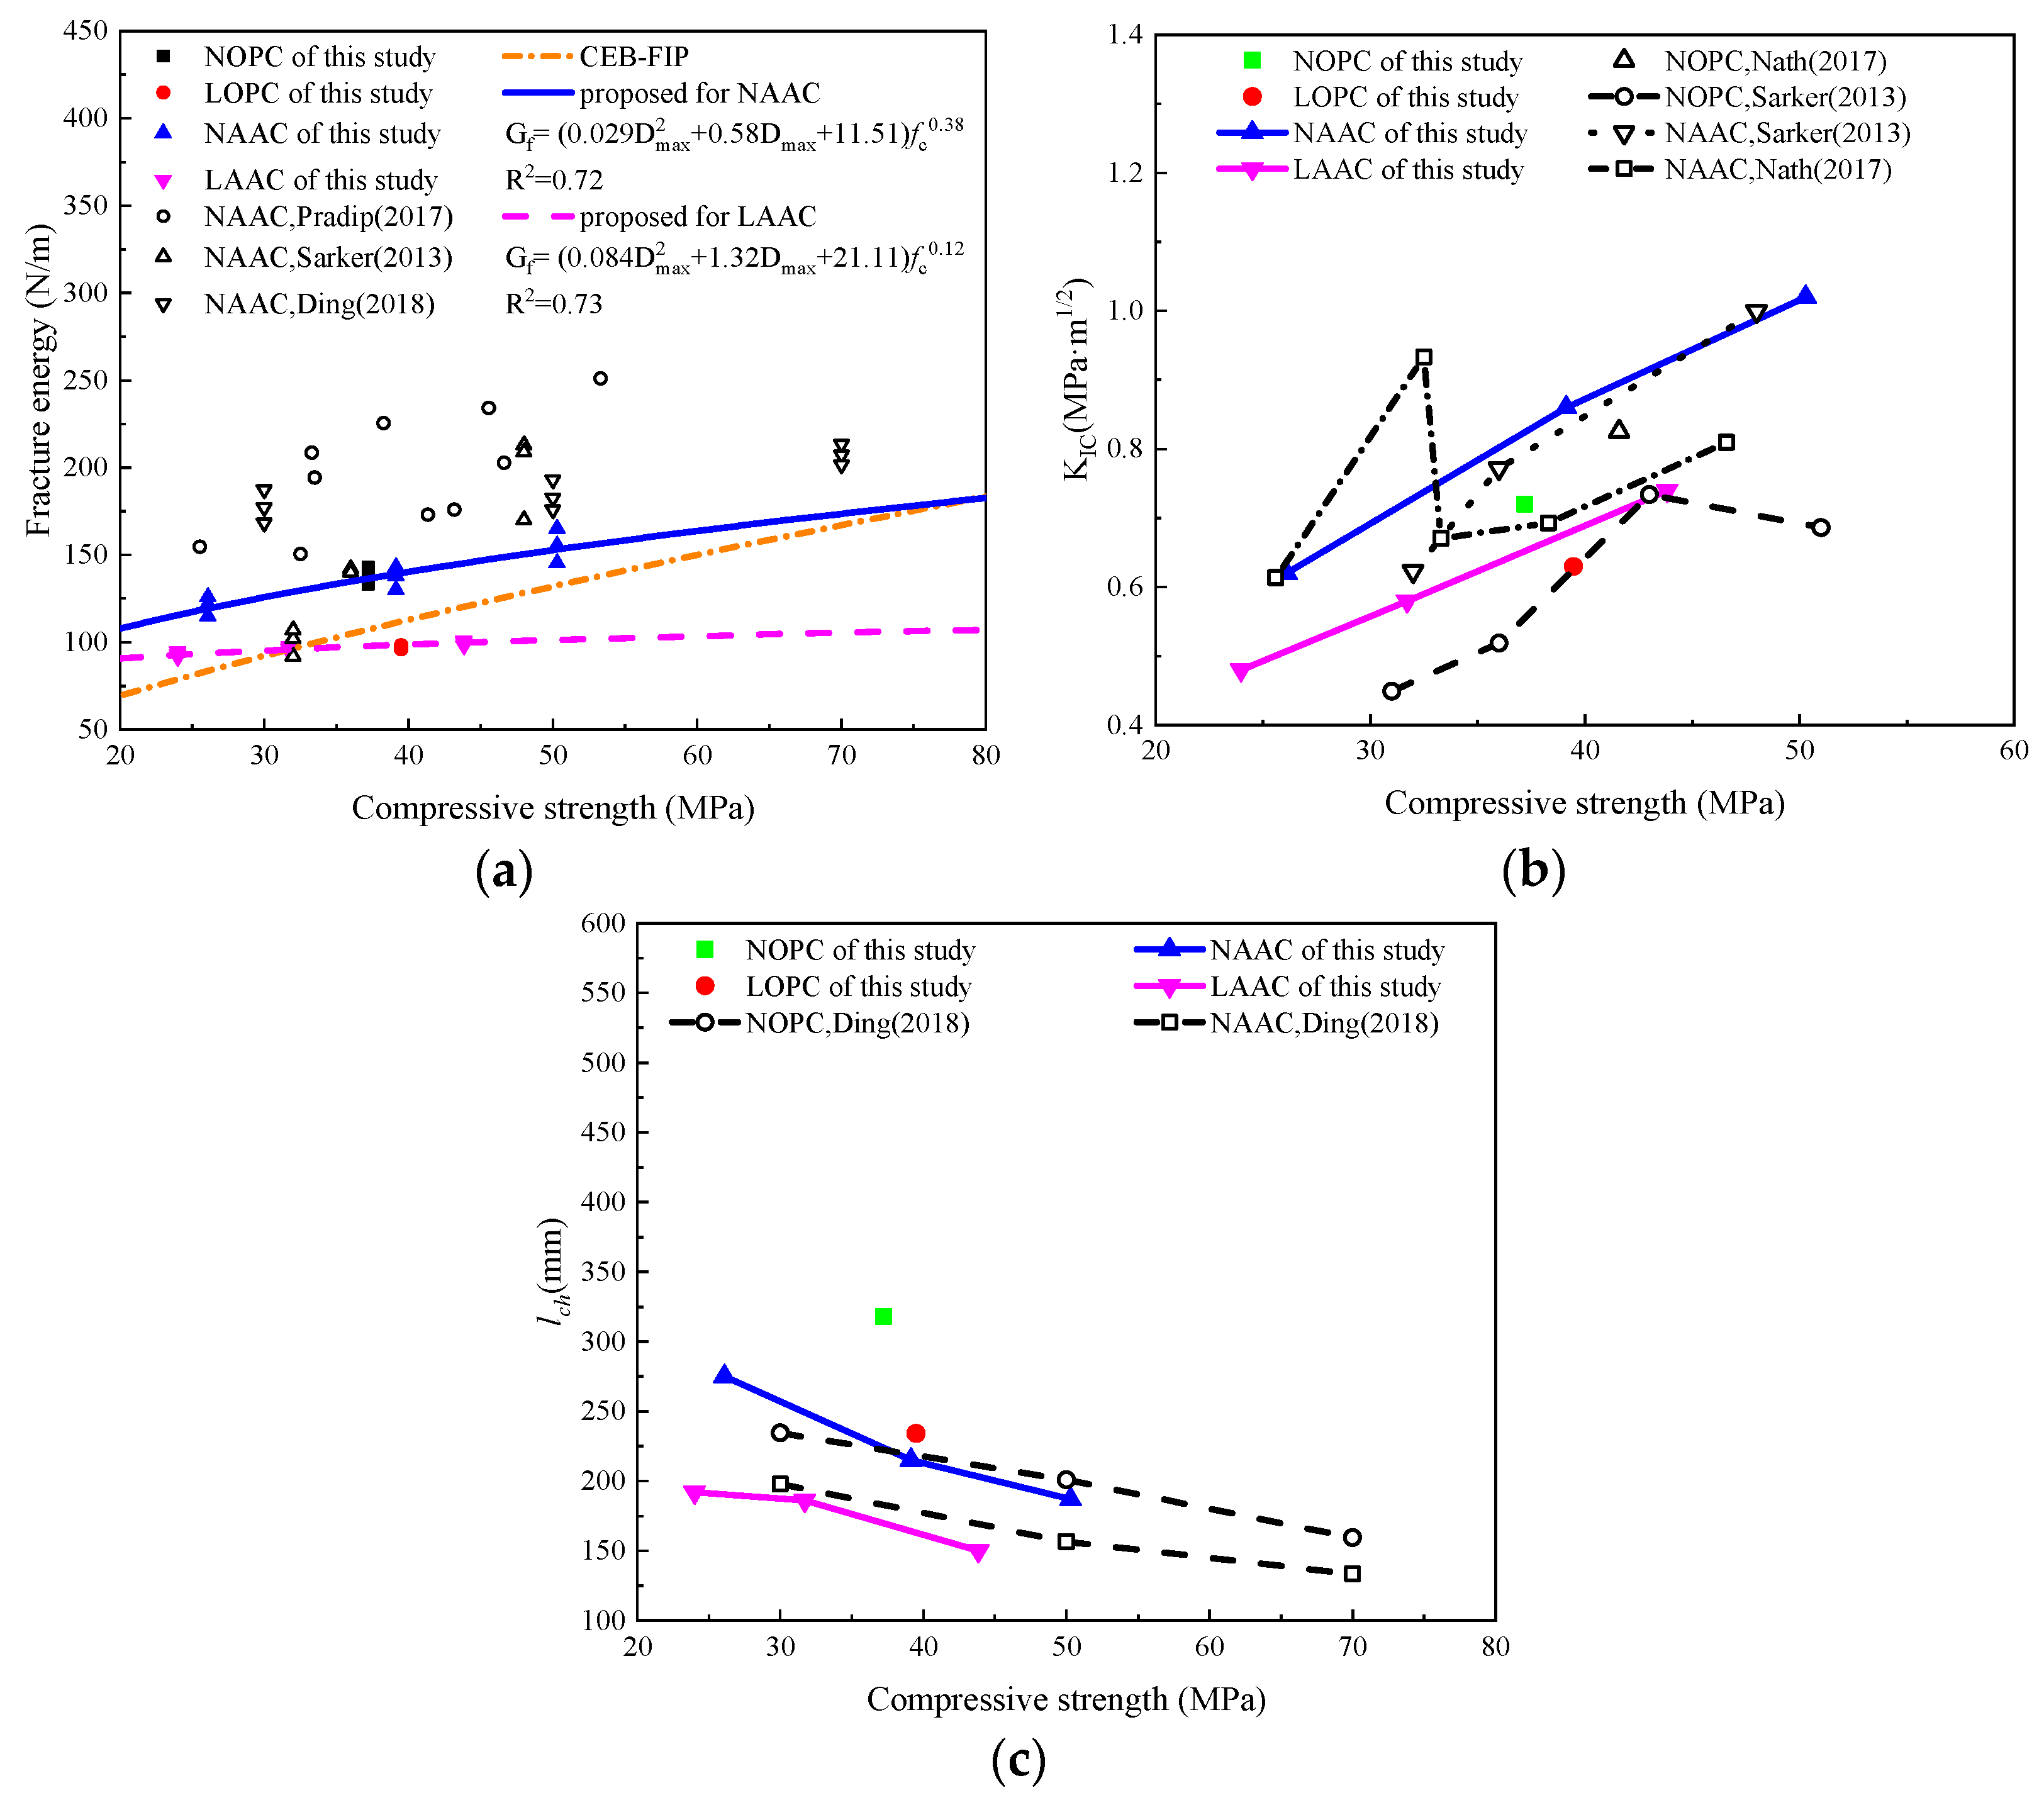
The fracture energy (GF) of the different mixtures was calculated by Equation (4) and listed in Table 6. The fracture energy of the NAAC ranged from 121 to 154 N/m, and that of LAAC varied between 93 and 100 N/m at 28 d. The value of GF of LAAC and LOPC was much lower than that of NAAC and NOPC, indicating that the contribution of the aggregate interlock action to GF in LAAC and LOPC was much less than that in NAAC and NOPC. It was noted that the fracture energies of the NAAC and LAAC were basically the same as those of the corresponding OPC concretes with the same compressive strength. However, Pan et al. [18] found that the fracture energy of alkali-activated fly ash paste was lower than that of OPC paste; thus, they pointed out that the fracture energy of an FA-based AAC was lower than that of OPC concrete. Figure 9a show the relationship between fracture energy and compressive strength. It can be found that the fracture energy of the AAC increased with the increase in compressive strength, which was consistent with the fracture test results of the OPC concrete [49]. However, the increase rate in GF was lower in LAAC than in NAAC, which was attributed to the fact that the NWA itself and ITZs between the matrix and NWA was stronger than the LWA and ITZs between the matrix and round LWA particles. Sarker et al. [7] pointed out that the fracture energy of a thermally-cured FA-based AAC was similar to that of OPC concrete and increased with compressive strength at a higher rate than that of the OPC concrete. Ding et al. [20] found that, with the increase in compressive strength, the improvement degree of the fracture energy of an ambient-cured slag-based AAC was lower than that of its cement counterpart. Nath et al. [19] reported that adding a small proportion of BFSP improved the fracture energy of a low-calcium fly ash-based AAC cured at room temperature, and the increasing rate of fracture energy with compressive strength was not significantly different from that of OPC concrete. The relationship between the GF values and compressive strength of the above results for the heat-cured and room temperature-cured NAACs is also plotted in Figure 9a. It can be seen that the test results from various literature were quite discrete, which was attributed to the fact that the types and sizes of coarse aggregates and paste materials in the different studies were quite different. The CEB-FIP committee [50] recommended a formula for calculating the fracture energy of OPC concrete as follows:
where Dmax = maximum aggregate size (mm); and fc = compressive strength (MPa).
As presented in Figure 9a, the CEB-FIP equation cannot accurately predict the experimental values of fracture energy of the NAAC and LAAC. A similar form of the CEB-FIP formula was used as a regression equation for predicting the fracture energy of AAC as a function of the compressive strength:
where k1 and k2 are regression parameters. The comparison results in Figure 9a showed that the predictions by Equation (12) were close to the test results of the NAAC and LAAC samples.
The mean KIC value and characteristic length lch for each concrete mixture are also given in Table 6. The results showed that the KIC value of the AAC was higher than that of its cement counterpart with a similar compressive strength, while the lch value of the AAC specimens was lower than that of corresponding OPC concrete. This demonstrated that the crack resistance of the AAC was higher than that of its cement counterpart, and the AAC was more brittle than the OPC concrete with the same compressive strength. Sarker et al. [7] also found that the KIC values of AAC and OPC concrete increased with the compressive strength, and the thermally cured FA-based AAC had a higher KIC value and crack resistance as compared to its OPC counterparts with the same compressive strength. Nath et al. [19] reported that the KIC values of an ambient-cured BFSP-blended fly ash AAC was almost the same as that of its cement counterpart, which was different from this study. Ding et al. [20] pointed out that the characteristic length lch of both ambient-cured slag-based AAC and OPC concrete decreased with an increase in compressive strength, and the AAC was more brittle than its cement counterpart.
The fracture failure planes of the AAC and OPC concrete three-point bending specimens with similar compressive strength are shown in Figure 10. From the observation of the failure surface, some difference was found: the fracture planes in LOPC and LAAC were flat, and the probability of a crack passing through the coarse aggregate in the LOPC sample was higher than that in the LAAC sample due to the same reason as the splitting tensile failure; the fracture planes in the NOPC and NAAC samples were more tortuous than those of the LOPC and LAAC samples. The above phenomena are consistent with those observed in the splitting tensile tests. Sarker et al. [7] also came to a similar conclusion through the three-point bending test of a fly ash-based AAC.
4. Discussion
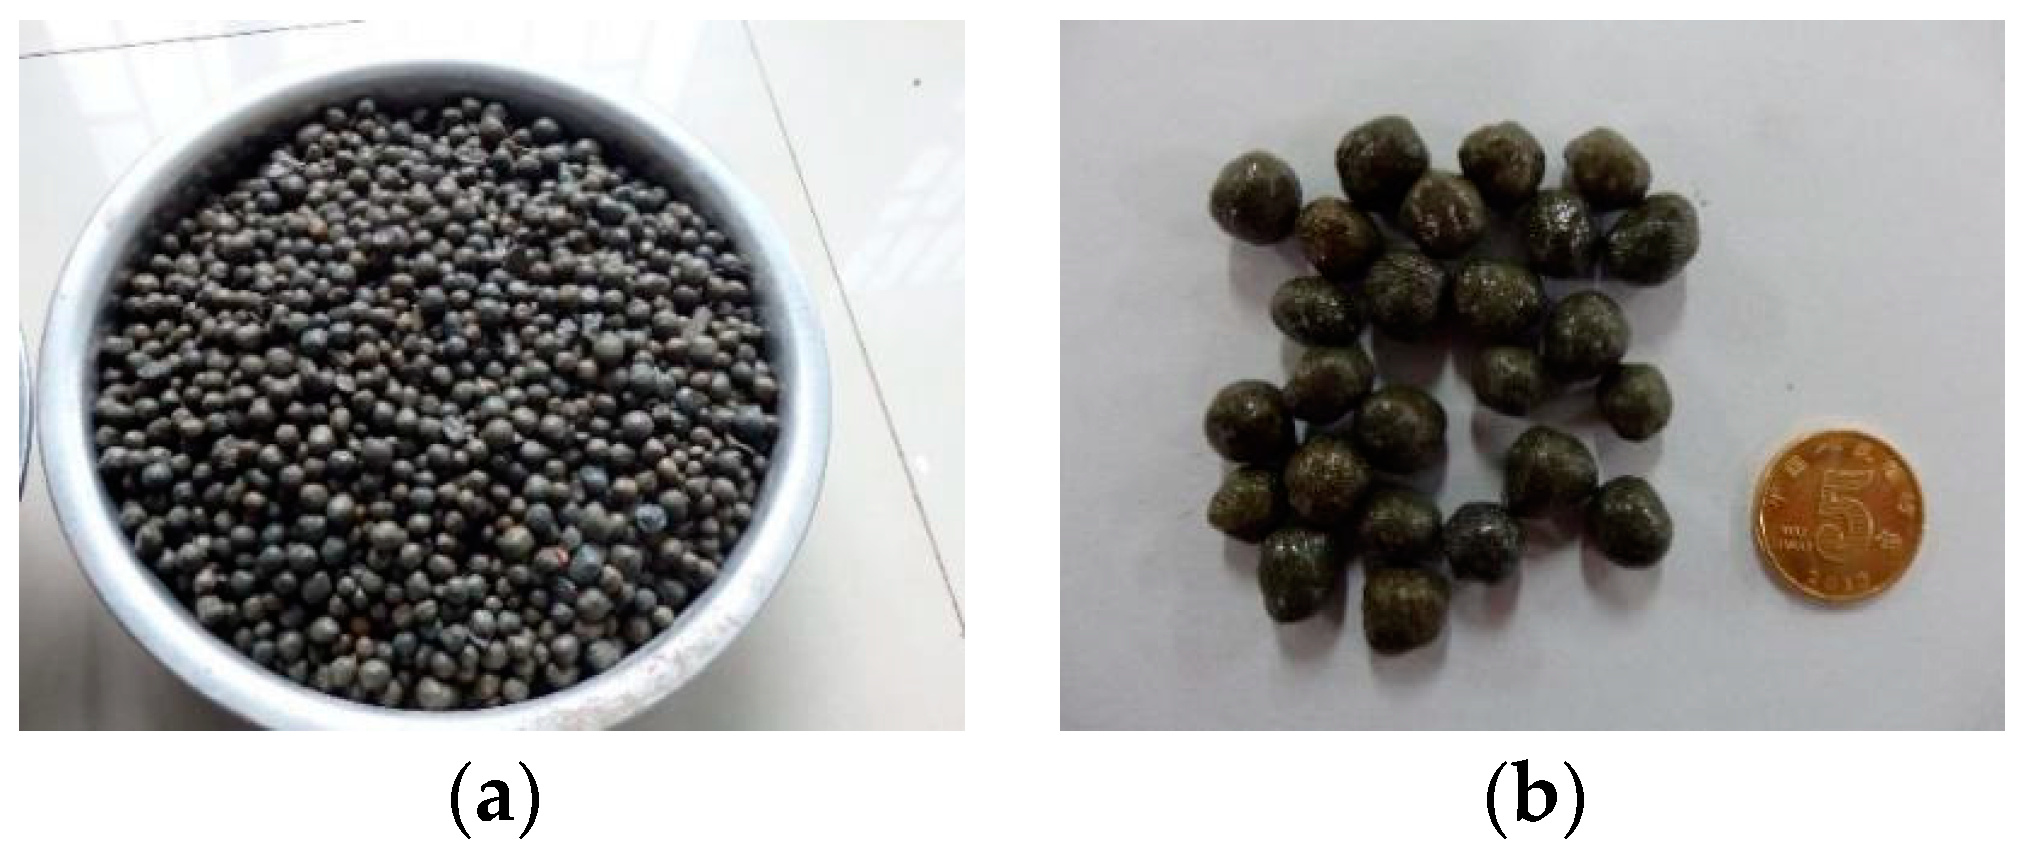
As shown in Figure 11, the sintered fly ash LWAs in the LOPC and LAAC were pretreated using different methods; the LWAs in the LOPC concrete generally need to be pre-wetted, while it is not necessary for the LWAs in the LAAC to be pre-wetted. In this study, the LWAs used in the LAAC were first mixed with a part of the SS solution, and water in the solution can form a dense shell around the LWA particles. Then, after adding the fly ash and BFSP, the products of the chemical interactions between the paste and sodium silicate solution can penetrate into the LWA particles down to a certain depth, which served to enhance the bonding and interlocking action between them.
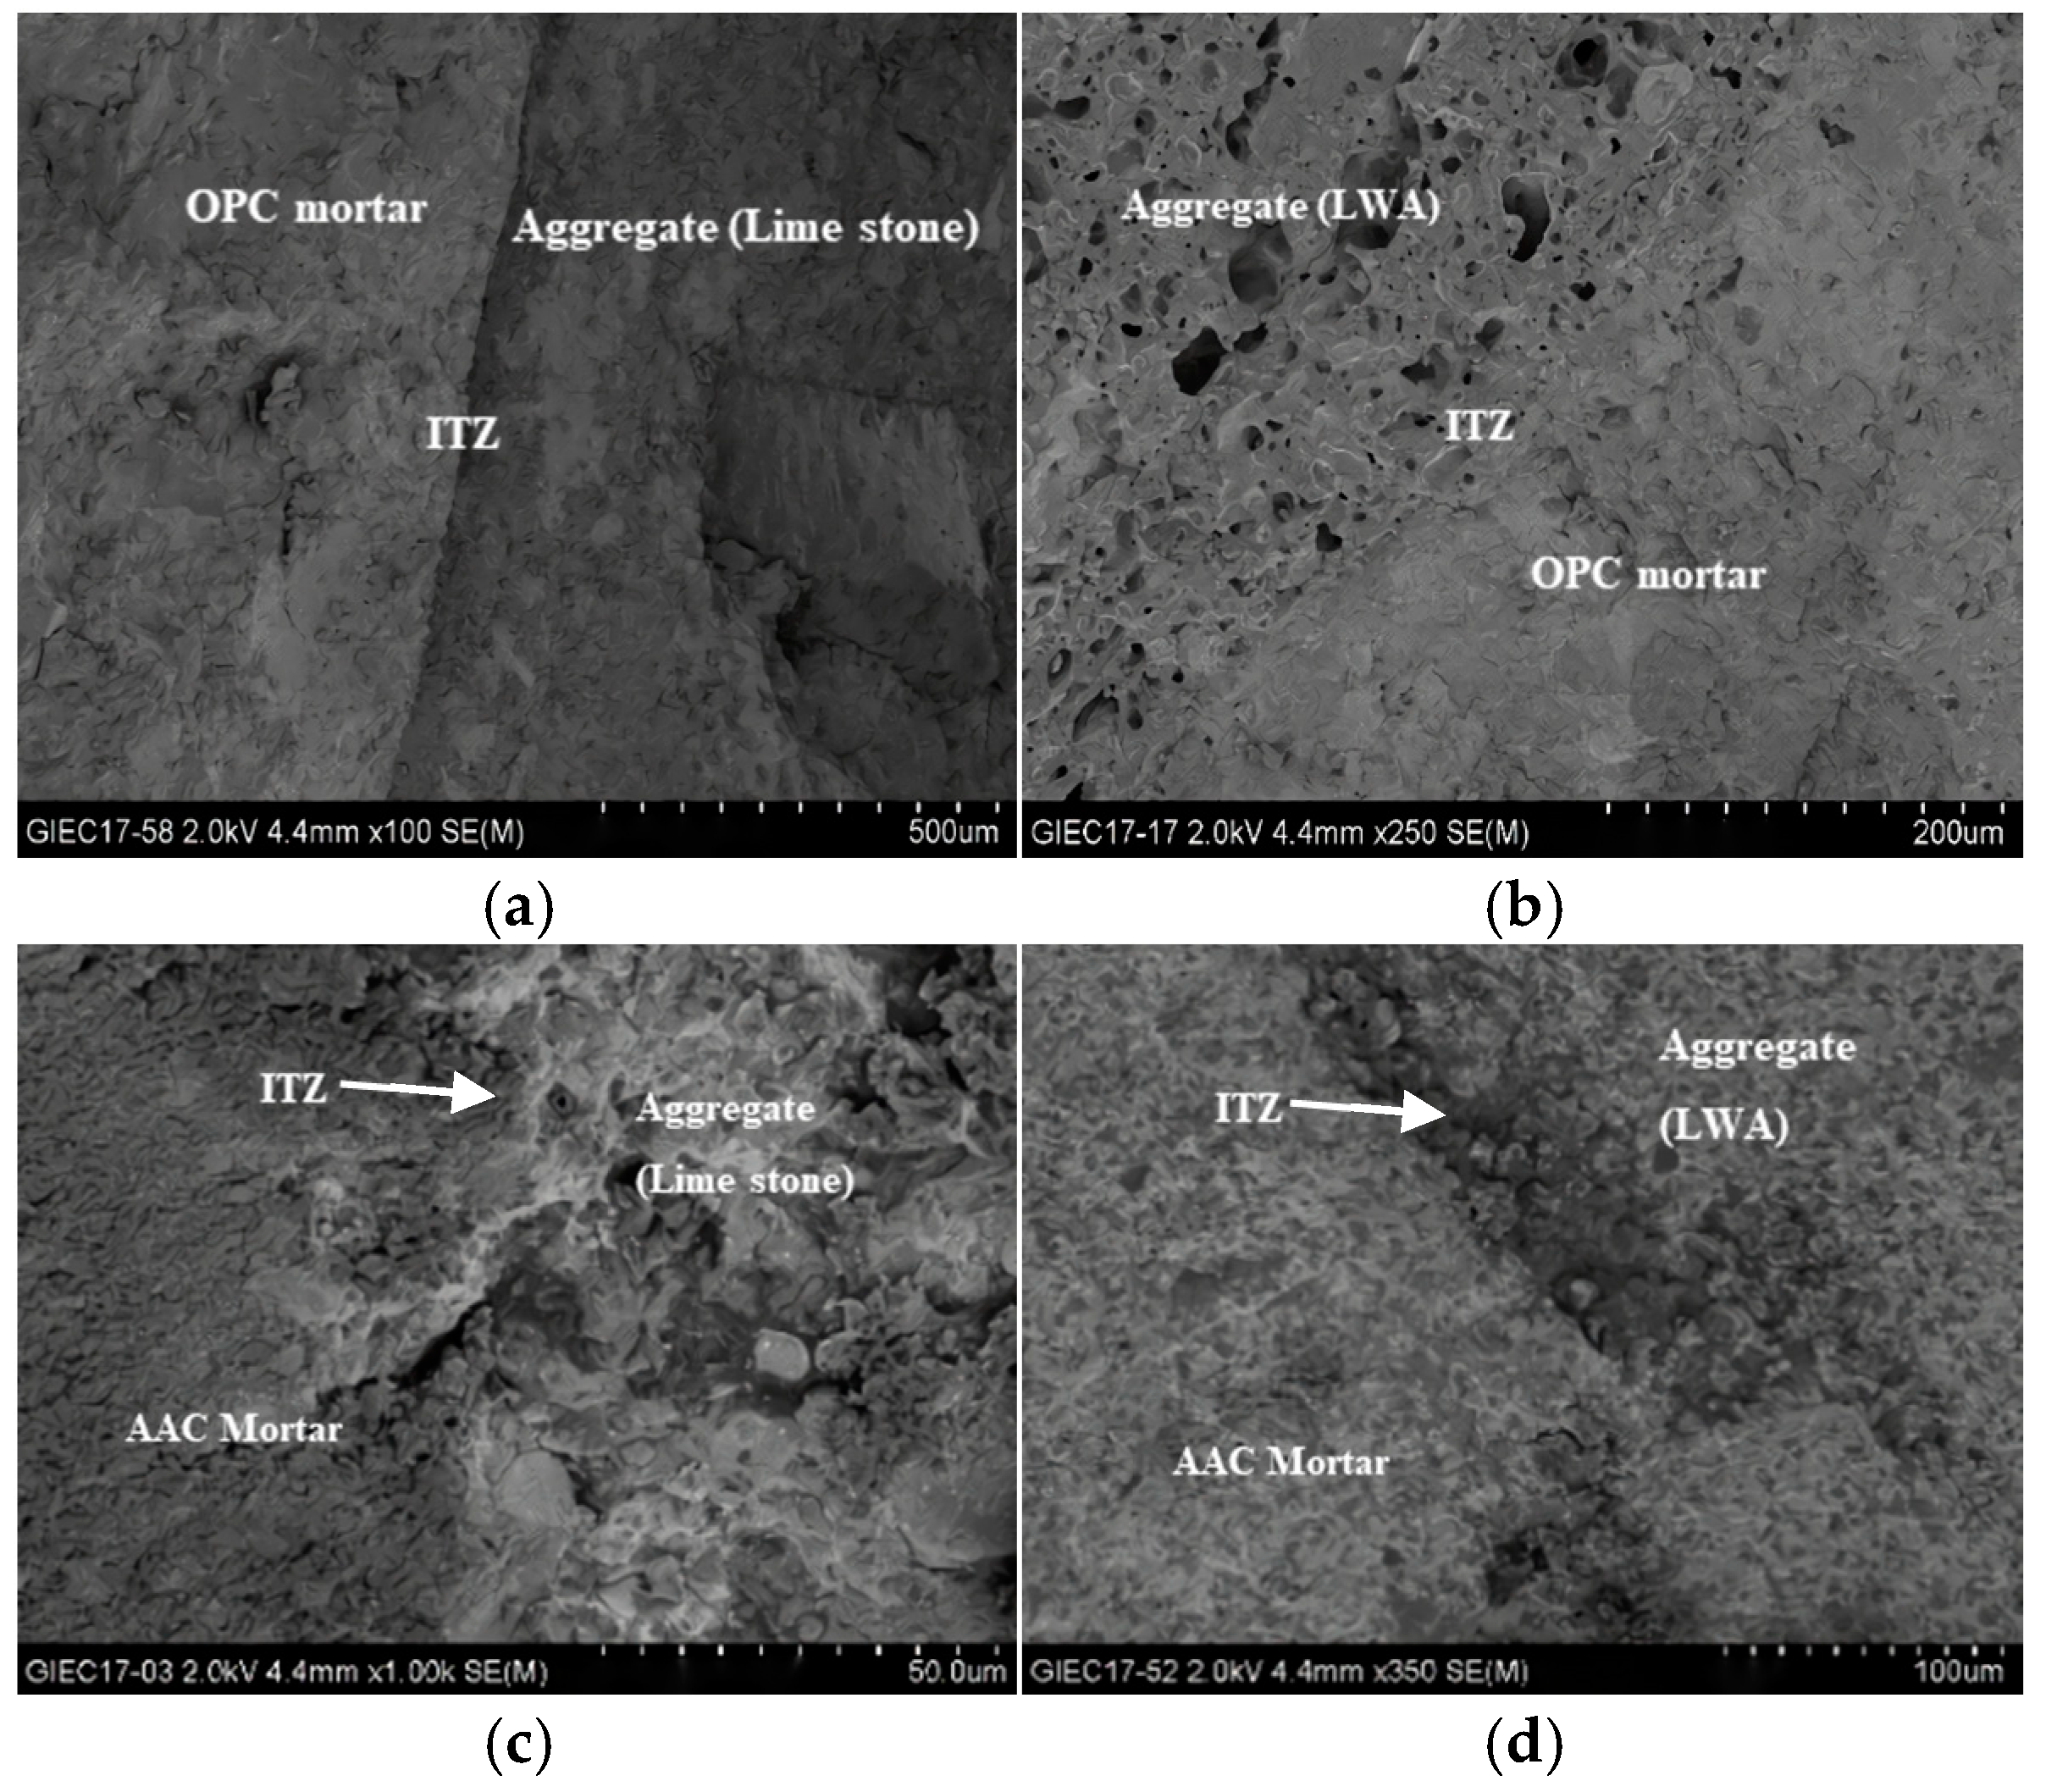
Figure 12 illustrates SEM photos of the interfacial transition zone (ITZ) of the OPC concrete and AAC samples. Figure 12a,b show that there existed obvious ITZs between the OPC binders and coarse aggregate (including NWA and LWA) particles. Compared with the OPC mortar phase, the inhomogeneous structure and initial shrinkage cracks of the ITZ make it a weak link in the OPC concrete, which has an important influence on the mechanical properties of the OPC concrete. For the AAC samples, whether the coarse aggregate was limestone or sintered fly ash lightweight aggregate, no porous ITZ structure was observed between the AAC mortar and the aggregate, as shown in Figure 12c,d. Rahimah et al. [49] also observed a similar phenomenon, which resulted in the quality and performance grade of the AAC not being inferior to that of its cement counterpart. In this study, the compressive strength of the NAAC samples using limestone aggregate were obviously higher than that of the LAAC, which was also attributed to the high porosity of the LWAs used in LAAC. The stress during the loading tends to transfer from the matrix phase to the porous LWA particles, which was the weakest phase in the LAAC; thus, premature failure occurred.
5. Conclusions
In this study, an FA–BFSP-based AAC was prepared with different cementitious materials and W/S ratios at room temperature to evaluate the effects of the mixed ratios and aggregate types on its mechanical and fracture properties. In addition, the morphology and microstructure of the ITZs that combined with the different coarse aggregates and cementitious materials were observed by SEM. Based on the experimental data analysis, the following conclusions can be drawn:
- LAAC was prepared and manufactured in this study and exhibited 28-day compressive strengths from 23.99 to 43.84 MPa, corresponding to dry apparent densities of 1825 to 1867 kg/m3, respectively, satisfying the requirements of a structural lightweight concrete. The strength grades or the UPVs of the LAAC mainly depend on the designed W/S ratios and the volume content of the coarse and fine aggregates.
- The 28-day fracture energy, fracture toughness and characteristic length of the LAACs made of sintered fly ash ceramsite are 93–100 N/m, 0.48–0.74 MPa·m1/2 and 150–192 mm, respectively, corresponding to compressive strengths from 26.10 to 50.29 MPa, while the fracture parameters of the NAACs are 121–154 N/m, 0.62–1.02 Mpa·m1/2 and 187–275 mm, respectively, corresponding to compressive strengths from 23.99 to 43.84 MPa. In the case of similar strength grades to the corresponding cement concrete, the fracture properties of the NAAC and LAAC are approximately the same as that of the corresponding NOPC and LOPC, respectively.
- The regression analysis models of the splitting tensile strength, elastic modulus and fracture energy of the NAAC and LAAC are established, which fit well with the experimental results, and can be used for analysis and prediction of AAC mechanic and fracture performance
- In the microstructure analysis, an obvious interface area is observed in the concrete with cement as cementitious material. The LWA has a slight wall effect at the interface and, compared with the conventional aggregate, the water absorption rate is higher. However, the pore size of the interface area decreases and the interface density improves when the alkali-activated FA and BFSP are used as the cementitious material.
Author Contributions
Conceptualization, H.W., Y.W. and B.C.; methodology, H.W., B.C., H.C. and L.W.; formal analysis, H.W., Y.W., H.C. and B.C.; writing—original draft preparation, H.W., Y.W., H.C. and L.W.; writing—review and editing, H.W., Y.W., and B.C.; visualization, B.C.; supervision, H.W.; project administration, H.W.; funding acquisition, H.W. All authors have read and agreed to the published version of the manuscript.
Funding
This research was funded by Guangxi University under contract no. XGZ160701, National Natural Science Foundation of China (Grant no. 51768003; 51868005) and the Science and Technology Planning Project of GuangXi Province (Grant no.2017GXNSFAA198360).
Data Availability Statement
The raw/processed data required to reproduce these findings cannot be shared at this time as the data also forms part of an ongoing study.
Conflicts of Interest
All authors declare that they have no conflict of interest.
Abbreviations
Alkali-activated concrete (AAC); Blast furnace slag powder (BFSP); Fly Ash (FA); Interfacial transition zones (ITZ); Lightweight alkali-activated concrete (LAAC); Lightweight ordinary Portland cement concrete (LOPC); Lightweight aggregate (LWA); Normal-weight alkali-activated concrete (NAAC); Normal-weight ordinary Portland cement concrete (NOPC); Normal-weight aggregate (NWA); Ordinary Portland cement (OPC); Scanning electron microscopy (SEM); Ultrasonic pulse velocity (UPV). Sodium silicate (SS); Sodium hydroxide (SH); Water/solid (W/S); Water/binder (w/b).
References
- Schneider, M.; Romer, M.; Tschudin, M.; Bolio, H. Sustainable cement production—Present and future. Cem. Concr. Res. 2011, 41, 642–650. [Google Scholar] [CrossRef]
- Wang, H.; Wang, L.; Li, L.; Cheng, B.; Zhang, Y.; Wei, Y. The study on the whole stress-strain curves of coral fly ash-slag alkali-activated concrete under uniaxial compression. Materials 2020, 13, 4291. [Google Scholar] [CrossRef]
- Wang, H.; Wu, Y.; Wei, M.; Wang, L.; Cheng, B. Hysteretic behavior of geopolymer concrete with active confinement subjected to monotonic and cyclic axial compression: An experimental study. Materials 2020, 13, 3997. [Google Scholar] [CrossRef]
- Duxson, P.; Provis, J.L.; Lukey, G.C.; van Deventer, J.S.J. The role of inorganic polymer technology in the development of ‘green concrete’. Cem. Concr. Res. 2007, 37, 1590–1597. [Google Scholar] [CrossRef]
- McLellan, B.C.; Williams, R.P.; Lay, J.; Van Riessen, A.; Corder, G.D. Costs and carbon emissions for geopolymer pastes in comparison to ordinary portland cement. J. Clean. Prod. 2011, 19, 1080–1090. [Google Scholar] [CrossRef] [Green Version]
- Van Deventer, J.S.J.; Provis, J.L.; Duxson, P. Technical and commercial progress in the adoption of geopolymer cement. Miner. Eng. 2012, 29, 89–104. [Google Scholar] [CrossRef]
- Sarker, P.K.; Haque, R.; Ramgolam, K.V. Fracture behaviour of heat cured fly ash based geopolymer concrete. Mater. Des. 2013, 44, 580–586. [Google Scholar] [CrossRef]
- Nath, P.; Sarker, P.K. Effect of GGBFS on setting, workability and early strength properties of fly ash geopolymer concrete cured in ambient condition. Constr. Build. Mater. 2014, 66, 163–171. [Google Scholar] [CrossRef] [Green Version]
- Thomas, R.J.; Peethamparan, S. Alkali-activated concrete: Engineering properties and stress–strain behavior. Constr. Build. Mater. 2015, 93, 49–56. [Google Scholar] [CrossRef] [Green Version]
- Nagalia, G.; Park, Y.; Abolmaali, A.; Aswath, P. Compressive strength and microstructural properties of fly ash-based geopolymer concrete. J. Mater. Civ. Eng. 2016, 28, 04016144. [Google Scholar] [CrossRef]
- Zhuang, X.Y.; Chen, L.; Komarneni, S.; Zhou, C.H.; Tong, D.S.; Yang, H.M.; Yu, W.H.; Wang, H. Fly ash-based geopolymer: Clean production, properties and applications. J. Clean. Prod. 2016, 125, 253–267. [Google Scholar] [CrossRef]
- Lee, N.K.; Lee, H.K. Setting and mechanical properties of alkali-activated fly ash/slag concrete manufactured at room temperature. Constr. Build. Mater. 2013, 47, 1201–1209. [Google Scholar] [CrossRef]
- Fang, G.; Ho, W.K.; Tu, W.; Zhang, M. Workability and mechanical properties of alkali-activated fly ash-slag concrete cured at ambient temperature. Constr. Build. Mater. 2018, 172, 476–487. [Google Scholar] [CrossRef]
- Keulen, A.; Yu, Q.L.; Zhang, S.; Grünewald, S. Effect of admixture on the pore structure refinement and enhanced performance of alkali-activated fly ash-slag concrete. Constr. Build. Mater. 2018, 162, 27–36. [Google Scholar] [CrossRef]
- Bouaissi, A.; Li, L.; Al Bakri Abdullah, M.M.; Bui, Q. Mechanical properties and microstructure analysis of FA-GGBS-HMNS based geopolymer concrete. Constr. Build. Mater. 2019, 210, 198–209. [Google Scholar] [CrossRef]
- Islam, A.; Alengaram, U.J.; Jumaat, M.Z.; Bashar, I.I.; Kabir, S.M.A. Engineering properties and carbon footprint of ground granulated blast-furnace slag-palm oil fuel ash-based structural geopolymer concrete. Constr. Build. Mater. 2015, 101, 503–521. [Google Scholar] [CrossRef]
- Nabeel, A.F.; Sheikh, M.N.; Muhammad, N.S.H. Investigation of engineering properties of normal and high strength fly ash based geopolymer and alkali-activated slag concrete compared to ordinary Portland cement concrete. Constr. Build. Mater. 2019, 196, 26–42. [Google Scholar]
- Pan, Z.; Sanjayan, J.G.; Rangan, B.V. Fracture properties of geopolymer paste and concrete. Mag. Concr. Res. 2011, 63, 763–771. [Google Scholar] [CrossRef]
- Nath, P.; Nath, P.; Sarker, P.K.; Sarker, P.K. Fracture properties of GGBFS-blended fly ash geopolymer concrete cured in ambient temperature. Mater. Struct. 2017, 50, 1–12. [Google Scholar] [CrossRef]
- Ding, Y.; Dai, J.; Shi, C. Fracture properties of alkali-activated slag and ordinary Portland cement concrete and mortar. Constr. Build. Mater. 2018, 165, 310–320. [Google Scholar] [CrossRef]
- Nadesan, M.S.; Dinakar, P. Influence of type of binder on high-performance sintered fly ash lightweight aggregate concrete. Constr. Build. Mater. 2018, 176, 665–675. [Google Scholar] [CrossRef]
- Satpathy, H.P.; Patel, S.K.; Nayak, A.N. Development of sustainable lightweight concrete using fly ash cenosphere and sintered fly ash aggregate. Constr. Build. Mater. 2019, 202, 636–655. [Google Scholar] [CrossRef]
- Junaid, T.M.; Kayali, O.; Khennane, A. Response of alkali activated low calcium fly-ash based geopolymer concrete under compressive load at elevated temperatures. Mater. Struct. 2017, 50, 1–10. [Google Scholar]
- Yang, K.; Mun, J.; Sim, J.; Song, J. Effect of water content on the properties of lightweight alkali-activated slag concrete. J. Mater. Civ. Eng. 2011, 23, 886–894. [Google Scholar] [CrossRef]
- China, Standardiztion Administration of China (S.A.C.). Common Portland Concrete; Standards Press of China: Beijing, China, 2007. [Google Scholar]
- China, Standardiztion Administration of China (S.A.C.). Lightweight Aggregates and Its Test Methods-Part 2: Test Method for Lightweight Aggregates; Standards Press of China: Beijing, China, 1998. [Google Scholar]
- China, Standardiztion Administration of China (S.A.C.). Code for Mix Proportion Design of Ordinary Concrete; China Architecture& Building Press: Beijing, China, 2011. [Google Scholar]
- China, Ministry of Construction of China (M.O.C.O). Technical Specification for Lightweight Aggregate Concrete; China Architecture & Building Press: Beijing, China, 2002. [Google Scholar]
- China, Standardiztion Administration of China (S.A.C.). Standard for Test Method of Performance on Ordinary Fresh Concrete; Standards Press of China: Beijing, China, 2016. [Google Scholar]
- ASTM C597. Standard Test Method for Pulse Velocity through Concrete; American Society for Testing and Materials: West Conshohocken, PA, USA, 2003. [Google Scholar]
- China, Standardiztion Administration of China (S.A.C.). Standard for Test Method of Mechanical Properties on Ordinary Concrete; China Architecture & Building Press: Beijing, China, 2002. [Google Scholar]
- Khalilpour, S.; BaniAsad, E.; Dehestani, M. A review on concrete fracture energy and effective parameters. Cem. Concr. Res. 2019, 120, 294–321. [Google Scholar] [CrossRef]
- Hillerborg, A. Concrete Fracture Energy Tests Performed by 9 Laboratories according to a Draft RILEM Recommendation: Report to RILEM TC50-FMC; Lund University: Skonay, Sweden, 1983. [Google Scholar]
- EN 14651. Test Method for Metallic Fibered Concrete Measuring the Flexural Tensile Strength; European Committee for Standardization: Brussels, Belgium, 2005. [Google Scholar]
- ASTM E399-90. Standard Test Method for Plane-Strain Fracture Toughness of Metallic Materials; American Society for Testing and Materials: West Conshohocken, PA, USA, 1997. [Google Scholar]
- Singh, B.; Ishwarya, G.; Gupta, M.; Bhattacharyya, S.K. Geopolymer concrete: A review of some recent developments. Constr. Build. Mater. 2015, 85, 78–90. [Google Scholar] [CrossRef]
- Joseph, R.Y.; Aleksandra, R.; Stephen, E.; Michael, S. Structural behavior of alkali activated fly ash concrete. Part 1: Mixture design, material properties and sample fabrication. Mater. Struct. 2013, 46, 435–447. [Google Scholar]
- Joseph, R.Y.; Aleksandra, R.; Stephen, E.; Michael, S.; Nicholas, J.M. Structural behavior of alkali activated fly ash concrete. Part 2: Structural testing and experimental findings. Mater. Struct. 2013, 46, 449–462. [Google Scholar]
- ACI 318. Building Code Requirements for Structural Concrete and Commentary; American Concrete Institute: Farmington Hills, MI, USA, 2014. [Google Scholar]
- China, Ministry of Construction of China (M.O.C.O). Technical Code for Lightweight Aggregate Concrete Structure; China Architecture & Building Press: Beijing, China, 2006. [Google Scholar]
- Amin, N.; Farhad, A.; Arnaud, C.; Raymond, I.G.; Brian, U.; Stephen, F. Compressive stress-strain model for low-calcium fly ash-based geopolymer and heat-cured Portland cement concrete. Cem. Concr. Compos. 2016, 73, 136–146. [Google Scholar]
- Shehata, I.A.E.M.; Shehata, L.C.D.; Mattos, T.S. Stress-strain curve for the design of high-strength concrete elements. Mater. Struct. 2000, 33, 411–418. [Google Scholar] [CrossRef]
- Manu, S.N.; Dinakar, P. Structural concrete using sintered flyash lightweight aggregate: A review. Constr. Build. Mater. 2017, 154, 928–944. [Google Scholar]
- Sofi, M.; van Deventer, J.S.J.; Mendis, P.A.; Lukey, G.C. Engineering properties of inorganic polymer concretes (IPCs). Cem. Concr. Res. 2007, 37, 251–257. [Google Scholar] [CrossRef]
- Xie, J.; Wang, J.; Rao, R.; Wang, C.; Fang, C. Effects of combined usage of GGBS and fly ash on workability and mechanical properties of alkali activated geopolymer concrete with recycled aggregate. Compos. Part B Eng. 2019, 164, 179–190. [Google Scholar] [CrossRef]
- China, Standardiztion Administration of China (S.A.C.). Code for Design of Concrete Structures; China Architecture & Building Press: Beijing, China, 2010. [Google Scholar]
- Ismail, N.; El-Hassan, H. Development and characterization of fly ash-slag blended geopolymer mortar and lightweight concrete. J. Mater. Civ. Eng. 2018, 30, 04018029. [Google Scholar] [CrossRef]
- Gomaa, E.; Sargon, S.; Kashosi, C.; Gheni, A.; ElGawady, M.A. Mechanical properties of high early strength class c fly Ash-Based alkali activated concrete. J. Transp. Res. Board 2020, 2674, 430–443. [Google Scholar] [CrossRef]
- Rahimah, E.; Andri, K.; Nasir, S.; Muhd, F.N. Strength and microstructural properties of fly ash based geopolymer concrete containing high-calcium and water-absorptive aggregate. J. Clean. Prod. 2016, 112, 816–822. [Google Scholar]
- CEB-FIP: Model Code 1990; European Concrete Association: London, UK, 1990.
Figure 1.
Uniaxial compressive test setup: (a) schematic of setup for loading; (b) test equipment. Note: 1—Force Transducer; 2—Steel Platens; 3—Specimen; 4—Displacement Sensor; 5—Strain Gauges; 6—Bottom Backing Plate; 7—Electro-Hydraulic Servo Actuator.
Figure 1.
Uniaxial compressive test setup: (a) schematic of setup for loading; (b) test equipment. Note: 1—Force Transducer; 2—Steel Platens; 3—Specimen; 4—Displacement Sensor; 5—Strain Gauges; 6—Bottom Backing Plate; 7—Electro-Hydraulic Servo Actuator.

Figure 2.
The three-point bending setup: (a) photo of three-point bending test; (b) schematic diagram of three-point bending test.
Figure 2.
The three-point bending setup: (a) photo of three-point bending test; (b) schematic diagram of three-point bending test.

Figure 3.
Typical failure patterns of the prism specimens: (a) normal-weight ordinary Portland cement concrete (NOPC); (b) lightweight ordinary Portland cement concrete (LOPC); (c) normal-weight alkali-activated concrete (NAAC); (d) lightweight alkali-activated concrete (LAAC)
Figure 3.
Typical failure patterns of the prism specimens: (a) normal-weight ordinary Portland cement concrete (NOPC); (b) lightweight ordinary Portland cement concrete (LOPC); (c) normal-weight alkali-activated concrete (NAAC); (d) lightweight alkali-activated concrete (LAAC)

Figure 4.
Compressive stress–strain curves of the tested prisms: (a) stress–strain curves of different mixtures; (b) stress–strain curves of NAAC; (c) stress–strain curves of LAAC.
Figure 4.
Compressive stress–strain curves of the tested prisms: (a) stress–strain curves of different mixtures; (b) stress–strain curves of NAAC; (c) stress–strain curves of LAAC.

Figure 5.
The mechanical properties of the AAC with different compressive strengths: (a) elastic modulus; (b) peak strain.
Figure 5.
The mechanical properties of the AAC with different compressive strengths: (a) elastic modulus; (b) peak strain.

Figure 6.
The mechanical properties of the AAC with different compressive strengths: (a) the ultrasonic pulse velocity (UPV); (b) splitting tensile strength.
Figure 6.
The mechanical properties of the AAC with different compressive strengths: (a) the ultrasonic pulse velocity (UPV); (b) splitting tensile strength.

Figure 7.
Typical splitting surfaces of cube specimens: (a) NOPC; (b) LOPC; (c) NAAC; (d) LAAC.

Figure 8.
Load–displacement curves and load–CMOD curves of the tested beams: (a) different mixture; (b) NAAC; (c) LAAC.
Figure 8.
Load–displacement curves and load–CMOD curves of the tested beams: (a) different mixture; (b) NAAC; (c) LAAC.


Figure 9.
Relationship between the fracture parameters and compressive strength of the concretes: (a) fracture energy; (b) critical stress intensity factor; (c) characteristic length.
Figure 9.
Relationship between the fracture parameters and compressive strength of the concretes: (a) fracture energy; (b) critical stress intensity factor; (c) characteristic length.

Figure 10.
The typical fracture planes of four types of concrete with a similar compressive strength: (a) NOPC; (b) LOPC; (c) NAAC; (d) LAAC.
Figure 10.
The typical fracture planes of four types of concrete with a similar compressive strength: (a) NOPC; (b) LOPC; (c) NAAC; (d) LAAC.

Figure 11.
LWA appearance in the different binders: (a) LWA treated by the pre-wetting method; (b) LWA treated by a sodium silicate solution.
Figure 11.
LWA appearance in the different binders: (a) LWA treated by the pre-wetting method; (b) LWA treated by a sodium silicate solution.

Figure 12.
SEM image of the interfacial transition zone (ITZ) between the binder and aggregate: (a) NOPC; (b) LOPC; (c) NAAC; (d) LAAC.
Figure 12.
SEM image of the interfacial transition zone (ITZ) between the binder and aggregate: (a) NOPC; (b) LOPC; (c) NAAC; (d) LAAC.


Table 1.
Properties and compositions of the pozzolanic materials.
| Sample | Chemical Composition (%) | Blaine Fineness (cm2/g) | Density (g/cm2) | LOI (%) | ||||
|---|---|---|---|---|---|---|---|---|
| SiO2 | Al2O3 | CaO | Fe2O3 | MgO | ||||
| FA | 49.10 | 26.70 | 6.96 | 9.67 | 1.37 | 3871 | 2.21 | 2.08 |
| BFSP | 32.28 | 13.80 | 47.85 | 0.74 | 3.73 | 3862 | 2.86 | 1.30 |
| Cement | 21.66 | 5.42 | 63.15 | 2.62 | 2.89 | 3110 | 3.14 | 1.63 |
Table 2.
Physical properties of the coarse and fine aggregates.
| Type | Particle Size (mm) | Specific Gravity | 24 h Water Absorption (%) | Fineness Modulus | Aggregate Crushing Value (%) | Cylinder Compressive Strength (MPa) |
|---|---|---|---|---|---|---|
| Natural River Sand | ≤5 | 2.67 | 1.2 | 2.7 | - | - |
| Limestone | 5~20 | 2.64 | 0.83 | - | 23 | - |
| Sintered Fly Ash Ceramsite | 4~16 | 1.24 | 11.3 | - | 30 | 10.6 |
Table 3.
Mixture proportions of the ordinary Portland cements (OPCs) (kg/m3).
| Mix ID | Cement | Water | Sand | NWA | LWA | SP |
|---|---|---|---|---|---|---|
| NOPC | 390 | 187 | 764 | 1023 | - | - |
| LOPC | 564 | 167 | 790 | 462 | 2.7 |
Table 4.
Mixture proportions of the alkali-activated concretes (AACs) (kg/m3).
| Mix ID | FA | BFSP | SS | SH | Sand | NWA | LWA | Added Water | W/S | SP |
|---|---|---|---|---|---|---|---|---|---|---|
| NAAC-1 | 183 | 122 | 110 | 44 | 773 | 1094 | - | 13.1 | 0.29 | - |
| NAAC-2 | 234 | 156 | 122 | 49 | 764 | 1023 | - | 11.5 | 0.25 | 1.4 |
| NAAC-3 | 298 | 199 | 131 | 52 | 735 | 958 | - | 5.9 | 0.21 | 2.8 |
| LAAC-1 | 216 | 144 | 110 | 44 | 858 | - | 605 | 13.1 | 0.26 | 2.1 |
| LAAC-2 | 266 | 177 | 122 | 49 | 844 | - | 531 | 8.3 | 0.22 | 3.3 |
| LAAC-3 | 339 | 226 | 124 | 50 | 790 | - | 462 | 5.5 | 0.18 | 4.8 |
SS—sodium silicate; SH—sodium hydroxide; NWA—normal-weight aggregate; LWA—lightweight aggregate; SP—superplasticizer.
Table 5.
Basic properties of the mixtures.
| Type | Slump (mm) | Apparent Wet Density (kg/m3) | Dry Density (kg/m3) | fc (MPa) | UPV (m/s) | fts (MPa) | Elastic Modulus (GPa) | Poisson’s Ratio |
|---|---|---|---|---|---|---|---|---|
| NOPC | 84 | 2364 | 2261 | 37.21 | 3830 | 3.57 | 29.11 | 0.19 |
| LOPC | 60 | 1987 | 1888 | 39.48 | 3717 | 3.25 | 18.77 | 0.22 |
| NAAC-1 | 223 | 2340 | 2242 | 26.10 | 3664 | 3.08 | 21.58 | 0.21 |
| NAAC-2 | 214 | 2361 | 2243 | 39.13 | 3701 | 4.01 | 25.17 | 0.20 |
| NAAC-3 | 205 | 2387 | 2296 | 50.29 | 3924 | 4.76 | 27.60 | 0.18 |
| LAAC-1 | 268 | 1992 | 1825 | 23.99 | 3234 | 2.51 | 12.95 | 0.22 |
| LAAC-2 | 245 | 2001 | 1859 | 31.71 | 3386 | 2.93 | 16.56 | 0.21 |
| LAAC-3 | 237 | 2003 | 1867 | 43.84 | 3596 | 3.69 | 20.01 | 0.18 |
Table 6.
Fracture parameters of the mixtures.
| Type | δ0 (mm) | Pmax (N) | GF (N/m) | KIC (MPa·m1/2) | lch (mm) |
|---|---|---|---|---|---|
| NOPC | 0.61 | 5385 | 139 | 0.72 | 318 |
| LOPC | 0.48 | 4698 | 98 | 0.63 | 174 |
| NAAC-1 | 0.55 | 4679 | 121 | 0.62 | 275 |
| NAAC-2 | 0.53 | 6444 | 137 | 0.86 | 215 |
| NAAC-3 | 0.42 | 7680 | 154 | 1.02 | 187 |
| LAAC-1 | 0.59 | 3574 | 93 | 0.48 | 192 |
| LAAC-2 | 0.52 | 4385 | 96 | 0.58 | 186 |
| LAAC-3 | 0.42 | 5559 | 100 | 0.74 | 150 |
δ0 represents the displacement at the failure load.
Publisher’s Note: MDPI stays neutral with regard to jurisdictional claims in published maps and institutional affiliations. |
© 2021 by the authors. Licensee MDPI, Basel, Switzerland. This article is an open access article distributed under the terms and conditions of the Creative Commons Attribution (CC BY) license (http://creativecommons.org/licenses/by/4.0/).
Share and Cite
MDPI and ACS Style
Wang, H.; Wu, Y.; Wang, L.; Chen, H.; Cheng, B. Properties of a Lightweight Fly Ash–Slag Alkali-Activated Concrete with Three Strength Grades. Appl. Sci. 2021, 11, 766. https://0-doi-org.brum.beds.ac.uk/10.3390/app11020766
AMA Style
Wang H, Wu Y, Wang L, Chen H, Cheng B. Properties of a Lightweight Fly Ash–Slag Alkali-Activated Concrete with Three Strength Grades. Applied Sciences. 2021; 11(2):766. https://0-doi-org.brum.beds.ac.uk/10.3390/app11020766
Chicago/Turabian StyleWang, Huailiang, Yuhui Wu, Lang Wang, Huihua Chen, and Baoquan Cheng. 2021. "Properties of a Lightweight Fly Ash–Slag Alkali-Activated Concrete with Three Strength Grades" Applied Sciences 11, no. 2: 766. https://0-doi-org.brum.beds.ac.uk/10.3390/app11020766
Note that from the first issue of 2016, this journal uses article numbers instead of page numbers. See further details here.