POP-ON: Prediction of Process Using One-Way Language Model Based on NLP Approach


1
Department of Smart Factory Convergence, Sungkyunkwan University, 2066 Seobu-ro, Jangan-gu, Suwon 16419, Korea
2
Department of Systems Management Engineering, Sungkyunkwan University, 2066 Seobu-ro, Jangan-gu, Suwon 16419, Korea
*
Author to whom correspondence should be addressed.
Appl. Sci. 2021, 11(2), 864; https://0-doi-org.brum.beds.ac.uk/10.3390/app11020864
Submission received: 30 December 2020
/
Revised: 13 January 2021
/
Accepted: 15 January 2021
/
Published: 18 January 2021
(This article belongs to the Special Issue Artificial Intelligence and Machine Learning in Software Engineering)
Abstract
:In business process management, the monitoring service is an important element that can prevent various problems in advance from before they occur in companies and industries. Execution log is created in an information system that is aware of the enterprise process, which helps predict the process. The ultimate goal of the proposed method is to predict the process following the running process instance and predict events based on previously completed event log data. Companies can flexibly respond to unwanted deviations in their workflow. When solving the next event prediction problem, we use a fully attention-based transformer, which has performed well in recent natural language processing approaches. After recognizing the name attribute of the event in the natural language and predicting the next event, several necessary elements were applied. It is trained using the proposed deep learning model according to specific pre-processing steps. Experiments using various business process log datasets demonstrate the superior performance of the proposed method. The name of the process prediction model we propose is “POP-ON”.
1. Introduction
The main characteristics of corporate and industrial processes are dynamics, complexity, and uncertainty. In particular, the manufacturing industry increases in complexity due to the dynamic situation change of many infrastructures and various products and services produced. At the same time, the globalization of industry makes the development cycle of new and innovative technologies shorter and leads to shorter product life cycles [1]. Therefore, companies need to quickly adapt to changes in the environment and technology to gain a competitive advantage [2]. Accurately grasping the planning deviations of a business process in real dynamic situations is essential to enabling companies to respond flexibly to all situations [3]. Process management through general documentation can lead to discrepancies between the actual and documented [4]. In the business flow, many and various event logs are generated. More business management systems can appear based on these logs. Process mining helps keep complex processes up to date and monitored. It extracts data from the event log and performs an important function to improve flow. In addition, it can increase the competitiveness of tasks such as the the optimization of management time, cost reduction and error control. As a result, relevant research being conducted in many fields [5].
However, the efficiency is limited because of the lack of high-level predictive analysis of the manufacturing and overall industry in the monitoring system. Most business process-related solutions have mainly solved enterprise operation problems such as infrastructure statistics [6]. Unfortunately, simply making it efficient only in terms of operations cannot keep manufacturing companies competitive in the future. Accordingly, to provide better products and services, many companies are putting a lot of effort into making decisions using vast amounts of data generated in manufacturing [7,8]. In the future, in addition to documenting, diagnosing, and inspecting historical data, it is also necessary to shift the direction of pre-decision making that enables predictive analysis of the next action of flow. There has been much prior research related to process prediction, but there is still an insufficient number of cases in which various decision-making models are applied. In this paper, we propose a predictive model of the process and compare it to existing studies.
Business process prediction extracts features from log data and matches variables of interest. Predicting successive target values, such as the remaining process execution time, is a regression problem. It is a classification problem to predict the next event of a running case, the result of executing a process instance, and individual target values such as service level contract violations. Based on the recorded log data, the past events of the current process instance are considered. It focuses on devising a classification problem that predicts the next event and an approach to solving it. This enables analysts to intervene and prevent problems that may occur in the workflow with previously analyzed information. This is an important issue in a monitoring system. We solve this problem with a fully attention-based transformer approach.
For process mining, we propose method of transforming OpenAI GPT-2 (Generative Pre-Training 2), a transformer-based one-way language model and compared it to deep learning methods from other studies. In addition, the prediction accuracy is further improved through the specific data pre-processing method and hyperparameter optimization of the proposed model. POP-ON (Prediction of Process Using One-way Language Model based on NLP (Natural Language Processing) Approach) proposed in this paper is designed according to the application and necessity in actual process prediction, and shows superior quantitative indicators compared to previous research results.
The rest of this paper is organized as follows. Section 2 introduces process mining used in manufacturing, as well as existing process prediction models. Section 3 details the components, approaches and key ideas of the proposed POP-ON model. In Section 4, experimental and evaluation analyses of the proposed method are performed. Finally, we conclude the paper with a summary and suggest future research directions.
2. Related Work
2.1. Event Log
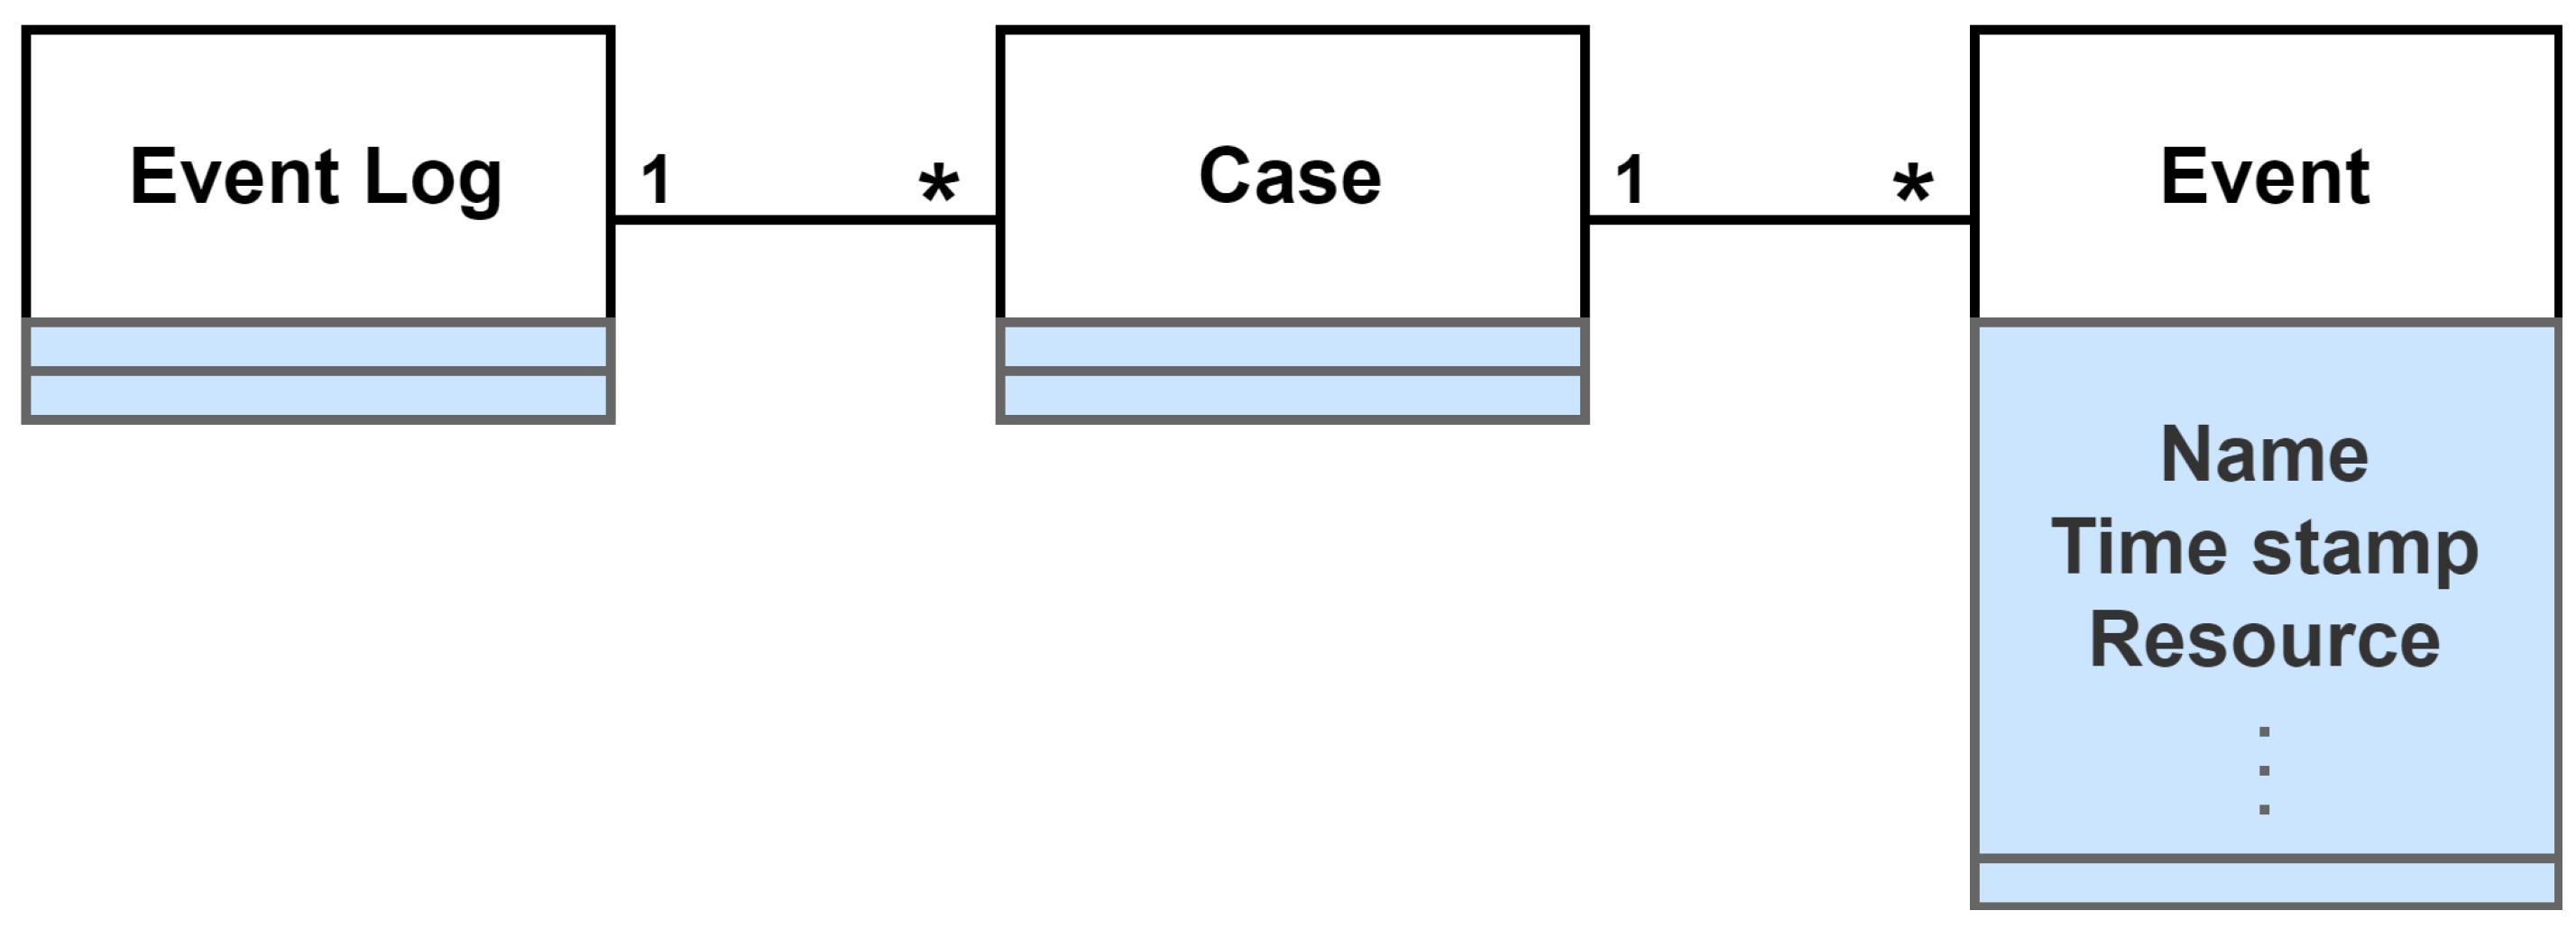
The event log that occurs in a typical application with a manufacturing process workflow consists of several cases [9], which indicate the running status of the business process instance as shown in Figure 1. This can be called event tracking.
The figure shows a simple UML (Unified Modeling Language) class diagram describing the interdependencies between event logs, cases, and events in process analysis [10]. The symbol ‘*’ means the whole case. The event log consists of several cases, but a single case is always assigned to one event log. The same applies to case-to-case relationships [10]. Events contain properties that indicate their characteristics. Common attributes include the name of the running event, the timestamp of the event, and the organization resource or role. Predicting the next event usually involves taking into account the sequence of past events in a particular process. In this paper, we consider analyzing logs generated by various software packages and manufacturing processes, such as Enterprise Resource Planning (ERP), Manufacturing Execution System (MES), and Supply Chain Management (SCM), and use them to predict the next event.
2.2. Process Mining for Manufacturing
Business process modeling has been widely used as a way to represent activities within an enterprise such as entities and activities and relationships [11]. In many studies, there has been a lot of effort to develop process modeling techniques and tools and applications using them [12]. Process mining connects data mining and business process modeling. Software vendors have begun to incorporate more and more functions into their solutions using process mining [13]. In particular, it was recognized as another way to analyze and improve an information system in production, logistics, and manufacturing. Using the data of the event log generated by the information system helps to improve the business process [14]. Process mining is actively researched for integration into a wide maintenance framework to effectively handle the manufacturing flow [15]. The work of applying process mining to manufacturing and logistics has already been carried out with related datasets, where it was proven that it can be applied to actual manufacturing processes. However, in process prediction, improvement work such as data pre-processing, unbalanced problem, hyperparameter optimization, and the introduction of more diverse prediction models are needed [15].
2.3. Prediction of Process
The latest works have evolved from explicit process models to deep learning approaches. There is a case of applying RNN (Recurrent Neural Network) and LSTM (Long Short-Term Memory) after changing input characteristics using word embedding [16]. We investigated studies attempting to improve accuracy by adding explanatory variables for each available case and event. On the one hand, the BPI Challenge 2012 and 2013 datasets were used to verify the results of process prediction. In addition, the LSTM method was applied, but a study was conducted to convert the input activity into a feature vector using one-hot encoding without considering only the order of occurrence and time stamp of the activity [17]. All previous studies used the same approach to predict the duration of process activity. However, in previous studies, attempts to improve the quality of predictive models have been insufficient. In addition, there is a need to improve hyperparameter optimization and improve prediction performance by supplementing data pre-processing.
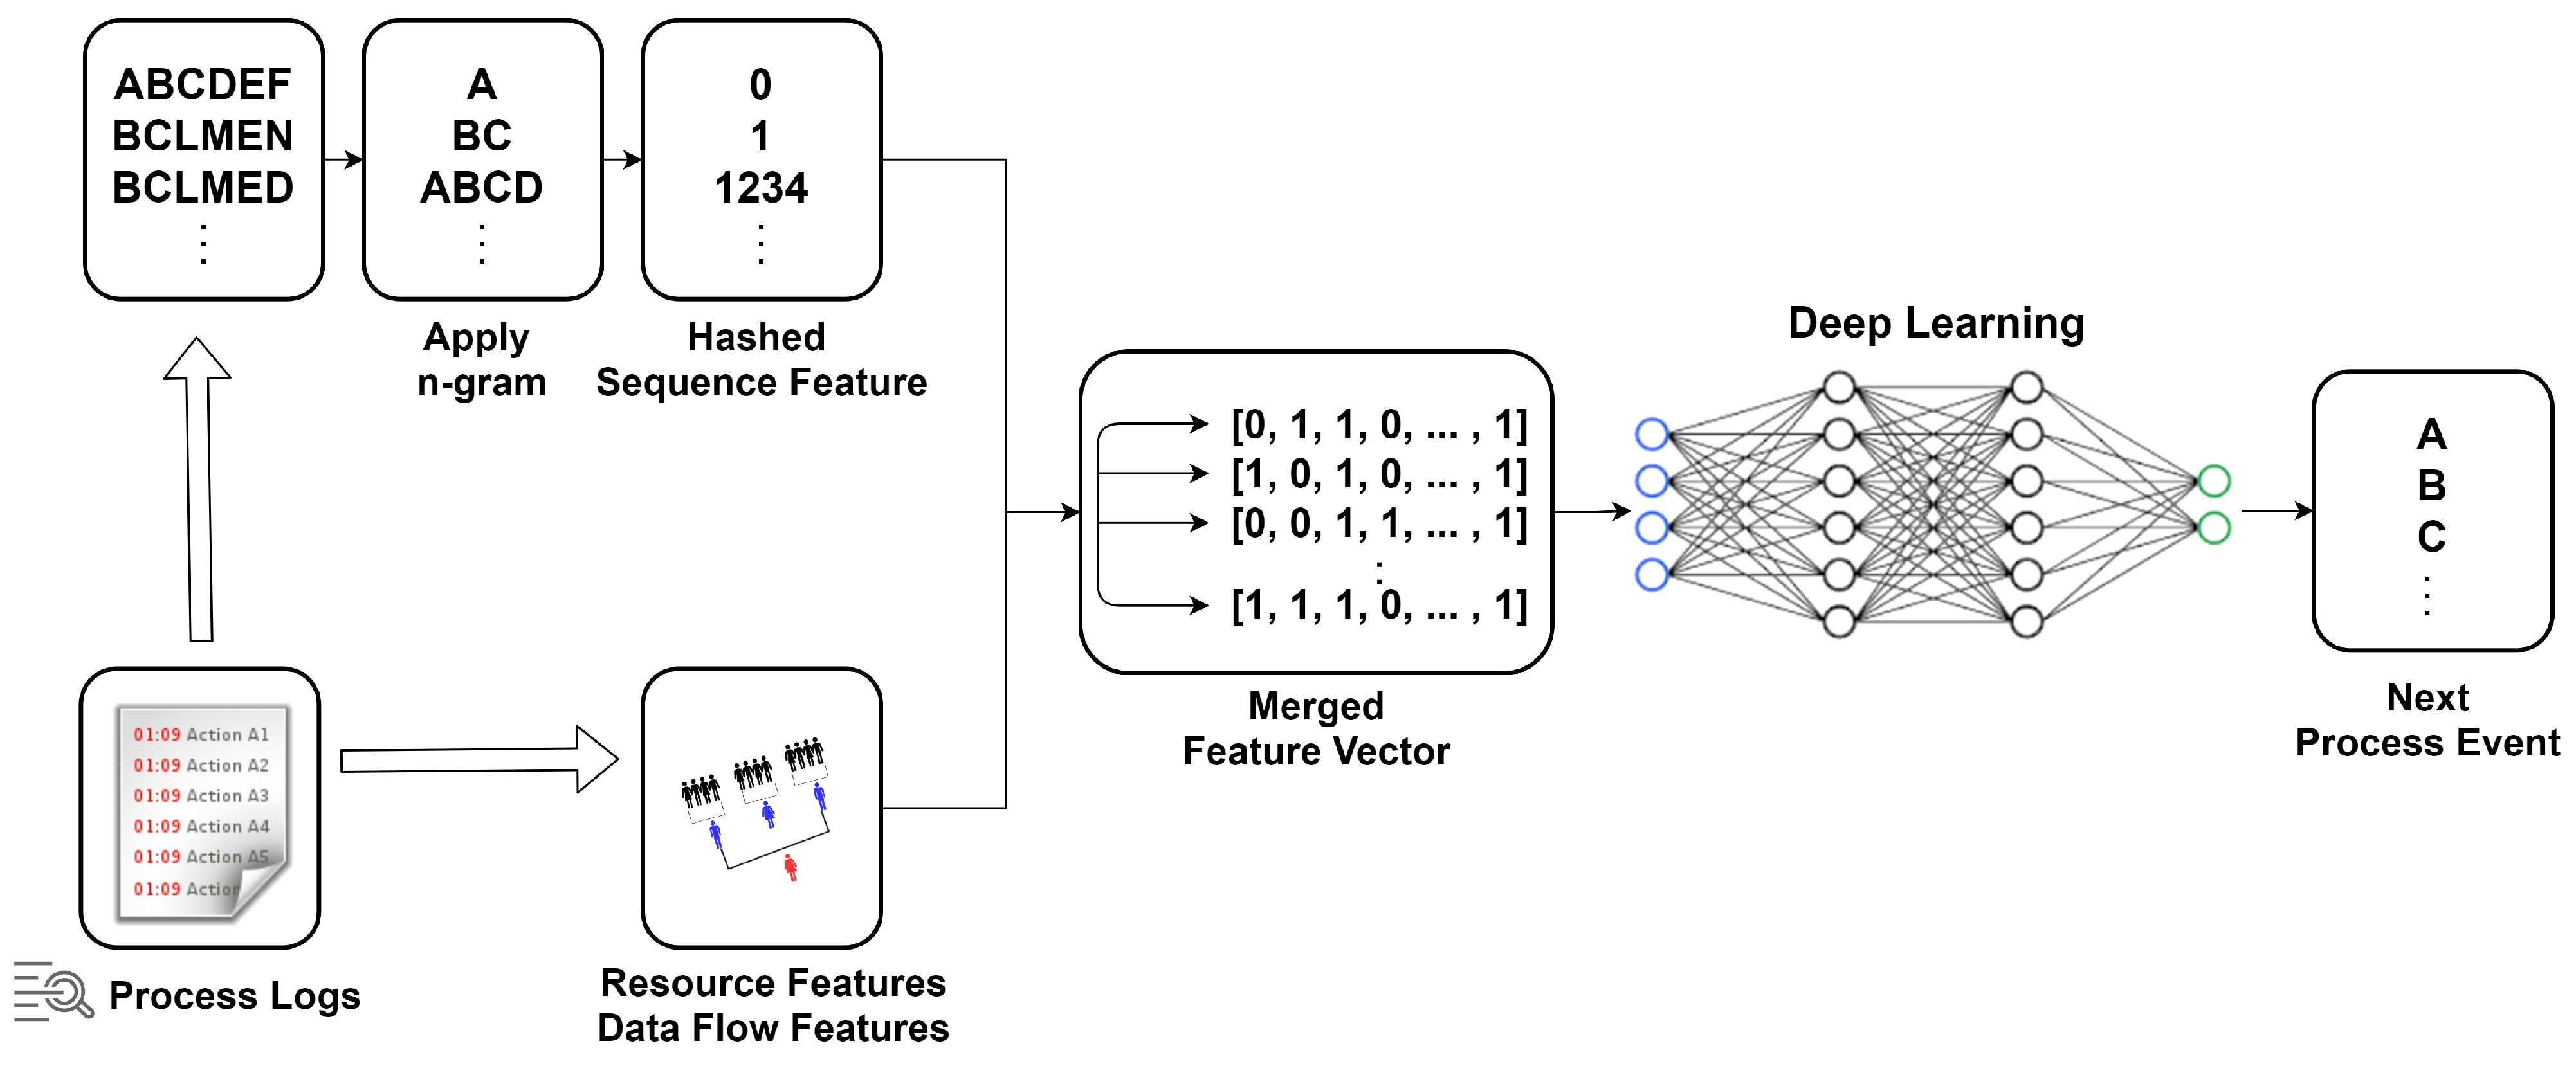
Recently, there have been studies that change the data pre-processing approach to improve event prediction performance through process mining. Here, the process of converting sequential process data into neural network input features according to a predetermined prefix size was performed. Most of the existing approaches simply use index encoding to construct feature vectors from sequence data, but in many cases they do not consider interdependencies between sequential event data [18,19]. To solve this problem, studies using n-gram encoding schemes have appeared. The n-gram approach can lead to a high-dimensional feature space in proportion to the size of the event space. In another research case, event prediction was treated as a classic multi-class classification problem. The classified features were extracted using a deep feed-forward network based on a stacked auto-encoder [20]. This research specified the pre-processing of the input data by combining n-gram and feature hashing. The overall outline of the study is shown in Figure 2. However, this approach is only possible with simple datasets because the amount of distinct expressions increases polynomial with the number of distinct event classes. Many software products used in the manufacturing process are not simple datasets. There is a need to develop a way to process massive amounts of complex real-time data.
2.4. Transformer
Deep learning and pre-training models have shown excellent results in several recent language analysis and prediction task including ELMo (Embeddings from Language Models) [21], OpenAI GPT (Generative Pre-Training) [22], GPT-2 [23], and BERT (Bidirectional Encoder Representations from Transformers) [24]. The recent GPT-2 model achieved excellent results among several language modeling benchmarks in a zero-shot setting. It is claimed that GPT-2 is very powerful and poses a high risk of malicious use. For this reason, OpenAI has decided to block the largest model to give more time to discuss the impact of GPT-2. Additionally, transformer as a bidirectional encoder language representation model (BERT) in 2018, achieved state-of-the-art performance across NLP (Natural Language Processing) tasks such as linguistic sentiment analysis and question answering. The basis of BERT and GPT-2 is a transformer model with a fully attention-based approach, unlike the existing sequence model based on an iterative architecture [25]. The advantage of using attention is that it can help interpret the decision process by showing how the model pays attention to different parts of the input [26]. Deep neurolinguistic models such as ELMo and BERT have successfully generated contextual word expressions and sensitive word vectors. In NLP, word embedding is generally the mapping of words into consecutive vectors. Replacing word embedding with contextual expressions greatly improves various NLP tasks from answering questions to solving interrelationships [21]. The word expression appropriate to the context implies that the language is highly transmissible and learns the attributes that are not restricted to the work, even though they have been educated only with language modeling work.
Recently, as the popularity of process mining has increased, some research has attempted to develop an automation tool that can extract process-related information from business documents using machine learning and NLP technologies [27]. In this research, work related to machine learning and NLP is reviewed and applied to process mining. Process mining has been discussed extensively in the literature and many tools and techniques have been developed. Therefore, in this paper, we studied a business process prediction model using the NLP approach. In particular, among the language models of the NLP approach, we propose a model modified to predict the process of GPT-2, which is a one-way language model and has strong performance.
3. POP-ON
3.1. One-Way Language Model
Given the limitations of word embedding, recent research has attempted to create a word expression that fits the context. ELMO, BERT, and GPT-2 are deep neural language models fine-tuned to create a wide range of models. As an NLP work, the internal expression of a word becomes a feature of the entire input sentence, so it is referred to as a contextualized word expression. The success of this approach suggests the language’s superior communication ability and flexibility. ELMo creates a contextual representation of each token by linking the internal state of a layer 2 biLSTM (Bidirectional LSTM) trained in a bidirectional language modeling task. In contrast, BERT and GPT-2 are two-way and one-way Transformer-based language models, respectively. Each Transformer layer of BERT and GPT-2 creates a context-processed representation of each token, paying attention to different parts of the input sentence. These models achieved state-of-the-art performance for a variety of NLP tasks, from question answering to sentiment analysis. The biggest difference between ELMo, BERT, and GPT-2 is that all of the masking deployment directions are different [28].
In this paper, we propose a deep learning-based pre-training model applicable to manufacturing process software applications and monitoring systems. There are very few studies using the existing NLP approach for business process prediction. In addition, it has not been utilized in the manufacturing domain. Therefore, we utilized GPT-2, which has shown strong performance in natural language processing and text mining.
The reason GPT-2 was judged to be more suitable than ELMo and Bert is that GPT-2 is a one-way language model. That is, GPT-2 predicts the next event in consideration of the previous event that has already progressed. In general, the previous event should be considered when fitting the next process in the process prediction process. As described above, Bert and ELMo check before and after an event, so they are suitable for process analysis and predicting the state of a specific process rather than predicting the next process. There are two ways to apply the pre-trained language expressions of the models to the actual task. One is a feature-base method, and the other is a fine-tuning method. ELMo is a feature-base method, and it can be expressed as bidirectional by applying it both left to right and right to left. However, the BERT is different in that after learning from left to right and from right to left, it then concatenates them. BERT is a model with good performance, but pre-training using masking takes into account the events before and after the event to be predicted [24]. Then, our experiments and evaluations were carried out by referring to GPT-2, a one-way language model.
3.2. Data Pre-Processing
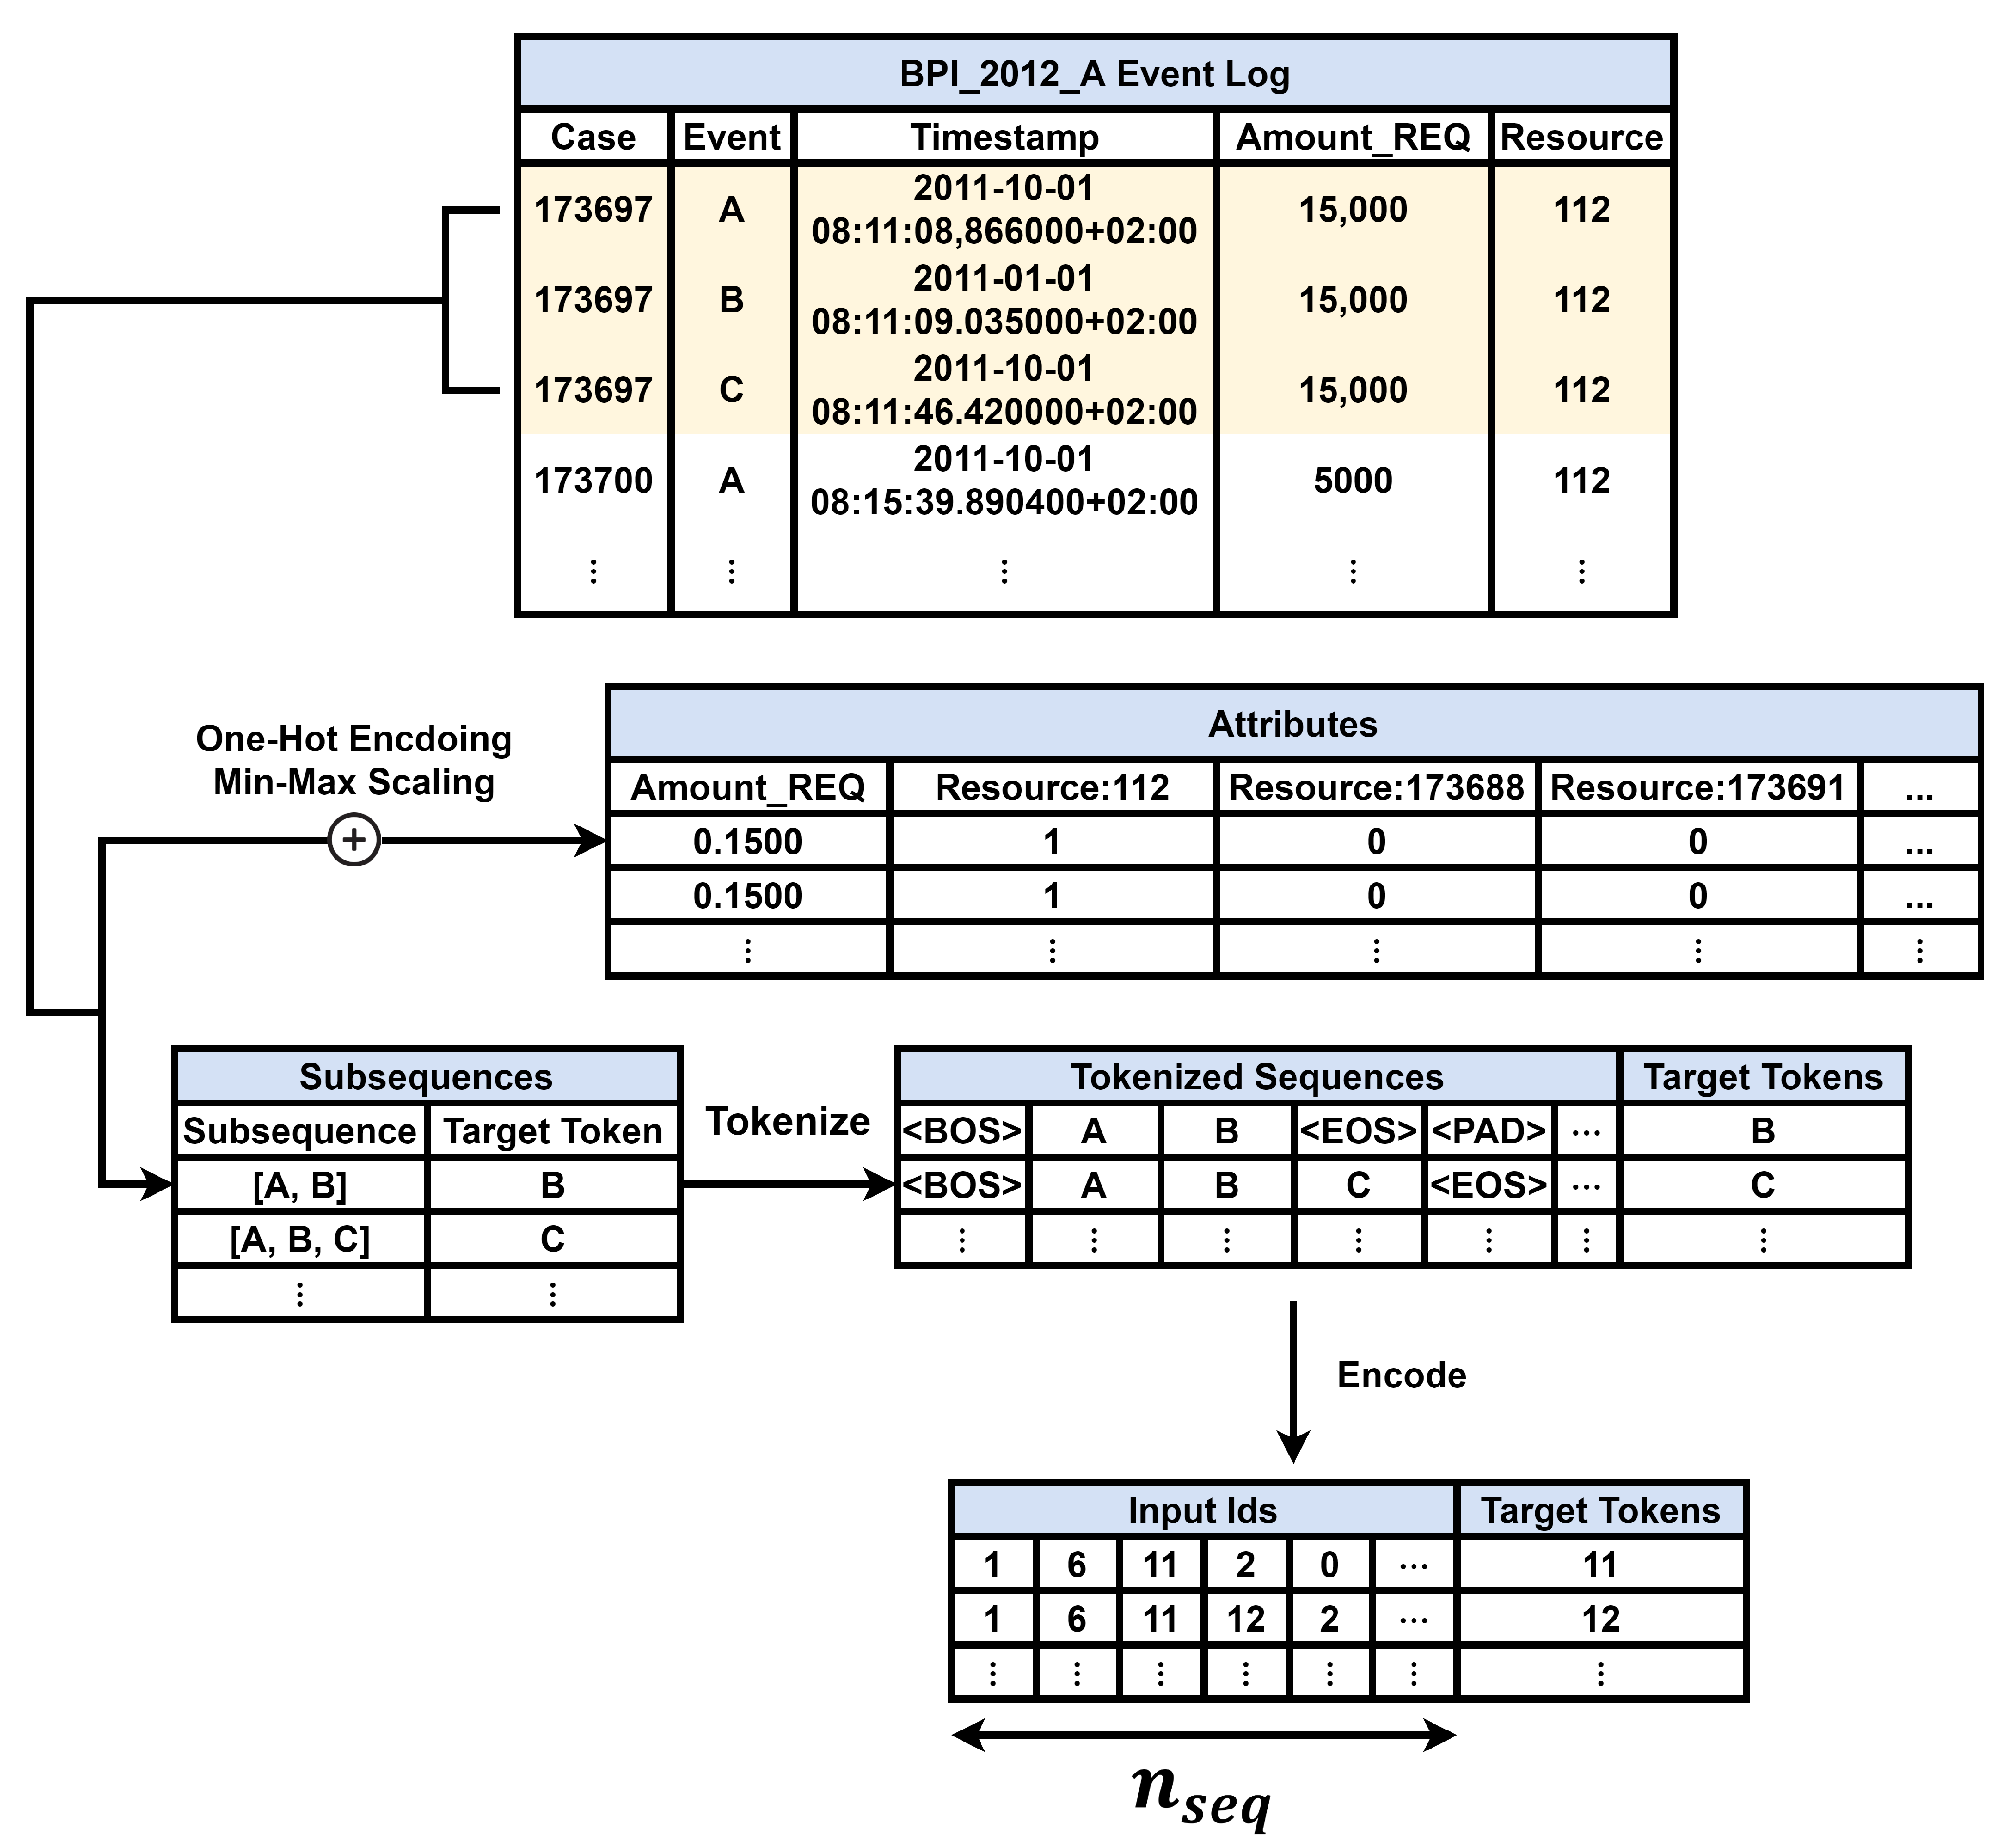
In our research, concrete data pre-processing was performed to improve the process prediction precision. As a result, the inclusion of our data pre-processing approach in the POP-ON model improved the prediction precision. Figure 3 visually shows the data pre-processing process for the event log datasets. In Figure 3, the sub sequence, label, and attribute are extracted from each case in the left event log. At the top right, special tokens are inserted and tokenized for each subsequence, and at the bottom right, one-hot encoding and min-max scaling are performed for each attribute type.
Tokenization is the breakdown of the flow of strings into meaningful tokens that are distinguished from each other [29]. The tokenization of sentences is essential for processing natural language. In this study, a series of events belonging to each case of the dataset was reported as one sentence and tokenized for each event. Tokenized events of case are called an event sequence . For case and event sequence with length , the subsequence of is shown in Equation (1):
The purpose of this study is to predict the next event in the process. Therefore, if or the length of the subsequence is 1, since in this case, it is a subsequence that cannot be used for both training and verification, it was excluded from the set of all subsequences. Therefore, for every case of length , there are subsequences each. The target token corresponding to each subsequence is the last token of the subsequence as shown in Equation (2):
The last token (target token) of the subsequence is removed, and the beginning of sequence token at the beginning and the sequence with the end of sequence token inserted at the end becomes the input sequence of the model. A padding token is inserted into each input sequence according to the length of the longest sequence among the entire input sequence set. Finally, input sequences are encoded as integers according to the vocabulary. In the vocabulary, unique integers are allocated for each token. The model outputs the result of predicting the next token at each location in the input sequence as an output sequence.
Attributes are related to the occurrence time of an event such as the amount of a request, organization, importance, product, and timestamp. In this study, attribute data was divided into categorical attributes and numerical attributes. A categorical attribute is a variable that has label values such as ‘product’ and ‘organization involved’, and a numerical attribute is data that can be expressed numerically, such as ‘case:AMOUNT_REQ’ (the amount requested by customers).
Data normalization is a process of standardizing attribute data to a smaller range by scaling. If data is normalized, the same weight can be given to all attributes. The normalization process is particularly effective for neural networks or distance-based models. By normalizing the input data of a classification problem using neural networks, it helps to accelerate the learning phase [30]. In this research, one-hot encoding was applied to the categorical attribute and min-max scaling was applied to the numerical attribute to normalize all data to the [0, 1] range.
3.2.1. One-Hot Encoding
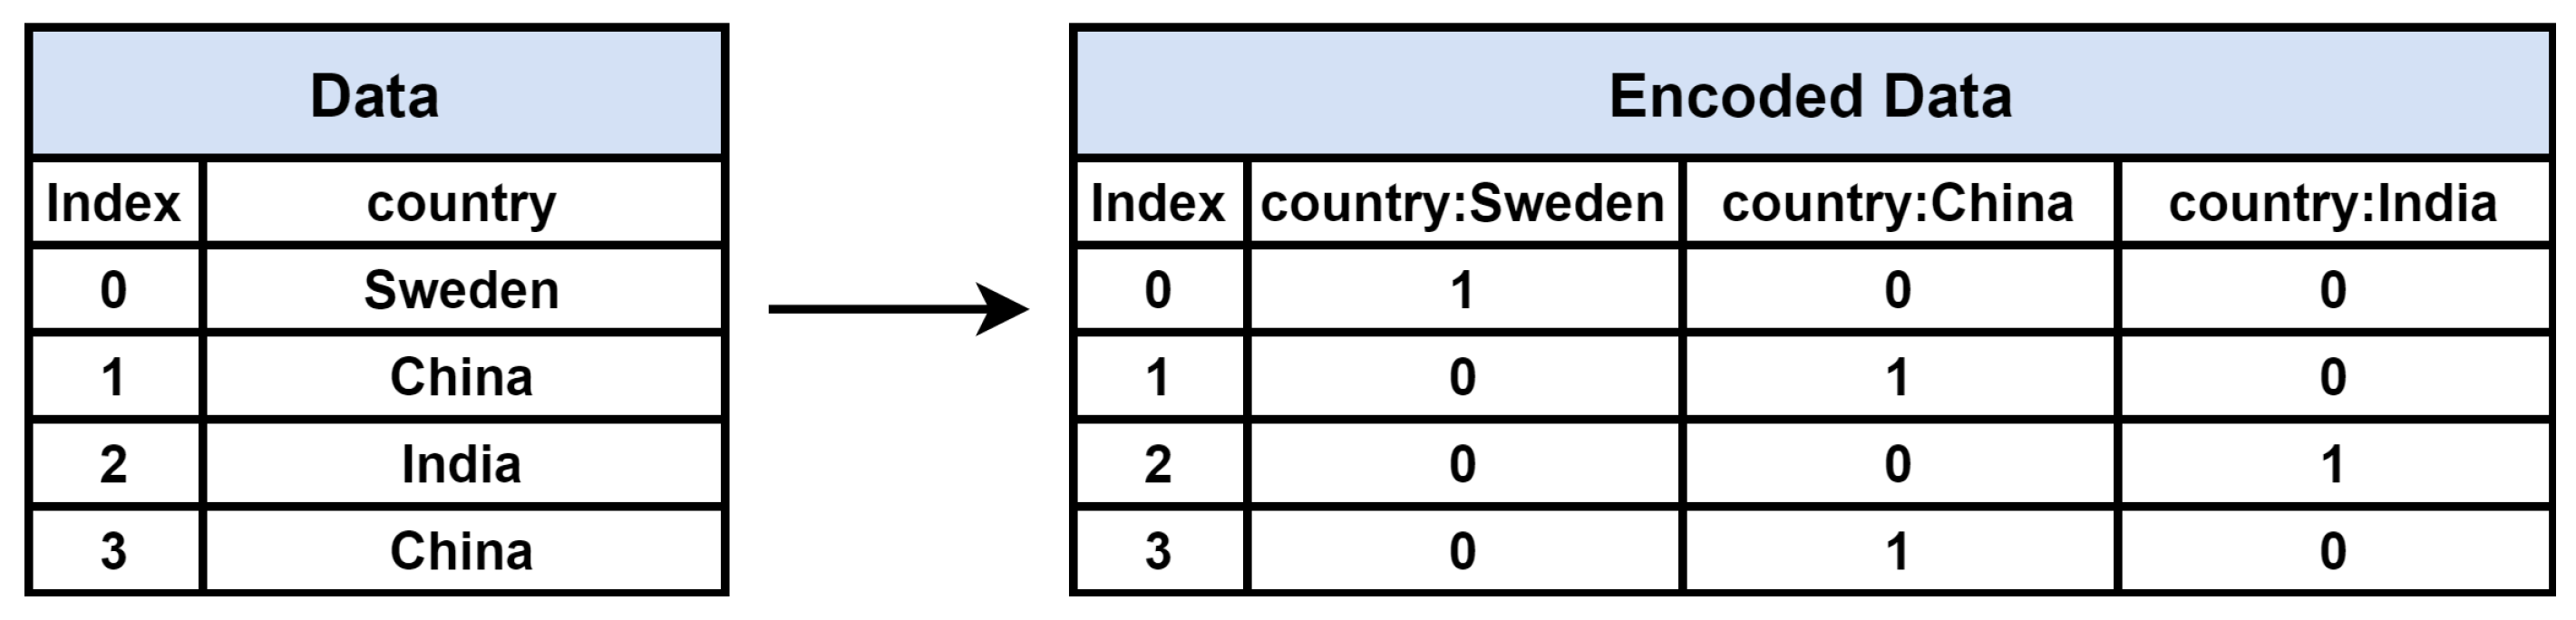
One-hot encoding is one of the main methods of handling categorical attributes. This is a method to convert the categorical attribute into a binary vector by enumerating the labels of a categorical attribute and assigning 1 and 0 to the corresponding label [31].
Figure 4 shows one-hot encoding applied to an arbitrary categorical attribute ‘country’. The labels of ‘country’, ‘Sweden’, ‘China’, and ‘India’ are listed, and 1 is assigned to the corresponding position in each row. In this study, one-hot encoding was applied to all categorical attributes.
3.2.2. Min-Max Scaling
Min-max scaling is a linear transformation technique that can adjust the range of data while preserving the shape of the data distribution. In this paper, for numerical attributes, min-max scaling was applied in the following way.
Here, x is an arbitrary numerical attribute. Through the above expression, the distribution of numerical attributes is normalized between 0 and 1. We used the MinMaxScaler class of version 0.22.2.post1 of scikit-learn to apply the min-max scaling in the development and experiment stage.
3.3. Proposed Prediction Model
We propose a new model modified from GPT-2, which is a one-way language model-based transformer approach in process prediction. It recognizes the name attribute of a process event as a kind of natural language. GPT-2, which showed excellent results in NLP, had difficulties in predicting the process, and the experiment was successfully conducted only after various attempts. The name of the process prediction model is POP-ON (POP-ON: Prediction of Process Using One-way Language Model based on NLP Approach).
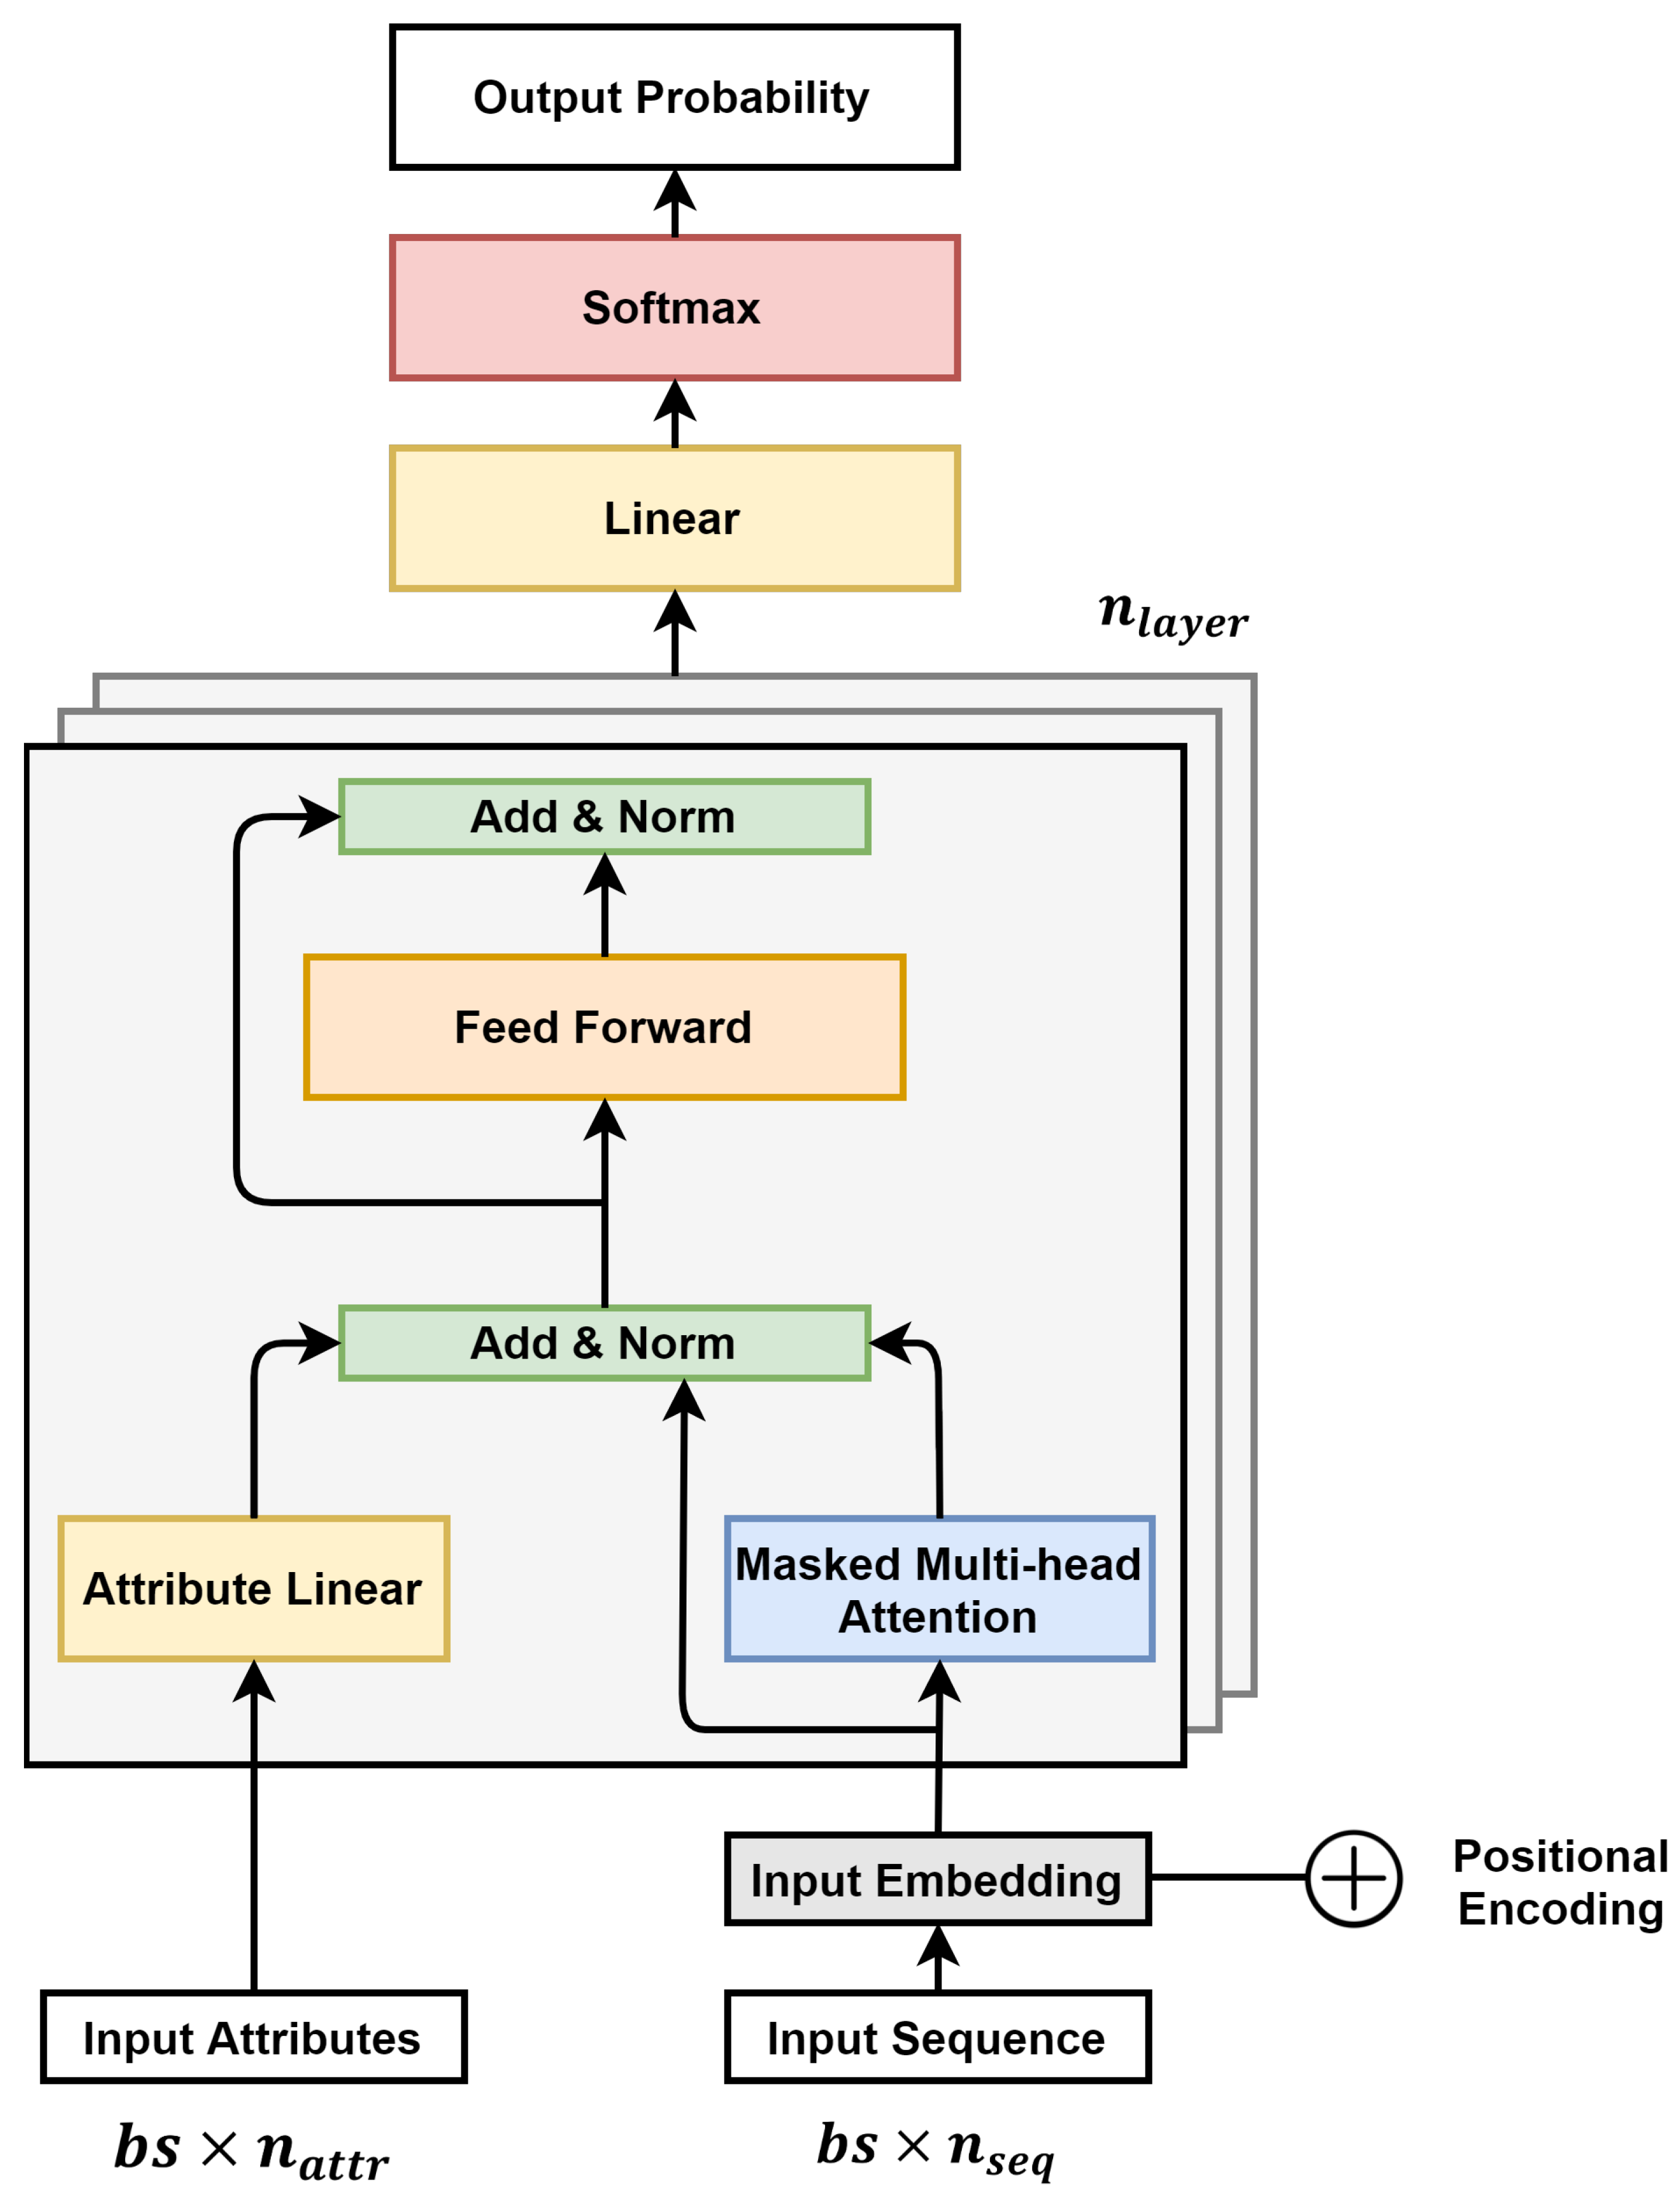
Figure 5 shows an overview of the POP-ON model. is the number of transformer decoder layers to be stacked, is the batch size, is the number of input attributes, and is the length of the input sequence. Like GPT, the structure of a multi-layer transformer decoder was basically used. The basic structure of GPT is a multi-layer stack of Transformer Decoder including Input Embedding Layer, positional encoding, and layer normalization, plus Linear Layer and softmax layer [22]. POP-ON has a structure in which Attribute Linear Layer (ALL) to be described later is added to each Transformer Decoder Layer of the GPT structure. ALL allows the attribute to be used in the next event prediction along with the sequence.
The Transformers model uses positional encoding to add information about the position of a word in a sequence. Positional encoding has a dimension of and is added to the input embedding to go to the transformer decoder layer [25].
Attention functions receive inputs as queries, keys, and values. By calculating the dot-product of the query and the keys, the similarity between query-keys is obtained, whereas Scaled Dot-Product Attention is obtained by multiplying the values by values from the softmax function after scaling, where the higher the value is, the more similar it is to the query. This means that ‘attention’ can be given to important information of the sequence. The attention function is equivalent to Equation (4) [25]:
Q and K, correspond to the dimensional matrix, and V is the dimensional matrix. is the transposition matrix of K. In the Transformers model, Multi-Head Attention is used. Multi-Head Attention performs linear projection times on Q, K, and V instead of using one attention. The projected Q, K, and V output the dimensional output through the attention function in parallel. Then, each head is concatenated and re-projected, and finally the dimension output is obtained. The Multi-Head Attention Layer used in the Transformer Decoder Layer is Masked Multi-Head Attention. When the attention of the ith position of the sequence is obtained, the position of the position after ith is masked and attention is not given to the position. MultiHead Attention is obtained as shown in Equations (5) and (6) [25]. The trainable weight matrices are , , , and .
The ALL is a fully connected FFN (Feed-Forward Network) that uses the Attribute input of a dataset as input. For the Attribute input vector x, the output of the ALL is shown in Equation (7):
Trainable weights are , , and . Here, is the middle size of the ALL layer, and ALL Layer uses dimension data as input. Then, it passes through three linear layers having a size of and an activation function ReLU, and generates an output of dimension . This output is converted back to the dimension. Therefore, linear transformation is applied differently for each position of the sequence.
Attributes entered with the sequence are added to the residual block of Multi-head Attention after passing through the three linear layers. A residual block is a structure that adds input to the output of a layer, has the meaning of adding additional learning information to existing learning information, and can solve the gradient vanishing problem as the depth of the layer increases [32]. By adding the output of ALL to the residual structure of multi-head attention, information of attributes for each position of the sequence can also be reflected. The added Attention input, Attention output, and ALL output go through Layer Normalization and Dropout layers [33,34].
Output after normalization and dropout leads to Position-wise FFN. The FFN layer is a network consisting of two layers, an activation function ReLU located between the two, and a dropout layer. The linear transformation is applied to each position of the sequence, and the output of the FFN is shown in Equation (8) [25].
The output of FFN becomes the input of the next decoder layer along with the attribute input. When passing the Decoder Layer as many as times, the probability of the next token at each location is output through the value of applying the linear transformation and softmax function to the last output [25]. In the POP-ON model, it predicts the next token at the end of the input sequence. Output predicts the next event expected at each position in the input sequence and uses Cross-Entropy loss and the Adam-Optimizer (default ). In the training process, the overall structure of the sequence was learned by calculating the loss for the entire sequence, and in the test process, the performance was measured with the prediction token of the next event location.
As input of the POP-ON model, the entire sequence of the event log is encoded and the corresponding attributes are used. For example, suppose that the subsequence (A, B, C) in Figure 3 is used for test, the sequence (A, B) is the input sequence, and the input attribute is (0.1500, 1, 0, 0, …) to predict target token C.
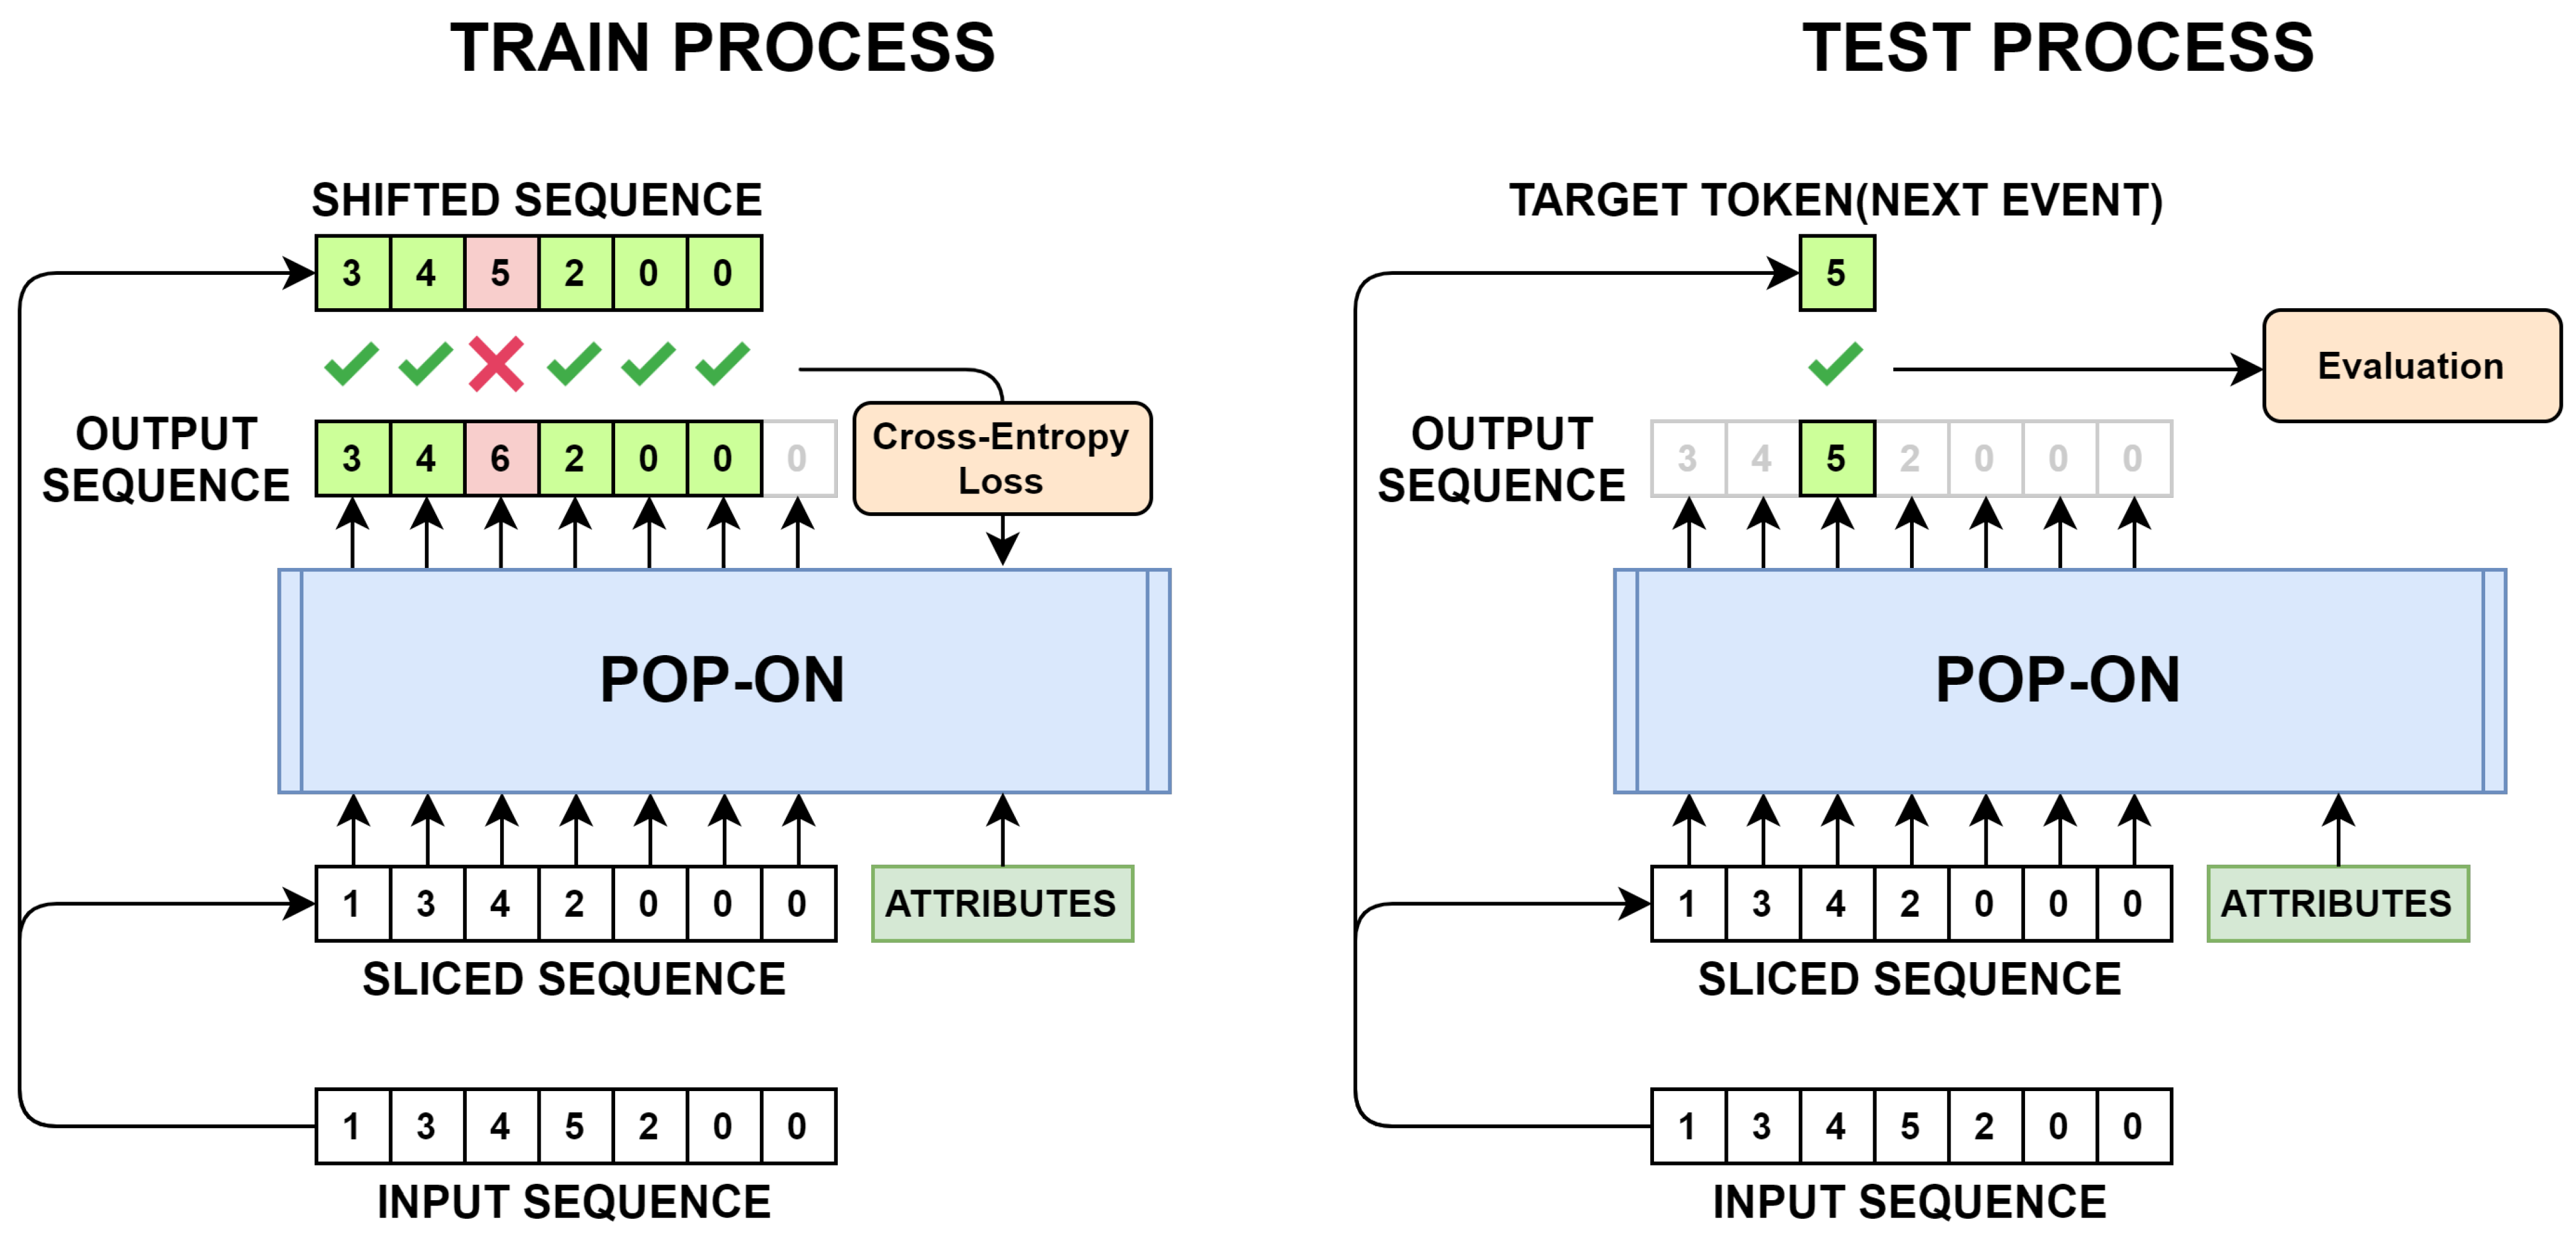
Figure 6 shows the training and testing process of the POP-ON model. In the example in the figure, the Beginning of Sequence Token is mapped to ‘1’, the End of Sequence Token is mapped to ‘2’, and the Padding Token is mapped to ‘0’. The original sequence is a subsequence consisting of the order of ‘{3, 4, 5}’, and according to Equations (1) and (2), the target token is ‘5’. The input sequence is a sequence of length, where the Beginning of Sequence Token and End of Sequence Token fill the front and back of the sequence in ‘{3, 4, 5}’, repectively, and the remaining positions are filled with the Padding Token. A sliced sequence is a sequence of length by subtracting the target token from the input sequence and filling the remaining end with the padding token.
When the sliced sequence and the corresponding attribute are input to the POP-ON model, the next token predicted at each location is the output, and the output sequence of length is generated. To compare whether the model prediction matches the actual target, the output sequence is compared with the shifted sequence. The shifted sequence is a sequence of length by removing the first token from the subsequence, and eventually the correct answer from the first to the position. Cross-Entropy Loss is calculated by comparing this with the prediction up to of the output sequence. Through back propagation, the neural network learns the structure of the entire sequence.
The test step only verifies predicting the last token of the subsequence, that is, the target token. If the location of the target token in the input sequence is , the prediction result of the output sequence is compared. In our experimental stage, the train set and test set were separated by a ratio of 8:2. To prevent overfitting, the train set was randomly permuted for each epoch during the train.
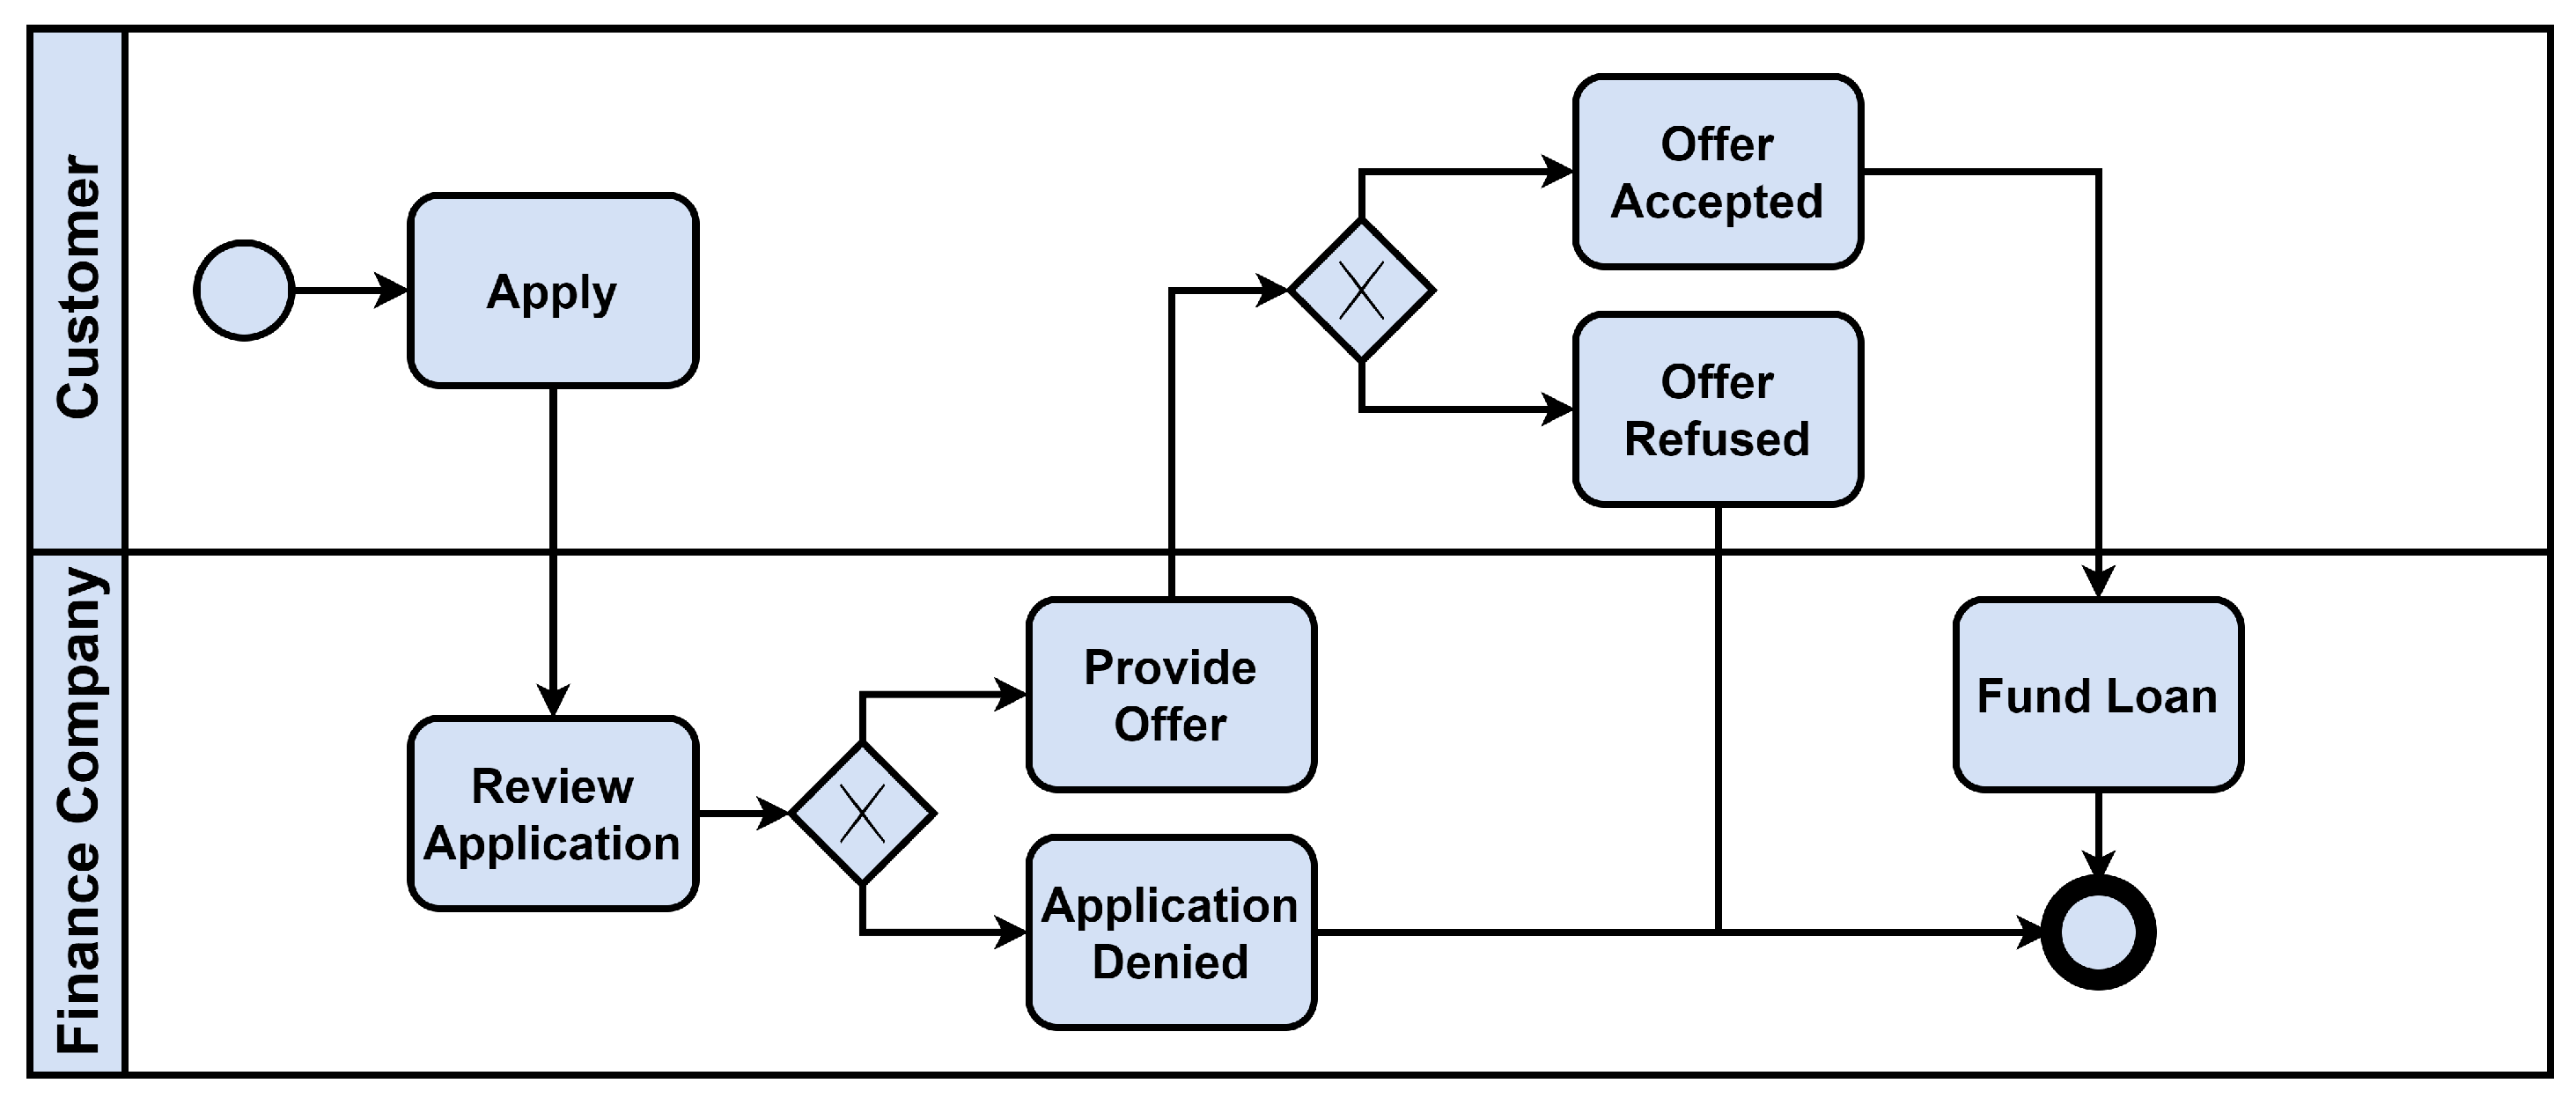
We will explain an example from the real world to make it easier to understand POP-ON. Figure 7 is a diagram to use as an example of the process of making a loan in a financial company. When a customer applies for a loan, the company reviews and deny the application or provides an offer. According to the customer’s decision, the offer is accepted or refused, and a loan is made for the accepted offer.
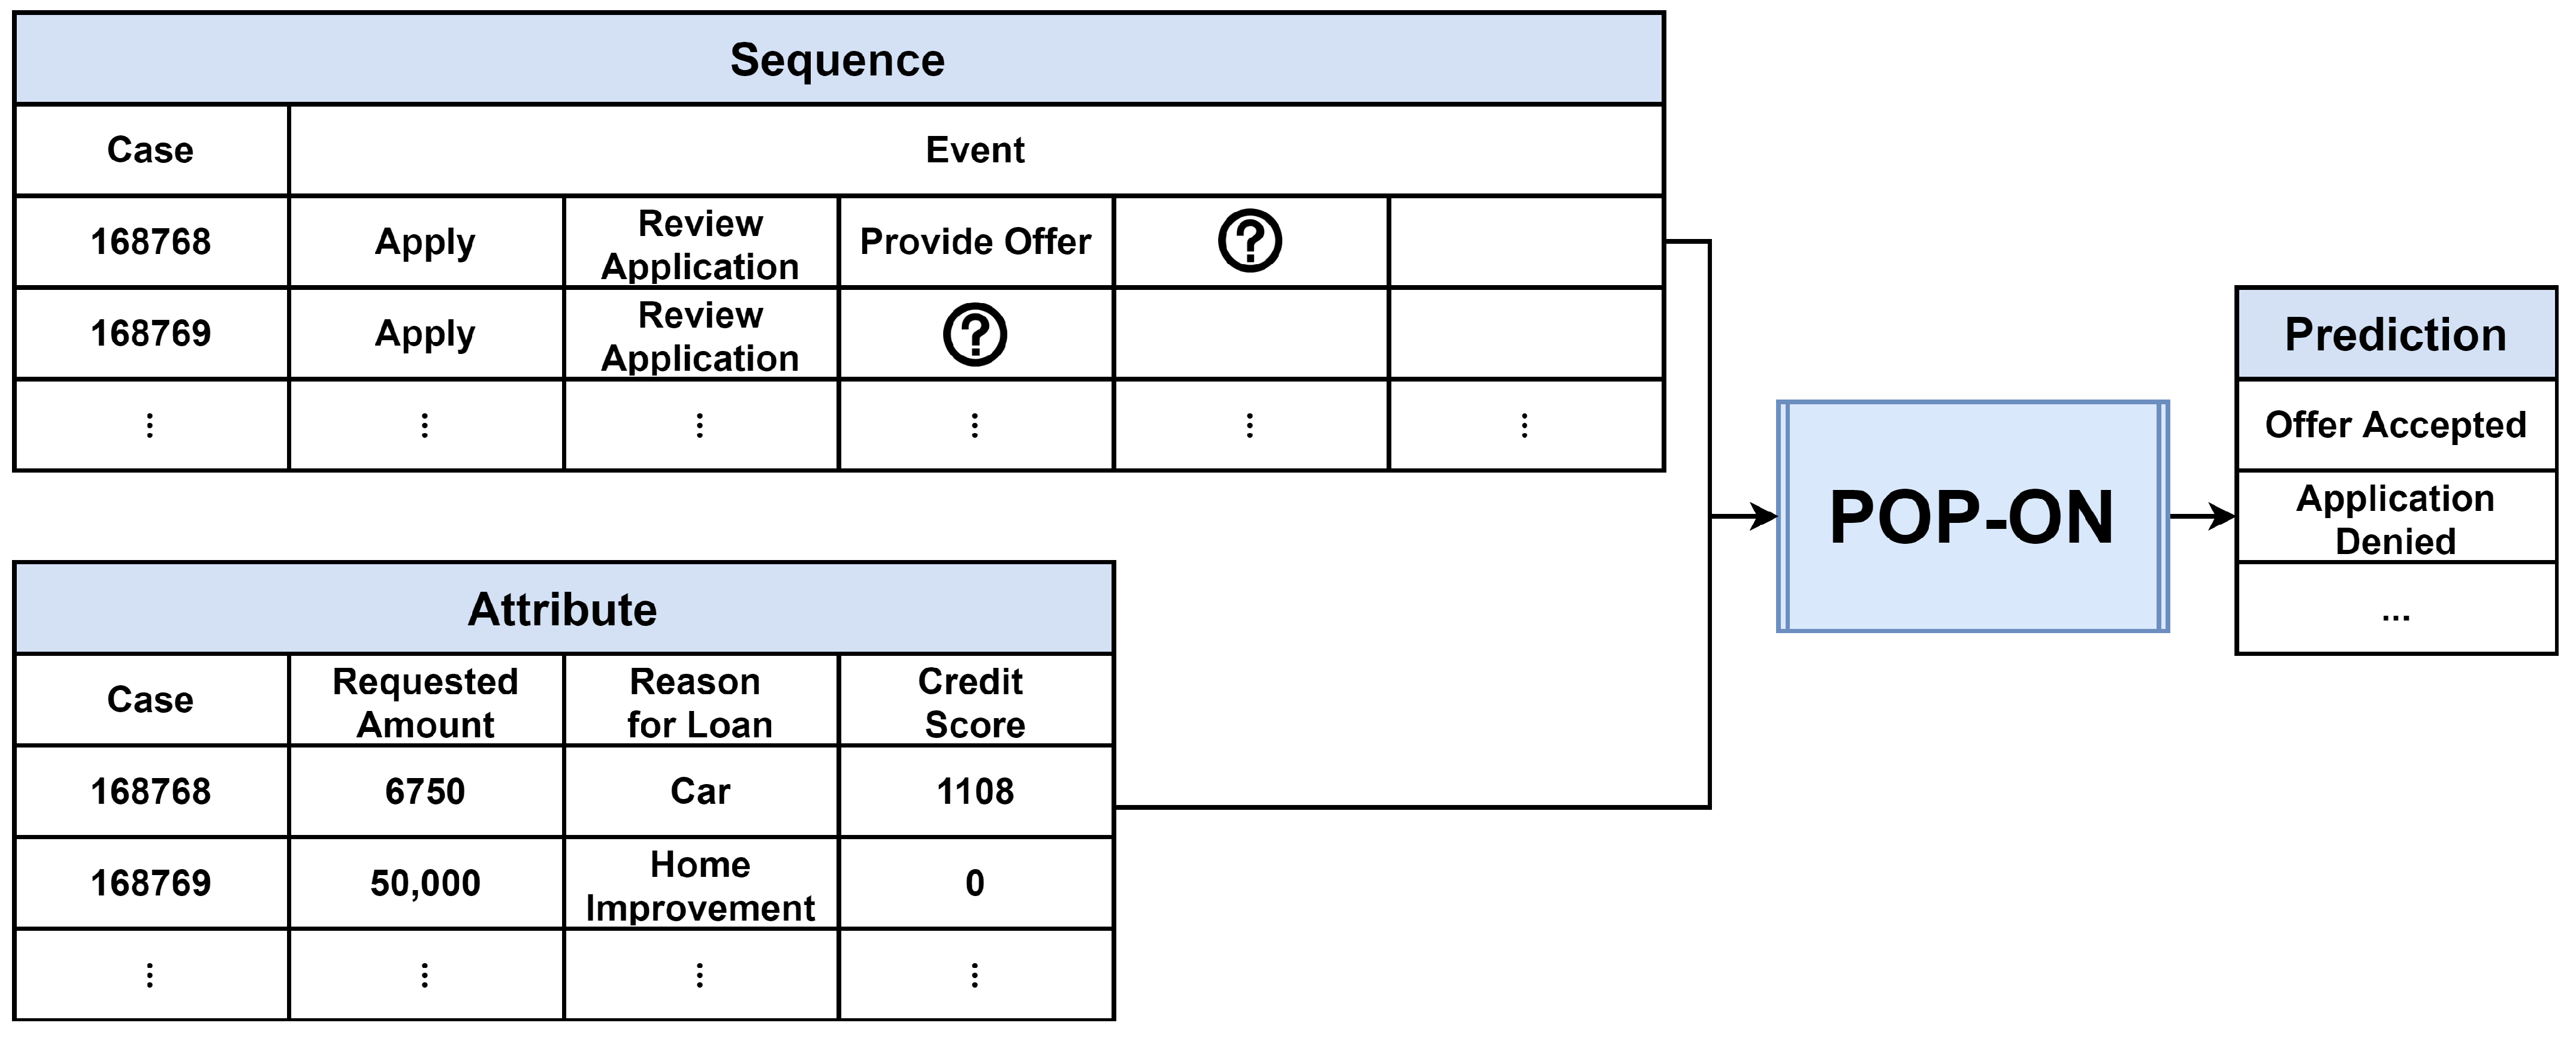
Figure 8 is an example of predicting the next event as shown in the Figure 7 process run by applying POP-ON. The amount of requests, reason for loan, and credit score presented by the customer are used as attributes, and the progress up to the present is used as a sequence. As shown in Figure 3, the attribute is processed by one-hot encoding and min-max scaling, and in the case of sequence, it is encoded as an integer according to the mapped value. The processed attribute and sequence are input to POP-ON as shown in Figure 6, and the next event is predicted. That is, in the case of 168768 in Figure 8, the event that will appear after the ‘Provide Offer’ (whether the customer will accept the provided offer) is predicted, and in the case of 168769, the event that will appear after the ‘Review Application’ (whether to deny the customer’s application or to provide an offer) is predicted.
In the actual business process, there will be attributes that greatly influence the decision of the next event. In the case of Figure 7 and Figure 8, which we have taken as an example, ‘credit score’ will be the attribute in the Review Application stage. POP-ON allows this information to be reflected in the next event prediction, thereby enabling more accurate predictions and decision support in real cases.
4. Performance Analysis
4.1. Experiment Environment
In this paper, PyTorch version 1.7.0 was used for the proposed model construction. The model was defined with the torch.nn module and the torch.optim module, and the GPU acceleration function was applied during training and testing using the torch.cuda module.
4.2. Datasets
The experiment used actual datasets, including BPI challenge 2012 [35], BPI Challenge 2013 [36], and Helpdesk [37] data. Table 1 shows the detailed characteristic information of the datasets. The number of distinct event types is the number of output classes in the multiclass classification problem. The BPI Challenge 2012 dataset consists of 262,000 pieces and 13,087 event conferences were obtained from Dutch finance. The procedure for applying for a loan is divided into an application (A), an activity belonging to the application (W), and an activity related to an offer (O). For the BPI 2012 A event and the BPI 2012 O subprocess contains only the completed lifecycle. The BPI 2012 W process includes the reservation, initiation, and completed life cycles.
The BPI Challenge 2013 dataset is an event log from the incident management and problem management system of the Belgian company Volvo IT. The incident management subset contains 7554 cases with 65,533 events distributed across 13 distinct types. In the open problem subset there are 819 cases with 2351 events distributed across 5 distinct types. The closed problem subset consists of 1487 cases with 6660 events of 7 distinct types. By merging open and closed problem subsets, we created the same dataset as the other study, generating 9011 events. The event log data from the ticketing management system developed for the Italian software company Helpdesk is the Helpdesk dataset, where there are 3804 cases in the event log with 13,710 events. The dataset information shown in Table 1 includes the total number of cases, the total number of events, the number of activities per dataset, and the number of attributes used. Table 1 shows the attributes of the events available in our experiment. We used six datasets as metrics: BPI 2012 A, BPI 2012 O, and BPI 2012 W Completed at BPI Challenge 2012 and BPI 2013 Incidents, BPI 2013, Closed Problems and Helpdesk at BPI Challenge 2013.
4.3. Evaluation Metrics
The accuracy, precision, recall, F1 Score, and MCC (Matthews Correlation Coefficient) were used as evaluation metrics to evaluate the model proposed in this paper. Table 2 shows the evaluation indexes of the multi-class classification model.
Additional explanations for Table 2 include the followings.
- : True positive. Number of cases classified as class i, and the actual class is also i.
- : False positive. Number of cases classified as class i, but the actual class is not i.
- : True negative. Number of cases not classified as class i, and the actual class is also not i.
- : False negative. Number of cases not classified as class i, but the actual class i.
- l: Number of all classes.
- : Number of class i.
- n: Total number of datasets, thus .
4.4. Comparative Analysis
There were research results in various fields using the BPI Challenge as a dataset, and there were use cases related to process prediction. The Approach in Table 3 provides a working list of different approaches used to validate our experiments. All of these tasks were performed on the BPI Challenge data set and applied a deep learning approach. In this section, we compare the prediction result values for each dataset by referring to Table 3 and show the superiority of the proposed POP-ON approach. Benchmark (accuracy) between POP-ON and existing deep learning-based process prediction studies was compared. The blue numbers in the table represent the best results for each dataset.
The attributes used in each dataset are shown in Table 4. The numerical attribute ‘time:elapsed’ is an attribute extracted from the timestamp of the log, and is the time difference between the event and the timestamp of the previous event. Hyperparameter used Equation (9), where the batch size was 64, the number of epochs was 200, and the learning rate was .
As an evaluation index, the evaluation was conducted based on the accuracy entered for each reference. As a result, POP-ON performed well on all datasets except Helpdesk. In particular, in the BPI 2012 A, BPI 2012 W Complete, BPI 2012 O, and BPI 2013 Closed Problem datasets, the POP-ON model was the best in terms of accuracy. The accuracy of the BPI 2012 A was slightly higher than most previous studies. Compared to the BPI 2012 W Complete and BPI 2012 O, it showed improvements of about 5.45% points and 6.64% points, respectively, compared to previous studies (Khan et al. [41] and Hinkka et al. [40]), which were the second best results in terms of accuracy. For the BPI 2013 Closed Problem dataset, compared to the second most accurate study (Tax et al. [17]), our approach showed an improvement of about 12.79% points. For the BPI 2013 Incidents, our method was 1.94% points better than the second most accurate approach (Hinkka et al. [40]). For the Helpdesk dataset, a previous model (Hinkka et al. [40]) showed the highest performance in terms of accuracy.
4.5. Hyperparameter Optimization
In this experiment, experiments were conducted on six datasets (BPI 2012 A, BPI 2012 O, BPI 2012 W Complete, BPI 2013 Incidents, BPI 2013 Closed Problems, and Helpdesk). The experiment was conducted using the BPI 2012 O dataset. Training was performed on a NVIDIA V100 GPU with 25GB RAM, with a batch size of 64, 200 epochs and, a learning rate of . The time taken for each epoch was measured from about 3 s to 25 s depending on the setting.
Table 5 shows a description of the hyperparameters we used, and the values for each setting for the experiments are as follows.
- ;
- ;
- ;
- .
Table 6 shows the experimental results according to the hyperparameter setting. Accuracy was used as an evaluation index, and after defining the hyperparameter setting for the dimension of the layer in the hyper parameter of the Transformer Block (in this experiment, the hyperparameters of the Transformer Decoder Layer), we changed the number of blocks according to the setting (the number of decoder layers in this experiment) and proceeded.
Table 6 shows the accuracy when the hyperparameter set and are different. As a result of the experiment, , and , where the performance was the best. Regarding the size of the model, the larger the model, the better the performance. In all hyperparameter sets, the higher the number of decoder layers , the better the performance. However, when the size of the model is large, the performance improvement is smaller and when the size of the model is small, the difference of performance according to is greater.
4.6. The Need for an Attribute Linear Layer
The key-point of POP-ON is to learn the overall structure of the sequence and add ALL to the structure of the GPT to predict the next event. Through this, the attribute information can be reflected in the next event prediction. Using the BPI 2013 Closed Problems data set, we compared the model performance according to the presence or absence of ALL of the POP-ON model. The BPI 2013 Closed Problem data set is a real life data set provided by Volvo IT, and is an event log for problem handling of IT services provided/operated by the company. The problem handling process works with other processes such as problem monitor service, discover, and define opportunity. Therefore, accurately predicting the problem handling process using event logs can reduce disruption to business and improve the availability and quality of IT services.
The BPI 2013 Closed Problems consists of 6660 events and 12 columns. Excluding the case name column, event name column, and timestamp column, 9 categorical attributes can be used. When ‘time:elapsed’ attribute is extracted from the timestamp, 10 attributes can be used. Since there are many attributes that can be used, and among them, there are attributes that are estimated to have a significant effect such as impact and product, we selected the BPI 2013 Closed Problems for the effective analysis of ALL. The learning trend and test performance were compared based on five metrics when the attributes were entered in ALL and when attributes were not entered.
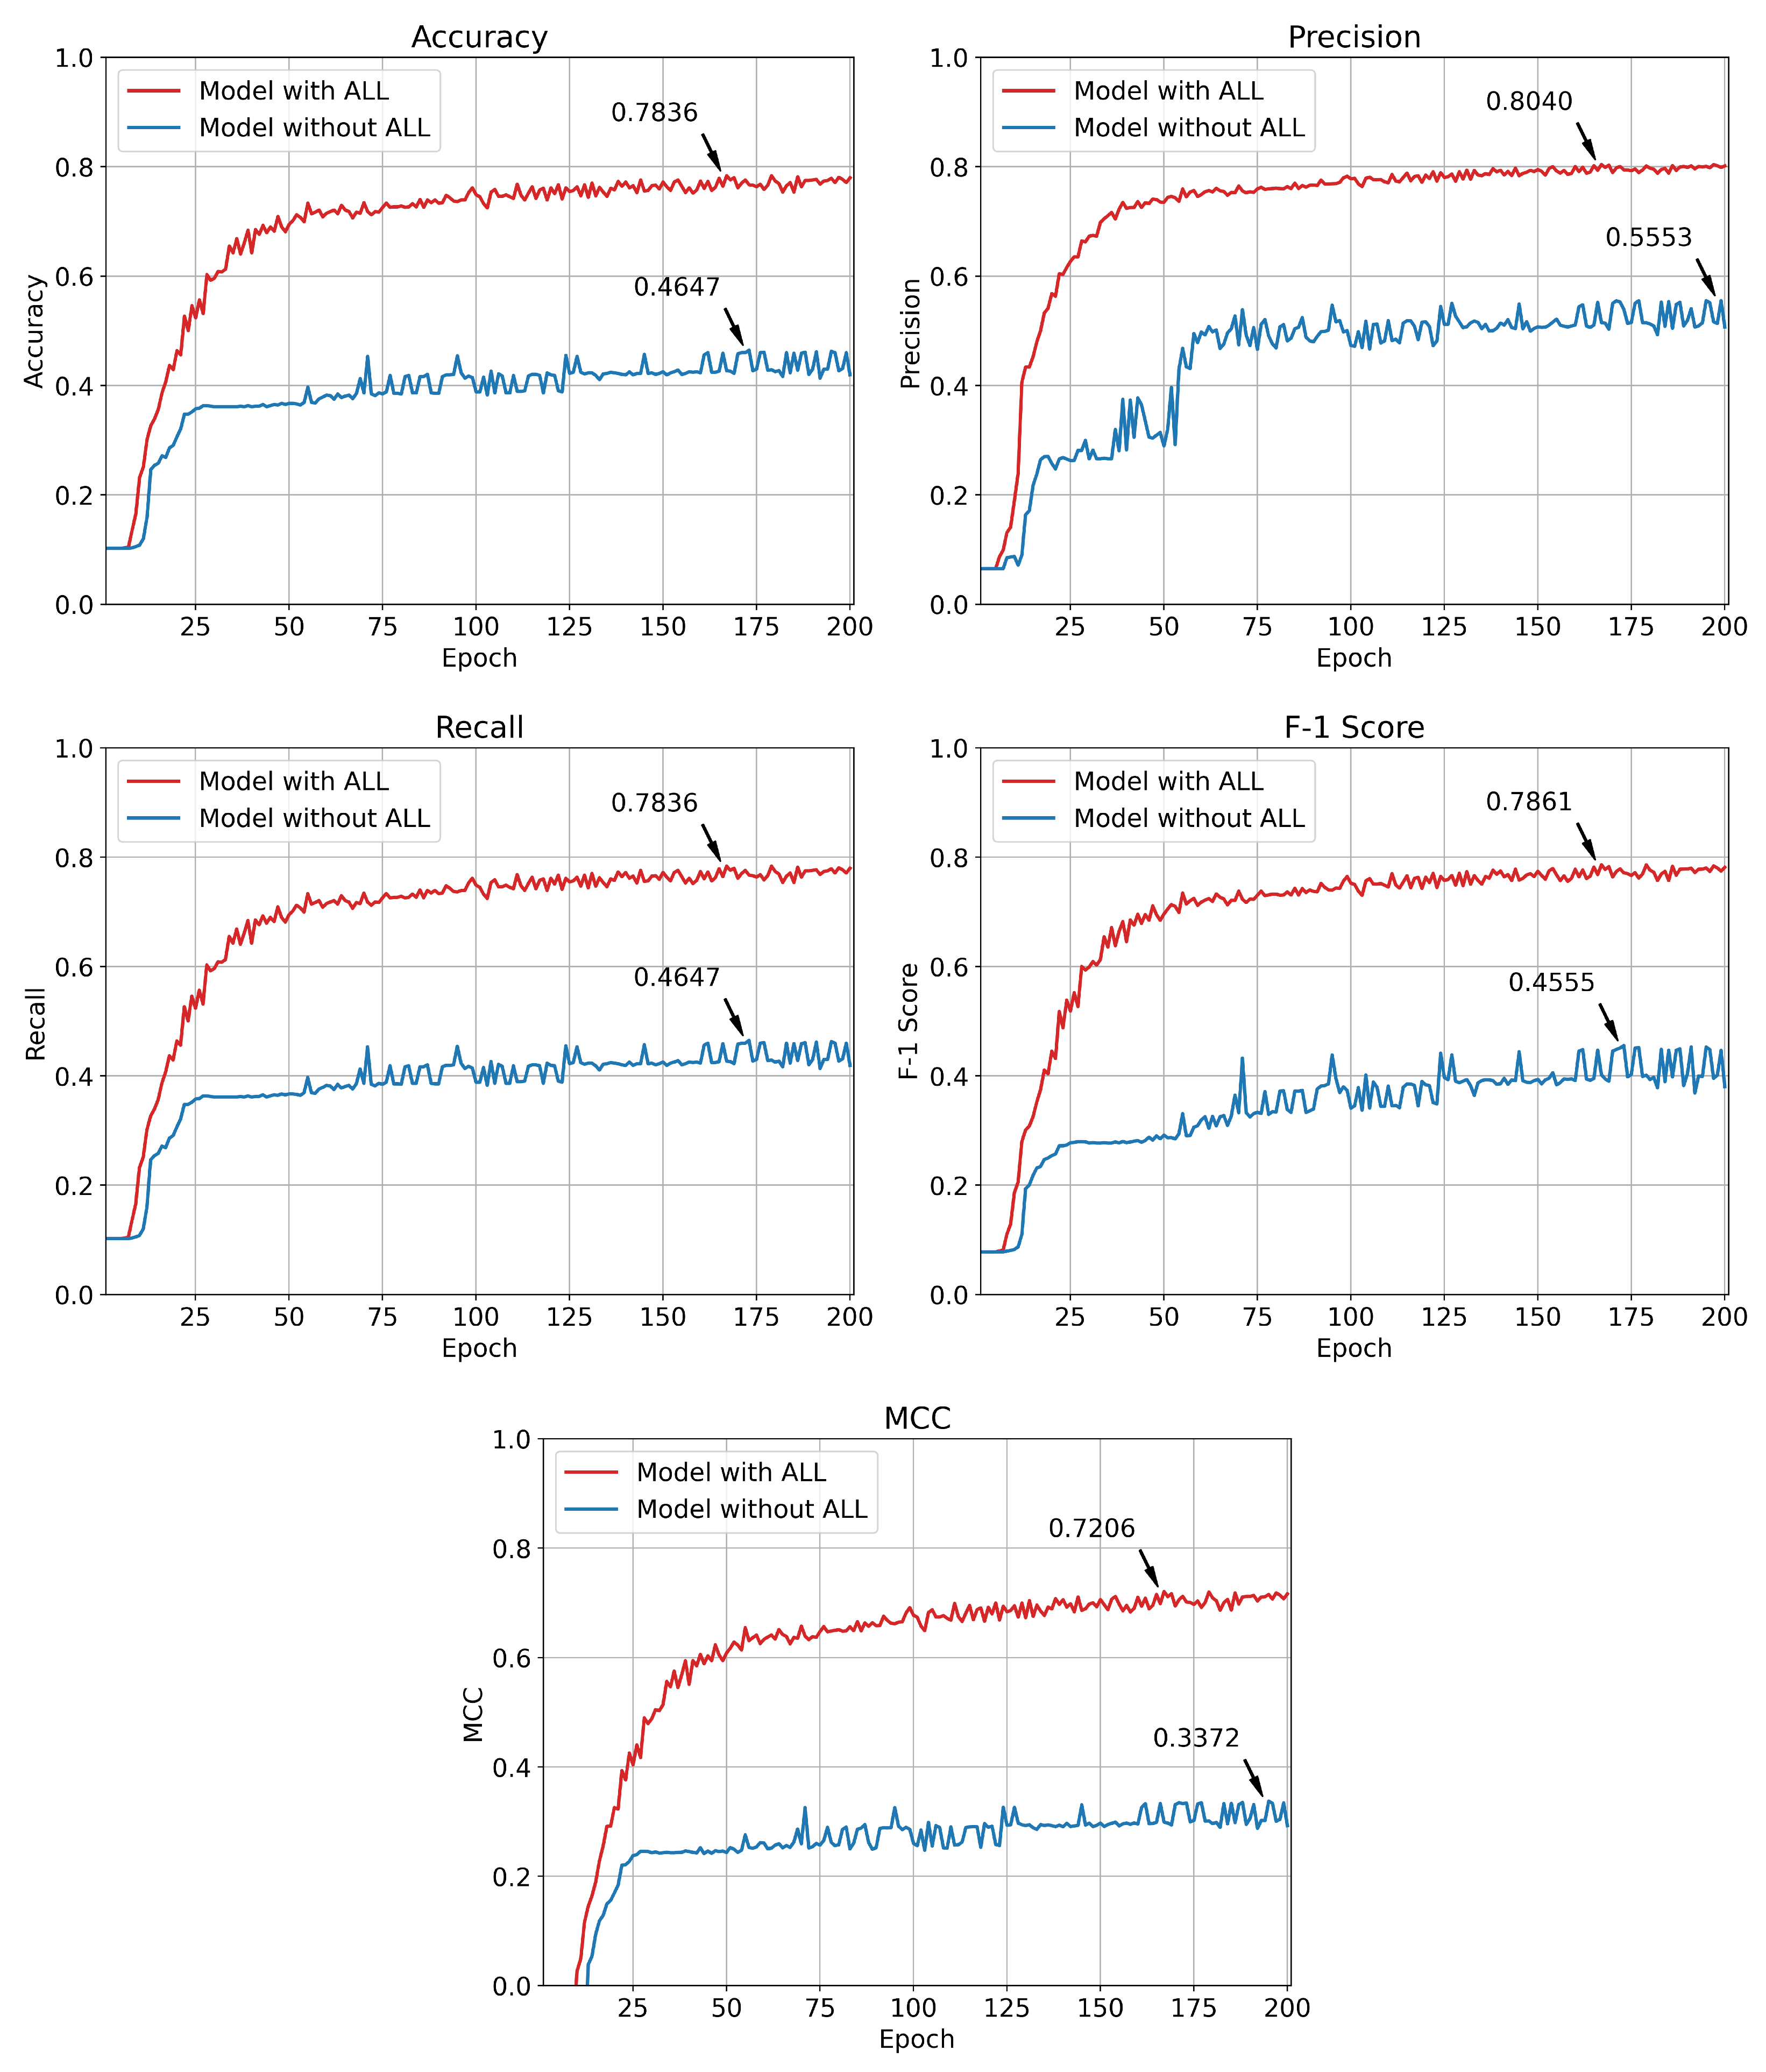
Figure 9 compares the test performance of the model according to the presence or absence of a linear attribute layer and training epoch. Among all epochs, the model with ALL resulted in the best test accuracy of 0.7836, and the model without ALL achieved the best test accuracy 0.4647. The hyperparameter used for learning was the same as Equation (10), where the batch size was 64, number of epochs was 200, and the learning rate was .
Figure 9 compares the test metrics of two models according to the training epoch. As a result of the comparison, the former model showed better performance in all five metrics used for evaluation than the latter model. The accuracy of the former was 0.7836, which was 68.62% higher than the latter which had an accuracy of 0.4647, the precision was 0.8040 vs. 0.5553 (44.79%), the recall was 0.7836 vs. 0.4647 (68.62%), the F-1 score was 0.7861 vs. 0.4555 (72.58%), and the MCC was 0.7206 vs. 0.3372, which is 113.70% higher.
5. Conclusions
In this paper, we investigated the efficiency of a one-way language model approach among fully attention-based transformer models for predicting future process events of the current process instance being executed. In addition, we proposed POP-ON, a process prediction model. As far as we know, this was the first time this approach has been applied in the area of business process prediction. The research goal was to apply the newly proposed approach to log data generated by the manufacturing process and software, and to evaluate the predictive performance of the next process event. To improve the prediction accuracy, we performed one-hot encoding and min-max scaling in the data pre-processing step, and made it possible to use categorical data. In the data pre-processing stage, after categorical data was applied to the experiment, the hyperparameters were adjusted to determine the impact on the prediction results, and hyperparameter optimization was applied to find the optimal configuration. Based on GPT-2, the proposed POP-ON model adds a linear network that uses the attribute of an event as an input to the residual structure of the multi-head attention layer within the Transformer Decoder Layer so that elements other than the sequence can be reflected in the prediction.
In Section 4, the predictive performance of the proposed approach and the existing deep learning approach were compared and evaluated. The experimental results suggest that the proposed method achieved good results in the evaluation index and outperformed the state-of-the-art approach in most experiments. In addition to its excellent predictive performance, the proposed Transformer approach demonstates that powerful predictive models of the latest trends used in NLP could also be used in process mining based on business process log data.
Future research aims to solve the ‘black box’ characteristic of the deep learning method used in the process prediction analysis process and provide post-mortem explanations so that domain experts can interpret the prediction. This is important for ensuring reliability of model results and applying them to actual processes in enterprises. Our future research goal is to make the process prediction model easier to understand, and to use the reliable predictive model for enterprise. In addition to the one-way language-based model in the transformer, we intend to analyze the process with a powerful model that considers the state of events in both directions such as BERT. In process prediction, a one-way language model was used as needed. However, in addition to forecasting, business process management requires a more versatile monitoring component, and another approach can be applied for this.
Author Contributions
Conceptualization, J.M. and J.J.; methodology, J.M.; software, J.M. and G.P.; validation, J.M. and J.J.; formal analysis, G.P.; investigation, J.M. and G.P; resources, J.J.; data curation, J.M.; writing—original draft preparation, J.M. and G.P.; writing—review and editing, J.J.; visualization, G.P.; supervision, J.J. project administration, J.J. All authors have read and agreed to the published version of the manuscript.
Funding
This research was supported by the MSIT (Ministry of Science and ICT), Korea, under the ITRC (Information Technology Research Center) support program (IITP-2020-2018-0-01417) supervised by the IITP (Institute for Information & Communications Technology Planning & Evaluation).
Institutional Review Board Statement
Not applicable.
Informed Consent Statement
Not applicable.
Data Availability Statement
BPI Challenge 2012 (www.win.tue.nl/bpi/doku.php?id=2012:challenge), BPI Challenge 2013 (www.win.tue.nl/bpi/doku.php?id=2013:challenge), Helpdesk (data.mendeley.com/datasets/39bp3vv62t/1).
Acknowledgments
This work was supported by the Smart Factory Technological R & D Program S2727115 funded by Ministry of SMEs and Startups (MSS, Korea).
Conflicts of Interest
The authors declare no conflict of interest.
References
- Nyhuis, P.; Wiendahl, H.P. Fundamentals of Production Logistics: Theory, Tools and Applications; Springer Science & Business Media: Berlin/Heidelberg, Germany, 2008. [Google Scholar]
- Ebert, C.; Abrahamsson, P.; Oza, N. Lean software development. IEEE Softw. 2012, 5, 22–25. [Google Scholar] [CrossRef] [Green Version]
- Barad, M.; Sapir, D.E. Flexibility in logistic systems—Modeling and performance evaluation. Int. J. Prod. Econ. 2003, 85, 155–170. [Google Scholar] [CrossRef]
- Becker, T.; Intoyoad, W. Context aware process mining in logistics. Procedia Cirp 2017, 63, 557–562. [Google Scholar] [CrossRef]
- Van der Aalst, W.M.; Schonenberg, M.H.; Song, M. Time prediction based on process mining. Inf. Syst. 2011, 36, 450–475. [Google Scholar] [CrossRef] [Green Version]
- Grigori, D.; Casati, F.; Castellanos, M.; Dayal, U.; Sayal, M.; Shan, M.C. Business process intelligence. Comput. Ind. 2004, 53, 321–343. [Google Scholar] [CrossRef] [Green Version]
- Duan, L.; Da Xu, L. Business intelligence for enterprise systems: A survey. IEEE Trans. Ind. Inform. 2012, 8, 679–687. [Google Scholar] [CrossRef]
- Mun, J.; Jeong, J. Design and Analysis of RUL Prediction Algorithm Based on CABLSTM for CNC Machine Tools. In Proceedings of the 2020 7th International Conference on Soft Computing & Machine Intelligence (ISCMI), Stockholm, Sweden, 14–15 November 2020; pp. 83–87. [Google Scholar]
- Philipp, P.; Jacob, R.; Robert, S.; Beyerer, J. Predictive Analysis of Business Processes Using Neural Networks with Attention Mechanism. In Proceedings of the 2020 International Conference on Artificial Intelligence in Information and Communication (ICAIIC), Fukuoka, Japan, 19–21 February 2020; pp. 225–230. [Google Scholar]
- Philipp, P.; Georgi, R.X.M.; Beyerer, J.; Robert, S. Analysis of control flow graphs using graph convolutional neural networks. In Proceedings of the 2019 6th International Conference on Soft Computing & Machine Intelligence (ISCMI), Johannesburg, South Africa, 19–20 November 2019; pp. 73–77. [Google Scholar]
- Curtis, B.; Kellner, M.I.; Over, J. Process modeling. Commun. ACM 1992, 35, 75–90. [Google Scholar] [CrossRef]
- Bandara, W.; Gable, G.G.; Rosemann, M. Factors and measures of business process modelling: Model building through a multiple case study. Eur. J. Inf. Syst. 2005, 14, 347–360. [Google Scholar] [CrossRef] [Green Version]
- Van Der Aalst, W.; Adriansyah, A.; De Medeiros, A.K.A.; Arcieri, F.; Baier, T.; Blickle, T.; Bose, J.C.; Van Den Brand, P.; Brandtjen, R.; Buijs, J.; et al. Process mining manifesto. In Proceedings of the International Conference on Business Process Management, Clermont-Ferrand, France, 29 August 2011; Springer: Berlin/Heidelberg, Germany, 2011; pp. 169–194. [Google Scholar]
- Der Aalst, V.; Mining, W.P. Discovery, Conformance and Enhancement of Business Processes; Springer: Berlin/Heidelberg, Germany, 2011. [Google Scholar]
- Becker, T.; Lütjen, M.; Porzel, R. Process maintenance of heterogeneous logistic systems—A process mining approach. In Dynamics in Logistics; Springer: Berlin/Heidelberg, Germany, 2017; pp. 77–86. [Google Scholar]
- Evermann, J.; Rehse, J.R.; Fettke, P. Predicting process behaviour using deep learning. Decis. Support Syst. 2017, 100, 129–140. [Google Scholar] [CrossRef] [Green Version]
- Tax, N.; Verenich, I.; La Rosa, M.; Dumas, M. Predictive business process monitoring with LSTM neural networks. In Proceedings of the International Conference on Advanced Information Systems Engineering, Essen, Germany, 12–16 June 2017; Springer: Berlin/Heidelberg, Germany, 2017; pp. 477–492. [Google Scholar]
- Leontjeva, A.; Conforti, R.; Di Francescomarino, C.; Dumas, M.; Maggi, F.M. Complex symbolic sequence encodings for predictive monitoring of business processes. In Proceedings of the International Conference on Business Process Management, Rio de Janeiro, Brazil, 18–22 September 2016; Springer: Berlin/Heidelberg, Germany, 2016; pp. 297–313. [Google Scholar]
- Márquez-Chamorro, A.E.; Resinas, M.; Ruiz-Cortés, A.; Toro, M. Run-time prediction of business process indicators using evolutionary decision rules. Expert Syst. Appl. 2017, 87, 1–14. [Google Scholar] [CrossRef]
- Mehdiyev, N.; Evermann, J.; Fettke, P. A novel business process prediction model using a deep learning method. Bus. Inf. Syst. Eng. 2020, 62, 143–157. [Google Scholar] [CrossRef] [Green Version]
- Peters, M.E.; Neumann, M.; Iyyer, M.; Gardner, M.; Clark, C.; Lee, K.; Zettlemoyer, L. Deep contextualized word representations. arXiv 2018, arXiv:1802.05365. [Google Scholar]
- Radford, A.; Narasimhan, K.; Salimans, T.; Sutskever, I. Improving Language Understanding by Generative Pre-Training. 2018. Available online: https://s3-us-west-2.amazonaws.com/openai-assets/research-covers/language-unsupervised/language_understanding_paper.pdf (accessed on 5 October 2020).
- Radford, A.; Wu, J.; Child, R.; Luan, D.; Amodei, D.; Sutskever, I. Language models are unsupervised multitask learners. OpenAI Blog 2019, 1, 9. [Google Scholar]
- Devlin, J.; Chang, M.W.; Lee, K.; Toutanova, K. Bert: Pre-training of deep bidirectional transformers for language understanding. arXiv 2018, arXiv:1810.04805. [Google Scholar]
- Vaswani, A.; Shazeer, N.; Parmar, N.; Uszkoreit, J.; Jones, L.; Gomez, A.N.; Kaiser, Ł.; Polosukhin, I. Attention is all you need. Adv. Neural Inf. Process. Syst. 2017, 30, 5998–6008. [Google Scholar]
- Belinkov, Y.; Glass, J. Analysis methods in neural language processing: A survey. Trans. Assoc. Comput. Linguist. 2019, 7, 49–72. [Google Scholar] [CrossRef]
- Li, J.; Wang, H.J.; Bai, X. An intelligent approach to data extraction and task identification for process mining. Inf. Syst. Front. 2015, 17, 1195–1208. [Google Scholar] [CrossRef]
- Ethayarajh, K. How contextual are contextualized word representations? Comparing the geometry of BERT, ELMo, and GPT-2 embeddings. arXiv 2019, arXiv:1909.00512. [Google Scholar]
- Kaplan, R.M. A method for tokenizing text. In Inquiries into Words, Constraints and Contexts; CSLI Publication: Stanford, CA, USA, 2005; pp. 55–64. [Google Scholar]
- Han, J.; Pei, J.; Kamber, M. Data Mining: Concepts and Techniques; Elsevier: Amsterdam, The Netherlands, 2011. [Google Scholar]
- Harris, D.; Harris, S. Digital Design and Computer Architecture; Morgan Kaufmann: Burlington, MA, USA, 2010. [Google Scholar]
- He, K.; Zhang, X.; Ren, S.; Sun, J. Deep residual learning for image recognition. In Proceedings of the IEEE Conference on Computer Vision and Pattern Recognition, Las Vegas, NV, USA, 26 June–1 July 2016; pp. 770–778. [Google Scholar]
- Ba, J.L.; Kiros, J.R.; Hinton, G.E. Layer normalization. arXiv 2016, arXiv:1607.06450. [Google Scholar]
- Srivastava, N.; Hinton, G.; Krizhevsky, A.; Sutskever, I.; Salakhutdinov, R. Dropout: A simple way to prevent neural networks from overfitting. J. Mach. Learn. Res. 2014, 15, 1929–1958. [Google Scholar]
- Van Dongen, B. BPI Challenge 2012. Dataset. 2012. Available online: https://www.win.tue.nl/bpi/doku.php?id=2012:challenge (accessed on 5 October 2020).
- Steeman, W. BPI Challenge 2013. Dataset. 2013. Available online: https://www.win.tue.nl/bpi/doku.php?id=2013:challenge (accessed on 5 October 2020).
- Verenich, I. BPI Challenge Helpdesk. Dataset. 2016. Available online: https://data.mendeley.com/datasets/39bp3vv62t/1 (accessed on 5 October 2020).
- Pasquadibisceglie, V.; Appice, A.; Castellano, G.; Malerba, D. Using convolutional neural networks for predictive process analytics. In Proceedings of the 2019 International Conference on Process Mining (ICPM), Aachen, Germany, 24–26 June 2019; pp. 129–136. [Google Scholar]
- Camargo, M.; Dumas, M.; González-Rojas, O. Learning accurate LSTM models of business processes. In Proceedings of the International Conference on Business Process Management, Vienna, Austria, 1–6 September 2019; Springer: Berlin/Heidelberg, Germany, 2019; pp. 286–302. [Google Scholar]
- Hinkka, M.; Lehto, T.; Heljanko, K. Exploiting Event Log Event Attributes in RNN Based Prediction. In Data-Driven Process Discovery and Analysis; Springer: Berlin/Heidelberg, Germany, 2018; pp. 67–85. [Google Scholar]
- Khan, A.; Le, H.; Do, K.; Tran, T.; Ghose, A.; Dam, H.; Sindhgatta, R. Memory-augmented neural networks for predictive process analytics. arXiv 2018, arXiv:1802.00938. [Google Scholar]
- Evermann, J.; Rehse, J.R.; Fettke, P. A deep learning approach for predicting process behaviour at runtime. In Proceedings of the International Conference on Business Process Management, Rio de Janeiro, Brazil, 18–22 September 2016; Springer: Berlin/Heidelberg, Germany, 2016; pp. 327–338. [Google Scholar]
- Di Mauro, N.; Appice, A.; Basile, T.M. Activity prediction of business process instances with inception cnn models. In Proceedings of the International Conference of the Italian Association for Artificial Intelligence, Rende, Italy, 19–22 November 2019; Springer: Berlin/Heidelberg, Germany, 2019; pp. 348–361. [Google Scholar]
Figure 1.
Diagram illustrating inter-dependencies between event logs.

Figure 2.
Process prediction using n-gram and feature hashing approaches.

Figure 3.
Overall data pre-processing.

Figure 4.
Example of using one-hot encoding.

Figure 5.
POP-ON (Prediction of Process Using One-way Language Model based on NLP Approach) model architecture.
Figure 5.
POP-ON (Prediction of Process Using One-way Language Model based on NLP Approach) model architecture.

Figure 6.
Appearance of the train process and test process.

Figure 7.
Illustrative diagram of the loan process.

Figure 8.
POP-ON explanation through a real-world example.

Figure 9.
Model test performance comparison according to the attribute linear layer.


Table 1.
Characteristics of the datasets.
| Dataset | Number of Cases | Number of Events | Number of Activities | Number of useful Attributes |
|---|---|---|---|---|
| BPI’2012 A | 13,087 | 60,849 | 10 | 1 |
| BPI’2012 O | 5015 | 31,244 | 7 | 1 |
| BPI’2012 W Completed | 9658 | 72,413 | 6 | 1 |
| BPI’2013 Incidents | 7554 | 65,533 | 13 | 8 |
| BPI’2013 Closed Problems | 1487 | 6660 | 7 | 2 |
| Helpdesk | 4580 | 21,348 | 14 | 1 |
Table 2.
Evaluation indicators of multi-class classification models.
| Metrics | Formula |
|---|---|
| Accuracy | |
| Precision | |
| Recall | |
| F-measure | |
| MCC (Matthews Correlation Coefficient) |
Table 3.
Benchmark (accuracy) between existing deep learning-based process prediction research and POP-ON. The bold numbers in the table represent the best results for each dataset.
Table 3.
Benchmark (accuracy) between existing deep learning-based process prediction research and POP-ON. The bold numbers in the table represent the best results for each dataset.
| Approach | BPI 2012 A | BPI 2012 W Complete | BPI 2012 O Closed Problems | BPI 2013 Incidents | BPI 2013 | Helpdesk | |
|---|---|---|---|---|---|---|---|
| Pasquadibisceglie et al. | [38] | 71.47 | 66.14 | 77.51 | 24.35 | 33.10 | 65.84 |
| Tax et al. | [17] | 77.75 | 66.80 | 81.22 | 65.57 | 67.50 | 75.06 |
| Camargo et al. | [39] | 78.82 | 65.19 | 85.13 | 60.62 | 68.01 | 76.51 |
| Hinkka et al. | [40] | 79.27 | 67.24 | 85.51 | 61.14 | 77.95 | 77.90 |
| Khan et al. | [41] | 75.62 | 75.91 | 84.48 | 55.57 | 64.34 | 69.13 |
| Evermann et al. | [42] | 74.44 | 65.38 | 79.20 | 55.66 | 68.15 | 70.07 |
| Mauro et al. | [43] | 78.09 | 65.01 | 81.52 | 56.97 | 71.09 | 74.77 |
| POP-ON | 79.49 | 81.36 | 92.15 | 78.36 | 79.89 | 75.53 | |
Table 4.
Numerical attributes and categorical attributes used in the POP-ON model for the different datasets.
Table 4.
Numerical attributes and categorical attributes used in the POP-ON model for the different datasets.
| Dataset | Numerical Attributes | Categorical Attributes |
|---|---|---|
| BPI 2012 A | time:elapsed, case:AMOUNT_REQ | org:resource |
| BPI 2012 W Complete | time:elapsed, case:AMOUNT_REQ | org:resource |
| BPI 2012 O | time:elapsed, case:AMOUNT_REQ | org:resource |
| BPI 2013 Closed Problems | time:elapsed | org:group org:role concept:name product impact resource country organization country organization involved |
| BPI 2013 Incidents | time:elapsed | org:group org:role concept:name product impact resource country organization country organization involved |
| Helpdesk | time:elapsed | - |
Table 5.
Description of hyperparameter.
| Hyperparameter | Description |
|---|---|
| Dimension of Embedding | |
| Dimension of Feed-Forward Network | |
| Dimension of Attribute Linear Layer | |
| Number of Transformer Decoder Layers | |
| Number of Attention Head |
Table 6.
Experiment results according to the hyperparameter settings.
| Hyperparameter Set | Accuracy | |||||
|---|---|---|---|---|---|---|
| 1 | 1 | 16 | 128 | 128 | 0.8296 | |
| 2 | 1 | 16 | 128 | 128 | 0.8593 | |
| 4 | 1 | 16 | 128 | 128 | 0.8984 | |
| 8 | 1 | 16 | 128 | 128 | 0.9064 | |
| 1 | 2 | 32 | 256 | 256 | 0.8934 | |
| 2 | 2 | 32 | 256 | 256 | 0.9039 | |
| 4 | 2 | 32 | 256 | 256 | 0.9121 | |
| 8 | 2 | 32 | 256 | 256 | 0.9169 | |
| 1 | 4 | 64 | 512 | 512 | 0.9051 | |
| 2 | 4 | 64 | 512 | 512 | 0.9110 | |
| 4 | 4 | 64 | 512 | 512 | 0.9171 | |
| 8 | 4 | 64 | 512 | 512 | 0.9194 | |
| 1 | 8 | 128 | 1024 | 1024 | 0.9125 | |
| 2 | 8 | 128 | 1024 | 1024 | 0.9196 | |
| 4 | 8 | 128 | 1024 | 1024 | 0.9197 | |
| 8 | 8 | 128 | 1024 | 1024 | 0.9217 |
Publisher’s Note: MDPI stays neutral with regard to jurisdictional claims in published maps and institutional affiliations. |
© 2021 by the authors. Licensee MDPI, Basel, Switzerland. This article is an open access article distributed under the terms and conditions of the Creative Commons Attribution (CC BY) license (http://creativecommons.org/licenses/by/4.0/).
Share and Cite
MDPI and ACS Style
Moon, J.; Park, G.; Jeong, J. POP-ON: Prediction of Process Using One-Way Language Model Based on NLP Approach. Appl. Sci. 2021, 11, 864. https://0-doi-org.brum.beds.ac.uk/10.3390/app11020864
AMA Style
Moon J, Park G, Jeong J. POP-ON: Prediction of Process Using One-Way Language Model Based on NLP Approach. Applied Sciences. 2021; 11(2):864. https://0-doi-org.brum.beds.ac.uk/10.3390/app11020864
Chicago/Turabian StyleMoon, Junhyung, Gyuyoung Park, and Jongpil Jeong. 2021. "POP-ON: Prediction of Process Using One-Way Language Model Based on NLP Approach" Applied Sciences 11, no. 2: 864. https://0-doi-org.brum.beds.ac.uk/10.3390/app11020864
Note that from the first issue of 2016, this journal uses article numbers instead of page numbers. See further details here.