Anthropometric Profiles in Table Tennis Players: Analysis of Sex, Age, and Ranking

 ,
,  , , and
Abstract
:1. Introduction
2. Materials and Methods
2.1. Sample
2.2. Anthropometric Measurements
2.3. Statistical Analysis
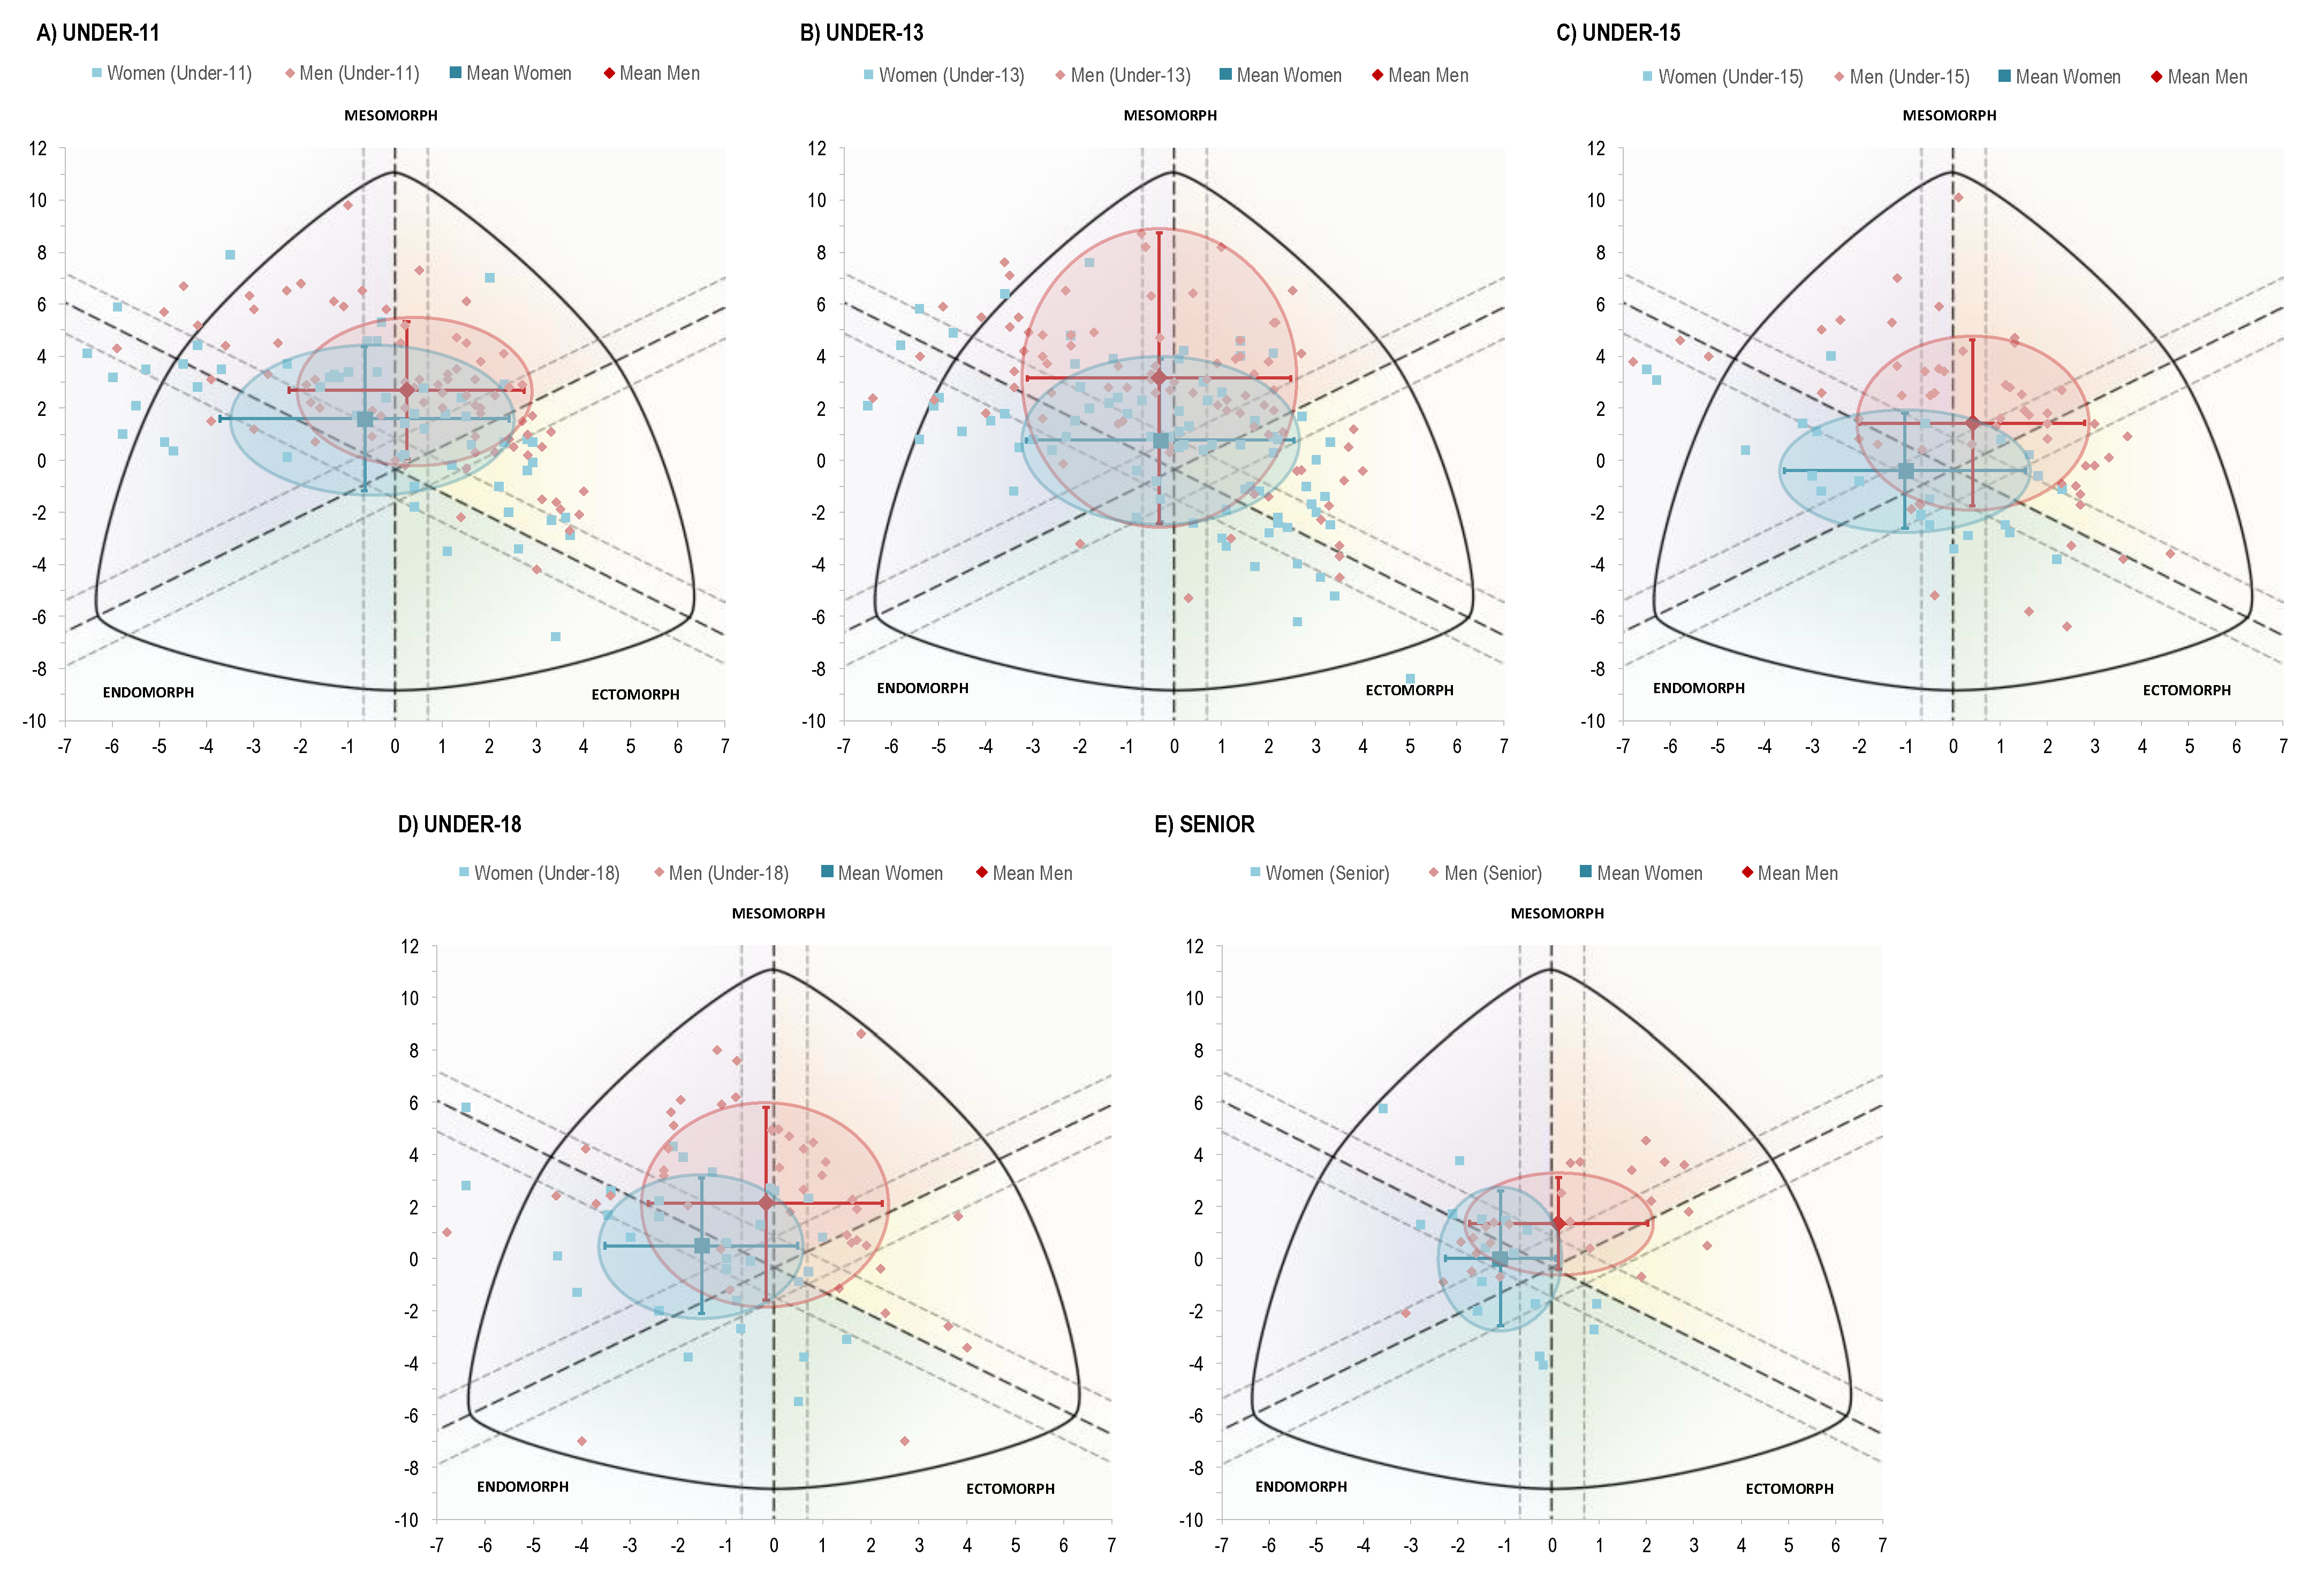
3. Results
4. Discussion
5. Conclusions
Author Contributions
Funding
Institutional Review Board Statement
Informed Consent Statement
Data Availability Statement
Acknowledgments
Conflicts of Interest
References
- Fett, J.; Ulbricht, A.; Ferrauti, A. Impact of Physical Performance and Anthropometric Characteristics on Serve Velocity in Elite Junior Tennis Players. J. Strength Cond. Res. 2020, 34, 192–202. [Google Scholar] [CrossRef] [PubMed]
- Bonato, M.; Maggioni, M.A.; Rossi, C.; Rampichini, S.; La Torre, A.; Merati, G. Relationship between anthropometric or functional characteristics and maximal serve velocity in professional tennis players. J. Sports Med. Phys. Fitness 2015, 55, 1157–1165. [Google Scholar] [PubMed]
- Sánchez-Muñoz, C.; Muros, J.J.; Cañas, J.; Courel-Ibáñez, J.; Sánchez-Alcaraz, B.J.; Zabala, M. Anthropometric and physical fitness profiles of world-class male padel players. Int. J. Environ. Res. Public Health 2020, 17, 508. [Google Scholar] [CrossRef] [Green Version]
- Ooi, C.H.; Tan, A.; Ahmad, A.; Kwong, K.W.; Sompong, R.; Ghazali, K.A.M.; Liew, S.L.; Chai, W.J.; Thompson, M.W. Physiological characteristics of elite and sub-elite badminton players. J. Sports Sci. 2009, 27, 1591–1599. [Google Scholar] [CrossRef]
- Zagatto, A.M.; Milioni, F.; Freitas, I.F.; Arcangelo, S.A.; Padulo, J. Body composition of table tennis players: Comparison between performance level and gender. Sport Sci. Health 2016, 12, 49–54. [Google Scholar] [CrossRef] [Green Version]
- Teunissen, J.W.; ter Welle, S.; Platvoet, S.; Faber, I.; Pion, J.; Lenoir, M. Similarities and differences between sports subserving systematic talent transfer and development: The case of paddle sports. J. Sci. Med. Sport 2020, 24, 200–205. [Google Scholar] [CrossRef]
- Robertson, K.; Pion, J.; Mostaert, M.; Norjali Wazir, M.R.W.; Kramer, T.; Faber, I.R.; Vansteenkiste, P.; Lenoir, M. A coaches’ perspective on the contribution of anthropometry, physical performance, and motor coordination in racquet sports. J. Sports Sci. 2018, 36, 2706–2715. [Google Scholar] [CrossRef] [PubMed]
- Faber, I.; Damsma, T.; Pion, J. Finding Talent and Establishing the Road to Excellence in Table Tennis. In Talent Identification and Development in Sport; Baker, J., Cobley, S., Schorer, J., Eds.; Routledge: New York, NY, USA, 2020; pp. 115–129. [Google Scholar]
- Siener, M.; Hohmann, A. Talent orientation: The impact of motor abilities on future success in table tennis. Ger. J. Exerc. Sport Res. 2019, 49, 232–243. [Google Scholar] [CrossRef]
- Burt, L.A.; Greene, D.A.; Ducher, G.; Naughton, G.A. Skeletal adaptations associated with pre-pubertal gymnastics participation as determined by DXA and pQCT: A systematic review and meta-analysis. J. Sci. Med. Sport 2013, 16, 231–239. [Google Scholar] [CrossRef] [PubMed]
- Wewege, M.A.; Ward, R.E. Bone mineral density in pre-professional female ballet dancers: A systematic review and meta-analysis. J. Sci. Med. Sport 2018, 21, 783–788. [Google Scholar] [CrossRef]
- Ryffel, C.P.; Eser, P.; Trachsel, L.D.; Brugger, N.; Wilhelm, M. Age at start of endurance training is associated with patterns of left ventricular hypertrophy in middle-aged runners. Int. J. Cardiol. 2018, 267, 133–138. [Google Scholar] [CrossRef]
- Faber, I.R.; Elferink-Gemser, M.T.; Oosterveld, F.G.J.; Twisk, J.W.R.; Nijhuis-Van der Sanden, M.W.G. Can an early perceptuo-motor skills assessment predict future performance in youth table tennis players? An observational study (1998–2013). J. Sports Sci. 2017, 35, 593–601. [Google Scholar] [CrossRef]
- Castellar, C.; Pradas, F.; Carrasco, L.; La Torre, A.D.; González-Jurado, J.A. Analysis of reaction time and lateral displacements in national level table tennis players: Are they predictive of sport performance? Int. J. Perform. Anal. Sport 2019, 19, 467–477. [Google Scholar] [CrossRef]
- Nikolić, I.; Nikolić, I.; Furjan-Mandić, G.; Kondric, M. The relationship of morphology and motor abilities to specific table tennis tasks in youngsters. Coll. Antropol. 2014, 38, 241–245. [Google Scholar]
- Zaferanieh, A.; Haghighi, A.H.; Kakhak, S.A.H.; Maleki, A.; Cè, E.; Esposito, F. Effect of ballistic and power training on performance adaptations of élite table tennis players. Sport Sci. Health 2020. [Google Scholar] [CrossRef]
- Pradas de la Fuente, F.; González Jurado, J.A.; Molina Sotomayor, E.; Castellar Otín, C. Anthropometric Characteristics, Body Composition and Somatotype of High-Level Table Tennis Players. Int. J. Morphol. 2013, 31, 1355–1364. [Google Scholar] [CrossRef]
- Sepúlveda, R.Y.; Barraza, F.; Soto, G.R.; Báez, E.; Tuesta, M. Anthropometric chilean table tennis players of competitive features. Nutr. Hosp. 2015, 32, 1689–1694. [Google Scholar]
- Munivrana, G.; Paušić, J. The Influence of Somatotype on Young Table Tennis Players’ Competitive Success. Kinesiol. Slov. 2011, 51, 42–51. [Google Scholar]
- Zagatto, A.M.; Kondric, M.; Knechtle, B.; Nikolaidis, P.T.; Sperlich, B. Energetic demand and physical conditioning of table tennis players. A study review. J. Sports Sci. 2018, 36, 724–731. [Google Scholar] [CrossRef]
- Sofiene, K.; Hermassi, S.; Safa, K.; Passelergue, P. Effect of an Integrated Resistance Program Based Weightlifting Exercises on Improving Physical Performance of Young Table Elite’s Tennis Players. Adv. Phys. Educ. 2016, 6, 364–377. [Google Scholar] [CrossRef] [Green Version]
- Carrasco, L.; Pradas, F.; Martínez, A. Somatotype and body composition of young top-level table tennis players. Int. J. Table Tennis Sci. 2010, 6, 175–177. [Google Scholar]
- Marfell-Jones, M.J.; Stewart, A.D.; De Ridder, J.H. International Standards for Anthropometric Assessment; International Society for the Advancement of Kinanthropometry: Wellington, New Zealand, 2012; ISBN 0620362073. [Google Scholar]
- Carter, J.E.L.; Heath, B.H. Somatotyping: Development and Applications; Cambridge University Press: Cambridge, UK, 1990; ISBN 0521351170. [Google Scholar]
- Siri, W.E. Body composition from fluid spaces and density: Analysis of methods. In Techniques for Measuring Body Composition; Brozec, A., Hensche, A., Eds.; National Academy of Sciences: Washington, DC, USA, 1961; Volume 61, pp. 223–244. [Google Scholar]
- Würch, A. La femme et le sport. Med. Sport Fr. 1974, 4, 441–445. [Google Scholar]
- Rocha, M.S.L. Peso ósseo do brasileiro de ambos os sexos de 17 a 25 años. Arq. anatomía e Antropol. 1975, 1, 445–451. [Google Scholar]
- Withers, R.T.; Craig, N.P.; Bourdon, P.C.; Norton, K.I. Relative body fat and anthropometric prediction of body density of male athletes. Eur. J. Appl. Physiol. Occup. Physiol. 1987, 56, 191–200. [Google Scholar] [CrossRef] [PubMed]
- Withers, R.T.; Whittingham, N.O.; Norton, K.I.; La Forgia, J.; Ellis, M.W.; Crockett, A. Relative body fat and anthropometric prediction of body density of female athletes. Eur. J. Appl. Physiol. Occup. Physiol. 1987, 56, 615. [Google Scholar] [CrossRef] [Green Version]
- Lee, R.C.; Wang, Z.; Heo, M.; Ross, R.; Janssen, I.; Heymsfield, S.B. Total-body skeletal muscle mass: Development and cross-validation of anthropometric prediction models. Am. J. Clin. Nutr. 2000, 72, 796–803. [Google Scholar] [CrossRef] [PubMed]
- Heymsfield, S.B.; McManus, C.; Smith, J.; Stevens, V.; Nixon, D.W. Anthropometric measurement of muscle mass: Revised equations for calculating bone-free arm muscle area. Am. J. Clin. Nutr. 1982, 36, 680–690. [Google Scholar] [CrossRef]
- Lakens, D. Calculating and reporting effect sizes to facilitate cumulative science: A practical primer for t-tests and ANOVAs. Front. Psychol. 2013, 4, 863. [Google Scholar] [CrossRef] [Green Version]
- Bentham, J.; Di Cesare, M.; Bilano, V.; Bixby, H.; Zhou, B.; Stevens, G.A.; Riley, L.M.; Taddei, C.; Hajifathalian, K.; Lu, Y.; et al. Worldwide trends in body-mass index, underweight, overweight, and obesity from 1975 to 2016: A pooled analysis of 2416 population-based measurement studies in 128·9 million children, adolescents, and adults. Lancet 2017, 390, 2627–2642. [Google Scholar]
- Telama, R.; Yang, X.; Leskinen, E.; Kankaanpää, A.; Hirvensalo, M.; Tammelin, T.; Viikari, J.S.A.; Raitakari, O.T. Tracking of physical activity from early childhood through youth into adulthood. Med. Sci. Sports Exerc. 2014, 46, 955–962. [Google Scholar] [CrossRef]
- Bull, F.C.; Al-Ansari, S.S.; Biddle, S.; Borodulin, K.; Buman, M.P.; Cardon, G.; Carty, C.; Chaput, J.P.; Chastin, S.; Chou, R.; et al. World Health Organization 2020 guidelines on physical activity and sedentary behaviour. Br. J. Sports Med. 2020, 54, 1451–1462. [Google Scholar] [CrossRef]
- Pluta, B.; Galas, S.; Krzykała, M.; Andrzejewski, M. The motor and leisure time conditioning of young table tennis players’ physical fitness. Int. J. Environ. Res. Public Health 2020, 17, 5733. [Google Scholar] [CrossRef] [PubMed]
- Zagatto, A.M.; Morel, E.A.; Gobatto, C.A. Physiological responses and characteristics of table tennis matches determined in official tournaments. J. Strength Cond. Res. 2010, 24, 942–949. [Google Scholar] [CrossRef] [PubMed]
- Eiben, O.; Eiben, E. The physique of European table-tennis players. Coll. Antropol. 1979, 1, 67–76. [Google Scholar]
- Kyle, U.G.; Genton, L.; Slosman, D.O.; Pichard, C. Fat-free and fat mass percentiles in 5225 healthy subjects aged 15 to 98 years. Nutrition 2001, 17, 534–541. [Google Scholar] [CrossRef]
- Abernathy, R.P.; Black, D.R. Healthy body weights: An alternative perspective. Am. J. Clin. Nutr. 1996, 63, 448S–451S. [Google Scholar] [CrossRef] [Green Version]
- Kim, K.; Hong, S.; Kim, E.Y. Reference values of skeletal muscle mass for Korean children and adolescents using data from the Korean national health and nutrition examination survey 2009–2011. PLoS ONE 2016, 11, e0153383. [Google Scholar] [CrossRef]
- Santos, D.A.; Dawson, J.A.; Matias, C.N.; Rocha, P.M.; Minderico, C.S.; Allison, D.B.; Sardinha, L.B.; Silva, A.M. Reference values for body composition and anthropometric measurements in athletes. PLoS ONE 2014, 9, e97846. [Google Scholar] [CrossRef] [Green Version]
- Pradas de la Fuente, F.; González-Jurado, J.A.; García-Giménez, A.; Gallego Tobón, F.; Castellar Otín, C. Anthropometric Characteristics Of Elite Paddle Players. Pilot Study. Rev. Int. Med. y Ciencias la Act. Fis. y del Deport. 2019, 19, 181–195. [Google Scholar]
- Abdullahi, Y.; Toriola, A.L.; Ter Goon, D.; Paul, Y.; Igbokwe, N.U.; Suarau, M.A. Anthropometric and motor performance characteristics of Nigerian badminton players. Asian J. Sci. Res. 2017, 10, 244–251. [Google Scholar] [CrossRef]
- Abián, P.; Abián-Vicén, J.; Sampedro, J. Anthropometric Analysis of Body Symmetry in Badminton Players. Int. J. Morphol. 2012, 30, 945–951. [Google Scholar] [CrossRef] [Green Version]
- Heller, J. Physiological profiles of elite badminton players: Aspects of age and gender. Br. J. Sports Med. 2010, 44, i17. [Google Scholar] [CrossRef] [Green Version]
- Jaski, A.; Bale, P. The Physique and Body Composition of Top Class Squash Players. Available online: https://pubmed.ncbi.nlm.nih.gov/3599965/ (accessed on 21 December 2020).
- Todd, M.K.; Mahoney, C. Determination of pre-pre season physiological characteristics of elite male squash players. Sci. Racket Sport. 1994, 81, 81–86. [Google Scholar]
- Čanaki, M.; Sporiš, G.; Leko, G. Morphological advantages and disadvantages in Croatian U-16 and U-18 tennis players. Hrvat. športskomedicinski Vjesn. 2006, 21, 97–101. [Google Scholar]
- Pyke, S.; Elliott, C.; Pyke, E. Performance Testing of Tennis and Squash Players. Br. J. Sports Med. 1974, 8, 80–86. [Google Scholar] [CrossRef] [Green Version]
- Elliott, B.C.; Ackland, T.R.; Blanksby, B.A.; Bloomfield, J. A prospective study of physiological and kinanthropometric indicators of junior tennis performance. Aust. J. Sci. Med. Sport 1990, 22, 87–92. [Google Scholar]
- Sánchez-Muñoz, C.; Sanz, D.; Zabala, M. Anthropometric characteristics, body composition and somatotype of elite junior tennis players. Br. J. Sports Med. 2007, 41, 793–799. [Google Scholar] [CrossRef] [Green Version]
- Le Mansec, Y.; Dorel, S.; Hug, F.; Jubeau, M. Lower limb muscle activity during table tennis strokes. Sport. Biomech. 2018, 17, 442–452. [Google Scholar] [CrossRef]
- Toomey, C.M.; Whittaker, J.L.; Nettel-Aguirre, A.; Reimer, R.A.; Woodhouse, L.J.; Ghali, B.; Doyle-Baker, P.K.; Emery, C.A. Higher fat mass is associated witha history of knee injury in youth sport. J. Orthop. Sports Phys. Ther. 2017, 47, 80–87. [Google Scholar] [CrossRef]
- Pradas, F. De la iniciación al perfeccionamiento en el juego de dobles. Un caso práctico en tenis de mesa. In Fundamentos y enseñanza de los deportes de raqueta y pala; Cabello, D., Ed.; University of Granada: Granada, Spain, 2002; pp. 99–110. [Google Scholar]
- Pradas de la Fuente, F.; Carrasco-Páez, L.; Martínez-Pardo, E.; Herrero-Pagán, R. Anthropometric Profile, Somatotype, and Body Composition of young Table Tennis Players; Revista Internacional de Ciencias del Deporte (RICYDE): Madrid, Spain, 2007; Volume 3. [Google Scholar]
- Pradas, F.; Vargas, M.C.; Herrero, R.; González-Jurado, J.A. El acto motor y las tareas motrices. In Fundamentos del tenis de mesa. Aplicación al ámbito escolar; Universidad de Murcia: Murcia, Spain, 2015; pp. 295–319. [Google Scholar]


| Under 11 | Under 13 | Under 15 | Under 18 | Senior | |||||||
|---|---|---|---|---|---|---|---|---|---|---|---|
| M (SD) | 95% IC | M (SD) | 95% IC | M (SD) | 95% IC | M (SD) | 95% IC | M (SD) | 95% IC | ||
| Stature (cm) | Women | 1.40 (0.1) | 1.39–1.42 | 1.54 (0.1) | 1.52–1.55 | 1.62 (0.1) | 1.59–1.65 | 1.62 (0.1) | 1.62–1.66 | 1.65 (0.1) | 1.62–1.69 |
| Men | 1.42 (0.1) | 1.40–1.43 | 1.50 (0.1) | 1.49–1.51 | 1.64 (0.1) | 1.66–1.74 | 1.72 (0.1) | 1.72–1.77 | 1.75 (0.1) | 1.72–1.78 | |
| Body mass (kg) | Women | 35.4 (6.1) | 33.8–37.0 | 44.8 (8.5) | 42.9–46.7 | 52.6 (7.8) | 49.2–55.9 | 57.3 (7.6) | 54.6–60.1 | 56.9 (5.3) | 54.1–59.7 |
| Men | 35.6 (6.5) | 34.2–37.1 | 42.7 (8.9) | 40.8–44.6 | 53.1 (10.7) | 50.2, 56.0 | 66.5 (9.1) | 63.7–69.3 | 70.3 (9.4) | 66.4–74.3 | |
| BMI (kg/m2) | Women | 18.0 (2.8) | 17.2–18.7 | 18.9 (2.9) | 18.3–19.5 | 20.1 (2.7) | 19.0– 21.3 | 21.3 (2.4) | 20.4–22.2 | 20.8 (1.3) | 20.1–21.5 |
| Men | 17.7 (2.5) | 17.1–18.2 | 18.9 (3.0) | 18.2–19.5 | 19.7 (2.9) | 18.9–20.5 | 21.8 (2.5) | 21.1–22.6 | 22.8 (2.4) | 21.8–23.8 | |
| Arm relax (cm) | Women | 21.2 (3.3) | 20.3–22.1 | 23.0 (3.3) | 22.2–23.7 | 24.5 (2.5) | 23.4–25.6 | 25.9 (2.3) | 25.0–26.7 | 25.5 (1.7) | 24.5–26.5 |
| Men | 21.3 (3.0) | 20.6–22.0 | 22.7 (2.9) | 22.1–23.3 | 24.9 (2.7) | 24.2–25.7 | 28.1 (2.3) | 27.4–28.8 | 29.8 (2.4) | 28.7–30.8 | |
| Arm tense (cm) | Women | 22.9 (3.4) | 22.0–23.8 | 24.5 (3.1) | 23.8–25.2 | 26.1 (2.2) | 25.1–27.0 | 27.6 (2.1) | 26.8–28.3 | 27.2 (1.6) | 26.3–28.1 |
| Men | 22.5 (2.8) | 21.9–23.1 | 24.0 (2.7) | 23.4–24.6 | 26.6 (2.8) | 25.8–27.4 | 30.0 (2.3) | 29.3–30.7 | 31.7 (2.7) | 30.6–32.9 | |
| CSA Arm (cm) | Women | 16.1 (9.4) | 13.6–18.7 | 21.3 (7.8) | 19.6–23.1 | 23.4 (5.4) | 21.1–25.7 | 26.7 (6.9) | 24.3–29.2 | 23.2 (5.4) | 20.1–26.3 |
| Men | 14.3 (6.2) | 12.9–15.7 | 16.8 (6.3) | 15.5–18.2 | 25.7 (8.7) | 23.4–28.1 | 37.4 (8.7) | 34.8–40.0 | 52.2 (10.3) | 47.8–56.5 | |
| CSA Leg (cm) | Women | 42.2 (13.2) | 38.7–45.8 | 55.5 (14.0) | 52.4–58.5 | 61.0 (14.2) | 54.9–67.2 | 67.1 (8.3) | 64.1–70.1 | 69.5 (11.3) | 63.0–76.1 |
| Men | 47.9 (9.7) | 45.7–50.0 | 52.7 (11.6) | 50.2–55.3 | 66.0 (16.7) | 61.5–70.5 | 81.6 (13.3) | 77.5–85.6 | 90.8 (14.1) | 84.9–96.8 | |
| CSA Thigh (cm) | Women | 81.7 (19.5) | 76.5–87.0 | 103.4 (23.3) | 98.2–108.6 | 133.3 (33.7) | 118.7–147.9 | 130.2 (22.1) | 122.2–138.1 | 136.4 (22.1) | 123.7–149.2 |
| Men | 86.3 (16.5) | 82.6–89.9 | 98.4 (20.2) | 94.0–102.8 | 121.1 (32.7) | 112.2–129.9 | 161.4 (28.2) | 152.8–170.0 | 172.1 (27.5) | 160.5–183.7 | |
| Bone (%) | Women | 14.8 (1.9) | 14.3–15.3 | 14.1 (2.1) | 13.6–14.6 | 17.6 (2.1) | 16.7–18.5 | 16.2 (2.0) | 15.5–16.9 | 16.5 (1.2) | 15.8–17.2 |
| Men | 15.6 (2.0) | 15.2–16.1 | 14.0 (3.9) | 13.2–14.8 | 18.8 (2.1) | 18.3–19.4 | 17.7 (2.1) | 17.0–18.3 | 16.6 (1.3) | 16.0–17.1 | |
| Fat mass (%) | Women | 21.2 (6.1) | 19.5–22.9 | 20.8 (5.3) | 19.6–22.0 | 22.5 (4.9) | 20.3–24.6 | 23.0 (4.2) | 19.1–22.2 | 20.6 (2.6) | 19.1–22.2 |
| Men | 11.3 (5.0) | 10.2–12.4 | 13.3 (6.6) | 11.9–14.7 | 12.1 (4.7) | 10.8–13.3 | 12.6 (5.2) | 11.0–14.2 | 10.9 (3.0) | 9.6–12.2 | |
| Lean mass (%) | Women | 45.8 (7.3) | 43.8–47.7 | 43.0 (5.6) | 41.8–44.2 | 37.5 (4.2) | 35.7–39.3 | 36.3 (3.8) | 35.0–37.7 | 36.7 (2.5) | 35.2–38.1 |
| Men | 54.3 (6.9) | 52.7–55.8 | 49.5 (8.5) | 47.6–51.3 | 44.8 (6.7) | 43.0–46.6 | 43.0 (5.8) | 41.2–44.8 | 44.2 (3.9) | 42.5–45.9 | |
| Endomorph | Women | 3.6 (1.6) | 3.1–4.0 | 3.6 (1.5) | 3.3–3.9 | 4.2 (1.4) | 3.6–4.8 | 4.2 (1.2) | 3.8–4.7 | 4.1 (0.6) | 3.7–4.4 |
| Men | 2.9 (1.3) | 2.6–3.2 | 3.4 (1.5) | 3.1–3.7 | 3.1 (1.3) | 2.8–3.5 | 3.2 (1.4) | 2.8–3.6 | 2.7 (0.9) | 2.3–3.1 | |
| Mesomorph | Women | 4.0 (1.2) | 3.7–4.4 | 3.9 (1.4) | 3.6–4.2 | 3.5 (1.1) | 3.0–3.9 | 3.7 (1.1) | 3.3–4.1 | 3.5 (1.1) | 2.9–4.1 |
| Men | 4.4 (1.1) | 4.1–4.6 | 4.8 (2.6) | 4.3–5.4 | 4.0 (1.3) | 3.7–4.4 | 4.3 (1.3) | 3.9–4.7 | 4.7 (1.2) | 4.2–5.2 | |
| Ectomorph | Women | 2.9 (1.6) | 2.5–3.3 | 3.3 (1.5) | 3.0–3.7 | 3.2 (1.3) | 2.6–3.7 | 2.7 (1.0) | 2.4–3.1 | 3.0 (0.8) | 2.5–3.4 |
| Men | 3.2 (1.4) | 2.9–3.5 | 3.1 (1.4) | 2.8–3.4 | 3.5 (1.4) | 3.1–3.9 | 3.0 (1.3) | 2.6–3.4 | 2.6 (1.1) | 2.1–3.1 | |
| Variable | Between-Subjects’ Main Effects | Between-Subjects’ Interaction Effects | ||||||||||
|---|---|---|---|---|---|---|---|---|---|---|---|---|
| Sex | Age | Ranking | Sex*Age | Sex*Ranking | Age*Ranking | |||||||
| P | ES | P | ES | P | ES | P | ES | P | ES | P | ES | |
| Stature (cm) | 0.036 * | 0.01 | <0.001 * | 0.51 | 0.026 * | 0.01 | <0.001 * | 0.11 | 0.012 * | 0.01 | 0.109 | 0.02 |
| Body mass (kg) | 0.113 | 0.01 | <0.001 * | 0.38 | 0.146 | <0.01 | <0.001 * | 0.07 | 0.015 * | 0.01 | 0.019 * | 0.02 |
| BMI (kg/m2) | 0.697 | <0.01 | <0.001 * | 0.09 | 0.477 | <0.01 | 0.194 | 0.01 | 0.124 | <0.01 | 0.072 | 0.02 |
| Arm relax (cm) | 0.088 | 0.01 | <0.001 * | 0.18 | 0.056 | 0.01 | <0.001 * | 0.04 | 0.044 * | 0.01 | 0.695 | <0.01 |
| Arm tense (cm) | 0.092 | 0.01 | <0.001 * | 0.22 | 0.040 * | 0.01 | <0.001 * | 0.06 | 0.031 * | 0.01 | 0.614 | 0.01 |
| CSA Arm (cm) | <0.001 * | 0.06 | <0.001 * | 0.28 | 0.011 * | 0.01 | <0.001 * | 0.26 | 0.109 | 0.01 | 0.578 | 0.01 |
| CSA Leg (cm) | <0.001 * | 0.05 | <0.001 * | 0.26 | 0.131 | <0.01 | <0.001 * | 0.07 | 0.776 | <0.01 | 0.252 | 0.01 |
| CSA Thigh (cm) | 0.004 * | 0.02 | <0.001 * | 0.33 | 0.106 | 0.01 | <0.001 * | 0.08 | 0.577 | <0.01 | 0.326 | 0.01 |
| Bone (%) | 0.009 * | 0.01 | <0.001 * | 0.23 | 0.496 | <0.01 | 0.044 * | 0.02 | 0.472 | <0.01 | 0.031 * | 0.02 |
| Fat mass (%) | <0.001 * | 0.27 | 0.437 | 0.01 | 0.761 | <0.01 | 0.022 * | 0.02 | 0.268 | <0.01 | 0.005 * | 0.03 |
| Lean mass (%) | <0.001 * | 0.14 | <0.001 * | 0.11 | 0.872 | <0.01 | 0.672 | 0.00 | 0.152 | <0.01 | 0.015 * | 0.03 |
| Endomorph | <0.001 * | 0.06 | 0.703 | <0.01 | 0.703 | <0.01 | 0.026 * | 0.02 | 0.131 | <0.01 | 0.038 * | 0.02 |
| Mesomorph | 0.028 * | 0.01 | 0.395 | 0.01 | 0.828 | <0.01 | 0.531 | 0.01 | 0.186 | <0.01 | 0.065 | 0.02 |
| Ectomorph | 0.421 | <0.01 | 0.083 | 0.02 | 0.736 | <0.01 | 0.213 | 0.01 | 0.594 | <0.01 | 0.142 | 0.01 |
Publisher’s Note: MDPI stays neutral with regard to jurisdictional claims in published maps and institutional affiliations. |
© 2021 by the authors. Licensee MDPI, Basel, Switzerland. This article is an open access article distributed under the terms and conditions of the Creative Commons Attribution (CC BY) license (http://creativecommons.org/licenses/by/4.0/).
Share and Cite
Pradas, F.; de la Torre, A.; Carrasco, L.; Muñoz, D.; Courel-Ibáñez, J.; González-Jurado, J.A. Anthropometric Profiles in Table Tennis Players: Analysis of Sex, Age, and Ranking. Appl. Sci. 2021, 11, 876. https://0-doi-org.brum.beds.ac.uk/10.3390/app11020876
Pradas F, de la Torre A, Carrasco L, Muñoz D, Courel-Ibáñez J, González-Jurado JA. Anthropometric Profiles in Table Tennis Players: Analysis of Sex, Age, and Ranking. Applied Sciences. 2021; 11(2):876. https://0-doi-org.brum.beds.ac.uk/10.3390/app11020876
Chicago/Turabian StylePradas, Francisco, Ana de la Torre, Luis Carrasco, Diego Muñoz, Javier Courel-Ibáñez, and José Antonio González-Jurado. 2021. "Anthropometric Profiles in Table Tennis Players: Analysis of Sex, Age, and Ranking" Applied Sciences 11, no. 2: 876. https://0-doi-org.brum.beds.ac.uk/10.3390/app11020876