1. Introduction
1.1. Research Motivation
The current work aims to deepen the analysis of the longitudinal dynamics of a dual motor Lithium-Ion Capacitor (LiC)-based hybrid super sport car. The study of vehicle dynamics has acquired strong importance throughout the years since it allows us to understand and optimize the vehicle characteristics fully. Moreover, the possibility to analyze the vehicle behavior through simulation and modeling activities shifts the focus on virtual or software environments instead of experimental testing. This method allows saving money and time during the vehicle development process.
One of the great advantages of computer simulation techniques is in fact represented by the possibility to analyze various design proposals with easiness and without the need for a prototype as it would be required for experimental testing. It must be considered that computer simulations are useful only if the software is reliable, meaning that it is able to reproduce faithfully the behavior of the actual vehicle. In that case, considerable savings in time and costs are expected. The main experimental activities that are run on the entire vehicle are represented by chassis dynamometer testing through emission cycles or road experimental testing. Experimental data from the chassis dynamometer can be used to guarantee the validation of the computer simulations, along with experimental results from tests on specific components, when present.
The vehicle model we are referring to in this document represents a Lamborghini Aventador and it has already been validated in a previous work [
1]. Since the validation process has already been carried out, this document can focus on deepening the analysis of the hybrid powertrain and its control strategies.
The longitudinal vehicle model consists of physics-based modeled and validated components as well as black box models, exclusively based on experimental data. This is the solution that has been adopted to guarantee the trade-off between simulation accuracy and simulation speed, delivering a powerful tool capable of exploring hybrid architectures and support the control strategy development.
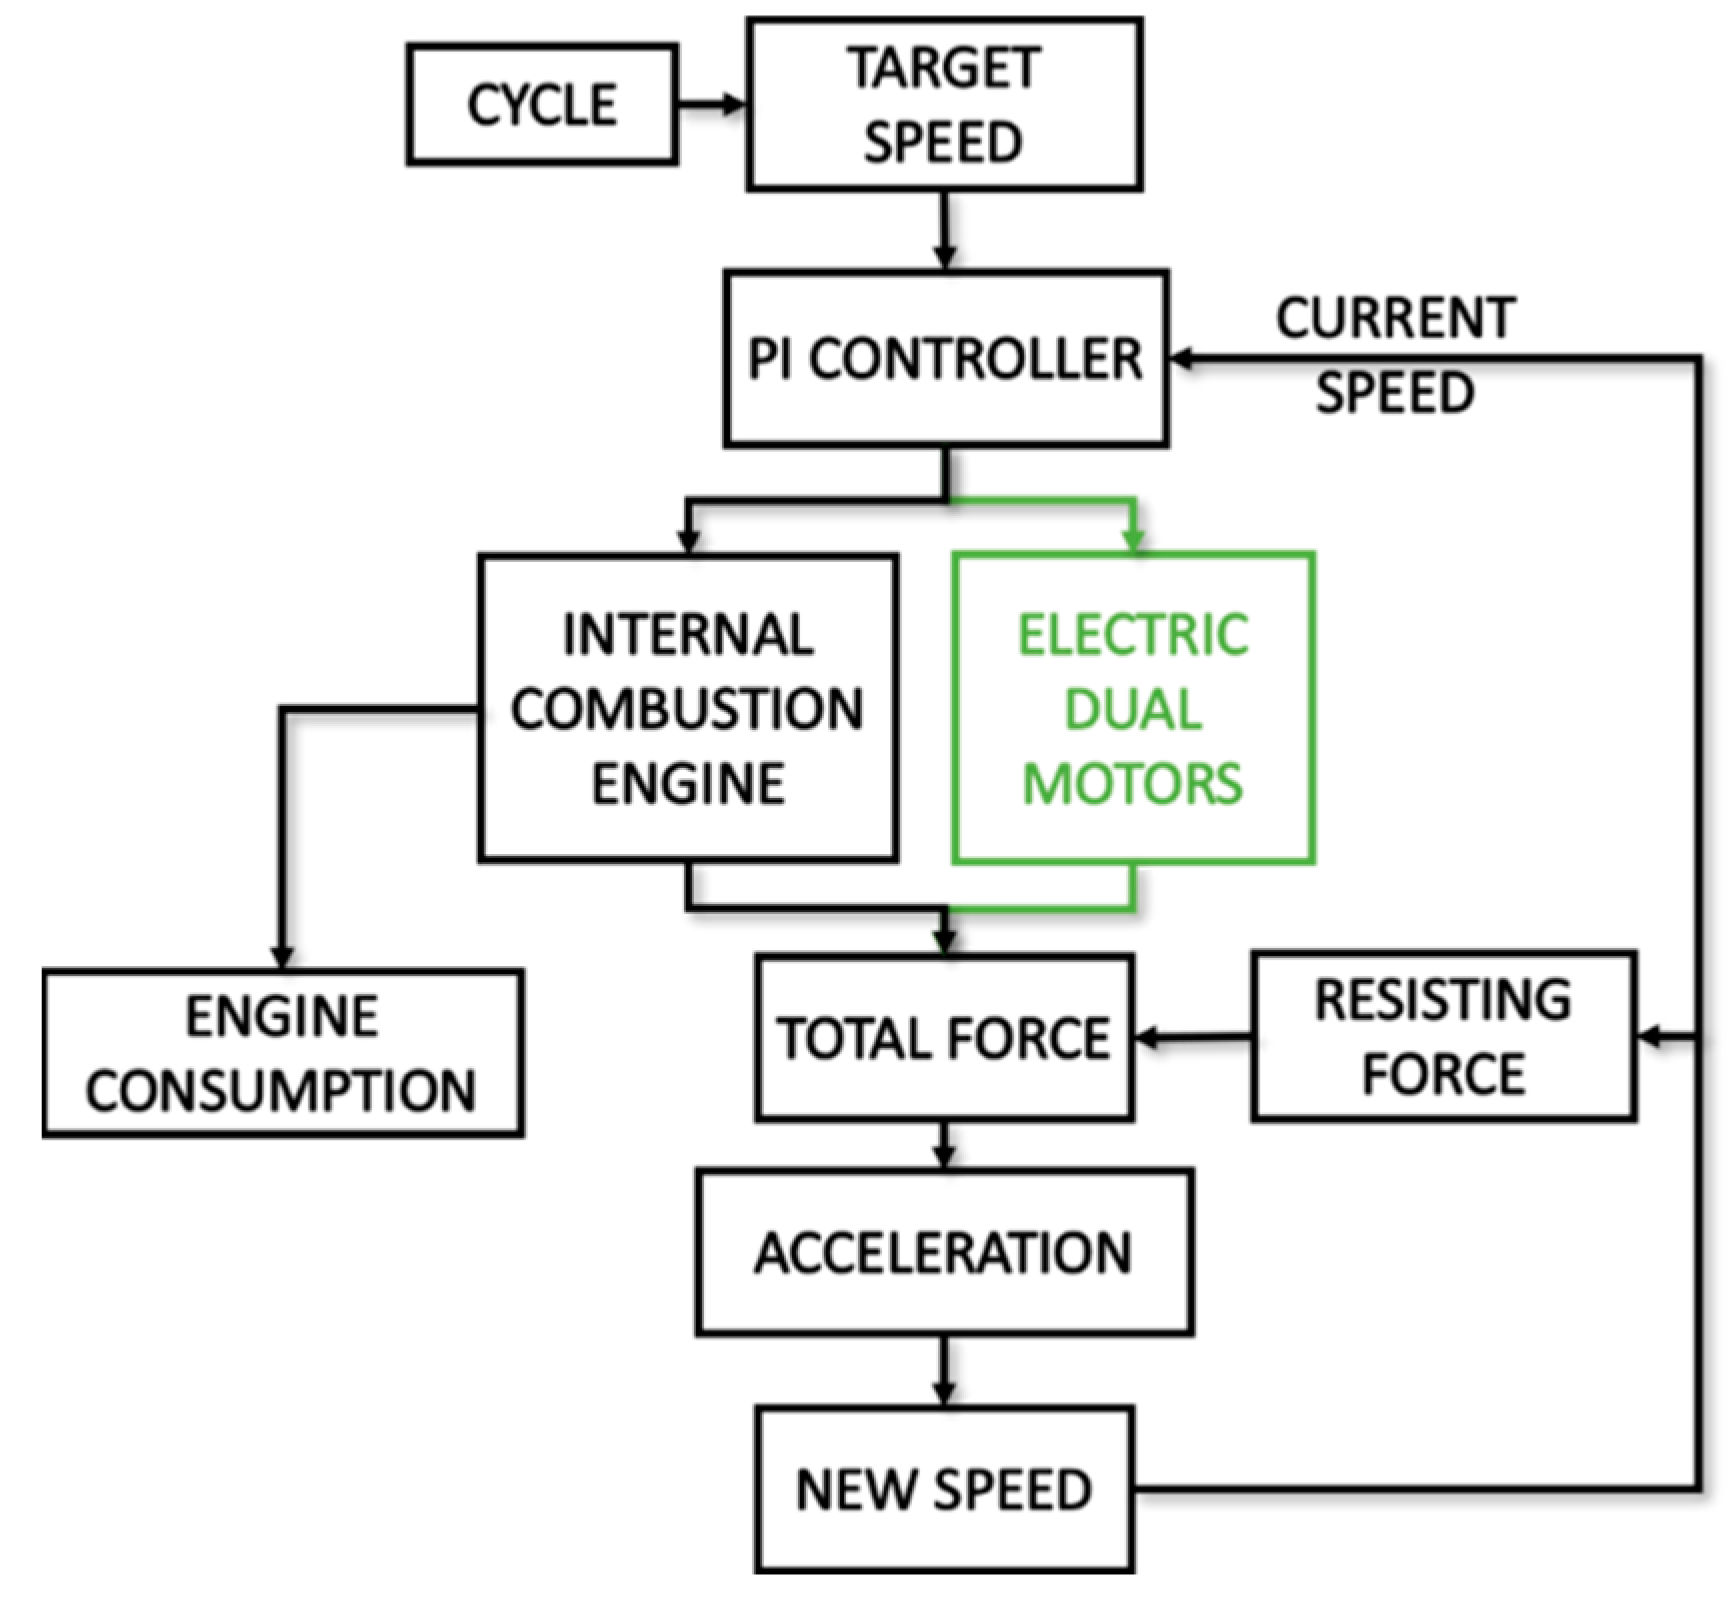
In particular, the longitudinal dynamics model (
Figure 1) is composed of a driving cycle input, a Proportional-Integral (PI) controller that acts as the accelerator and braking pedal, an engine model subsystem, a gearbox model, a tire model, the longitudinal dynamics equations, and the hybrid electric powertrain.
The input is given by a speed cycle, function of time, and it can be chosen between the main emission cycles and some real experimental driving cycles. The actual speed is subtracted from the target speed, and the error enters the PI controller, which simulates the driver’s behavior. The PI controller output, acting as the requested pedal position, is the input of the vehicle model and determines the vehicle performance.
The vehicle performance directly depends on the hybrid powertrain. The Electric Motors’ (EMs) parallel configurations that are analyzed are represented by the P3–P4 and P2-P4 positions, as shown in
Figure 2. The P4 EM is placed at the front axle, while the rear EM (P2 or P3) is directly coupled with the gearbox. In both cases, the hybrid system can directly power the wheels if requested.
Figure 2 shows the EMs that are mechanically connected to the shafts. The gear ratios will be dimensioned to keep the motors connected until certain target speeds.
The P4 front EM will be disengaged at 190 km/h, while the rear EMs will disengage at the vehicle’s maximum speed, approximately equal to 350 km/h. Thus, they will be able to cover the complete speed range of the vehicle.
As shown in
Figure 2, the resulting Lamborghini Aventador will be a 4WD vehicle where the front wheels are powered exclusively through the P4 EM that is mechanically connected to the front axle.
1.2. Literature Review
The energy storage system that is evaluated is uniquely based on LiCs. This kind of technology is characterized by high specific power, high cycle life, and low specific energy [
2] and usually finds its application for operations like Start&Stop [
3]. Since it is considered difficult to use capacitors alone as an energy storage reservoir [
2,
4], they are often used as auxiliaries in combination with other energy storage systems [
5,
6,
7]. The hybrid energy storage system allows to decouple the specific energy and specific power requirements, and while the capacitors cover the power request, the main energy storage system can be optimized for the energy request and cycle life.
The decision to work with an energy storage system uniquely LiC-based is innovative, and Automobili Lamborghini has already started to investigate an application of this kind, as shown in [
1]. This vehicle represents one of the first proposals of the company in the hybrid market. The choice of high-power energy storage based on LiCs allows covering the torque gap, adding a boost function, and reducing fuel consumption.
1.3. Research Contributions
Different from the previous study, the main contribution of this work is represented by fuel economy optimization specifically designed for a LiC-based energy storage system, as a new strategy is modeled to take the benefits of the system’s characteristics. The application is innovative also for the kind of functions implemented that are usually satisfied through high energy systems [
8,
9,
10], while in this study, they are destined to a lower energy content system.
Once the conventional vehicle model has been validated, the LiC-based configuration is analyzed in detail. Later, the control strategy is introduced, and emissions cycles are simulated.
At first, the control strategy model will be based on a Rule Based Strategy (RBS), which will target lower fuel consumption results through control rules. Afterward, an Equivalent Consumption Minimization Strategy (ECMS) is implemented [
9,
10].
Fuel economy is not easy to obtain with this kind of application. In fact, the vehicle is characterized by a V12 engine [
11], with a large displacement and high CO
2 emissions and fuel consumption values, as all super sport cars do.
At last, a simulation with a smaller engine displacement is run, and it is compared to hybrid vehicles commonly available on the market. This allows to evaluate the impact of the hybrid system properly.
2. Materials and Methods
This analysis was carried out in a MATLAB/Simulink(R2019a)-based simulation environment, working on the longitudinal dynamics vehicle model previously introduced. The various hybrid control strategies were analyzed, comparing their fuel economy impact and the feasibility of the proposals.
2.1. Longitudinal Dynamics Model
As explained in [
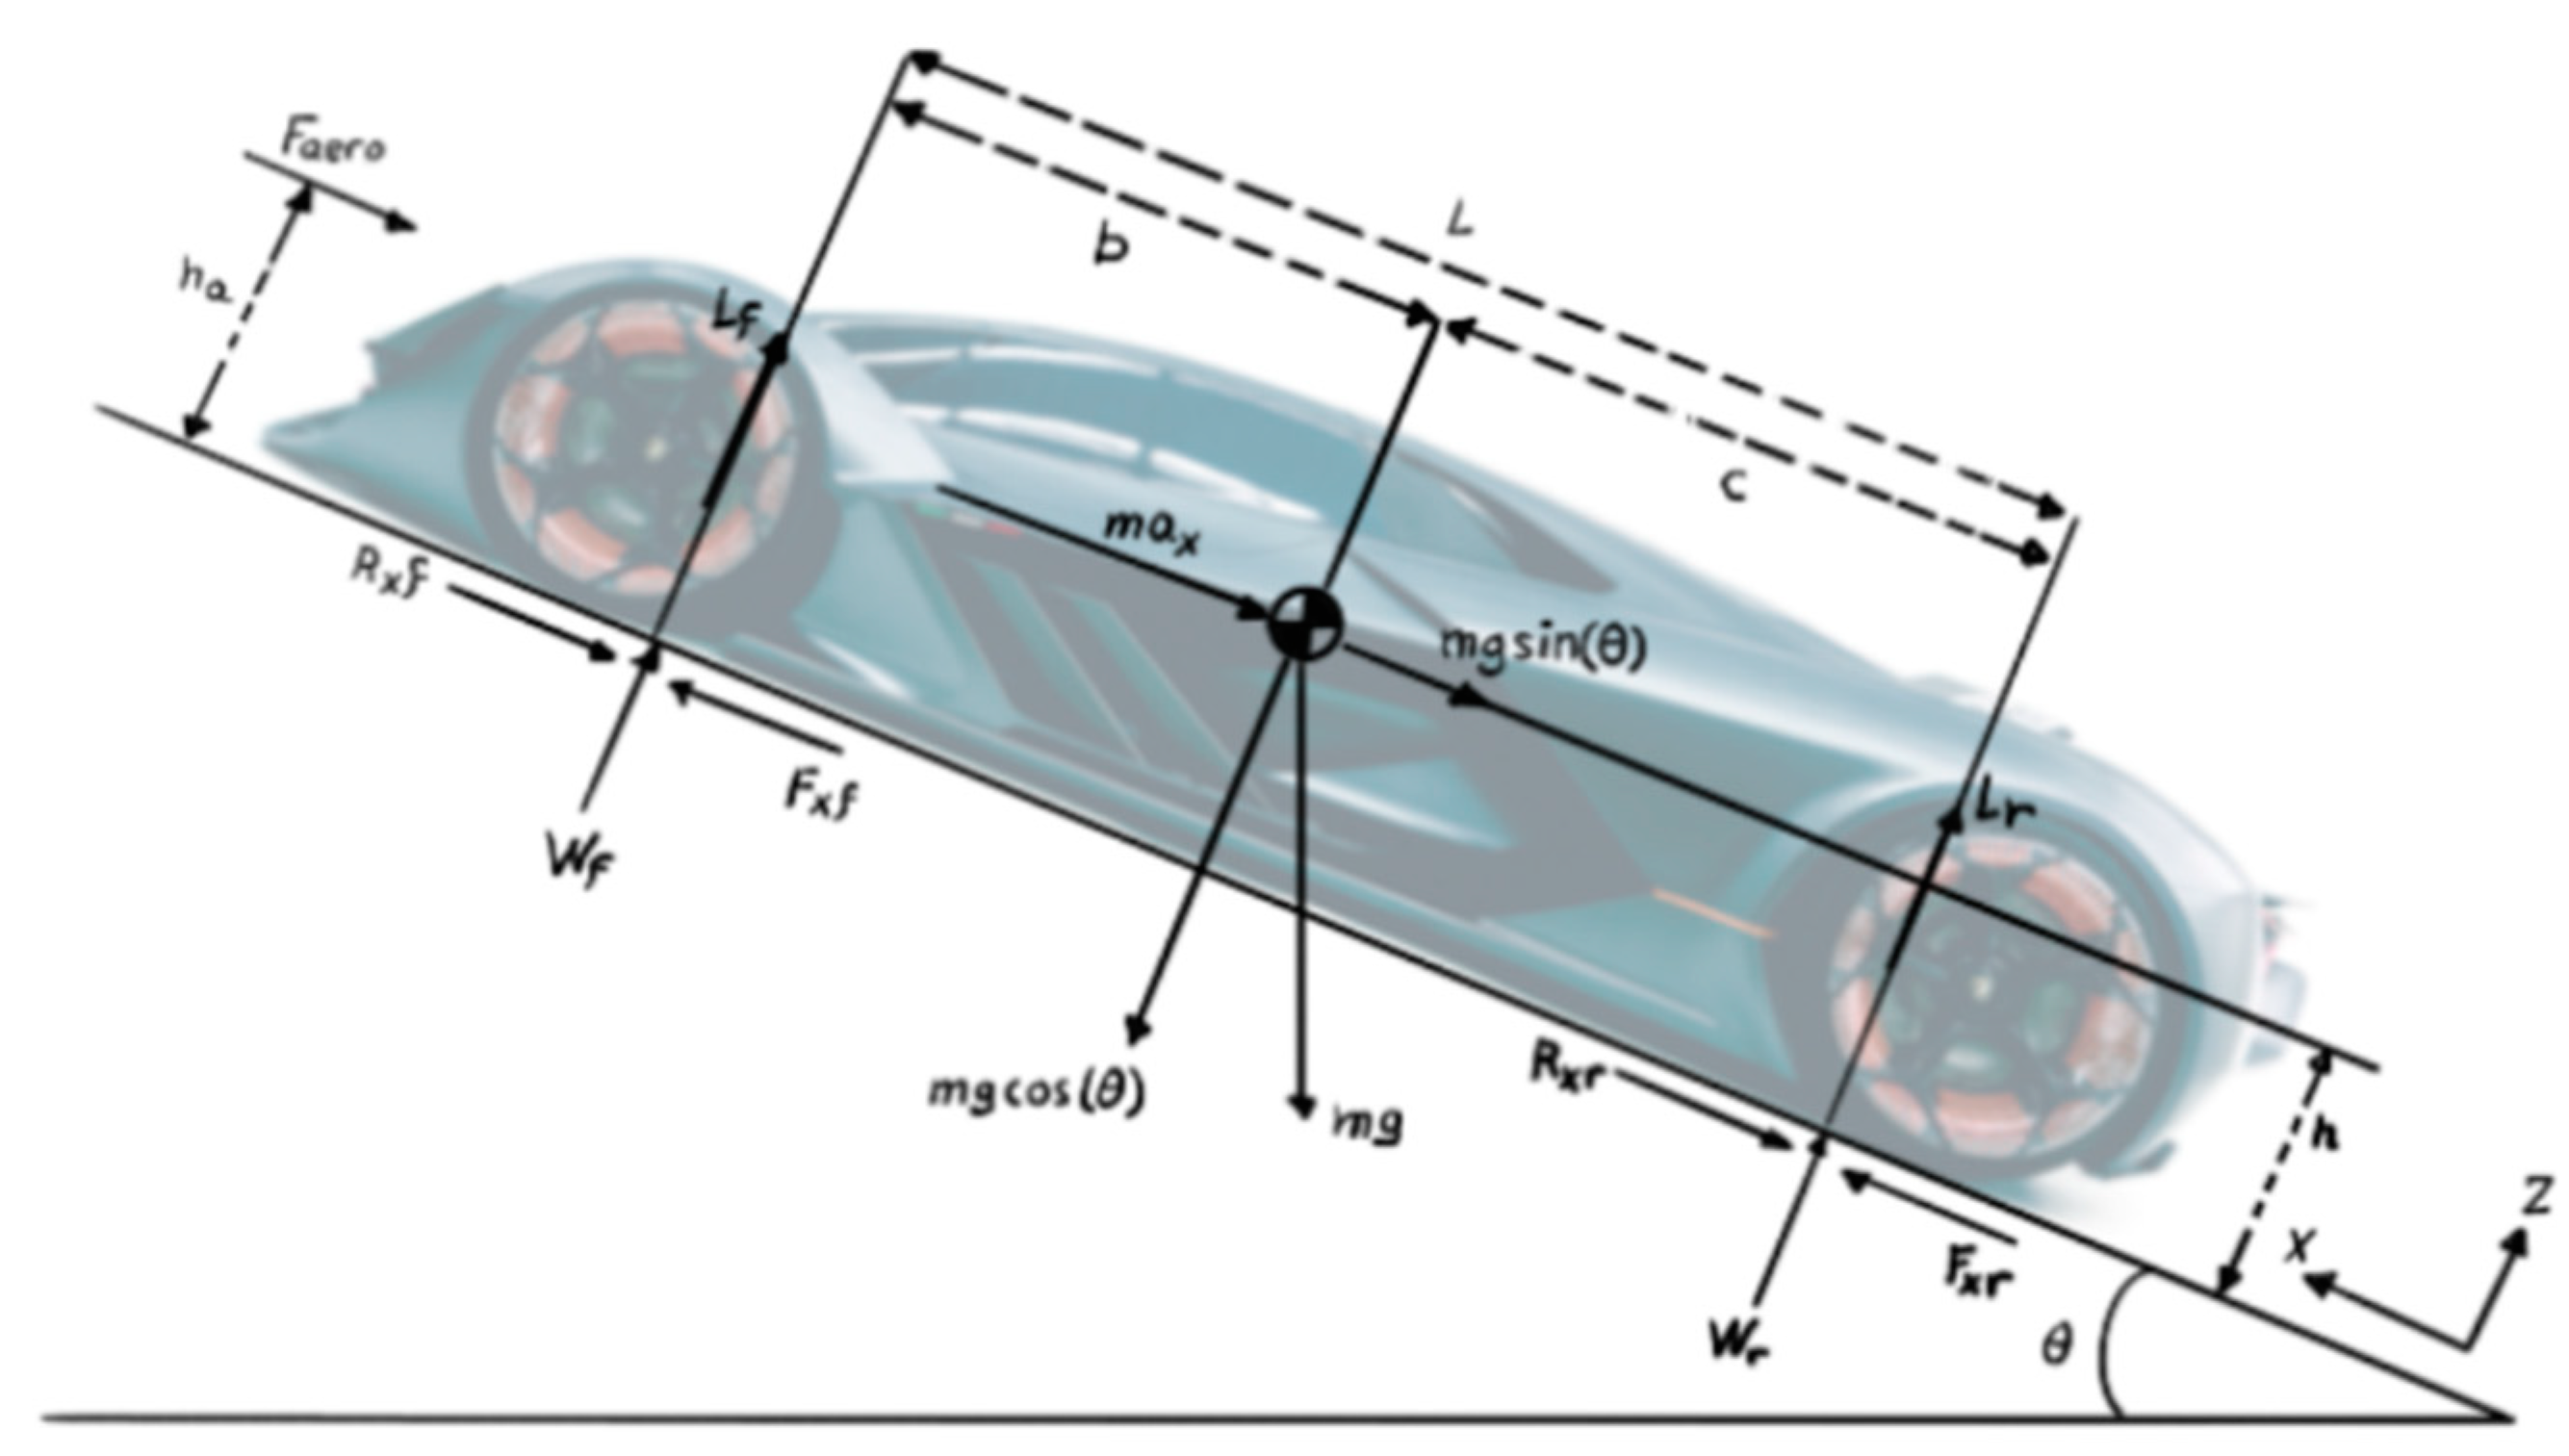
1], the longitudinal dynamics model was based on the equilibrium along the X and Z direction, in addition to the momentum equilibrium, as it can be seen in
Figure 3.
Reported below is the equation for the longitudinal dynamics:
Solving (1), where express the longitudinal traction force for the front and rear wheel, respectively, is the aerodynamic force, are the rolling resistance produced on each axle, the longitudinal acceleration can be determined and, by integration, the longitudinal speed.
The longitudinal dynamics model aims to accurately simulate emission cycles or real driving cycles. At first, the cycle will be chosen from an implemented pop-up menu that includes both homologation driving cycles and real experimental driving cycles obtained from road tests.
The driving cycle generates a target speed, a time-dependent quantity that is the input for the vehicle model. The target speed is compared with the actual speed, and their difference enters the PI controller, where a command corresponding to the driver accelerator and braking pedals was generated.
The command value will act as a torque request to the wheels that will be satisfied by the hybrid powertrain. When possible, the powertrain components were based on experimental data, guaranteeing low simulation time but relatively low accuracy (especially for the dynamic behavior of the model). Otherwise they were modeled on physics laws and validated.
2.1.1. PI Driver
The PI controller output was normalized between −1 and 1, representing 3 different cases:
If it is positive, the car must accelerate to reach the target speed. This signal matches the accelerator driver pedal.
If it is equal to zero, the target speed is reached.
If it is negative, the vehicle must brake.
2.1.2. Vehicle Resistances
Vehicle resistances have been based on experimental data. Vehicle tests have been run to determine the dependency of the resistant force with speed, according to the following coast-down equation:
where
[
] is the vehicle speed,
[
],
[
] and
[
] are the vehicle coast-down coefficients.
According to this formula, the already models the aerodynamics, rolling and all the vehicle resistances. This approach was easily implementable but required experimental testing on the specific vehicle or on the most similar vehicle available.
On the other side, data of this kind can be easily shared due to the ease of use of the model. Since a prototype is not available at the moment, it has been established to work with this approach.
2.1.3. Powertrain
The V12 engine model was based on experimental data and on the torque map that was inserted in the control unit.
The powertrain model was completed through the gearbox and transmission model. The torque was transmitted to the gearbox shafts and multiplied by the gear ratio, to the wheels.
Electric powertrain components were not present in the conventional vehicle model and will be introduced in a second phase to reproduce the hybrid configuration.
2.1.4. Model Validation
For the model validation, the reader is referred to the following document [
1]. There, the model validation for the conventional Lamborghini Aventador vehicle was carried out. The two works took that configuration as a starting point while they differed in the hybrid powertrain components.
2.2. Hybrid Powertrain
Once the conventional model was complete, the hybrid powertrain was designed and modeled.
As it has already been explained, the hybrid powertrain consisted of 2 identical EMs, one at the front axle in P4 position, and the other in P3 or P2 position at the rear axle. For every EM, a proper transmission ratio was designed that could fit the desired speed range.
The EMs models were based on experimental maps that kept into account the contribution of the single EM and the inverter associated with it.
The energy storage system was based on LiCs and the reader is referred to [
1] for the model detailed description.
The masses of the hybrid components will be added in the simulation, the LiC-based hybrid vehicle was expected to weigh 57 kg more than the conventional one.
2.2.1. Transmission Ratios
The EMs mechanical connections were dimensioned with reference to the maximum admissible speed established in the project design.
The transmission ratios were dimensioned to guarantee front electric traction and recuperation until 190 km/h, when the front EM in P4 position was detached. On the other hand, the P2–P3 EMs will be detached at maximum speed, and they will be able to power the rear wheels over the complete speed vehicle range.
These target speed values will be compared to the maximum EM speed, equal to 24,000 RPM, and the transmission ratio was determined (
Table 1).
Since the P2 configuration was positioned at the primary gearbox shaft, the transmission ratio value will be determined keeping into account the gearbox gear ratios. The chosen value will guarantee an EM speed below 24,000 RPM for any inserted gear.
2.2.2. Electric Motors
Every EM was associated with an inverter, and their contribution was described by black-box models based on experimental testing results provided by the suppliers.
All the EMs were assumed to be identical. Every EM guaranteed a maximum torque of 68 Nm and a maximum power of 65 kW. The EMs can run up to 24,000 RPM.
2.2.3. Lithium-Ion Capacitors
The usage of LiCs as the main and only energy storage system was innovative. LiCs were derived from Electric Double Layer Capacitors (EDLC) [
6], and they combined the activated Carbon cathode of an EDLC with the Li-doped Carbon anode of Lithium-Ion Batteries to ensure great power and good energy content.
They were typically adopted for a few low energy demanding operations in automotive applications [
3,
5,
6,
7].
On the other side, Li-Ion Batteries were more commonly installed in hybrid electric vehicles and electric vehicles due to the high energy content that they can provide [
12]. Typically, common batteries guarantee high energy values (meaning a high electric range in automotive applications) but cannot guarantee high power performance [
2,
13].
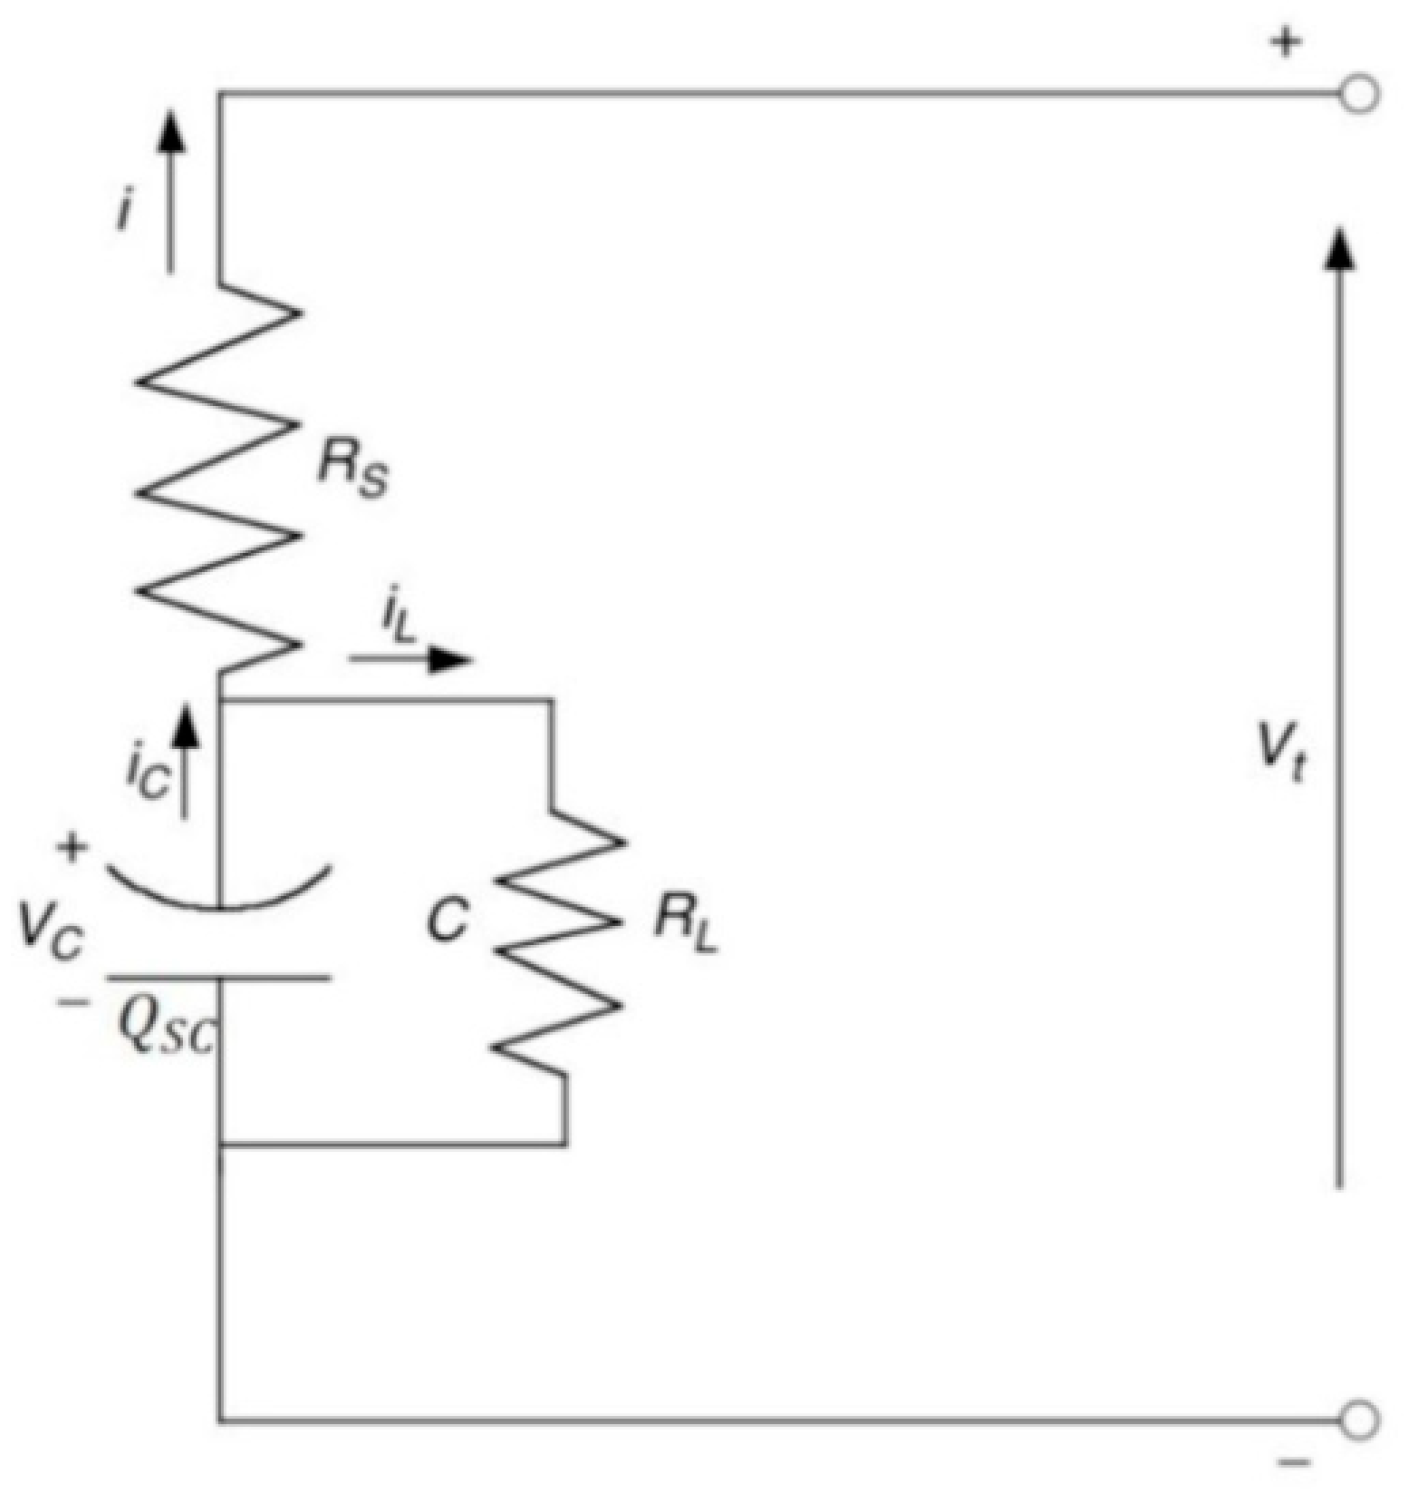
In
Figure 4, a first approach to the description of the LiC behavior is shown. The scheme was simple, representing only a series resistance
and a capacitance
[
2]. The leakage resistance
allowed to describe a more detailed model but could be omitted without losing too much in accuracy.
Defining
the charge stored within the LiC, and
the capacitance, the voltage
can be calculated as follows:
According to Kirchhoff’s rule, the terminal power is given by:
Thus, the current
can be determined as [
14]:
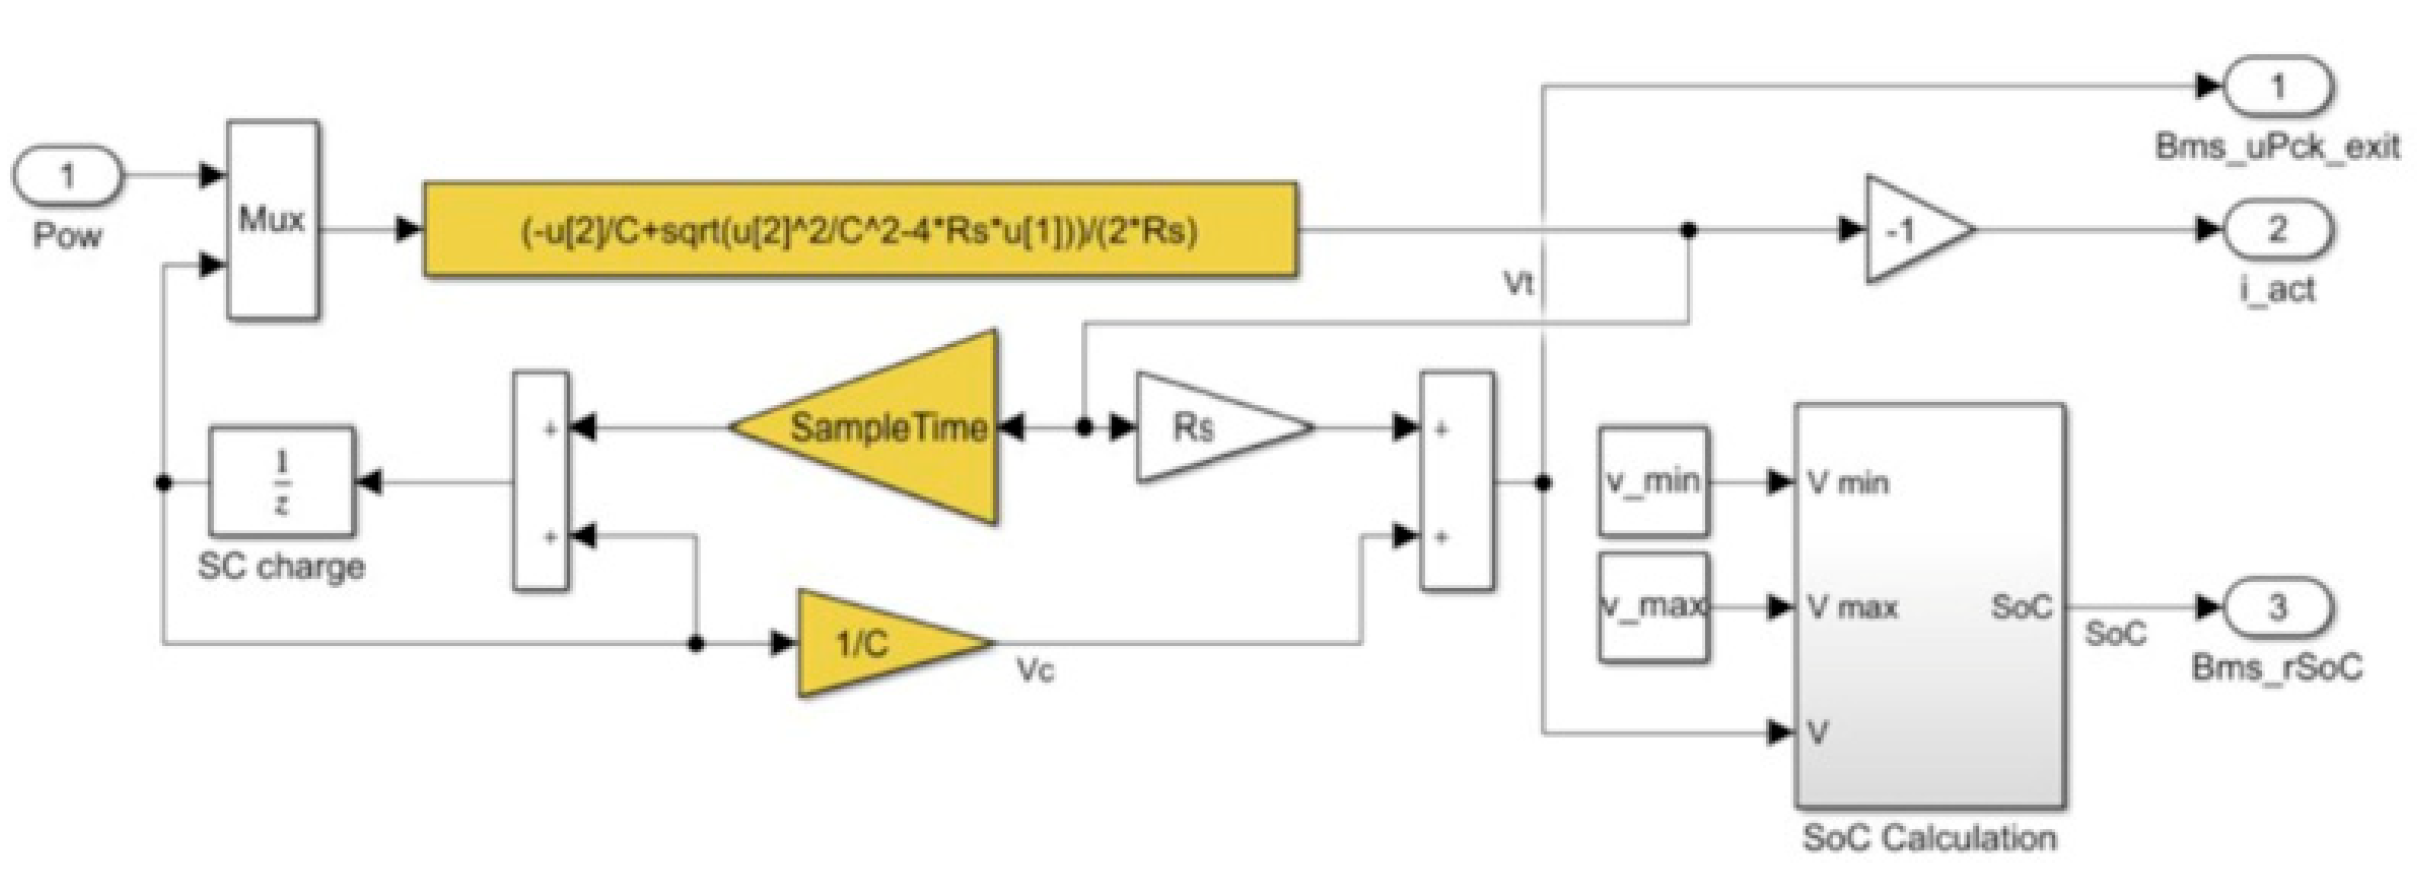
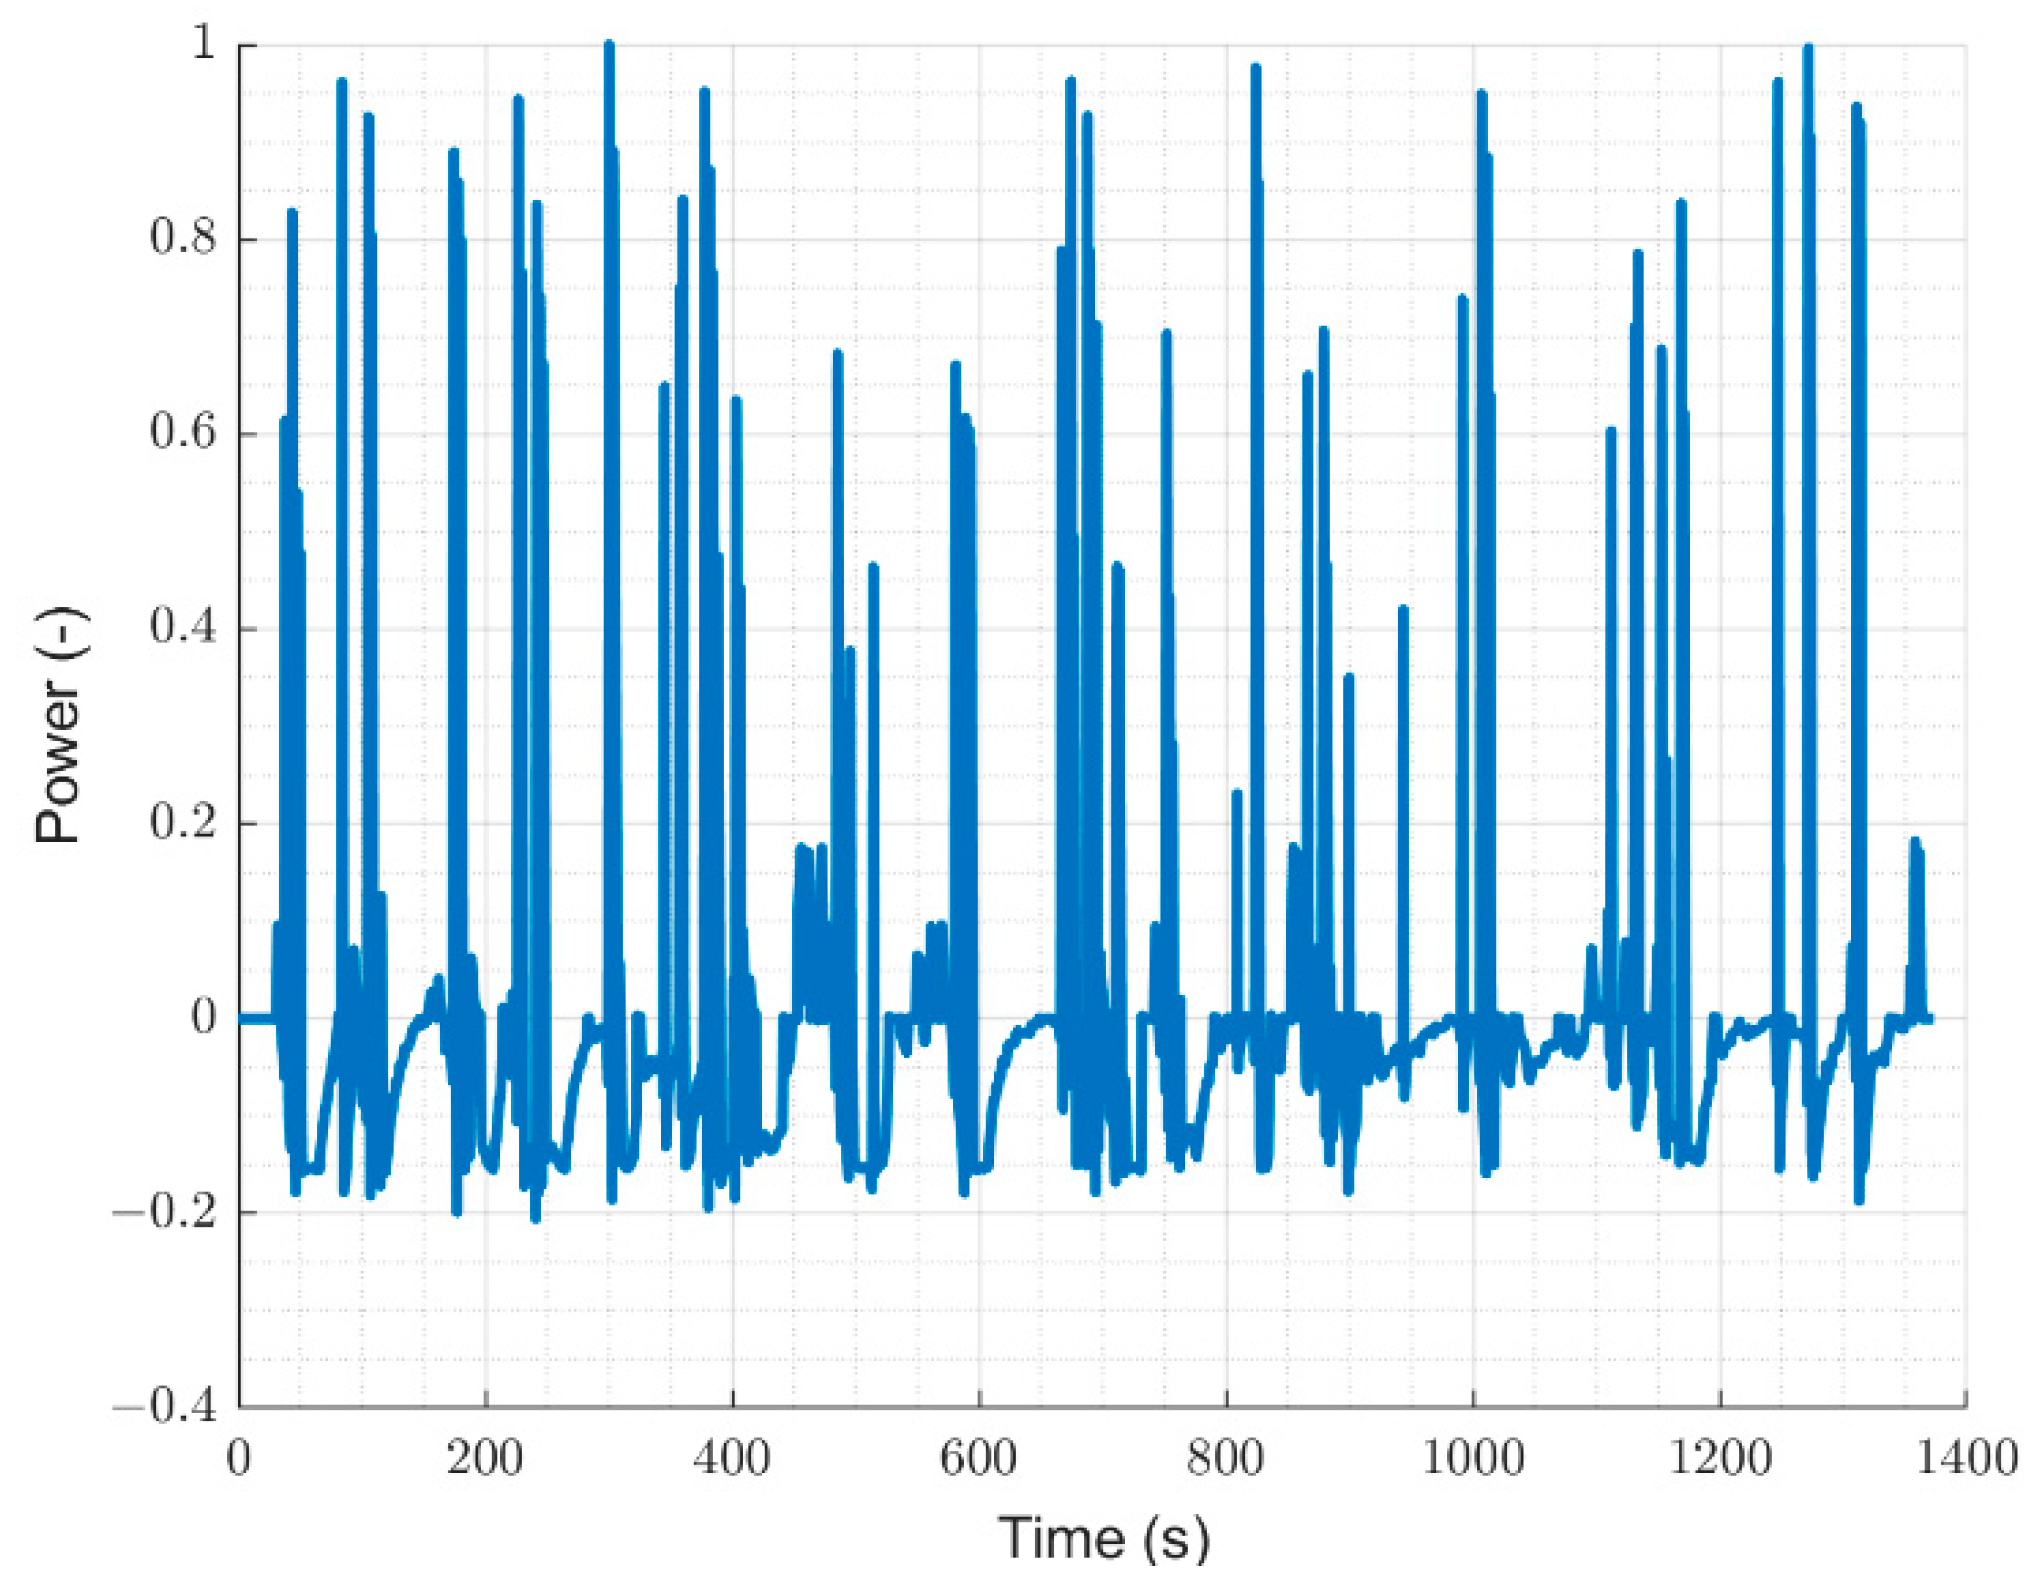
Figure 5 shows the model of LiC that has been integrated in the vehicle model, where the power [W] is the input and the terminal voltage [V] and the current flow [A] are the outputs.
As explained in [
1,
15], the LiC model could be more complicated and detailed, reproducing a wider range of phenomena, but that level of detail was not strictly needed for automotive control-oriented applications. Moreover, according to previous works [
1], the analysis of industrial capacitors from different suppliers showed that the choice to work with a single RC circuit branch was justified.
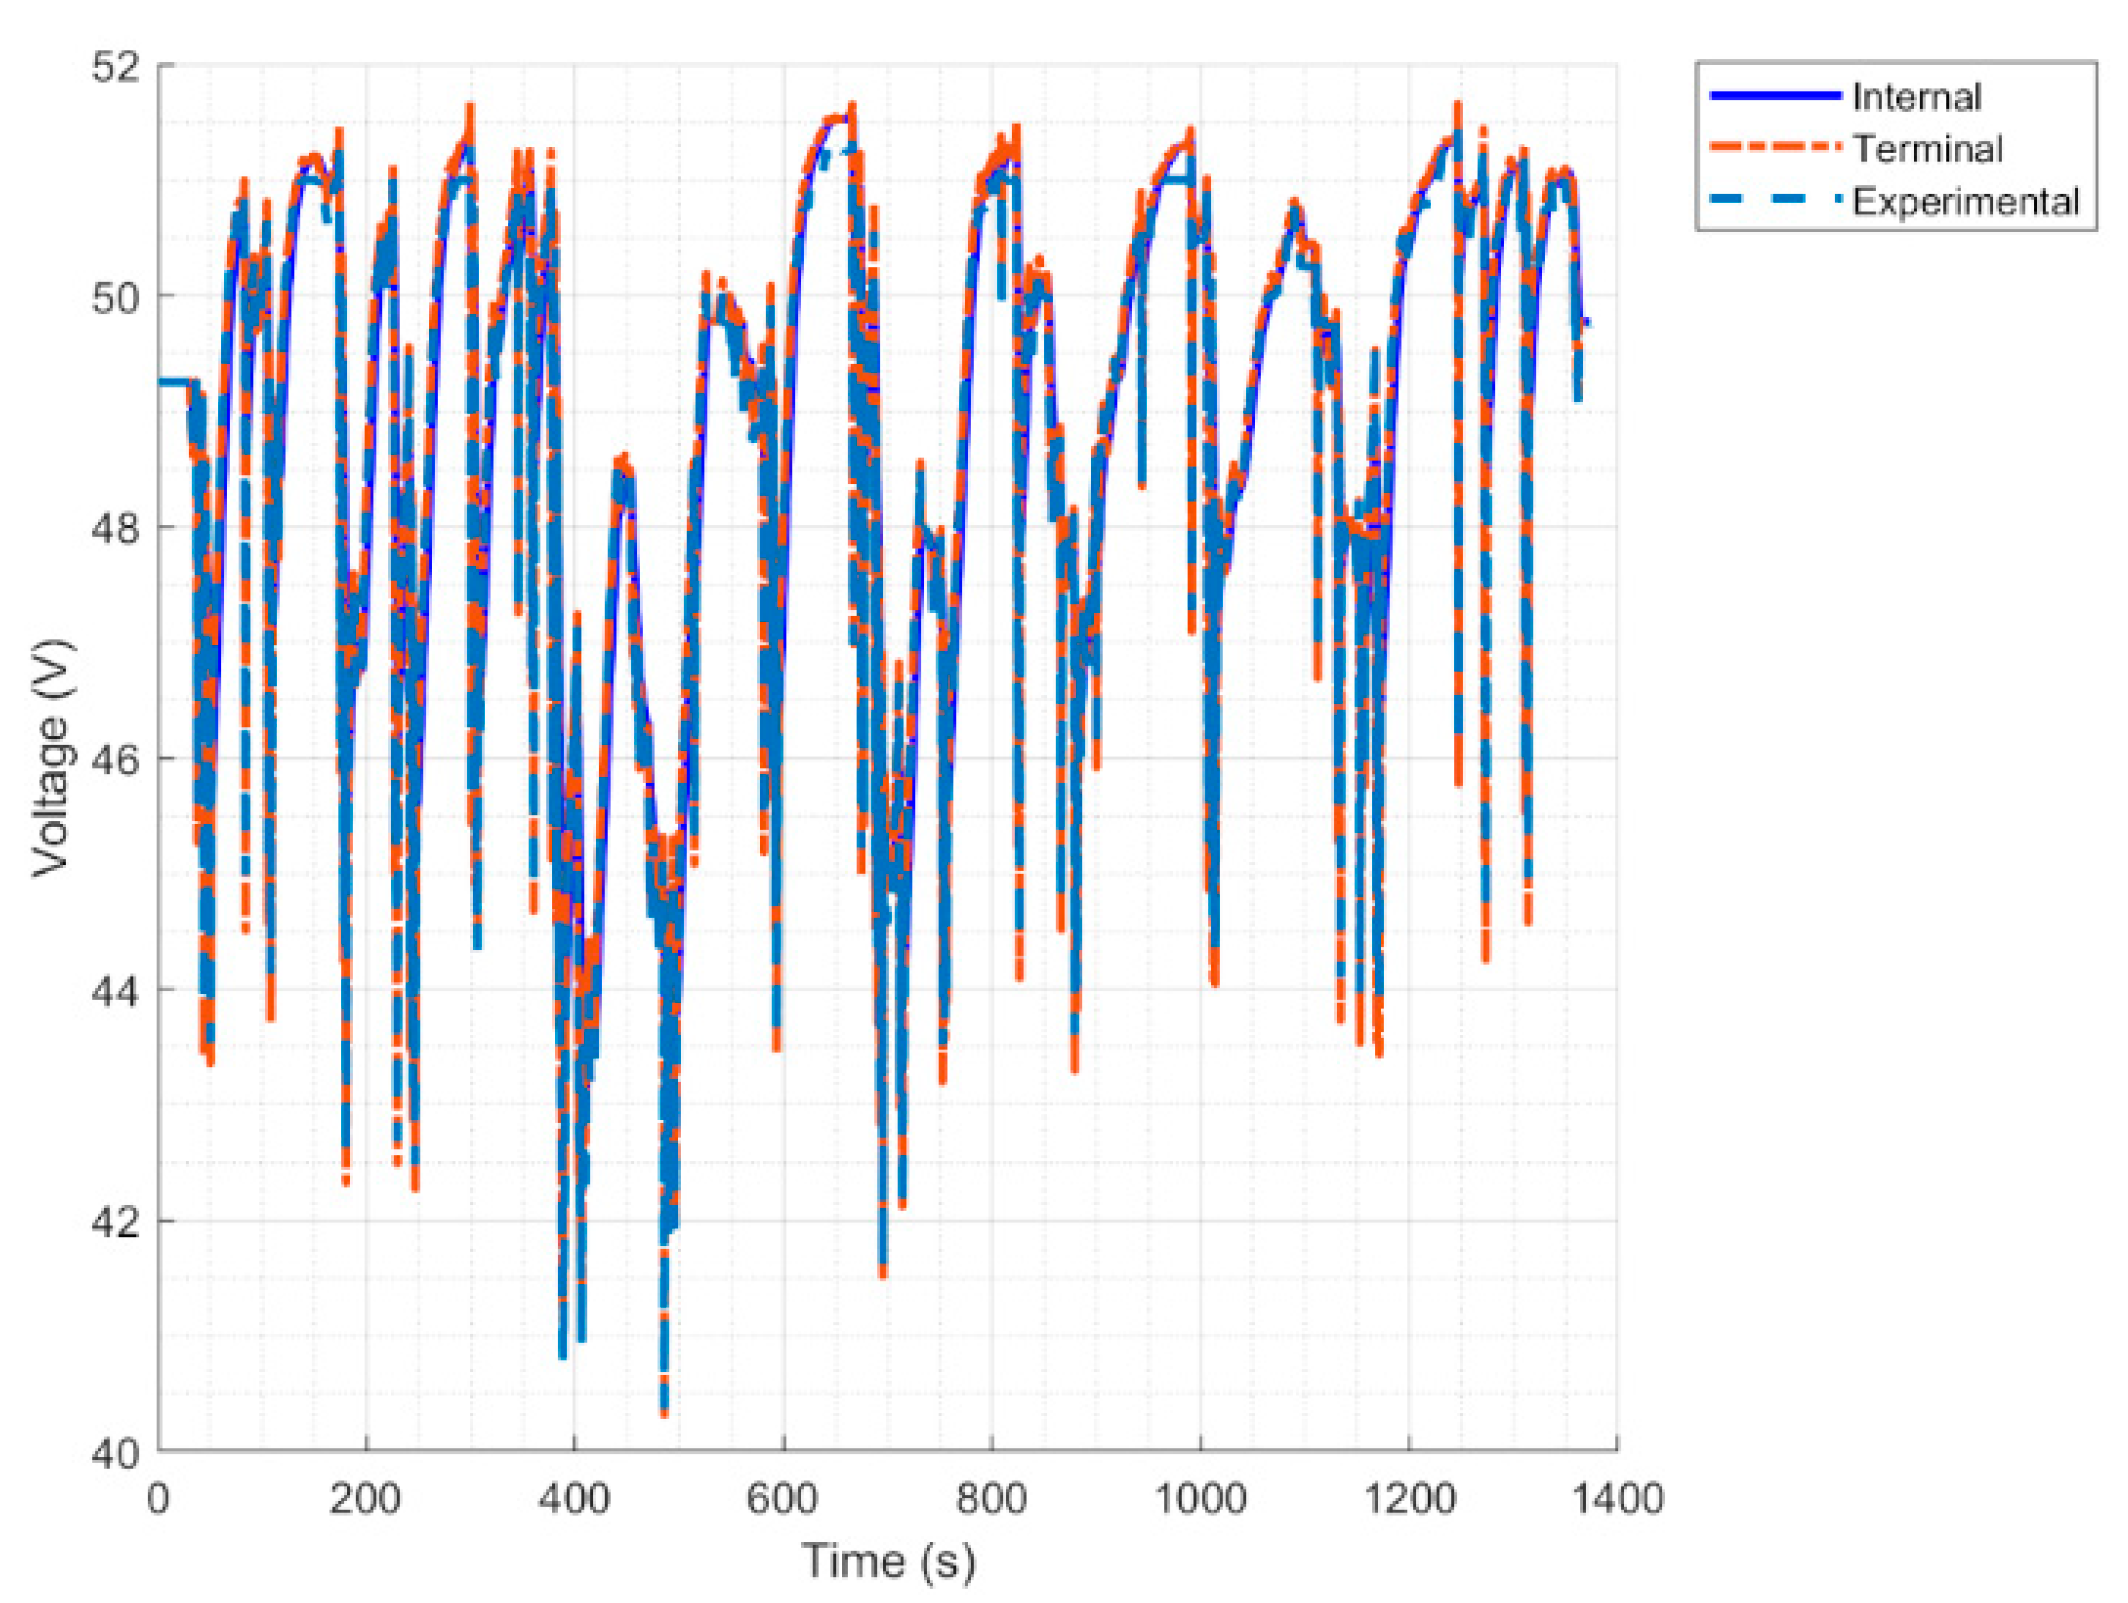
A validation based on experimental tests has been run, setting the required power as input (
Figure 6). The simulated terminal voltage was compared with the experimentally measured one in
Figure 7.
The voltage root mean square error was equal to 0.2 V, and the model can thus be considered reliable.
Once the model was validated, the LiC configuration was chosen. The system will be a 60s1p (60 series cells and 1 parallel string) that stores 0.26 kWh and could reach over 130 kW of power, satisfying the power request of the EMs. The working voltage spans from 132 V to 228 V.
3. Hybrid Control Strategies Design
The hybrid control strategies were designed according to the vehicle mission. This work mainly wanted to investigate the possibility of guaranteeing fuel economy through the hybrid application.
As we were considering a super sport car application, the vehicle was characterized by a V12 engine, with a large displacement and high CO2 emissions and fuel consumption values, as all super sport cars do. The EMs account for a power and torque that are strongly inferior to the one expressed by the ICE (approximately 15%). Consequently, their impact on the performance and on fuel economy is expected to be small, and the percentage of improvements on fuel economy are expected to be quite low. Various hybrid powertrain configurations will be analyzed, and the simulated results will be reported as a comparison between the conventional vehicle and the hybrid configurations.
With the introduction of a control strategy, the electric energy can be managed in the best way to guarantee fuel economy. Moreover, a control strategy is required to respect the technology voltage limits. Good energy management can guarantee the proper use of technology, activating control functions as energy recuperation or boost.
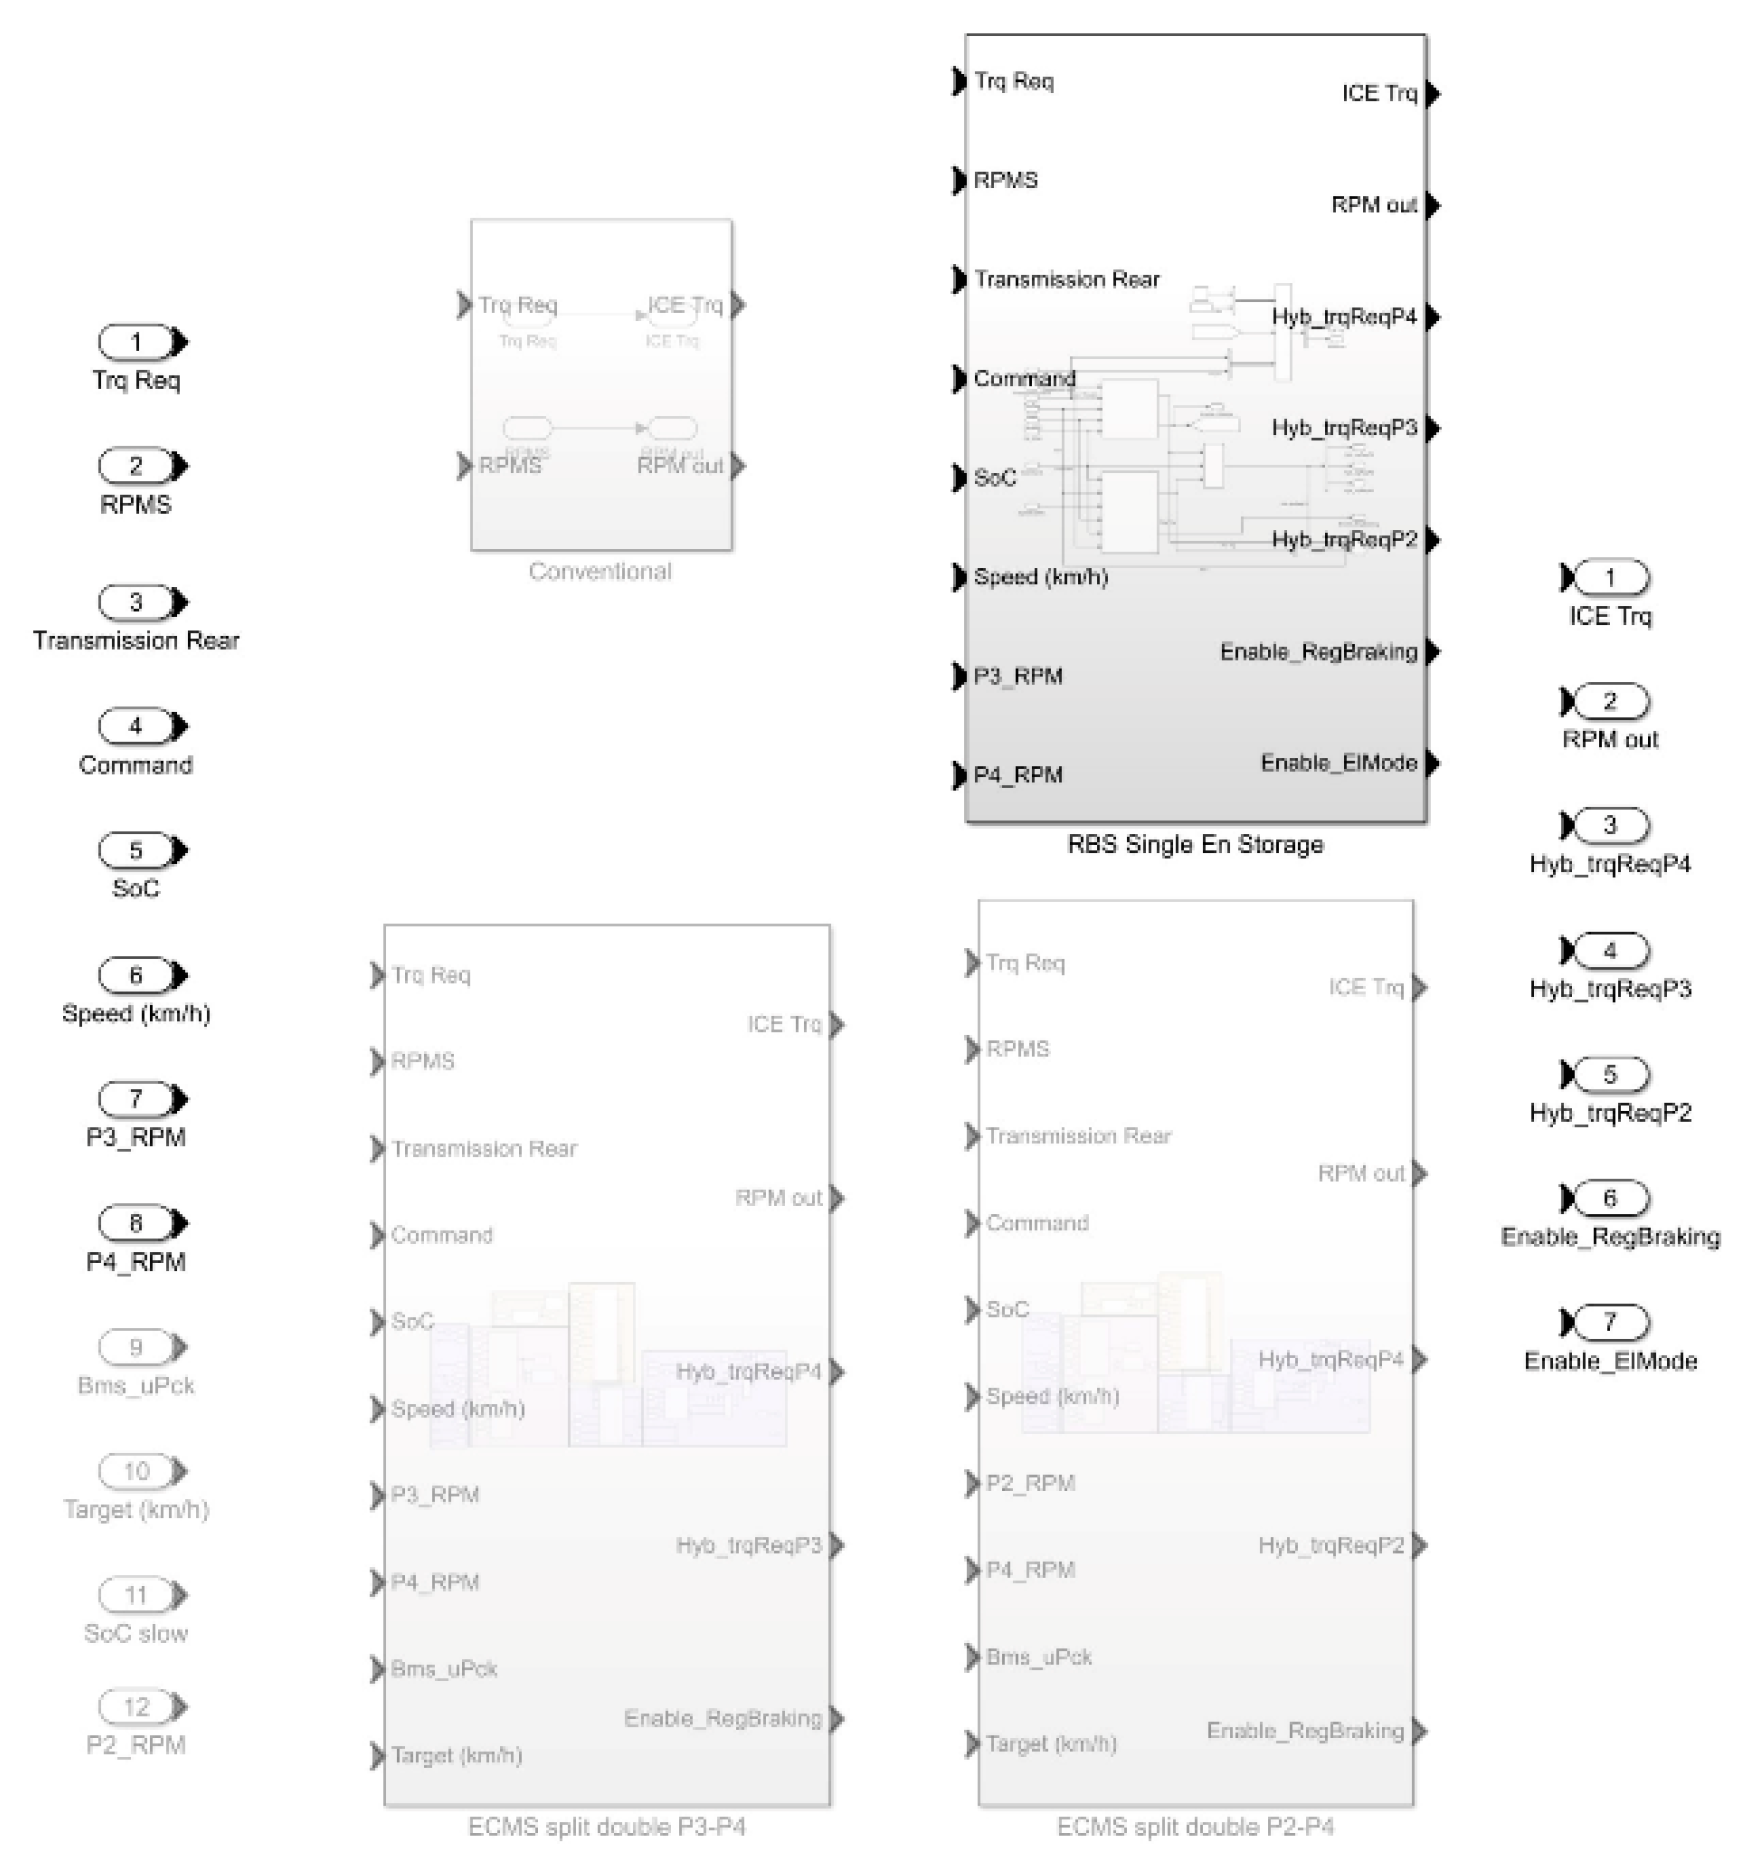
MATLAB/Simulink allows the user to design various configurations and to activate only the desired one while keeping the others disabled. This was possible thanks to the Variant Subsystems [
16], where the active choice was determined by the variant control, which can be a Boolean expression or also a string. The decision to work with a Variant Subsystem (
Figure 8) allowed the user to choose the control strategy directly from the MATLAB environment, without necessarily entering Simulink. This means that the model was more easily accessible even to users who have not participated in the design of the model itself. Any unwanted changes in the Simulink environment could generate major problems, especially if the model was shared between users and departments. This is avoided when the model control is done via MATLAB.
In this regard, a graphical user interface could be implemented to further facilitate operations for users who are not familiar with the software.
3.1. RBS Hybrid Control
The first strategy implemented was an RBS. An RBS is a control strategy based primarily on control rules that establish the behavior of the vehicle’s individual components [
2,
9,
10,
17].
The rules considered were fixed mathematical rules. These rules controlled the vehicle behavior, and they aimed to maximize the powertrain capabilities, for example, aiming to use as much electrical energy as possible to reduce fuel consumption or shifting the ICE working point to recharge the battery.
This kind of control strategy compared the system variables with thresholds whose reference values were fixed thanks to hypothetical evaluations, the designer’s experience, and calibration activities based on experimental tests.
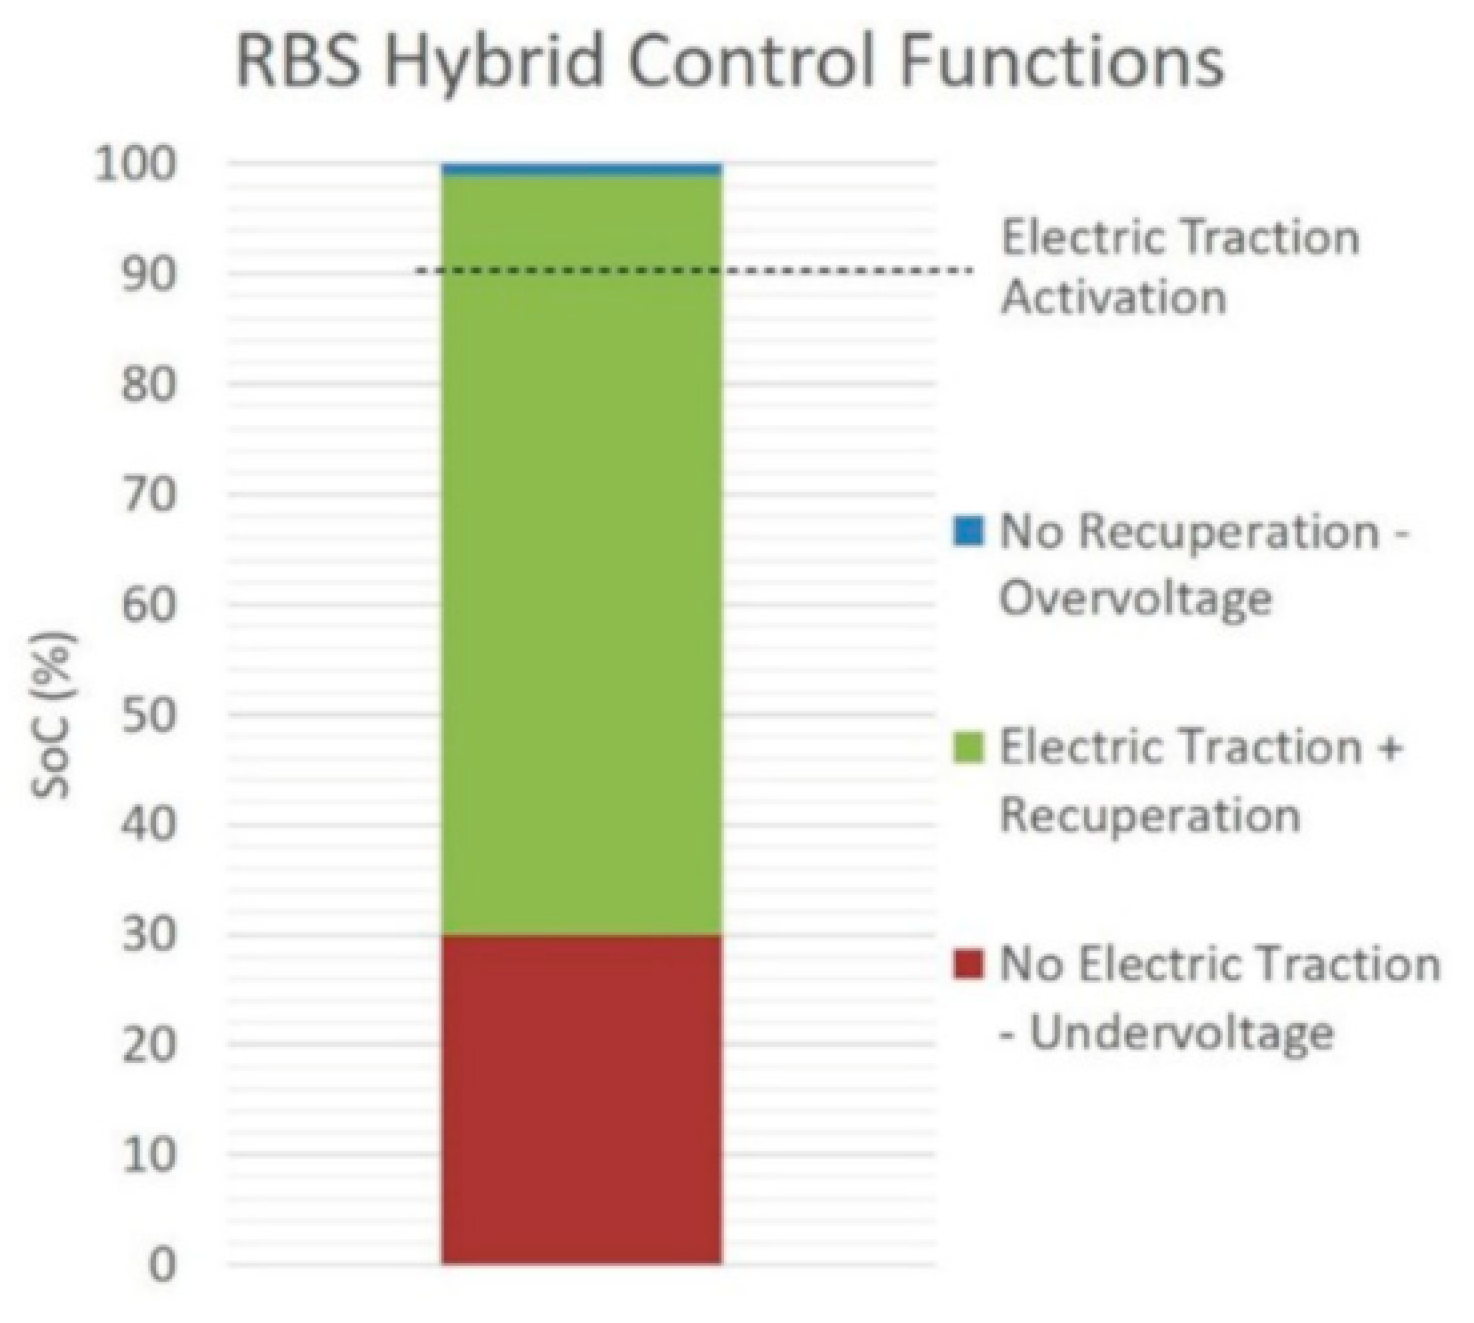
The vehicle behavior can be modeled through simple, low computational effort subsystems or more complex subsystems that could require larger amounts of data and higher computational effort. As shown in
Figure 9, the main target of the RBS was to make the vehicle work in electric drive mode as soon as the electrical energy storage was full, i.e., the battery State of Charge (SoC) reached a value of 90%. Every time the electric drive mode was activated, the fuel consumption was reduced to the minimum, as the ICE could be shut down or it could be working in idle conditions.
The discharge speed of the electrical energy storage depended on the technology’s characteristics and, as soon as the minimum SoC value was chosen from calibration (i.e., SoC = 30%) was reached, the electric driving mode was stopped, and only the regenerative braking function was kept active. In this implementation, energy recuperation was possible only through the regenerative braking function, as no load point shift function is momentarily implemented.
The SoC was not the only control variable of the strategy, the EMs speed and the torque request were also kept into account, as they will be compared with their corresponding limit values.
The feasibility of the pure electric mode activation has been analyzed, and the possibility to work with the ICE in shut down conditions has been discarded. If the ICE were to be turned off, we would have issues with the lubricant flow, on the frictions, and on the heating of the powertrain components. Other issues would have been generated by the speed difference between the clutch and the gearbox components when the ICE reconnection takes place.
Then, the ICE will be kept in idle conditions, guaranteeing low fuel consumption values and allowing the clutch and gearbox to work in conditions that do not heavily stress the mechanical components.
The strategy will be activated after the warm-up phase of the after-treatment system on the Worldwide Harmonized Light Vehicle Test Procedure (WLTP) 3b cycle to guarantee the usual heating strategy for the post-treatment components.
The warm-up phase of the WLTP 3b emission cycle represents one of the most controversial intervals for the fuel consumption analysis. The introduction of the hybrid control strategy would necessarily generate changes in vehicle behavior during this starting phase. These changes were unpredictable, and it was very difficult to simulate them accurately.
The decision to maintain the same behavior as the conventional vehicle guaranteed the reduction of possible errors to the minimum since the results were analyzed as a comparison between cycle simulations.
3.2. Equivalent Consumption Minimization Strategy
Further considerations were made for the control strategy. The decision to work with an RBS strategy that targeted fuel economy ensured the possibility to work with a simple system. The RBS can provide a high simulation speed since it can work with control rules, but at the same time, it does not guarantee the best working condition for every integration step.
In fact, even if the engineering assumptions made for the RBS design make total sense, the rules and calibration were not flexible and cannot be adapted to the driving conditions.
An ECMS was a sub-optimal strategy that targeted the minimization of the instantaneous equivalent fuel consumption value [
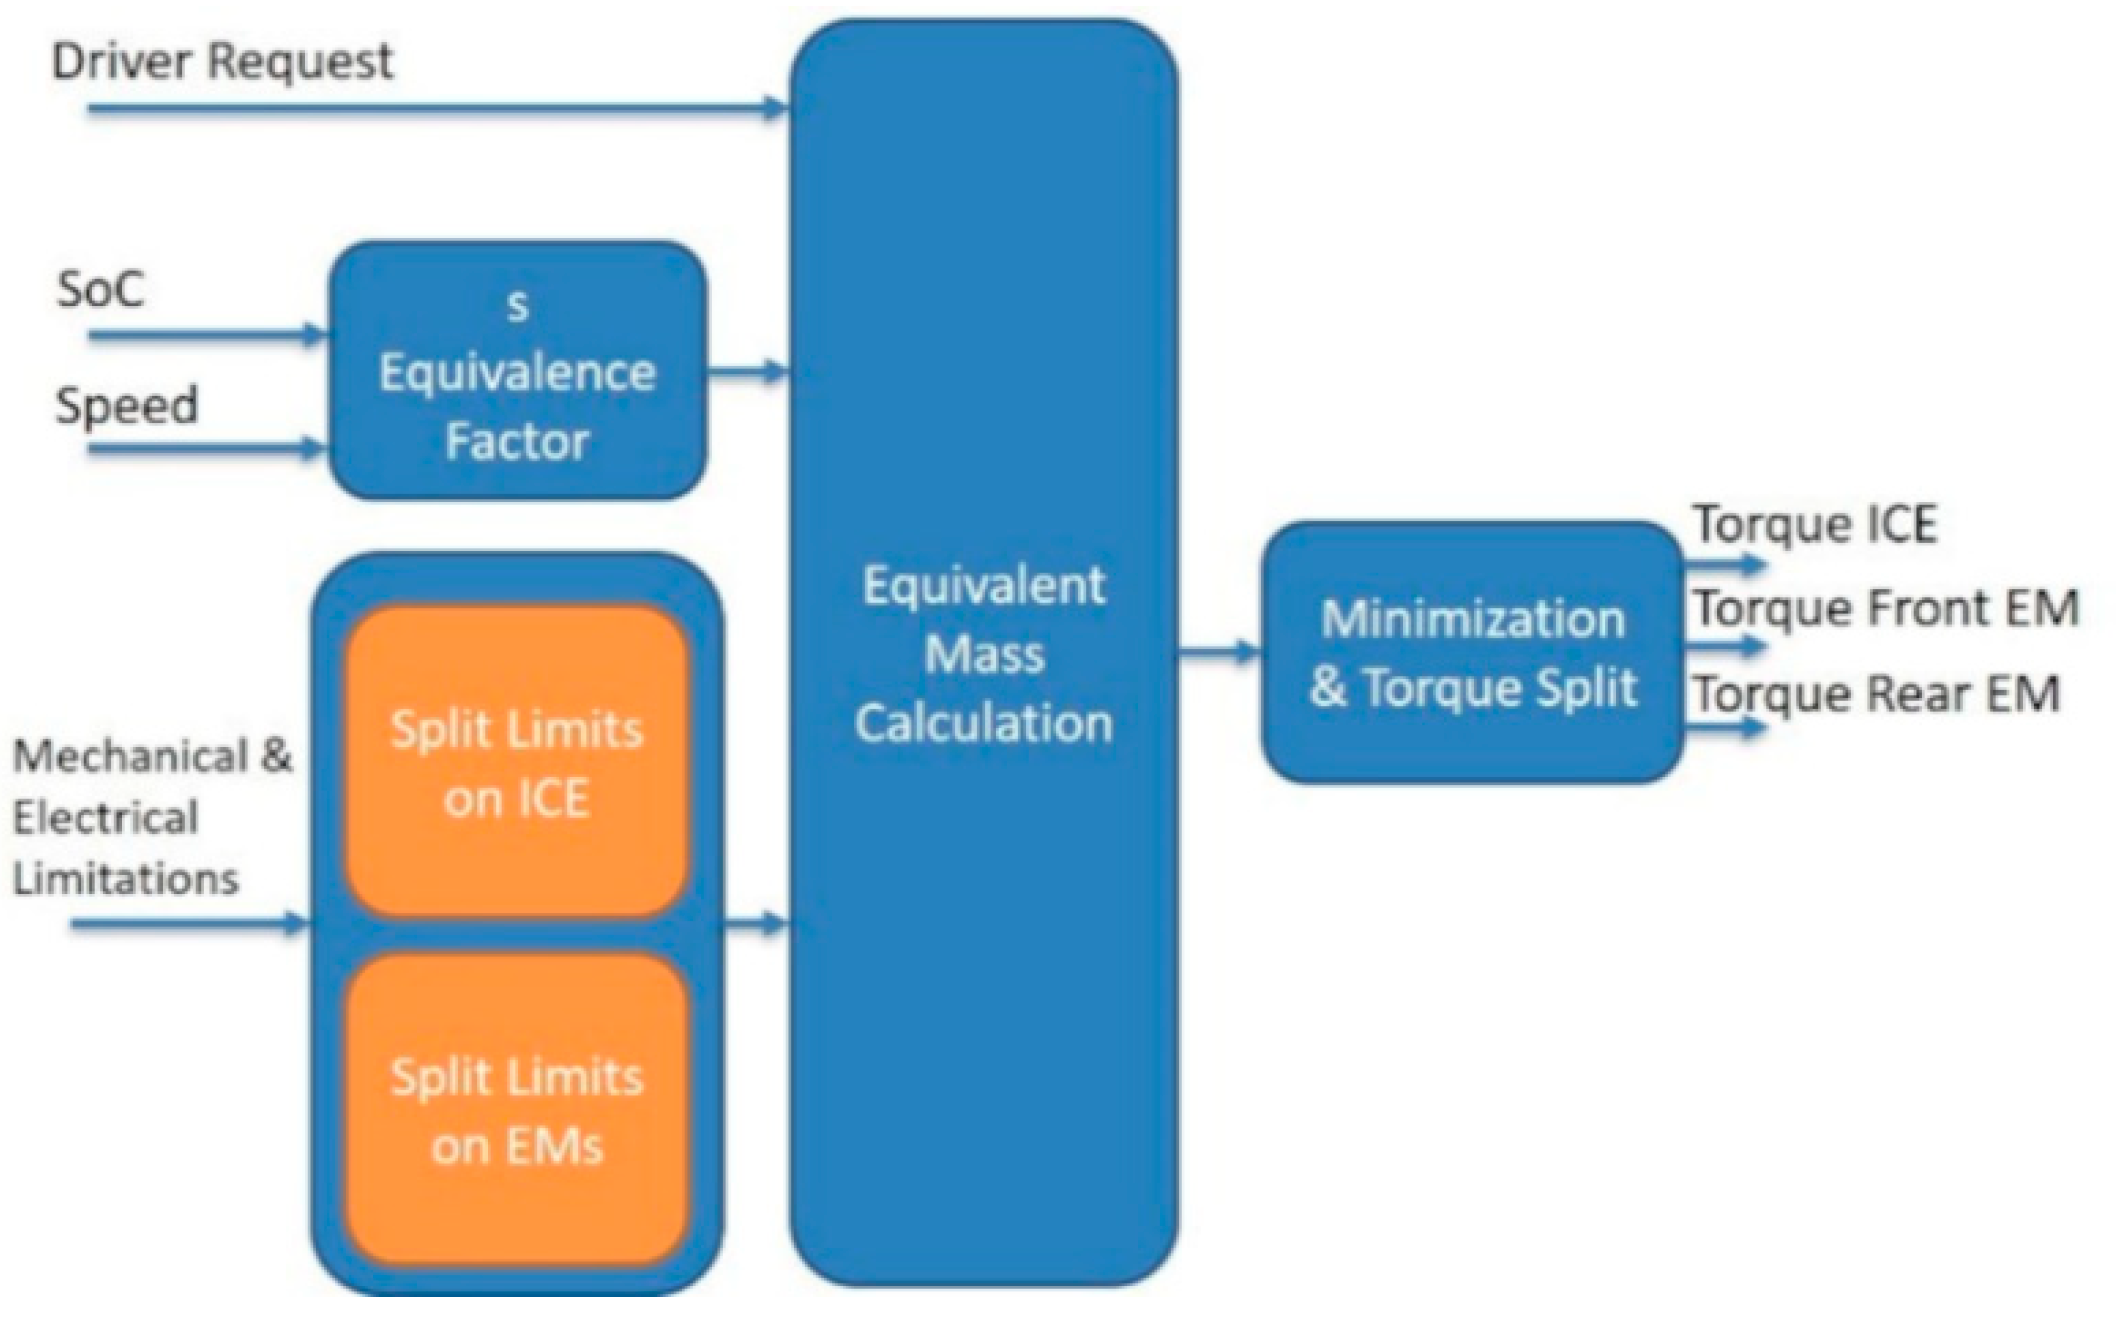
10]. It was evaluated in this work to understand whether the development of a system of that kind was justified by the fuel economy benefits. The ECMS was designed (
Figure 10) to improve the power flow distribution to the wheels. During braking, the regenerative braking control function from the RBS will be maintained, and the strategy will also keep into account the delayed activation due to the catalyst heating. As it can be seen in various documents, ECMS represented a commonly adopted solution for the fuel economy target. Extended documentation exists regarding this topic [
8,
9,
10,
18,
19,
20], and the main elements of this strategy were further analyzed.
3.2.1. Split Factor (u)
The control variable for this kind of strategy is , the torque split factor between ICE and EM.
Once the torque working range was defined, both for the ICE and the EM, the
factor that minimizes the equivalent fuel consumption was sought. The torque request must be fulfilled by combining the 2 power sources.
The torque split factor
is defined as follows:
The split factor
working window (
Table 2), and consequently the ICE and EM torque working window, was determined at each integration step through the EM, ICE, and battery limits.
Once the working window was defined, it was discretized in evenly spaced intervals to guarantee a fixed-size simulation array. The variable discretization that was chosen guaranteed a real-time simulation.
This simulation environment was a concept tool that allowed to carry out preliminary evaluations on the vehicle’s longitudinal dynamics and needs to maintain a balance between simulation speed and simulation accuracy.
3.2.2. Split Factor (hy)
Secondly, the torque was split between the 2 EMs. The electrical limitations imposed an operational range for the 2 EMs that must be considered. Hypothetically, we could decide to deliver all the electrical torque with the front EM instead of the rear one or vice versa. The
factor (
Table 3) will define the split.
The torque split factor
was defined as follows (apart from the transmission ratios):
Once the working window was defined, it was discretized in evenly spaced intervals, to guarantee a fixed-size simulation array. The variable discretization that was chosen guaranteed a real-time simulation.
The combination of the and vectors will define a matrix of possible torque values, and subsequently of equivalent fuel consumption, from which the minimum value that satisfies the optimality criterion will be extracted.
3.2.3. Equivalent Fuel Consumption
The ECMS aimed to identify the best power flow distribution between the energy converters at every integration step, such that the optimality criterion that has been chosen is achieved.
At first, a global cost function was defined, that considered the usage of both the ICE and the EMs to power the vehicle. Their contribution was evaluated through the calculation of the equivalent consumption value, at every integration step, defined as follows:
where
[g/s] is the equivalent fuel consumption flow,
[g/s] is the fuel consumption and
[g/s] is the electrical energy equivalent consumption.
can be determined through interpolation of FC maps during the simulation of the longitudinal dynamics model, while the value will be calculated based on the electrical power request and to the cost function, which depends on the equivalent cost and on the system’s working point.
The Lower Heating Value (
) [J/g] will divide the power request to the battery to convert, using the equivalent factor
s, electrical energy into virtual fuel consumption.
Consequently,
where
is the efficiency of the EM,
is the power request to the EM and
is the factor that allows to properly evaluate if the EM is working as a generator (
< 0) or as an electric motor (
> 0), and it is defined as follows:
This formulation can be easily implemented into the longitudinal dynamics model.
The minimization of the equivalent fuel consumption brings along the definition of the power flow distribution between ICE and EM, as the and pair is defined.
The general formulation of the minimization problem refers to any kind of energy storage system and can be found in [
8,
21]. Defining
as the SoC,
the control variable,
the battery charge capacity,
the battery current:
It is possible to define the Hamiltonian of the optimal control problem:
Thus, the Hamiltonian is the total equivalent fuel consumption. Introducing
:
The optimal control satisfies:
The optimal control depends on , but its value is unknown a priori, thus the strategy is sub-optimal.
3.2.4. Battery Energy Cost Function (s)
The
factor indicates the cost of the electrical energy; it is dependent on the system’s working conditions and can be formulated as follows [
8,
9]:
The cost function was calculated at every integration step, and when its value is high, it makes it preferable to use the engine and recharge the battery, while if it is low, it makes the electric traction preferable.
The curly brackets contain a penalty term that modifies the value when the SoC is near to the maximum or minimum acceptable values, making the electrical energy cost, respectively, lower or higher. On the other hand, the second term is a proportional correction obtained considering the difference between the target value of the SoC, and the actual one.
The parameters and are calibrated. Their value choice is decisive for the simulation results, as it directly impacts the cost function and consequently, the hybrid performance and the fuel consumption.
For this application, the electrical energy is low-cost since the LiC energy storage is a high-power system, and it can be charged and discharged rapidly. The values of the calibrated parameters are chosen accordingly.
The SoC target can be chosen depending on the hybrid vehicle mission and the technology that is used. The choice to work with a constant value is the simplest one, and it makes the strategy a Charge Sustaining (CS) one.
Other possibilities that are commonly used for Li-ion Batteries-based vehicles are represented by the Charge-Depleting/Charge Sustaining (CD/CS), which firstly discharges the battery until a certain SoC value and then keeps the value around a target SoC, or the Charge-Blended (CB), which follows a SoC target that linearly decreases with the driven distance [
8].
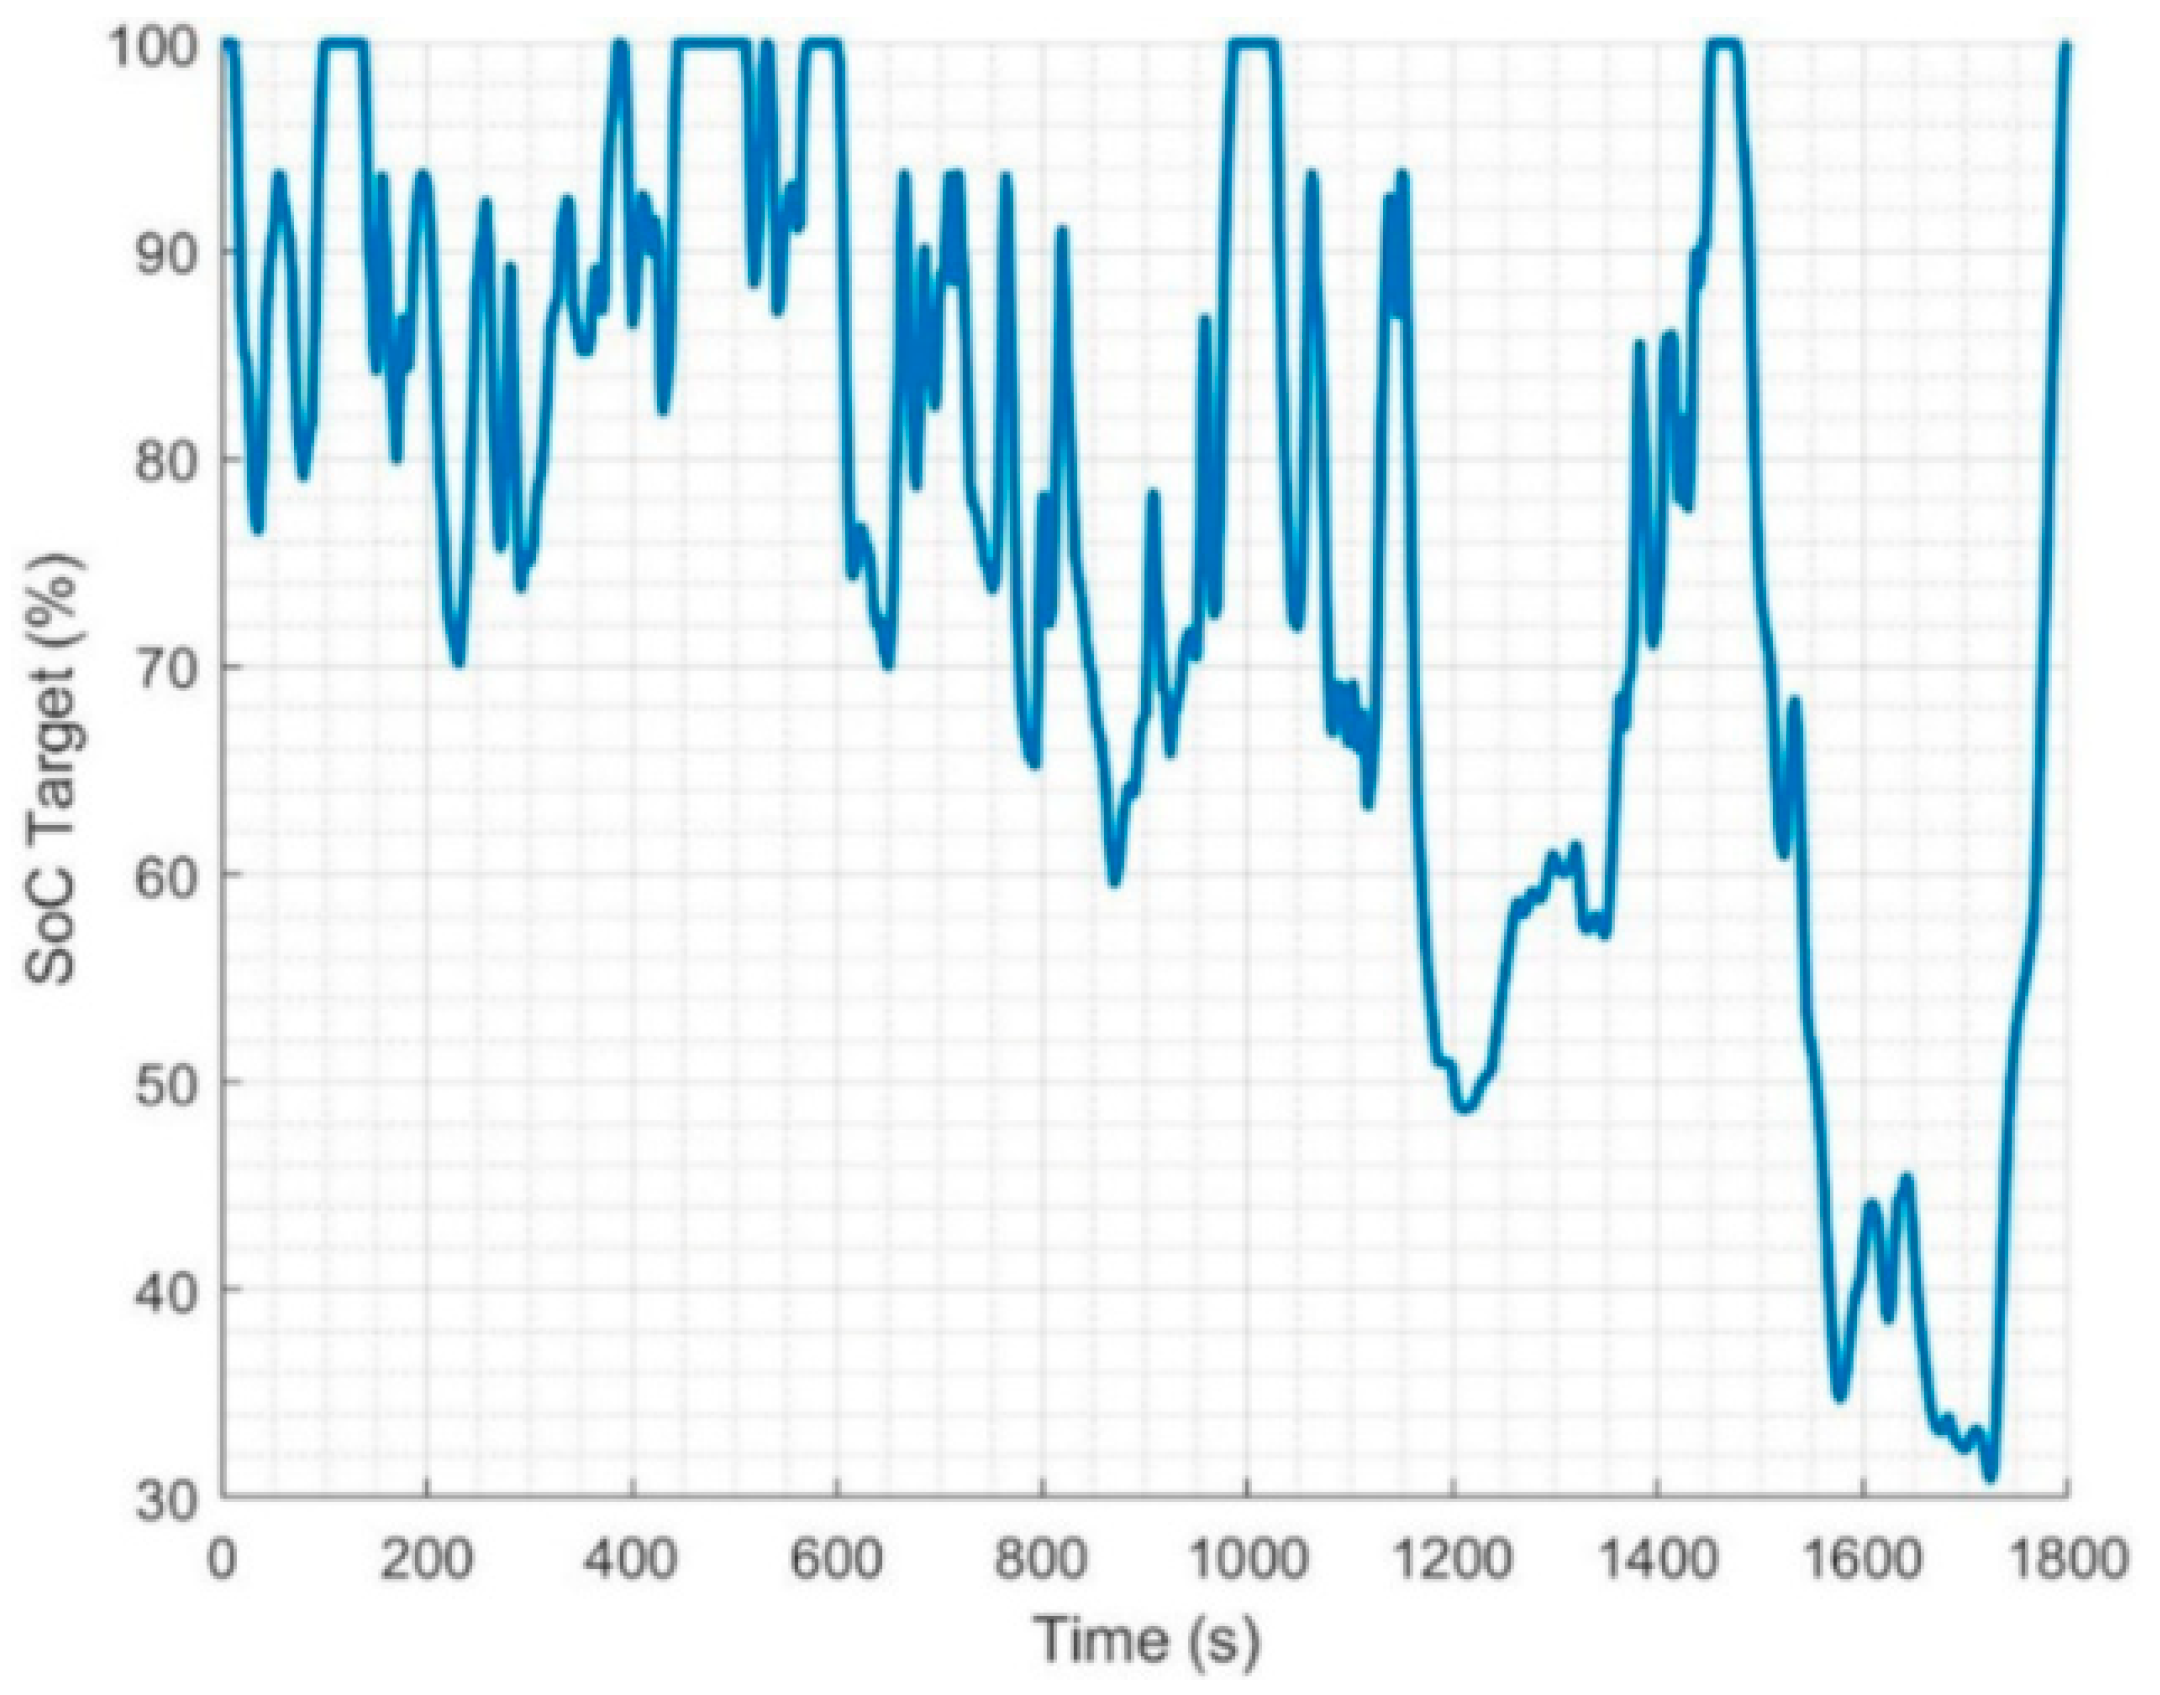
The present work is based on a LiC-based super sport car, and an alternative SoC target is formulated similarly as it has been done in [
1]. According to the previous work, the SoC target is a speed-dependent quantity related to the detachment speed value of the EM (in this application it has been set equal to 190 km/h, the detachment speed of the front EM).
As explained in [
1], the SoC target was high at low speeds, as the kinetic energy was low, and this solution guaranteed a high energy quantity stored in the electrical system. On the other side, the SoC target was low at high speeds since energy was already existing in the form of kinetic energy that could be rapidly recovered through the EM. Moreover, if we were to have high electrical energy at high speed, the energy content would end up unused once the detachment speed was reached.
Differently from [
1], in this study, the dependency of the SoC on speed was modeled as linear to better fit the complete SoC range.
This alternative SoC target formulation, represented in
Figure 11 for a WLTP 3b cycle, was thought to fit better the behavior of LiC that dispose of a high charge and discharge rate and which can perform a high number of cycles [
22,
23].
This kind of application aims to avoid unused energy and to maintain high energy content where it is mostly needed, ensuring the satisfaction of performance or drivability requests, important objectives for a super sport car. Different control functions could be implemented to uniquely guarantee improvements in performance and drivability, especially at low speeds.
4. Results
A conventional vehicle simulation on a WLTP 3b cycle was run as a reference. Then, the results for the simulations with the active hybrid control strategies were reported as a fuel consumption comparison.
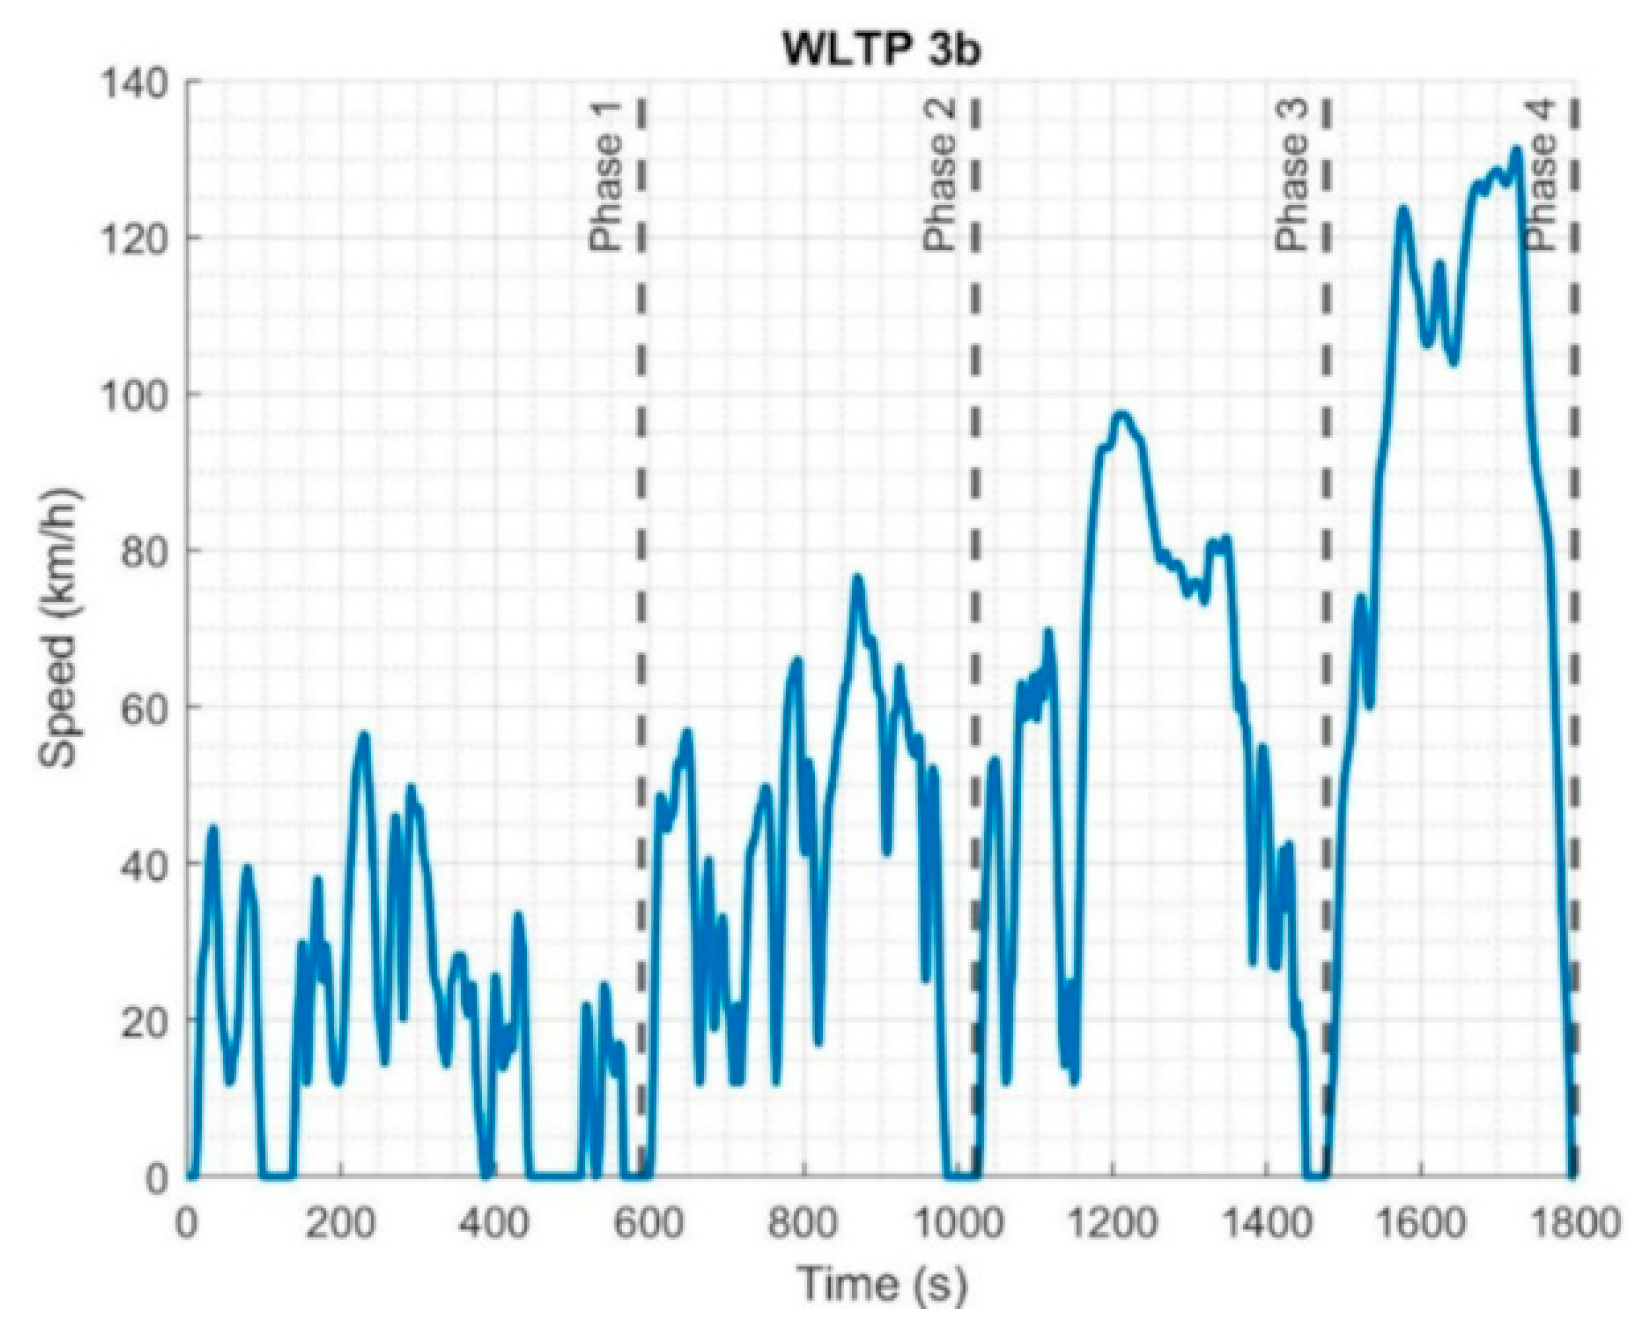
The WLTP Class 3b cycle phases were defined as follows, as illustrated in [
24] and shown in
Figure 12:
Phase 1: 0–589 s
Phase 2: 590–1023 s
Phase 3: 1024–1478 s
Phase 4: 1479–1800 s
The simulations were valid only if the final SoC was equal to the initial one or if it was greater. This allows to correctly evaluate the impact of the hybrid control strategy on the fuel consumption results.
The tables reporting the results show in the first line the conventional series vehicle simulation, while in the following lines, they show the simulated results for the hybrid configurations.
The fuel consumption simulated results for the conventional vehicle were normalized (%) with respect to the maximum fuel consumption value obtained during the various cycle phases. As will be shown, Phase 1 was usually associated with the maximum value (i.e., 100%) since the engine works in cold-start conditions and at high fuel consumption operating points.
The simulated results for the hybrid vehicle configurations were reported as a fuel consumption comparison with the series vehicle, showing the percentage reduction.
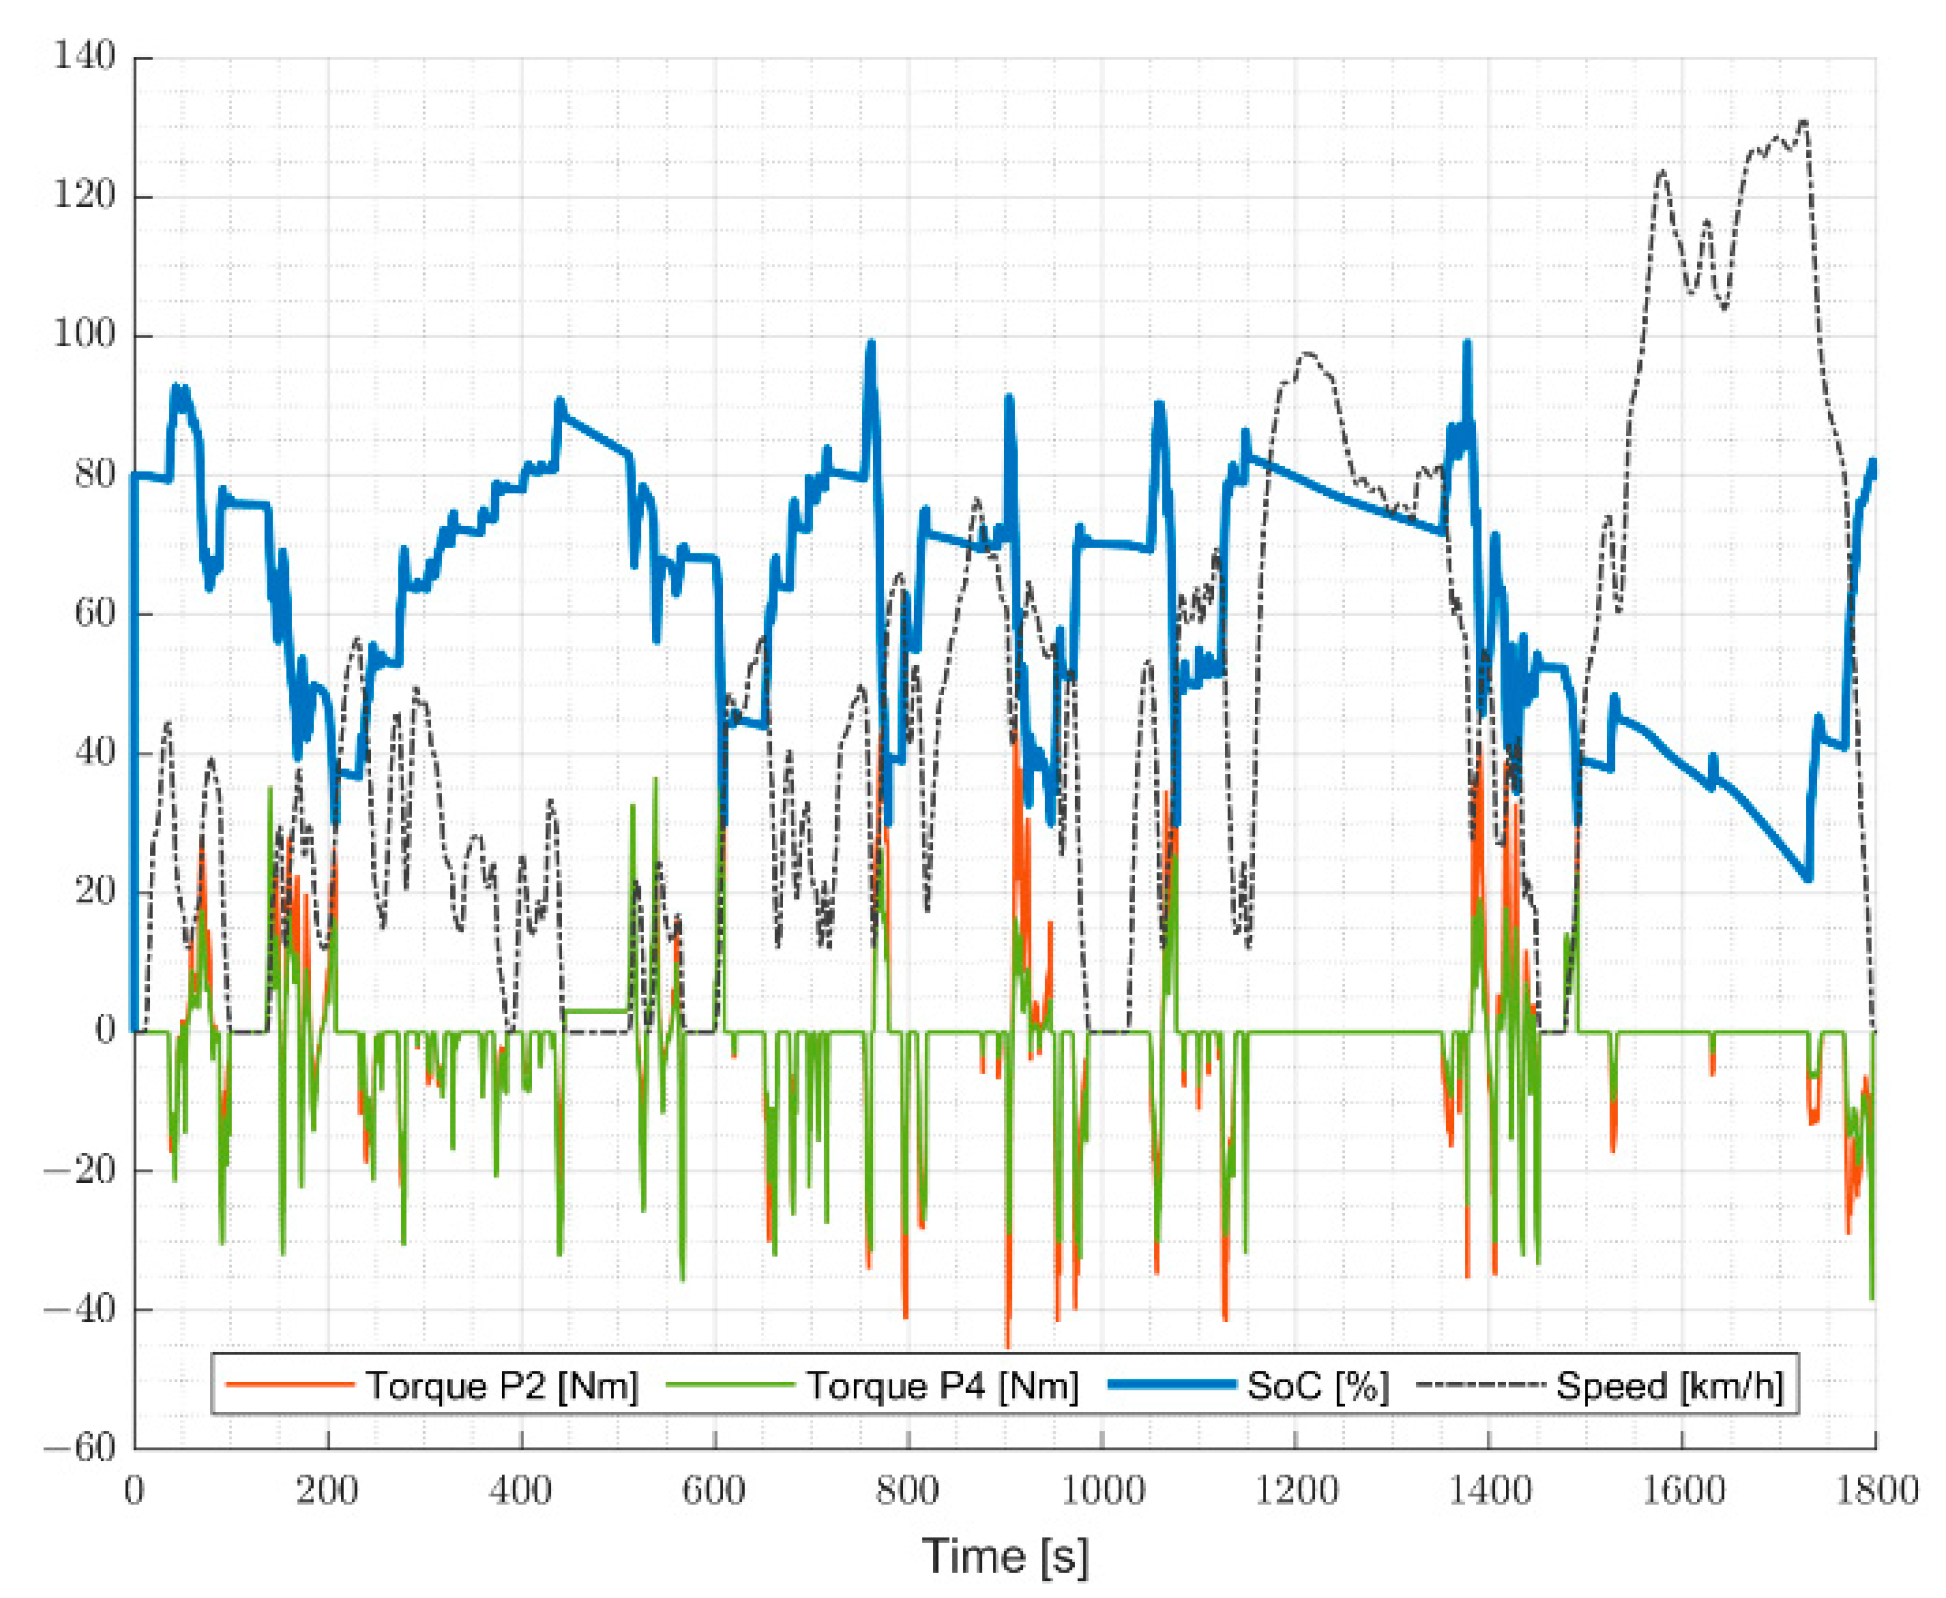
4.1. RBS
At first, the RBS simulations were run, and the results were reported following the indications previously described.
The powertrain system behaved as expected, allowing the activation of the electric mode. The potential fuel consumption results were reduced due to the deactivation of the ICE for certain time periods.
During the energy storage recharge, the vehicle will be powered exclusively by the ICE.
Both simulations show how the storage system recharged quickly, guaranteeing multiple discharges related to electric driving during the cycle.
Figure 15 reported the speed of both the P3 and P2 EMs during the WLTP 3b cycle. Due to the different transmission ratios, the speed profiles were different.
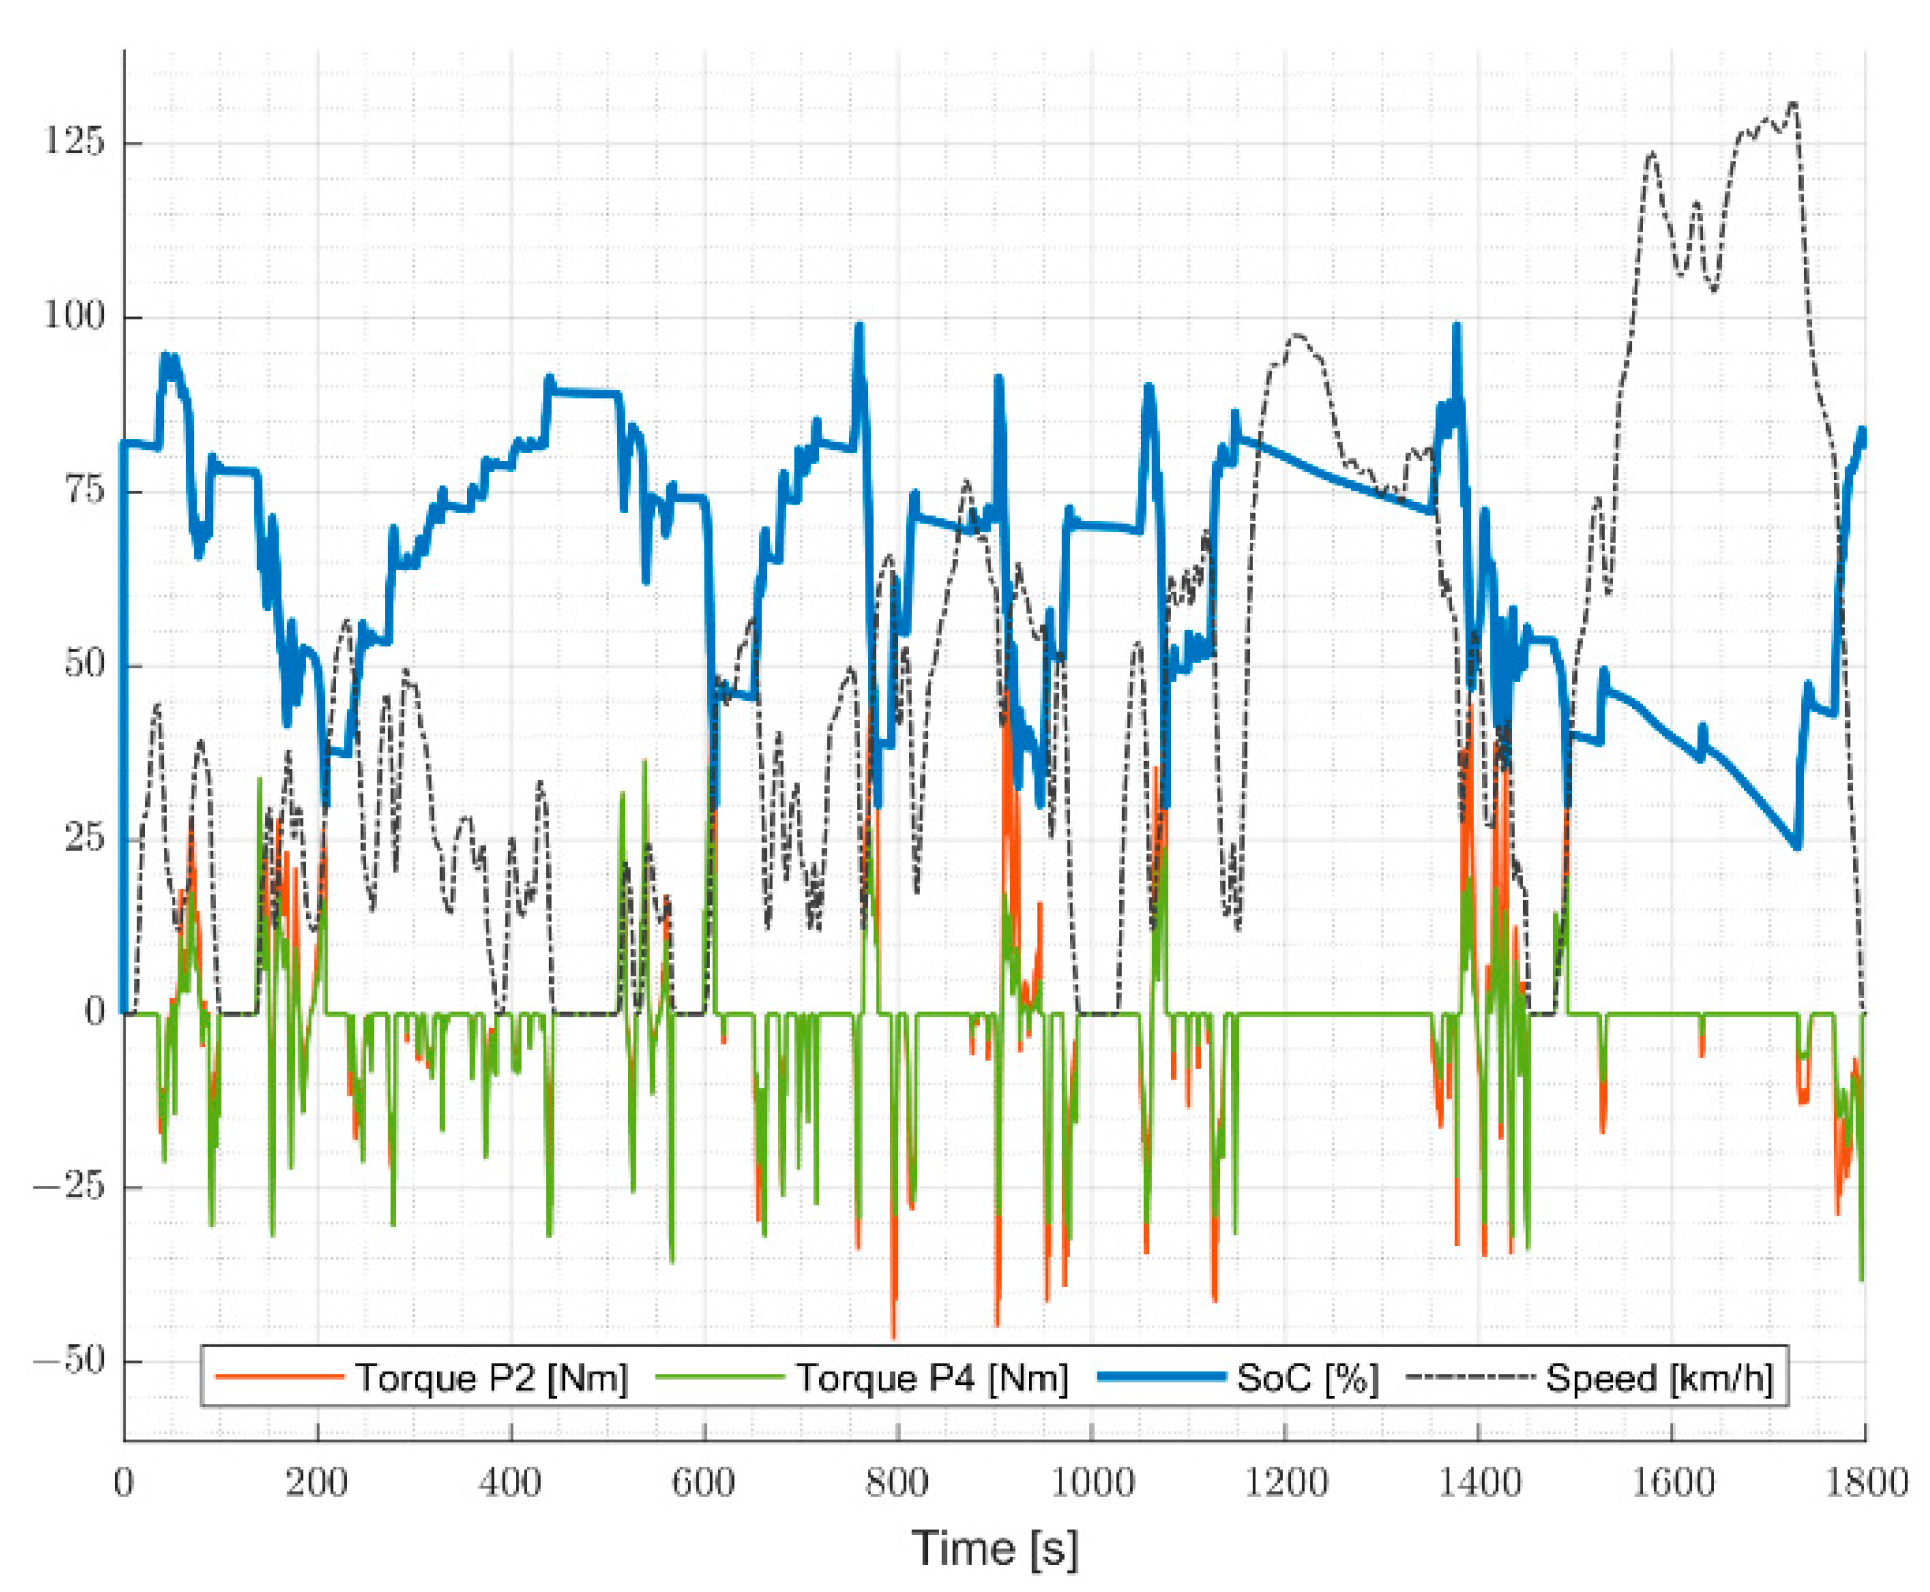
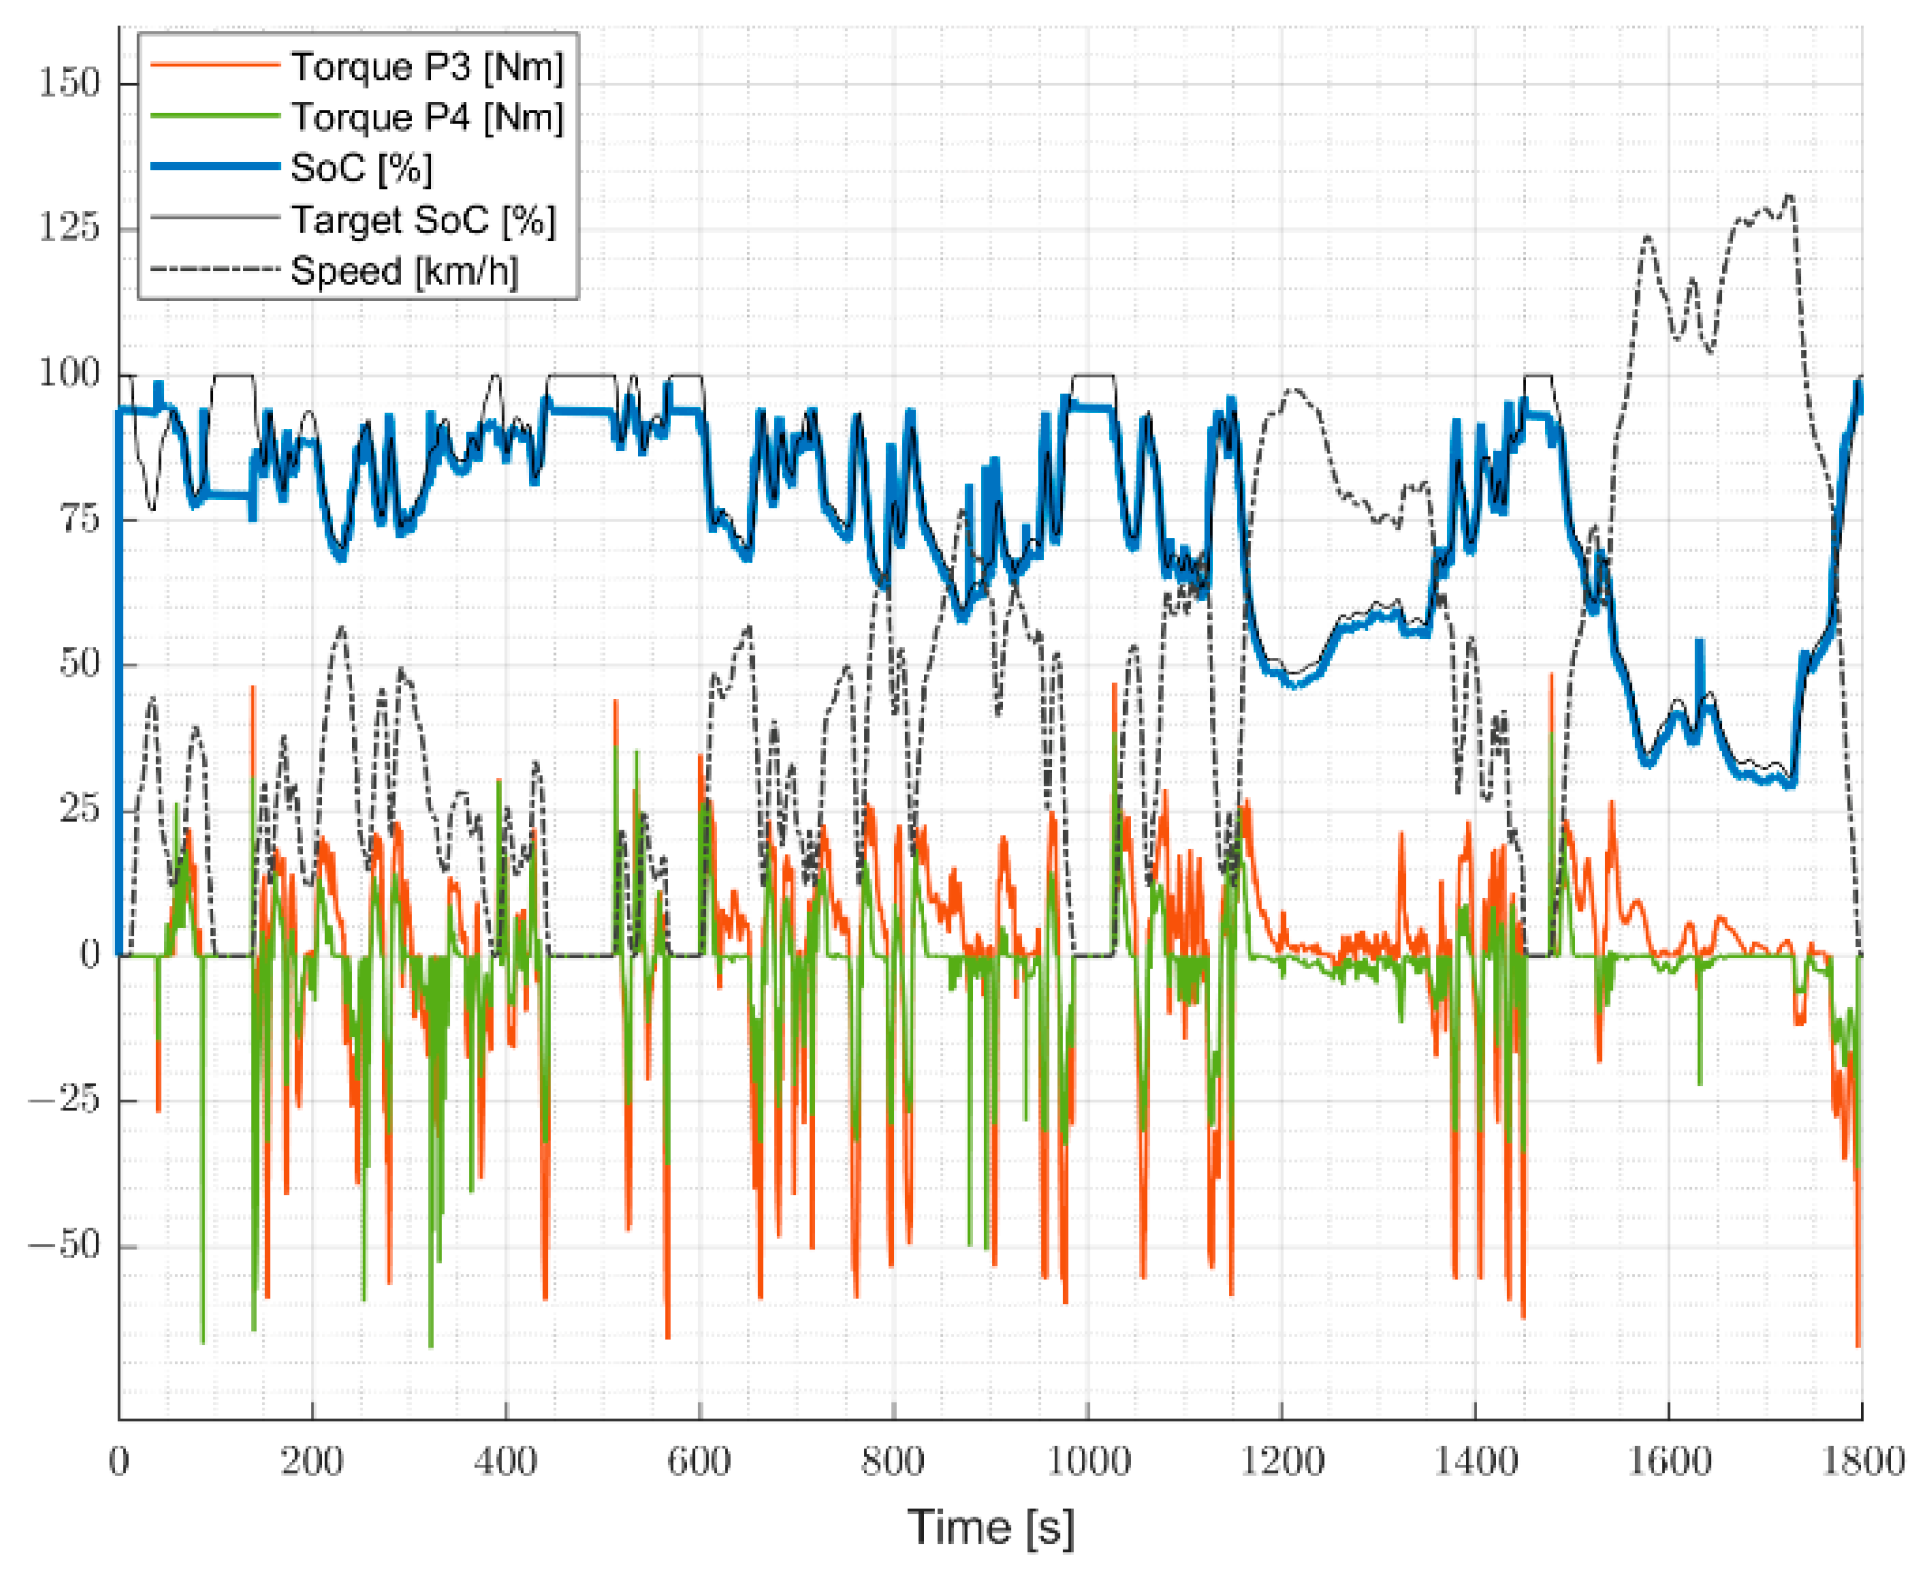
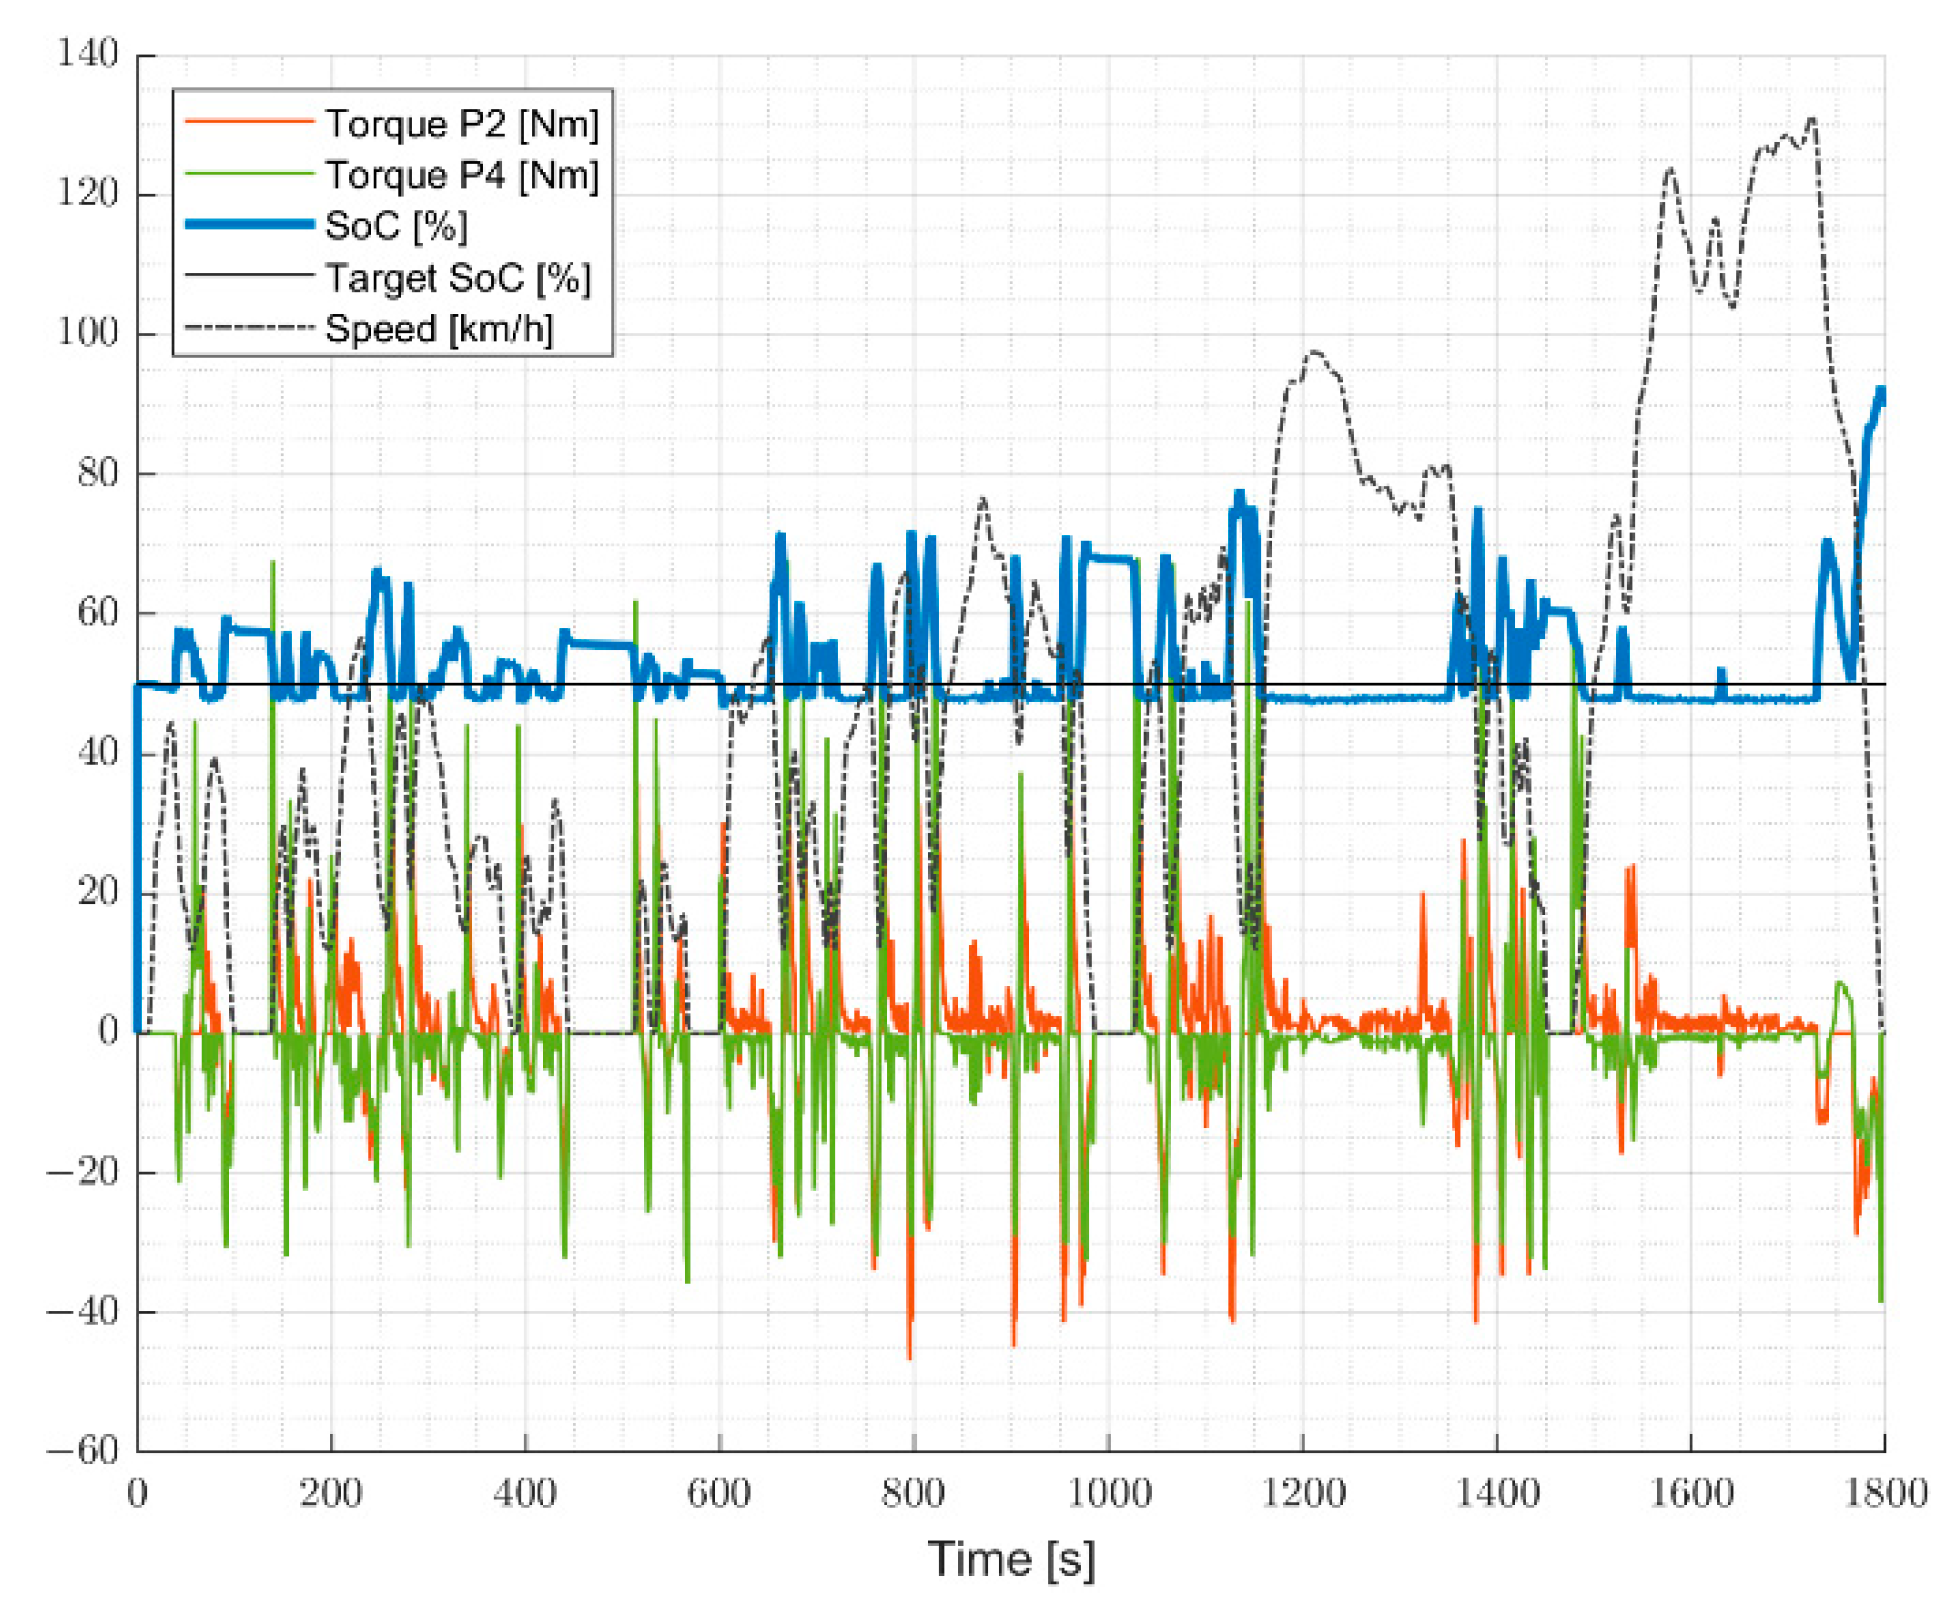
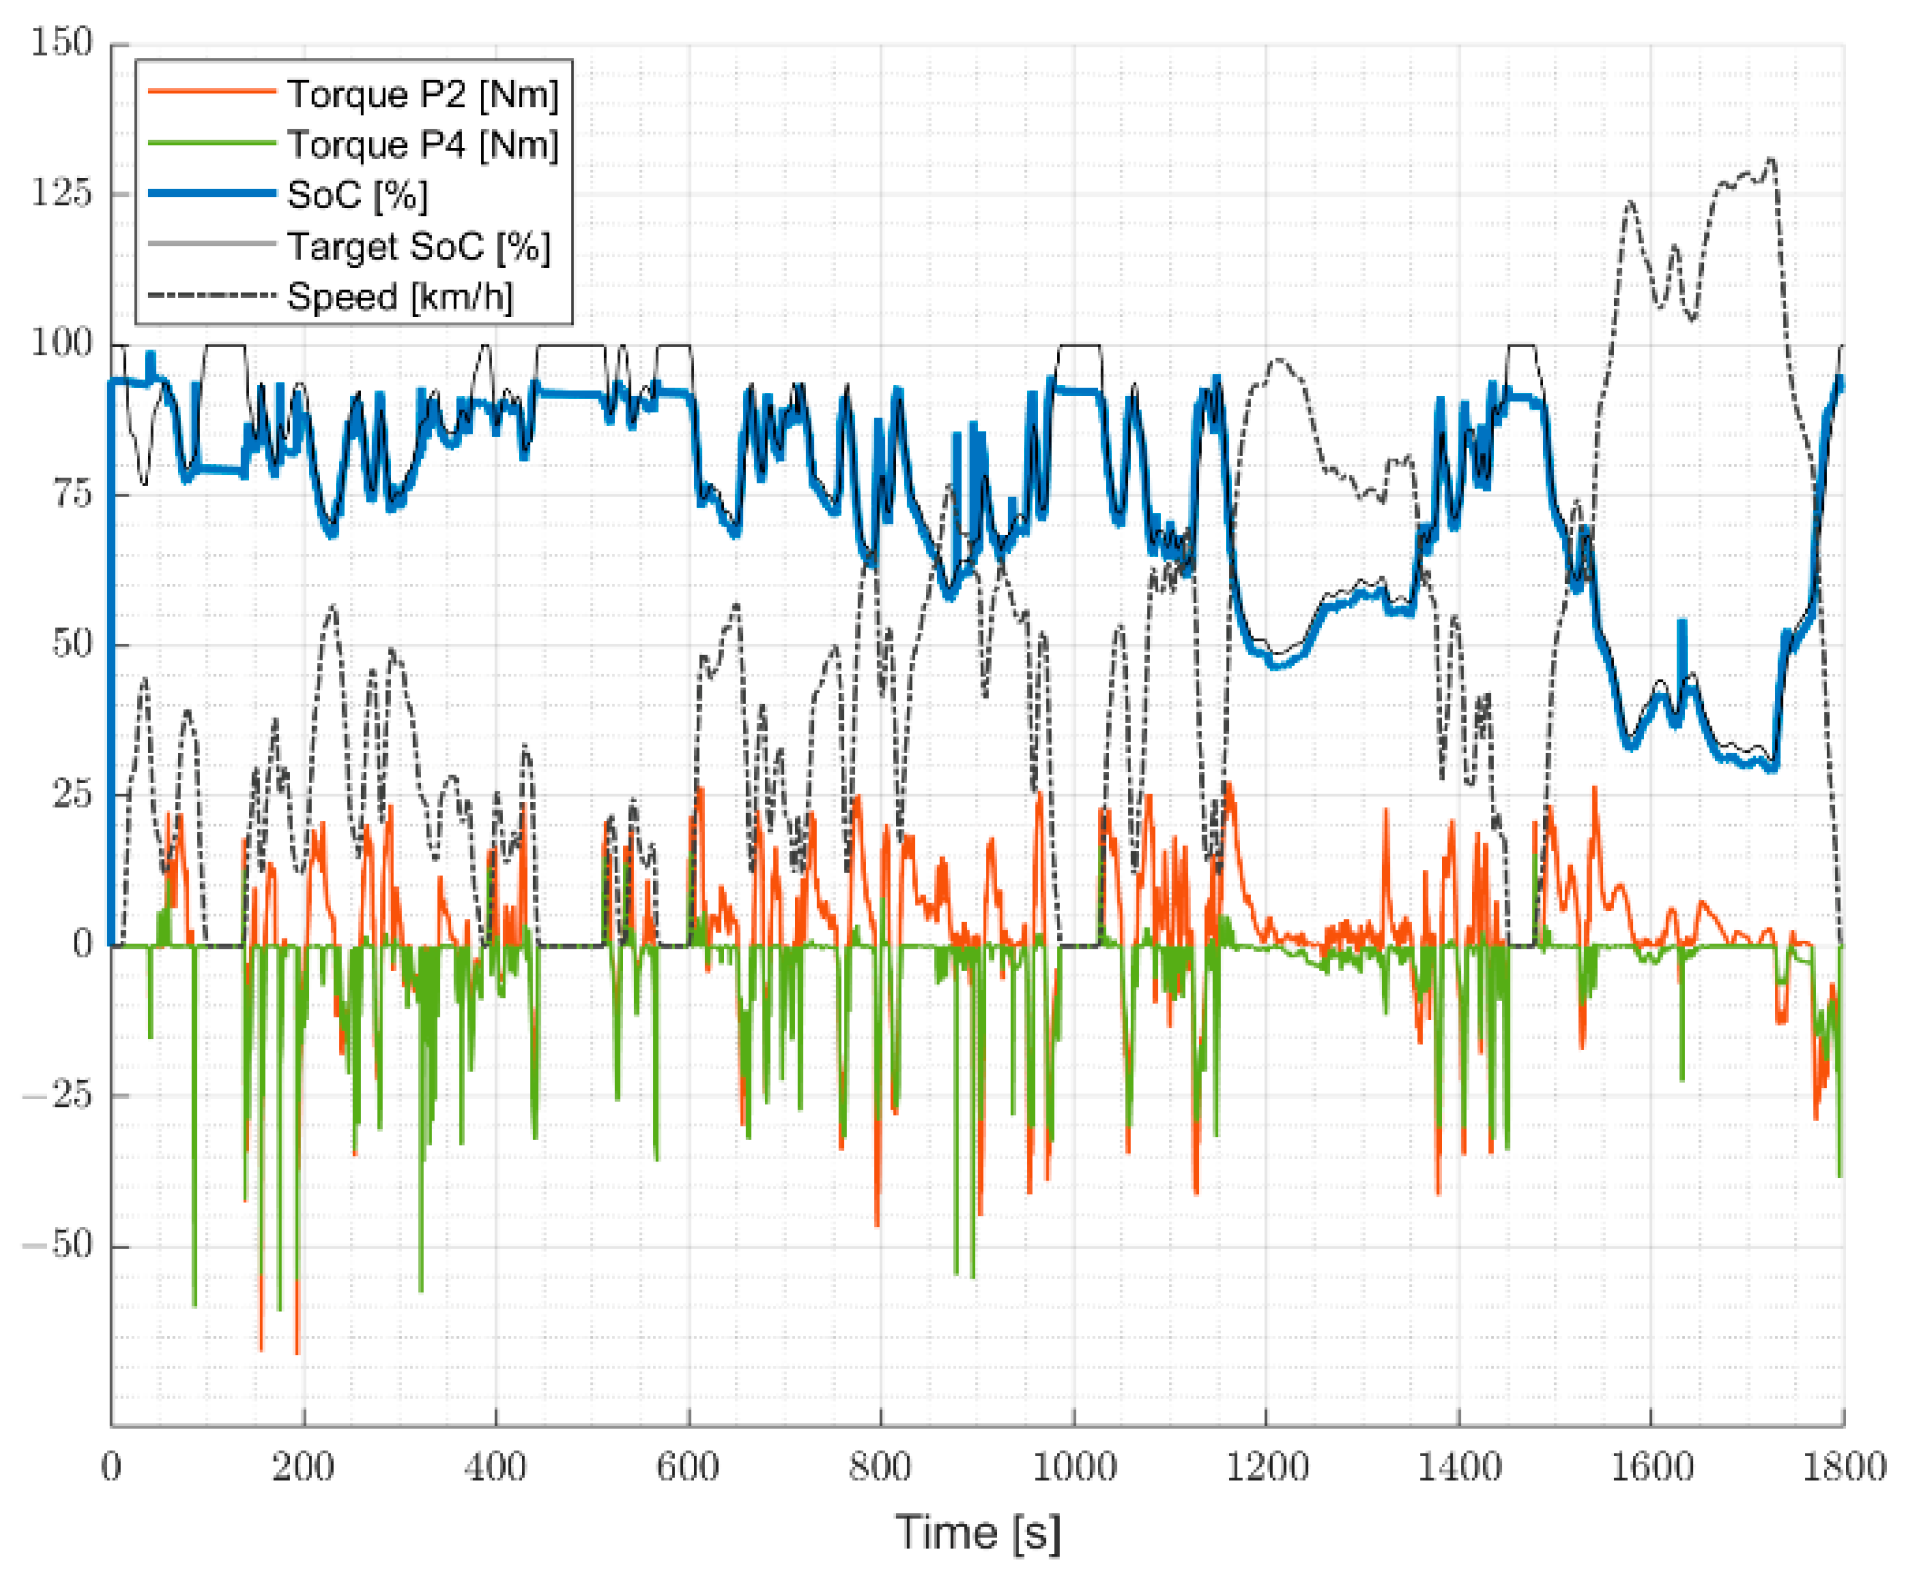
4.2. ECMS
The following simulations allow evaluating the impact of the ECMS, always according to the previously introduced indications.
The ECMS results show an improvement in fuel economy, both for the CS and Spd Dependency hypothesis. The SoC profiles are reported.
The same simulations were run on the P2–P4 configuration as it has been done for the RBS.
The CS calibration was tuned to guarantee an SoC value close to the target one at every instant. On the other side, the speed dependency configuration will guarantee a greater variability of the SoC, keeping space for any evaluations on performance or drivability.
4.3. Half Displacement Results
Further evaluations were made through simulation, modifying the engine displacement and its performance, to evaluate the impact of the hybrid control strategy and the LiC hybrid architecture on a smaller engine.
In particular, the RBS P2–P4 and ECMS speed-dependent P3–P4 were simulated, as these represented the best solutions for the two different control strategies.
4.4. Energy Storage Size Variation
At last, some simulations were run to evaluate the behavior of the energy storage with respect to its main limit represented by the low specific energy [
2,
4].
The simulations were run for the best-case scenario (ECMS P3–P4), assuming that the capacity of the energy storage system doubled and quadrupled, for example, simulating a 60s2p and 60s4p. A system of that kind will guarantee greater capacitance, lower internal resistance, and a greater mass. The results are reported in
Table 9.
5. Conclusions
The results show an improvement in fuel economy with the activation of the hybrid control strategies. The RBS can reduce fuel consumption by up to 2.3%. In particular, the choice to work with a P2 instead of a P3 is profitable.
As shown in
Figure 15, the P2 and P3 EMs run at different speeds, since their gear ratio is different. In particular, the P2 EM can meet the torque demand at the wheels through a lower torque since its transmission ratio is higher overall.
These differences have the direct consequence of lower electrical energy consumption, meaning that more time can be spent in electric drive mode. Consequently, different results for fuel consumption are generated in the two configurations, rewarding the case of P2–P4.
The comparison between RBS and ECMS shows that it is possible to guarantee a greater fuel consumption reduction working on the hybrid control strategy.
The ECMS reduces fuel consumption by up to 4.8%. Both the P2–P4 and the P3–P4 configurations achieve better results, as the strategy will choose at every working point the best torque split solution between the front and rear EM.
Overall, the fuel consumption reduction is small, and that can be associated with the characteristics of the vehicle at our disposal (i.e., high displacement and high absolute values of fuel consumption). At the same time, the results show a positive trend on the fuel economy that is due to the hybrid control strategies chosen.
It must be noticed that the speed-dependent SoC strategy guarantees better results than the charge sustaining one. This kind of application shows that we can achieve fuel economy even if we do not maintain a fixed SoC target, but a speed-dependent one. This means that depending on the speed of the vehicle we could leave room for any functions more performance-related, which could be activated at the request of the driver.
This result represents an important element for the design of super sport cars, for which performance and drivability are notable elements. It should be noted, however, that these results are a consequence of the type of energy storage system chosen, which has as its main feature the high power and the consequent reduced charging and discharging times.
The hybrid control strategy comparison points out that the choice to invest in the ECMS has benefited from the fuel economy point of view as it doubles the improvement on FC results.
A simulation with half displacement is run, and the results are compared with the ones from hybrid vehicles commonly available on the market. According to these, the Lamborghini application would fall within the sphere of mild hybrid systems [
9,
10].
The analysis is concluded simulating an energy storage system that is, respectively, doubled and quadrupled. It is shown that a greater capacitance brings slightly better fuel economy results that tend to an asymptote. It is evident that although the results improve, the reward obtained is not sufficient to justify an investment in a system that becomes more complex, heavier, and larger. Above all, because the system is inserted in a supercar, which typically seeks maximum performance and has dimensional limits related to design and aerodynamics.
Such an outcome points out that for an application of this kind the low specific energy limit of the energy storage system does not compromise the results, indeed this hybrid powertrain can achieve fuel economy thanks to its high power, which results in a high charge and discharge rate.
Even if the LiCs are limited for energy performance at the moment, proper development of the control strategy and the growth of the technology [
2,
22,
23] could lead to fuel-saving applications.
In conclusion, the high-power characteristic makes the LiC technology interesting for applications like super sport cars, which greatly evaluate features such as performance and drivability along with fuel economy.

 ,
, 


