Article

Applying Wearable Technology and a Deep Learning Model to Predict Occupational Physical Activities

1
Department of Mechanical Engineering, University of California, Berkeley, CA 94720, USA
2
Key Laboratory of Industrial Design and Ergonomics, Ministry of Industry and Information Technology, Northwestern Polytechnical University, Xi’an 710072, China
3
Department of Electrical Engineering and Computer Science, University of California, Berkeley, CA 94720, USA
4
Department of Medical Engineering, University of Applied Sciences Upper Austria, 4020 Linz, Austria
5
School of Public Health, University of California, Berkeley, CA 94704, USA
6
Department of Medicine, University of California, San Francisco, CA 94143, USA
7
Department of Orthopaedic Surgery, University of California, San Francisco, CA 94143, USA
*
Author to whom correspondence should be addressed.
Submission received: 9 September 2021 / Revised: 5 October 2021 / Accepted: 12 October 2021 / Published: 15 October 2021
(This article belongs to the Special Issue Novel Approaches and Applications in Ergonomic Design II)

Abstract

:
Many workers who engage in manual material handling (MMH) jobs experience high physical demands that are associated with work-related musculoskeletal disorders (WMSDs). Quantifying the physical demands of a job is important for identifying high risk jobs and is a legal requirement in the United States for hiring and return to work following injury. Currently, most physical demand analyses (PDAs) are performed by experts using observational and semi-quantitative methods. The lack of accuracy and reliability of these methods can be problematic, particularly when identifying restrictions during the return-to-work process. Further, when a worker does return-to-work on modified duty, there is no way to track compliance to work restrictions conflating the effectiveness of the work restrictions versus adherence to them. To address this, we applied a deep learning model to data from eight inertial measurement units (IMUs) to predict 15 occupational physical activities. Overall, a 95% accuracy was reached for predicting isolated occupational physical activities. However, when applied to more complex tasks that combined occupational physical activities (OPAs), accuracy varied widely (0–95%). More work is needed to accurately predict OPAs when combined into simulated work tasks.

1. Introduction

Work-related musculoskeletal disorders (WMSDs) are injuries or pain involving the joints, ligaments, muscles, nerves, tendons, and/or structures that support the limbs, neck, and back [1,2]. WMSDs are a common concern for modern industrialized nations [3] due to their high incidence and high costs which reached over USD 20 billion in the United States in 2018 [4]. It can be caused by a complex interaction of physical, psychosocial, biological and individual characteristics, among which physical demand is an important factor. One of the most prevalent WMSDs is low back pain [5], which is associated with physically demanding tasks that include handling heavy loads repeatedly and in awkward postures [6,7].
Since the physical demands vary widely across jobs, a physical demand analysis (PDA) outlines the physical and environmental requirements to perform a job and is used for pre/post-offer employment screening, return-to-work, and identification of personal protective equipment needs. In the US, it is a required part of a job description and must be written in compliance with the American Disabilities Act. The PDA includes information on the approximate duration (% of day) and magnitude (load) that different occupational physical activities (OPAs), such as lifting/lowering, carrying, kneeling, reaching, walking, and standing, take place. The PDA informs workers about the physical demands of a job before they are hired and it provides occupational health practitioners critical information for facilitating effective return to work programs should an injury occur.
Various methods for quantifying OPAs include self-report, observational, and direct measurement [8,9]. Though both self-report and observational approaches are low-cost and convenient, results can be inaccurate and unreliable, as well as time consuming [5]. Although observational methods are the most common approach for estimating OPAs [8], some have used more detailed video-based techniques to quantify the duration of OPAs with higher accuracy. Essentially, workers are recorded in real-time and the video is analyzed using computer software that aggregates the amount of time spent performing different OPAs. Direct measurements of force supplement the video analysis to provide a more valid and reliable PDA; however, this approach is extremely time consuming and costly [8].
Accurate and reliable quantification of OPAs required for a job description is critical for physically demanding jobs. Prospective workers rely on them to determine if they would like to pursue a job and clinicians rely on them to facilitate appropriate return to work plans. Further, accurate and reliable quantification of the duration, frequency and magnitude of physical demands can be useful when assessing interventions designed to reduce physical exposures associated with WMSDs. To overcome the limitations of self-report, observational, and direct measurement methods, kinematic data could be an effective approach to quantifying OPAs in the workplace. Kinematic data yield the position, velocity, and acceleration of body segments and have been used to predict the patterns and quality of movement [10]. Conventional methods of capturing kinematic data rely principally on video analysis or an optoelectronic system to distinguish movement patterns of body segments [11,12,13,14]. However, these laboratory methods have limitations in real work scenarios both in cost and feasibility.
Wearable technology, such as inertial measurement units (IMUs), have been used to capture human body motion for animation, optimizing athletic performance, and even optimizing patient treatment [15]. For example, Daponte et al. [16] developed a wireless and IMU-based system for monitoring patient motion with real-time 3D reconstruction. IMU systems have also been used by practitioners for gait and lower limb rehabilitation [17,18]. IMUs perform well when tracking the orientation of a moving object, thus, coaches and athletes use them to assess athletic performance [19,20]. More recently, IMUs have been used in the workplace to quantify specific exposures that may increase risk of injury. A smart garment using two IMU sensors was introduced by Wang et al. [21] to monitor shoulder posture for treating WMSDs. Relative time series data and kinematic data from the wearable sensors (IMUs) are used to summarize the percent time spent in different physical activities and the probability of being at high risk for WMSDs [22,23]. The IMU system (17 IMUs) with classification models introduced by Kim and Nussbaum [24] and Bastani, Kim, Kong, Nussbaum, and Huang [25], classified MMH tasks for real-time applications with a higher accuracy than observational methods. These studies provide support for the use of wearable devices in predicting OPAs actively and continuously in diverse work environments, even using fewer sensors. However, the performance of using wearable devices on classifying a broader range of OPAs such as crouching, kneeling and overhead work has not been evaluated. Further, there is little, if any, work published on predicting OPAs when combined in typical simulated work tasks.
Therefore, the objective of this study was to apply deep learning models to data from eight IMUs to predict physical activities performed during simulated occupational tasks. If wearable devices can be used to predict OPAs with higher accuracy, reliability and efficiency than self-report, observational or direct methods, job descriptions and return to work programs can be standardized more effectively.

2. Materials and Methods

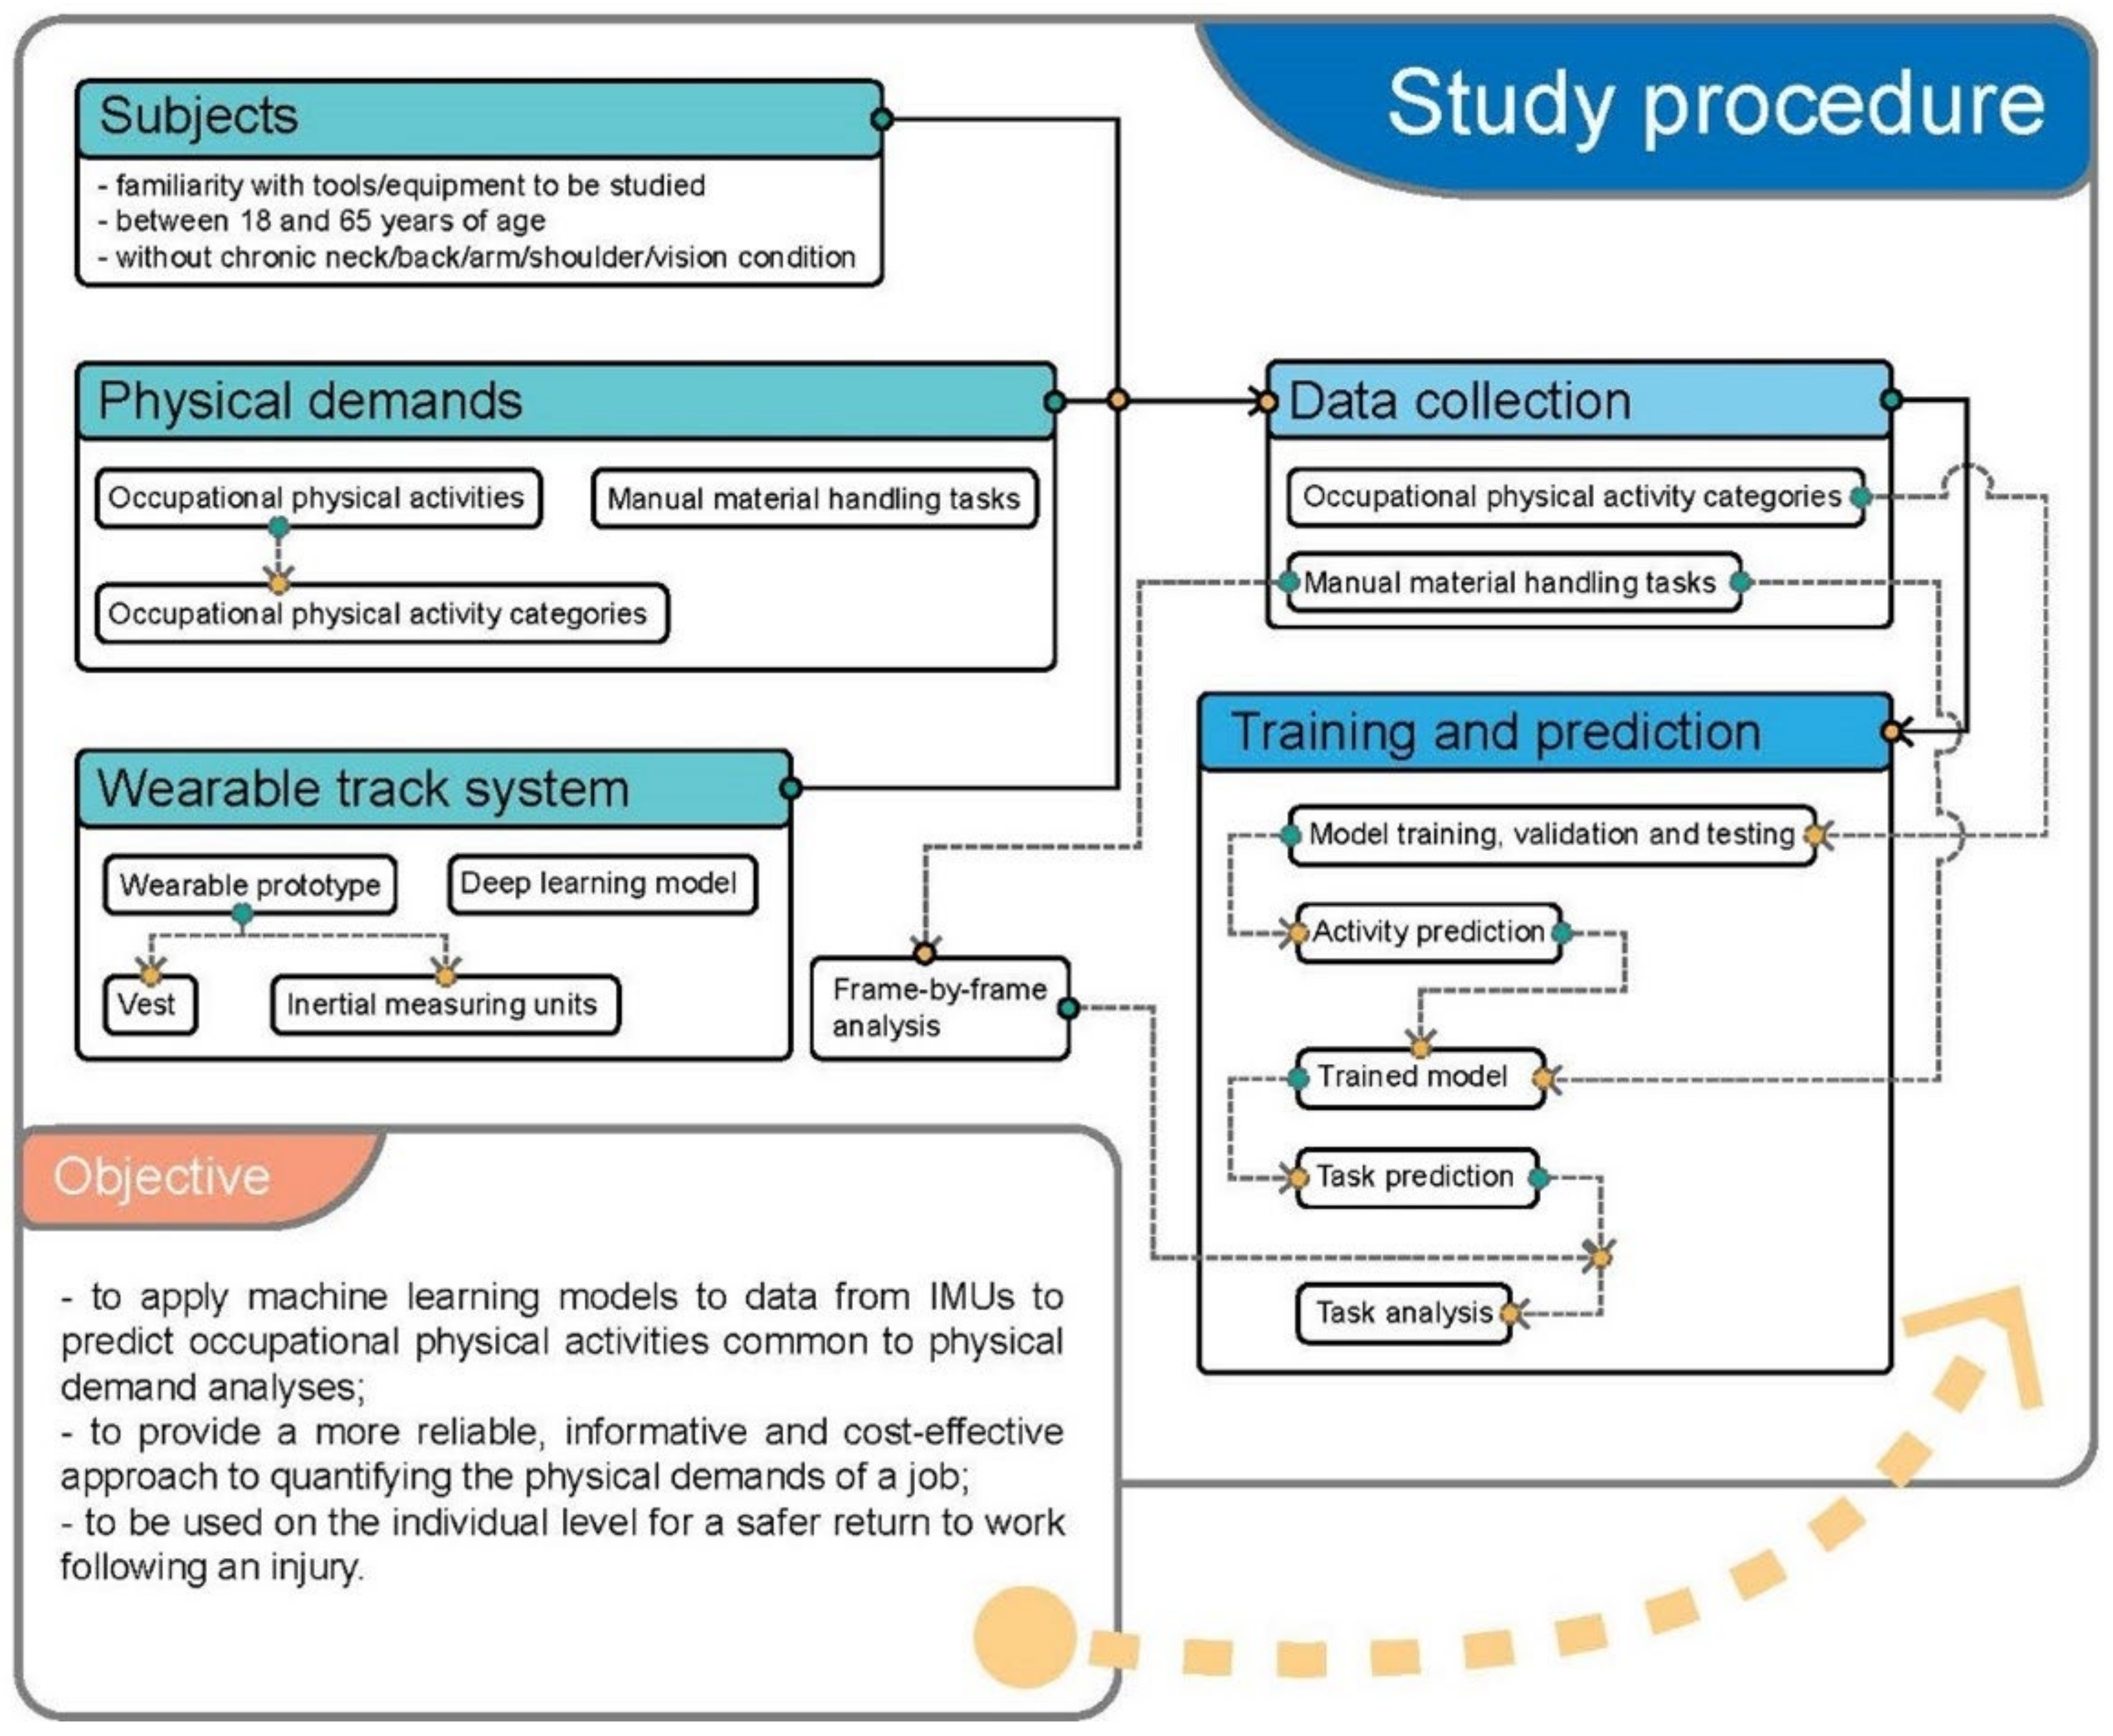
2.1. Study Procedure

This laboratory study collected kinematic data from 8 IMUs worn on 8 different body segments by participants who performed OPAs common in MMH jobs [9,13,22,23,25,26,27,28,29,30,31,32,33,34,35,36]. The kinematic data were used for training a deep learning model for pattern recognition (Figure 1). The trained model was used to predict OPAs performed in 3 simulated work tasks. In this pilot validation study, model predictions of the OPA were validated using a frame-by-frame analysis of video collected during simulated tasks.

2.2. Participants

Subjects (n = 15) were recruited by email, campus, and social networks. To be included in the study, subjects needed to be between 18 and 65 years of age and willing to perform the simulated work tasks described. Subjects with neck/back/arm/shoulder/vision pain were excluded. Written informed consent was obtained from all subjects before their participation. This study was approved by the Institutional Review Board of the University of California, San Francisco (IRB# 10-04700).

2.3. Occupational Physical Activities and Manual Material Handling Tasks

In this study, 15 categories of occupational physical activities were selected with some OPAs performed in multiple ways to capture the variation of physical activities and prevent overfitting of the model (Table 1). To train the models, subjects performed activities with fixed parameters of load, duration, and repetition. Most OPAs were performed for at least 60 s each (Table 1).
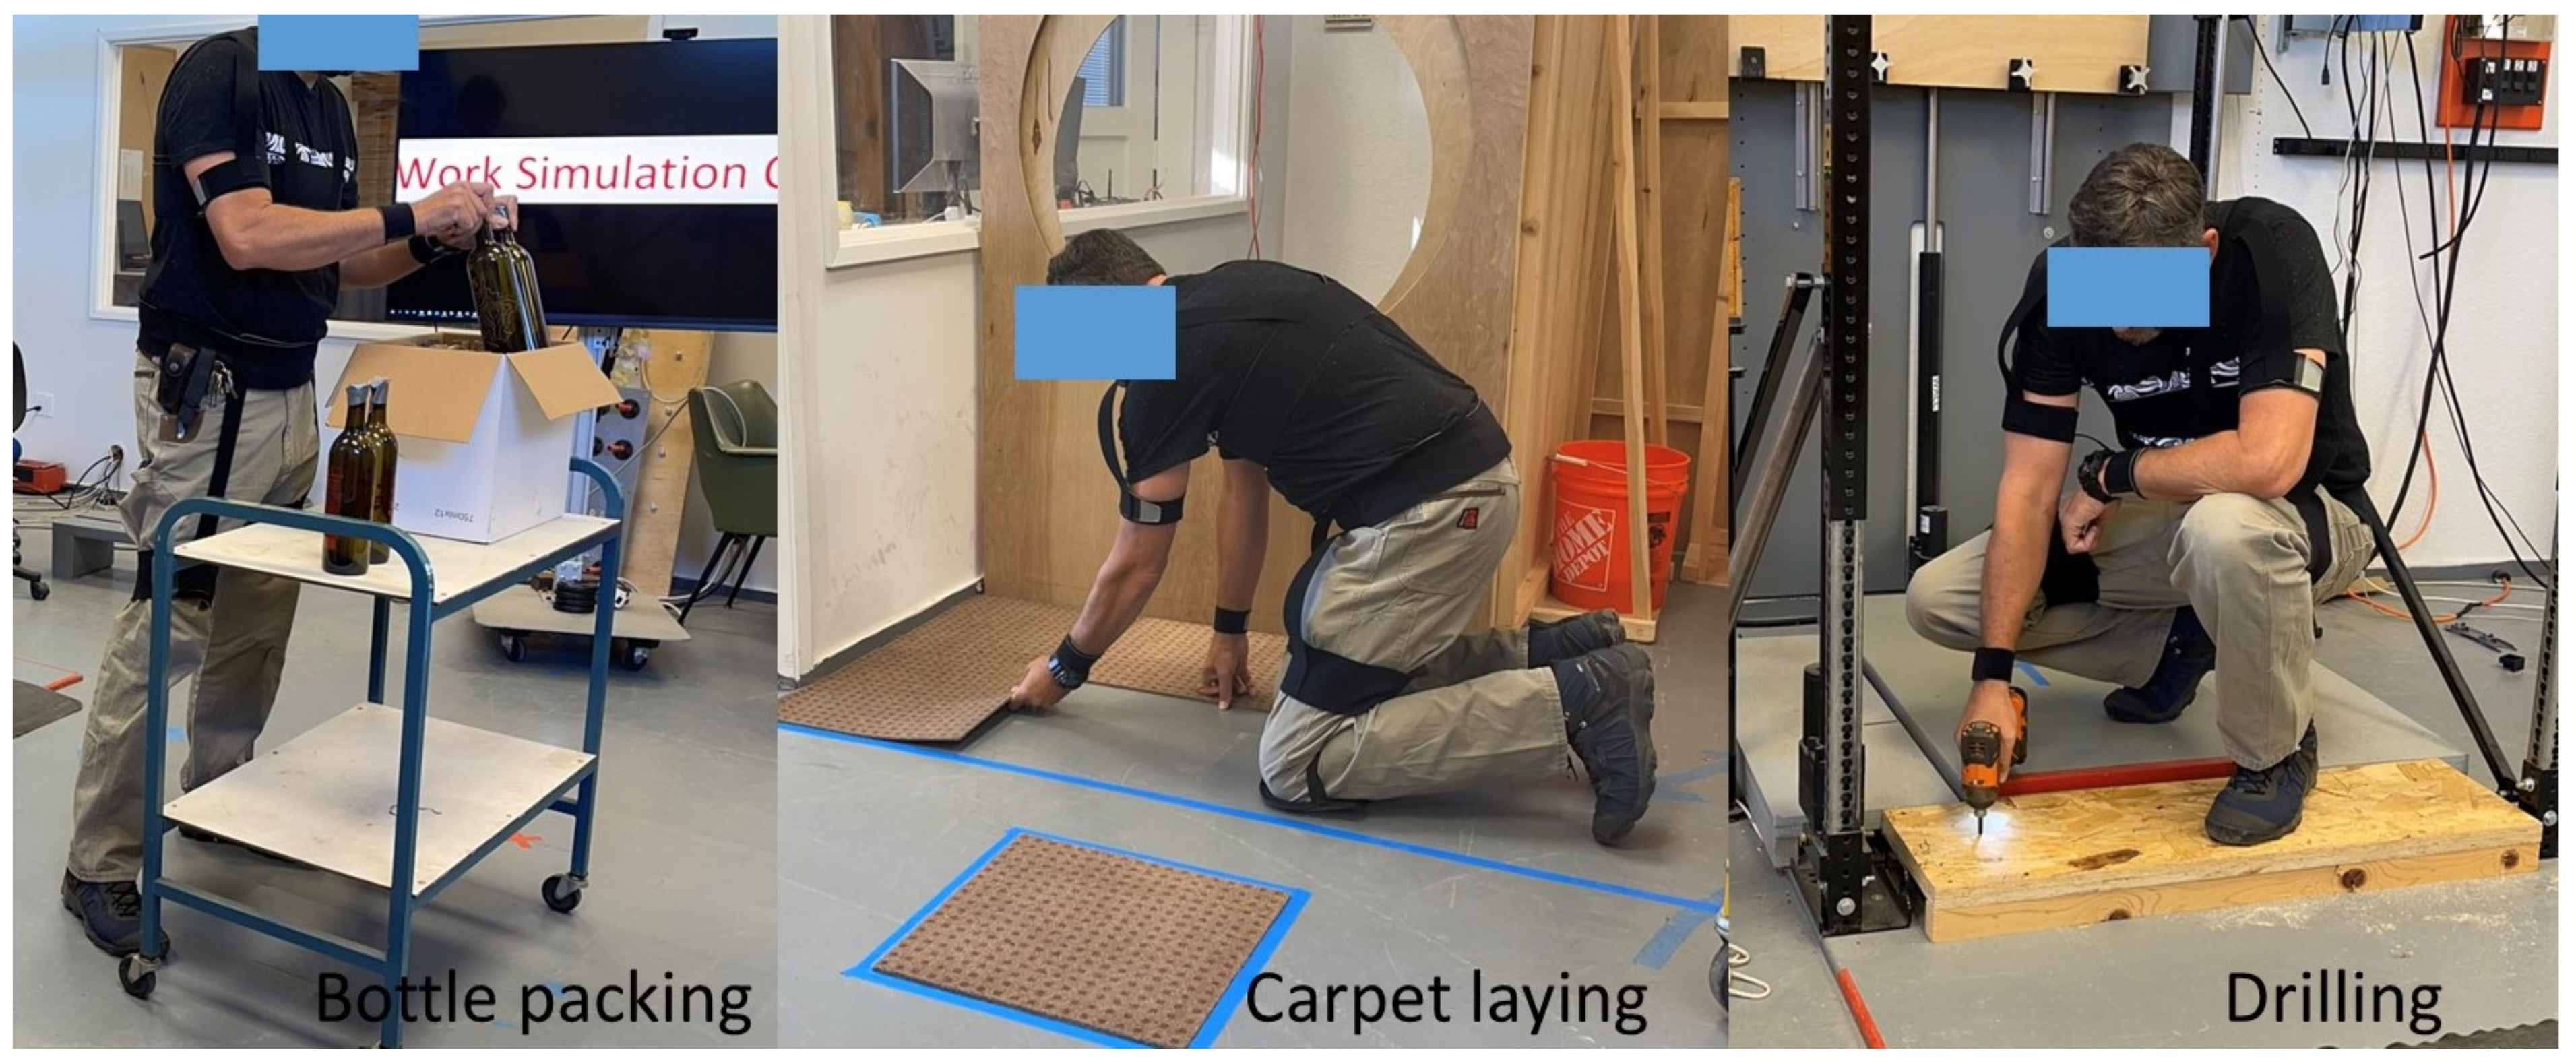
A subset of participants (n = 9) completed up to three simulated work tasks including bottle packing, carpet laying, and drilling to test the deep learning model’s ability to predict OPAs while performing simulated work tasks (Figure 2). Except for sitting which exhibited obvious features for prediction, the bottle packing, carpet laying and drilling tasks included all OPAs (Table 2). Verbal explanation and visual demonstration were provided for subjects prior to performing the various OPAs and simulated work tasks. The whole procedure took approximately 2 h per subject.
Subjects performed carpet laying and bottle packing tasks until the task was complete; all tasks were completed within 5 min. Drilling was performed for 15 s. Details for each task include:
  • Bottle packing started with opening the box and putting 12 bottles into the box, which contained three rows (close, intermediate, and extended distances) and four bottles in each row. After placing the bottles in the box, the box was closed. The horizontal distances between the bottles and the body were <30 cm, 30–40 cm, and >40 cm. Next, the box was carried about two meters and placed on shelves of fixed heights ranging from floor height, waist height and shoulder height.
  • The carpet laying task was performed by lifting carpet from a shelf (floor, waist and shoulder height) onto a cart. The cart was then pushed or pulled to a distance of approximately two meters. After placing the carpet on the floor, subjects were asked to lay the carpet in a pre-defined rectangle.
  • The drilling task involved picking up a drill, or paint roller with one hand, walking to the designated area about two meters away and drilling overhead or on the ground. Afterwards the tool was returned to the original spot.

2.4. Wearable Track Device with Inertial Measuring Units

A lightweight (<0.7 kg) prototype wearable vest and arm cuffs that housed 8 IMUs (SwiftMotion, Berkeley, CA, USA) was used to quantify the kinematics while performing OPAs (Figure 3). The vest was designed with a shoulder harness, belt, upper arm straps and upper leg straps made by nylon mesh fabric, which was used to fix the positions of the IMUs. The vest was available in three different sizes (small, medium, and large), and the straps were length-adjustable to allow exact positioning of the sensors, independent of the body type of the subject.
The specific positions of IMUs were as follows: (1) two were placed on the spine facing posterior, one between the 3rd and 4th thoracic spinous process (T3-T4) and the other between the 5th lumbar and 1st sacral spinous process (L5-S1); (2) two were placed on the medial segment of each upper arm facing lateral; (3) two were placed on the distal segment of each forearm just proximal to the hand facing posterior; (4) the last two were placed on the medial segment of each thigh facing posterior. With these 8 sensors and their corresponding anatomical locations it was possible to track the orientation of the trunk, upper arms, forearms, and thighs. The sensors were not placed directly on muscle bellies, as their orientation could then change during the activation of those muscles.
The small IMUs (50 × 50 × 20 mm) developed by the researchers included three-axis accelerometers, three-axis gyroscopes, and three-axis magnetometers, which measured accelerations, velocities, and position (orientation). Data from the IMUs were recorded at a sample frequency of 10 Hz.

2.5. Data Collection

Time series data (1 column) and kinematic data (18 columns) were synchronized from the 8 IMUs and transmitted to a laptop by Wi-Fi dongles. The IMUs output included both the quaternion and Euler data. Kinematic data were recorded by IMU number and position (2 columns), quaternion (4 columns), Euler angle (°, 3 columns), raw acceleration (m/s2, 3 columns), linear acceleration (m/s2, 3 columns), and angular velocity (rad/s, 3 columns). The current orientation of IMUs was determined by using Euler angle following the Z-Y-Z sequence: the first rotation occurs around the Z-axis, followed by a rotation around the Y-axis and a rotation around the rotated new Z-axis. Quaternions transformed to Euler angles using Equation (1) [37].
Q u a t 2 E u l q = a r c t a n 2 q 0 q 1 + q 2 q 3 1 2 q 1 2 + q 2 2 , arcsin 2 q 0 q 2 q 3 q 1 , a r c t a n 2 q 0 q 3 + q 1 q 2 1 2 q 2 2 + q 3 2 T
where, q0 denotes the scalar part and q1, q2 and q3 denote the vector part of the quaternion.

2.6. Model Training

The ResNet-18 structure was pre-defined, only the weights were learned during training. Error was defined as the averaged cross-entropy loss over all samples [38] in one batch (Equation (2)). Training was not finished until the model converged (Figure 4a). A convolutional neural network (CNN), ResNet-18 [
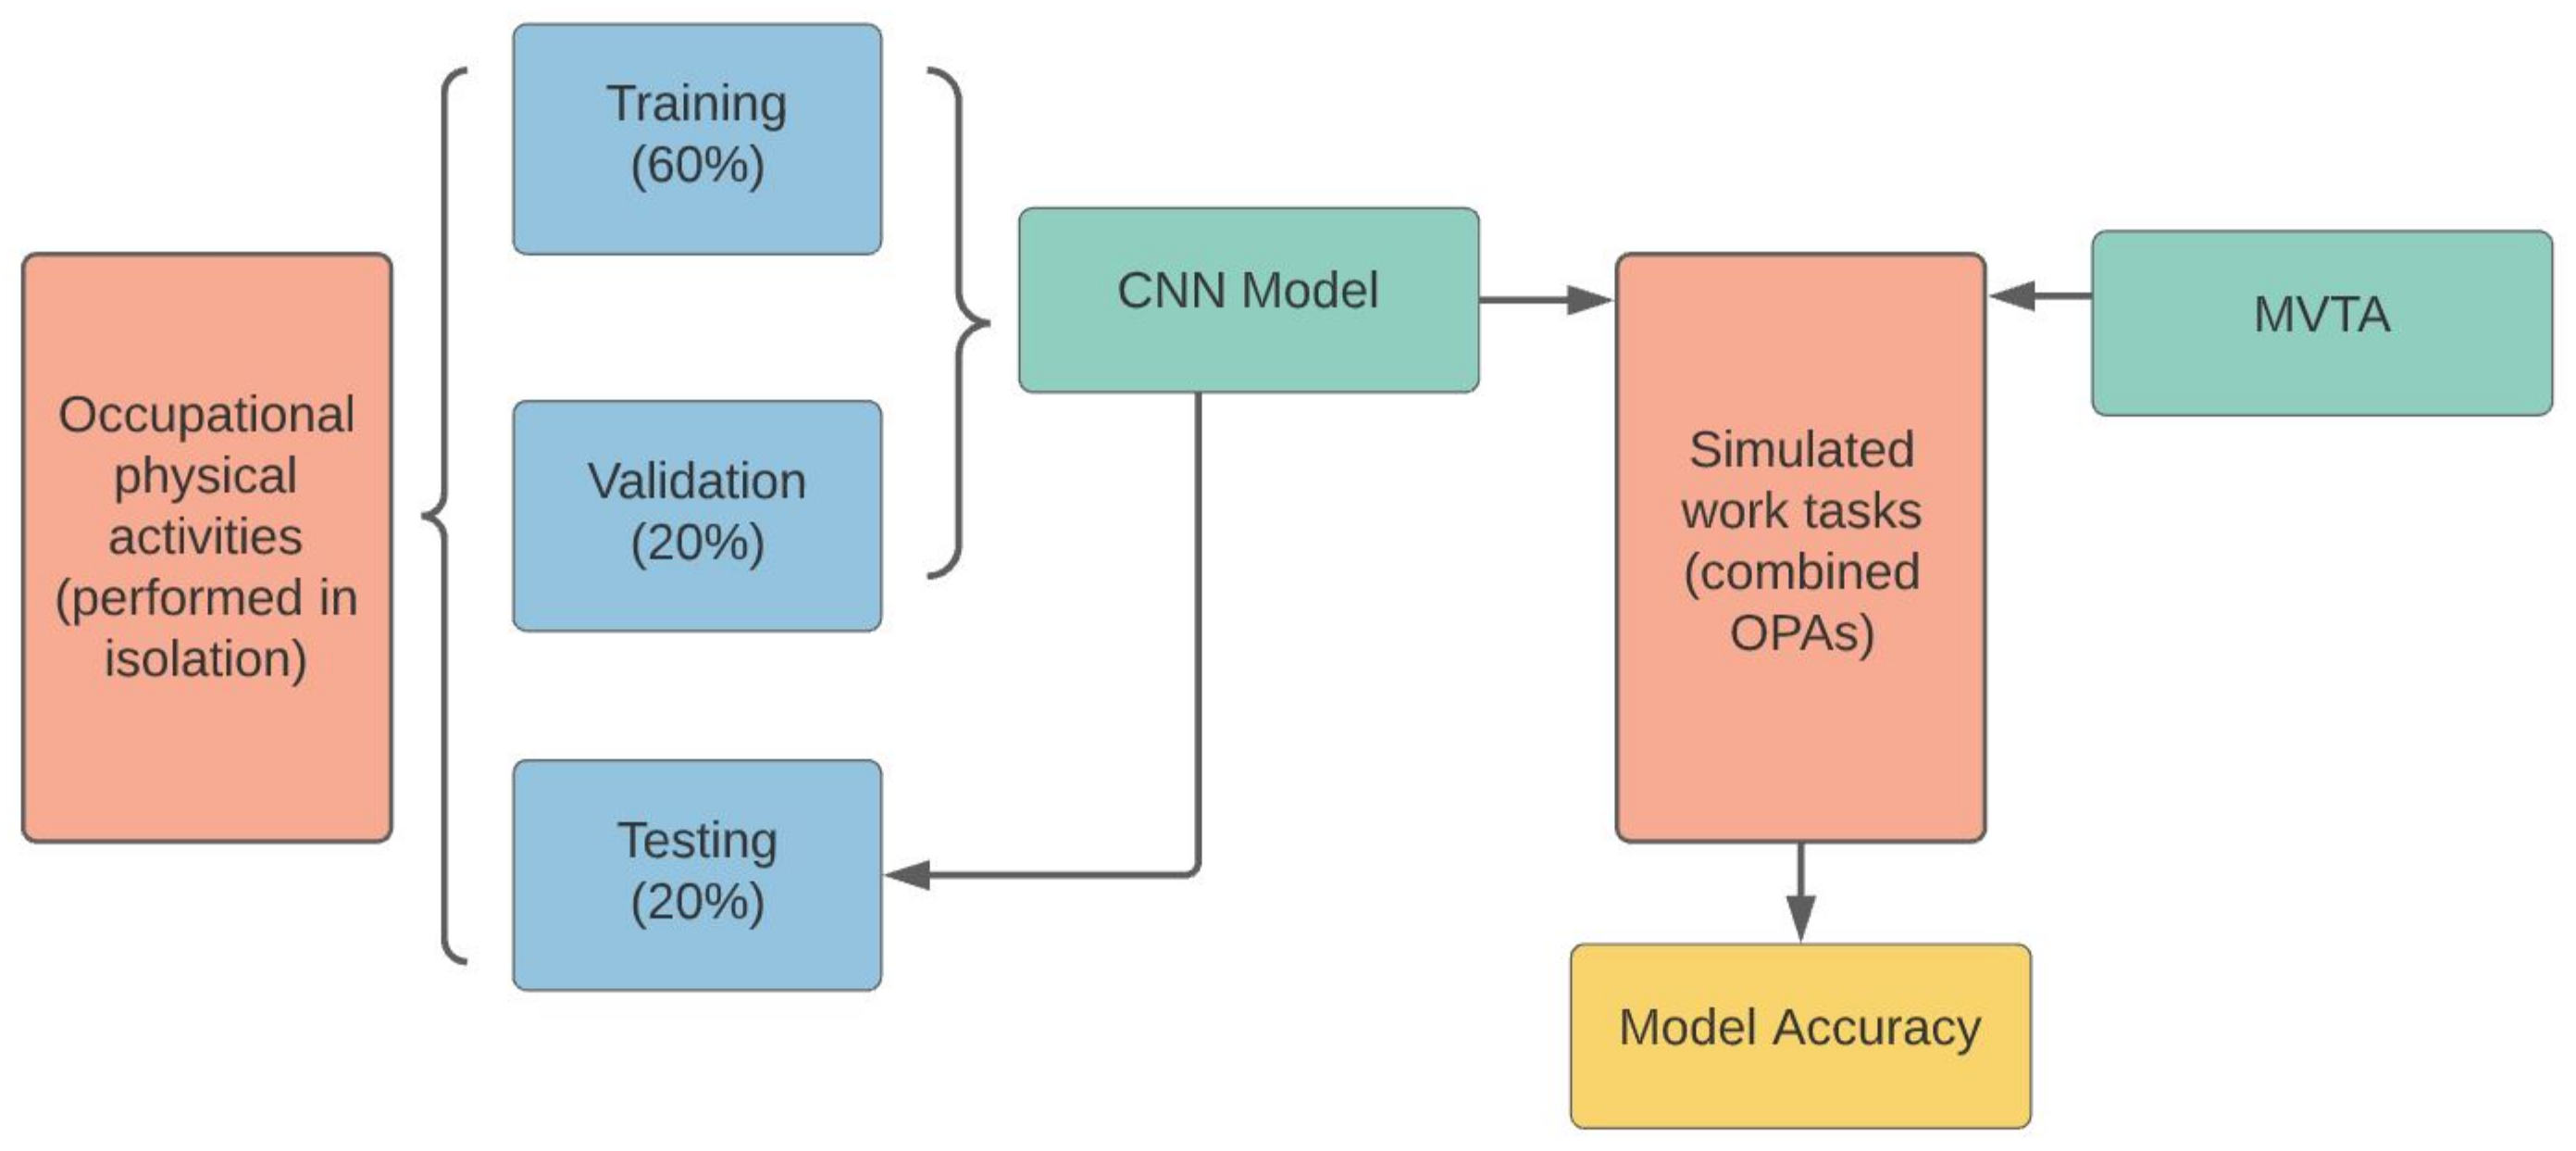
39] was used for categorical prediction. Its 18-layer implementation was robust to train the model efficiently and retain high accuracy. The time series data and kinematic data of activities based on the 15 OPA categories (Table 1) were converted to tensors (1 × 60 × 19) and divided into 60%, 20% and 20% for training, validation, and testing, respectively.
l o s s x , i = 1 N x i + log ( j e x j )
where, in each batch, i represented the correct OPA categories, j represented all of the OPA categories and N was the batch size. The lowest validation error across models did not necessarily identify the best model. Therefore, it was critical to save the current best model when the validation error decreased. After the training was complete, the best model was selected based on testing data accuracy (minimize empirical error). Model training and prediction were all performed using Python 2.7.
The OPA categories were added to data of 15 activities as the activity’s labels; the raw datasets were saved to 15 csv files. Each csv file represented one activity and was constructed in such a way that columns represented coordinates and time derivative information from one sensor and rows represented timestamps of each of the 8 sensors. Therefore, each row had 18 columns of sensor data, 1 column for the timestamp, and 1 column for the label.
The final model input data was generated by combining multiple rows together to form an image-like window. The number of rows combined (window size) was a hyperparameter of the model. The window size with the highest accuracy achieved. Each window had a size of 60 rows × 20 columns; in other words, 60 rows of sensor data, 20 columns of sensor data plus an activity label (Figure 4b). Finally, the overlapping window was cut. An overlapping window was defined as a window containing multiple activities and therefore it was redundant. For example, when a single window (1 s) contained both activity 1 and activity 2, this window was dropped (0.7%).

2.7. Tasks Prediction and Validation

Simulated work tasks were video-recorded at 30 frames per second then analyzed using Multimedia Video Tasks Analysis™ (MVTA™, NexGen Ergonomics Inc., Pointe-Claire, QC, Canada). Each frame was categorized and labeled into one of the 15 OPAs (Table 1). Two researchers performed the task analysis using MVTA. Both researchers were trained by a senior engineer who has been using MVTA for more than 13 years. Random frames were selected by PI and the senior engineer to confirm task analysis reliability and accuracy. Any uncertainties were resolved by discussion with the PI and senior engineer. Transitions (i.e., frames between standing and lifting) were allocated to the proceeding OPA.
In the occupational activity classification problems, after removing the column of activity label, each task was split into multiple 60 × 19 windows as input to the CNN. In total, 60 rows of data corresponded to roughly 1 s of “video” which was enough for a single activity to be repetitive and recognizable. The CNN analyzed these windows and mapped them to a predicted OPA. The trained CNN model was applied to the IMU data for the simulated work tasks to predict an OPA for each 1 s interval. The OPA prediction each second was compared to the results from the MVTA [40] to calculate model accuracy of OPA prediction (Figure 5). A post hoc analysis of the best three predictions of OPAs generated by the CNN model was used for further analysis.

2.8. Post Hoc Analysis

For the simulated work tasks, the best three CNN OPA predictions each second were compared with the actual OPA identified by MVTA. For the best three CNN predictions of each second, if there was a correct prediction, it was counted. If all three were incorrect, the first OPA prediction was counted as the incorrect prediction.

3. Results

A total of 15 healthy participants with an average age of 31 ± 13.6 years (9 males, 6 females, Table 3) participated in this study. The average height and weight of individuals were 169.4 ± 14.8 cm and 68.2 ± 15.6 kg, respectively. None of them reported any recent injuries or chronic diseases.
The CNN achieved an overall accuracy of 95% in test data but differed by OPA with one handed lifting/lowering having the lowest accuracy (83%) and six OPAs having an accuracy of 100% (Table 4).
The data collected from bottle packaging tasks, carpet laying tasks and drilling tasks were combined and processed by the trained CNN model. The top CNN OPA prediction was compared with MVTA results for each frame to calculate the prediction accuracy (Table 5). Based on the 1503 frames, the average accuracy was 22% with accuracies varying by OPA. The lowest accuracy was 0% (one-handed lifting) and the highest accuracy was 95% (overhead work).
The analysis of the three best CNN predictions was higher; the average prediction accuracy was 45% (Table 6). Some OPA prediction accuracies were high; accuracy of one-handed pulling and overhead work exceeded 95%, while the accuracy for pushing reached 88%. However, prediction accuracy of other OPAs was very low. For example, kneeling had an accuracy of 7%, being commonly mistaken for crouching (Figure 6). None of the one-handed lifts were correctly predicted. Many frames of stooping were predicted as reaching.

4. Discussion

The present study used a deep learning method to predict 15 OPA activities common in MMH jobs. A convolution neural network model was applied to data from 8 IMUs to predict which of the 15 OPAs were being performed during each second of analysis. Overall, the model had an average accuracy of 95% when each OPA was performed in isolation. However, model accuracy decreased when applied to simulated work tasks that contained multiple OPAs (e.g., bottle packaging, carpet lying and drilling).
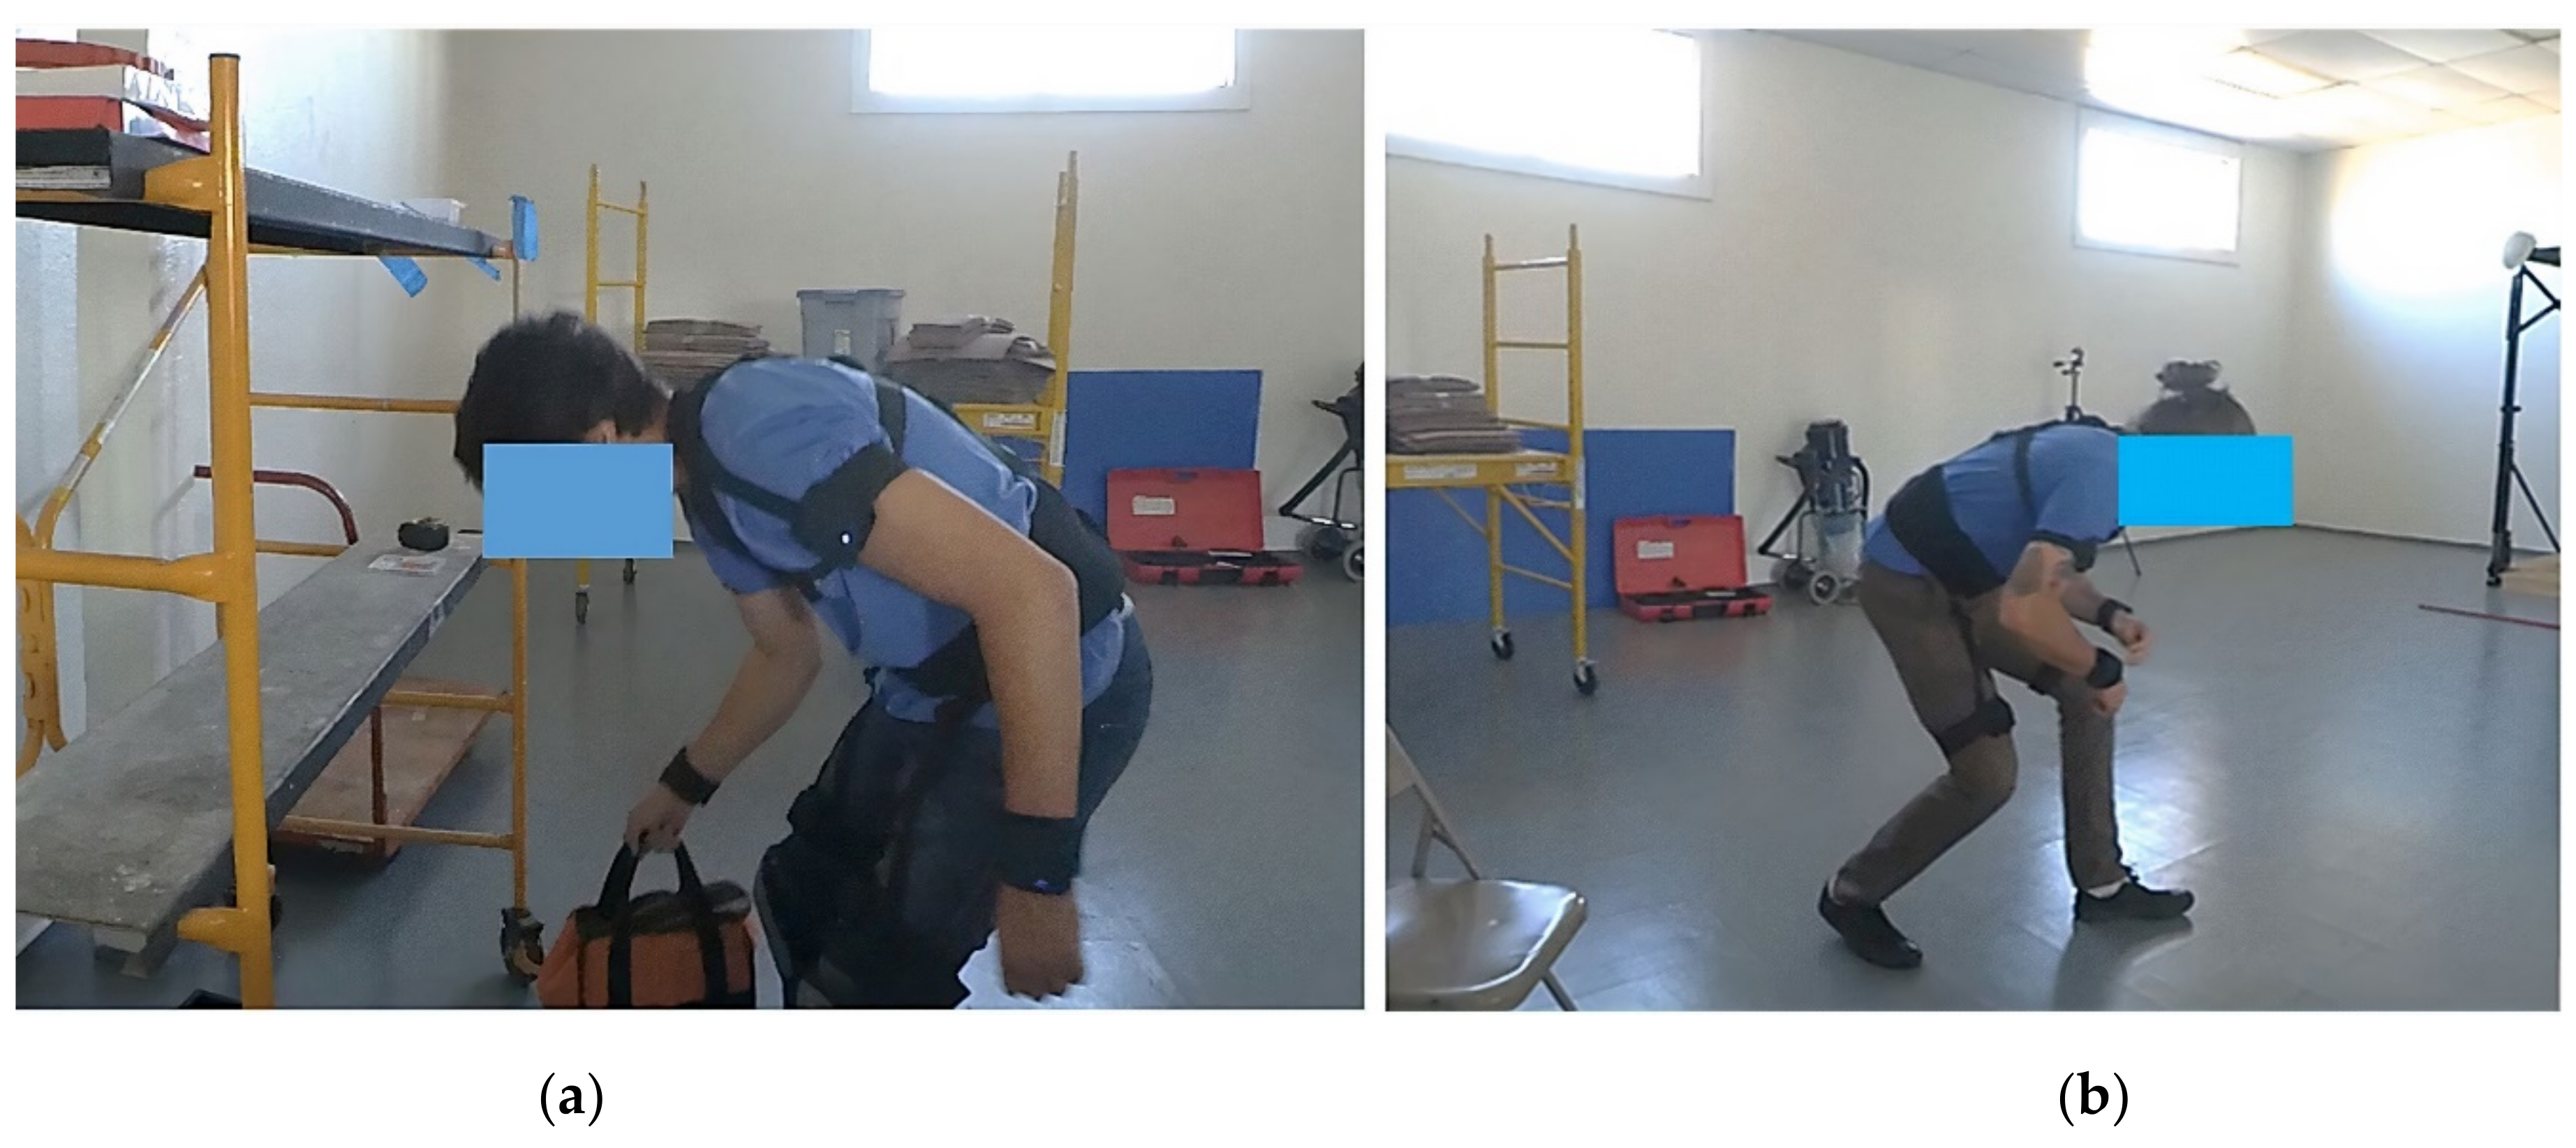
The CNN model was first applied to predict occupational physical activities performed in isolation. The study indicated that the CNN model provided a reliable prediction of OPAs performed in isolation with the highest accuracy of prediction reaching 100%, and the lowest accuracy being 83%. However, even when performed in isolation, some activities had better accuracy than others; overhead work, sitting, standing, carrying, reaching and static stoop had 100% accuracy while one-handed lifting, pulling and crouching were lower (83%, 85% and 88%, respectively). One possible reason for the lower accuracy in one-handed lifting (83%) was the asymmetrical movement that varied with each lift (Figure 7a). Pulling and one-handed pulling also had lower prediction accuracy (85% and 93%, respectively) which may have also been due to activity being asymmetrical and varied. The model accuracy for crouching may have been lower (88%) due to the trunk angle being similar to other activities, such as lifting and kneeling. Future studies should include IMU data from the lower legs to evaluate whether additional IMU data improves model prediction for all OPAs by differentiating activities with similar upper body postures (Figure 7b).
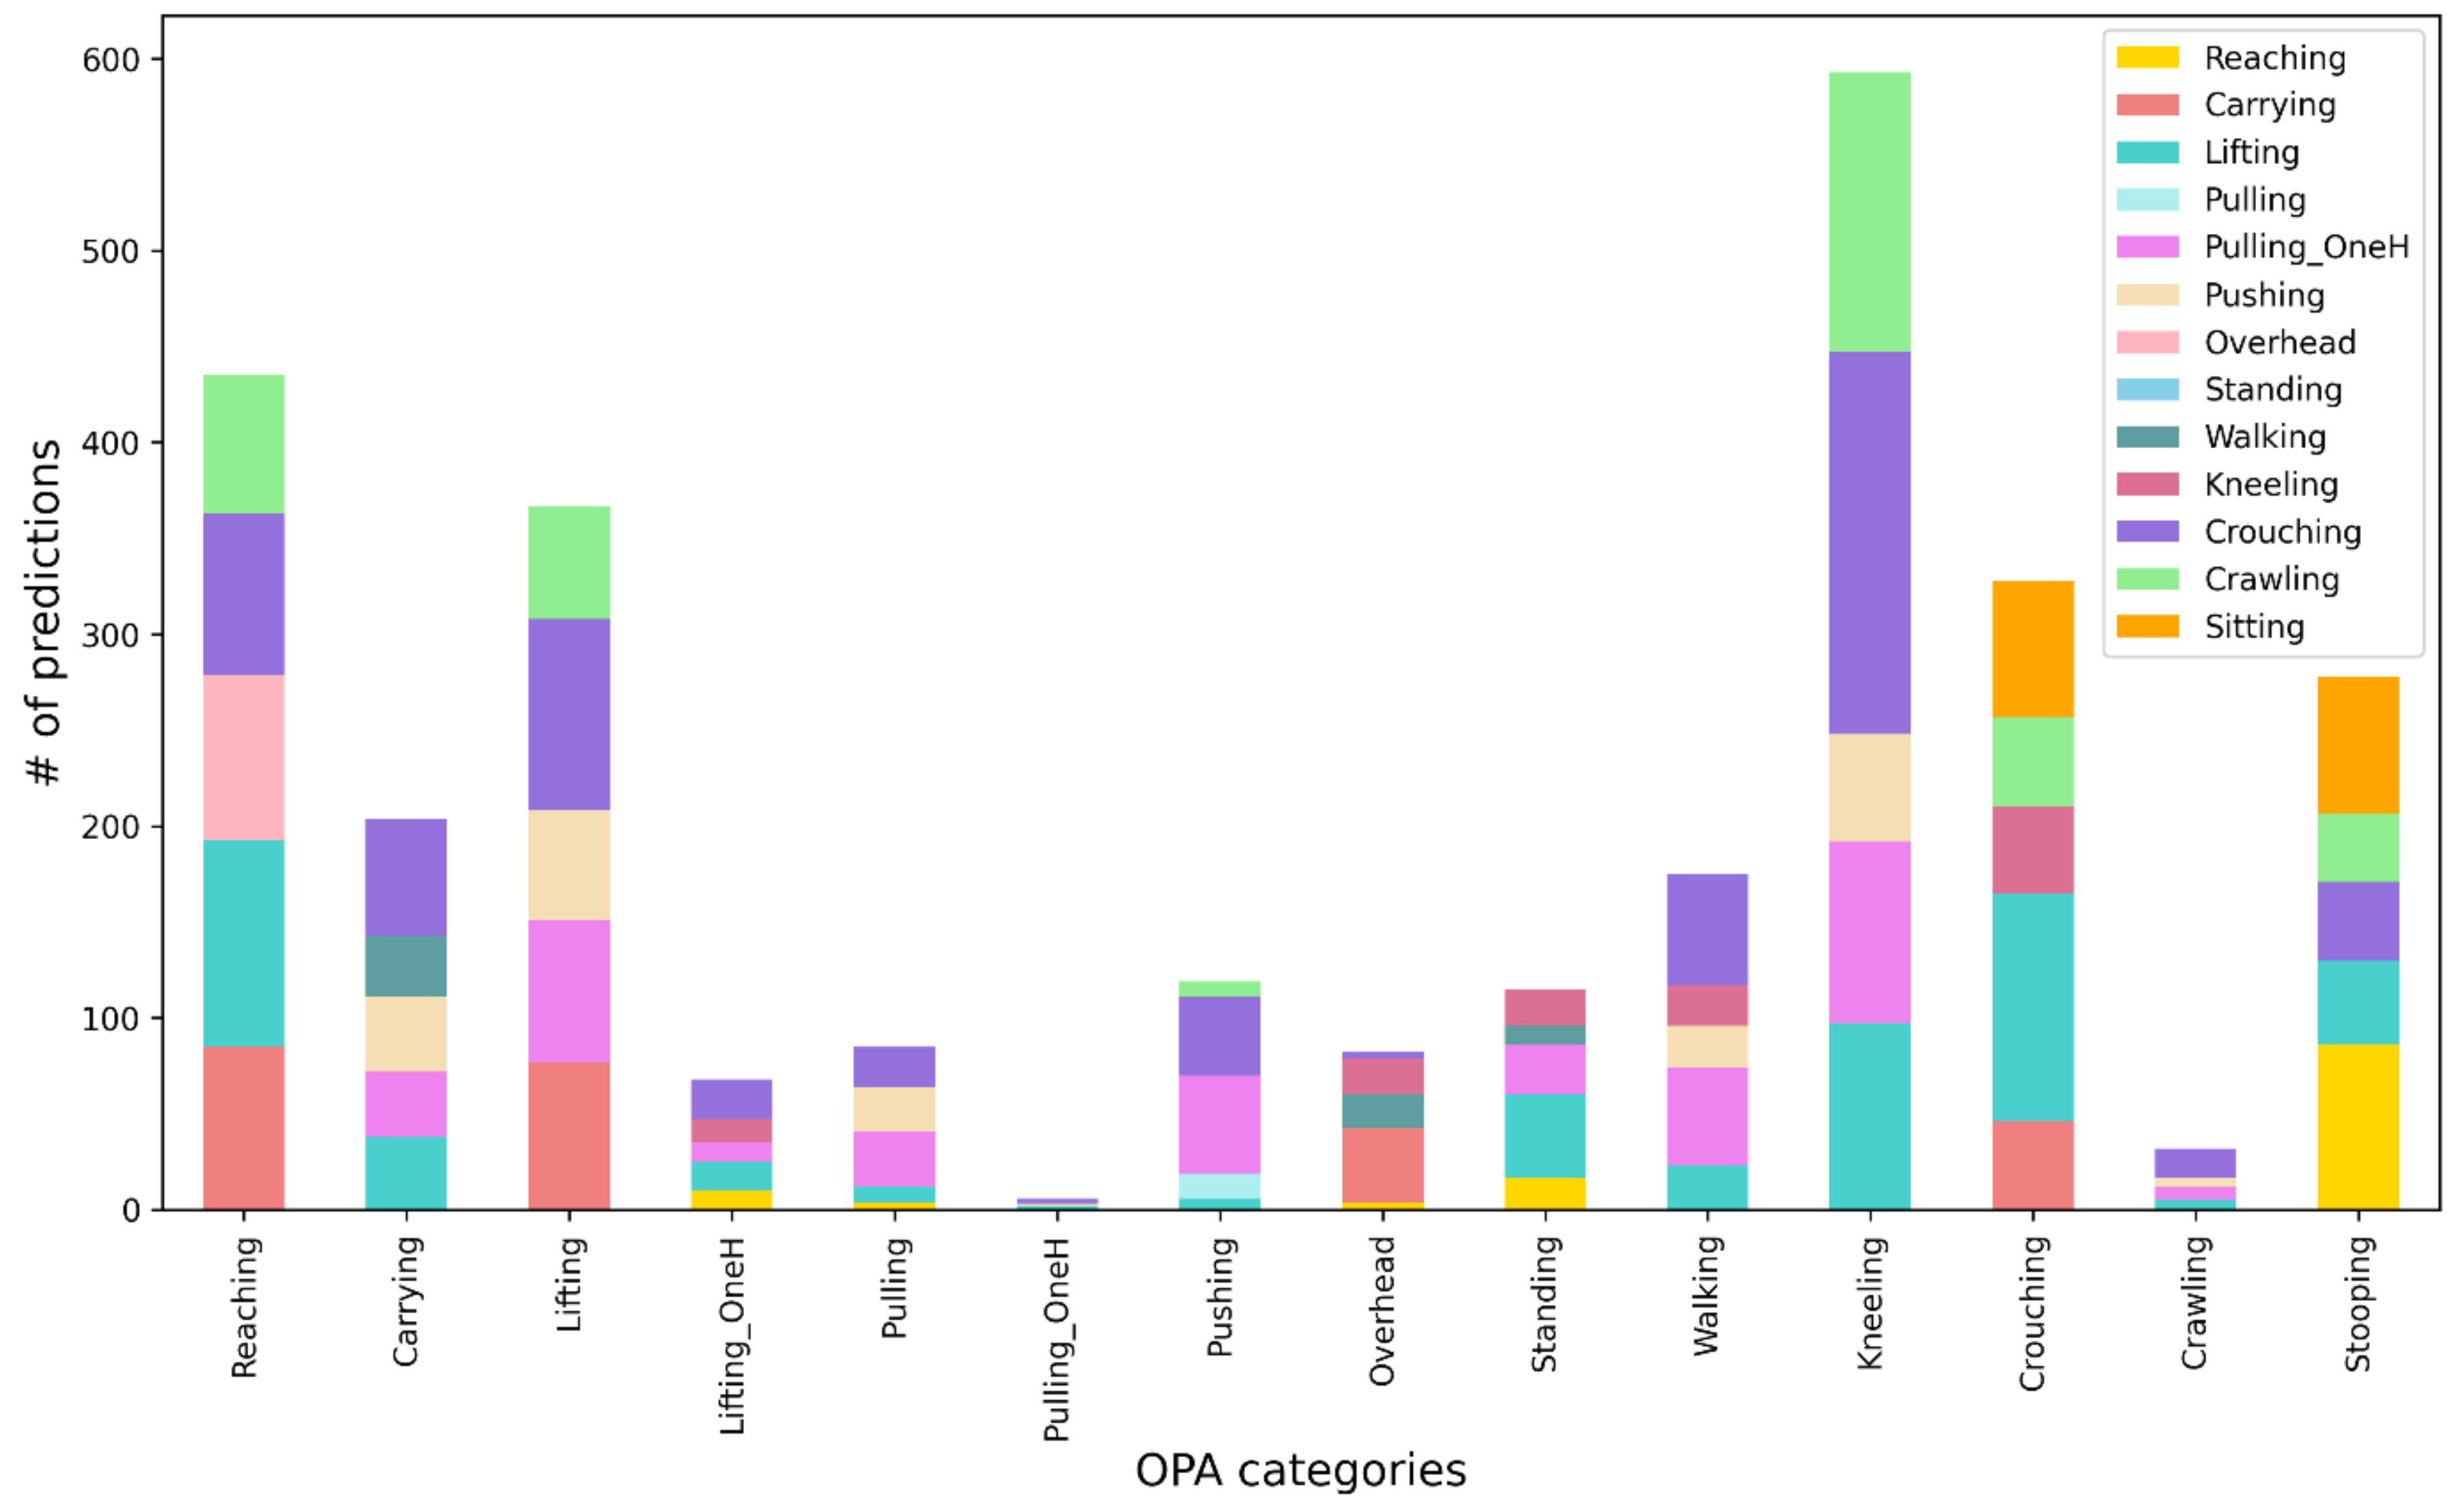
To test the robustness of the trained CNN model, it was applied to data collected during three MMH tasks. The overall model accuracy fell dramatically to 22%. Each task contained multiple OPAs and the model was unable to differentiate the OPAs with high accuracy when they were performed as part of a simulated task. To understand the inaccurate predictions, a post hoc analysis analyzed the best three CNN predictions for each second of simulated work. The overall accuracy of OPAs increased from 22% to 45%. The results of some activities improved greatly; prediction for lifting and pushing increased from 13% to 51% and 39% to 88%, respectively. This indicates that the model may have had an incorrect best prediction, but the 2nd or 3rd prediction was correct, at least for some OPAs. However, some activities had minimal changes in accuracy. The incorrect predictions for each OPA were graphed to visually depict erroneous predictions for each OPA. This was primarily done to develop improved models for future research, particularly for the OPAs with a low prediction accuracy. Upon further analysis, the erroneous predictions appeared to be primarily due to four circumstances including (1) variation in how the OPA was performed; (2) OPAs being performed concurrently; (3) posture similarities between OPAs; (4) an OPA being embedded in another OPA, thus confusing the model.
The amount of variation in how activities were performed impacted the model prediction accuracy. For example, the CNN model was trained with people lifting using a squat technique, yet during the work simulated tasks, some people used the stoop lift posture which was mistakenly predicted as crouching. Kneeling only had a 7% accuracy despite using the best three predictions. Kneeling can also be performed with much variation; there was kneeling while sitting on the heels, kneeling upright (no hip flexion) and single knee kneeling. Since the model was not trained for these variations in posture, it predicted other similar activities such as crouching or crawling. Future research should include more variations of how each OPA is performed during the training-test dataset before it is applied to simulated work tasks. Fifteen subjects participated in the current study. Including more people in the training-test dataset would also be helpful in capturing variations in how OPAs are performed.
Another reason for poor prediction accuracy was that subjects often performed multiple OPAs at the same moment while performing a task which the single model prediction approach could not resolve. For example, subjects may reach while kneeling, sitting, or standing. Standing was misclassified as lifting since subjects usually lift items when standing. This presented challenges for the CNN model in predicting the predominant activity. Despite the extensive training, evaluation, and discussion about how to classify each frame in MVTA, human judgement was used to identify the predominant activity.
As described above when OPAs were performed in isolation, similar postures across OPAs were a reason for poor accuracy during the MMH tasks, especially since there was no information on loads being handled. Reaching was frequently predicted as lifting, overhead work, and carrying likely because those activities include shoulder flexion with an increased horizontal distance between the body and wrists. Kneeling was commonly misclassified as crawling or crouching, also likely due to the similarities in hip flexion and trunk angles, particularly when kneeling while sitting on one’s heels. Crouching was misclassified as lifting or sitting, again due to similar hip flexion angles. Surprisingly, walking had low prediction accuracies and was most commonly misclassified as one-handed pulling, carrying, or pushing, all of which include walking while handling a load. Having additional information from lower extremity IMUs and/or about loads being handled may improve the OPA classification across these otherwise similar activities that all included some amount of reach.
Another common reason for misclassification was when one OPA was part of or embedded within another OPA. For example, when categorizing OPAs in MVTA, the visual cues made it obvious when someone was reaching forward to lift something. In this case, the lift started at the beginning of the reach to lift an item and ended when the item was brought back to their body. In other words, if someone was reaching forward to lift something, the frames including the reach forward required to make contact with the object, were classified as part of the lift. Despite this consistency in how the models were trained, the CNN model could not differentiate these activities during the simulated activities, based on intent of the movement. This may explain why reaching was incorrectly predicted as a carry and why standing was frequently misclassified as lifting. Thus, a different approach to OPA classification will be needed in the future to help differentiate OPAs. It may be beneficial to start the classification of a lift when the load is actually being lifted versus the moment someone reaches forward to initiate a lift.
To mitigate the misclassification discussed above and improve the prediction accuracy, additional IMUs and/or pressure insoles could be added to the system in future studies. For example, pressure insole information may help differentiate similar activities that primarily differ based on loads being handled such walking versus carrying, pushing or pulling and crouching versus lifting. Information from pressure insoles has been shown to distinguish such activities [36] and may help distinguish kneeling, crouching, and stooping from lifting. Pressure insole information may also help distinguish crawling from kneeling and crouching since the total force would be significantly lower since the weight is supported through the knees when crawling.
To address concurrent OPAs happening simultaneously, sequential modeling could be used to make multiple predictions. A prior study used sequential artificial neural network models to estimate hand posture before estimating hand exertion force [41]. Perhaps a similar approach that predicts whole body posture before predicting upper extremity movement could be used to improve OPA prediction accuracy.
Continual challenges to estimating prediction accuracies remain because of the transitional time between OPAs when performing simulated work. This can be minimized by training models to make accurate predictions from the beginning of the activity to the very end. For example, lifting would need to be predicted from the first moment there is hip and knee flexion to the moment the person returns to standing. This has obvious challenges for a model that makes a prediction every second and will require proceeding information for accurate classification. Exploring additional types of deep learning models may help to address this issue and improve prediction results. In this study, a recurrent neural network (RNN) model was first applied to predict OPAs when performed in isolation. The prediction result of the RNN model did not meet expectations. Upon reflection, RNNs are designed to predict an outcome for each timestamp in a time series that was not the best fit for OPA classification. Further, CNN Resnet models have been shown to outperform other deep learning approaches significantly for time series classification [42]. Thus, the current model chosen for this study was from ImageNet contest winner, Resnet. Its 18-layers implementation is robust to train the model efficiently and retain high accuracy for single OPAs prediction. The window size of the current CNN model was 60 rows of sensor data, roughly corresponding to 1 s of video data which is enough for a single activity to be repetitive and recognizable. However, in MMH tasks, activities change at a very fast pace. Thus, further investigation on window size selection is needed.

5. Limitations

Subjects could choose how they performed the simulated work tasks, therefore, some activities such as one-handed pulling and crawling had limited data. For some OPAs like crawling, this may have led to the low accuracy rate, specifically because crawling is similar with other OPAs. Future studies should include more participants and data from a greater number of simulated tasks. Fifteen subjects participated in this pilot study which allowed us to assess the feasibility and accuracy of this approach. In future studies, more subjects will be included to allow more variability when training the model.

6. Conclusions

Fifteen occupational physical activities were predicted using a convolutional neural network model and inertial measurement units with an overall accuracy of 95% when performed in isolation, however, the prediction accuracy was low and varied widely when applied to simulated work tasks that included multiple OPAs. Reasons for the reduced accuracy may be addressed in future studies by exploring sequential modeling approaches, model selection, and the addition of lower extremity IMUs and/or pressure insole sensors. Predicting OPAs using wearable devices and deep learning models is an important step in quantifying physical job demands with more accuracy than current methods.

Author Contributions

Conceptualization and experimental design: C.H.-A. and A.B.; data collection: E.H. and A.W.; data analysis: Y.Y., Y.L. and H.F.; data interpretation: Y.Y., H.F. and C.H.-A.; writing—original draft preparation: Y.Y. and H.F.; writing—review and editing: C.H.-A. and G.D.O. All authors have read and agreed to the published version of the manuscript.

Funding

This research was supported by a gift from Liberty Mutual.

Institutional Review Board Statement

The study was conducted according to the guidelines of the Declaration of Helsinki and approved by the Institutional Review Board of University of California, San Francisco (IRB #: 10-04700).

Informed Consent Statement

Informed consent was obtained from all subjects involved in the study.

Data Availability Statement

Data sharing is not applicable for this study.

Acknowledgments

We would like to acknowledge Liberty Mutual for their support of this research.

Conflicts of Interest

The authors declare no conflict of interest.

References

  1. Bernard, B.P.; Putz-Anderson, V. Musculoskeletal Disorders and Workplace Factors. A Critical Review of Epidemiologic Evidence for Work-Related Musculoskeletal Disorders of the Neck, Upper Extremity, and Low Back. U.S. Department of Health and Human Services, 1997. Available online: https://www.cdc.gov/niosh/docs/97-141/pdfs/97-141.pdf?id=10.26616/NIOSHPUB97141 (accessed on 7 July 2021).
  2. Occupational Safety and Health Administration. Ergonomics—Overview. Available online: https://www.osha.gov/ergonomics (accessed on 16 June 2021).
  3. Waters, T.R. National Efforts to Identify Research Issues Related to Prevention of Work-Related Musculoskeletal Disorders. J. Electromyogr. Kinesiol. 2004, 14, 7–12. [Google Scholar] [CrossRef]
  4. Occupational Safety and Health Administration. Prevention of Work-Related Musculoskeletal Disorders. Available online: https://www.osha.gov/redirect?p_table=UNIFIED_AGENDA&p_id=4481%20 (accessed on 11 June 2021).
  5. Esfahani, M.I.M.; Nussbaum, M.A.; Kong, Z. Using a Smart Textile System for Classifying Occupational Manual Material Handling Tasks: Evidence from Lab-Based Simulations. Ergonomics 2019, 62, 823–833. [Google Scholar] [CrossRef]
  6. Casazza, B.A. Diagnosis and Treatment of Acute Low Back Pain. AFP 2012, 85, 343–350. [Google Scholar]
  7. Hwang, B.; Shan, M.; Supa’at, N.N.B. Green Commercial Building Projects in Singapore: Critical Risk Factors and Mitigation Measures. Sustain. Cities Soc. 2017, 30, 237–247. [Google Scholar] [CrossRef]
  8. David, G.C. Ergonomic Methods for Assessing Exposure to Risk Factors for Work-Related Musculoskeletal Disorders. Occup. Med. 2005, 55, 190–199. [Google Scholar] [CrossRef] [Green Version]
  9. Schall, M.C.; Fethke, N.B.; Chen, H. Working Postures and Physical Activity among Registered Nurses. Appl. Ergon. 2016, 54, 243–250. [Google Scholar] [CrossRef] [PubMed]
  10. Chen, H.; Lin, K.; Liing, R.; Wu, C.; Chen, C. Kinematic Measures of Arm-Trunk Movements during Unilateral and Bilateral Reaching Predict Clinically Important Change in Perceived Arm Use in Daily Activities after Intensive Stroke Rehabilitation. J. Neuroeng. Rehabil. 2015, 12, 84. [Google Scholar] [CrossRef] [Green Version]
  11. Song, J.; Qu, X. Effects of Age and Its Interaction with Task Parameters on Lifting Biomechanics. Ergonomics 2014, 57, 653–668. [Google Scholar] [CrossRef] [PubMed]
  12. Song, J.; Qu, X. Age-Related Biomechanical Differences during Asymmetric Lifting. Int. J. Ind. Ergon. 2014, 44, 629–635. [Google Scholar] [CrossRef]
  13. Harris-Adamson, C.; Eisen, E.A.; Kapellusch, J.; Garg, A.; Hegmann, K.T.; Thiese, M.S.; Dale, A.M.; Evanoff, B.; Burt, S.; Bao, S.; et al. Biomechanical Risk Factors for Carpal Tunnel Syndrome: A Pooled Study of 2474 Workers. Occup. Environ. Med. 2015, 72, 33–41. [Google Scholar] [CrossRef] [PubMed]
  14. Tammana, A.; McKay, C.; Cain, S.M.; Davidson, S.P.; Vitali, R.V.; Ojeda, L.; Stirling, L.; Perkins, N.C. Load-Embedded Inertial Measurement Unit Reveals Lifting Performance. Appl. Ergon. 2018, 70, 68–76. [Google Scholar] [CrossRef] [PubMed]
  15. Cuesta-Vargas, A.I.; Galán-Mercant, A.; Williams, J.M. The Use of Inertial Sensors System for Human Motion Analysis. Phys. Ther. Rev. 2010, 15, 462–473. [Google Scholar] [CrossRef] [PubMed] [Green Version]
  16. Daponte, P.; De Vito, L.; Sementa, C. A Wireless-Based Home Rehabilitation System for Monitoring 3D Movements. In Proceedings of the 2013 IEEE International Symposium on Medical Measurements and Applications (MeMeA), Gatineau, QC, Canada, 4–5 May 2013; pp. 282–287. [Google Scholar]
  17. Yang, P.; Xie, L.; Wang, C.; Lu, S. IMU-Kinect: A Motion Sensor-Based Gait Monitoring System for Intelligent Healthcare. In Proceedings of the Adjunct Proceedings of the 2019 ACM International Joint Conference on Pervasive and Ubiquitous Computing and Proceedings of the 2019 ACM International Symposium on Wearable Computers, London, UK, 9 September 2019; Association for Computing Machinery: New York, NY, USA, 2019; pp. 350–353. [Google Scholar]
  18. Yeh, S.C.; Chang, S.M.; Hwang, W.Y.; Liu, W.K.; Huang, T.C. Virtual Reality Applications IMU Wireless Sensors in the Lower Limbs Rehabilitation Training. Appl. Mech. Mater. 2013, 278, 1889–1892. [Google Scholar] [CrossRef]
  19. Groh, B.H.; Kautz, T.; Schuldhaus, D.; Eskofier, B.M. IMU-Based Trick Classification in Skateboarding. Appl. Ergon. 2016, 52, 104–111. [Google Scholar]
  20. Tessendorf, B.; Gravenhorst, F.; Arnrich, B.; Tröster, G. An IMU-Based Sensor Network to Continuously Monitor Rowing Technique on the Water. In Proceedings of the 2011 Seventh International Conference on Intelligent Sensors, Sensor Networks and Information Processing, Adelaide, SA, Australia, 6–9 December 2011; pp. 253–258. [Google Scholar]
  21. Wang, Q.; De Baets, L.; Timmermans, A.; Chen, W.; Giacolini, L.; Matheve, T.; Markopoulos, P. Motor Control Training for the Shoulder with Smart Garments. Sensors 2017, 17, 1687. [Google Scholar] [CrossRef] [PubMed]
  22. Marras, W.S. Occupational Low Back Disorder Causation and Control. Ergonomics 2000, 43, 880–902. [Google Scholar] [CrossRef] [PubMed]
  23. Gallagher, S. Physical Limitations and Musculoskeletal Complaints Associated with Work in Unusual or Restricted Postures: A Literature Review. J. Saf. Res. 2005, 36, 51–61. [Google Scholar] [CrossRef] [PubMed]
  24. Kim, S.; Nussbaum, M.A. Performance Evaluation of a Wearable Inertial Motion Capture System for Capturing Physical Exposures during Manual Material Handling Tasks. Ergonomics 2013, 56, 314–326. [Google Scholar] [CrossRef]
  25. Bastani, K.; Kim, S.; Kong, Z.; Nussbaum, M.A.; Huang, W. Online Classification and Sensor Selection Optimization with Applications to Human Material Handling Tasks Using Wearable Sensing Technologies. IEEE Trans. Hum. Mach. Syst. 2016, 46, 485–497. [Google Scholar] [CrossRef]
  26. Nonfatal Occupational Injuries and Illnesses Requiring Days Away from Work. Available online: https://www.bls.gov/news.release/osh2.toc.htm (accessed on 11 June 2021).
  27. Kelsey, J.L.; Githens, P.B.; White, A.A.; Holford, T.R.; Walter, S.D.; O’Connor, T.; Ostfeld, A.M.; Weil, U.; Southwick, W.O.; Calogero, J.A. An Epidemiologic Study of Lifting and Twisting on the Job and Risk for Acute Prolapsed Lumbar Intervertebral Disc. J. Orthop. Res. 1984, 2, 61–66. [Google Scholar] [CrossRef]
  28. Granata, K.P.; Marras, W.S. Relation between Spinal Load Factors and the High-Risk Probability of Occupational Low-Back Disorder. Ergonomics 1999, 42, 1187–1199. [Google Scholar] [CrossRef] [PubMed]
  29. Hoogendoorn, W.E.; van Poppel, M.N.; Bongers, P.M.; Koes, B.W.; Bouter, L.M. Physical Load during Work and Leisure Time as Risk Factors for Back Pain. Scand. J. Work. Environ. Health 1999, 25, 387–403. [Google Scholar] [CrossRef] [PubMed] [Green Version]
  30. Strine, T.W.; Hootman, J.M. US National Prevalence and Correlates of Low Back and Neck Pain among Adults. Arthritis Care Res. 2007, 57, 656–665. [Google Scholar] [CrossRef] [PubMed]
  31. Gallagher, S.; Marras, W.S. Tolerance of the Lumbar Spine to Shear: A Review and Recommended Exposure Limits. Clin. Biomech. 2012, 27, 973–978. [Google Scholar] [CrossRef] [PubMed]
  32. Harris-Adamson, C.; Eisen, E.A.; Dale, A.M.; Evanoff, B.; Hegmann, K.T.; Thiese, M.S.; Kapellusch, J.M.; Garg, A.; Burt, S.; Bao, S.; et al. Personal and Workplace Psychosocial Risk Factors for Carpal Tunnel Syndrome: A Pooled Study Cohort. Occup. Environ. Med. 2013, 70, 529–537. [Google Scholar] [CrossRef] [PubMed]
  33. Agarwal, S.; Steinmaus, C.; Harris-Adamson, C. Sit-Stand Workstations and Impact on Low Back Discomfort: A Systematic Review and Meta-Analysis. Ergonomics 2018, 61, 538–552. [Google Scholar] [CrossRef] [PubMed]
  34. Harris-Adamson, C.; Mielke, A.; Xu, X.; Lin, J.-H. Ergonomic Evaluation of Standard and Alternative Pallet Jack Handless. Int. J. Ind. Ergon. 2016, 54, 113–119. [Google Scholar] [CrossRef]
  35. Keester, D.L.; Sommerich, C.M. Investigation of Musculoskeletal Discomfort, Work Postures, and Muscle Activation among Practicing Tattoo Artists. Appl. Ergon. 2017, 58, 137–143. [Google Scholar] [CrossRef] [PubMed]
  36. Antwi-Afari, M.F.; Li, H.; Yu, Y.; Kong, L. Wearable Insole Pressure System for Automated Detection and Classification of Awkward Working Postures in Construction Workers. Autom. Constr. 2018, 96, 433–441. [Google Scholar] [CrossRef]
  37. Blanco, J.L. A Tutorial on SE (3) Transformation Parameterizations and On-Manifold Optimization; Technical Report; University of Malaga: Malaga, Spain, 2013; Volume 3, p. 6. [Google Scholar]
  38. Sangari, A.; Sethares, W. Convergence Analysis of Two Loss Functions in Soft-Max Regression. IEEE Trans. Signal. Process. 2016, 64, 1280–1288. [Google Scholar] [CrossRef]
  39. He, K.; Zhang, X.; Ren, S.; Sun, J. Deep Residual Learning for Image Recognition. In Proceedings of the IEEE Conference on Computer Vision and Pattern Recognition (CVPR), Las Vegas, NV, USA, 27–30 June 2016; pp. 770–778. [Google Scholar]
  40. Yen, T.Y.; Radwin, R.G. A Video-Based System for Acquiring Biomechanical Data Synchronized with Arbitrary Events and Activities. IEEE Trans. Biomed. Eng. 1995, 42, 944–948. [Google Scholar] [CrossRef] [PubMed] [Green Version]
  41. Wang, M.; Zhao, C.; Barr, A.; Yu, S.; Kapellusch, J.; Harris Adamson, C. Hand Posture and Force Estimation Using Surface Electromyography and an Artificial Neural Network. Proc. Hum. Factors Ergon. Soc. Annu. Meet. 2020, 64, 1247–1248. [Google Scholar] [CrossRef]
  42. Fawaz, H.I.; Forestier, G.; Weber, J.; Idoumghar, L.; Muller, P.-A. Deep Learning for Time Series Classification: A Review. Data Min. Knowl. Discov. 2019, 33, 917–963. [Google Scholar] [CrossRef] [Green Version]
Figure 1. Study procedure of prediction of occupational physical activities using inertial measuring units and deep learning model.
Applsci 11 09636 g001
Figure 2. Manual material handling tasks: bottle packing, carpet laying, and drilling.
Applsci 11 09636 g002
Figure 3. Wearable vest for occupational physical activities: (a) wearable track device and location of IMUs and their orientations (orientations were displayed as two orthogonal vectors), (b) performing manual material handling tasks with prototype, (c) IMU used in this study.
Applsci 11 09636 g003
Figure 4. Model training: (a) the training and validation error over the epoch, the model converged at epoch 23 and became overfitting afterward, (b) window cut.
Applsci 11 09636 g004
Figure 5. This diagram shows the approach for assessing the accuracy of the CNN model. Data collected from the OPAs performed in isolation were divided into 60%, 20% and 20% for training, validation, and testing, respectively. The trained model was applied to testing data from the OPAs performed in isolations, then the simulated work tasks to predict OPAs. Multimedia video task analysis was performed on the simulated work tasks and compared with model predictions to estimate the accuracy of the predictive model.
Applsci 11 09636 g005
Figure 6. This stacked bar chart shows the top 5 other OPAs that each activity was misclassified as. The X-axis represents the OPAs performed during the simulated work tasks and the legend represents OPAs predicted by CNN.
Applsci 11 09636 g006
Figure 7. Activities with similar trunk flexion have low prediction accuracies: (a) one-handed lifting, an asymmetrical activity (83%); (b) crouching (88%).
Applsci 11 09636 g007
Table 1. Occupational physical activities (N of subjects = 15).
OPA CategoryActivityLoadDuration/RepetitionRepetition
1Lifting/Lowering1Lifting from floor to shoulder level4.5 kg (box)15 s2
2Lifting from floor to waist level4.5 kg (box)15 s2
3Lifting from shoulder to waist level with twist4.5 kg (box)15 s2
4Lifting from shoulder to waist level without twist4.5 kg (box)15 s2
5Stooped lifting from floor to waist level4.5 kg (box)15 s2
6Lifting from floor to 1.5 m level4.5 kg (box)15 s2
2One-handed lifting/lowering7Right-handed lifting from floor to waist level4.5 kg (box)15 s2
8Left-handed lifting from floor to waist level4.5 kg (box)15 s2
3Pushing9Pushing clockwise136 kg (cart)60 s1
10Pushing counterclockwise136 kg (cart)60 s1
4Pulling11Pulling clockwise136 kg (cart)60 s1
5One-handed pulling12Right-handed pulling136 kg (cart)60 s1
13Left-handed pulling 136 kg (cart)60 s1
6Standing14Standing0 kg60 s1
7Sitting15Sitting0 kg60 s1
8Kneeling16Kneeling0 kg60 s1
9Static stooping17Static stooping0 kg60 s1
10Walking18Walking0 kg60 s1
11Crouching19Crouching0 kg60 s1
12Crawling20Crawling0 kg60 s1
13Carrying21Carrying4.5 kg (box)60 s1
14Reaching22Reaching (standing) close to body (shoulder elevation angle: 30°)0 kg60 s1
23Reaching (standing) far from body (shoulder elevation angle: 60°)0 kg60 s1
24Reaching (standing) high and far from body (shoulder elevation angle: 135°)0 kg60 s1
15Overhead work25Static overhead work0 kg60 s1
26Dynamic overhead work0 kg60 s1
OPA: occupational physical activities.
Table 2. Manual material handling tasks (n = 9). Subjects complete MMH tasks with different handling height and OPAs covered by each task are listed.
MMH TaskNDuration/RepetitionOPA Category Covered
Bottle packing6Within 5 minStanding, reaching, lifting/lowering, walking and carrying
Carpet laying4Within 5 minWalking, lifting/lowering, one-handed lifting/lowering, pushing, pulling, one-handed pulling, crouching, stooping, crawling, kneeling and standing
Drilling415 sWalking, lifting/lowering, carrying, stooping, overhead work and standing
Table 3. Demographics and anthropometric data of subjects.
GenderNAgeHeightWeightBMILower LegUPPER LEGLower ArmUpper Arm
(yrs)(cm)(kg)(kg/m2)(cm)(cm)(cm)(cm)
Male9Mean3117776.1024.3057.4492.0037.6738.89
SD15.4312.1315.434.303.686.542.873.26
Female7Mean3316561.1622.4552.1785.6733.3334.33
SD15.794.407.111.752.642.421.972.34
Table 4. CNN model accuracy of different OPA categories (N = number of correct predictions over total samples for each OPA. Accuracy is the percentile of correct predictions divided by total samples).
OPA CategoryN of Correct Samples (Windows)Accuracy
Overhead work194/194100%
Sitting97/97100%
Crawling78/7998%
Standing103/103100%
Carrying271/271100%
Walking101/10695%
Pushing170/18094%
Reaching279/279100%
Static stooping84/84100%
Kneeling84/8598%
Crouching85/9688%
Lifting/Lowering1028/106496%
One-handed lifting/lowering273/32783%
Pulling80/9485%
One-handed pulling194/20793%
Overall3121/326695%
Table 5. Accuracy of the top OPA prediction during simulated work tasks. The confusion matrix shows the CNN model accuracy of OPA predictions in simulated work tasks. OPAs were classified as upper body kinematics or whole-body kinematics. Cells in the left-hand column represent OPA categories in tasks and cells in the second row represent CNN predicted activities. Cells on the main diagonal and off-diagonal indicate the number of correct and incorrect predictions of each activity. The two right-hand columns represent the total frame and prediction accuracy of each OPAs, respectively. The cell at the bottom-right corner indicates the average prediction accuracy.
OPA CategoryUpper Body KinematicsWhole Body KinematicsTotal (Frame)Accuracy
ReachingCarryingLiftingLifting OnehandedPullingPulling OnehandedPushingOverhead WorkStandingWalkingKneelingCrouchingCrawlingStoopingSitting
Reaching312347 114150 5726281924313%
Carrying1369 8113 1112455111531%
Lifting63228 291612 1583921 320913%
Lifting onehanded 250 711 3483 1350%
Pulling 1 13136 2 4 3933%
Pulling onehanded 1 01 1 30%
Pushing 3 22923 2 5939%
Overhead work 0 0 40 1 1 4295%
Standing5 21 47 117 443126925%
Walking2813 2142 213254 29622%
Kneeling1125 235161 128960 42371%
Crouching7385 15 172413122218013%
Crawling 2 21 57 1741%
Stooping5233 75 9590315957%
Sitting 00N/A
Total581072730241668810817603626114910947150322%
Table 6. Accuracy of the top 3 OPA predictions during simulated work tasks. A confusion matrix showing the accuracy of the best three CNN predictions of OPAs in simulated work tasks. If there was a correct prediction in the best three outcomes, the correct one was counted. Otherwise, the first outcome of the best three predictions was counted. Cells in the left-hand column represent OPA categories in tasks and cells in the second row represent the best three predicted activities. The best three CNN predictions of each frame were taken for analysis. Cells on the main diagonal and off-diagonal indicate the number of correct and incorrect prediction of each activity. The two right-hand columns represent the total frame and CNN best three prediction accuracies of each OPA, respectively. The cell at the bottom-right corner indicates the average accuracy of best three CNN predictions.
OPA CategoryUpper Body KinematicsWhole Body KinematicsTotal (Frames)Accuracy
ReachingCarryingLiftingLifting OnehandedPullingPulling OnehandedPushingOverhead WorkStandingWalkingKneelingCrouchingCrawlingStoopingSitting
Reaching1032028 114130 442391524342%
Carrying1661 68 611942111557%
Lifting314106 22111 1242312 120951%
Lifting onehanded 250 711 3483 1350%
Pulling 1 2174 2 4 3954%
Pulling onehanded 3 3100%
Pushing 1 652 5988%
Overhead work 41 1 4298%
Standing1 11 35 139 1431 6957%
Walking2412 261 403204 29642%
Kneeling1123 235161 1168751 32377%
Crouching7150 4 14719122118039%
Crawling 1 1 312 1771%
Stooping 233 74 9399215962%
Sitting 00N/A
Total1181102720291181037539703727111011536150345%
Publisher’s Note: MDPI stays neutral with regard to jurisdictional claims in published maps and institutional affiliations.

