
HAZOP Analysis in Terms of Safety Operations Processes for Oil Production Units: A Case Study


1
FEUAN-Faculty of Engineering, University Agostinho Neto, Avenida Ho Chi Minh 56, Luanda 5 0307, Angola
2
LEPABE-Laboratory for Process Engineering, Environment, Biotechnology and Energy, Faculty of Engineering, University of Porto, Roberto Frias, 4200-465 Porto, Portugal
*
Author to whom correspondence should be addressed.
Appl. Sci. 2021, 11(21), 10210; https://0-doi-org.brum.beds.ac.uk/10.3390/app112110210
Submission received: 26 August 2021
/
Revised: 20 October 2021
/
Accepted: 22 October 2021
/
Published: 31 October 2021
(This article belongs to the Special Issue Celebrating Applied Sciences 20,000 Articles Milestone: Invited Papers in Chemistry Section)
Abstract
:The Hazard and Operability Study (HAZOP) methodology is considered one of the most effective techniques for risk analysis, developed fundamentally to provide regular processes with reduced risks that aim to guarantee the safety of activities and the operability of the production units. The study aims to apply the HAZOP methodology in process and safety operations in the oil production industry. A crude oil production unit was divided into smaller sections that were analysed. By applying the HAZOP methodology, 71 possibilities of relevant risks were identified. The environmental, health and economic impacts were estimated to establish safeguard priorities for them. The application of this methodology and the defined safeguards generated 47 recommendations to mitigate the detected problems. The study contributions were to demonstrate the efficacies of HAZOP methodology to identify potential hazards and evaluate the potential hazards obtained for malfunctioning of equipment and property in terms of the resultant impacts either new or existing process facilities, and as a useful tool to provide essential knowledge for the companies’ leaders, decision-maker, and operations managers.
1. Introduction
Industrialisation provides not only well-being and progress, but also brings problems and harmful effects to the environment and human health and increases the risk of accidents and safety issues. Accidents associated with the oil industry can cause various types of damage and irreparable injuries [1]. Many catastrophic accidents occur not because of a lack of knowledge, but because of the lack of an ideal tool to analyse knowledge precisely [2,3]. Process and chemical units are usually flammable, explosive, and toxic. For this reason, identifying these hazards is fundamental for ensuring the safe design and operation of these process plants [4].
Since the industrial revolution to the present day, the number of techniques developed to prevent accidents in the process industry is increasing. Nowadays, the most known techniques, according to the ISO 31010, are: PHA, HAZOP, What If Analysis, FMEA, FMECA, ETA, FTA, BOWTIE, BAYESIAN NETWORK, HAZID, and LOPA known already in literature [5]. Therefore, systemic safety evaluation must be performed in those units [6].
Hazard and operability study (HAZOP) is applied worldwide to process hazard analyses for processing plants [2,7]. It is considered a proper, organised, and critical examination used to evaluate the potential hazards obtained for malfunctioning equipment and property in terms of the resultant impacts of either new or existing process facilities [7,8]. Dunjó [8] performed the first review of all existing HAZOP literature from 1974 to 2010. The focus was on studies in chemical process facilities and related units. Compared to the other risk analysis methods: Fault Tree Analysis (FTA), Failure Modes and Effects Analysis (FMEA), Facilities Risk Review (FRR) and Quantitative Risk Analysis (QRA), HAZOP methodology is a means-term among them because, in addition to identifying and estimating risks, like most, it is an excellent tool for recommendations. Dunjó [8] observed that HAZOP is the most studied Preliminary Hazard Analysis (PHA) method; in fact, much research has focused on retrofitting HAZOP as process systems evolved. However, the one and only HAZOP Pattern needs to be improved (for example, it does not include guidance on how to delimit nodes in a process). Based on the revised documents, HAZOP was found to be the foundation of process safety and risk management programs.
Modern literature presents numerous applications of the HAZOP methodology as a risk analysis tool in the most diverse industrial segments, showing its relevance. For example, Sauer [9] performed a risk analysis of the start-up procedures of an IEA-R1 reactor applying the HAZOP technique. The objective of the study was to predict which undesirable consequences could be generated due to possible deviations in the procedures of execution of reactor start-up routines and to evaluate the effectiveness of the method when applied for analysis of procedures. Sauer [9] analysed 53 reactor start-up instructions and determined 74 possible procedural deviations. These deviations resulted in 25 change recommendations covering aspects of reactor design, operation and safety, of which 11 were implemented in the facility’s procedures and systems [9].
Benedetti-Marquez [10] applied the HAZOP methodology to identify and analyse the operability risks associated with a liquid ammonium nitrate storage tank in a petrochemical plant in Colombia’s Caribbean region. Among the analysed parameters, it was observed that: (i) temperature is a key factor, not exceeding the range (130–150 °C); otherwise, an explosion will occur; (ii) the pH of the tank must be monitored and controlled; and (iii) as well as the flow to the pumps at the outlet of the tank, so that cavitation is avoided.
Most deviations were classified as moderate (acceptable with risk control). It was observed that the tank has the necessary instrumentation to keep the temperature and pressure parameters under control; however, continuous monitoring is recommended due to possible human errors. Any deviation from normal parameters in this process can result in the decomposition of ammonium nitrate followed by the explosion [10].
Although HAZOP is an efficient and well-organised technique, it has its limitations. Baybutt [11] clarifies the limitations of the method. The researcher explains that teams can lose scenarios, later thoughts can be neglected, participants can become complacent, the process can be complex, the terms used can be confusing, and studies can have a decreasing focus and be prolonged. Another limitation of the technique is the time required to perform a complete examination of an installation [12]. Depending on the size of the plant, it can take from 1 to 8 weeks for a team of at least five members to complete the task [13]. Less experienced teams do not have the necessary knowledge to understand the problems associated with each guide word [14].
Nowadays, many authors very often use computational simulators to assess future scenarios. Di Nardo [5] analysed a plastic moulding plant with a scenario of risk of a massive fire using the integration between System Dynamics and Layers of Protection Analysis technique is provided to enhance risk management results. The results obtained showed that the probability values related to the various scenarios presented were extremely low, on the order of 5% growth for scenarios whose main event was the occurrence of fire within the facilities.
Mitkowski [15] applied the HAZOP methodology for risk analysis in supply chain management (SCM), to identify risks in organisations modelled with the Collaborative Planning, Forecasting, and Replenishment (CPFR) model. In addition, the author figures out that the keywords used commonly by the chemical industry also works perfectly for the supply chain. Fuentes-Bargues [16] performed a risk analysis at a fuel storage terminal using HAZOP and FTA. The HAZOP analysis showed that the loading and unloading zone is the most sensitive within the plant inside a fuel storage terminal. The FTA analysis indicated that the fuel spill is the most likely event to occur in the tanker loading area. The results of the FTA allowed for prioritising preventive and corrective measures to minimise the probability of failure.
Single [17] developed a programmed logical reasoning algorithm (ontology-based computer aid for the automation of HAZOP studies) based on an ontology which, through the modelling of causal relationships and automatically generated risk scenarios, proved to be very suitable to identify hazardous scenarios and operability problems. Marhavilas [18] performed a case study in the sour-crude-oil process industry (SCOPI), where he proposed a joint analysis using (i) a multi-criteria decision-making technique (MCDM) of the Hierarchical-Analytical-Typical Process (T_AHP) and Process-Hierarchical-Analytical-Fuzzy (F_AHP) with (ii) the Hazards and Operability method (HAZOP), respectively, focusing on deviations with an economic/health/environmental impact.
Da Costa [19] used the HAZOP technique combined with the FTA technique to calculate the Safety Integrity Level (SIL) in the C.5-01 reactor of an oil refinery unit in Balikpapan-Indonesia. The process consisted of mixing naphtha and recycled hydrogen gas in the main reactor through feed inlets and process exchanger equipment. The data were processed and analysed to assess the SIL level of each component. Three nodes of the unit were analysed: reactor-stage 1, reactor-stage 2 and reactor-stage 3. Of the 11 components analysed, four components were in the category of potentially high risks, one with moderate risks and six with low risks. The temperature was the most unstable parameter. For this reason, the parameter that required the most attention and treatment [19].
Since HSE (Health, Safety and Environment) engineering issues are rarely taken into account in risk studies, Choi [2] proposed the HSE-HAZOP. Whereas classic HAZOP involves analysis based on deviations, regardless of item characteristics, HSE-HAZOP classifies possible events according to item characteristics. The HSE-HAZOP marks the flow that deals with the toxic service in the PFD (Process Flow Diagram) and selects it as a basis for analysing accident scenarios [2]. For example, in a tank loading/unloading installation, manual operator operation is involved, so human error is considered, but, if direct operator operation is not involved in process operation, such as a heater, the human error is not considered. In summary, HAZOP studies have been used for more than 40 years with great success within chemical and the petroleum industry to obtain safer, more efficient and more reliable oil production units [4].
This paper is a critical analysis of the classic HAZOP methodology used to describe a case study of a Crude Oil Production Unit (COPU) that, for the first time, performed HAZOP study as a risk analysis methodology in its facilities. The study contributions demonstrate from the results presented that, despite the classic HAZOP being questioned by several researchers, it still remains an effective tool for detection, analysis and mitigation of risks. However, the paper also suggests that the methodology can be improved when combined with other event forecasting techniques. HAZOP methodology also aided the decision-maker of the company’s top management team to continue using HAZOP as the standard technique for risk analysis of the production unit.
This study aims to apply HAZOP methodology in a real case of a Crude Oil Production Unit (COPU) to identify potential hazards that may result from operational problems and how this tool is useful in providing essential knowledge for company leaders, decision-makers and operations managers. This procedure was the first examination carried out after five years of the unit operation. This paper is organised into five sections: (1) the introduction, (2) process description and methodology, (3) case study, (4) results and discussion, and (5) conclusions.
2. Materials and Methods
This section gives a brief technical description of the COPU and its main equipment.
2.1. Production Unit Description
The COPU was projected to produce, process, and transport 10 Mbpd (Millions of barrels per day) of 33° API (American Petroleum Institute) crude oil. The produced gas associated with the oil (approximately 10 MMscfd Million standard cubic feet per day) is separated in the plant facilities. Produced water (approximately 10 Mbwpd Millions of barrels of water per day) is also separated and treated in the plant facilities to be re-injected in a water injection well. After dehydration, salt removal, and RVP (Reid Vapor Pressure) conditioning, the oil is stored in tanks before being pumped to the custody transfer point facilities.
2.1.1. Oil Treatment
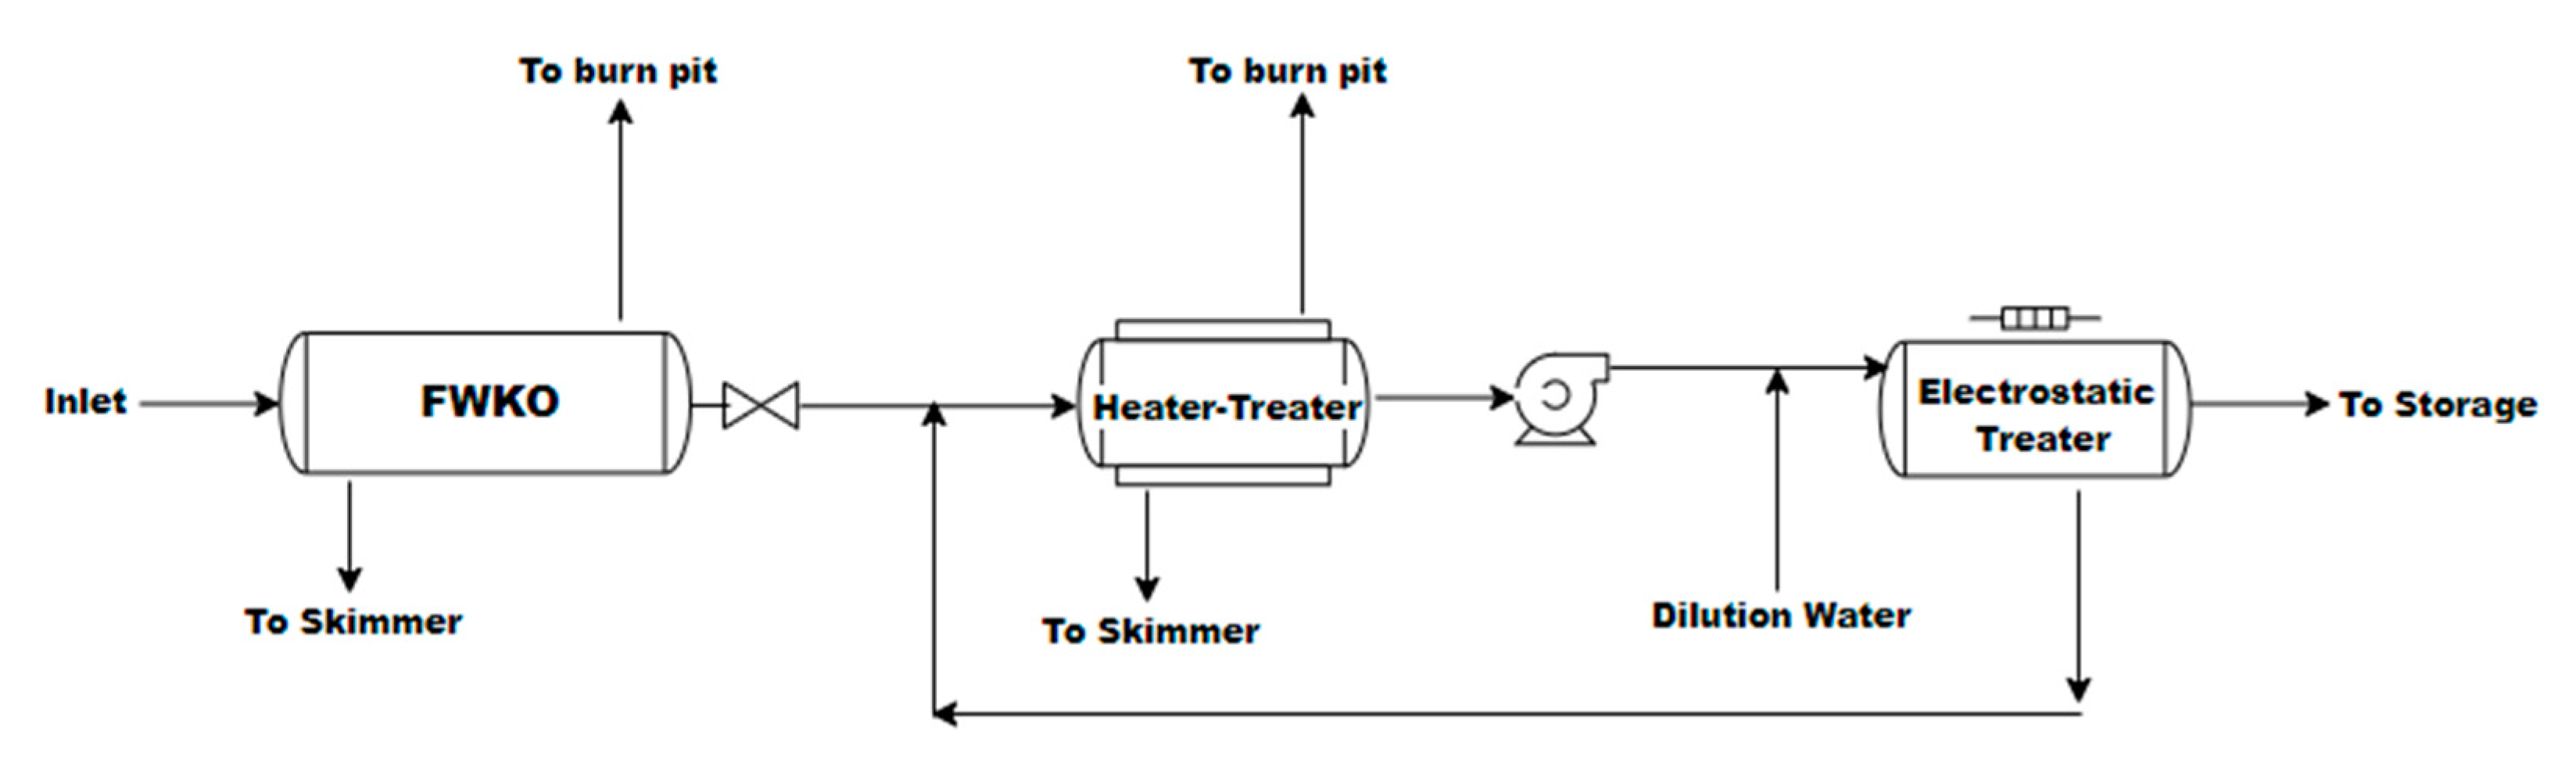
Crude oil from field production composed of gas, oil and water enters the plant to the first separation equipment, the free water knock-out drum (FWKO), where the first bulk water separation is performed. This FWKO vessel is a three-phase separator with enough capacity to separate most of the free water-fed along with the field inlet stream. The FWKO drum also has sufficient liquid holdup time to withstand any eventual slug produced in the feed pipelines. Water removal efficiency is assumed to bring 15% BS&W (Basic Sediment and Water) in the oily outlet stream for this separator. Separated water is conducted to the water treatment facilities to be treated. The separated gas is removed to be used as fuel gas, and excess gas is burnt in the burn pit.
Oily stream from FWKO enters the Heater–Treater separator, which combines a three-phase separator with a heating media using a fuel gas firetube to heat the inlet stream to the required temperature needed to achieve the desired separation between oil and emulsified water. The ideal temperature for the separation of the water–oil fluid is estimated to be in the range of 150–170 °F. It is assumed that the Heater–Treater’s water removal efficiency produces 0.5% BS&W in the oily output stream.
The oily stream goes from the Heater Treater to the Electrostatic-Desalter’s final conditioning unit for final water and salt removal. This equipment uses an electric field to promote and speed up water coalescence, helping the final separation of the smallest water drops that previous equipment could not remove. The Electrostatic-Desalter water removal efficiency is assumed to produce 0.2% BS&W in the oil outlet.
Fresh well water must be injected before the Electrostatic Desalter to achieve the final dilution required to remove the salt and produce treated oil with less than 15 pounds per thousand barrels (PTB). To economise dilution water requirements, the Electrostatic Desalter removed water outlet is recycled to the Heater–Treater. The same diluting effect occurs since the salt concentration in the Electrostatic-Desalter water outlet is below the salt concentration in the Heater–Treater water inlet. Figure 1 shows the Process Flow Diagram (PFD) of the Crude Oil treatment.
2.1.2. Water Treatment
Separated water from the FWKO, Heater–Treater and sporadic purges from the Electrostatic-Desalter enter the water treatment facilities to remove most of the free and emulsified oil that could come with those water streams.
The first stage in the water treatment system consists of a Skimmer–Tank in which gravity separation is performed through relatively slow velocity profiles and high retention time. The outlet water from this tank has an oil concentration below 200 ppm. Finally, the water produced will be pumped and re-injected into the disposal well.
Table 1 shows the oil and water processes that are developed to satisfy the production parameter. Table A1 (in Appendix A) shows the main equipment and assessors used in COPU HAZOP analysis concerning equipment operating conditions.
2.2. HAZOP Methodology
The preparation process for the HAZOP exam is based on several factors and on the specific objectives of each step, taking into account the sequence of interrogative words: why, how, where and when [7,8]. The HAZOP methodology can be divided into four phases [20]:
- Definition: is the phase where HAZOP team sets the scope and objectives of the analysis, establishes responsibilities, and selects the team.
- Preparation: in this phase the study is planned by the team, essential data are collected, agree on the style of recording, the time is estimated and the schedule is arranged.
- Examination: this step involves dividing the system into parts, selecting a part and defining design intent, identifying deviation by using guide words, identifying consequences and causes, identifying protection, detection, and indicating mechanisms, identifying possible remedial/mitigating measures (optional), agreeing on actions, and repeating for each element and then each part.
- Documentation and follow-up: here, the team records the examination, signs off on the documentation, produces the report of the study, follows up on those actions implemented, re-studies any parts of system if necessary, and produces the final output report.
Whitty and Ford [21] stated that an accurate and complete design representation is necessary to execute a HAZOP examination, which implies at least: (i) a logical (schematic) description, usually based on Piping & Instrumentation Diagrams (P&IDs)–sometimes called Engineering Line Diagrams (ELDs); and (ii) a physical layout of the equipment, usually General Arrangement (GAs) scale drawings, which, together with any other documents required, define the designer’s “design intent” for the system. This is why the HAZOP technique is not performed at the conceptual stage of a project, in the earlier phase of the project, due to the lack of comprehensive P&ID, i.e., any “Piping and Instrumentation Diagram” at that moment [8].
2.3. Relevant Guide Words and Deviations
In the preparation phase of the HAZOP study, the team leader must propose a list of guide words to be used to examine the facilities [4]. The choice of words must be made carefully, as a poorly chosen guide word can significantly limit or generalise the study’s focus [20]. Below, some examples of guide words studies and the associated deviations frequently used in the process [20]:
- Deviation type: Negative. Guide word: No. Example interpretation for the process industry. No part of the intention is achieved, e.g., no flow
- Deviation type: Quantitative modification. Guide word. More or Less. Example interpretation for the process industry. A quantitative increase, e.g., higher temperature or quantitative decrease, e.g., lower temperature.
- Deviation type: Qualitative modification. Guide word: As well as or Part of. Example interpretation for the process industry: impurities present simultaneous execution of another operation/step, or only some of the intention is achieved. i.e., only part of an intended fluid transfer takes place.
The HAZOP team uses the guide words to investigate the potential hazards. First, a node is analysed until all the forecasting possibilities are exhausted. Then, the procedure moved to the next node and made the same process until all the nodes were analysed. The causes are identified, the consequences are estimated, and safeguards are established to help detect, prevent, control, or alleviate hazardous scenarios. Finally, recommendations are made when safeguards are insufficient to mitigate the problem [18,22].
3. Case Study: HAZOP Analysis of a Crude Oil Production Unit
The analysis was conducted by the HAZOP team leader and supported by a secretary. Engineers from the operating company (production engineer, maintenance engineer, safety, health and environment engineer, and a facility engineer) also participated in the study. The complete examination of the facilities took five days to be carried out, with an average duration of 8 h of analysis per day.
For analysis, the entire installation was divided into 13 areas or key points designated by nodes, which corresponds to 100%. Only the results of the first six nodes, approximately 50% of the installations, were presented and analysed in this paper. Table A2 describes the nodes briefly. The steps that comprise a HAZOP analysis are described below:
- (i)
- Selection of nodes: the nodes were defined according to the functioning and operation of the equipment and accessories in their neighborhood. The six nodes examined during HAZOP sessions are briefly described in Table A4.
- (ii)
- Choice of guide words and process limits: words that describe the unit’s process parameters (pressure, temperature, flow, level and corrosion), associated with words that indicated deviations in the normal operation of the unit, called guide words (high, low, none, inverse/reverse, and other). The combinations of these words used throughout the analysis/study that assigned indicators of equipment functioning (nodes), showing whether they would be operating inside/outside the standard (deviations) of operation, allowing the identification of hazards—for example, high pressure, low temperature, or none flow.
- (iii)
- Identification of the source of deviations or causes of hazards: with the system divided into smaller sections and each one with the parameters and keywords adequately identified, the risk analysis was carried out by testing the hypothesis of improper functioning of the equipment. Based on the probable trends of deviations observed, it was sought to predict the result, that is, the consequences. If the variation in the parameter represented a hazard, that problem was documented, and its impact was later estimated.
- (iv)
- Risk frequency analysis: the frequency analysis was made based on estimates of the probability of occurrence of scenarios that were predicted to be dangerous. The frequencies were synthesised using models of frequency estimates. Synthesising the frequencies involves determining combinations of failures and circumstances that may cause the scenarios of interest, using the consulting firm’s procedure manual (adapted from BS IEC 61882: 2001) [20].
- (v)
- Determination of consequences: the analysis of the consequences was based on the statistically estimated results of a target population regarding the risk of interest and the effects on safety/health related to this level of exposure (Criteria described in the CCPS manual, 2011). Consequence estimates were made according to a risk matrix (Table 2), measuring the level of impact of the consequences in association with safety, environment, and economy [23].
- (vi)
- Setting barriers: to prevent the consequences of the identified risks from being implemented, measures were taken to mitigate or eliminate these risks; these measures were established to prevent the progress of a situation that could become potentially disastrous; for this reason, the measures are called barriers. These barriers were recorded on the HAZOP sheet.
- (vii)
- Recommendations: at the end of the assessment, recommendations were made on the potential hazards identified in the previous steps to reduce the level of risks analysed and discussed by the HAZOP team.
3.1. The Sequence of Activities Performed during the Sessions
In the first session, the PIDs and PFDs of the oil production unit were exposed, and the main equipment operating in that unit and the entry and exit lines were identified, as well as the devices attached to them. The operating boundaries were then delimited, and the nodes or nodes around the equipment and the surrounding region were marked using dashed lines with different colours, one colour for each node to facilitate the distinction.
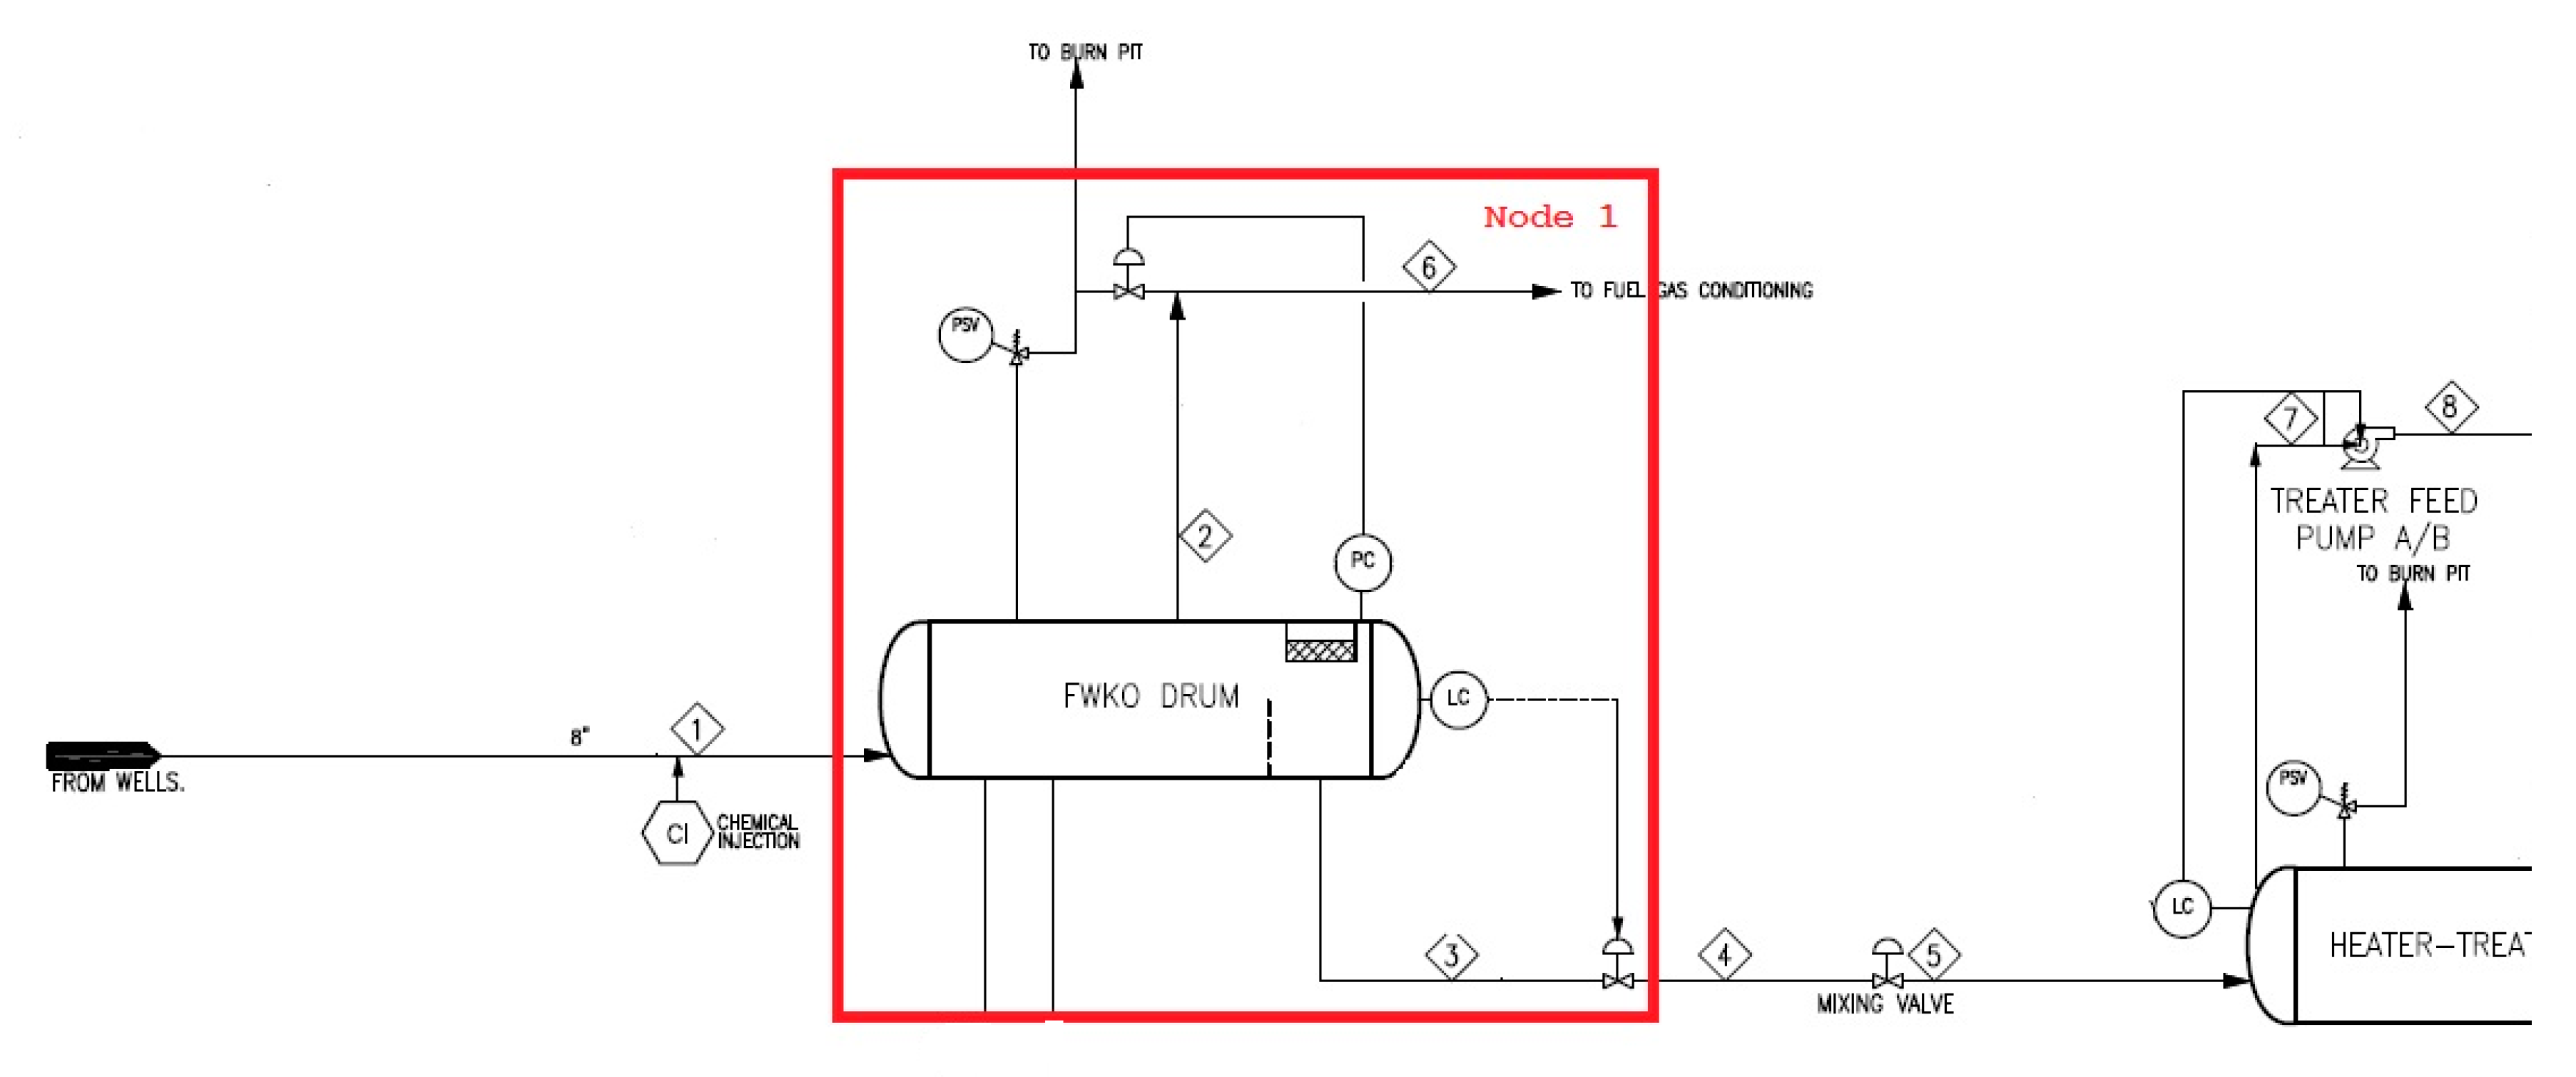
The first node comprised the first separator vessel in the primary crude oil separation system, V-001 and the lines associated with it. The general elements of the process were analysed: pressure, flow, level, temperature, risk of starting and/or stopping operation and corrosion. The second node involved the second separator vessel in the primary separation system for crude oil, V-002 and its lines. The general elements of the process were also analysed: pressure, flow, level, temperature, risk of starting and stopping operation and corrosion. The third node covered the system of lines that conduct the gas to the burner or flare. The fourth node comprised the degassing system and associated lines. In this part of the unit, the analysed parameters were: pressure, flow, temperature, risk of starting/stopping and risk of fire/explosion. The fifth node corresponded to the third separator vessel in the primary separation system for crude oil from V-002 and its associated lines. The sixth node included the water system for dilution in the primary separation system for crude oil. In all nodes, the general elements of the process analysed were: flow, level, risk of starting and stopping operation and corrosion/erosion.
Due to the size of the crude oil production and processing facilities, the number of nodes and the amount of information processed, in this study, all nodes will not be detailed. Thus, to illustrate clearly, and for academic reasons, the study focuses on the analysis made in the first node of that unit, as shown in Figure 2.
3.2. Risk Classification Criteria
Risk classification is a management tool to prioritise the monitoring of recommendations. The identified hazards were classified by criteria, at levels: low, medium and high. In addition, they were grouped into categories according to the harm to people, environment, assets/property of the company, and impact on the company’s image.
The frequency of the cause and the severity of the consequence were defined according to BS IEC 61882: 2001, which considers the simplest combination of probability and severity (see Table A3). The current criteria reflect the belief that the risk rating performed during the HAZOP studies should be used only to determine qualitative properties for priority recommendations. It is important to note that the criteria stipulate that the values of severity and probability should be assigned consistently throughout the study. The risk classification should be used only to prioritise recommendations, not for quantification.
The HAZOP registration sheets were used to record both the sources of risks and their consequences, as well as the barriers that were set/inserted, without forgetting the recommendations.
4. Results
The results of the HAZOP analysis performed on node 1 are shown in Table A3, Table A4, Table A5, Table A6, Table A7, Table A8 and Table A9. All tables with the results for node 1 are listed in the Annex. Thus, the HAZOP sheet serves as a guiding document for implementing measures to mitigate hazards by the operation/maintenance teams of the facilities. The first element analysed was pressure (Table A3), in two circumstances, when the pressure was higher than the normal value (high pressure) and when the pressure was lower than the normal value (low pressure). In both cases, the identification of the possible cause of the values of the pressure parameter increasing or decreasing beyond the tolerable values pointed to a failure in the circuit where the pressure valve failed to act appropriately, PV-101 (Pressure Valve—101).
The second element analysed was the flow rate (Table A4). This element was analysed in four circumstances: (i) when the flow rate was higher than the normal value (high flow); (ii) when the flow rate was lower than the normal value (low flow); (iii) when the flow follows a reverse flow (in this case, the event did not occur) and (iv) when the flow follows another direction (another flow), i.e., when the flow goes to areas to which it is not directed. In this situation where the element analysed was the flow, the main cause of failure was the safety system where the sensor of maximum or minimum opening of the flow valve was responsible for the event.
The third element was the level (Table A5 and Table A6), which was analysed in two circumstances: (i) when more liquid was entering into the separator vessel (high level), i.e., when more liquid entered in the separator vessel than the acceptable level; and (ii) less liquid was entering into the vessel (low level), that is, when less liquid entered the separating vessel than what is acceptable. In both circumstances, the main cause was the malfunction of the level valve, LV–101 (Level Valve–101).
The fourth element analysed was the temperature (Table A7). The fifth element was the corrosion or erosion that may occur in some equipment elements (Table A8). The sixth element was the start and shut down element (Table A9).
4.1. Pressure
Regarding the pressure, the “high pressure” deviation would be caused by a failure of the pressure gauge or by the malfunction of the pressure valves, which, in turn, would cause more pressure inside the vessel. The “low pressure” deviation does not apply to this node; however, it is a deviation considered important for the integrity of the vessel and the substance. For this reason, as a safeguard, it is advisable that the use of the safety valve must be included in the periodic calibration program to ensure its correct operation.
In similar studies, Benedetti-Marquez [10], Ibraim and Syed [24], and Ishteyaque [25] noted that the causes of more pressure are pressure safety valve (PSV) failure, compressor malfunction and pump backflow. As a consequence, it causes damage to the pump. As a safeguard, it proposes using an alarm, a controller and a pressure indicator. Marhavilas [18] pointed out as causes of more pressure, failure of the pressure indicator, blocked line and leakage of raw steam. As a consequence, the fracture of the line, oil spill, risk of fire and release of H2S. To mitigate the possible problems, H2S alarm and fire alarm were proposed to safeguard the installation of the PSV [16]. For Kletz [26] and Cozzani [27], these deviations may be caused by a failure in the pressure valve manometer, failure of the pressure sensors, error in the safety circuit or calibration error of the manometers. As a safeguard, it is suggested to install a pressure control valve, installation of pressure alarms, periodic inspections and maintenance of valves and sensors [18,28].
4.2. Flow Rate
Regarding the flow entering to the separator, it was assumed that it could be increased or reduced; “high flow” when the flow valves are fully open or “low flow”, “no flow” or “flow reverse” when the pumps are stopped, or the wells are partially shut down. The study pointed out that the causes of the variations in the flow were the failure of flow control valves (FCV), valve malfunction, pump failure, valve opening and closing failure and sensor indicator malfunctions. Consequently, flaws in the production process, an increase in temperature values and the possibility of the collapse of the pipes were observed. On the other hand, to solve the problems, periodic inspection of valves and equipment, use of flow alarms and verification of lines and systems are recommended.
Jagtap [29], Ibraim and Syed [24] claim that the causes of too much flow are: (i) fully open flow valves; (ii) faulty flow regulating mechanism; (iii) out-of-calibrated controller and (iv) pump failure. Consequently, the pressure increases rapidly in the pipeline; therefore, the likelihood of leakage and explosion increases. The researchers also claim that the causes of less flow are the partial opening of the outlet valve, rupture of the flow inlet pipe to the vessel due to mechanical damage and minimal leakage in the pipe [16]. As a result, there is less release of crude oil into the environment and the possibility of increased pressure in the storage line.
In addition, Sikindar [28], Benedetti-Marquez [10] and Marhavilas [18] pointed out as causes of more flow, leaving the flow valve fully open, temperature increase and flow valve failure. Consequently, there would be low stabilisation of crude oil, increased pressure in the vessel, line rupture, oil spillage, fire risk and H2S release. As a safeguard, the installation of a PSV with an automatic opening mechanism, H2S alarm and fire alarm were recommended.
4.3. Level
Regarding the effect of the level parameter, two scenarios were assumed: low level and high level. The “high level” deviation may be related to the non-stopping of the pumps during the activities, failure of the level transmitter during the transfer or due to the entry of flood water in the vessel or tank. As a result, there may be oil spills, causing environmental impact and possible effects for people. It is recommended to place the vessel in a safe space with a second spill containment tank and check that the level transmitter signals are being transmitted well.
Benedetti-Marquez [10] and Ibraim and Syed [24] found that the causes of more level in the vessel are: (i) vessel without supervision or inspection; (ii) failure of the level indicator; (iii) wrong valve opening and (iv) alarm that does not work correctly. On the other hand, Ibraim and Syed [24] point out as causes of the lower level, cracking or corrosion of the vessel, damage to the vessel body seal, weak joints between the ceiling and the vessel structure and damage to the valves and flanges.
Benedetti-Marquez [10] and Ishteyaque [25] indicated the causes of high levels such as failure of the open LCV (Level Control Valve), increased discharge pressure and blocked outlet valve. Consequently, floods, loss of production and flow migrating to another direction may occur. As a safeguard, installation of an alarm of high liquid level, use of LIC, and constant monitoring of the system are recommended. Ishteyaque [25] and Orugba [30] further pointed out, as causes of the low level pump, failure and malfunction of the level meter. The main consequences of Low Flow are emptying of the vessel and loss of production. As safeguards, it is recommended to use a LIC to operate the pump, make adequate monitoring and periodic maintenance.
4.4. Temperature
The temperature may also be low or high. The reasons underlying these deviations may be the failure of the high-temperature controller, reflux controller, a fully open reflux flow control valve and faulty supply temperature controller. It was recommended to use high-temperature alarms, maintain the column temperature controllers, regularly check and maintain the flow lines and valves, and frequently check the tubes of the heat exchangers.
Jagtap [29], Sarsama [31] and Ishteyaque [25] observed that the causes of the high-temperature deviation might be due to more steam entering the heat exchanger system, which will heat the vessel due to a failure in the temperature indicator. Benedetti-Marquez [10] also noted that the deviation would cause uncontrolled heating of the hydrocarbon in the vessel, consequent decomposition and risk of explosion. As mitigation, it is recommended to inspect the tank and calibrate the sensors periodically.
Jagtap [29] and Ishteyaque [25] observed that the causes of the deviation of “low temperature” can be due to the shutdown of the steam that feeds the heat exchanger, which, in turn, is due to the failure of the refrigerant temperature meter and failure of the supply of steam to the line tracing. The low-temperature deviation would result in the crystallisation of hydrocarbons and clogging of the lines, and loss of production. The recommendation is to install a temperature transmitter in the recirculation line of the storage tank with an alarm. In addition, a low steam flow alarm is recommended.
4.5. Starting or Stopping
It was observed that the procedure for starting or stopping the installation could also affect the production operations of the unit. If the flow is misdirected due to operational errors during start-up, the error will cause operational problems and economic losses; another abnormality that can occur during the start of the production unit is the lack of heat in the lines, which can cause incrustations or paraffin of hydrocarbons embedded in the pumps before starting.
Benedetti-Marquez [10] and Cozzani [27] stated that these operational errors cause line clogging, delay in starting, economic loss, damage to the pump, heating and/or decomposition of the oil into lighter fractions that can lead to the explosion. To minimise these risks, Kletz [26] and Orugba [30] recommend inserting protections such as low flow alarm, as well as turning off the suction pump if low amperage, low vibration, high temperature or low/high pressure are detected in the pump discharge.
4.6. Paradigm of the HAZOP Methodology
The classic HAZOP methodology (which is not quantitative) shows its fragility when dealing with high-level risks, especially for complex operations in the upstream sector of the oil industry [32]. However, despite the patent limitations of the HAZOP methodology, it remains an excellent risk analysis tool, as evidenced by some studies found in the literature. Kletz [26], Dunjó [8], Kolberg [33] and Rausand [34] showed that the HAZOP methodology is a systematic and structured technique. Borelli [35], Pasman [13], Jagtap [29], Taylor [36] and Marhavilas [18], among others, proved that it is possible to combine the technique with other tools and increase its efficiency.
5. Conclusions
The paper brings up the discussion made over the years by researchers concerned with HAZOP studies. Is HAZOP methodology still an efficient tool for analysing complex units such as COPU? For these aims, a real case study was developed to reinforce the theoretical framework given by literature:
- The main contribution of this study was to demonstrate the efficacies of HAZOP methodology to identify potential hazards that may result from operational issues in a COPU and as a useful tool to provide essential knowledge for the company’s leaders, decision-makers and operations managers.
- The literature and discussion section bring up the certainty that, although many researchers see HAZOP methodology lacking a lot, it is still ideal for process analysis.
- From the study case, 80 causes of deviations were identified; it generated 71 risk scenarios that required the application of approximately 60 safeguards or barriers and 47 recommendations.
- Among the main causes of deviation, there were safety flaws in the installation, followed by equipment failures. Furthermore, the measures to solve the problem were based on safeguards and recommendations to the installation of sensors and security alarms, as well as the periodic maintenance of the installation.
Although the benefits of operational HAZOP analysis of COPU are satisfactory, the model does not contemplate human factors. Then, some risks included negligence:
- The above-stated findings are beneficial and conclusive for the safety of oil production operations. However, some limitations were noted: the experience of the HAZOP team influences the efficiency of the results, and the analysis time was not enough. The methodology should be reinforced with the same quantitative tools or support decision tools.
- This paper fails in not presenting all aspects of HAZOP analysis, focusing only on the analysis of process and operations risks, leaving aside the risks resulting from human decisions—Human HAZOP and Procedure HAZOP—as well environmental risk scenarios.
In fact, the risk of accidents is never reduced to zero, only reduced to a tolerable margin, as proven by the study. Once the recommendations are followed, a new study should be scheduled to prevent future risks.
Author Contributions
Conceptualisation, J.C.M.P.; methodology, A.d.J.P.; software, A.d.J.P.; investigation, A.d.J.P.; writing—original draft preparation, A.d.J.P.; writing—review and editing, J.C.M.P. All authors have read and agreed to the published version of the manuscript.
Funding
This work was financially supported by the Base Funding—UIDB/00511/2020 of the Laboratory for Process Engineering, Environment, Biotechnology and Energy—LEPABE—funded by national funds through the FCT/MCTES (PIDDAC); J.C.M.P. acknowledges the FCT Investigator 2015 Programme (IF/01341/2015). A.J.P.acknowledges the Angolan Executive Training Program and Companhia Total E.P. for funding the 3rd edition of the Master’s Program in Environmental Engineering.
Institutional Review Board Statement
Not applicable.
Informed Consent Statement
Not applicable.
Acknowledgments
The authors would like to thank the Postgraduate Department at Universidade Agostinho Neto and LESRA—Laboratory of Engineering, Separation, Reaction and Environment.
Conflicts of Interest
The authors declare no conflict of interest.
Appendix A

Table A1.
Main equipment of the Crude Oil Production Unit.
| Nr. | Equipment | Basic Technical Clarifications |
|---|---|---|
| 1 | Vessels | V-001: Free Water Knock Out—it is a three-stage separator vessel used to remove free water from crude oil–water emulsions and gas, using the variations of densities of these substances. |
| V-002: DP Electrostatic Heater treater—it is a dehydrating vessel. It consists of a pressure vessel with a heating/degassing section and fire tubes, an oil spill over the box, and a coalescing section with metered orifice distributors. | ||
| V-003: Dual Polarity Electrostatic Desalter—it is a dehydrating and desalting vessel. Electrostatic fields generate forces that can create conditions for improved coalescence of water droplets, resulting in improved water separation from the crude oil. | ||
| V-203: Fuel Gas Scrubber—fuel Gas Scrubber or Knock-out (KO) drum or mist eliminators remove the entrained liquid droplets and slugs from the vapour stream. | ||
| V-204: Fuel Gas Scrubber—it assists in removing free liquids present with incoming gas and helps prevent overloading of downstream final filter elements. | ||
| V-008: Pump Degasser—the device that degasses liquid mechanically without using any chemical. When pumping liquid flows through the orifice into the intake part of the pump, the dissolved gas in the liquid is separated from the liquid by decompression, and the generated gas–liquid mixture is fed to the inducer. | ||
| 2 | Heat Exchangers | E-001: Oil Heat Exchanger is a device that transfers heat from one medium to another. Heat is transferred by conduction through the exchanger materials, which separate the mediums being used. |
| E-101: Water—Water Heat Exchanger—freshwater flows in and circulates around the hotter wastewater that flows out in a typical water heat exchanger. The wastewater transfers its heat energy to the freshwater through the interior walls, heating the freshwater, typically to over 100 °F, and cooling the wastewater as it exits the unit. | ||
| E-201: Fuel Gas Heat Exchangers capture exhaust gas and transfer the heat to different energy-consuming parts of your installation. | ||
| 3 | Pumps | P-004: Crude Transfer Pump A/B it is designed to deliver the liquid (oil or water) from the metering tank (or buffer tank) into the storage tank or mobile tanker or pump the crude oil from a tank to a burner (pump pressure ≧ 2 Mpa) or into an existing flowline. Screw and centrifugal pump designs are available. |
| P-202: Slop Oil Pump is a device used to transfer reclaimed petroleum waste mixtures of oil, chemicals, and water derived from a wide variety of processes in refineries or oil fields. | ||
| P-205: Drain Sump Pump A/B is a pump used to remove water accumulated in a water-collecting sump basin. | ||
| P-203: Desalter and Sand Jet Water Pumps—Jet pumps can be used for material handling, either for transfer or for washing by use of the cavitation that can be induced to break up clays, soils, oil etc. | ||
| 4 | Compressors | KAE-001: Gas Lift Compressor a device used to comprise gas and injects gas into an oil well to aerate the crude oil, increasing production. |
| K-201: Air Compressor A/B the working principle of compressors are similar to pumps; both increase the pressure on a fluid, and both transport the fluid through a pipe. As gases are compressible, the compressor also reduces the volume of gas. | ||
| 5 | Tanks | TK-201: Slop Tank is an oil tanker used to collect draining’s, tank washings and other oily mixtures. |
| TK-202: Utility Water Tank—a water tank is a container for storing potable water. | ||
| 6 | Control Valves | Pressure Control Valve—a pressure control valve can protect a system from the damages caused by excessive pressure. These valves can do the pressure control of a system; an example of this is, using a line relief valve to limit the maximum allowable system pressure. |
| Level Control Valve—a level control valve maintains a constant level in a liquid supply such as a reservoir. Level control valves regulate the flow into the liquid supply, which maintains a constant level to meet the usage demands. | ||
| Flow Control Valve—a flow control valve regulates the flow or pressure of a fluid. Flow control valves normally respond to signals generated by independent devices such as flow meters or temperature gauges. |
Table A2.
Nodes selected for HAZOP analysis.
| Nodes | Operating Parameters |
|---|---|
| 1. Separator V-001 and associated lines. | P-60 psig; T-130 °F Operating conditions: 125 psig a 200 °F Heat exchangers E-001. |
| 2. Separator V-002 and associated lines. | P-40 psig; T-130 °F Operating conditions: 125 psig a 200 °F Heat exchangers E-001. |
| 3. Fuel gas for separator V-002. | Fire tube heater section P-30 psig; T-350 °F Operating conditions: 75 psig a 500 °F |
| 4. V-008 degasser and associated pumps. | P-35 psig; T-350 °F Operating conditions: 75 psig a 195 °F Pumps P-004 A/B: Q = 10100 BWPD a 70 psig (diferential). |
| 5. Separator V-003 e associated lines. | P-75 psig; T-150 °F Operating conditions: 150 psig a 300 °F Heat exchengers E-001 and E-101. |
| 6. Dilution water. | Nominal capacity: 1232 bbl Desalination pumps and sandblasting P-203 A/B Water supply from V-002 and V-003. |
Appendix B. HAZOP SPREADSHEETS
Table A3.
HAZOP analysis of Pressure Element—Node 1.
| Node | 1 | Separator V-001 and Associated Lines | ||||||
|---|---|---|---|---|---|---|---|---|
| Element | Pressure | |||||||
| Guideword | Deviation | Possible Cause | Consequences | Safeguards | Risk Matrix | Recommendations | ||
| F | S | R | ||||||
| More | More pressure in crude input line and separator vase V-001. (1. Higher Pressure) | 1. PV-101 loop closed failure. 2. Spurious shot of the SDV-30010. | 1. Pressurisation of V-001 and associated lines. 2. Release of flammable material. 3. Material damage. 4. Injuries to people. 5. Oil spill and contamination. 6. Loss of production. | 1. PSV-101 A/B. PAHH-102 with closing action SDV-30010. | B | IV | M | 1. Update the PID: R-AH0004-713-1001, REV.3; PSV-101 A/B. Listed as fire, but projected as full flow. 2. Reassess and reactivate the platform well shutdown and safety system. |
| Less | Low pressure in the crude input line and separator vase V-001. (2. Lower Pressure) | 1. PV-101 loop open failure. 2. Leakage on pipeline or pipeline fracture. | 1. Depressurisation of V-001 and associated lines. 2. Material damage. 3. Stop generators. 4. Impossibility of discharging fluids V-001. 5. Unit shut down. | 1. None. | B | I | L | 3. Confirm if the PIT-101 has a low-pressure alarm active in the control room and, if necessary, activate. |
Table A4.
HAZOP analysis of Flow Element—Node 1.
| Node | 1 | Separator V-001 and Associated Lines | ||||||
|---|---|---|---|---|---|---|---|---|
| Element | Flow | |||||||
| Guideword | Deviation | Possible Cause | Consequences | Safeguards | Risk Matrix | Recommendations | ||
| F | S | R | ||||||
| More | More flow in the separator vessel and in the vessel outlet lines. (3. High Flow) | 1. Commissioning of the gas lift compressor 2. Full opening of the well flow valves. | 1. None. | 1. None. | C | I | L | 4. Check that the PIT—101 has a high flow alarm active in the control room, and confirm that it is active. |
| Less/None | Less flow in the separator vessel and the vessel outlet lines. (4. Low Flow/None) | 1. Spurious firing of the SDV-30010 2. Partial shutdown of the wells (electrical system failure). | 1. Stop generators. Plant shutdown (SD 2). Impossibility of discharging liquid in V-001. 2. Operational problems. | 1. FAL-103. 2. Flow control. | C | IV | M | 5. Check if the FIT—101 has a low flow alarm active in the control room, and confirm that it is active. |
| Reverse Flow | None. (5. Reverse Flow) | None. | None. | None. | None. | |||
| Another Flow | Less flow in the separator vessel and the vessel outlet lines. (6. Another Flow) | 1. Leakage of crude oil at the exchanger gasket E-001 | 1. Spill of crude oil and contamination of the environment. | 1. Double containment zone. | C | I | L | 6. Check for leak sensors. |
Table A5.
HAZOP analysis of Level Element—Node 1.
| Node | 1 | Separator V-001 and Associated Lines | ||||||
|---|---|---|---|---|---|---|---|---|
| Element | Level | |||||||
| Guideword | Deviation | Possible Cause | Consequences | Safeguards | Risk Matrix | Recommendations | ||
| F | S | R | ||||||
| More | More liquid in the separator vessel V-001 (7. High Level) | 1. Spurious shot of the SDV—101. | 1. Flooding of the V-0001 vessel. 2. Drag of the liquid into the gas line and treatment unit. 3. Possible damage to the unit’s generators. 4. Unit Shut down. 5. Loss of production. | 1. LAHH-103 with closing action of SDV-30010. LAH-102 with closing action of SDV 30010. | C | II | M | None. |
| More | More liquid in the separator vessel V-001 (7. High Level) | 2. LV-101 closed circuit failure. | Analysed in the previous point. | None. | C | II | M | None. |
| More | More liquid in the separator vessel V-001 (7. High Level) | 3. Spurious shot of the SDV—102. | 11. Flooding of the V-0001 vessel. 2. Drag of the liquid into the gas line and treatment unit. 3. Possible damage to the unit’s generators. 4. Unit Shut down. 5. Loss of production. | 1. LAHH-103 with closing action of SDV-30010. LAH-102 with closing action of SDV 30010. | C | II | M | None. |
| More | More liquid in the separator vessel V-001 (7. High Level) | 4. LV-102 closed circuit failure. | Analysed in the previous point. | None. | C | II | M | None. |
Table A6.
HAZOP analysis of Level Element—Node 1.
| Node | 1 | Separator V-001 and Associated Lines | ||||||
|---|---|---|---|---|---|---|---|---|
| Element | Level | |||||||
| Guideword | Deviation | Possible Cause | Consequences | Safeguards | Risk Matrix | Recommendations | ||
| F | S | R | ||||||
| Less | Less liquid in separator vessel V-001 (8. Low Level) | 1. LV-101 open circuit failure. | 1. Passage of gas through the V-102 degasser. 2. Possible damage to the degasser. 3. Release of flammable material. 4. Spill and contamination. | 1. LAHH-104 with closing action of SDV-101. | B | II | L | 7. Adjust the operating conditions of the cover gas on the TK-101 to allow proper operation of the V-102. |
| Less | Less liquid in separator vessel V-001 (8. Low Level) | 1. LV-101 close circuit failure. | 1. Shipment of gas to V-002. 2. Operational problems. | 2. LAHH-104 with closing action of SDV-101. | B | II | L | Analysed in the previous point. |
Table A7.
HAZOP analysis of Temperature Element—Node 1.
| Node | 1 | Separator V-001 and Associated Lines | ||||||
|---|---|---|---|---|---|---|---|---|
| Element | Temperature | |||||||
| Guideword | Deviation | Possible Cause | Consequences | Safeguards | Risk Matrix | Recommendations | ||
| F | S | R | ||||||
| More | Higher Temperature in vase separator V-001 (9. High Temperature). | 1. None. | None. | None. | None. | |||
| Less | Low Temperature in vase separator V-001 (10. Low Temperature). | 2. Inappropriate opening of the deviation valve on line “6”-PF-A01-5002. | 1. Operational problems on separator. | 1. Periodic check of the valve in line “6”-PF-A01-5002. | B | II | L | 8. Inspection and verification of the valve. |
| Fire/Explosion | None (11.Fire/Explosion). | 3. None. | None. | None. | None. | |||
Table A8.
HAZOP analysis of Corrosion Element—Node 1.
| Node | 1 | Separator V-001 and Associated Lines | ||||||
|---|---|---|---|---|---|---|---|---|
| Element | Corrosion/Erosion | |||||||
| Guideword | Deviation | Possible Cause | Consequences | Safeguards | Risk Matrix | Recommendations | ||
| F | S | R | ||||||
| More | More corrosion. (12. Corrosion/Erosion Risk) | 1. Water system (sandblasting) entry fails. | 1. Breaking of stages in the separator vessel V-001. 2. Loss of internal coating. 3. Possible leakage of hydrocarbons. 4. Spill and contamination. | 1. Calibrated oxygen scavenging peak. | C | I | L | 9. Monitor and calibrate oxygen scavenging system. |
Table A9.
HAZOP analysis of the Start and Stop Procedure Element—Node 1.
| Node | 1 | Separator V-001 and Associated Lines | ||||||
|---|---|---|---|---|---|---|---|---|
| Element | Start/Stop Procedures | |||||||
| Guideword | Deviation | Possible Cause | Consequences | Safeguards | Risk Matrix | Recommendations | ||
| F | S | R | ||||||
| Error | Error on procedures. (13. Start/Stop Risk) | 1. Error in FWKO start-up procedures (without bypass opening). | 1. Possible internal damage to vessel V-001 and accessories. | 1. Commissioning Procedure. | C | I | L | 10. Evaluate the installation of the differential pressure gauge that works on the SDV-30010 (permissive opening). |
References
- Abbasi, S.; Bakhtom, S.; Ziaei, M.; Arghami, S. Comparison of Risk Assessment Using HAZOP and ETBA Techniques: Case Study of a Gasoline Refinery Unit in Iran. J. Human Environ. Health Promot. 2015, 1, 19–27. [Google Scholar] [CrossRef] [Green Version]
- Dunjó, J.; Fthenakis, V.; Vílchez, J.A.; Arnaldos, J. Hazard and Operability (HAZOP) analysis. A literature review. J. Hazard. Mater. 2010, 173, 19–32. [Google Scholar] [CrossRef]
- Di Nardo, M.; Madonna, M.; Gallo, M.; Murino, T. A Risk Assessment Proposal through System Dynamics. J. Southwest Jiaotong Univ. 2020, 55. [Google Scholar] [CrossRef]
- Kang, J.; Guo, L.; Wang, N. A Simplified HAZOP Analysis based on Fuzzy Evaluation of Node Criticality for Chemical Plants. Int. J. Simul.-Syst. Sci. Technol. 2016, 17, 1–6. [Google Scholar]
- Dunjó Denti, J. New Trends for Conducting Hazard & Operability (HAZOP) Studies in Continuos Chemical Processes. Ph.D. Thesis, Universitat Politècnica de Catalunya, Catalunya, Spain, 2010. [Google Scholar]
- Sauer, M.E. Análise dos Procedimentos de Partida de um Reator IEA-R1: Uma Aplicação da Técnica HAZOP; Instituto de Pesquisas Energéticas e Nucleares: São Paulo, Brasil, 2000; p. 142. [Google Scholar]
- Benedetti-Marquez, E.B.; Sanchez-Forero, D.I.; Suarez-Urbina, A.J.; Rodrigues-Urbina, D.P.; Gracia-Rojas, J.; Puello-Mendez, J. Analysis of Operational Risks in the Storage of Liquid Ammonium Nitrate in a Petrochemical Plant, through the HAZOP Methodology. Chem. Eng. 2018, 67, 883–888. [Google Scholar]
- Baybutt, P. A critique of the Hazard and Operability (HAZOP) study. J. Loss Prev. Process. Ind. 2015, 33, 52–58. [Google Scholar] [CrossRef]
- Munn, A. Common Problems and Recent Trends with HAZOPs. IChemE Symp. 2009, 155, 130–133. [Google Scholar]
- Pasman, H.; Rogers, W. How can we improve HAZOP, our old work horse, and do more with its results? An overview of recent developments. Chem. Eng. Trans. 2016, 48, 829–834. [Google Scholar]
- Trujillo, A.; Kessler, W.S.; Gaither, R. Commom mistakes when conducting a HAZOP and how to avoid them. Chem. Eng. 2015, 122, 54–58. [Google Scholar]
- Mitkowski, P.T.; Zenka-Podlaszewska, D. HAZOP method in identification of risk in CPFR supply chain. Chem. Eng. Trans. 2014, 39, 445–450. [Google Scholar]
- Fuentes-Bargues, J.L.; Gonzáles-Cruz, M.; Gonzáles-Gaya, C.; Baixauli-Pérez, M. Risk analysis of a fuel storage terminal using HAZOP and FTA. Int. J. Environ. Res. Public Health 2017, 14, 705. [Google Scholar] [CrossRef]
- Single, J.I.; Schmidt, J.; Denecke, J. Ontology-based computer aid for the automation of HAZOP studies. J. Loss Prev. Process. Ind. 2020, 68, 104321. [Google Scholar] [CrossRef]
- Da Costa, S.R.; Al-Asy’ari, I.I.; Musyafa, A.; Soeprijanto, A. HAZOP study and fault tree analysis for calculation safety integrity level on reactor-c.5-01, oil refinery unit at alikpapan-indonesia. Asian J. Appl. Sci. 2017, 5, 507–517. [Google Scholar]
- Choi, J.-Y.; Byeon, S.-H. HAZOP Methodology Based on the Health, Safety, and Environment Engineering. Int. J. Environ. Res. Public Health 2020, 17, 3236. [Google Scholar] [CrossRef]
- BS IEC 61882:2001. Hazard and Operability studies (HAZOP)–Application Guide; British Standards Institution: London, UK, 2001. [Google Scholar]
- Whitty, S.; Foord, T. Is HAZOP worth all the effort it takes? Inst. Chem. E 2009, 155, 143–148. [Google Scholar]
- Center for Chemical Process Safety. Layer of Protection Analysis, Simplified Process Risk Assessment; American Institute of Chemical Engineers: New York, NY, USA, 2001; p. 270. [Google Scholar]
- Ibrahim, H.A.; Syed, H.S. Hazard Analysis of Crude Oil Storage Tank Farm. Int. J. ChemTech Res. 2018, 11, 300–308. [Google Scholar] [CrossRef]
- Ishteyaque, S.; Jabeen, S.; Shoukat, S. Hazop study on oil refinery waste water treatment plant in karachi. Black Sea Sci. J. Acad. Res. 2017, 34, 38–42. [Google Scholar]
- Marhavilas, P.K.; Filippidis, M.; Koulinas, G.K.; Koulouriotis, D.E. A HAZOP with MCDM Based Risk-Assessment Approach: Focusing on the Deviations with Economic/Health/Environmental Impacts in a Process Industry. Sustainability 2020, 12, 993. [Google Scholar] [CrossRef] [Green Version]
- Kletz, T.A. Learning from Accidents, 3rd ed.; Routledge: London, UK, 2001. [Google Scholar]
- Mkpat, E.; Reniers, G.; Cozzani, V. Process safety education: A literature review. J. Loss Prev. Process. Ind. 2018, 54, 18–27. [Google Scholar] [CrossRef]
- Jagtap, M. Hazard and operability (HAZOP) analysis: A review of basics. Clinition’s Sci. J. 2017, 1, 1–15. [Google Scholar]
- Sikandar, S.; Ishtiaque, S.; Soomro, N. Hazard and Operability (HAZOP) study of wastewater treatment unit producing biohydrogen. Sindh Univ. Res. J. SURJ Sci. Ser. 2016, 48, 131–136. [Google Scholar]
- Orugba, H.O.; Ogbeide, S.E.; Osagie, C. Risk level Assessment of the Desalter and Preflash Column of a Nigerian Crude Distillation Unit. J. Mater. Sci. Chem. Eng. 2019, 7, 31–41. [Google Scholar] [CrossRef] [Green Version]
- Sarsama, J.; Nissilä, M.; Koski, P.; Kaisalo, N.; Tallgren, J. HAZOP report: PEMBeyond Deliverable 6.5. 2017. Available online: http://pembeyond.eu/deliverables/D6.5%20HAZOP%20report.pdf (accessed on 20 October 2021).
- Kolberg, T.A. Evaluation of Subsea7 HIRA (Hazard Identification and Risk Assessment). Master’s Thesis, University of Stavanger, Stavanger, Norway, 2011. [Google Scholar]
- Rausand, M.; Hoyland, A. HAZOP—Hazard and Operability Study. System Reliability Theory. Models, Statistical Methods and Applications, 2nd ed.; John Wiley & Sons: New York, NY, USA, 2011. [Google Scholar]
- Borelli, S.; Ferreira, R.E.; Gabriel, V.; De Campos, F.C. Metodologia HAZOP: Segurança e Sustentabilidade no Processo Industrial. Rev. Eletrônica FACP 2015, 7, 94–108. [Google Scholar]
- Taylor, J. Automated HAZOP revisited. Process. Saf. Environ. Prot. 2017, 111, 635–651. [Google Scholar] [CrossRef] [Green Version]
- Crawley, F.; Tyler, B. Chapter 4: The Detailed HAZOP Study Procedure. In HAZOP: Guide to Best Pratice, 3rd ed.; Elsevier: Amsterdam, The Netherlands, 2015; pp. 13–18. [Google Scholar]
- Galante, E.; Bordalo, D.; Nobrega, M. Risk assessment methodology: Quantitative Hazop. J. Saf. Eng. 2014, 3, 31–36. [Google Scholar]
- Haridoss, S. Health and Safety Hazards Management in Oil and Gas Industry. Int. J. Eng. Res. 2017, V6, 1058–1061. [Google Scholar] [CrossRef]
- International Electrotechnical Commission; International Electrotechnical Technical Commission. Hazard and Operability Studies (HAZOP Studies) Application Guide; IEC: Geneva, Switzerland, 2016. [Google Scholar]
Figure 1.
Simplified process flow diagram of crude oil treatment.

Figure 2.
Simplified process flow diagram of node 1.

Table 1.
Oil and water requirements.
| Oil | |
| RVP | 7 psia |
| Salt concentration | 15 PTB |
| BS&W | 0.5% |
| Water | |
| Oil concentration | 20 ppm |
| Solids | 20 ppm |
BS&W—Basic Sediment and Water; RVP—Reid Vapor Pressure; PTB—Pounds per Thousand Barrels.
Table 2.
Risk matrix.
| Risk Classification Matrix | Frequencies | |||||
|---|---|---|---|---|---|---|
| A | B | C | D | E | ||
| Severities | V | M | M | H | H | H |
| IV | M | M | M | H | H | |
| III | L | M | M | M | H | |
| II | L | L | M | M | M | |
| I | L | L | L | M | M | |
| Severity | Frequency | Risks | ||||
| I | Low | A | Unlikely | (1) Low (2) Moderate (3) High | ||
| II | Moderate | B | Remote | |||
| III | Average | C | Casual | |||
| IV | Critical | D | Likely | |||
| V | Catastrophic | E | Frequent | |||
Publisher’s Note: MDPI stays neutral with regard to jurisdictional claims in published maps and institutional affiliations. |
© 2021 by the authors. Licensee MDPI, Basel, Switzerland. This article is an open access article distributed under the terms and conditions of the Creative Commons Attribution (CC BY) license (https://creativecommons.org/licenses/by/4.0/).
Share and Cite
MDPI and ACS Style
Penelas, A.d.J.; Pires, J.C.M. HAZOP Analysis in Terms of Safety Operations Processes for Oil Production Units: A Case Study. Appl. Sci. 2021, 11, 10210. https://0-doi-org.brum.beds.ac.uk/10.3390/app112110210
AMA Style
Penelas AdJ, Pires JCM. HAZOP Analysis in Terms of Safety Operations Processes for Oil Production Units: A Case Study. Applied Sciences. 2021; 11(21):10210. https://0-doi-org.brum.beds.ac.uk/10.3390/app112110210
Chicago/Turabian StylePenelas, Artur de J., and José C. M. Pires. 2021. "HAZOP Analysis in Terms of Safety Operations Processes for Oil Production Units: A Case Study" Applied Sciences 11, no. 21: 10210. https://0-doi-org.brum.beds.ac.uk/10.3390/app112110210
Note that from the first issue of 2016, this journal uses article numbers instead of page numbers. See further details here.