
Formulation Development and Performance Characterization of Ecological Dust Suppressant for Road Surfaces in Cities

1
School of Civil and Resources Engineering, University of Science and Technology Beijing, Beijing 100083, China
2
Key Laboratory of Ministry of Education for High Efficiency Exploitation and Safety of Metal Mine, Beijing 100083, China
*
Author to whom correspondence should be addressed.
Appl. Sci. 2021, 11(21), 10466; https://0-doi-org.brum.beds.ac.uk/10.3390/app112110466
Submission received: 26 September 2021
/
Revised: 29 October 2021
/
Accepted: 4 November 2021
/
Published: 8 November 2021
(This article belongs to the Special Issue Advanced Technologies on Mine Dust Prevention and Control)
Abstract
:In order to solve the problem of road dust pollution, an ecological dust suppressant for road surfaces has been developed using monomer, orthogonal, and optimization experiments and based on the dust raising mechanism. A humectant, hygroscopic agent, coagulant and surfactant and their concentration ranges have been determined through monomer experiment. The preliminary formula of the dust suppressant has been obtained through orthogonal experiment, with the water loss rate, moisture content rate, viscosity value, and surface tension value serving as experimental indexes. The optimal formula for the dust suppressor has been calculated through an optimization experiment, with the toxicity, moisture absorption and retention performance of plants, and the relative damage rate of plant seeds serving as experimental indexes. Based on the performance characterization of ecological road dust suppressant, the ecologically and environmentally friendly dust suppressant demonstrates fine moisture absorption and retention performance, good wind and rain erosion resistance, and no toxicity. The ecological road dust suppressant developed herein covers extensive raw material sources. It is ecologically and environmentally friendly, fit for most urban roads, and has a fine dust suppression effect. Meanwhile, it also can bring in good economic and social benefits, demonstrating its broad application prospects.
1. Introduction
Climate change has been exacerbated during recent years. With the constant enhancement of the awareness of ecological and environmental protection, people and the government in China have been increasingly focused on urban environmental problems. Urban roads are key channels for transportation inside a city, the dust atmosphere of which has a significant impact on the urban environment [1,2,3]. Therefore, the elimination of fugitive road dust is extremely urgent.
Fugitive road dust refers to the dust in the atmosphere that comes from road surfaces under certain dynamic conditions (such as wind, vehicle wheel rolling, and crowd activity) [4,5,6]. Gao [7] and Jia [8] show that fugitive road dust accounts for 14.3% of emission sources for PM2.5 (pollutants such as elemental carbon, sodium, magnesium, calcium, aluminum, and iron in dust emissions, the particle size of which is 2.5). Cheng [9] and Fan [10] found that the annual emissions and the emission factors of fugitive dust PM2.5 on suburban roads are higher than on downtown roads after researching the spatial distribution characteristics of PM2.5. Through the APRS-CMAQ model, Chen, Cheng, and Zhou [11] estimated that the contribution rate of fugitive road dust to PM10 was 36% in Beijing in 2010. Therefore, fugitive road dust is the key source of PM2.5 and PM10 in the atmosphere [12,13]. The control of fugitive road dust pollution is of great significance for improving the air quality in urban environments.
Under the dust control policy of “prevention-based control”, present measures are mainly designed to control fugitive road dust and reduce atmospheric pollution [14,15] through water sprinkling, windscreens [16,17], and chemical dust suppressants [18], in combination with mechanical, electrostatic, and bag-filter techniques and wet dust removal. At present, researchers are mainly committed to the research and development of chemical dust suppressants regarding fugitive road dust control. After comparing the effects of road surface cleaning, water flushing, and chemical dust suppressants upon reducing the dust in the surrounding environment, Anderson [19] found that chemical dust suppressants demonstrate the most obvious effect on fugitive road dust suppression. Jin [20,21,22] developed a new type of biodegradable environmentally friendly dust suppressant and a highly efficient composite dust suppressant which can effectively inhibit the re-entrainment of coal dust and reduce environmental pollution. Gang [23] developed a chemical dust suppressant for tarmac roads. Ding [24] used hydroxyethyl cellulose, acrylamide, and stearyl methyl acrylate to prepare an environmental protection dust suppressant for preventing dust during coal storage and transportation. Ding [25] magnetized the surfactants in moist dust suppressants, thus enhancing the moisturizing capacity toward coal dust and improving the dust suppression performance. Huang [26] prepared a dust suppressant by using sodium polyacrylate as a binder, sodium carbonate as a moisture absorbent, polyethylene glycol as a water-retaining agent, and alkyl glycoside as a surfactant. Xiao [27] synthesized a polymer dust suppressant with raw materials of polyvinyl alcohol, carboxymethyl cellulose, and acrylamide.
With the enhancement of environmental protection awareness among people, topics of environmental protection have become increasingly key social issues. Road dust suppressant formulas proposed by many scholars have begun to shift into the ecological and environmental protection direction. Taking the fugitive dust on some urban roads in Beijing as a research object, Zheng [28] researched the change of PM10 and PM2.5 concentrations in fugitive road dust before and after the spraying of a new environmentally friendly road dust suppressant. Zheng [29] developed a biodegradable starch-based dust suppressant through microwave synthesis. Therefore, the main components of dust suppressant have gradually transitioned to new types of surfactant: super absorbent and natural organic materials [30,31,32]. An ecologically and environmentally friendly multi-functional dust suppressant has become the main direction of current research [33,34].
Based on the domestic and foreign status quo on road dust suppressant research and applications, this paper aims to develop a dust suppressant with hygroscopic, water-retention, adhesive, coagulable, infiltrative, and other properties that is also ecological and environmentally friendly. In light of the dust generation mechanism in road transportation and the dust suppression principles of different types of dust suppressants, the dust suppressant has been designed to solve the practical problem of urban road fugitive dust pollution. Through monomer, orthogonal, and optimization experiments, an ecological dust suppressant for road surface is developed. The ecological chemical dust suppressant developed in this paper shall meet multiple requirements, such as being non-toxic, harmless, quickly degradable under natural conditions, and free from any negative environmental effect, and that has good dust suppression performance, a reasonable price, convenient usage, and extensive sources for raw materials, as well as being environmentally friendly. Thus, our suppressant can effectively suppress urban fugitive road dust, purify the atmospheric environment, and improve the urban air quality, so as to provide a better working and living environment for urban residents and facilitate the healthy and rapid development of cities.
2. Materials and Methods
2.1. Dust Samples and Sample Preparation
Suitable urban road sections were selected for soil sample collection. Based on the “soil moisture determination method” (GB 7172-87), those samples were dried at 105 °C to a constant weight and then ground with a mortar. Then, the soil samples were screened with a standard sieve with 140 meshes and impurities were removed (the same was performed for dust sample preparation below). In total, 15 g of dust samples weas weighed in the Petri dish (φ 75 mm) with an electronic balance. The total mass of both dust samples and the Petri dish was recorded.
The mass of the dust suppressant solution and water in each group was calculated based on the concentration needed. Then, the dust suppressant and water were weighed and filled in beakers. A DF-101S magnetic agitator was adopted to stir the solution to accelerate dissolution. The stirring was stopped after the solute was completely dissolved. Then, the solution was taken out and set aside for a moment and formulated to a uniform dust suppressant solution. Then, 11 mL of prepared dust suppressant solution was taken out from each group and sprayed evenly on the surface of the dust sample to infiltrate it completely. Those soil samples were also labeled in sequence.
2.2. Methods of Dust Suppressant Formula Development
The orthogonal experiment scheme was designed according to the principle that each level of each factor should be combined the same number of times as each level of other factors, without considering the interaction between factors.
In combination with the results of the monomer experiment, each monomer humectant BS, hygroscopic agent XS, coagulant NB, and surfactant BZ, their corresponding concentration ranges, and the L16 (45) orthogonal table were selected [35,36,37]. Concentration values corresponding to each factor and level are displayed in Table 1.
2.3. Methods of Performance Characterization
- (1)
- Moisture absorption and retention performance test.
The moisture absorption performance of a dust suppressor is characterized by the moisture content. The moisture content rate of dust samples was calculated based on Equation (1).
where is the moisture content rates of dust samples in hour i (%), is the mass of the Petri dish and dust sample in hour i (g), is initial mass of dry Petri dish and dust sample (g), and is the mass of the dry dust sample (g). The moisture retention performance of the dust suppressor is characterized by the water loss rate. The water loss rate was calculated according to Equation (2).
where is the water loss rate of the dust sample (%), is the mass of the clean and dry Petri dish and the dust sample (g), is the mass of the dust sample and Petri dish at hour i/day (g), and is the mass of 11 nm of solution (g).
- (2)
- Survival rate of plant.
The leaf number in each group was counted on the first and the last day to spray reagents. The growth rate and the growth speed inhibition percentage of each group were calculated based on Equation (3). The growth rate and the growth speed inhibition percentage of each group were calculated based on Equation (3).
where is the leaf number of the plant at (t), is the leaf number of the initial plant, t is the experiment duration (days), is the plant growth rate, is the growth rate of the control group, and is the growth rate of the experimental group.
- (3)
- Chlorophyll content.
On the seventh day of plant culture, chlorophyll was extracted from leaves in each group as per the design of the plant toxicity experiment in Section 3.2.2. A UV-6100 spectrophotometer (The manufacturer’s location is Nanbei Instrument Equipment Co. LTD in Zhengzhou, China. The test was conducted according to Chinese standard GB/T 26813-2011 Dual beam UV-VIS spectrophotometer.) was adopted to determine the absorbance of chlorophyll-extracting solution in each group for 665 nm and 649 nm light waves. The chlorophyll contents in each group were calculated based on Equation (4).
where is absorbance at the wavelength of 665 nm, is absorbance at the wavelength of 649 nm, is the concentration of chlorophyll a (mg/L), is the concentration of chlorophyll b (mg/L), w is the chlorophyll content (mg/g), V is the volume of the chlorophyll-extracting solution (mL), is the dilution ratio of chlorophyll-extracting solution, which is 1 in this experiment, and is the mass of crushed leaves (g).
- (4)
- Wind erosion resistance.
The dust suppressor solution was prepared according to the optimal dust suppressor formula. Dust samples sprayed with dust suppressant solution and with pure water were prepared, respectively, dried for 2 h in an air blowing drying oven at the constant temperature of 110 °C, and then taken out for weighing and recording. An AZ9671 digital anemometer was adopted to measure the wind speed. The air volume of SFG4-2R and SFG4-4R low noise axial flow fans was adjusted to blow each dust sample for 5 min. The wind erosion rates of each sample were calculated according to Equation (5).
where is the wind erosion rates of dust samples (%), is the mass of dust sample before wind erosion (g), and is the mass of dust samples after wind erosion (g).
- (5)
- Freezing point test.
Due to the limitations of the experimental conditions, the freezing point test of dust suppressant solution was conducted by sending samples to Shanghai Microspectrum Chemical Technology Service Co., LTD. (Shanghai, China), according to the Chinese standard “SH/T0090-1991 engine coolant freezing point determination method”.
- (6)
- Test for physical and chemical properties.
PH measurement: The METTLER table PH meter was used to measure the PH value. The PH values of three dust suppressor solutions and three samples of clean water were measured, respectively, and the average value was taken as the final PH value. Viscosity measurement: A digital rotary viscometer was used for viscosity measurement. The viscosity values of three clean water samples and three dust suppressant solutions were read, respectively, and the average value was taken as the final viscosity value. The BZY surface tension meter was used to measure the surface tension value. The surface tension values of three clean water samples and three dust suppressant solutions were read, respectively, and the average value was taken as the final surface tension value. Density measurement: The DH-300L liquid digital densitometer was used for density measurement; three dust suppressor solutions were read, and the average value was taken as the final density value.
3. Results and Discussion
3.1. Development of Optimal Dust Suppressant Formula
3.1.1. Performance Requirement and Formula Composition of Dust Suppressant
According to the influencing factors of fugitive road dust concentration, this paper has researched the road condition factor and developed a kind of environmentally friendly dust suppressant comprising organic components for the humectant, hygroscopic agent, coagulant, surfactant, etc. Its dust suppression principle is to control the fugitive road dust concentration by changing the moisture content, evaporation rate, and particle size ratio of road dust. The technical characteristics of the suppressant are shown in Table 2.
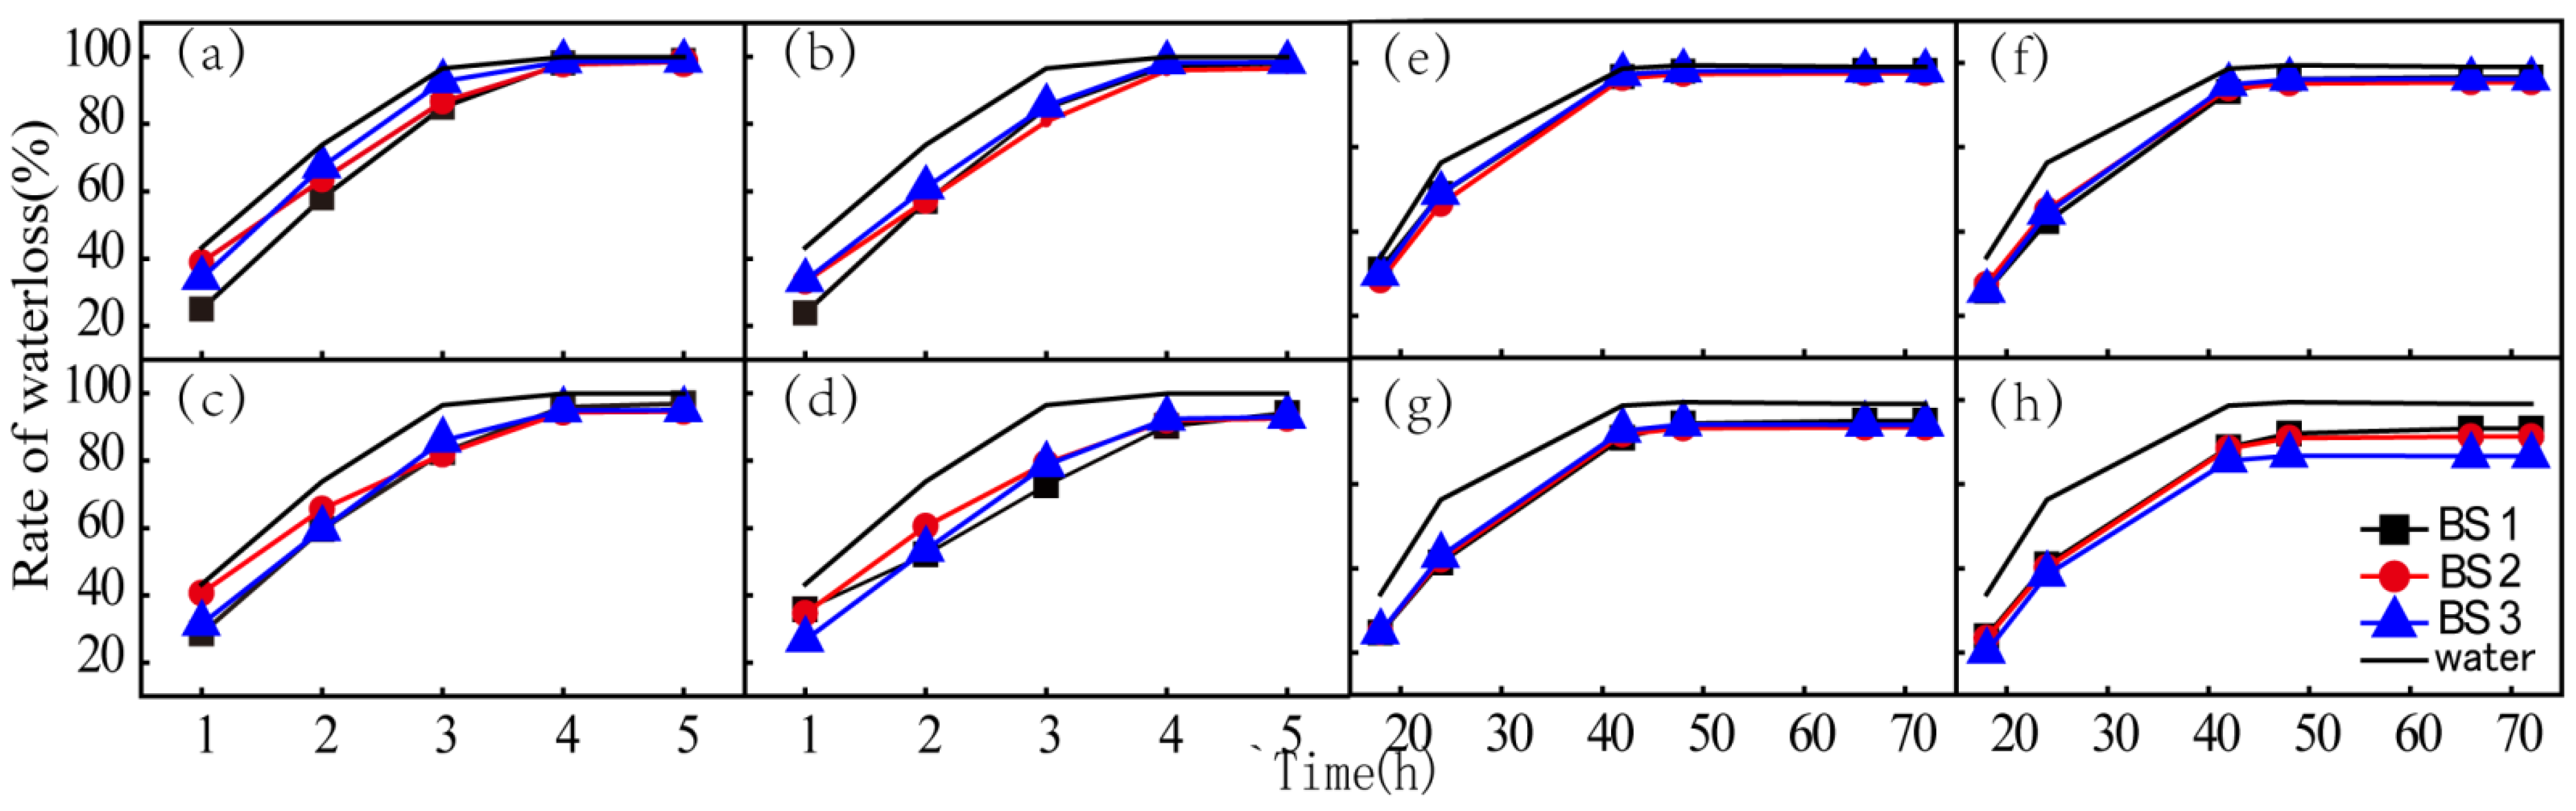
Based on the “Soil moisture determination method” (GB 7172-87), Glycol (BS1), sucrose (BS2), and triethanolamine (BS3) were selected as preliminary moisturizers. The changes in the water loss rates of dust samples at 65 °C and under natural conditions are shown in Figure 1 and Figure 2 through monomer experiments with different concentrations of humectants. According to Figure 1 and Figure 2, the order of moisture retention at 65 °C is BS1 > BS2 > BS3, and the order of moisture retention under natural conditions is BS2 > BS3 > BS1, showing that the higher the concentration, the better the moisturizing performance will be. Based on the results of the moisturizing test under different conditions, BS2 demonstrates the best moisturizing performance. Therefore, BS2 was selected as the humectant monomer. Its concentration range was determined to be from 3% to 6% in light of both its hygroscopicity and economic efficiency.
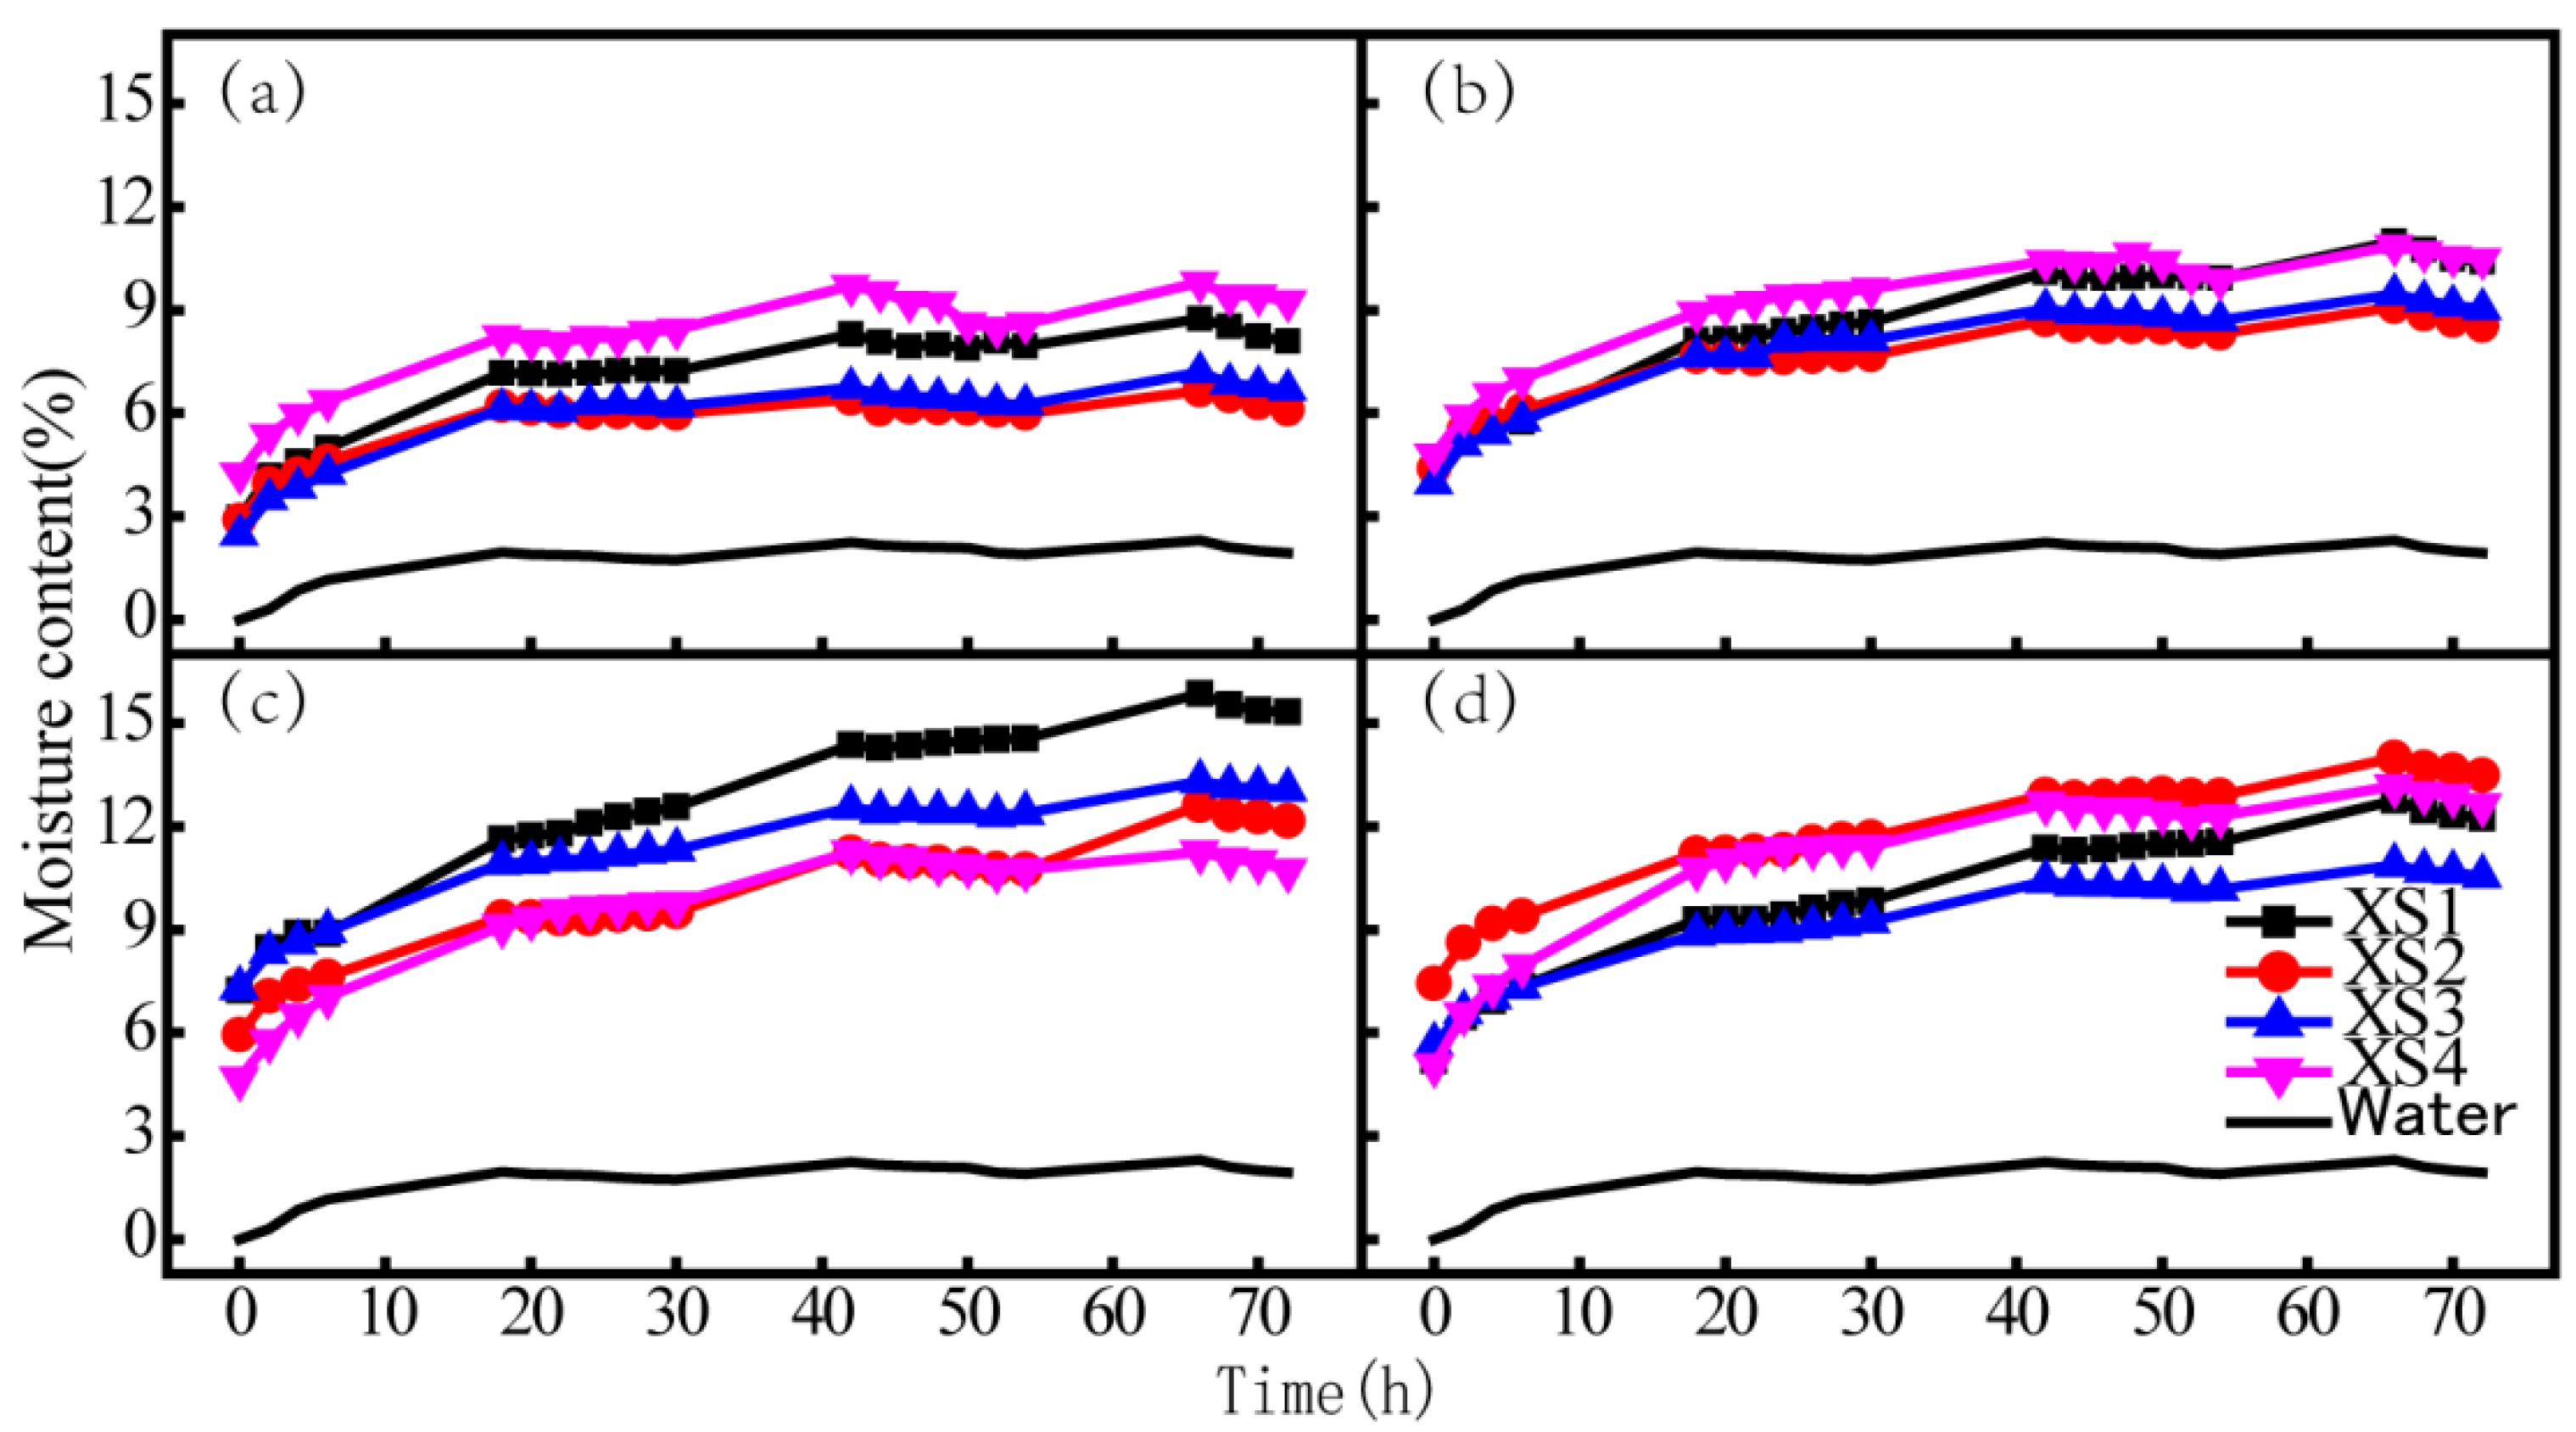
The organic solvents glycerin (XS1), triethanolamine (XS2), trimethylolpropane (XS3), and the mixture of glycerin and magnesium chloride (XS4) were selected as the hygroscopic agents. The performance of each hygroscopic agent was evaluated by the moisture content rate and its increment of dust samples. The moisture content rate variation curves for different concentrations of hygroscopic agent monomers are shown in Figure 2. According to Figure 2, XS4 and XS1 demonstrate the best hygroscopic performance. However, in view of the compound reagent of XS4, whose main component is XS1, and the strong hygroscopicity of XS1 in a single component, XS1 was selected as the best hygroscopic agent. Its concentration range was set from 3% to 6% in light of its economic efficiency. Subsequently, another reagent in XS4 can serve as a hygroscopic and moisturizing enhancer to optimize the hygroscopic and moisture-retention performance of the dust suppressant.
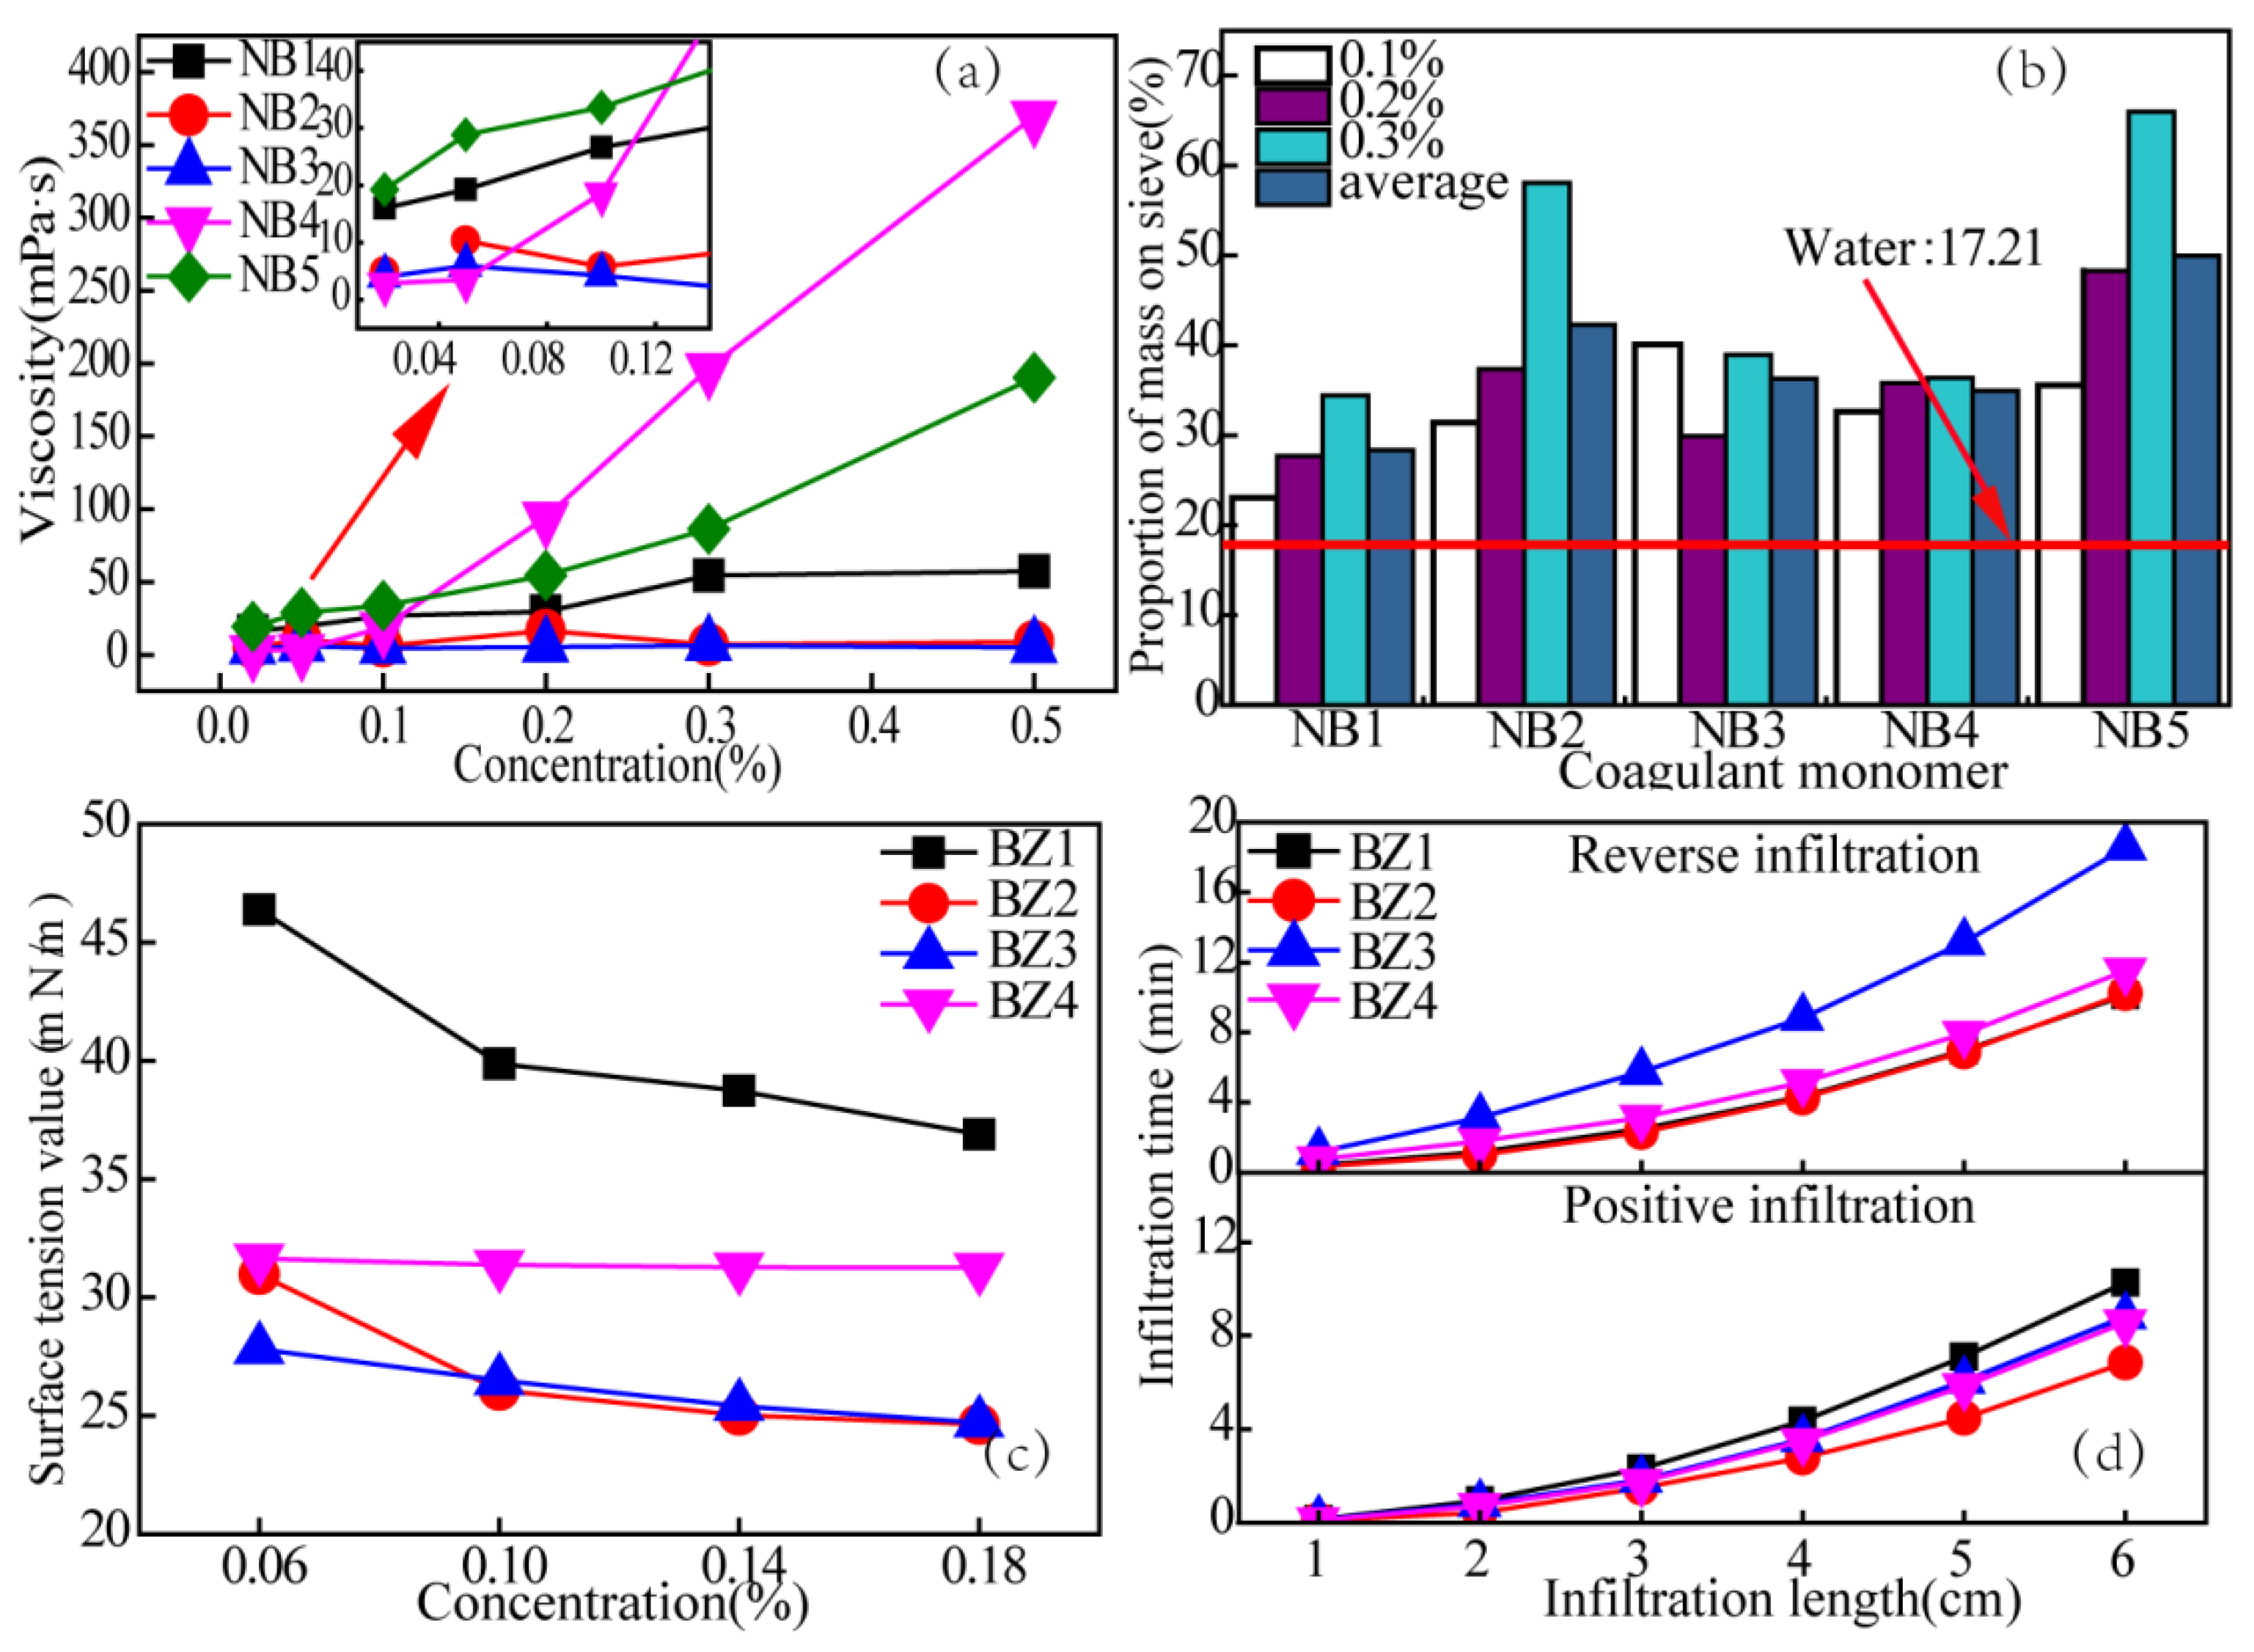
Polyacrylamide (NB1), methylcellulose (NB2), cassava starch (NB3), sodium polyacrylate (NB4), and sodium carboxymethyl cellulose (NB5) were selected as raw materials of the coagulant. The viscosity value and the bonding effect were adopted to evaluate the bonding performance of each coagulant. The curves of viscosity changes in the coagulant solutions with concentration are shown in Figure 3a, and the mass proportion of dust in large particles is shown in Figure 3b. In can be seen that the viscosity values of NB4 and NB1 solutions are relatively large, seldom show changes with concentration, and are easy to condense and process. The order of the bonding effect of coagulants is NB5 > NB2 > NB3 > NB4 > NB1, and NB5 shows the best bonding effect of the three concentration gradients. NB5 was selected as a coagulant, and its concentration range was set from 0.06% to 0.12% in combination with the experimental conclusion of viscosity values.
Sodium dodecyl benzene sulfonate (BZ1), sodium dodecyl sulfate (BZ2), phospholipid (BZ3), and sodium lignosulfonate (BZ4) were preliminarily selected as raw materials for the surfactant in this monomer experiment. The surface tension values of different concentrations of surfactant solutions were measured (Figure 3c) and the infiltration time of dust on the surfactants was observed through an infiltration experiment device (Figure 3d). According to the experiment, surfactants BZ2 and BZ4 demonstrated small surface tension values at the same concentration, and BZ2 demonstrated the shortest forward and reverse infiltration time. This shows that BZ2 has the best infiltration performance. Therefore, BZ2 was selected as the surfactant, and its concentration range was set from 0.06% to 0.12%.
3.1.2. Orthogonal Experiment
Orthogonal experiments concerning moisture retention, hygroscopicity, bonding performance, and infiltration performance were conducted, respectively, with the moisture retention (water loss rate), hygroscopicity (moisture content rate), viscosity, and surface tension of dust suppressant serving as indexes. The results of 16 groups of experiments are shown in Table 3.
According to the range analysis method, the range values of each factor level were calculated; the influence rules of each factor on moisture retention (water loss rate), hygroscopicity (moisture content rate), viscosity, and surface tension were obtained as shown in Figure 4. According to Figure 4, the optimal combinations corresponding to four groups of orthogonal experimental indexes are shown in Table 4.
According to the analysis principle of “the secondary submitting to the primary and the minority submitting to the majority” in the comprehensive balance method, the main factors affecting the suppression effect of the dust suppressant are hygroscopicity, moisture retention, and the bonding effect, followed by surface tension. Therefore, the results of orthogonal experiments on moisture retention, hygroscopicity, moisture retention, and bonding performance were selected as the main optimal combination. The optimal combination was selected as BS4XS4NB4BZ1,3,4 by applying the principle of the minority submitting to the majority. According to the results of the orthogonal experiment concerning infiltration performance, the preliminary formula of the dust suppressant was determined as BS4XS4NB4BZ1; namely, 6% of BS + 6% of XS + 0.12% of NB + 0.06% of BZ.
3.1.3. Optimization Experiment of Dust Suppressant Formula
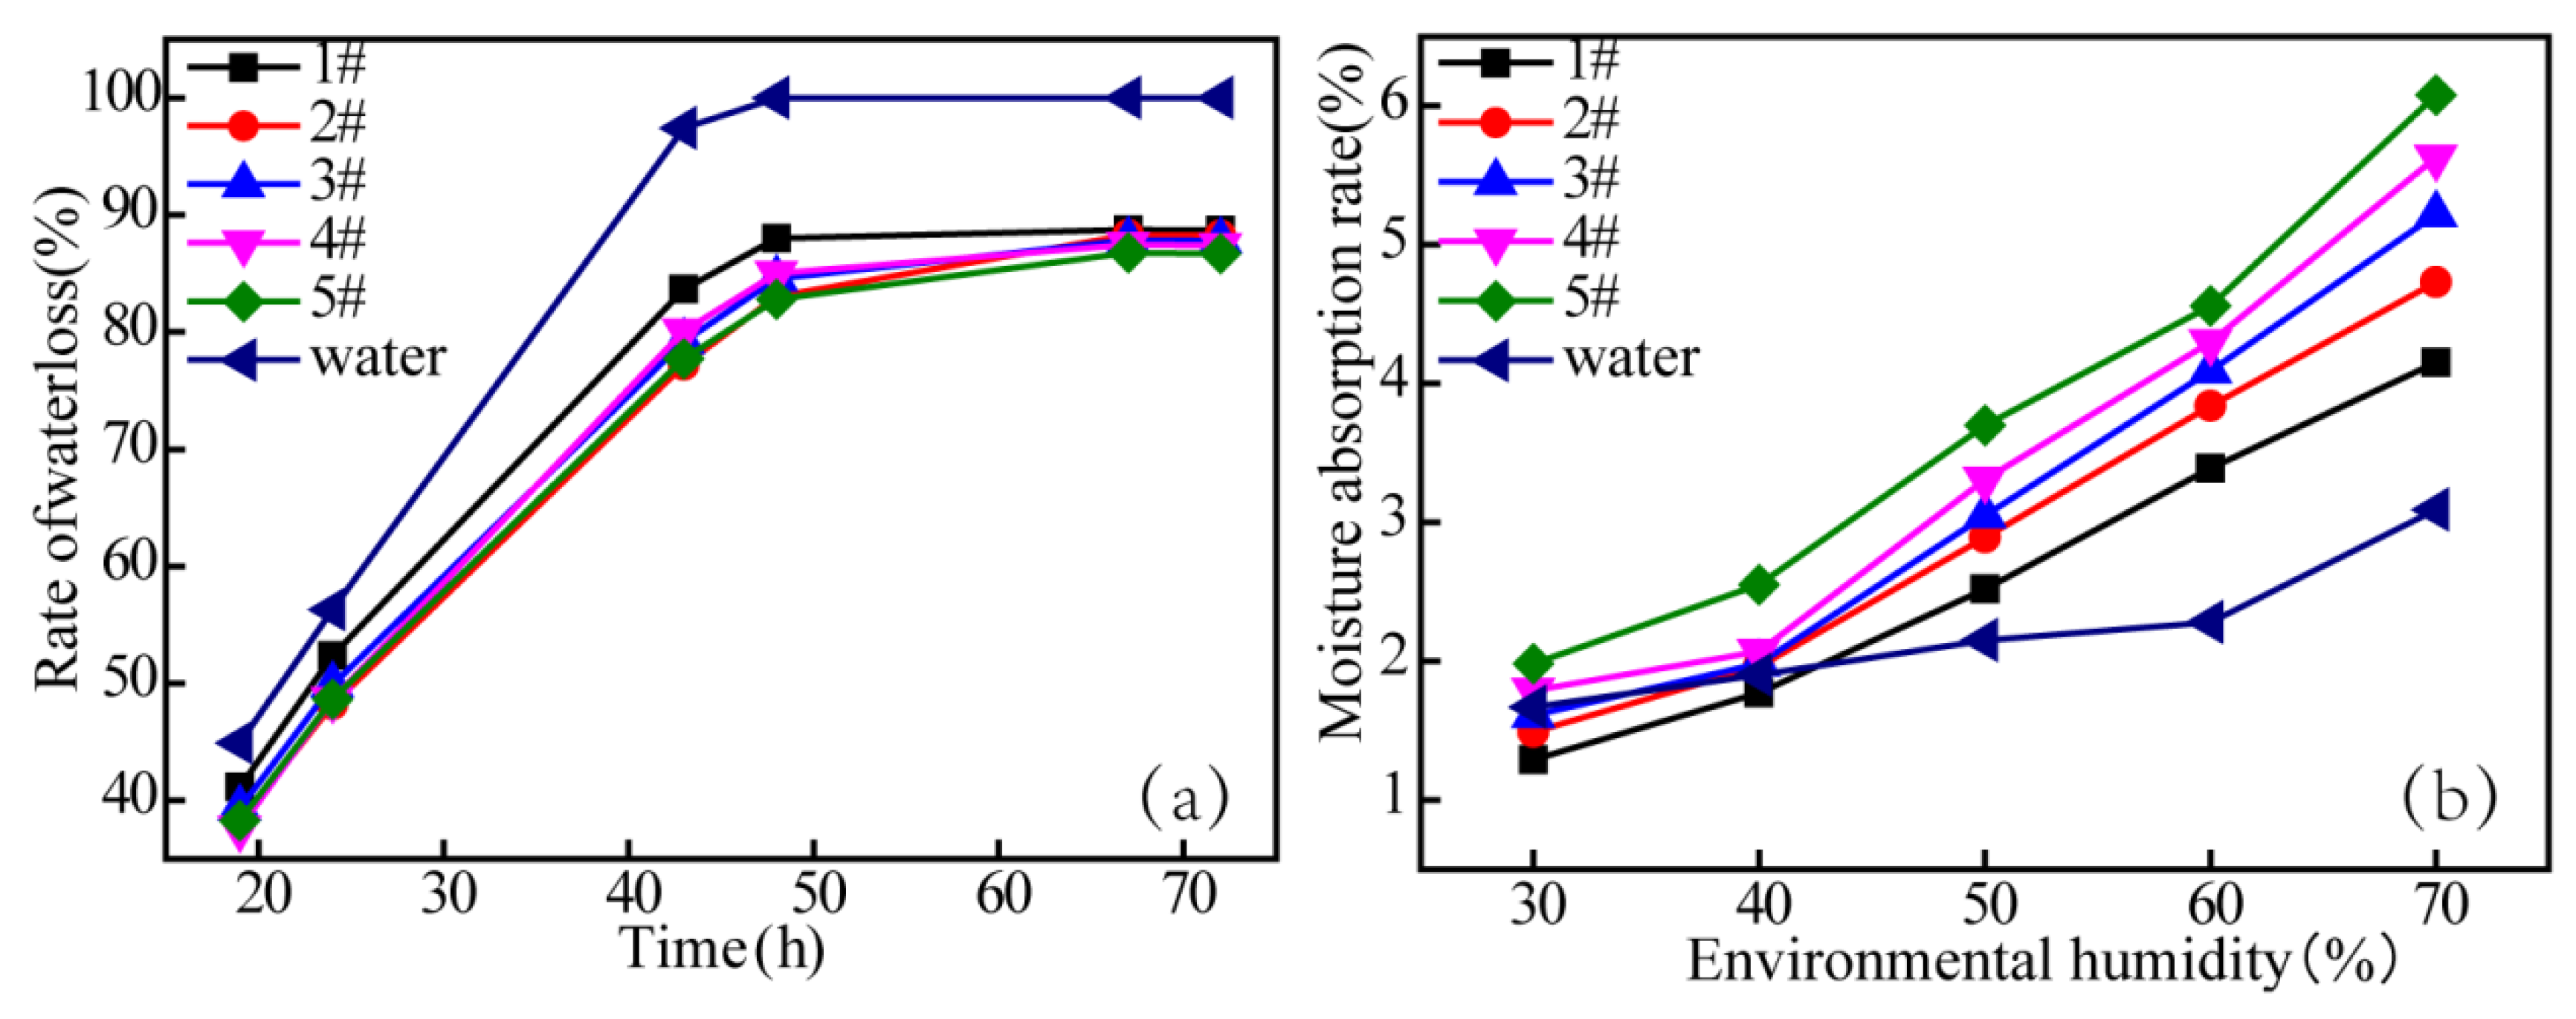
A certain amount of hygroscopic and moisturizing enhancer can increase its photosynthesis, so the concentration of this enhancer has been determined to be lower than 0.5%. ecologically. With reference to the Standard of China Environmental Protection Industry Association-Water-Soluble Road Dust Suppressant Industry Standard (T/CAEPI 7-2017), the concentration of Cl− should not exceed 0.1%. Four groups of optimized formulas were obtained by adding different concentrations of hygroscopic and moisturizing enhancers into the preliminary formula. According to Table 5, one preliminary formula and four groups of optimized formulas for dust suppressant solutions and dust samples were prepared. The five groups of samples were placed in the natural environment. According to the requirements of this experiment, the mass of samples was weighed at 9:00 am and 14:00 pm each day so as to calculate their water loss rates and evaluate their water retention effects. The changes in water loss rate over time are shown in Figure 5a.
According to Figure 5a, the moisture retention for all dust suppressant samples is better than that of pure water samples; the addition of hygroscopic and moisturizing enhancer can improve the water retention effect of dust suppressant appropriately, and the water loss rate decrements range from 0.47% to 6.47%. Within 60 h, the hygroscopic and moisturizing enhancer can obviously reduce the water loss rate of samples, whose maximum decrement can reach 6.47%. However, the moisture enhancing performance of the enhancer exhibits a decrease with time. According to the measured data, within 60 h, dust suppressants with an extra 0.25% and 0.50% of hygroscopic and moisturizing enhancers demonstrate better moisture enhancing performance. In combination with the requirements of industry standard (T/CAEPI 7-2017) on Cl− concentration, the concentration of hygroscopic and moisturizing enhancer was preliminarily determined to be 0.25%.
Under the moisture conditions of 30%, 40%, 50%, 60%, and 70%, the changes in hygroscopicity of above five groups of samples were calculated and are shown in Figure 5b. According to Figure 5b, the moisture retention rates for all dust suppressant samples are higher than that of pure water samples when the moisture is above 40%; the addition of hygroscopic and moisturizing enhancer can effectively improve the hygroscopicity of the dust suppressant. The hygroscopicity of the dust suppressant sample prepared with the preliminary formula is poorer than that of the pure water sample when the moisture content is lower than 42%. The hygroscopicity of that sample is higher than that of the pure water sample at low moisture conditions after the addition of hygroscopic and moisturizing enhancer. At this point, the higher the concentration of hygroscopic and moisturizing enhancer, the more effective the enhanced hygroscopicity will be. In combination with the results of moisture retention tests under natural conditions, the concentration of hygroscopic and moisturizing enhancer has finally been determined as 0.25%; that is, the optimal formula is the preliminary formula with the addition of 0.25% of hygroscopic and moisturizing enhancer.
3.1.4. Test for Relative Damage Rate of Plant Seeds
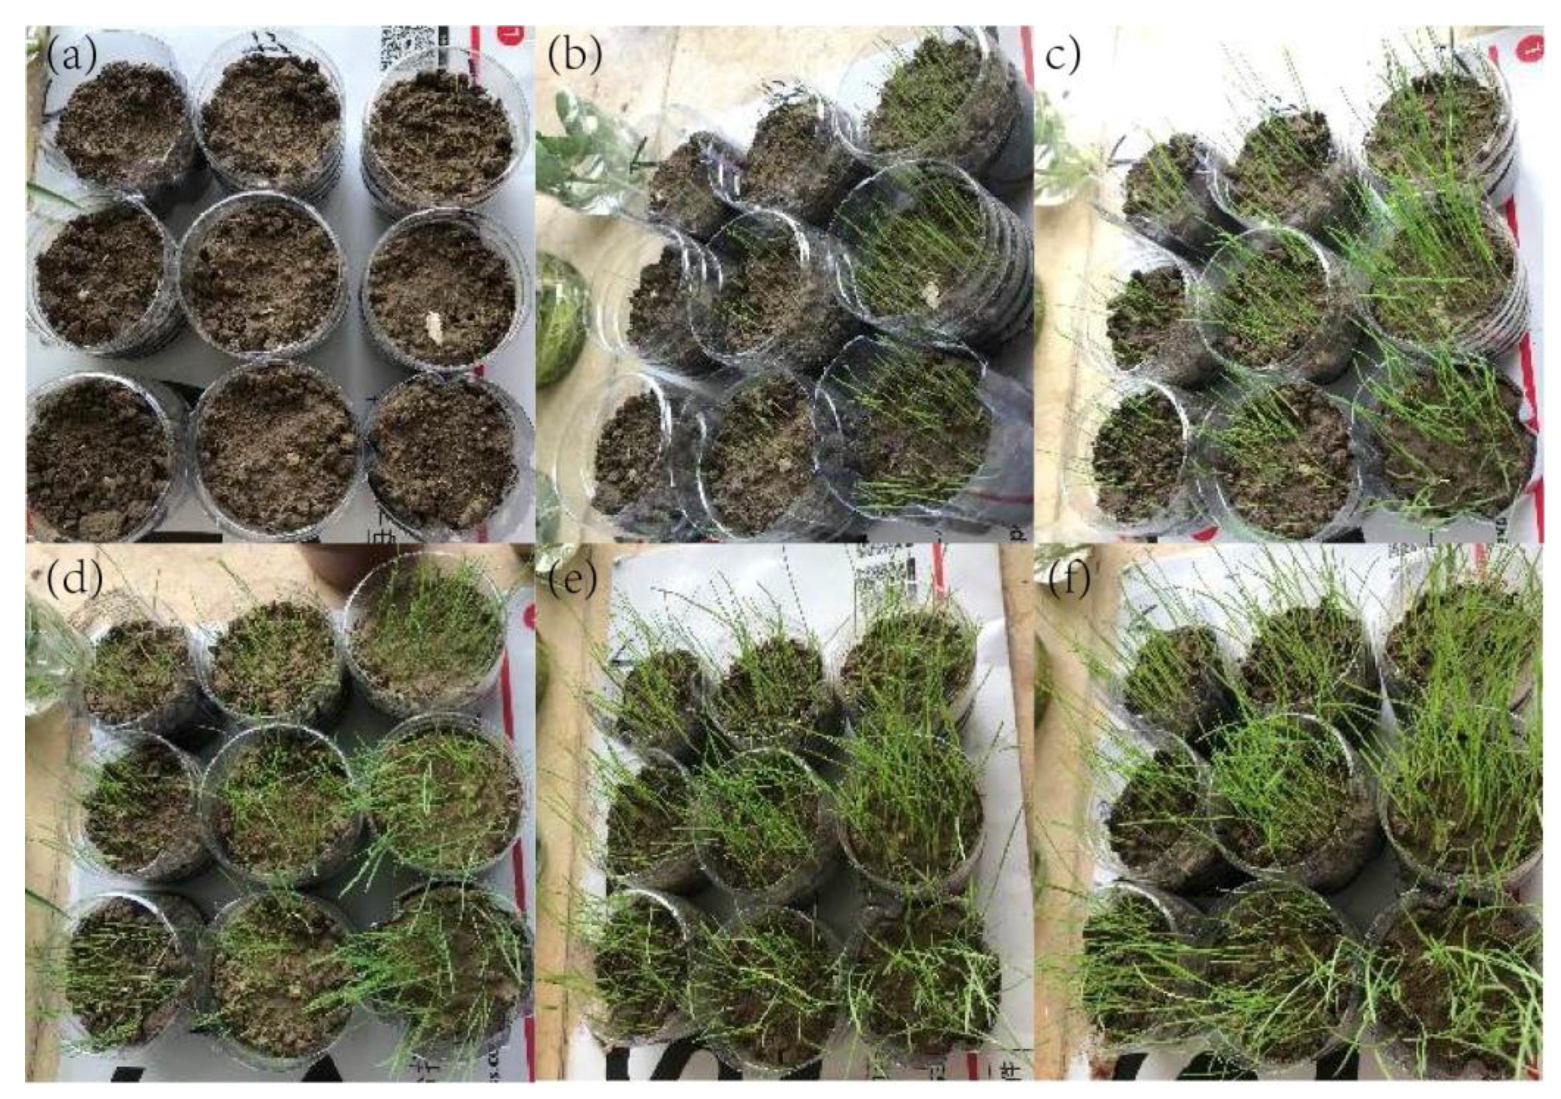
Plant seeds were cultured with the optimal formula solution, the preliminary formula solution, and the pure water on days 1, 3, 5, 8, 10, and 12, respectively (Figure 6). The sprout number and the germination rate were calculated. The relative damage rates for plant seeds under the optimal formula and the preliminary formula were obtained through further calculation, as shown in Table 6.
According to Table 6, the germination rates of plant seeds cultured for 12 days with the optimal formula solution, the preliminary formula solution, and the pure water are 63%, 81%, and 89%, respectively. The relative damage rates of plant seeds under the optimal formula and the preliminary formula are 29% and 9%, respectively, both of which are less than 40% and meet the requirements of the Water-Soluble Road Dust Suppressant Industry Standard (T/CAEPI 7-2017). In combination with the results of moisture retention tests under natural conditions and hygroscopicity tests under different moisture conditions, the optimal formula demonstrated the best comprehensive performance in terms of moisture retention, hygroscopicity, and environmental protection.
3.2. Performance Characterization of Dust Suppressant
3.2.1. Moisture Absorption and Retention Performance Test
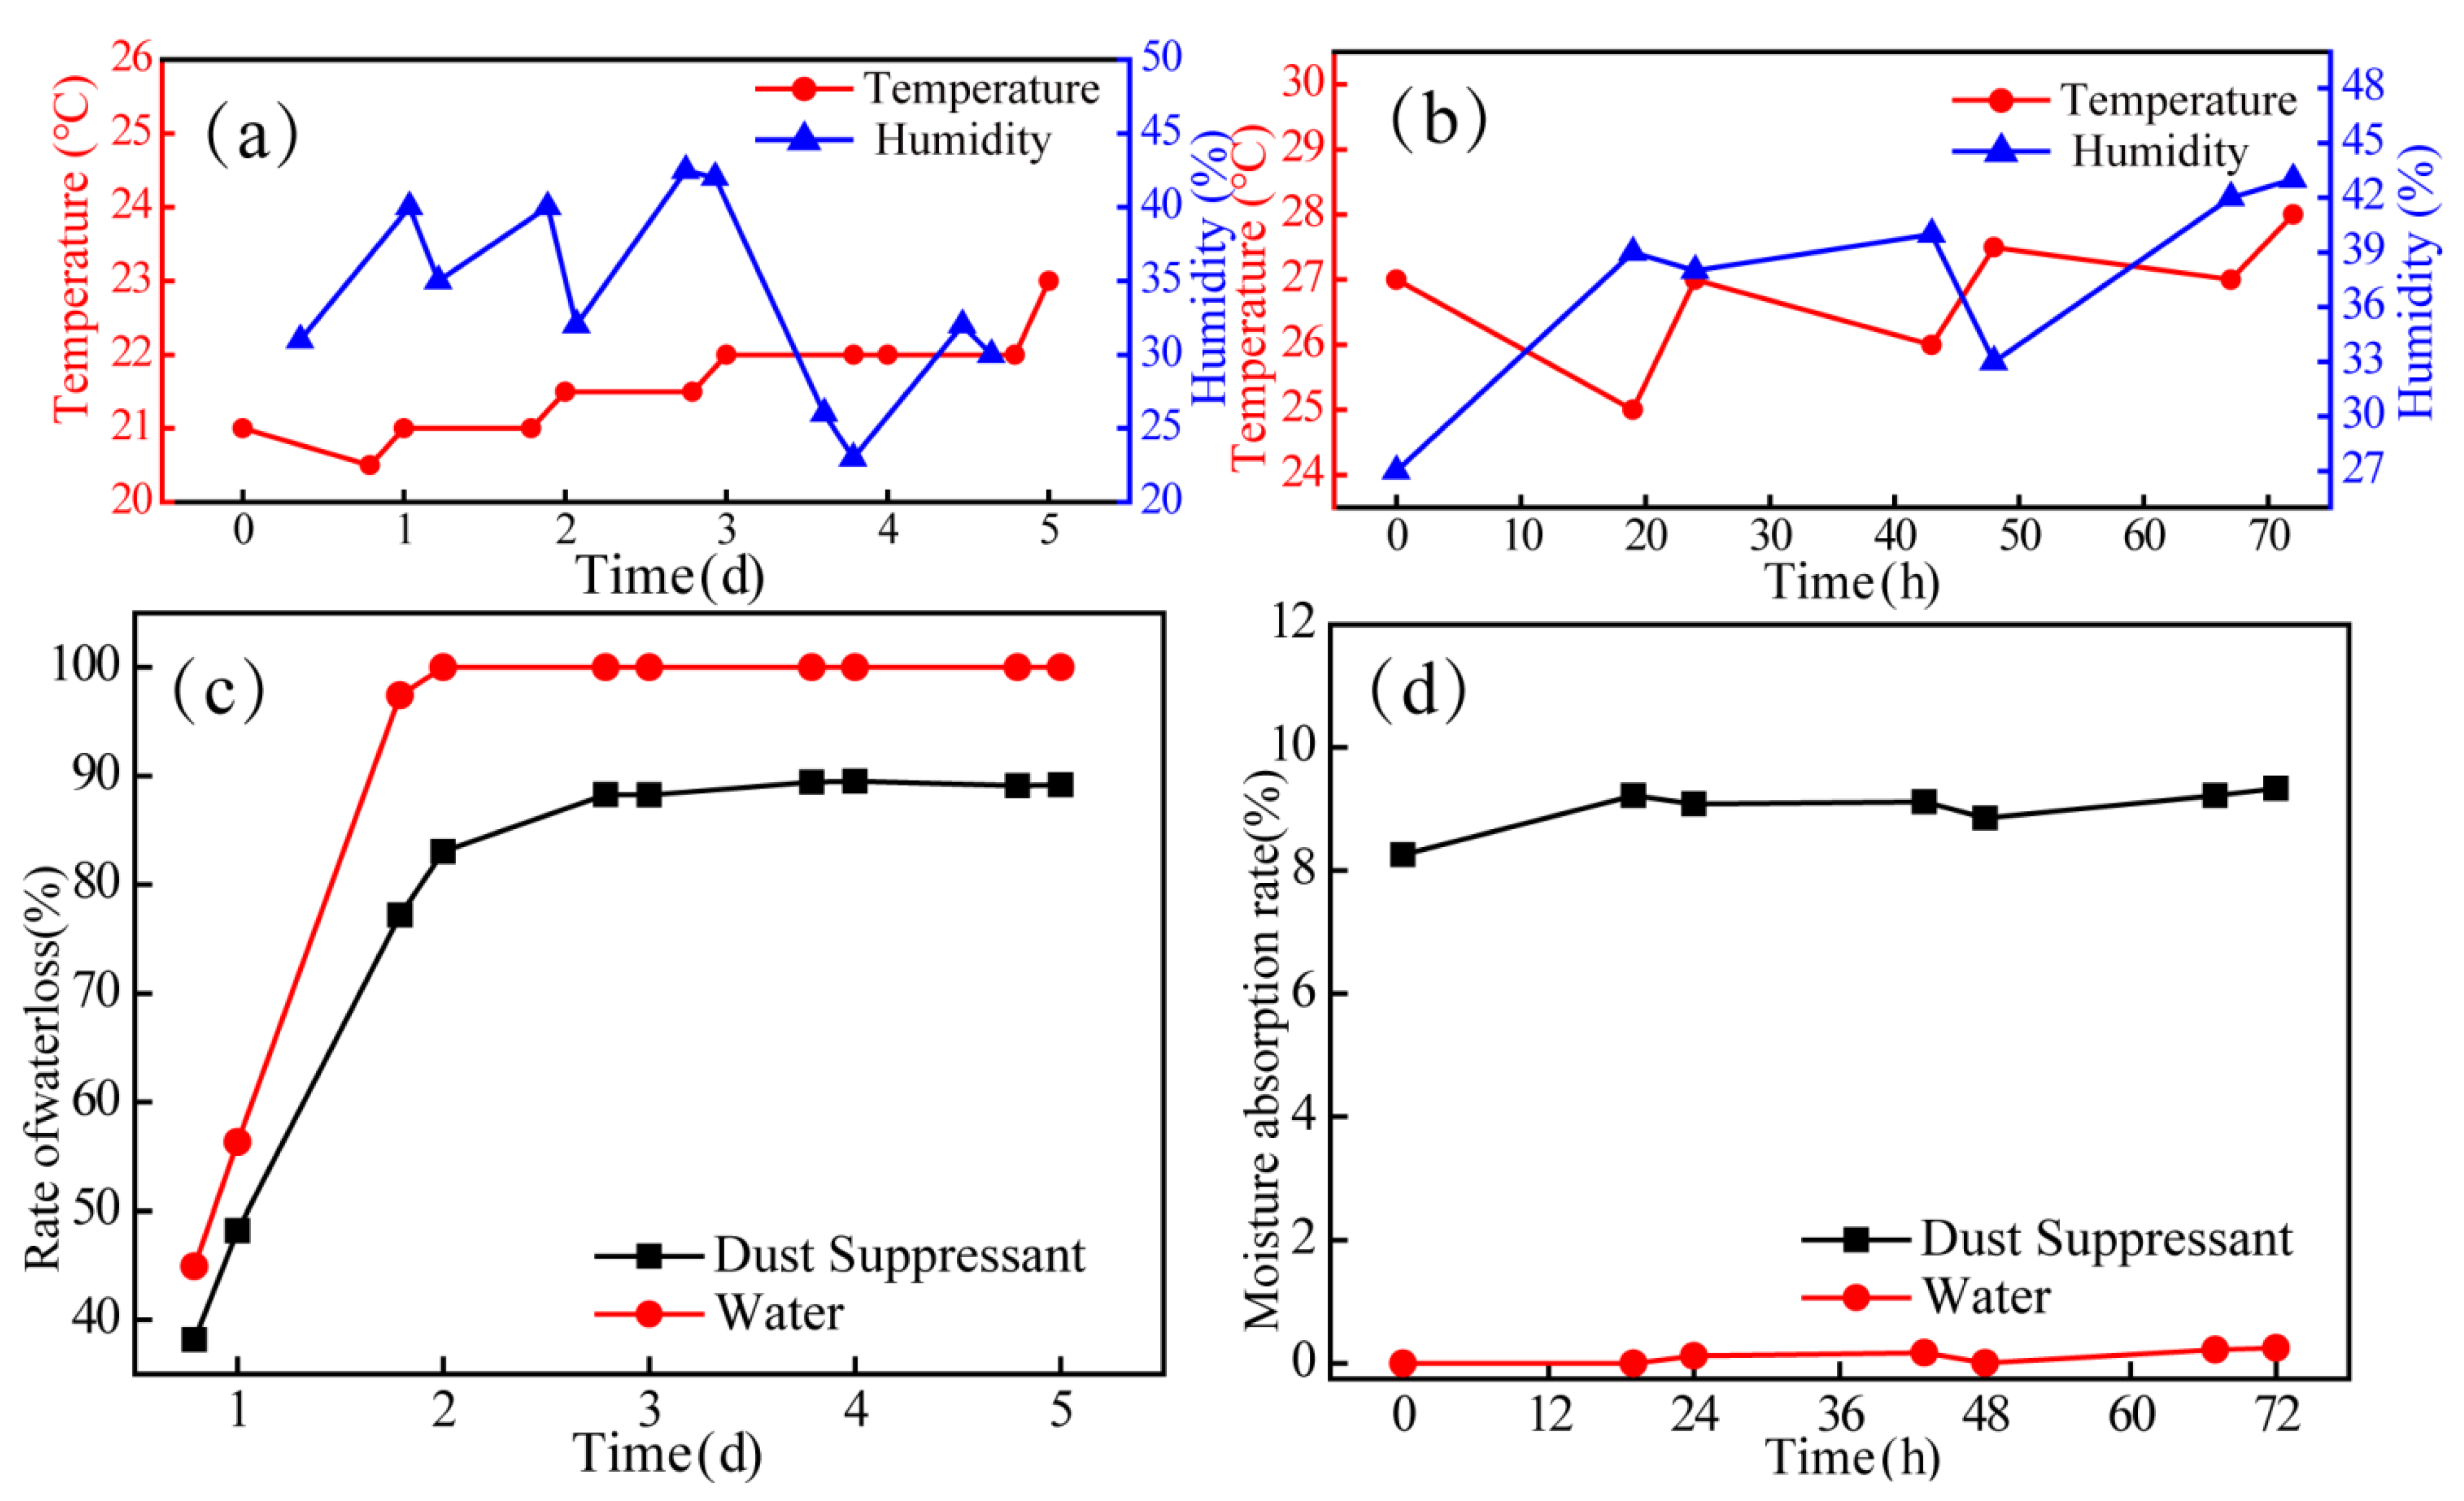
In order to verify the moisture retention and hygroscopicity of the dust suppressor under natural conditions, the moisture absorption and retention performance tests for dust suppressant were conducted for five consecutive days. Variation curves of temperature and moisture during the test are shown in Figure 7a,b. The water loss rate and the moisture content rate of samples were calculated, respectively, and their variation curves are shown in Figure 7c,d.
According to Figure 7a,c, under natural conditions, the water loss rate for the sample sprayed with dust suppressant was significantly lower than that of the sample with pure water. The water loss rate of the sample sprayed with pure water was up to 100% on the second day, showing that its water retention effect was very poor. The water loss rate and the water loss speed of samples sprayed with dust suppressant were obviously lower than samples with pure water in the first two days. Due to the constantly changing moisture during the test, the water loss rate of samples with dust suppressant fluctuated between 86% and 89% during the third to fifth days. During the experiment, the air’s relative humidity in daytime ranged from 22.5% to 42.5% and the temperature ranged from 20.5 °C to 23 °C. The air humidity was the lowest on the fourth day and the water loss rate reached its maximum value on that day. However, the water loss rate of samples sprayed with dust suppressant was obviously lower than samples sprayed with pure water. Therefore, the dust suppressant demonstrated a better moisture retention effect.
According to Figure 7b,d, under natural conditions, the moisture content rate of samples sprayed with dust suppressant was obviously higher than samples sprayed with pure water. The maximum moisture content rate of samples sprayed with pure water was only 0.25% over 3 days, and their increment in moisture content was 0.25%—approximately 0%, which shows a very poor hygroscopicity. The moisture content rate of samples sprayed with dust suppressant fluctuated between 8.26% and 9.33% over 3 days, and their increment in moisture content was 1.07%, both of which were obviously higher than samples sprayed with pure water. The temperature and the humidity exhibited constant variation during the test, with the humidity ranging from 27% to 43% and the temperature ranging from 25 °C to 28 °C. As a result, the moisture content rate of samples sprayed with dust suppressant fluctuated around 8%. The air humidity was lower at the 48th hour and the moisture content rate of samples decreased slightly. However, with the increase of humidity, the moisture content rate of those samples also increased. Generally, the moisture content rate and the increment of samples sprayed with dust suppressant were obviously higher than samples sprayed with pure water. Therefore, the dust suppressant demonstrated good hygroscopicity.
3.2.2. Test for Toxicity to Plant
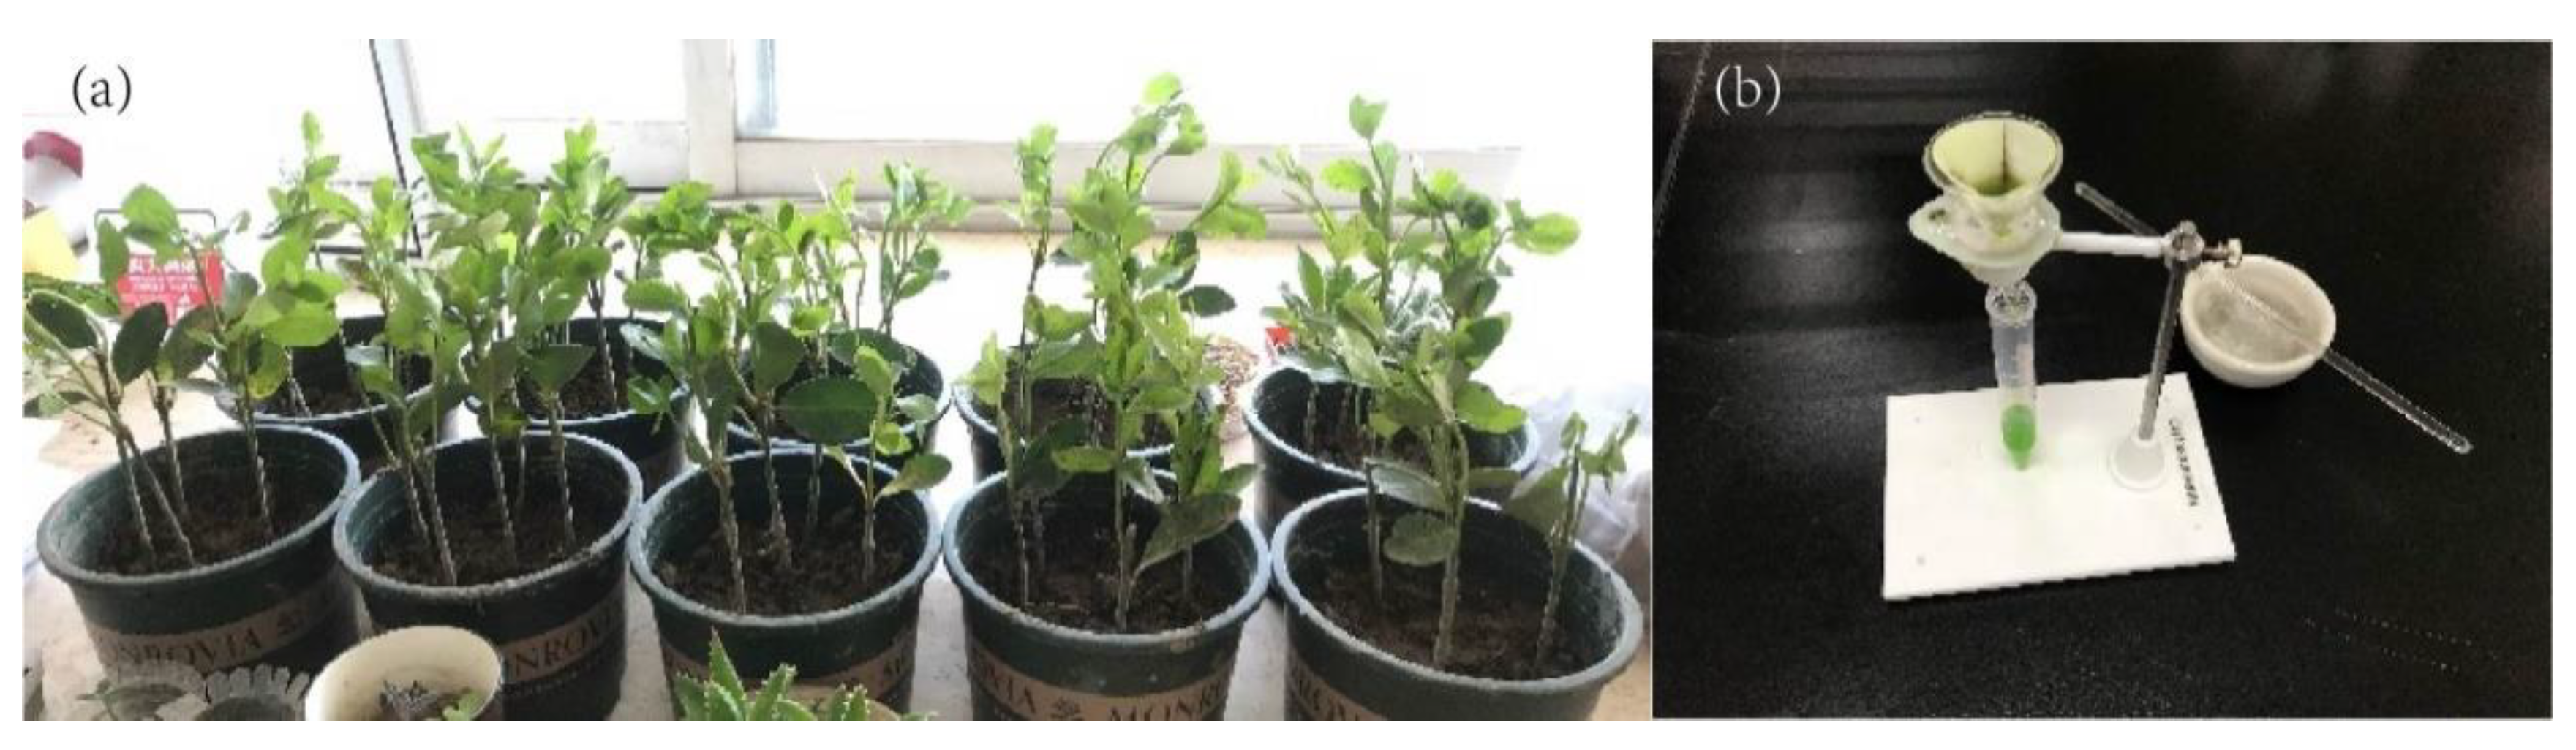
In order to accurately measure the toxicity of the dust suppressant to green plants, holly seedlings with the same or similar conditions were planted under the same light source, temperature, and humidity conditions. The experimental temperature was 24 ± 2 °C and humidity was 40 ± 5%; under these conditions, the growth status of plants was observed, and the results are shown in Figure 8a. Two weeks later, after the holly seedlings grew into stable conditions, equal amounts of dust suppressant solution and pure water were sprayed at the roots of two groups of plants, respectively. The testing solution was sprayed once at 10:00 a.m. each day for 7 days. The survival rate and the chlorophyll content of plants were determined (Figure 8b).
Based on the macroscopic observation of the growth conditions of each group of holly plants, within a certain range, dust suppressant solutions in each concentration had no significant influence on the growth of holly plants, and there was no obvious toxic effect. According to the experimental data in Table 7, the growth rate of holly plants cultured with dust suppressant solution was not slower than holly plants cultured with pure water, and the inhibition percentage was smaller than 0; namely, the survival rate of holly cultured with dust suppressant solution was 100%, showing that the dust suppressor had no inhibition effect on the growth of holly; instead, it played a certain facilitating role.
According to the data in Table 8, the dust suppressant solution can promote the photosynthesis of plants and thus increase their chlorophyll content. In summary, both macroscopic and microscopic studies have proven that the ecological dust suppressant developed herein has no toxic impact on green plants; instead, it can promote the photosynthesis and growth of plants to a certain extent.
3.2.3. Test for Wind Erosion Resistance
According to Table 9, the wind erosion rate of the sample sprayed with water is 9.39% under a wind speed of 5 m/s, and the wind erosion rate is 10.97% when the wind speed is 10 m/s. Therefore, when the wind speed increases, the wind erosion rate increases gradually as well. For the sample sprayed with dust suppressant, the wind erosion rate is basically dependent on whether the wind speed is 5 m/s or 10 m/s. The sample mass increases after it is subject to wind. This may be because the dust suppressant is hygroscopic and absorbs moisture from the air. According to the experiment results, the dust suppressant not only has good bonding performance, which can give the dust a “crust” so that it bonds together and is not easy to break, but it also holds the dust together against wind and prevents the moisture infiltrating inside due to wind.
3.2.4. Rain Immersion Test
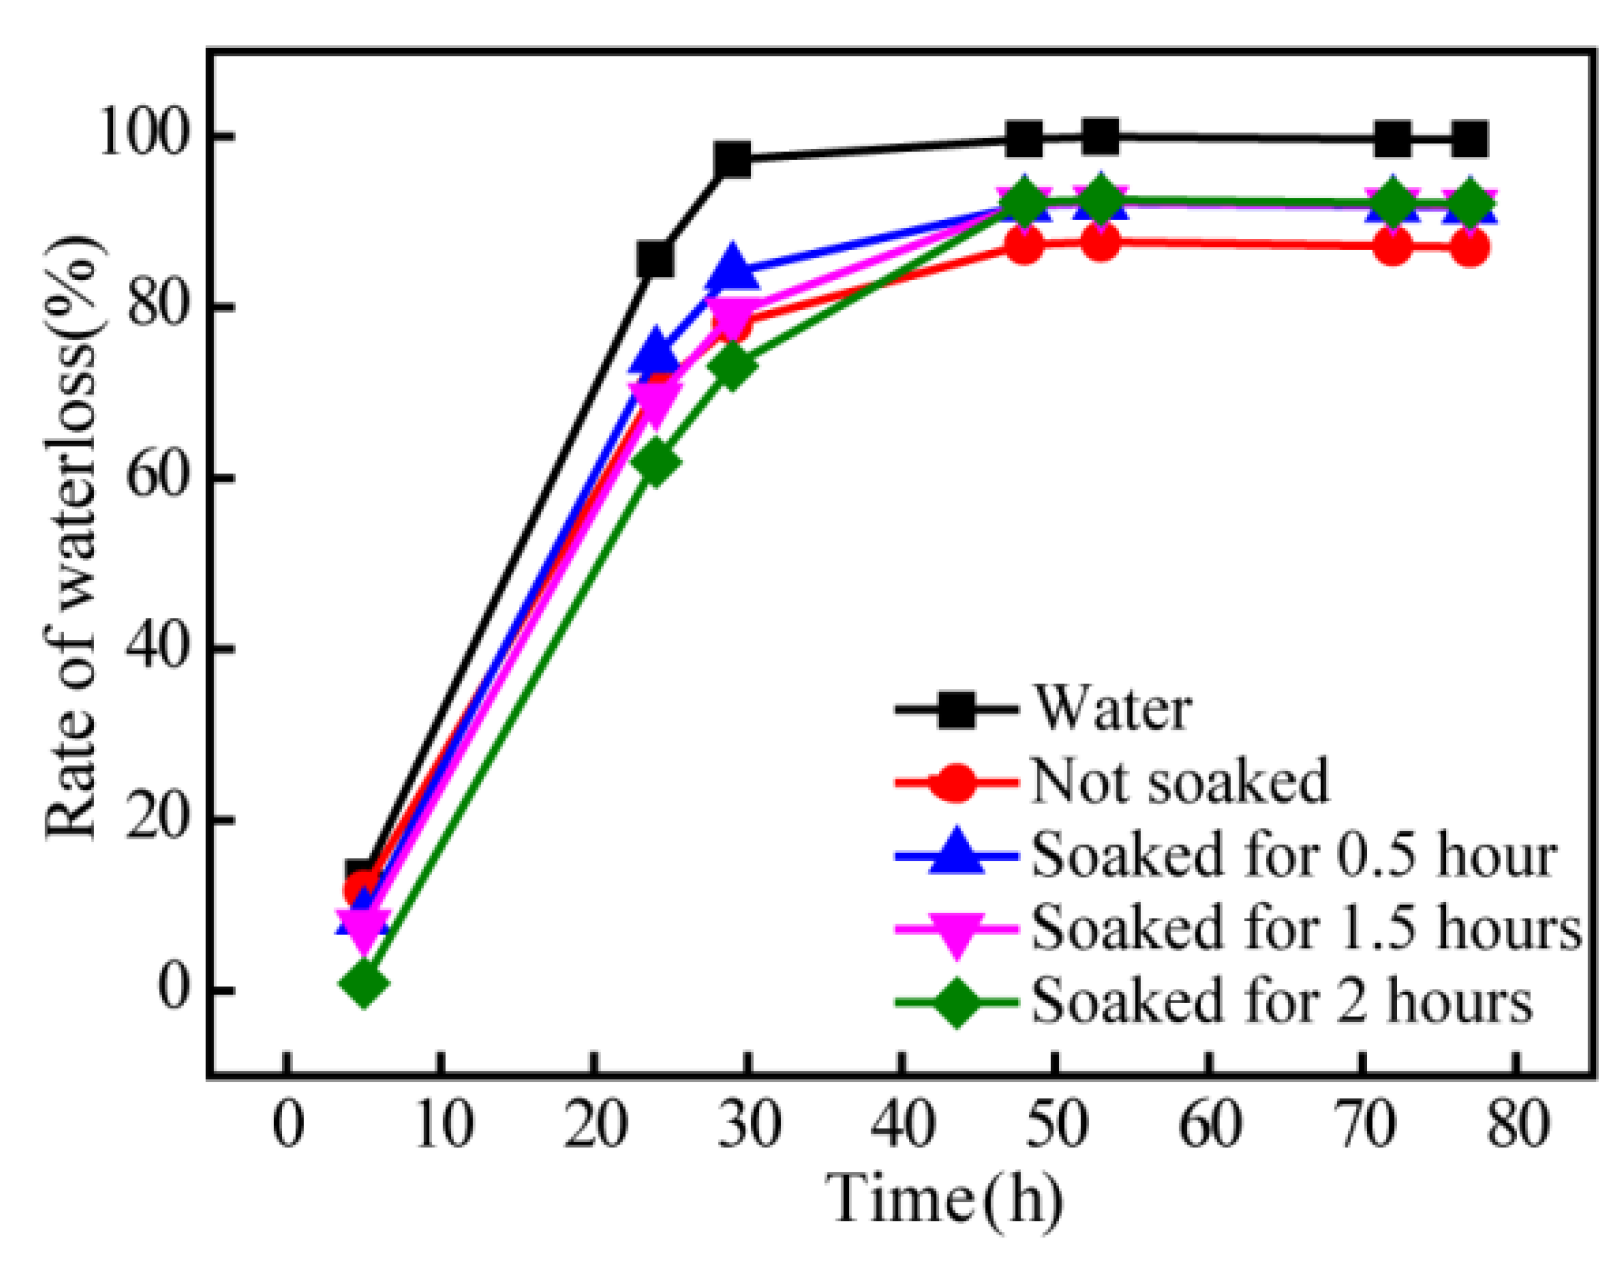
The test data on samples soaked for 1 h were discarded because the experiment had a different test date from other samples. Samples soaked in rainwater for 0.5 h, 1.5 h, and 2 h were tested for moisture retention, the variation curves of water loss rate over time for which are shown in Figure 9.
According to those experimental results, the water loss rates of soaked samples were small at the beginning of the experiment due to the increasing amount of water inside. As time passed, the water loss rates of soaked samples increased faster than those that were not soaked. At the 40th hour, the water loss rates of all soaked samples were higher than samples that were not soaked. Therefore, when the dust suppressant was subject to rain or soaked in water, the dust suppressant solution dissolved, resulting in a decreased moisture content rate in the dust. However, according to the experimental data, the water loss rate of the sample sprayed with dust suppressant was obviously lower than that of the sample sprayed with pure water. Moreover, within 40 h, water loss rates of all samples did not exceed 85%. Within 77 h, the water loss rate of soaked dust was about 92%; that is to say, the dust contained more than 5% of water. Based on the investigation and statistics on fugitive road dust, when the moisture content of dust was higher than 4%, it was not easy to raise. Therefore, the dust suppressant can maintain its performance for about 3 days even if it has been subject to rainfall.
3.2.5. Freezing Point Test
The freezing point of the dust suppressant formula is −5 °C according to the third-party detection of those samples, indicating a moderate anti-freezing performance. Therefore, its applicability is limited in northern winters. This dust suppressant formula can be adopted optionally at a temperature below −5 °C and is therefore suitable for most urban roads in spring, summer, autumn, and early winter.
3.2.6. Test for Physical and Chemical Properties
The PH, viscosity, surface tension, and density values of the dust suppressant solution for the optimal formula were measured, the physical and chemical properties of which are shown in Table 10.
According to the test for physical and chemical properties, the PH value of water is 6.81 and the PH of the dust suppressant is 7.74—near to neutral. The viscosity of water is about 1 mPa·s while the viscosity of dust suppressant is 10.98 mPa·s. Therefore, it has a bonding effect that condenses dust particles together and increases the dust particle size and density. It facilitates both settlement and spraying. The surface tension value of dust suppressant is 27.41 mN/m and that of clean water is 71 mN/m. This shows that the surface tension of dust suppressant decreases obviously, which can effectively accelerate the moisturizing rate of dust and the capture of dust. The density value of dust suppressant is 1.041 g/cm3 and has a small difference from the density value of clean water. Therefore, it can be proved that the formula solution can dissolve with water without sinking or floating, and its intuitive appearance is a clear solution.
4. Conclusions
An ecological road dust suppressant has been developed through a monomer experiment and orthogonal experiment in this paper. The best formula for the dust suppressant has been selected through the monomer, orthogonal, and optimization experiments. The following conclusions have been drawn after the characterization of the dust suppression performance with the optimal formula.
- (1)
- The humectant, hygroscopic agent, coagulant, and surfactant monomers that meet the performance requirements for a dust suppressant and their applicable concentration ranges have been obtained.
- (2)
- The range analysis has been conducted on each evaluation index through orthogonal experiment with the water loss rate, moisture content rate, viscosity value, viscosity value, and surface tension value serving as experimental indexes. The preliminary formula of the dust suppressant has been obtained through comprehensive equilibrium analysis.
- (3)
- According to the optimization experiment, the moisture absorption and retention performance of the dust suppressant have been enhanced by adding a certain amount of hygroscopic and moisturizing enhancer. According to the relative damage rate test on plant seeds, the dust suppressant has no toxic effect on plants. Thus, the optimal formula for the dust suppressant has been obtained.
- (4)
- According to the performance characterization of the ecological dust suppressant, the ecological and environmentally friendly dust suppressant demonstrates fine moisture absorption and retention performance, good wind and rain erosion resistance, and no toxicity.
Of course, this study has some limitations. The ecological dust suppressor is only applicable to urban road dust, and not to coal dust or other types of dust. Therefore, we will continue to develop eco-road dust suppressants for different types of dust in the future. The cost of developing dust suppressant will be lower, and the effect of controlling dust on urban road surfaces will be better.
Author Contributions
Field work and experiment, Y.W.; data analysis, Y.W. and M.C.; writing—original draft preparation, Y.W.; writing—revision and editing, Y.W., M.C. and C.D.; project administration, Y.W. and C.D.; funding acquisition, Y.W. and C.D. All authors have read and agreed to the published version of the manuscript.
Funding
This work was financially supported by the National Key R&D Program of China (No. 2018YFC0604605) and the Fundamental Research Fund for the Central Universities (No. FRF-TP-19-039A1).
Institutional Review Board Statement
Not applicable.
Informed Consent Statement
Not applicable.
Data Availability Statement
Not applicable.
Acknowledgments
We are grateful for the comments of the anonymous reviewers, which greatly improved the quality of this paper.
Conflicts of Interest
The authors declare no conflict of interest.
Nomenclature
| Roman symbols (upper case) | |
| PM2.5 | Particulate matter with particle size below 2.5 micrometers |
| PM10 | Particulate matter with particle size below 10 micrometers |
| Moisture content rates of dust samples in hour i (%) | |
| Mass of Petri dish and dust sample in hour i (g) | |
| Initial mass of dry Petri dish and dust sample (g) | |
| The mass of dry dust sample (g) | |
| The water loss rate of dust sample (%) | |
| Clean and dry Petri dish and the mass of dust sample (g) | |
| Mass of dust sample and Petri dish at hour i/day (g) | |
| Mass of 11 nm of solution (g) | |
| Leaf number of the plant at (t) | |
| Leaf number in the initial plant | |
| Experiment duration (day) | |
| Plant growth rate | |
| Growth rate of control group | |
| Growth rate of experimental group | |
| The absorbance at the wavelength of 665 nm | |
| The absorbance at the wavelength of 649 nm | |
| Concentration of chlorophyll a (mg/L) | |
| Concentration of chlorophyll b (mg/L) | |
| Chlorophyll content (mg/g) | |
| Volume of chlorophyll-extracting solution (mL) | |
| Dilution ratio of chlorophyll-extracting solution, which is 1 in this experiment | |
| The mass of crushed leaves (g) | |
| Wind erosion rates of dust samples (%) | |
| Mass of dust sample before wind erosion (g) | |
| Mass of dust sample after wind erosion (g) | |
| BS | Humectant |
| BS1 | Glycol |
| BS2 | Sucrose |
| BS3 | Triethanolamine |
| XS | Hygroscopic agent |
| XS1 | Organic solvent glycerin |
| XS2 | Triethanolamine |
| XS3 | Trimethylolpropane |
| XS4 | The mixture of glycerin and magnesium chloride |
| NB | Coagulant |
| NB1 | Polyacrylamide |
| NB2 | Methylcellulose |
| NB3 | Cassava starch |
| NB4 | Sodium polyacrylate |
| NB5 | Sodium carboxymethyl cellulose |
| BZ, | Surfactant |
| BZ1 | Sodium dodecyl benzene sulfonate |
| BZ2 | Sodium dodecyl sulfate |
| BZ3 | Phospholipid |
| BZ4 | Sodium lignosulfonate |
| BSi | The i indicates the concentration serial number of humectant in the orthogonal experiment |
| XSi | The i indicates the concentration serial number of hygroscopic agent in the orthogonal experiment |
| NBi | The i indicates the concentration serial number of coagulant in the orthogonal experiment |
| BZi | The i indicates the concentration serial number of surfactant in the orthogonal experiment |
References
- Wang, K.; Chen, J.X.; Bei, M.X.; He, M.Y. Study on the present situation, causes and countermeasures of urban atmospheric pollution. Environ. Dev. 2017, 29, 67–69. [Google Scholar]
- Hu, Y.Q.; Li, M.; Yan, X.; Zhang, C. Characteristics and inter annual variation of chemical components in typical road dust in Beijing. Environ. Sci. 2019, 40, 1645–1655. [Google Scholar]
- Gao, J.; Tian, H.; Cheng, K.; Lu, L.; Wang, Y.; Wu, Y.; Zhu, C.; Liu, K.; Zhou, J.; Liu, X.; et al. Seasonal and spatial variation of trace elements in multi-size airborne particulate matters of Beijing, China: Mass concentration, enrichment characteristics, source apportionment, chemical speciation and bioavailability. Atmos. Environ. 2014, 99, 257–265. [Google Scholar] [CrossRef]
- Sanders, T.G.; Quayenortey, J.A.; Jorgensen, D. Unpaved Road Dust Control in the Piceance Creek Basin in Rio Blanco County, Colorado. J. Transp. Eng. 2015, 141, 04014079. [Google Scholar] [CrossRef]
- Barnes, D.L.; Connor, B.; Trost, B.; McTigue, E.; Krauss, K.; Bluehorse, B. Managing Alaska’s Road-Dust Problem: A Model for Road Dust–Impacted Regions. J. Transp. Eng. Part A Syst. 2020, 146, 04020019. [Google Scholar] [CrossRef] [PubMed]
- Han, L.; Zhuang, G.; Cheng, S.; Wang, Y.; Li, J. Characteristics of re-suspended road dust and its impact on the atmospheric environment in Beijing. Atmos. Environ. 2007, 41, 7485–7499. [Google Scholar] [CrossRef]
- Gao, J.; Tian, H.; Cheng, K.; Lu, L.; Zheng, M.; Wang, S.; Hao, J.; Wang, K.; Hua, S.; Zhu, C.; et al. The variation of chemical characteristics of PM2.5 and PM10 and formation causes during two haze pollution events in urban Beijing, China. Atmos. Environ. 2015, 107, 1–8. [Google Scholar] [CrossRef]
- Jia, Y.H.; Peng, L.; Mu, L. The Chemical Composition and Sources of PM10 in Urban Road Dust. Appl. Mech. Mater. 2011, 71, 2749–2752. [Google Scholar] [CrossRef]
- Cheng, H.; Gong, W.; Wang, Z.; Zhang, F.; Wang, X.; Lv, X.; Liu, J.; Fu, X.; Zhang, G. Ionic composition of submicron particles (PM1.0) during the long-lasting haze period in January 2013 in Wuhan, central China. J. Environ. Sci. 2014, 26, 810–817. [Google Scholar] [CrossRef]
- Fan, S.B.; Zhang, D.X.; Tian, L.D.; Li, X.F.; Guo, J.J.; Lin, Y.N. Emission inventory and spatial distribution of road fugitive dust PM2.5 in Beijing. Res. Environ. Sci. 2016, 29, 20–28. [Google Scholar]
- Chen, N.; Cheng, S.; Zhou, Y.; Guo, X.; Fan, S.; Wang, H. Impact of Road Fugitive Dust on Air Quality in Beijing, China. Environ. Eng. Sci. 2010, 27, 825–834. [Google Scholar] [CrossRef]
- Chow, J.C.; Watson, J.; Ashbaugh, L.L.; Magliano, K.L. Similarities and differences in PM10 chemical source profiles for geological dust from the San Joaquin Valley, California. Atmos. Environ. 2003, 37, 1317–1340. [Google Scholar] [CrossRef]
- Bi, X.; Feng, Y.; Wu, J.; Wang, Y.; Zhu, T. Source apportionment of PM10 in six cities of northern China. Atmos. Environ. 2007, 41, 903–912. [Google Scholar] [CrossRef]
- Jin, X.Y. Application of anti wind and dust net in open coal storage yard. Coal Eng. 2008, 6, 37–40. [Google Scholar]
- Song, Q.Y.; Zhang, J.P.; Wang, Z.W.; Li, Z.H.; Shi, R.M.; Li, J.P.; Zhang, J.P. Study on dust control effect of wind-proof and dust control mesh in coal storage yard. Fuel Chem. Processes. 2007, 38, 12–17. [Google Scholar]
- Zhong, L.C.; Sun, X.R. Progress and evaluation of dust hazard and dust suppression technology. Shanghai Chem. Ind. 2010, 35, 26–30. [Google Scholar]
- Wang, S. Analysis on dust pollution control of urban roads, Commer. Car J. 2013, 6, 18–20. [Google Scholar]
- Edvardsson, K. Gravel roads and dust suppression, Road Mater. Pavement Des. 2009, 10, 439–469. [Google Scholar] [CrossRef]
- Anderson, F.G. A Study of dust control methods for mining of coal. Inf. Circ. 1974, 78, 1–16. [Google Scholar]
- Jin, H.; Nie, W.; Zhang, Y.; Wang, H.; Zhang, H.; Bao, Q.; Yan, J. Development of Environmental Friendly Dust Suppressant Based on the Modification of Soybean Protein Isolate. Processes 2019, 7, 165. [Google Scholar] [CrossRef] [Green Version]
- Jin, H.; Zhang, Y.S.; Chen, K.; Niu, K.; Wu, G.G.; Wei, X.R.; Wang, H.W. Preparation and characterization of a compo-site dust suppressant for coal mines. Polymers 2020, 12, 2942. [Google Scholar] [CrossRef] [PubMed]
- Jin, H.; Nie, W.; Zhang, H.; Liu, Y.; Bao, Q.; Wang, H.; Huang, D. Preparation and characterization of a novel environmentally friendly coal dust suppressant. J. Appl. Polym. Sci. 2018, 136. [Google Scholar] [CrossRef]
- Gang, L.I.; Fan, S.B.; Tian, G.; Huang, Y.H.; Qin, J.P.; Nie, L. Experiments of chemical dust suppressant control fugitive dust from asphalt roads. Munic. Adm. Technol. 2005, 7, 152–154. [Google Scholar]
- Ding, J.; Zhou, G.; Liu, D.; Jiang, W.; Wei, Z.; Dong, X. Synthesis and Performance of a Novel High-Efficiency Coal Dust Suppressant Based on Self-Healing Gel. Environ. Sci. Technol. 2020, 54, 7992–8000. [Google Scholar] [CrossRef] [PubMed]
- Ding, C.; Nie, B.; Yang, H.; Dai, L.; Zhao, C.; Zhao, F.; Li, H. Experimental Research on Optimization and Coal Dust Sup-pression Performance of Magnetized Surfactant Solution. Procedia Eng. 2011, 26, 1314–1321. [Google Scholar]
- Huang, Z.A.; Huang, Y.; Yang, Z.J.; Zhang, J.; Zhang, Y.H.; Gao, Y.K.; Shao, Z.L.; Zhang, L.H. Study on the physicochemical characteristics and dust suppression performance of new type chemical dust suppressant for copper mine pavement. Environ. Sci. Pollut. Res. 2021, 28, 59640–59651. [Google Scholar] [CrossRef]
- Xiao, Y.C.; Zheng, C.; Gan, M.K.; Lai, S.L. The preparation of CMC-PVA-AM dust suppression agent and its application appraisement. Adv. Mater. Res. 2015, 1120, 628–634. [Google Scholar] [CrossRef]
- Zheng, X.J.; Li, J.S.; Xue, F.; Meng, D.F.; Wu, X.J.; Huo, M.Q.; Xie, G.; Shi, J. The Applied research of new environment-friendly dust suppressant in city road. J. Environ. Eng. Technol. 2014, 4, 169–172. [Google Scholar]
- Zheng, X.Y.; Yu, B.Q.; Yang, W.Y.; Shi, Z.S.; Wang, Y.H. Properties analysis of starch—Based biodegradable dust suppressant under the microwave radiation. Ind. Saf. Environ. Prot. 2016, 42, 54–56. [Google Scholar]
- Ling, W.C.; Li, Z.Z.; Sun, C.H.; Fang, Y.Y.; Liu, G.Z. Eco-Toxicity and biodegradation of an acetate urban road dust suppressant. Res. Environ. Sci. 2016, 29, 1643–1650. [Google Scholar]
- Sun, J.; Zhou, G.; Gao, D.; Wei, Z.; Wang, N. Preparation and performance characterization of a composite dust suppressant for preventing secondary dust in underground mine roadways. Chem. Eng. Res. Des. 2020, 156, 195–208. [Google Scholar] [CrossRef]
- Zhao, Z.; Zhao, Y.; Hu, X.; Cheng, W.; Hou, J.; Song, C. Preparation and performance analysis of enteromorpha-based environmentally friendly dust suppressant. Powder Technol. 2021, 393, 323–332. [Google Scholar] [CrossRef]
- Wang, Y.H.; Jia, Z.C.; Jiang, L.T.; Fu, Z.X.; Yu, B.Q. Characterization and preparation of bagasse dust suppressant by microwave induced polymerization. Chin. J. Environ. Eng. 2017, 11, 4202–4209. [Google Scholar]
- Zheng, T.L.; Zheng, T.C.; Xu, G.X.; Hao, J.L.; Song, J.Q.; Wang, Y. Experimental study on field application of new polymer dust inhibitor. Sci. Technol. Ind. Parks. 2018, 8, 21–22. [Google Scholar]
- Peng, H.T.; Nie, W.; Liu, Z.Q.; Xiu, Z.H.; Yang, S.B.; Xu, C.W.; Ma, Q.X.; Guo, C. Optimization of externalspray negative-pressure mist-curtain dust suppression devices for roadheaders based on a multi-factororthogonal experiment. J. Clean. Prod. 2020, 275, 123603. [Google Scholar] [CrossRef]
- Wang, K.; Zhang, Y.; Cai, W.; Pei, X.; Hao, H.; Wang, Z. Study on the microscopic mechanism and optimization of dust suppression by compounding biological surfactants. Colloids Surf. A Physicochem. Eng. Asp. 2021, 625, 126850. [Google Scholar] [CrossRef]
- Yan, J.; Nie, W.; Zhang, H.; Xiu, Z.; Bao, Q.; Wang, H.; Jin, H.; Zhou, W. Synthesis and performance measurement of a modified polymer dust suppressant. Adv. Powder Technol. 2019, 31, 792–803. [Google Scholar] [CrossRef]
Figure 1.
(a–d) Curves of water loss rate of humectants with concentrations of 2%, 4%, 6%, and 8% at 65 °C, respectively; (e–h) Curves of water loss rate of humectants with concentrations of 2%, 4%, 6%, and 8% under natural conditions, respectively.
Figure 1.
(a–d) Curves of water loss rate of humectants with concentrations of 2%, 4%, 6%, and 8% at 65 °C, respectively; (e–h) Curves of water loss rate of humectants with concentrations of 2%, 4%, 6%, and 8% under natural conditions, respectively.

Figure 2.
(a–d) Variation curves of moisture content rate of hygroscopic agent monomers with concentrations of 6%, 8%, 10%, and 12%, respectively.
Figure 2.
(a–d) Variation curves of moisture content rate of hygroscopic agent monomers with concentrations of 6%, 8%, 10%, and 12%, respectively.

Figure 3.
(a) Viscosity curve of coagulant solution with concentration; (b) mass proportion of dust with large particles; (c) change curve of surface tension of surfactant solution with concentration; (d) change curve of infiltration time with infiltration length.
Figure 3.
(a) Viscosity curve of coagulant solution with concentration; (b) mass proportion of dust with large particles; (c) change curve of surface tension of surfactant solution with concentration; (d) change curve of infiltration time with infiltration length.

Figure 4.
(a–d) Influence trend of factor levels on water loss rate, moisture content rate, viscosity value, and surface tension, respectively.
Figure 4.
(a–d) Influence trend of factor levels on water loss rate, moisture content rate, viscosity value, and surface tension, respectively.

Figure 5.
(a) Variation curves of water loss rate of samples; (b) variation curves of the hygroscopicity rate of samples with moisture.
Figure 5.
(a) Variation curves of water loss rate of samples; (b) variation curves of the hygroscopicity rate of samples with moisture.

Figure 6.
(a–f) Germination of plant seeds cultured with the optimal formula solution, the preliminary formula solution, and the pure water on days 1, 3, 5, 8, 10, and 12, respectively.
Figure 6.
(a–f) Germination of plant seeds cultured with the optimal formula solution, the preliminary formula solution, and the pure water on days 1, 3, 5, 8, 10, and 12, respectively.

Figure 7.
(a) Changes in ambient temperature and moisture during moisture retention test; (b) changes in ambient temperature and moisture during hygroscopicity test; (c) variation curves of water loss rate for samples under natural conditions; (d) variation curves of moisture content rate for samples under natural conditions.

Figure 8.
(a) Plant culture; (b) chlorophyll extraction.

Figure 9.
Variation curves of samples’ water loss rate over time.


Table 1.
Factor concentration level table.
| Concentration Serial Number | Factors | |||
|---|---|---|---|---|
| BS | XS | NB | BZ | |
| 1 | 3% | 3% | 0.06% | 0.06% |
| 2 | 4% | 4% | 0.08% | 0.08% |
| 3 | 5% | 5% | 0.10% | 0.10% |
| 4 | 6% | 6% | 0.12% | 0.12% |
Note: The i of BSi, XSi, NBi and BZi below indicates the concentration serial number of each component corresponding to this table.
Table 2.
The technical characteristics of the suppressant.
| Composition of Dust Suppressor | Technical Characteristics of the Suppressant |
|---|---|
| Humectant | It can resist evaporation, thus reducing the evaporation rate of the water contained in dust itself and the water absorbed by dust. The road dust is kept wet in this way, and the dust suppression duration of the dust suppressant can also be prolonged. |
| Hygroscopic agent | It serves to absorb moisture from the air when the ambient humidity is high. Thus, the moisture content rate of road dust and the road surface humidity can be increased so that the dust will not be easy to raise. |
| Coagulant (mainly) | It serves to delay water evaporation and bond the fine dust, so as to add weight to dust, to shorten the sedimentation time of fugitive dust, and thus to enhance the effect of the dust suppressant. |
| Surfactant | It serves to reduce the surface tension of dust suppressant solution and accelerate the speed for road dust infiltration. |
Table 3.
Data from orthogonal experiment.
| Experiment Group Numbers | Factors | Water Loss Rate (%) | Moisture Content Rate (%) | Viscosity (mPa·s) | Surface Tension (mN/m) | |||
|---|---|---|---|---|---|---|---|---|
| BS | XS | NB | BZ | |||||
| 1 | 1 | 1 | 1 | 1 | 93.09 | 8.33 | 6.39 | 23.95 |
| 2 | 1 | 2 | 2 | 2 | 92.19 | 9.37 | 7.24 | 27.32 |
| 3 | 1 | 3 | 3 | 3 | 91.17 | 10.56 | 8.44 | 24.67 |
| 4 | 1 | 4 | 4 | 4 | 90.17 | 11.23 | 9.60 | 26.14 |
| 5 | 2 | 1 | 2 | 3 | 92.00 | 8.68 | 7.47 | 27.97 |
| 6 | 2 | 2 | 1 | 4 | 91.00 | 9.92 | 6.50 | 27.54 |
| 7 | 2 | 3 | 4 | 1 | 90.25 | 11.58 | 9.38 | 27.79 |
| 8 | 2 | 4 | 3 | 2 | 89.23 | 12.70 | 8.13 | 27.97 |
| 9 | 3 | 1 | 3 | 4 | 90.87 | 9.80 | 8.43 | 29.29 |
| 10 | 3 | 2 | 4 | 3 | 90.10 | 10.43 | 10.98 | 27.48 |
| 11 | 3 | 3 | 1 | 2 | 89.02 | 11.93 | 7.45 | 27.31 |
| 12 | 3 | 4 | 2 | 1 | 88.44 | 14.75 | 8.32 | 27.81 |
| 13 | 4 | 1 | 4 | 2 | 89.77 | 10.64 | 8.69 | 28.99 |
| 14 | 4 | 2 | 3 | 1 | 89.11 | 11.59 | 8.85 | 28.80 |
| 15 | 4 | 3 | 2 | 4 | 88.15 | 13.75 | 9.80 | 29.10 |
| 16 | 4 | 4 | 1 | 3 | 87.30 | 15.25 | 8.47 | 29.39 |
Table 4.
Optimal combinations of orthogonal experiment.
| Orthogonal Experiment Category | Indexes | Optimal Combinations |
|---|---|---|
| Moisture retention | Water loss rate | BS4XS4NB4BZ4 |
| Hygroscopicity | Moisture content rate | XS4BS4NB2BZ1 |
| Bonding performance | Viscosity value | NB4BS4XS3BZ3 |
| Infiltration performance | Surface tension value | BS1NB1BZ1XS3 |
Table 5.
Optimization design table for preliminary formula.
| Formula Names | Main Components | Optimized Components |
|---|---|---|
| 1# (Preliminary formula) | 6%BS, 6%XS, 0.12%NB and 0.06%BZ | -- |
| 2# (Optimized formula) | 6%BS, 6%XS, 0.12%NB and 0.06%BZ | 0.25%A |
| 3# (Optimized formula) | 6%BS, 6%XS, 0.12%NB and 0.06%BZ | 0.50%A |
| 4# (Optimized formula) | 6%BS, 6%XS, 0.12%NB and 0.06%BZ | 0.75%A |
| 5# (Optimized formula) | 6%BS, 6%XS, 0.12%NB and 0.06%BZ | 1.00%A |
Table 6.
Relative damage rates of plant seeds.
| Category | Serial Number | Sprout Number | Germination Rate (%) | Average Values (%) | Relative Damage Rates (%) |
|---|---|---|---|---|---|
| Optimal formula | 1 | 58 | 58 | 63 | 29% |
| 2 | 55 | 55 | |||
| 3 | 75 | 75 | |||
| Preliminary formula | 4 | 72 | 72 | 81 | 9% |
| 5 | 85 | 85 | |||
| 6 | 85 | 85 | |||
| Pure water | 7 | 85 | 85 | 89 | -- |
| 8 | 93 | 93 | |||
| 9 | 90 | 90 |
Table 7.
Experimental results on plant survival rate.
| Category | Leaf Number on Day 1 | Leaf Number on Day 7 | Growth Speed | Inhibition Percentage |
|---|---|---|---|---|
| Pure water | 34 | 35 | 0.0041 | 0 |
| Dust suppressant | 34 | 38 | 0.0159 | −288 |
Table 8.
Measurement results on chlorophyll contents in plants.
| Category | Absorbance at 665 nm | Absorbance at 649 nm | Chlorophyll a Content (mg/L) | Chlorophyll b (mg/L) | Chlorophyll Content (mg/g) |
|---|---|---|---|---|---|
| Pure water | 1.151 | 0.785 | 10.656 | 11.168 | 2.182 |
| Dust suppressant | 2.510 | 1.052 | 27.777 | 7.885 | 3.566 |
Table 9.
Results for wind erosion resistance test.
| Wind Speed (m/s) | Sample Sprayed with Water | Sample Sprayed with Dust Suppressant | ||||
|---|---|---|---|---|---|---|
| Mass before Wind Erosion (g) | Mass after Wind Erosion (g) | Wind Erosion Rate (%) | Mass before Wind Erosion (g) | Mass after Wind Erosion (g) | Wind Erosion Rate (%) | |
| 5 | 35.0575 | 32.2407 | 9.39 | 37.6814 | 37.6880 | 0 |
| 10 | 35.1908 | 31.9007 | 10.97 | 37.1857 | 37.1855 | 0 |
Table 10.
Physical and chemical properties of dust suppressant.
| Serial Number | PH | Viscosity (mPa·s) | Surface Tension (mN/m) | Density (g/cm3) |
|---|---|---|---|---|
| 1 | 7.83 | 10.32 | 27.39 | 1.046 |
| 2 | 7.76 | 10.97 | 27.49 | 1.037 |
| 3 | 7.62 | 11.10 | 27.36 | 1.041 |
| Average | 7.74 | 11.80 | 27.41 | 1.041 |
Publisher’s Note: MDPI stays neutral with regard to jurisdictional claims in published maps and institutional affiliations. |
© 2021 by the authors. Licensee MDPI, Basel, Switzerland. This article is an open access article distributed under the terms and conditions of the Creative Commons Attribution (CC BY) license (https://creativecommons.org/licenses/by/4.0/).
Share and Cite
MDPI and ACS Style
Wang, Y.; Du, C.; Cui, M. Formulation Development and Performance Characterization of Ecological Dust Suppressant for Road Surfaces in Cities. Appl. Sci. 2021, 11, 10466. https://0-doi-org.brum.beds.ac.uk/10.3390/app112110466
AMA Style
Wang Y, Du C, Cui M. Formulation Development and Performance Characterization of Ecological Dust Suppressant for Road Surfaces in Cities. Applied Sciences. 2021; 11(21):10466. https://0-doi-org.brum.beds.ac.uk/10.3390/app112110466
Chicago/Turabian StyleWang, Yuan, Cuifeng Du, and Mengmeng Cui. 2021. "Formulation Development and Performance Characterization of Ecological Dust Suppressant for Road Surfaces in Cities" Applied Sciences 11, no. 21: 10466. https://0-doi-org.brum.beds.ac.uk/10.3390/app112110466
Note that from the first issue of 2016, this journal uses article numbers instead of page numbers. See further details here.