
Estimation of Burst Pressure of PVC Pipe Using Average Shear Stress Yield Criterion: Experimental and Numerical Studies

1
School of Water Resources and Hydropower Engineering, Wuhan University, Wuhan 430070, China
2
Material and Structural Engineering Department, Nanjing Hydraulic Research Institute, Nanjing 210029, China
3
School of Civil Engineering, Chongqing University, Chongqing 400045, China
*
Author to whom correspondence should be addressed.
Appl. Sci. 2021, 11(21), 10477; https://0-doi-org.brum.beds.ac.uk/10.3390/app112110477
Submission received: 30 September 2021
/
Revised: 28 October 2021
/
Accepted: 31 October 2021
/
Published: 8 November 2021
Abstract
:Polyvinyl chloride (PVC) pipes have been extensively applied in water supply network fields. Understanding the mechanical properties and burst pressure of PVC pipes is necessary because a large number of pipes rupture due to excessive internal water pressure. In this paper, a practical approach based on the average shear stress yield (ASSY) criterion was proposed to assess the PVC pipe burst pressure. In addition, the PVC uniaxial tensile tests and the pipe burst tests were carried out to determine the material characteristic parameters and burst pressure of the PVC pipe. Furthermore, a finite element analysis (FEA) of PVC burst pressure was also performed based on the tangent intersection (TI) method to validate the proposed method and experimental results. Moreover, the impact of material parameters and pipe size, such as the strain hardening exponent and standard dimension ratio (SDR) on bursting pressure, were investigated. The comparison with the proposed theoretical model and the experimental and FEA results shows that the burst pressure derived from ASSY was consistent with the experimental data, with a relative error ranging from −2.76% to 2.65%, which is more accurate compared to other yield criteria. The burst pressure obtained by the ASSY approach declined with the increase of the hardening exponent n and increased with the increase of SDR. Therefore, the burst pressure solution-based ASSY proposed in this paper is an adequately suitable and precise predictive tool for assessing the failure pressure of PVC pipes.
1. Introduction
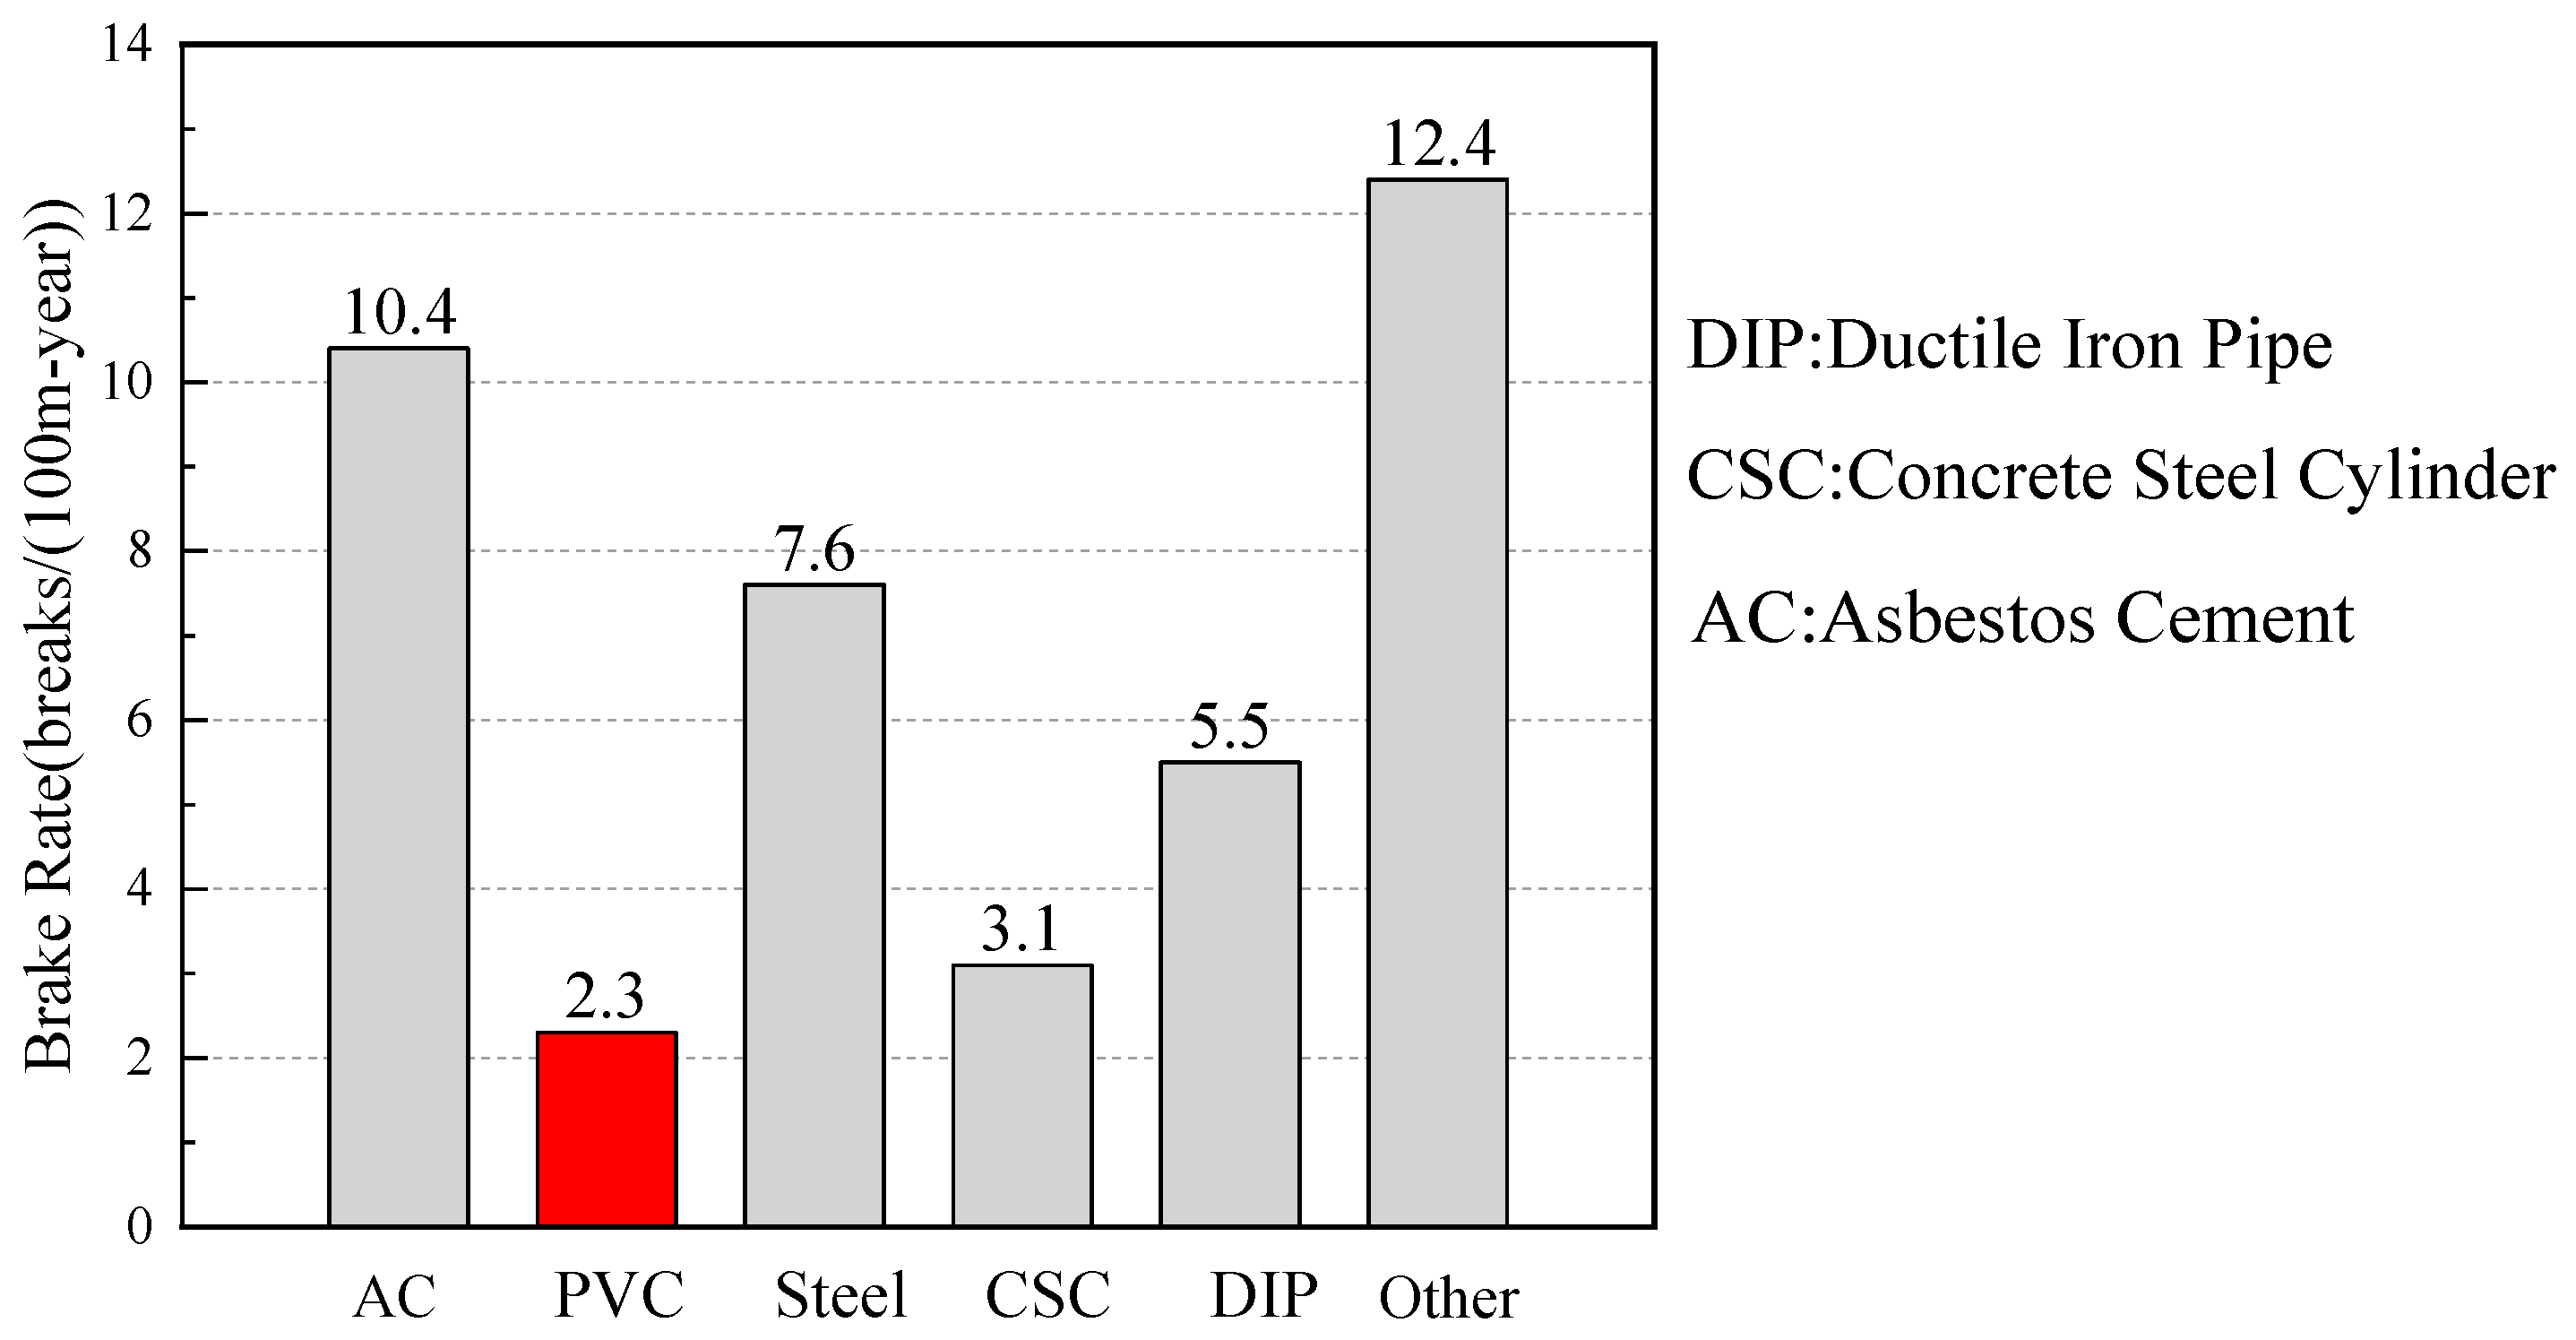
Water pipelines are critical infrastructures and pipe burst accidents have caused huge economic and social losses [1]. A study on water pipes in the United States and Canada showed that in the past six years, the proportion of pipe breaks and failures has increased by 27%, with collected data on approximately 23,803 water pipe cracks, involving 170,569 miles of pipelines, which accounted for 12.9% of the total water pipe length in the United States and Canada [2,3]. For every 100 miles of pipeline, there are 14 ruptures per year. When it comes to polyvinyl chloride (PVC) pipes, this statistical data reaches 2.3 per 100 miles as shown in Figure 1. There are more than 190 pipe rupture accidents recorded by China web news media each year and the diameters of those broken pipes belonged to the DN200~DN600, DN800, and DN1000~DN1200 [4]. The water cut and drop of water pressure caused by pipe burst events seriously affects the urban water supply for residents. How to avoid and hinder broken pipe accidents due to excessive water pressure has become an important research field [5,6,7,8].
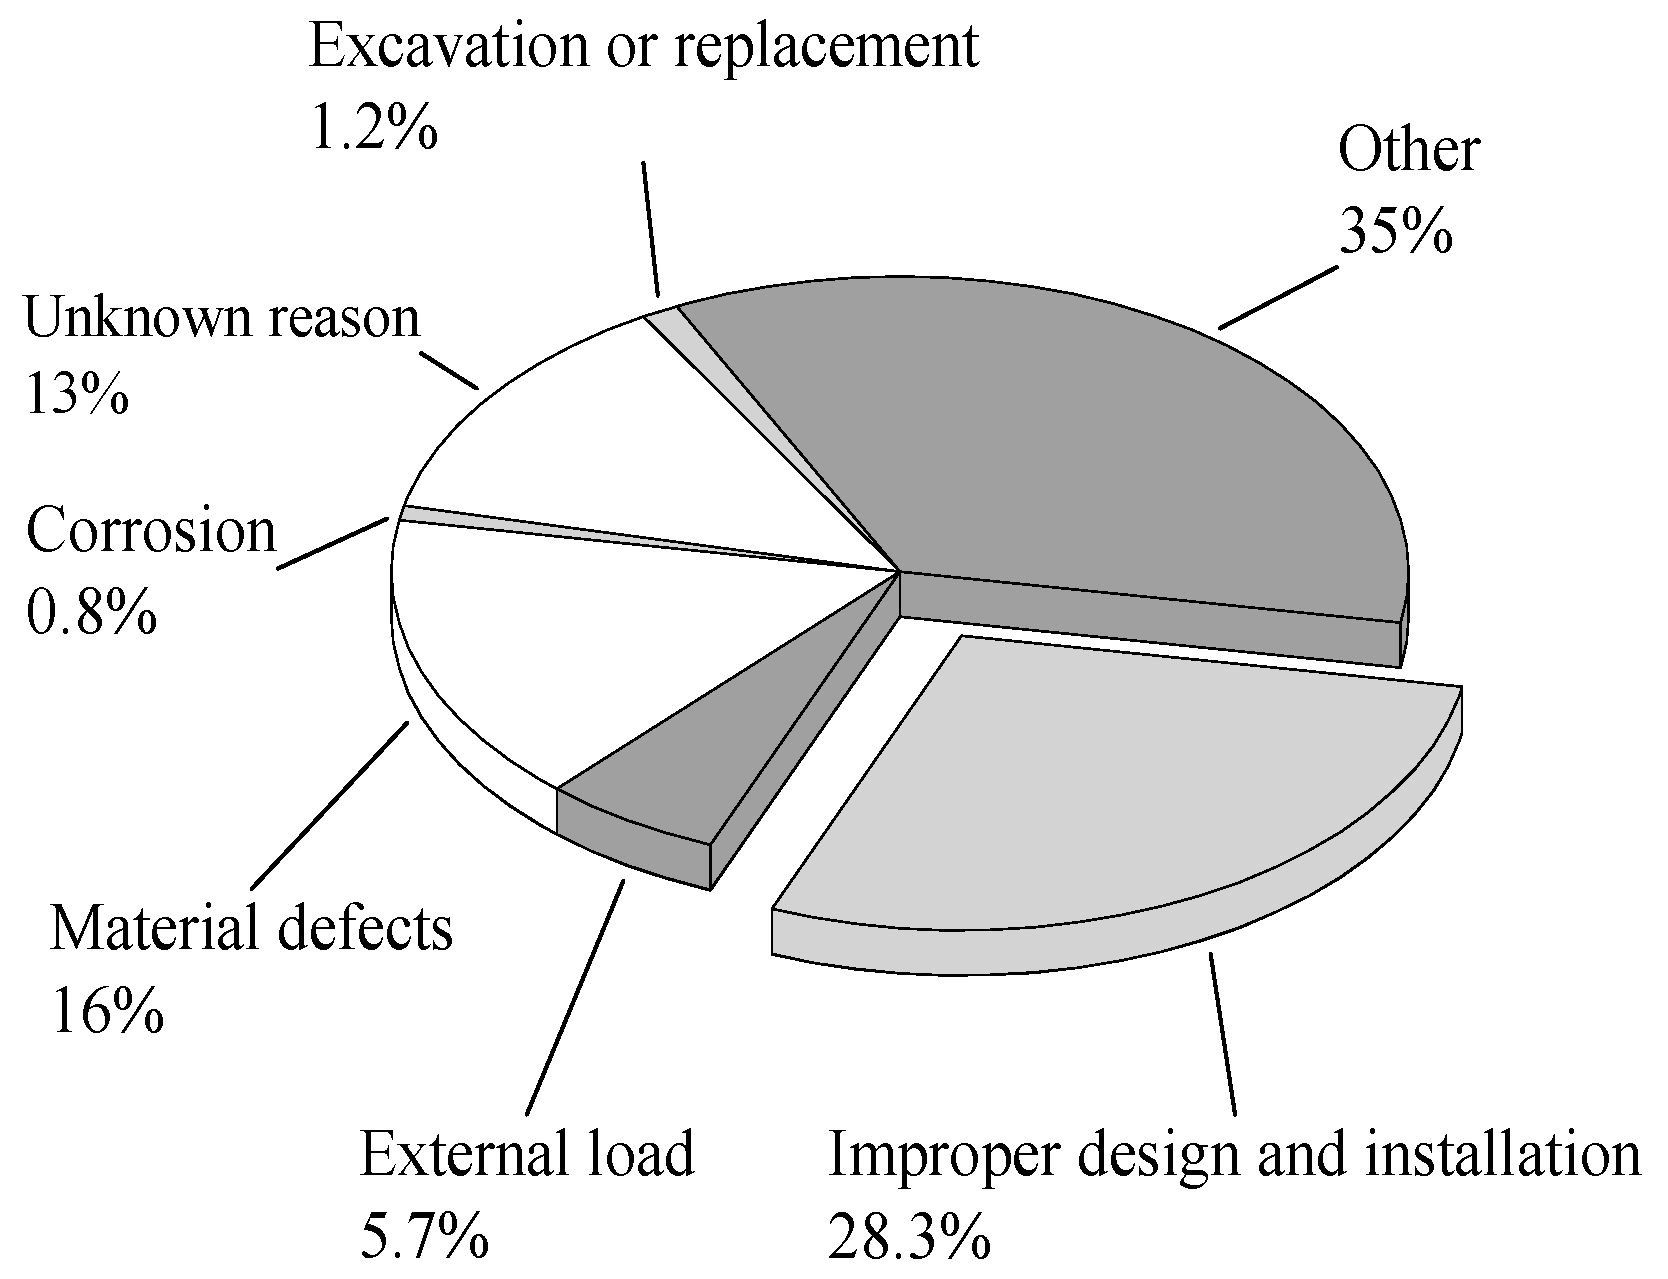
Water pipe rupture is related to the mechanical properties of the pipe material and environment, while internal pressure load is also an important factor leading to pipe burst [9]. According to a study by the Plastic Pipe Database Committee (PPDC) of the United States, design and installation errors account for the largest proportion of PVC pipe failure causes, followed by material defects (Figure 2), meaning that inappropriate pipe products with working pressure specifications that do not meet the requirements were selected and installed in the pipe engineering design and construction. In addition, several researchers have found that extreme water pressure caused by water hammers is one of the most common factors affecting PVC pipe bursts [10,11,12,13]. For the ultimate strength analysis, the burst pressure of a pipe is an important parameter in PVC pipeline design and safe operation, which is determined as the internal water pressure resulting in pipe rupture. Therefore, accurate burst pressure prediction is needed in support of pipe engineering critical assessment.
In the past few decades, evaluation methods for the pipe burst pressure have been developed to precisely estimate the failure pressure when the pipe cracking will occur. Currently, there are a variety of evaluation models to determine the pipe burst pressure [14,15,16,17]. In 1950, Cooper developed theoretical solutions based on the von Mises criterion. In mid-1990s, Steward et al. proposed a calculation model for thin-walled pipes with Tresca and von Mises criteria and used test data for verification [18]. Moreover, the CIS (cylindrical instability stress) concept was proposed by Law et al. for evaluation of the internal pressure bearing capacity of thin-walled pipes [19]. Numerical FEM investigations were developed by considering heavy cyclic thermal loads acting on the structure and a LCF criterion based on the von Mises equivalent strain concept [20,21]. These findings imply that the experimental data are inconsistent with those criteria due to the pipe being under complex stress states when burst occurred. Therefore, more a precise yield criterion is necessary to develop an accurate model for pipe burst pressure prediction.
Several experimental burst tests have been carried out to verify burst pressure models for thermoplastic pipes [1,13,22,23,24] Mohamed Amine Guidara et al. performed experimental burst tests on cracked high-density polyethylene (HDPE) pipes and investigated the mechanical behavior of HDPE when subjected to internal pressure [25]. Majid Fatima et al. proposed evaluation criteria of the internal pressure of rupture for pipes and experimented to validate both HDPE pipe and PVC specimens [26,27]. In addition, a new failure analysis and prediction model using burst pressure of undamaged HDPE pipes instead of ultimate stresses were developed and verified through the damaged HDPE pipes tests with different levels of groove notches.
In recent years, finite element analysis (FEA), as an effective and reliable simulation method, has been used in the limit analysis and safety assessment of water supply pipelines [28,29]. Several common burst pressure methods, usually described as a function of pipe diameter, pipe wall thickness, pipe material, and other parameters, have been studied for thermoplastic pipes, and the corresponding design criteria have been carefully analyzed [30]. Three ductile fracture models were proposed to obtain the burst pressure of a dented aluminum pipe and were verified using FEA by S. Jafari et al. [31]. A simplified method based on multi-dimensional analysis was proposed for the analysis of the ultimate water pressure bearing capacity for large-caliber water supply pipes [32]. Ma et al. revealed the influence of pipe material strength changes on burst pressure and analyzed the sources of errors in those models [33].
At present, there are still a large number of scholars carrying out the evaluation and analysis of the burst pressure of PVC pipes, using experimental testing, numerical simulation, and other methods [34]. However, precise determination of the pipe burst pressure is still unresolved when the proposed method is used for calculation, due to the diverse mechanical properties of PVC. In addition, various classic formulas also have their specific scopes of application and simplified conditions. Therefore, an analysis and predictive formulas for precise determination of burst pressure that are extensively applicable have still not been proposed.
The objective of the current paper is to accurately predict the short term burst pressure of PVC pipes through a theoretical model, laboratory burst tests, and FEA. Firstly, based on the proposed average shear stress yield (ASSY) theory, a new theoretical solution for the burst pressure of pipes is obtained. Then, the PVC material tensile test and pipe burst test are employed to validate the ASSY-based solution. Finally, the predicted results are compared with a series of experiments and FEA simulations. The comparison results show that the ASSY method provides a practical solution to demands for accurate prediction of PVC pipes’ burst pressure.
2. Theoretical Analysis
2.1. The Average Shear Stress Yield Criterion
In many limit analysis cases, the results of the Tresca and Mises yield criteria are not accurate enough for the neglect of the intermediate principal stress and the difference in material tensile and compression properties. However, some materials may have different tensile and compression properties, and most of them work under complex stress conditions. Many scholars have put forward different models as solutions and have achieved excellent results, the most representative of which is the unified strength theory proposed by Yu et al. [35]. In this theory, the difference in material strength and stress in three directions is cleverly considered with two parameters [35].
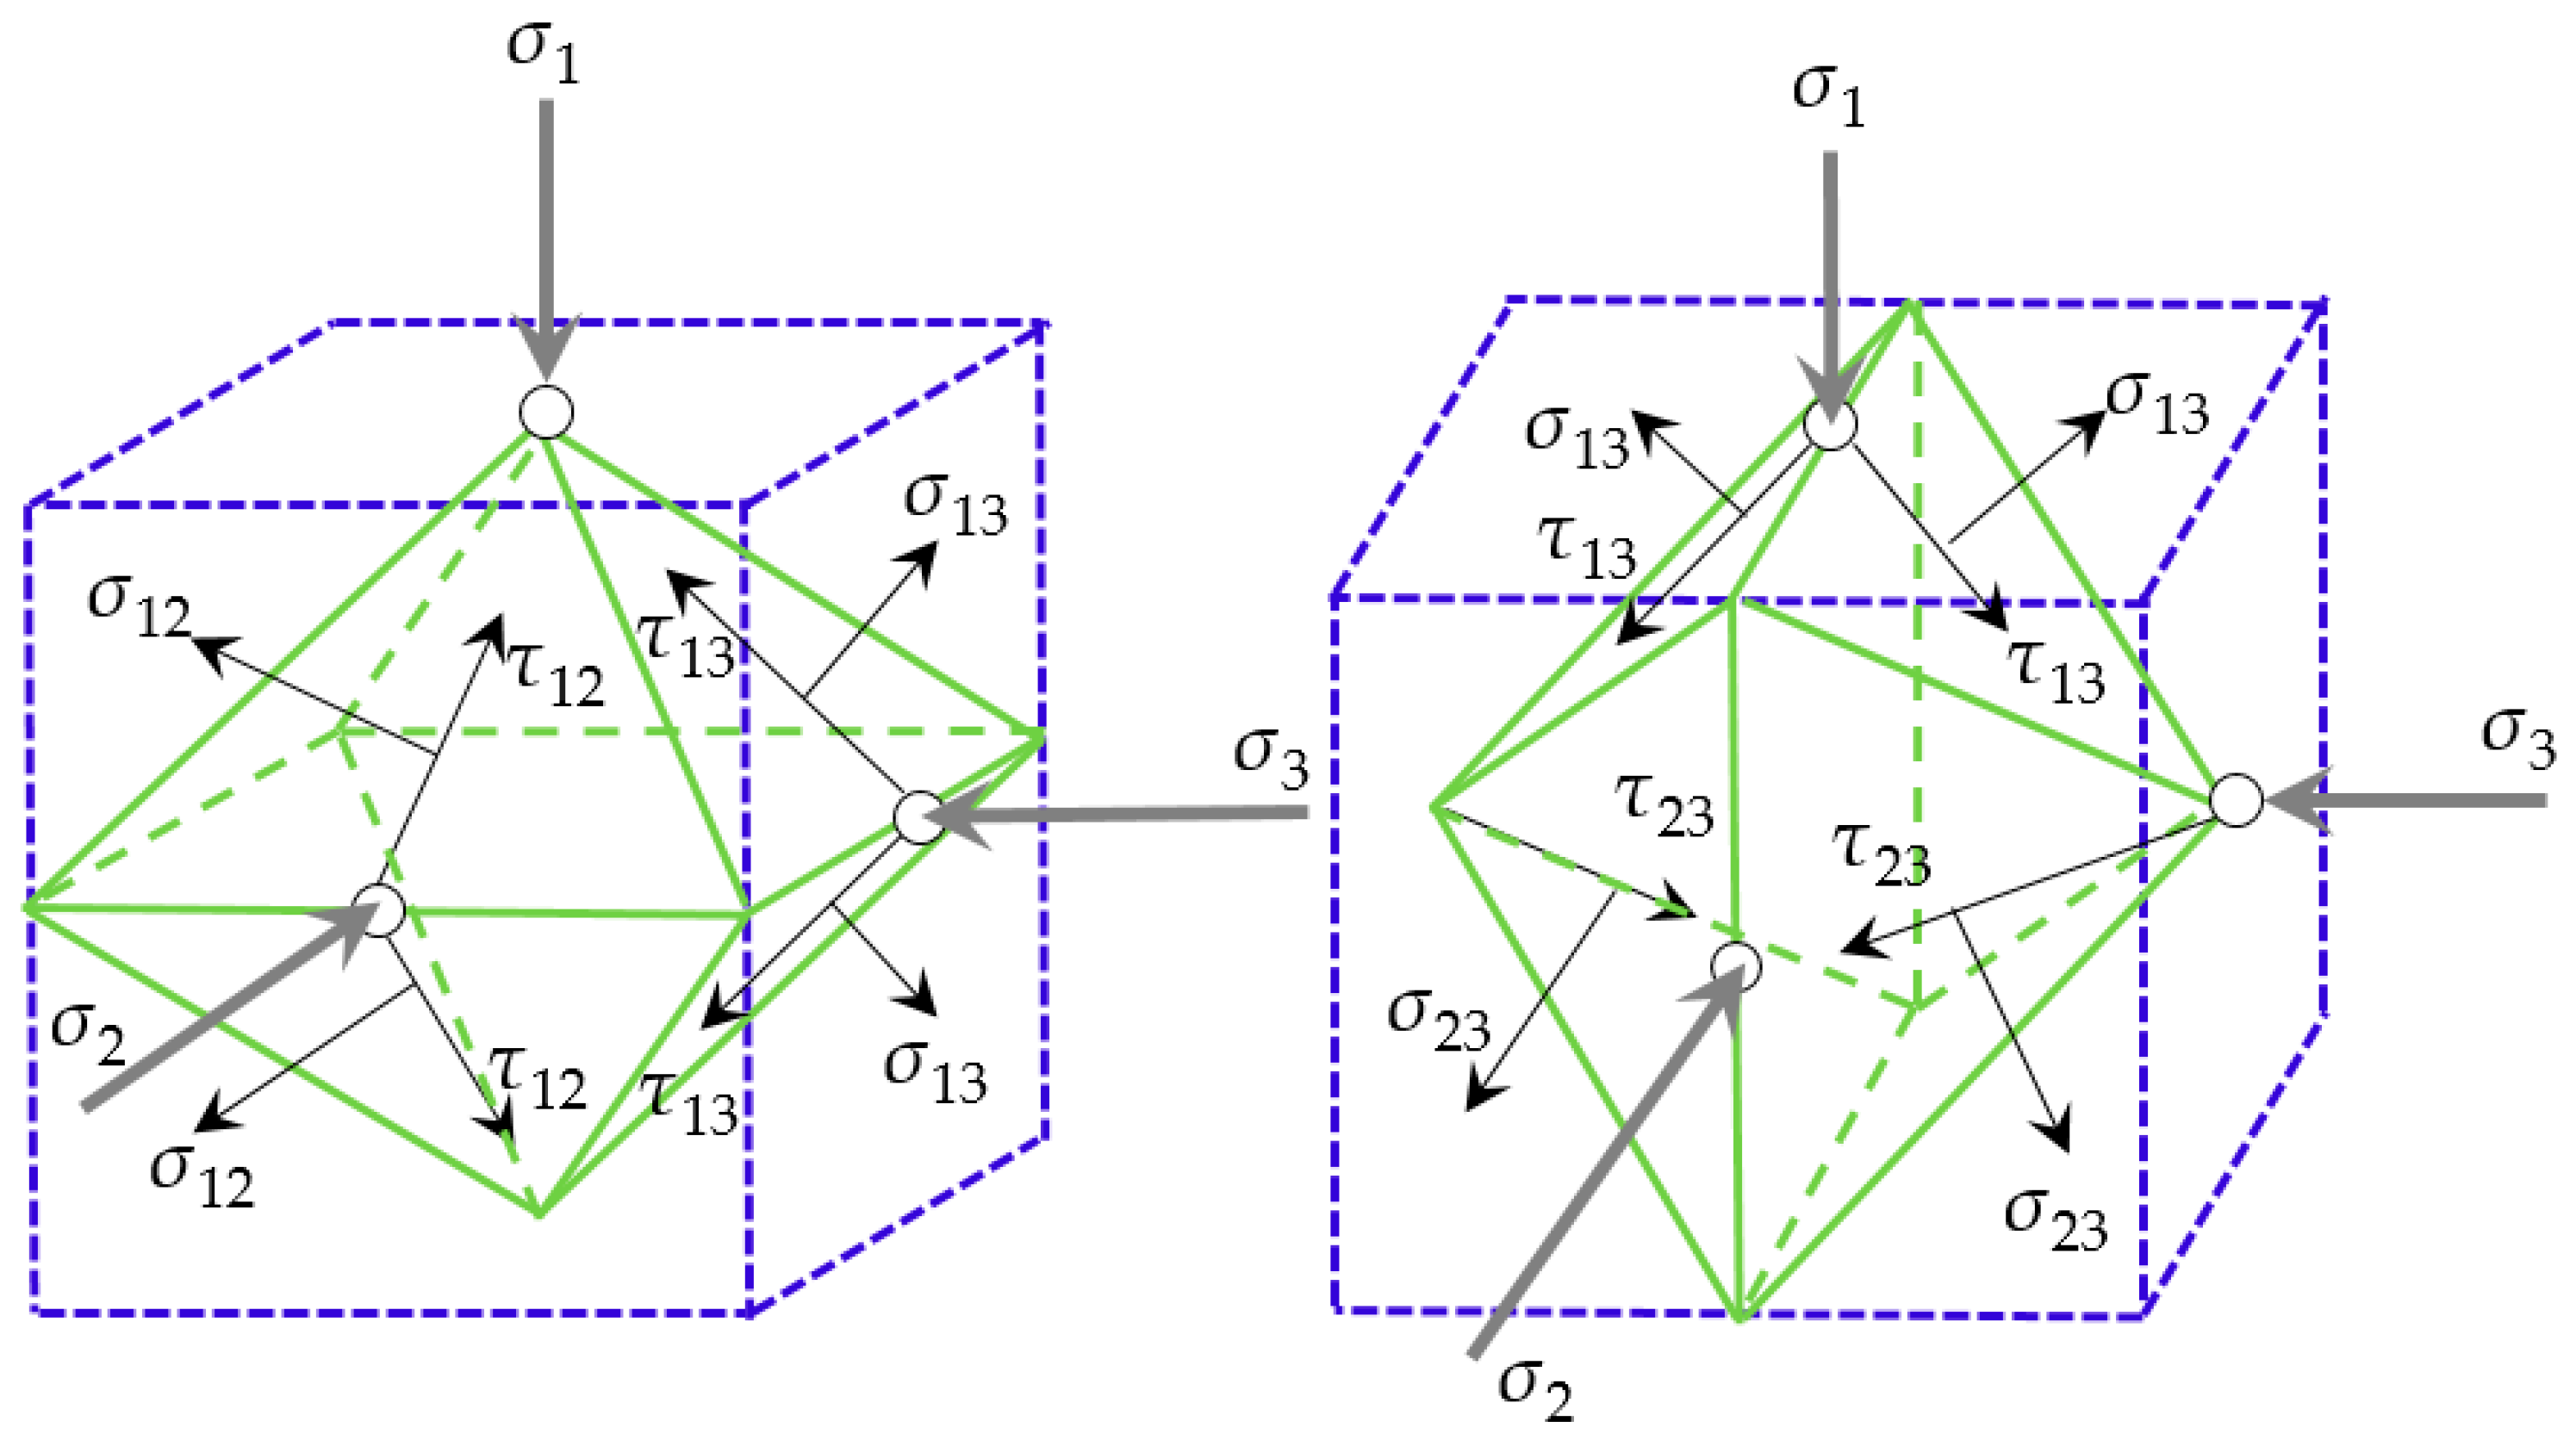
The principal stress in three directions (σ1, σ2, σ3) is transformed into the principal shear stress state (τ13, τ23, τ23) (Figure 3). The principal shear stress is converted into the double shear stress state (τ12, τ13, σ12, σ13) or (τ23, τ23, σ13, σ13) for only two independent quantities appearing in the latter. Its expression is obtained by the following:
where b is a material parameter reflecting the effect of intermediate principal stress; β and C are the coefficients which are determined by the material tensile strength limit σt and compressive strength limit σc; τ0 is the shear strength of the material; σt and σc are the uniaxial tensile strength and uniaxial compressive strength, respectively; and α = σt/σc represents the tensile and compression strength ratio.
The shear stress τ13, τ23, or τ12 and the normal stress σ13, σ12, or σ23 on the acting surface are
Therefore, the principal stress expression is
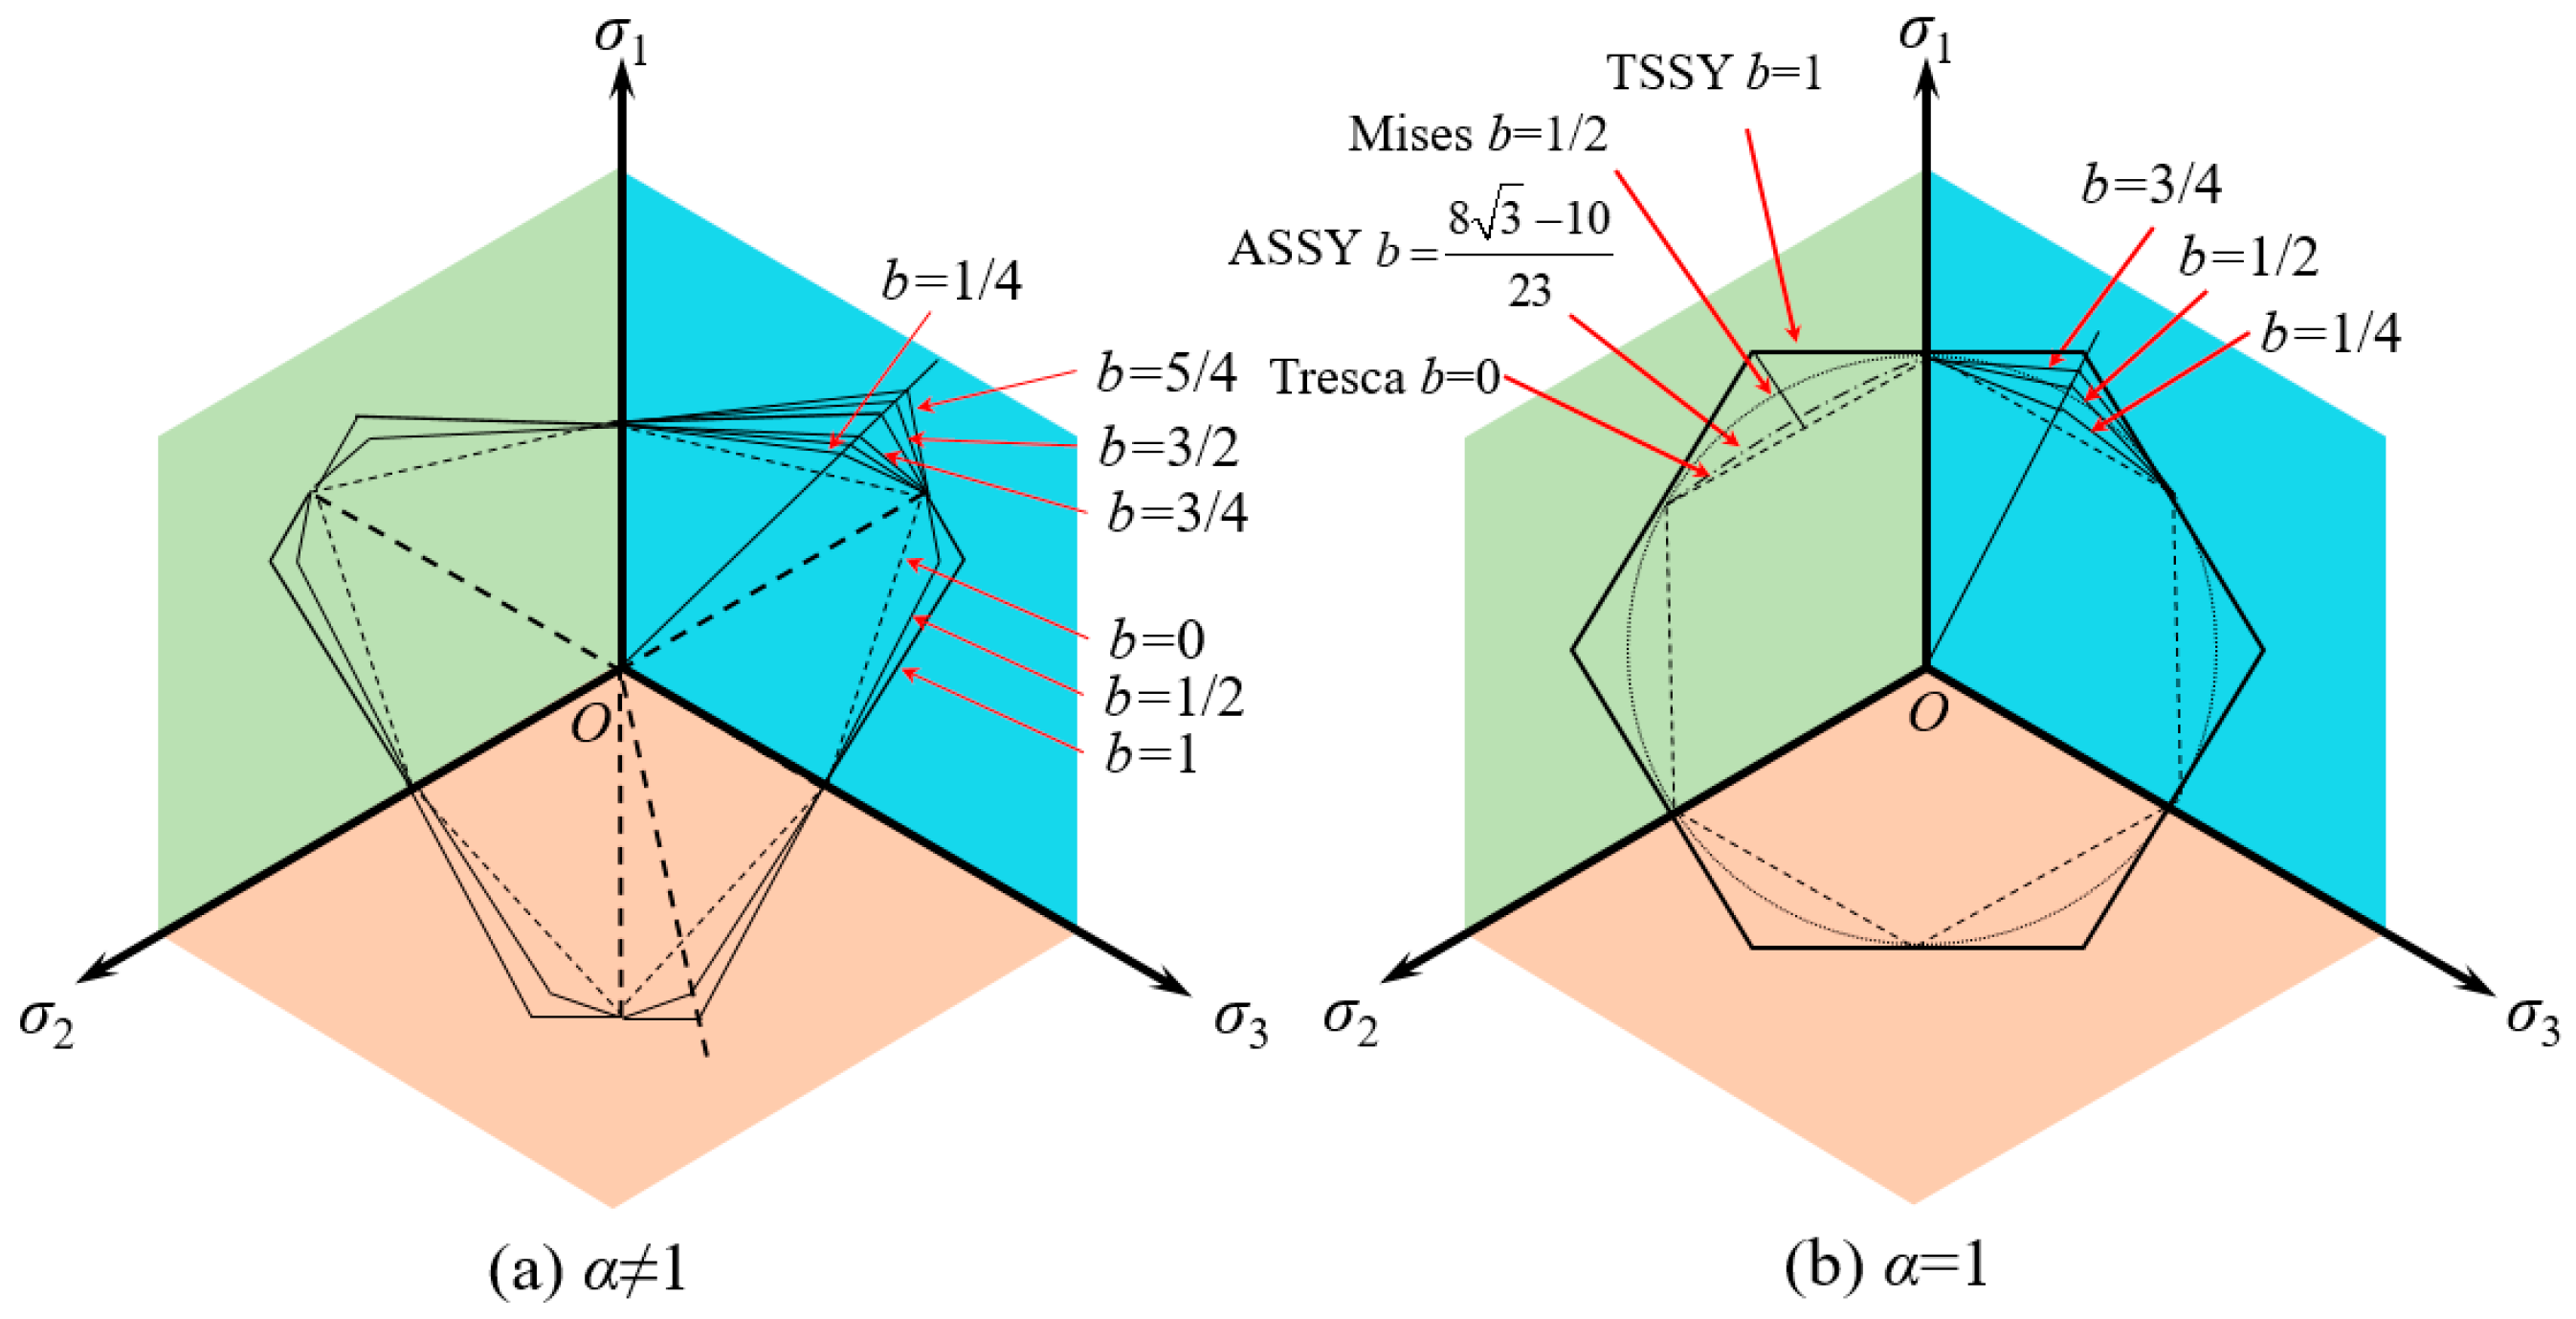
Equation (3) indicates that the unified strength theoretical model contains two material parameters, α and b. When the parameters α and b take values between 0 and 1, various yield criteria are obtained (Figure 4). As shown in Equation (5), when α = 1 and b = 0, Equation (3) is converted to the Tresca yield criterion. Similarly, when α = 1 and b = 1/2, the Mises yield criterion is obtained. Apart from these two yield criterion, the twin shear stress yield (TSSY) criterion established by Yu is a relatively common yield criterion applicable to most materials [35]. When α = 1 and b = 1, TSSY is expressed as Equation (5).
where σT, σM, and σTS are the equivalent stress based on Tresca, Mises, and Twin shear stress yield criterion, respectively.
When the Tresca and von Mises yield criterion are used in material plasticity analysis, many studies have confirmed that the initial yield and post-yielding occur between those two theories’ predictions [28,31]. To describe this plastic yield behavior more accurately, a new yield model, the ASSY criterion for isotropic hardening materials, was introduced and applied to burst pressure determination [36]. The average shear stress is defined as the average value of the maximum shear stress and the von Mises effective shear stress with the assumption that the material yields when the average stress reaches a critical value. According to Equations (3) and (4), when α = 1 and , using the assumption of σ1 ≥ σ2 ≥ σ3, the equivalent stress based on ASSY is expressed as
where σA is the equivalent stress based on ASSY.
2.2. Stress–Strain Relationship of PVC
Most polymer materials are ductile and show a nonlinear relationship between stress and strain. The power exponential constitutive model, as shown in Figure 5, has significant advantages in describing the nonlinear behavior of materials from plastic deformation to failure [37].
Therefore, the power law curve is applied to characterize the stress–strain relationship of PVC material as follows:
where σ′ and ε′ are the uniaxial true stress and true strain in simple tension; εt′ represents the true strain of ultimate strength; σt and εt represent the uniaxial engineering stress and uniaxial engineering strain; σy represents the yield strength; and n and K are the strain hardening index and strengthening coefficient, respectively.
2.3. Burst Pressure Solution Based ASSY
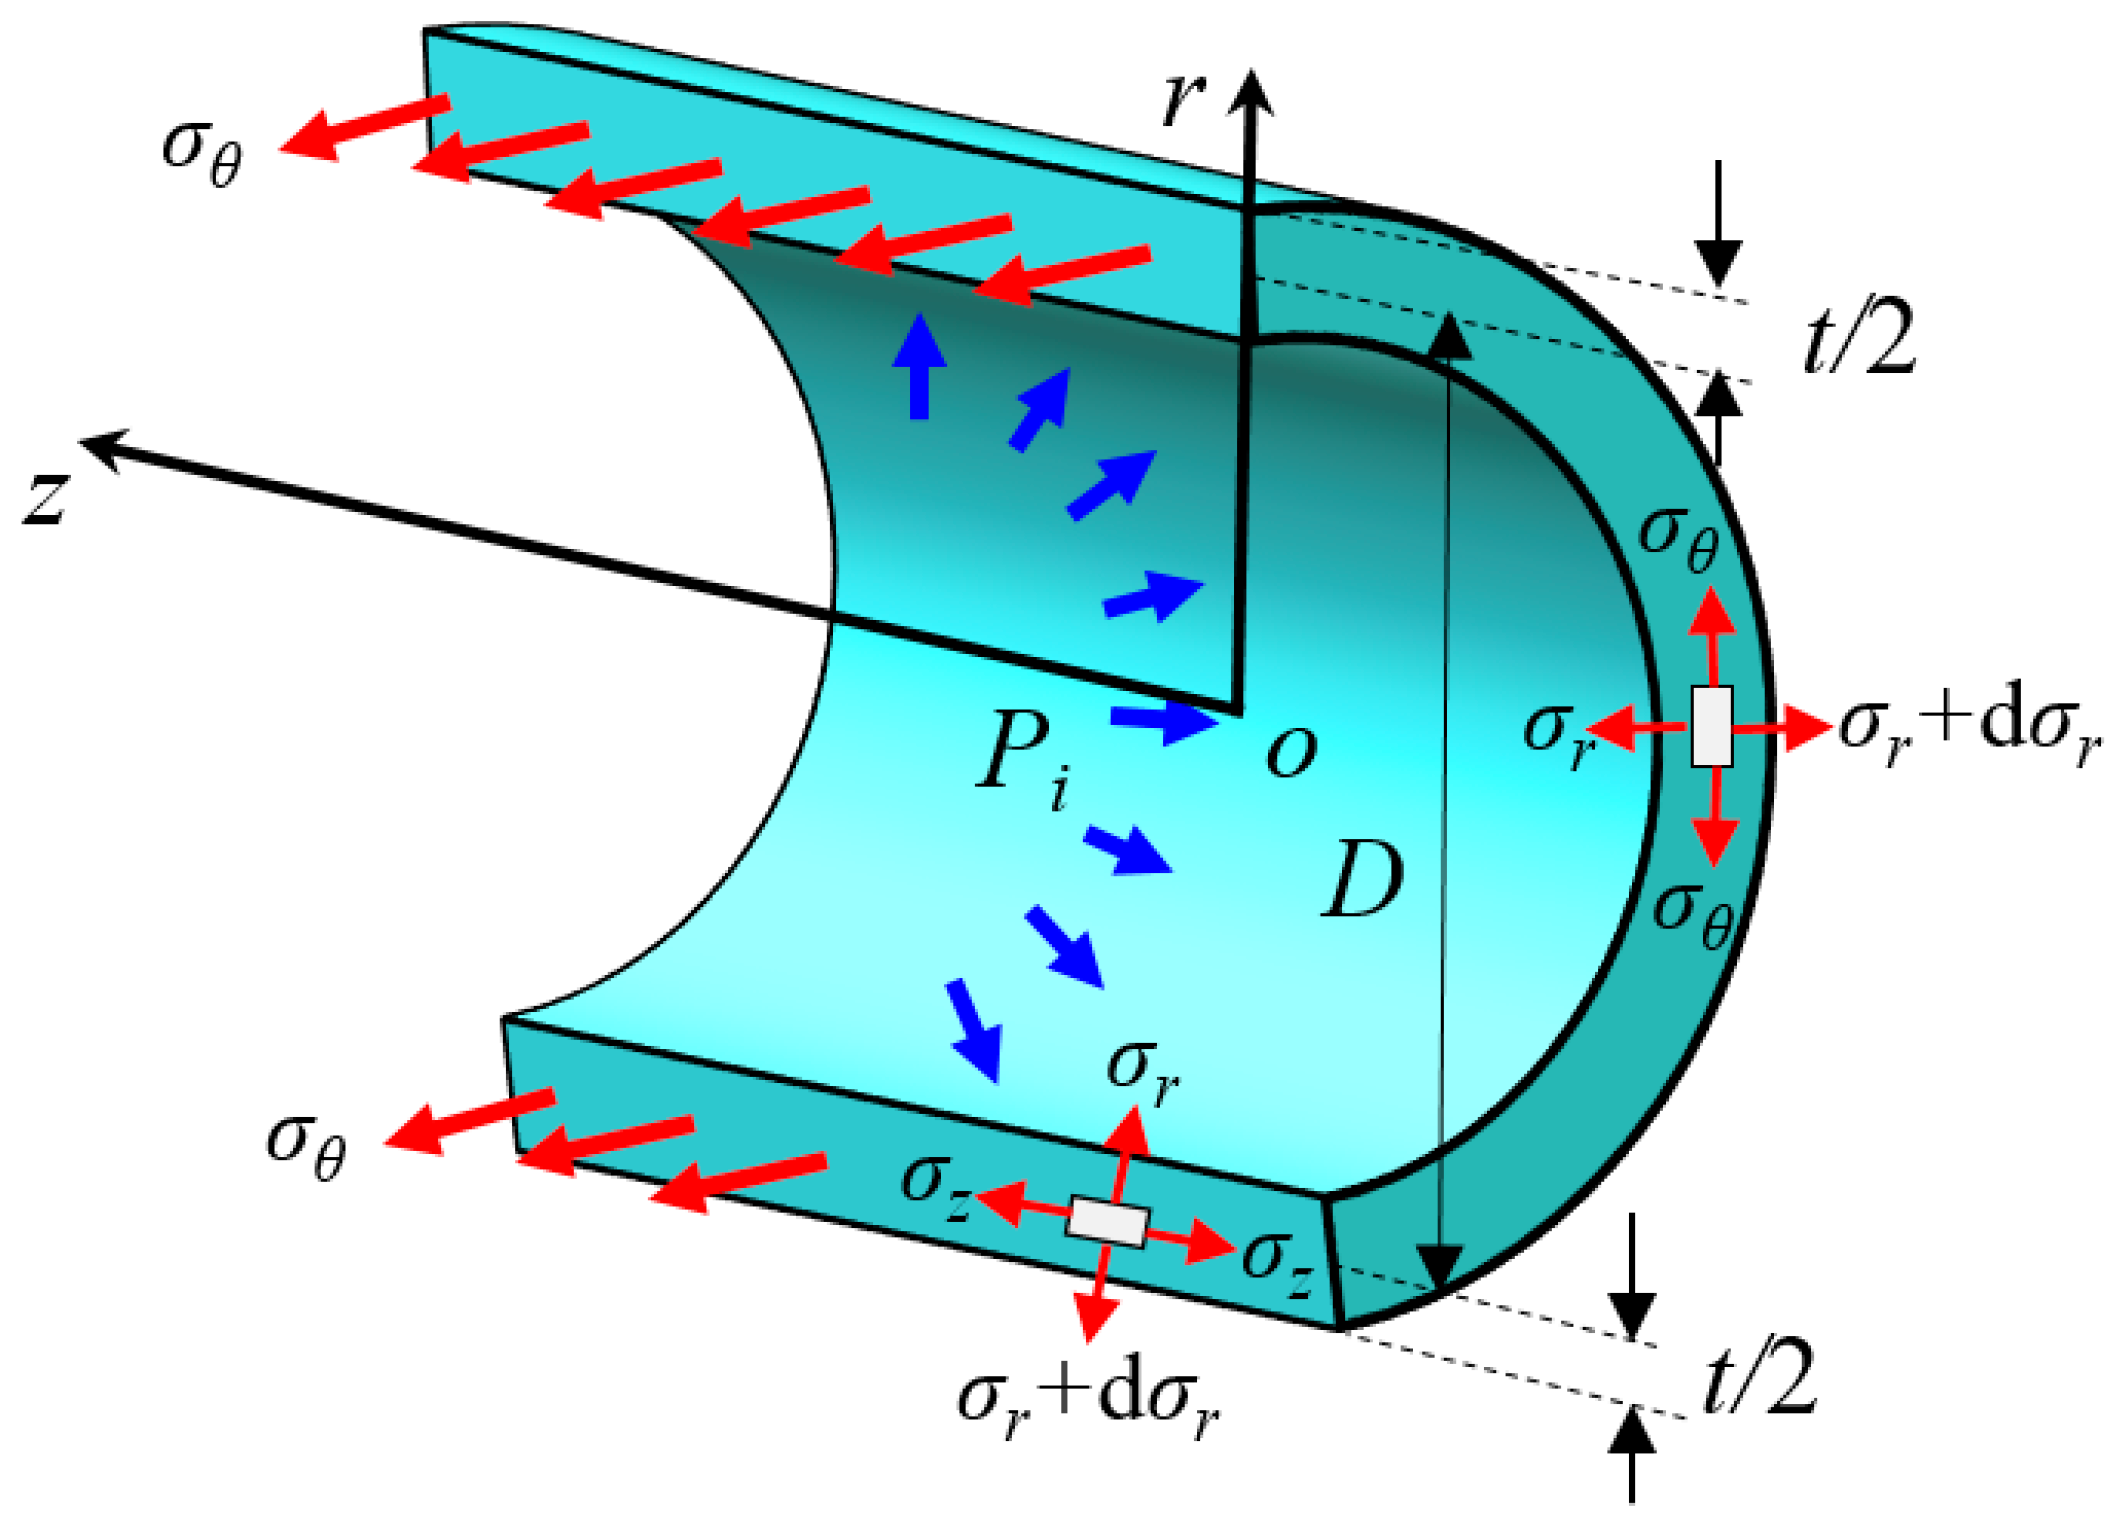
A general stress analysis is presented in the cylinders subjected to inner pressure P (Figure 6). The solution is applied under closed-end conditions and the three principal stresses are as follows [36]:
where θ, r, and z mean the hoop, radial, and axial directions, respectively; σr, σθ, and σz represent the radial stress, the hoop stress, and the axial stress, respectively; and D and t are the pipe mean diameter and mean wall thickness, respectively.
In general, the axial strain is small and can be ignored in the pipeline, and the three strains are
where D0 and t0 represent the initial diameter and wall thickness respectively.
When the pipe fails due to burst, large plastic deformation usually occurs; considering the incompressibility of the material volume ε1 + ε2 + ε3 = 0, From Equation (9), one has
From Equations (6) and (8)–(10), the ASSY equivalent stress and equivalent strain in the pipe are determined as
From Equations (11) and (12), it can be known from Hill’s plastic work assumption that σAεA = σ1ε1 = σε, and the diameter and wall thickness are derived from Equations (10) and (12) as
According to Equations (8)–(13), the internal loading limit of the pipe is a function of the geometric size, the properties of the pipe material, and the equivalent strain, which can be expressed by the following formula:
When , the maximum value of equivalent strain based on ASSY is . Hence, the burst pressure calculated by ASSY is determined as a function of the size and material of the pipe, including diameter, wall thickness, the σt, and the hardening exponent n:
Similarly, the burst pressure based on the three yield criteria can be determined as follows [36]:
3. Experimental Study
3.1. Tensile Testing
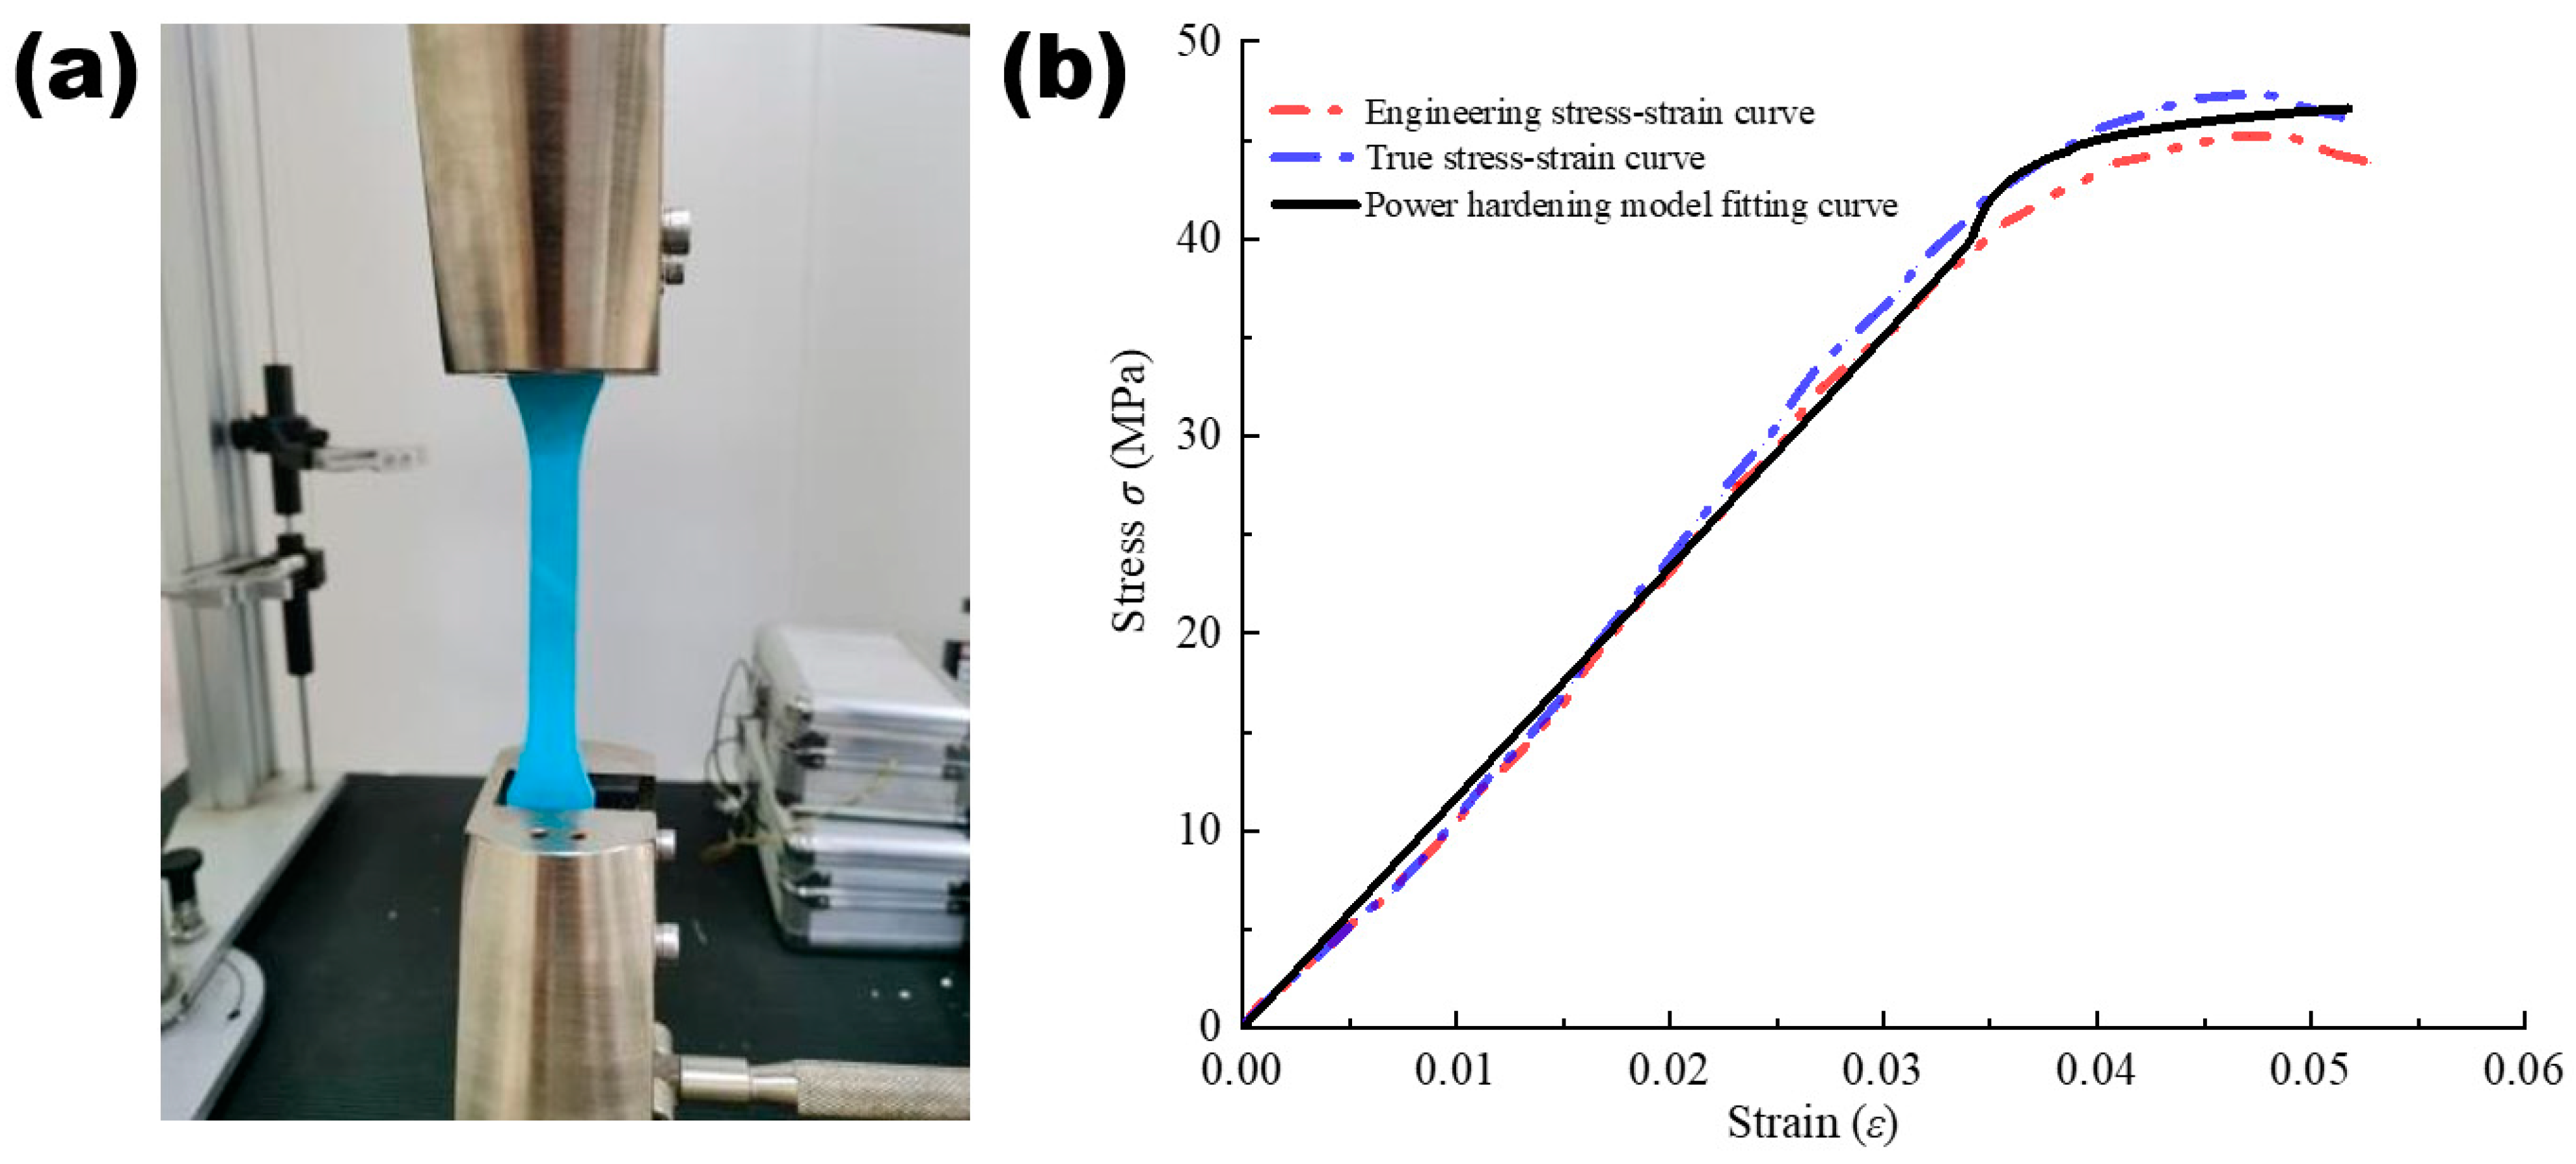
The purpose of this test was to obtain the mechanical properties of PVC materials under tensile conditions. According to the ASTM D638-14 standard, the cylindrical hourglass-shaped (CHS) specimens were taken from the PVC pipe and processed parallel to the axial direction carefully. As shown in Figure 7a, the uniaxial tensile test was carried out at 23 °C and the tensile rate was set to 50 mm/min using an extensometer with a gauge length of 50 mm. The resulting curve of the PVC pipe material after averaging treatment is presented in Figure 7b.
Three stages that can reflect the characteristics of the material are observed clearly from the stress-strain curve: (1) the initial linear elastic response before yielding; (2) after the initial linear elastic response, the stress-strain curve rollover due to the material yielding; and finally (3) a stage of strain hardening. Mechanical parameters can be achieved from the curve, such as the yield stress σy (43.67 MPa) and Young’s modulus E (1259 MPa). The detailed parameter values of the five tests are listed in Table 1.
3.2. Burst Tests
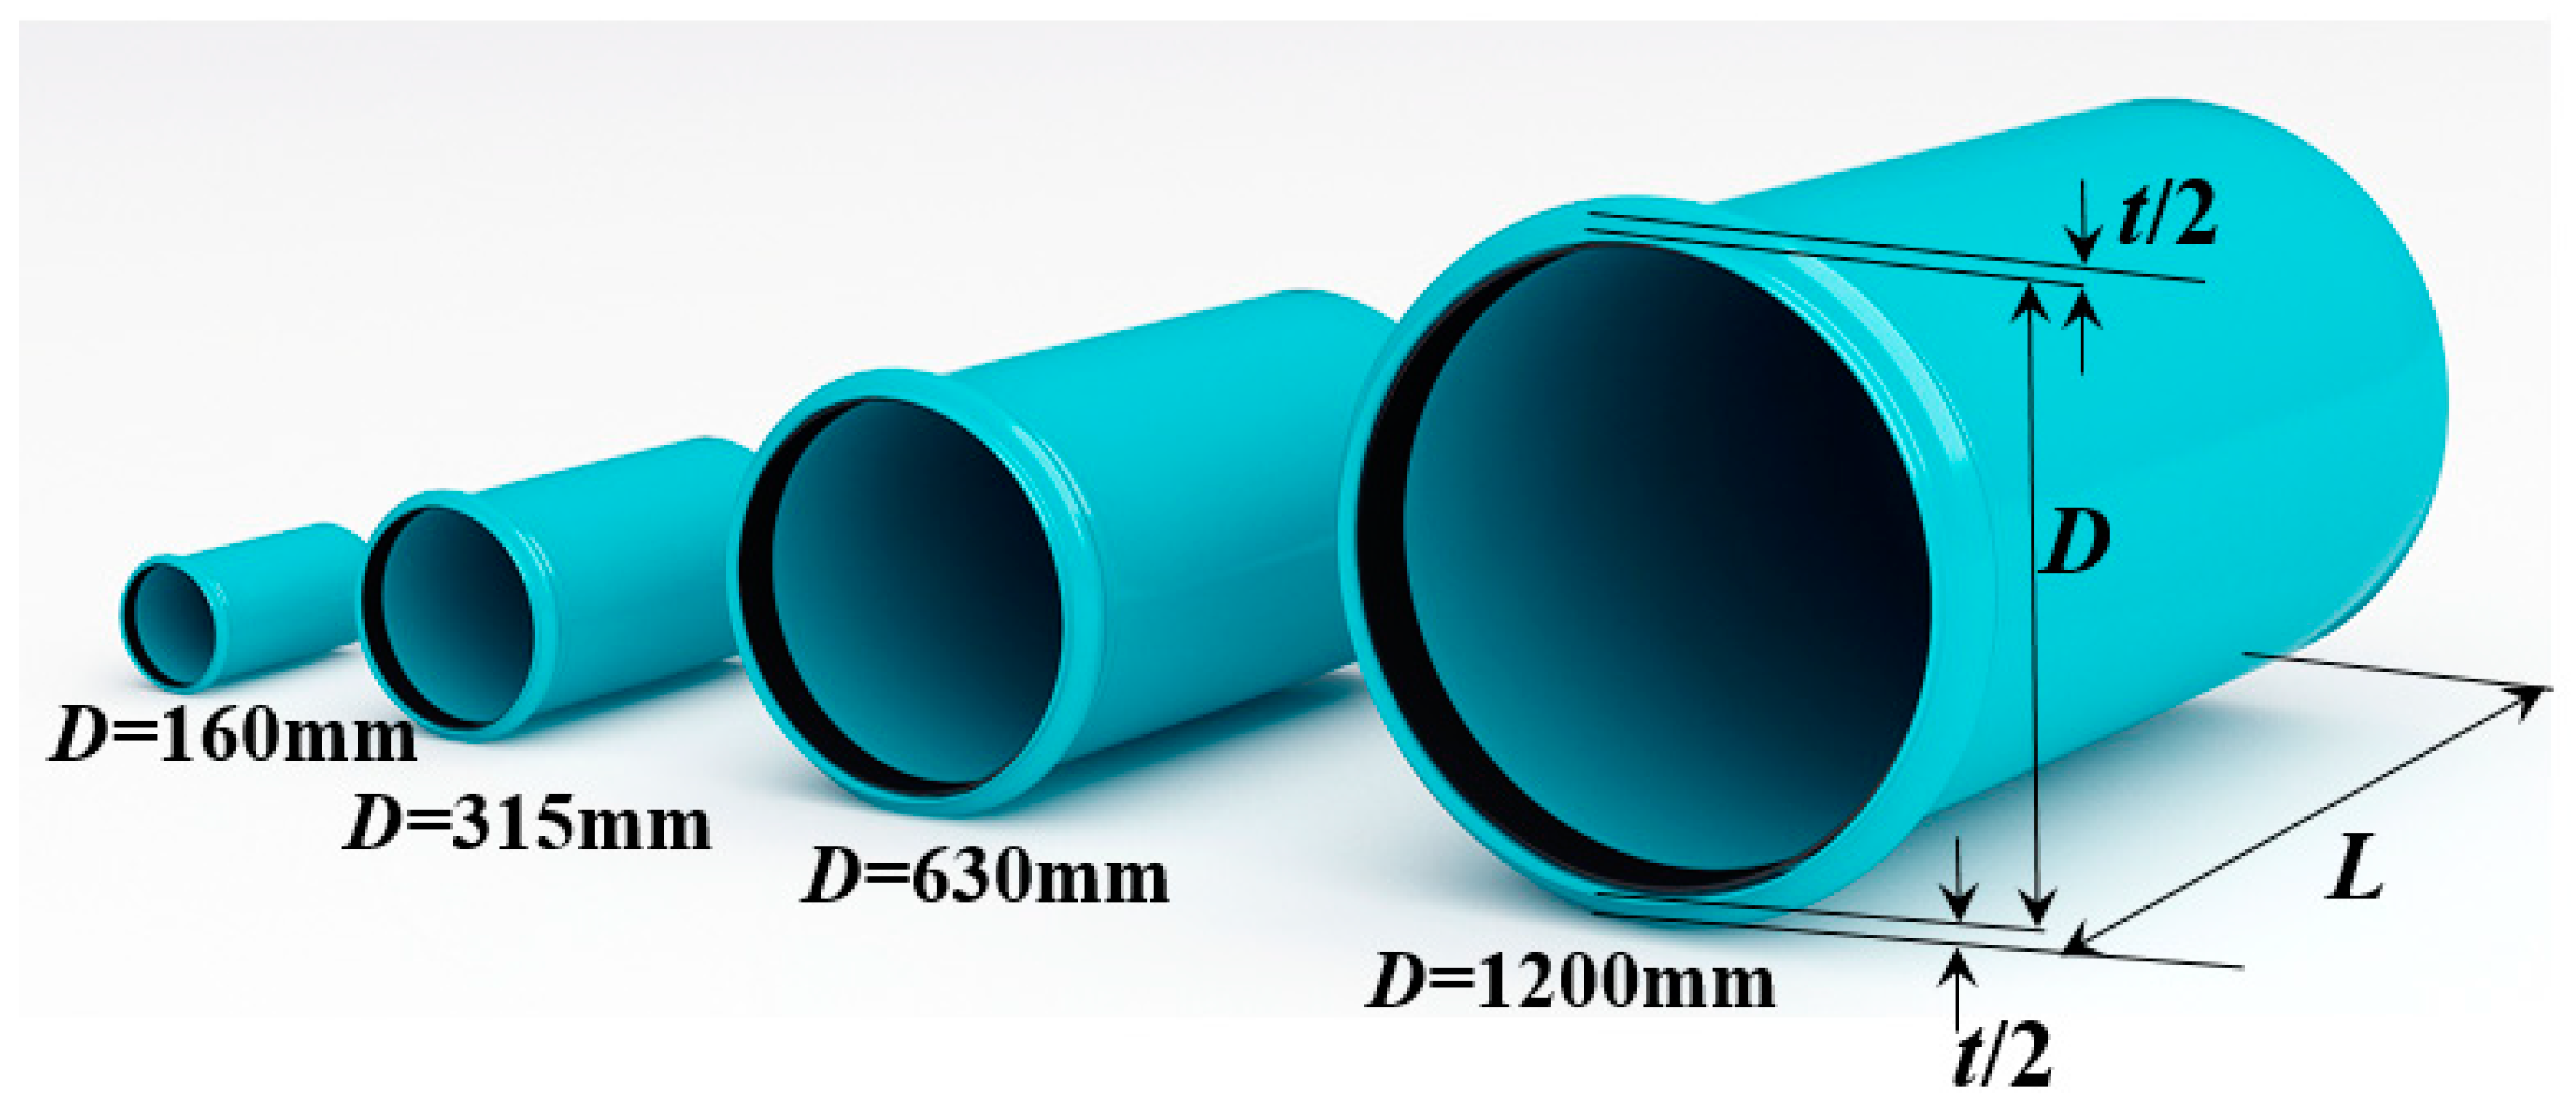
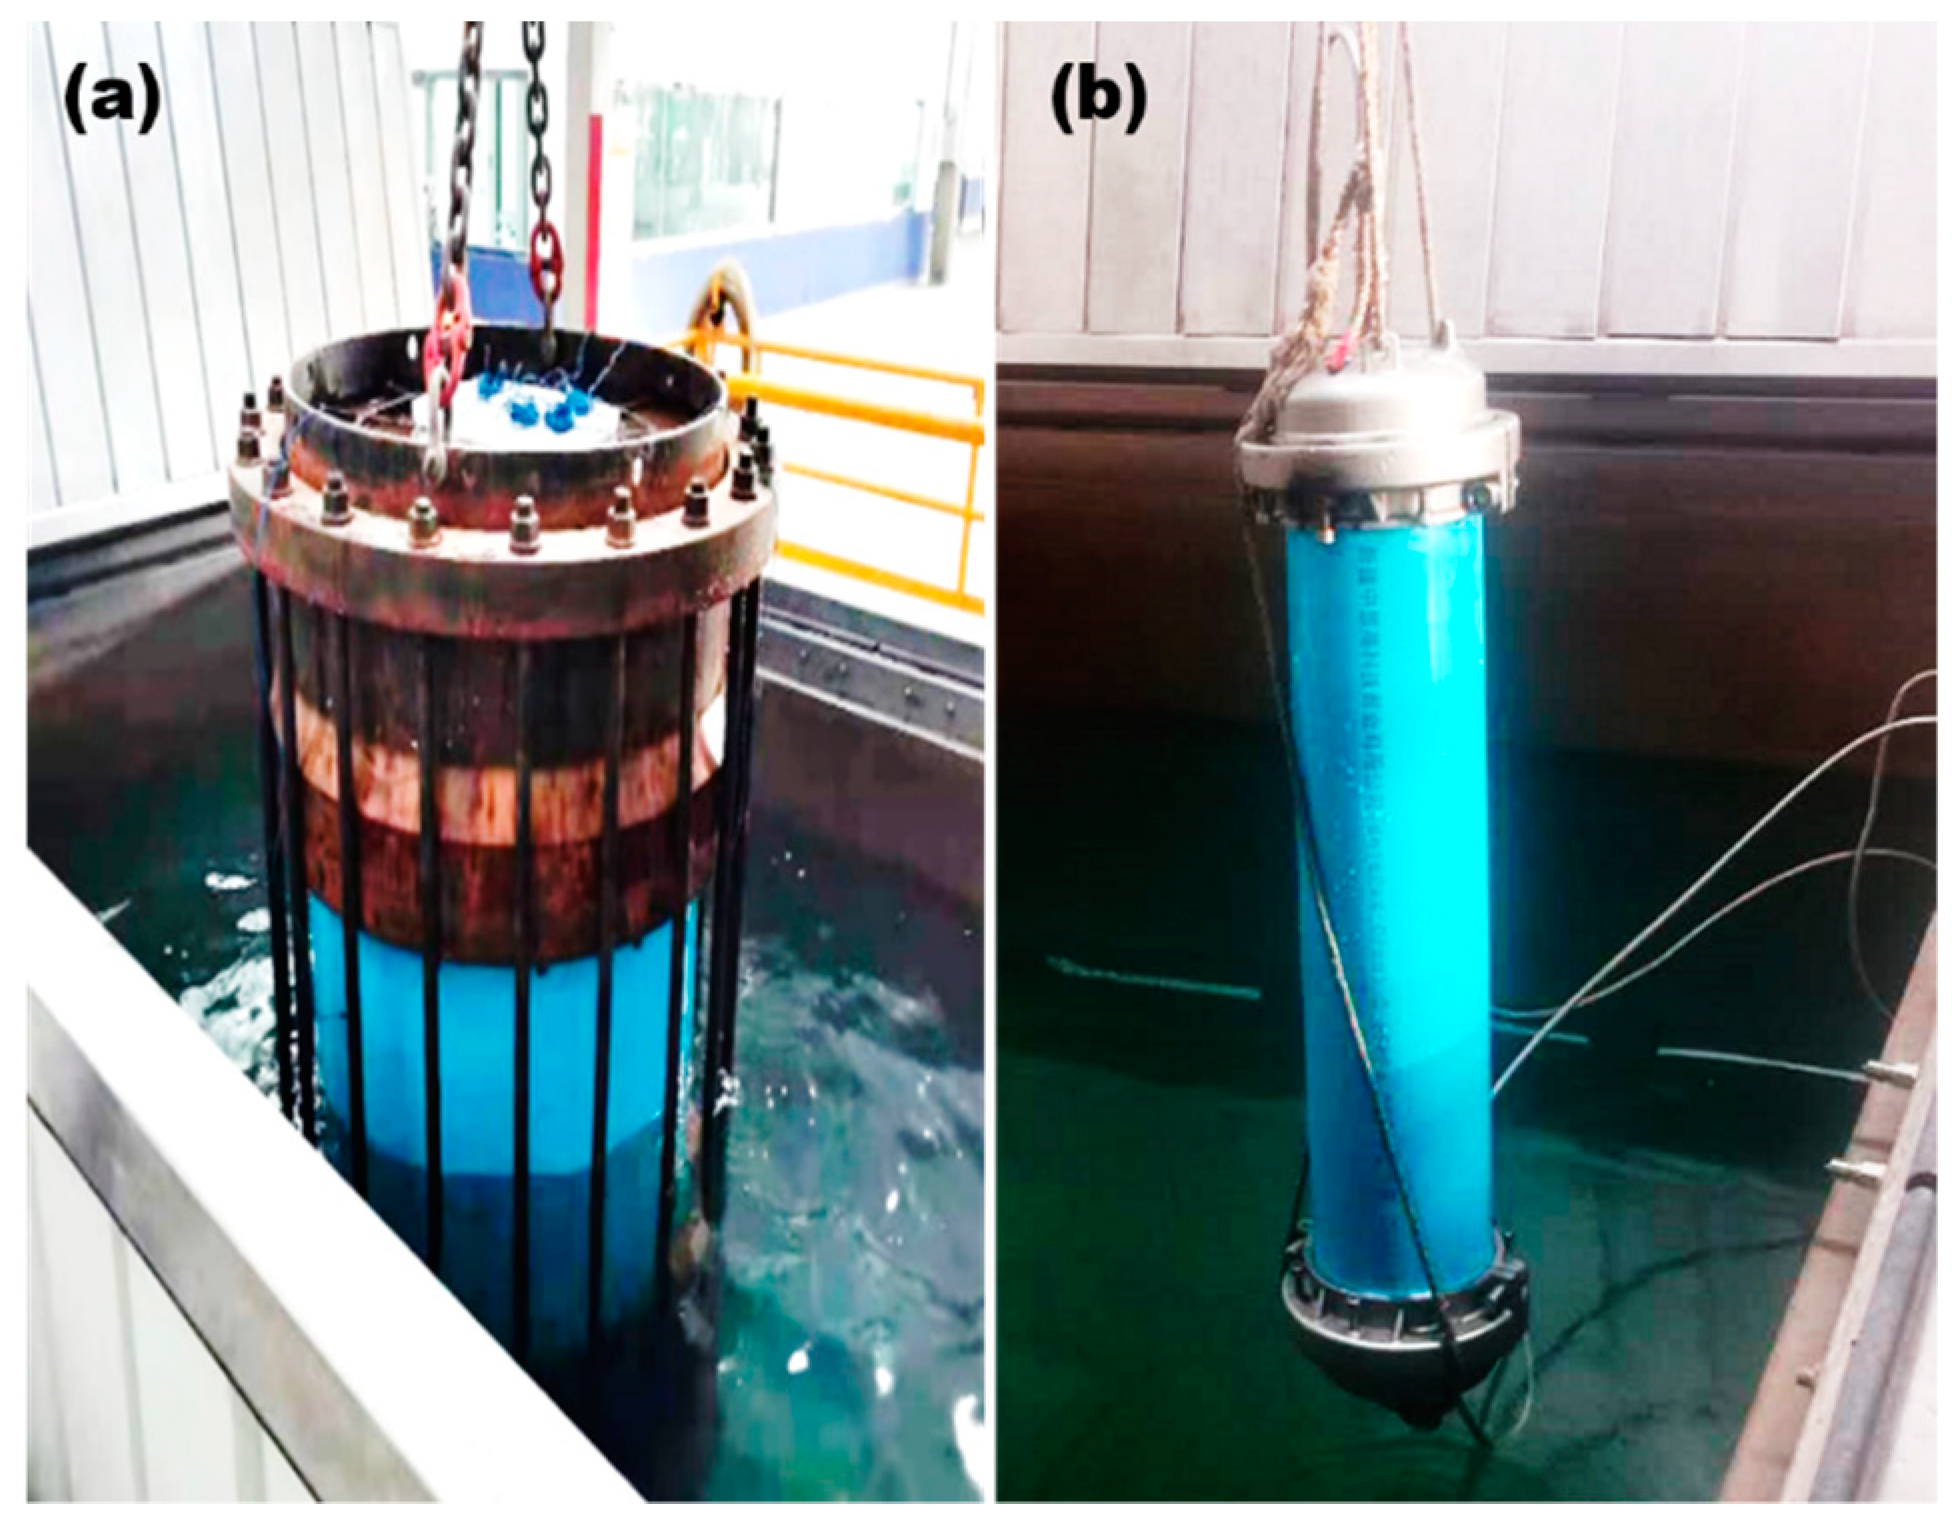
The burst test is an intuitive and effective method for evaluating the safety and reliability of a pipe’s materials and structure. The pipeline burst test was carried out to measure the ultimate internal pressure bearing capacity, pressure duration, and the corresponding expansion deformation of the PVC pipe. In addition, the failure mode was also studied through the damaged specimen. To validate the theoretical method, 4 groups of 16 specimens were prepared for burst tests and placed at 23 °C before water injection and pressurization (Figure 8). The pipe samples used in the test were all obtained from the same batch of products. The details of the PVC pipe geometry values are listed in Table 2.
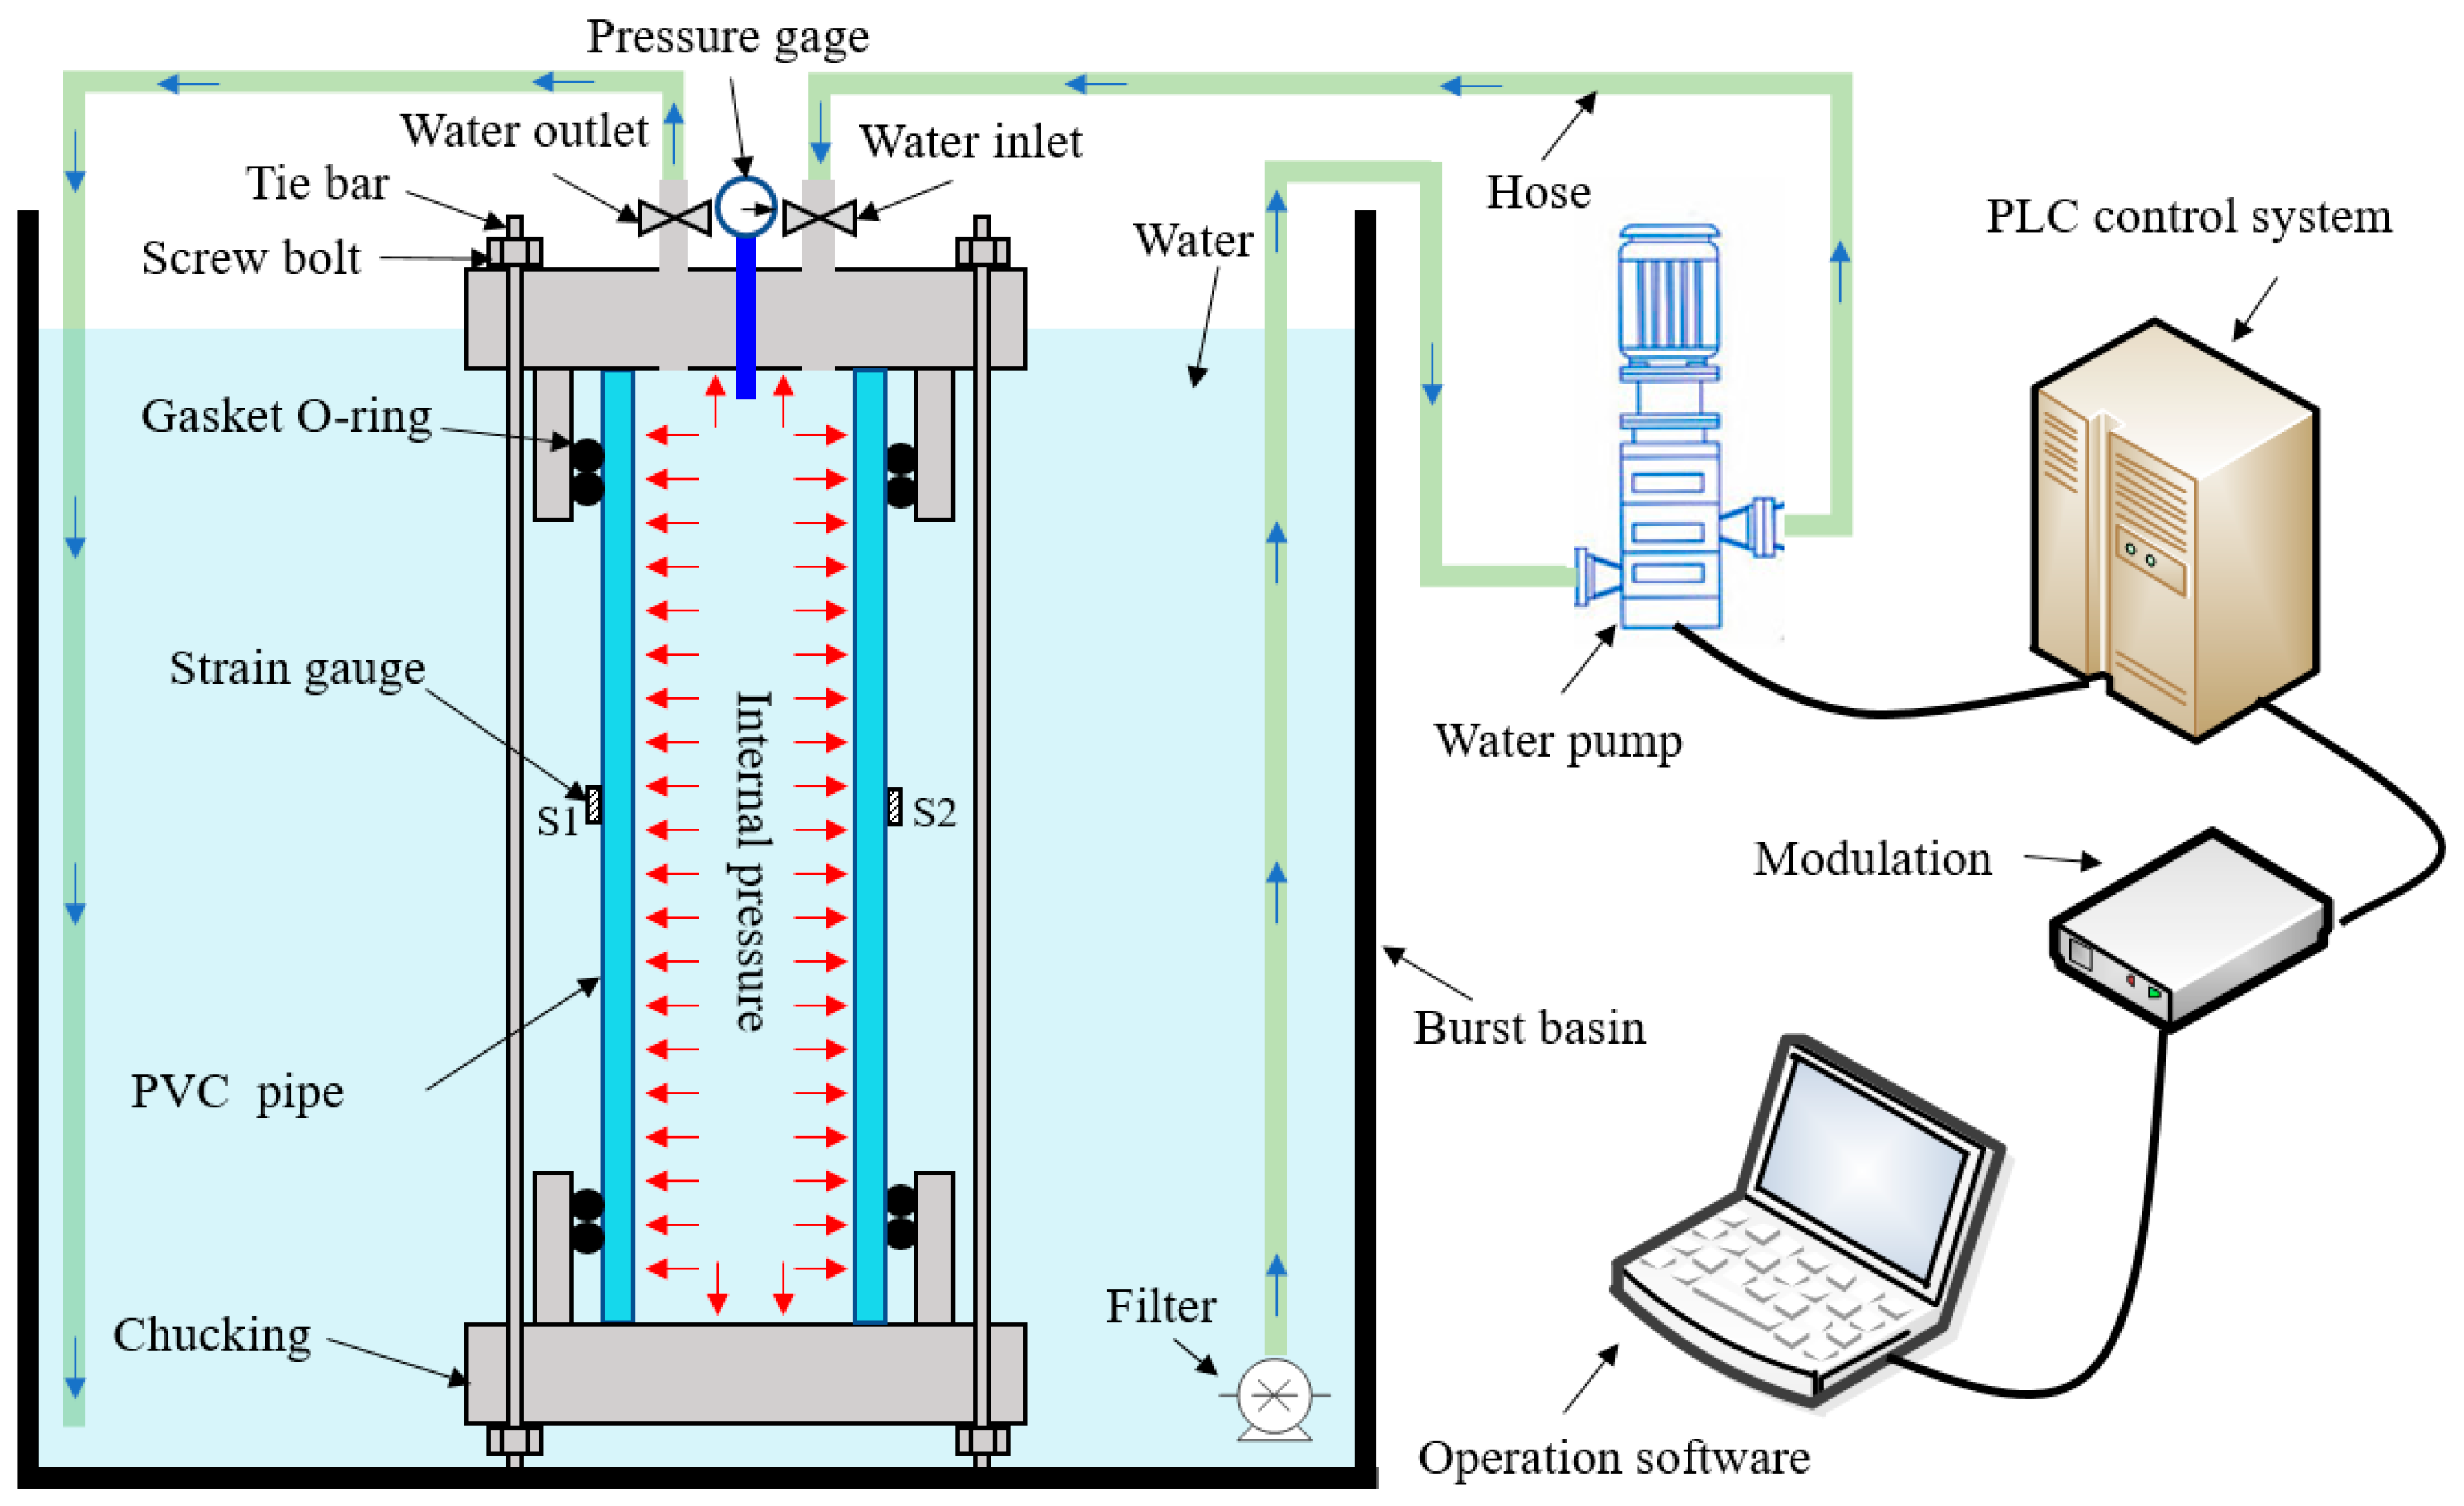
The burst test was conducted under room temperature according to ASTM D1599-18 standard. The testing equipment used to apply sustained internal pressure on the PVC pipes is shown in Figure 9 and Figure 10. Before the test, both ends of the PVC pipe were blocked by test fixtures. The tie bar connected two end closures with a bolt and sealed each side of the PVC pipe with O-rings. Before pressurization, the prepared pipes were placed in a burst basin at the prescribed water temperature for 6 h. Then, the switch was turned on and started filling the pipe with water at 23 °C. The pressurizing device was composed of a PLC-controlled pressurizing pump, a water pressure sensor, and a feeding system. The pressurizing rate was controlled by water flow, and the pressurization accuracy reached up to 0.01 MPa. Lastly, we linked the water inlet to the water pump with a high-pressure hose and injected water to increase the internal pressure of the PVC pipe until it ruptured. The internal pressure value of the pipe was obtained by the pressure gauge installed at the end closure. Two strain gauges were attached to the outer wall of the pipe to monitor the strain change during the pressurization process.
4. Finite Element Modeling
4.1. Tool Geometry and Mesh
As a mature commercial FEA software, ABAQUS was used in the simulation of the pipelines subjected to internal pressure. Therefore, a total of 16 pressurized pipe models with four diameters were established for theoretical accuracy verification. The pipe size used in the numerical simulation was the same as the pipe size in the experiment. In the piping material settings, the power exponential constitutive model introduced in the theoretical analysis was used for FE analysis due to the tested stress–strain relations. The PVC material parameters are provided in Table 1, which were obtained according to the uniaxial tensile test.
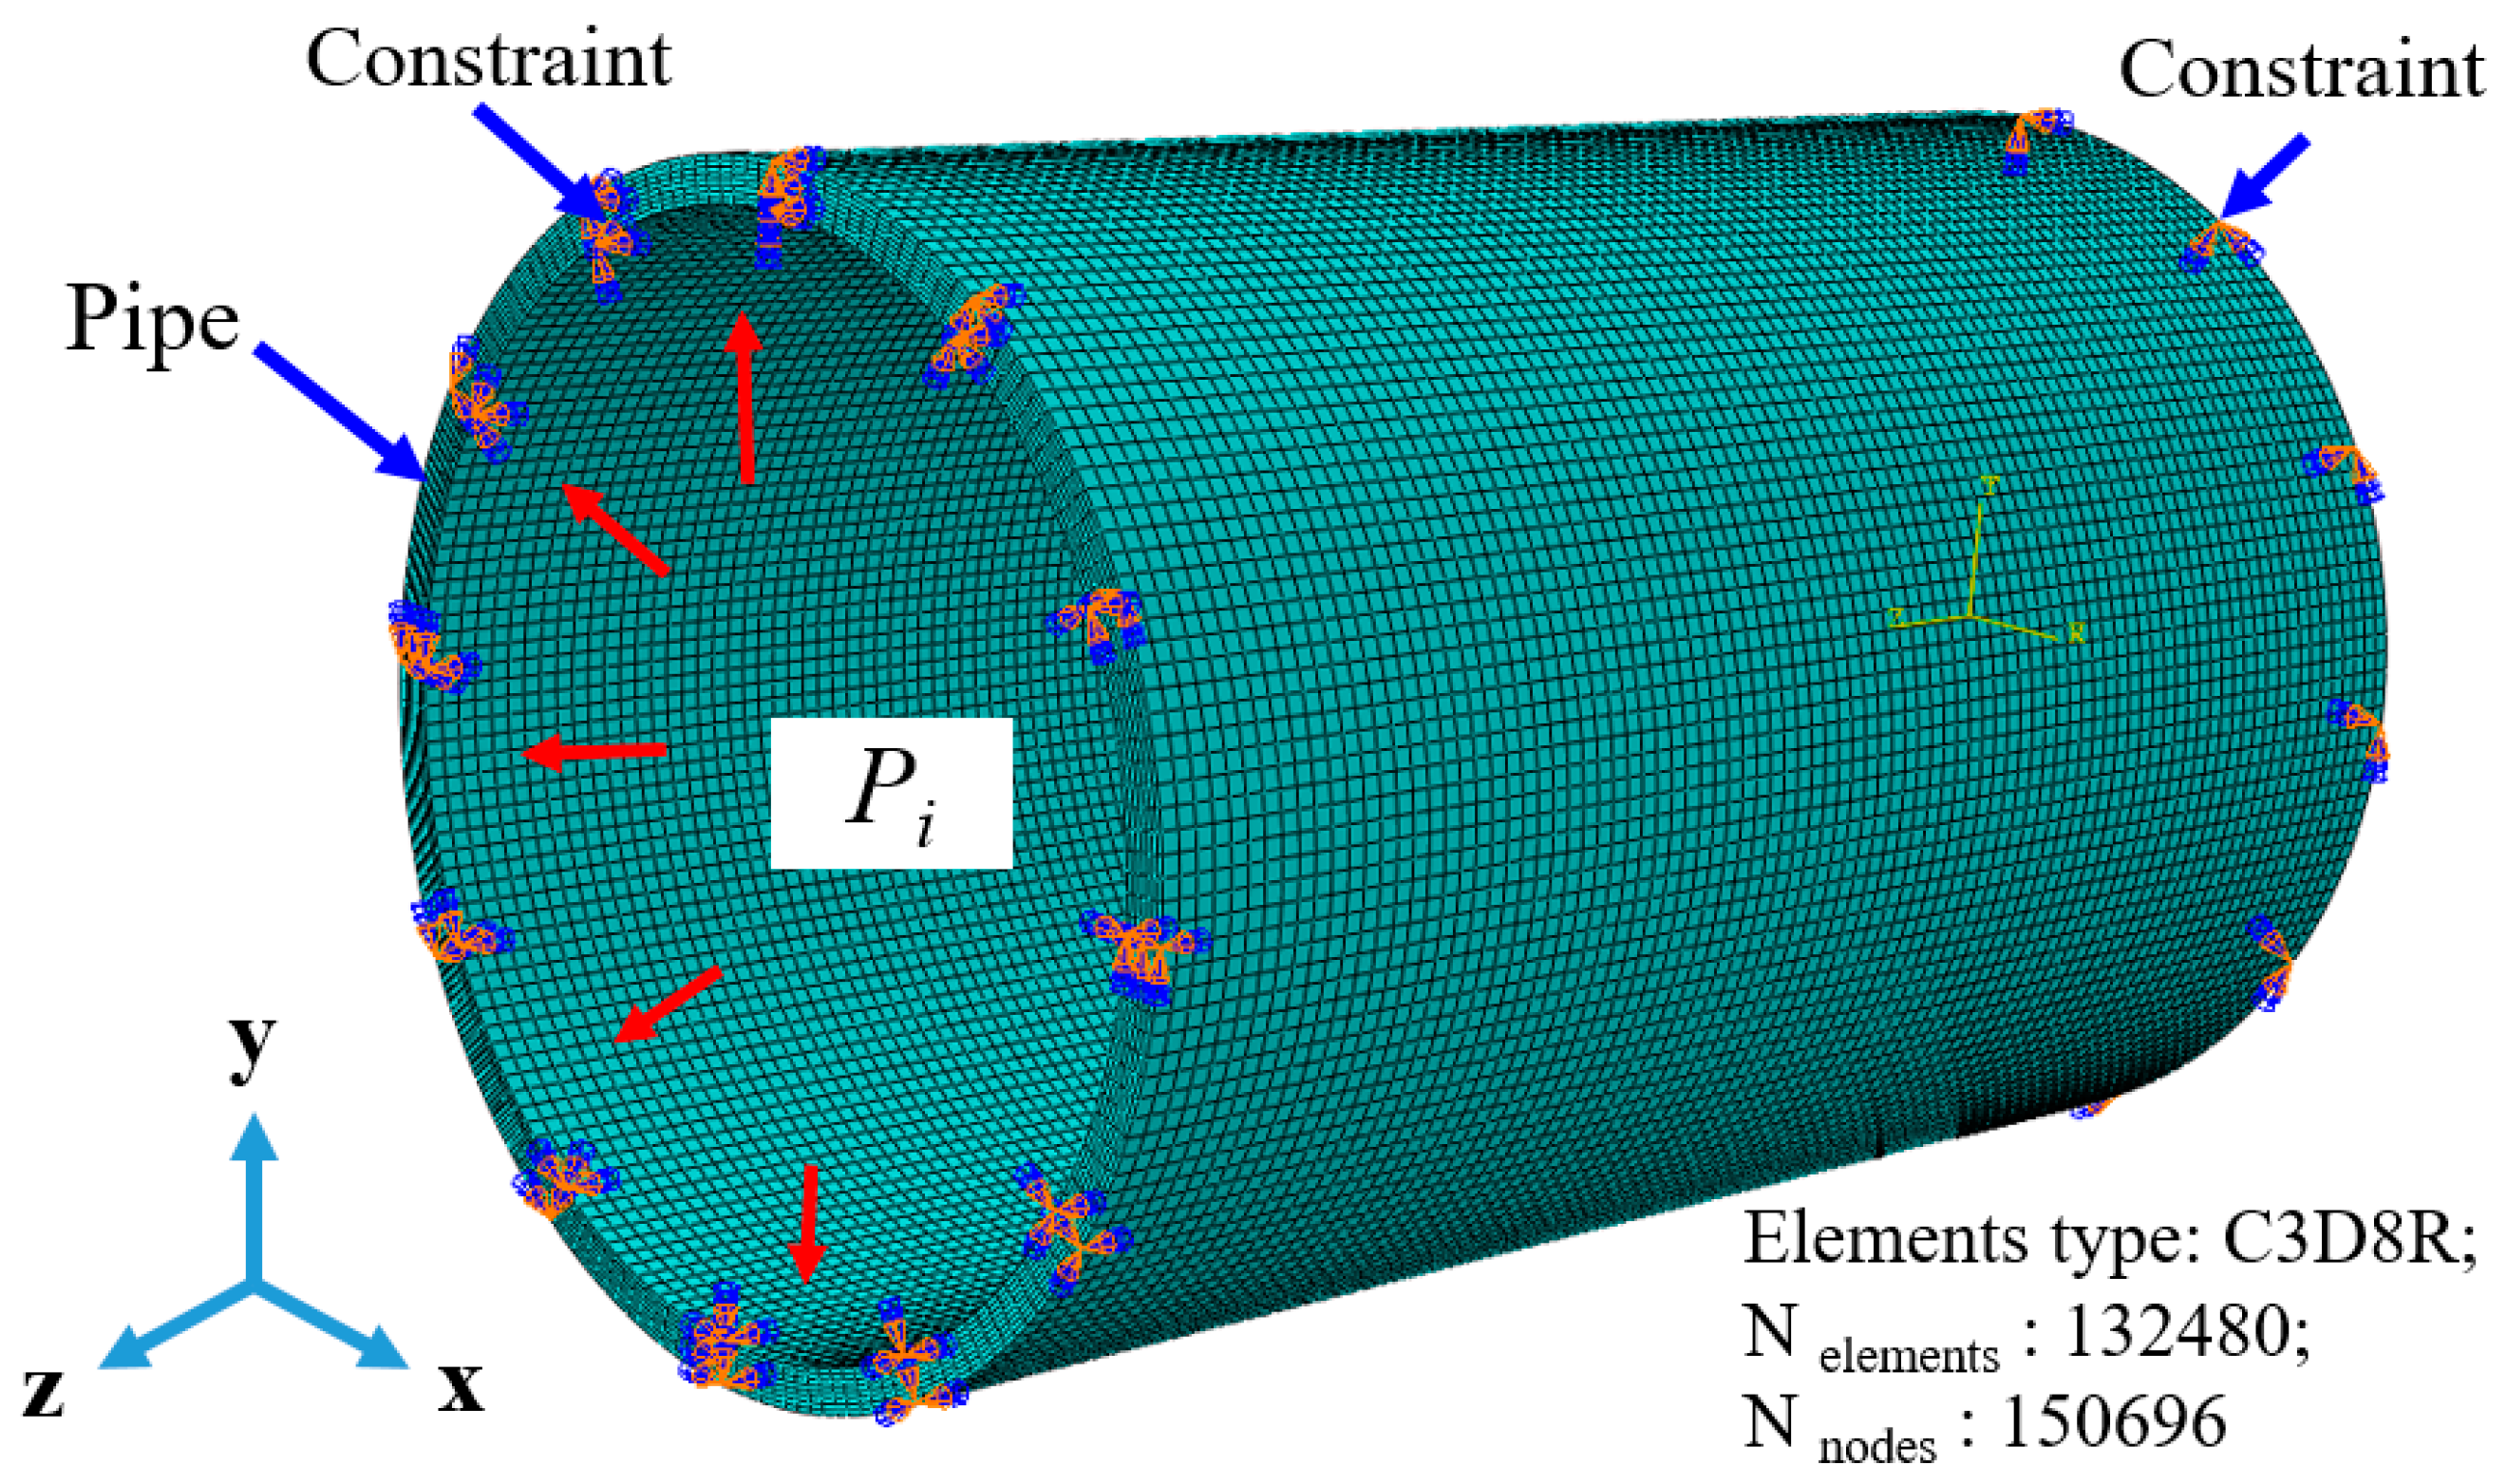
For model meshing, a coarse grid was applied along the axial direction and a fine grid was employed along the radial direction. This meshing method was chosen due to the more drastic changes in pipe stress along the wall thickness direction. During the burst testing process, the pipe wall, made of elastoplastic material, will expand in a wide range; therefore, the elastic–plastic and large-deformation finite element model was used in the finite element model. The completely fixed constraints (U1 = U2 = U3 = UR1 = UR2 = UR3 = 0) were imposed on both ends of the pipe. The established PVC pressure piping model of P1200-1 and the grid meshing are shown in Figure 11. An eight-node continuum element (C3D8R) was adopted in the meshing while the number of elements and nodes were 132,480 and 150,696, respectively.
4.2. Definition of Burst Pressure
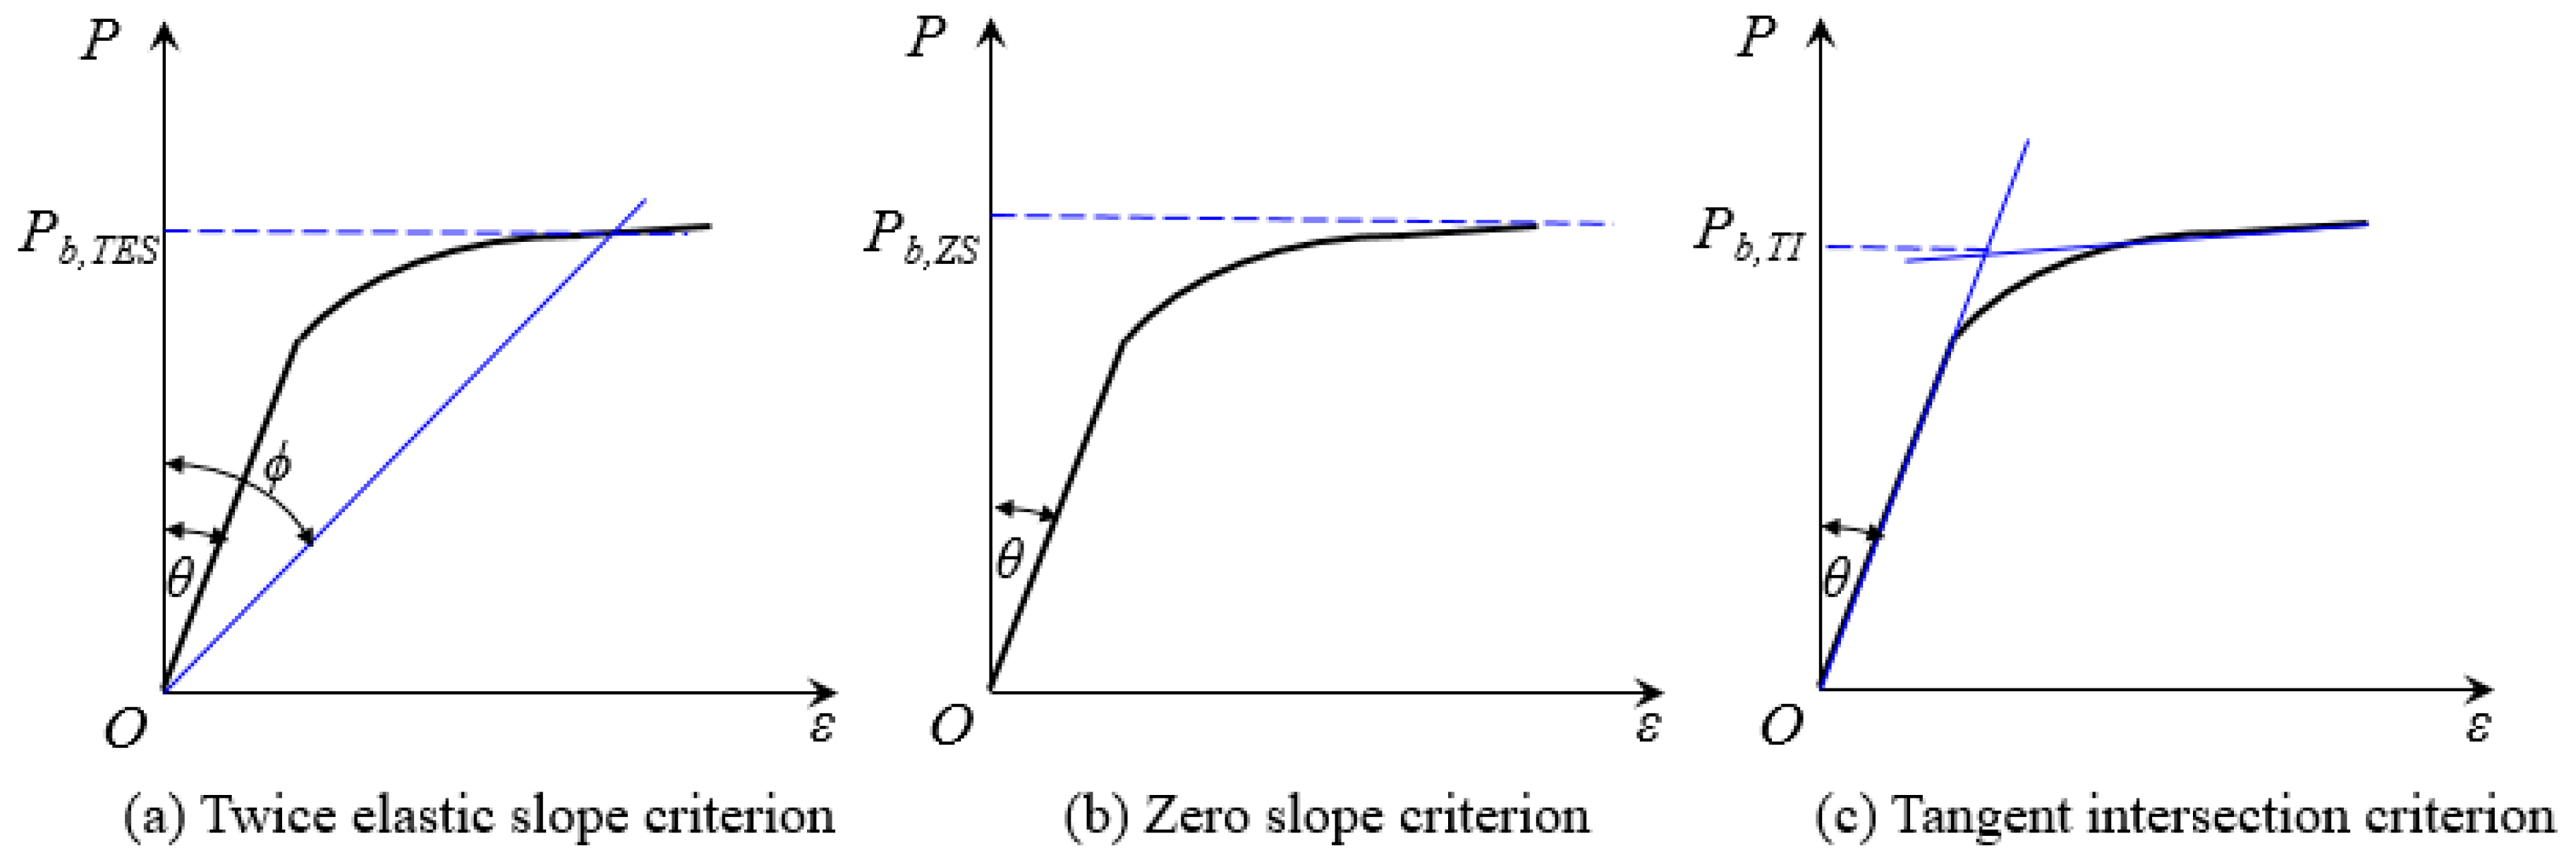
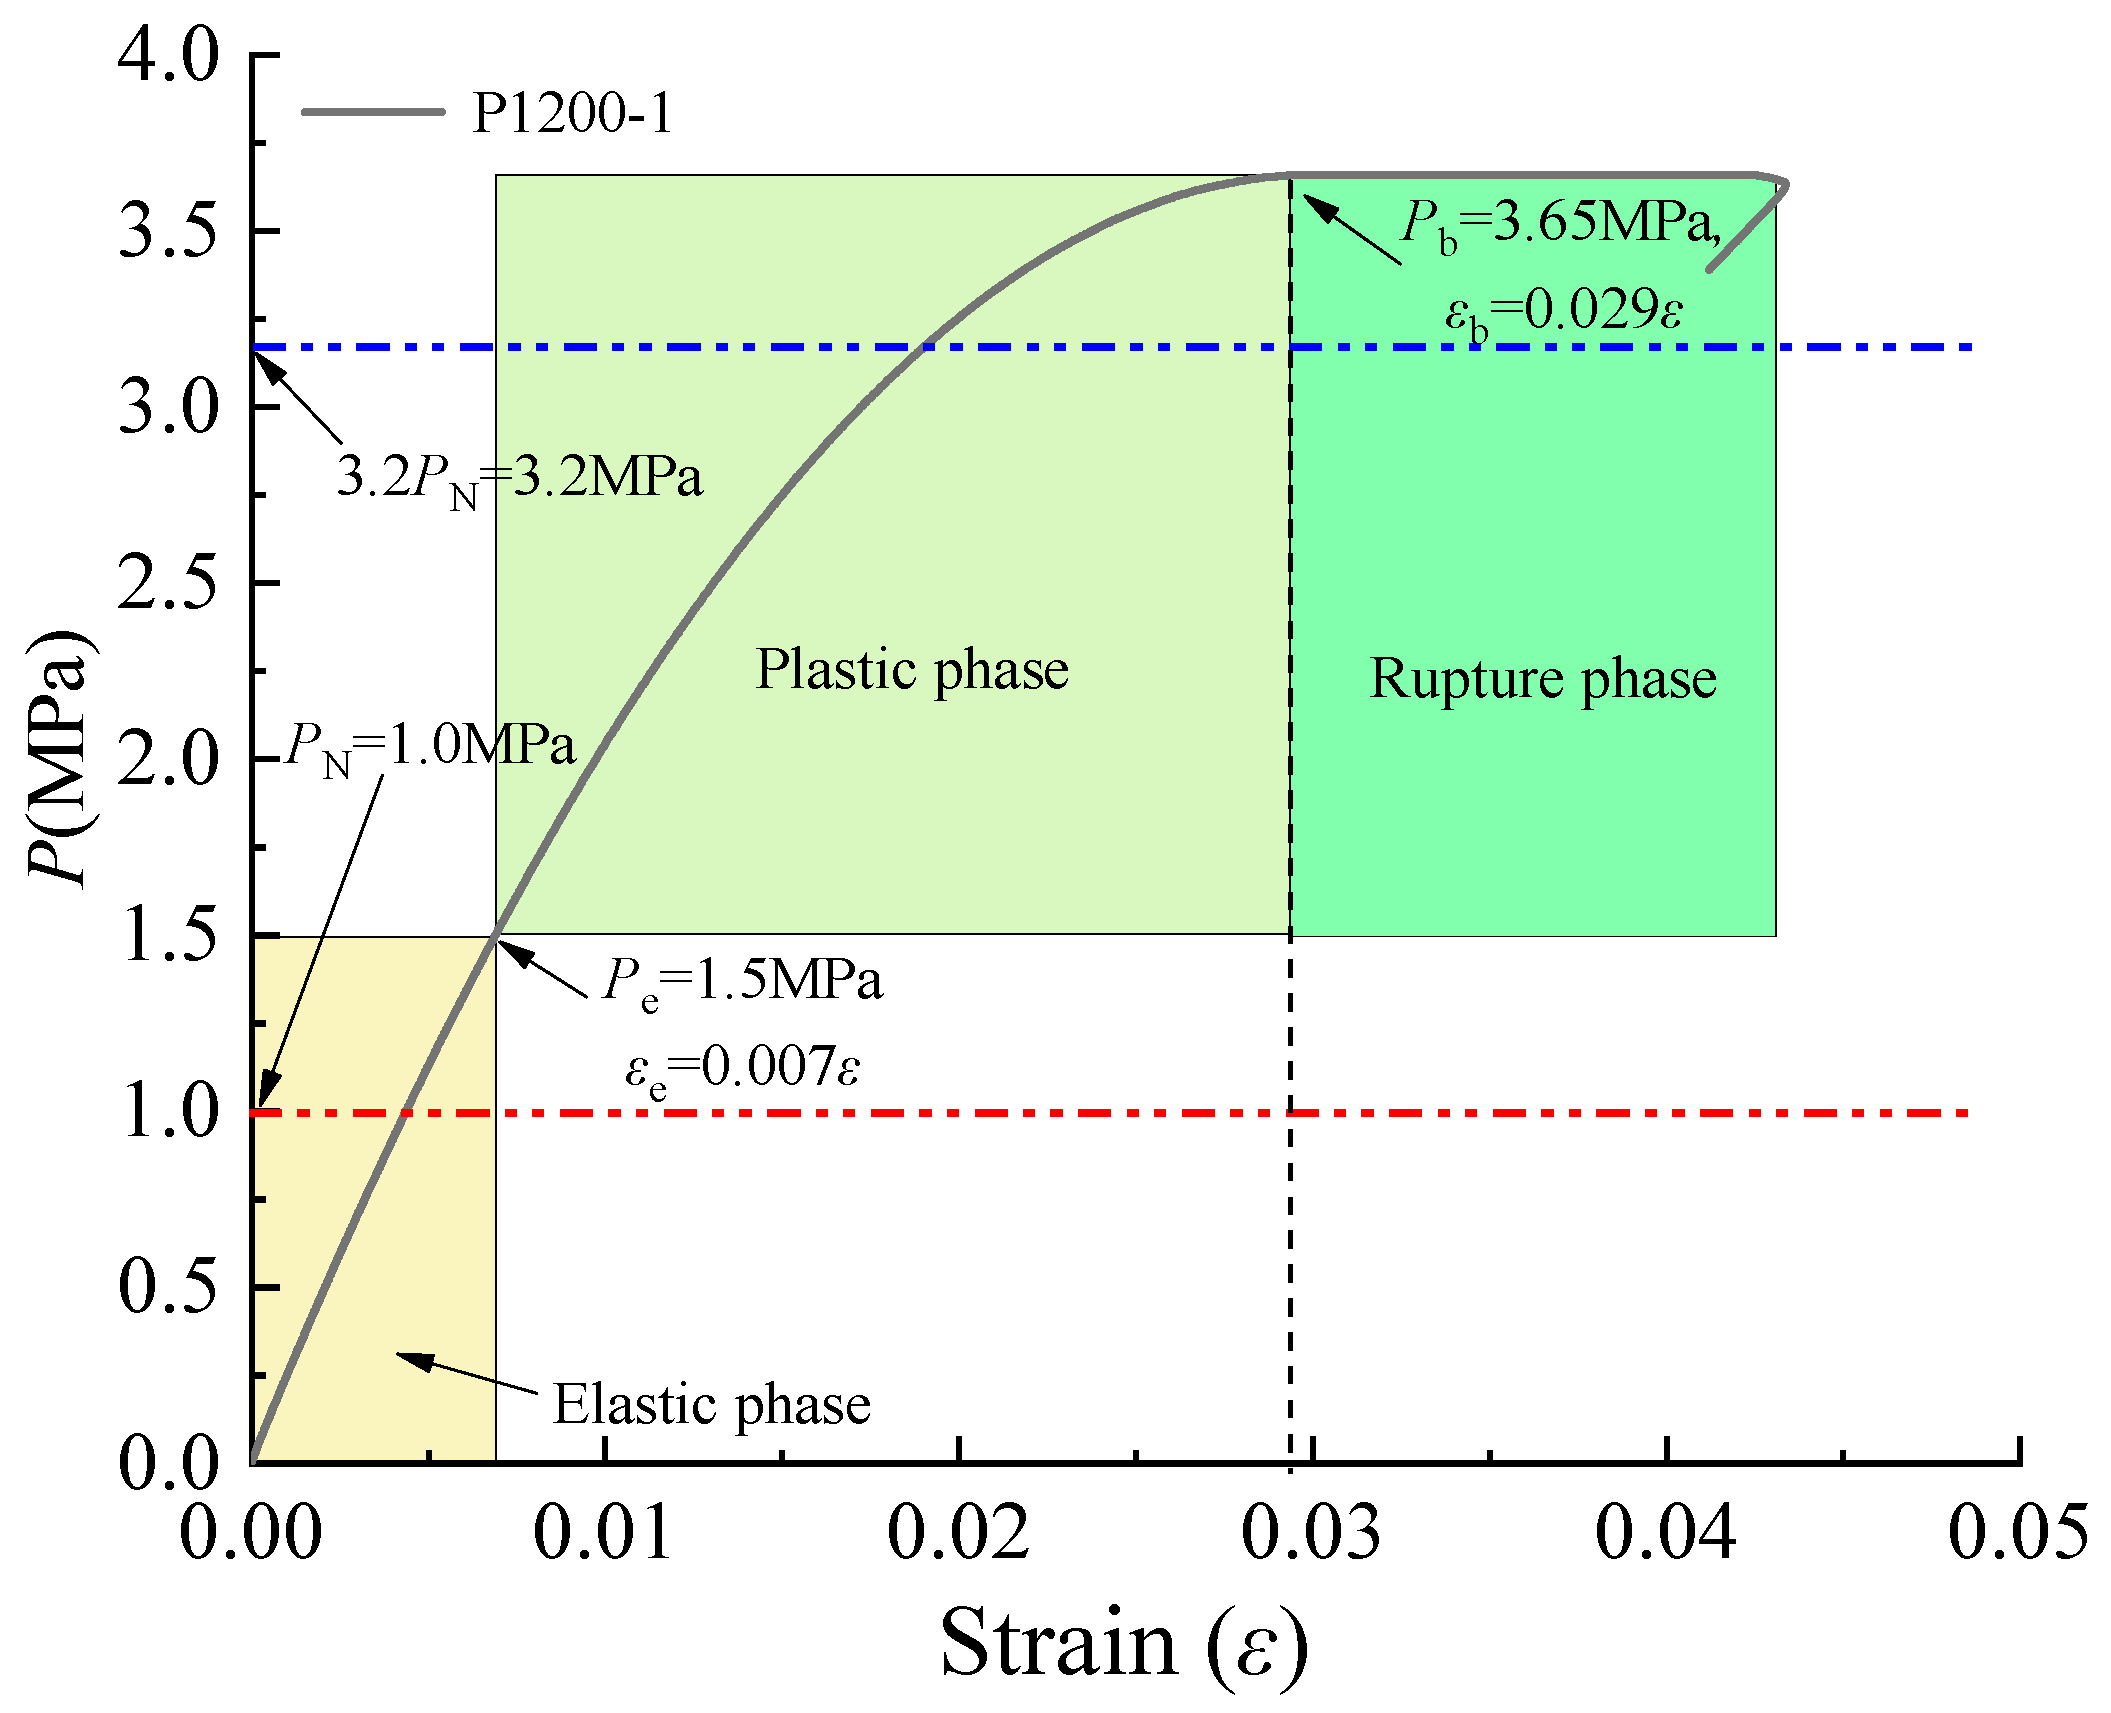
When determining the failure pressure of a pipeline according to the pressure–strain curve, there are usually the following three criteria: the twice elastic slope (TES) criterion, the zero slope (ZS) criterion and the tangent intersection (TI) criterion. The twice elastic slope (TES) criterion is a practical criterion, which is specified in ASME Boiler and Pressure Vessel Code Section VIII Div 2 [37]. As a graphical method, the burst pressure was obtained through plotting a straight line from the origin with twice the slope of the initial elastic response, that is, tan ϕ = 2 tanθ. The ultimate internal water pressure load Pb,TES expresses the value of the ordinate of the intersection point. The zero slope (ZS) criterion, as illustrated in Figure 12b, was proposed by Gerdeen [38]. The ultimate internal water pressure load Pb,ZS is obtained when the load–strain curve has a nonzero slope.
The theoretical limit water pressure loads of the pipe are derived based on plasticity and small deformation assumptions, while the actual burst pressure of the pipe is obtained by ductile failure in pipe safety accidents. The ductile failure also occurs in experimental tests, which means that strain hardening and large deformation need to be considered in the analysis. An alternative criterion was the tangent intersection (TI) method, which determines the burst pressure as the intersection of the initial elastic and final plastic responses of the load–strain curve, as shown in Figure 12c. Therefore, the TI method was applied to determine the pipeline failure pressure.
5. Result Analysis
5.1. Burst Test Results
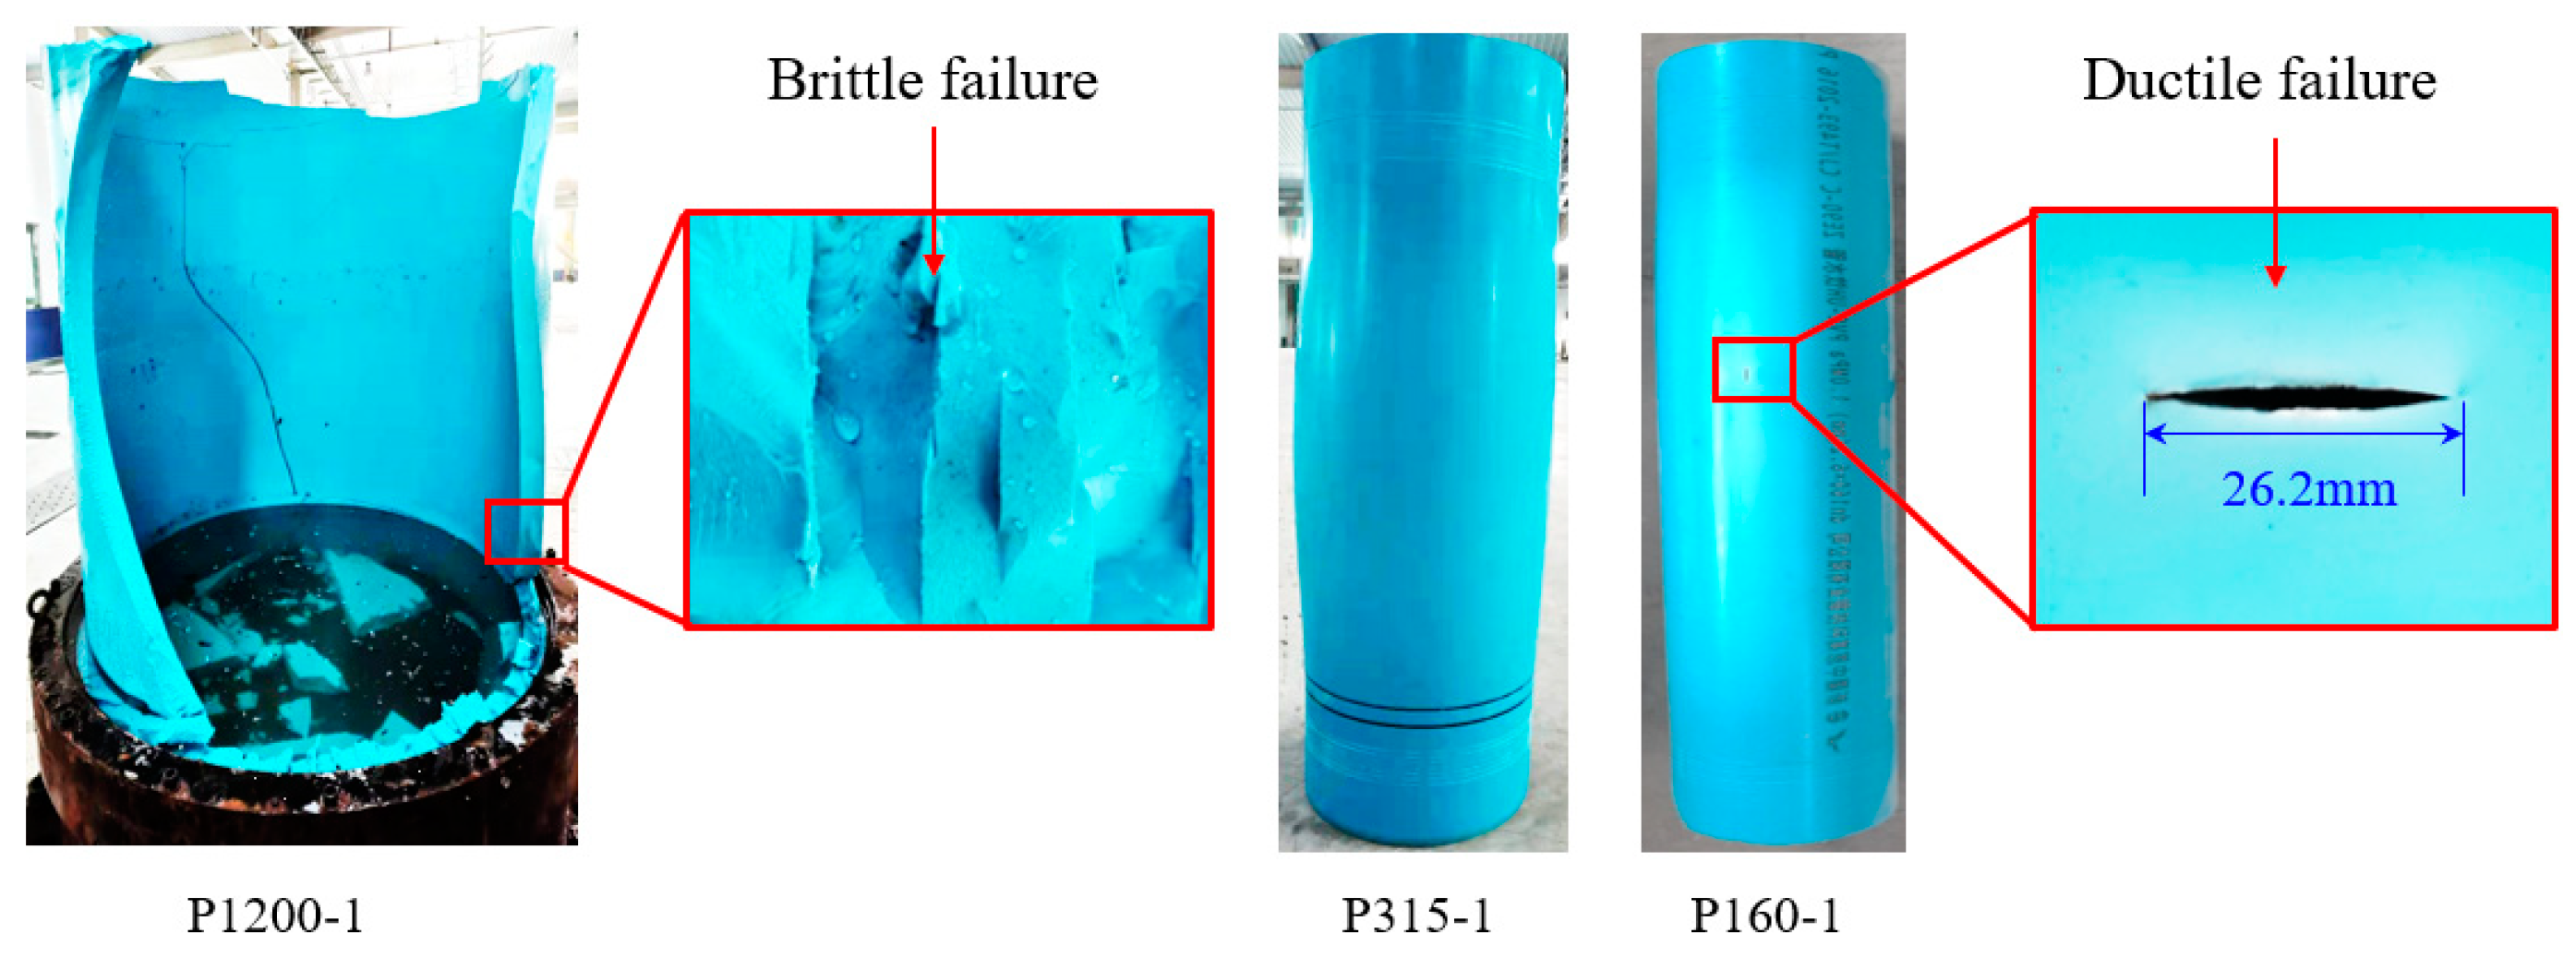
As mentioned above, 16 PVC pipe specimens were subjected to a burst test. A typical sample failure rupture is shown in Figure 13. P630-1, P315-1, and P160-1 exhibited typical ductile failure characteristics; cracks appeared on the pipe wall and propagated to the nearby area, with major cracks extending along the axial direction of the pipe when the internal water pressure increased. When the length of the crack in the P160-1 pipe reached 26.2 mm, the pipe leaked. An obvious shear lip was observed near the main fracture, and there were no fragments on the outer wall in P160-1. Before the destruction of P630-1 and P315-1, significant plastic deformation occurred and no cracks were observed in the pipe wall. The failure showed almost ductile fracture, which is unique to the case of polymer composite pipes with observed brittle failure from other studies [39].
There was a significant difference between the failure mode of P1200-1 and P315-1. As shown in Figure 13, the P1200-1 specimen showed catastrophic failure without significant expansion and deformation. The pipe broke into pieces, and a through crack appeared in the pipe wall. The surface of the breach was flat and smooth. These failure characteristics indicate that the failure mode of the P1200-1 pipe is a brittle failure.
When a pipe is cooled at different temperatures, residual stress on the pipe wall will be generated due to the different shrinkage rates of the inner and outer walls of the pipe, which has a considerable impact on the internal pressure bearing performance of the pipe. This feature becomes more pronounced when the pipe diameter and wall thickness increase. A larger wall thickness causes a greater difference between the inner and outer shrinkage. An excessive shrinkage rate leads to dimple fracture and defects, which may reduce the burst pressure when the pipe wall is very thick and the temperature difference between the inner and outer walls is large.
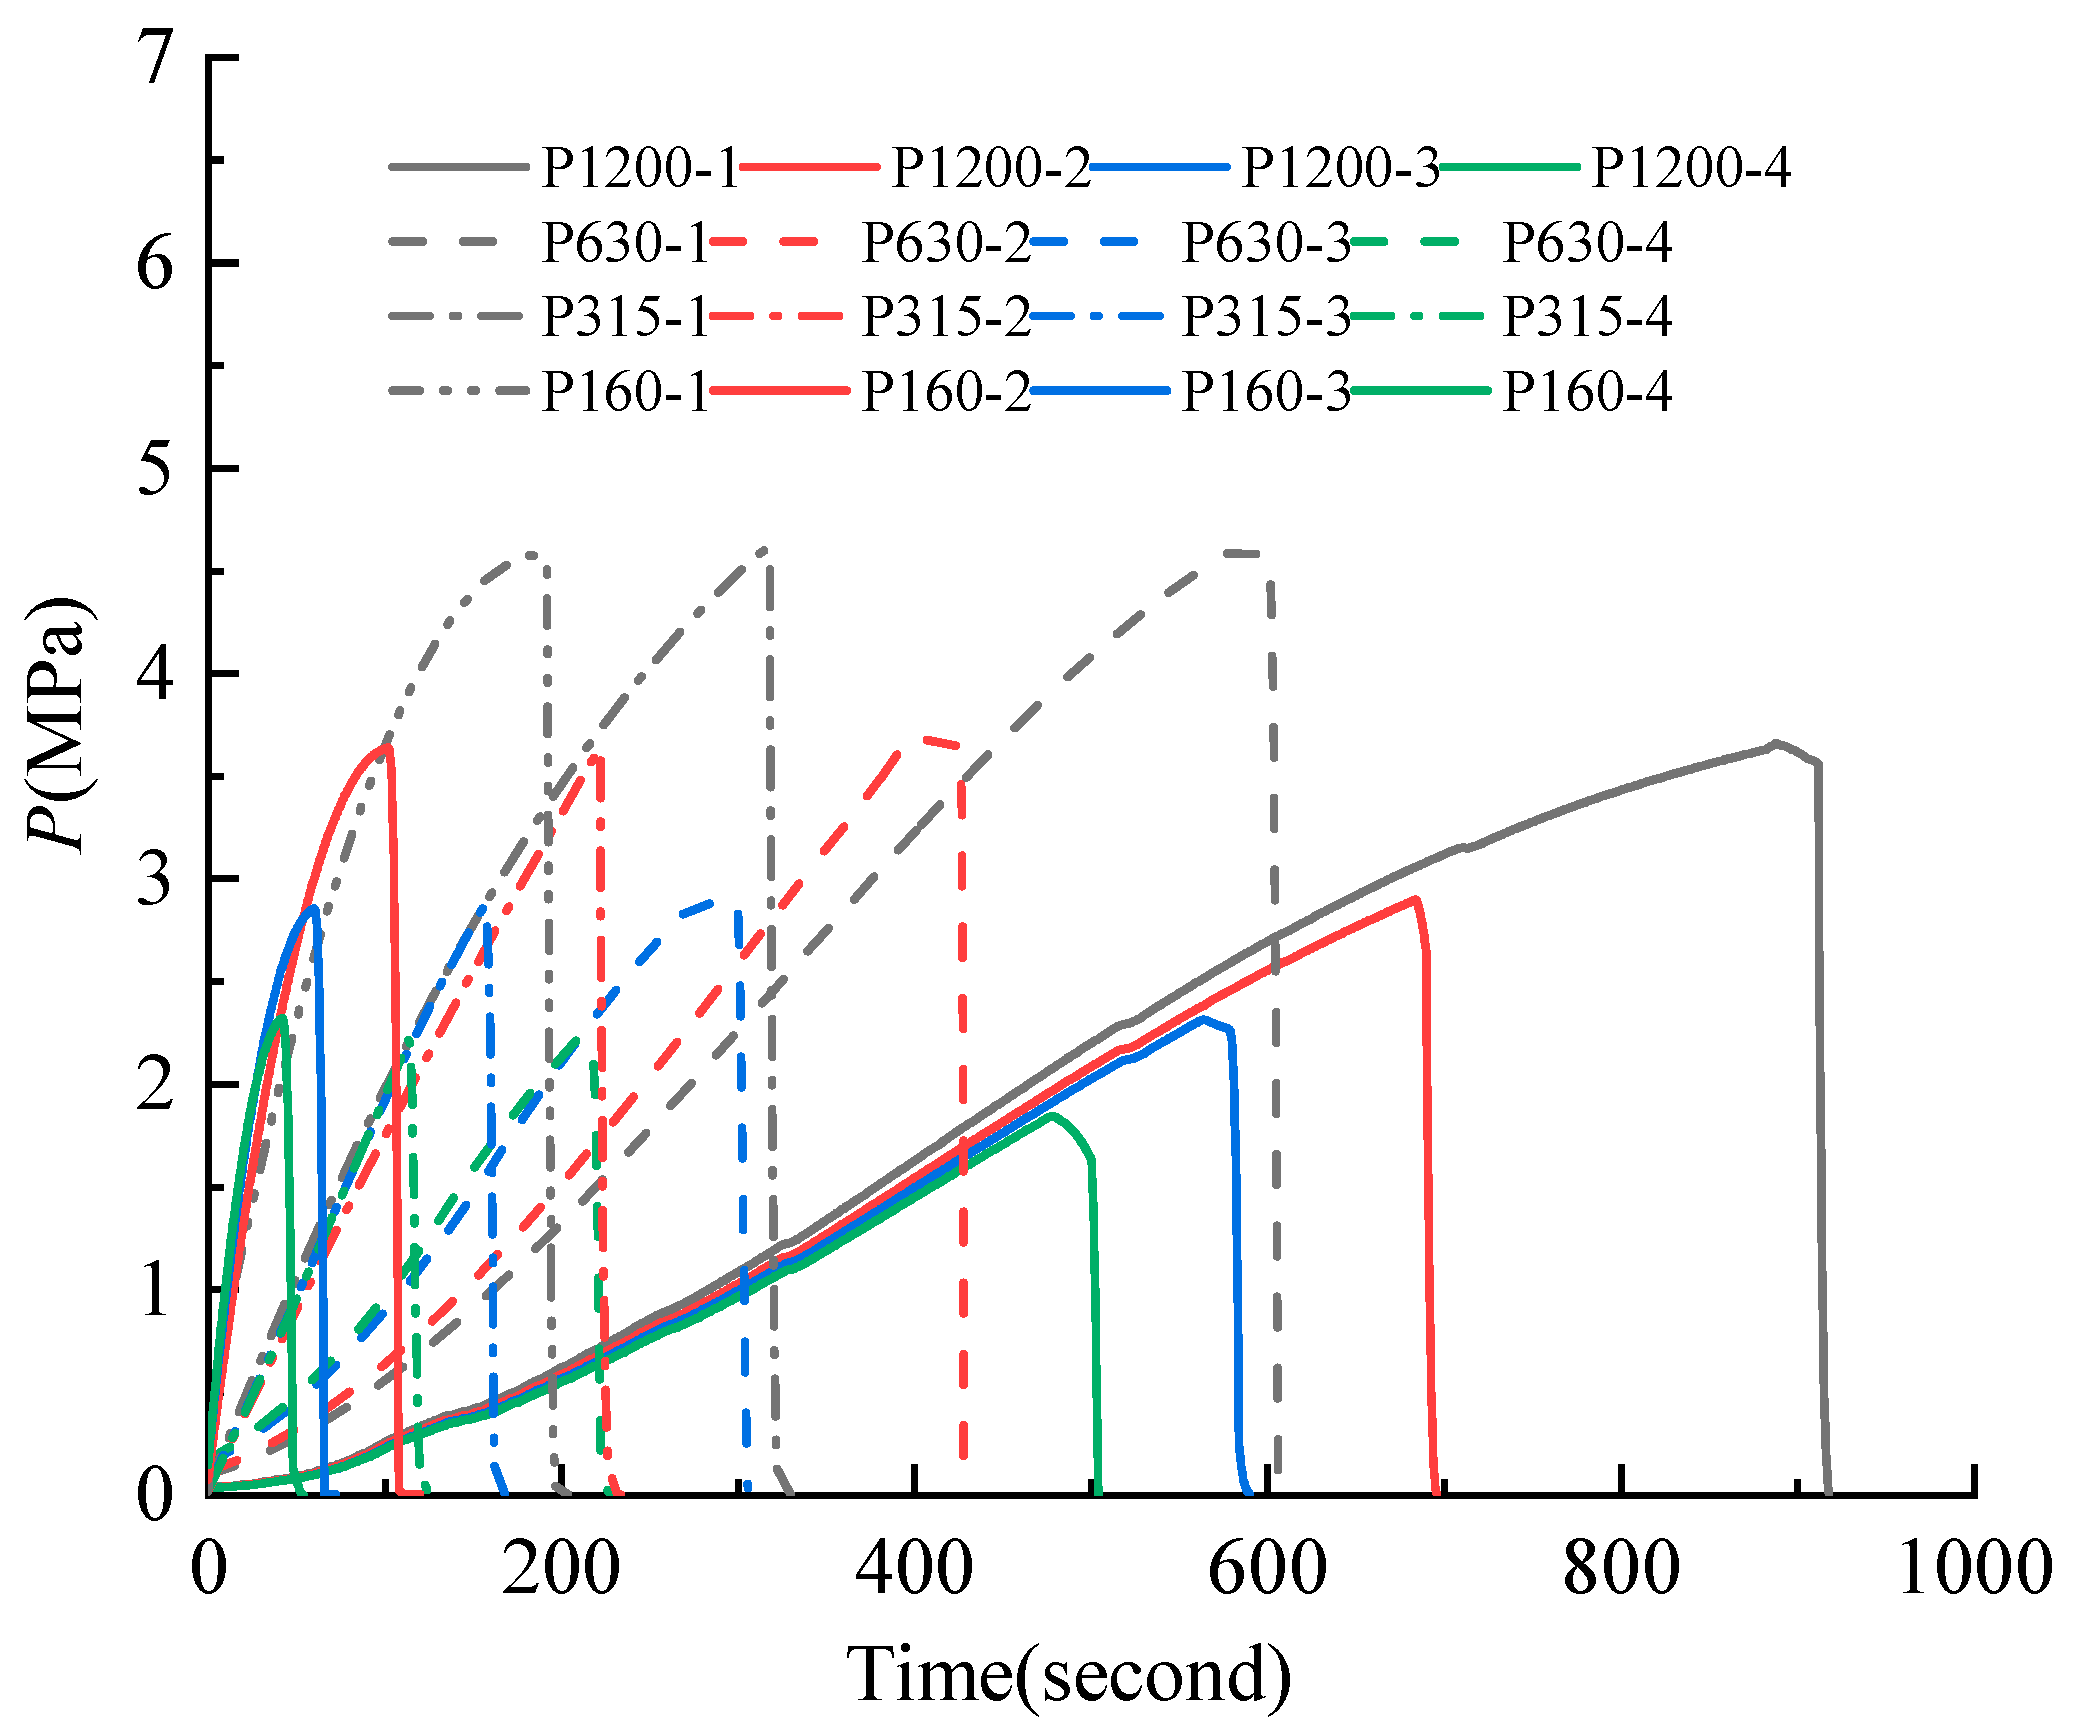
At the beginning of the test, the acquisition device was activated, and the pressure and deformation data were collected by the sensor and transmitted to the computer during the test pressurization. These monitoring data are drawn as curves such as burst pressure, pressurized time, hoop strain, and radial displacement for 16 pipes as shown by Figure 14, Figure 15 and Figure 16, respectively.
Three stages that can reflect the characteristics of the material are observed clearly from the stress–strain curves shown in Figure 17. In the first stage, the strain of the pipe wall and the internal water pressure increase linearly.
Three stages were observed from water injection and pressurization to pipeline rupture according to Figure 14. In the first stage, also known as the elastic stage, the strain of the pipe wall and the internal water pressure increase linearly. Then, the nonlinear relationship between internal pressure and strain is observed and the expansion of the pipeline is detected in the second phase. The last stage is the rupture phase. In this phase, the strain increases rapidly while the water pressure remains constant, and the obvious radial expansion occurs on the pipe wall. After a period of time, the pipe ruptures and fails.
The nominal pressure PN of the P1200-1 pipe was 1.0 MPa and the required minimum burst pressure was 3.2 MPa according to the AWWA M23 standard. In this test, the burst pressure of P1200-1 was 3.65 MPa, which far exceeded the limit specification.
5.2. Analysis of Simulation and Test Results
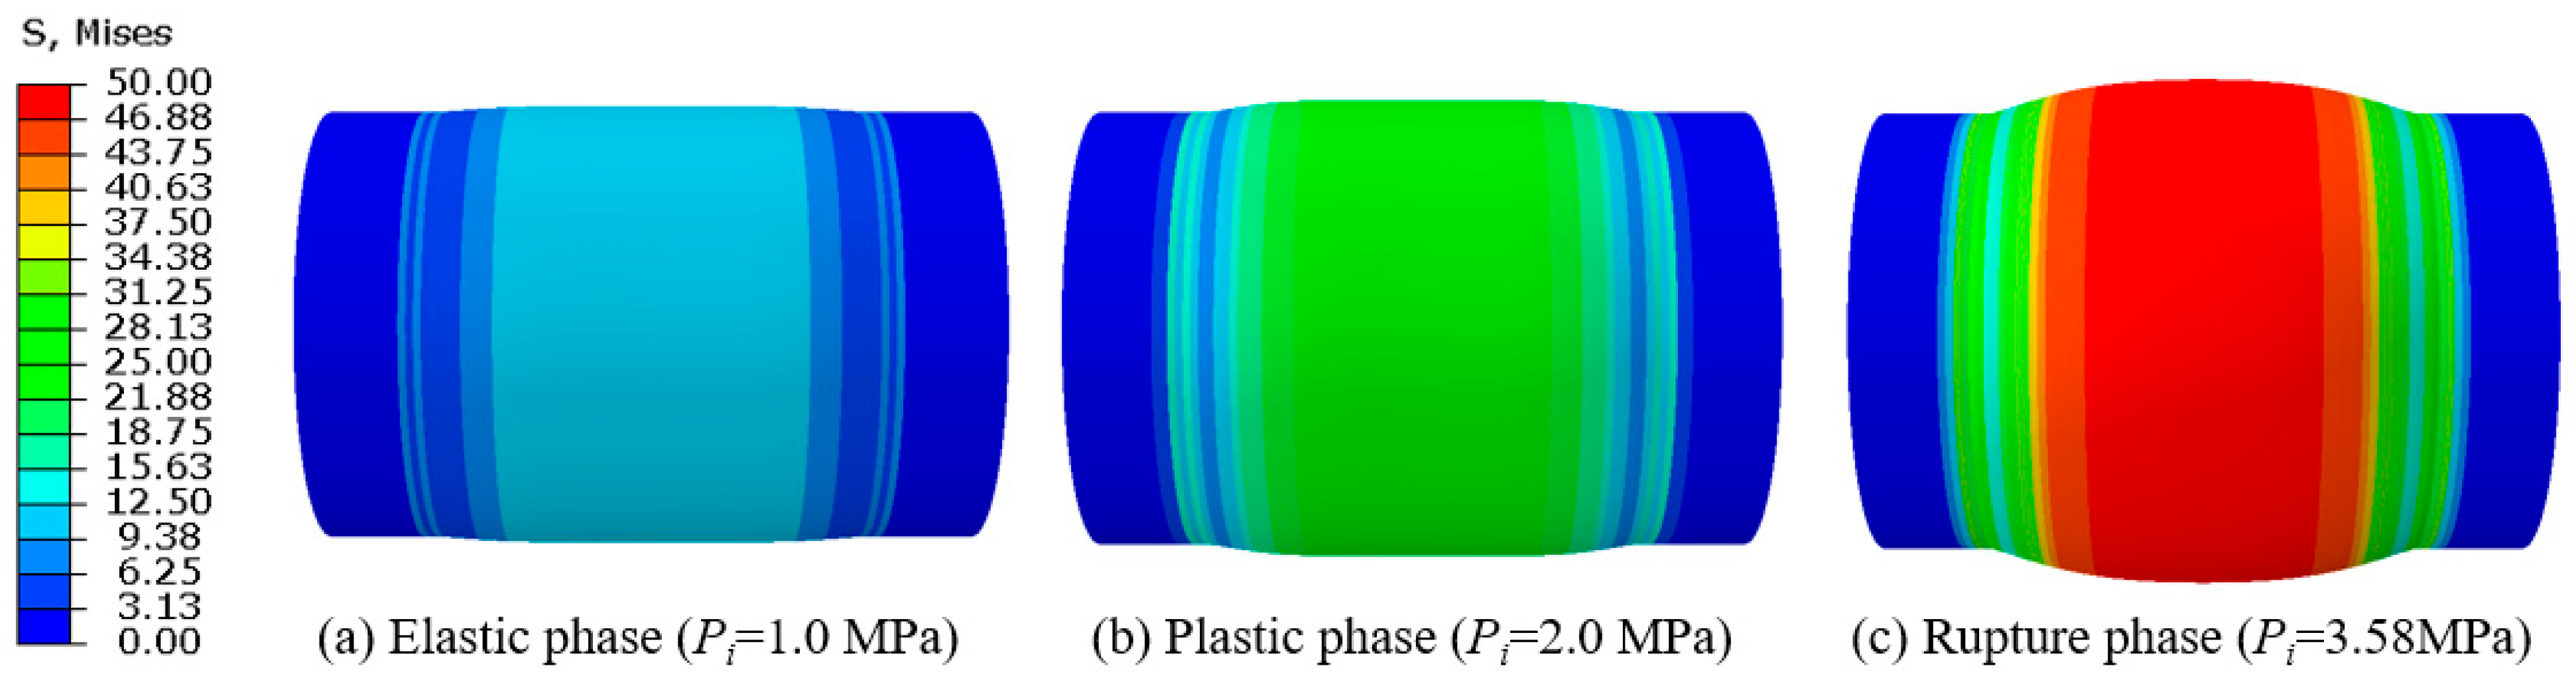
Figure 18 illustrates the von Mises stress distribution of the numerical results during pressurization. During the pressurization process, the elastoplastic behavior of the PVC pipe was considered. From Figure 18, it is clear that the pipeline failure process in the simulation experienced three stages like the burst test: initially, in the elastic phase, the pipe remained cylindrical and no swell feature was detected. The first step is shown in blue. Next, in the plastic phase, the shape of the tested pipe became an ellipse caused by large deformation. It can be seen from the cloud diagram that the von Mises stress on the pipe wall increased. Finally, in the rupture phase, the tested sample was broken into pieces or cracks. The pipe wall is displayed in red with extreme stress. In addition, an extremely obvious swelling appearance in the pipe can be noticed by the high stress concentration.
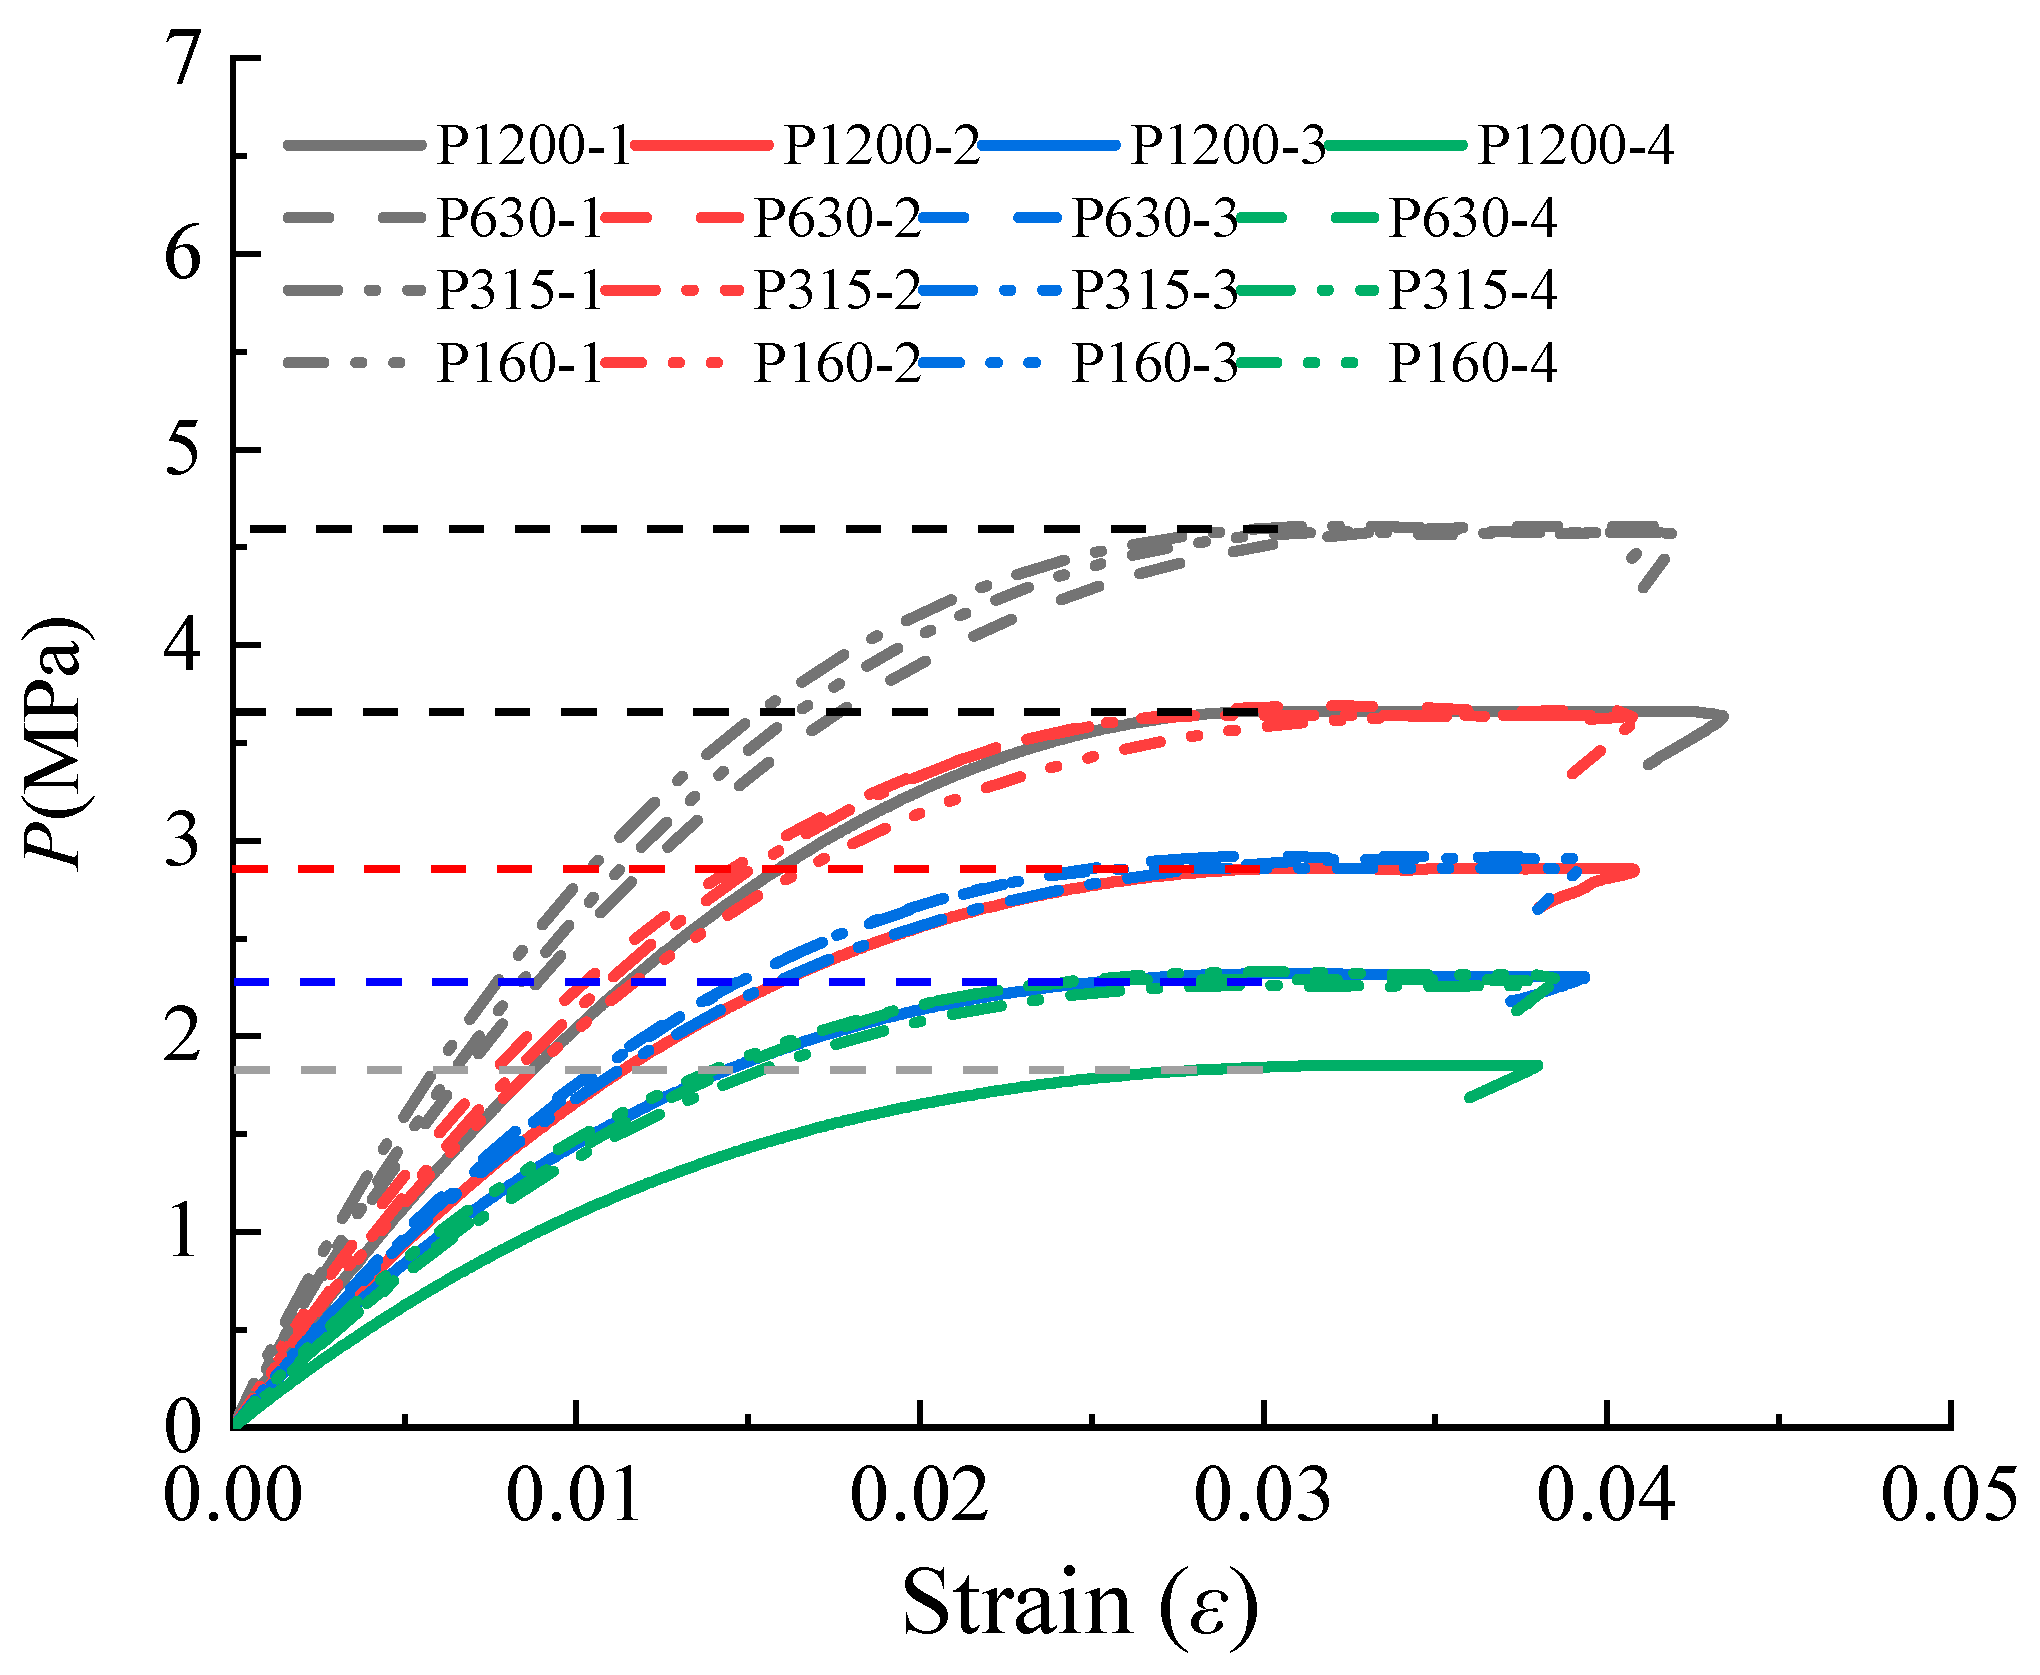
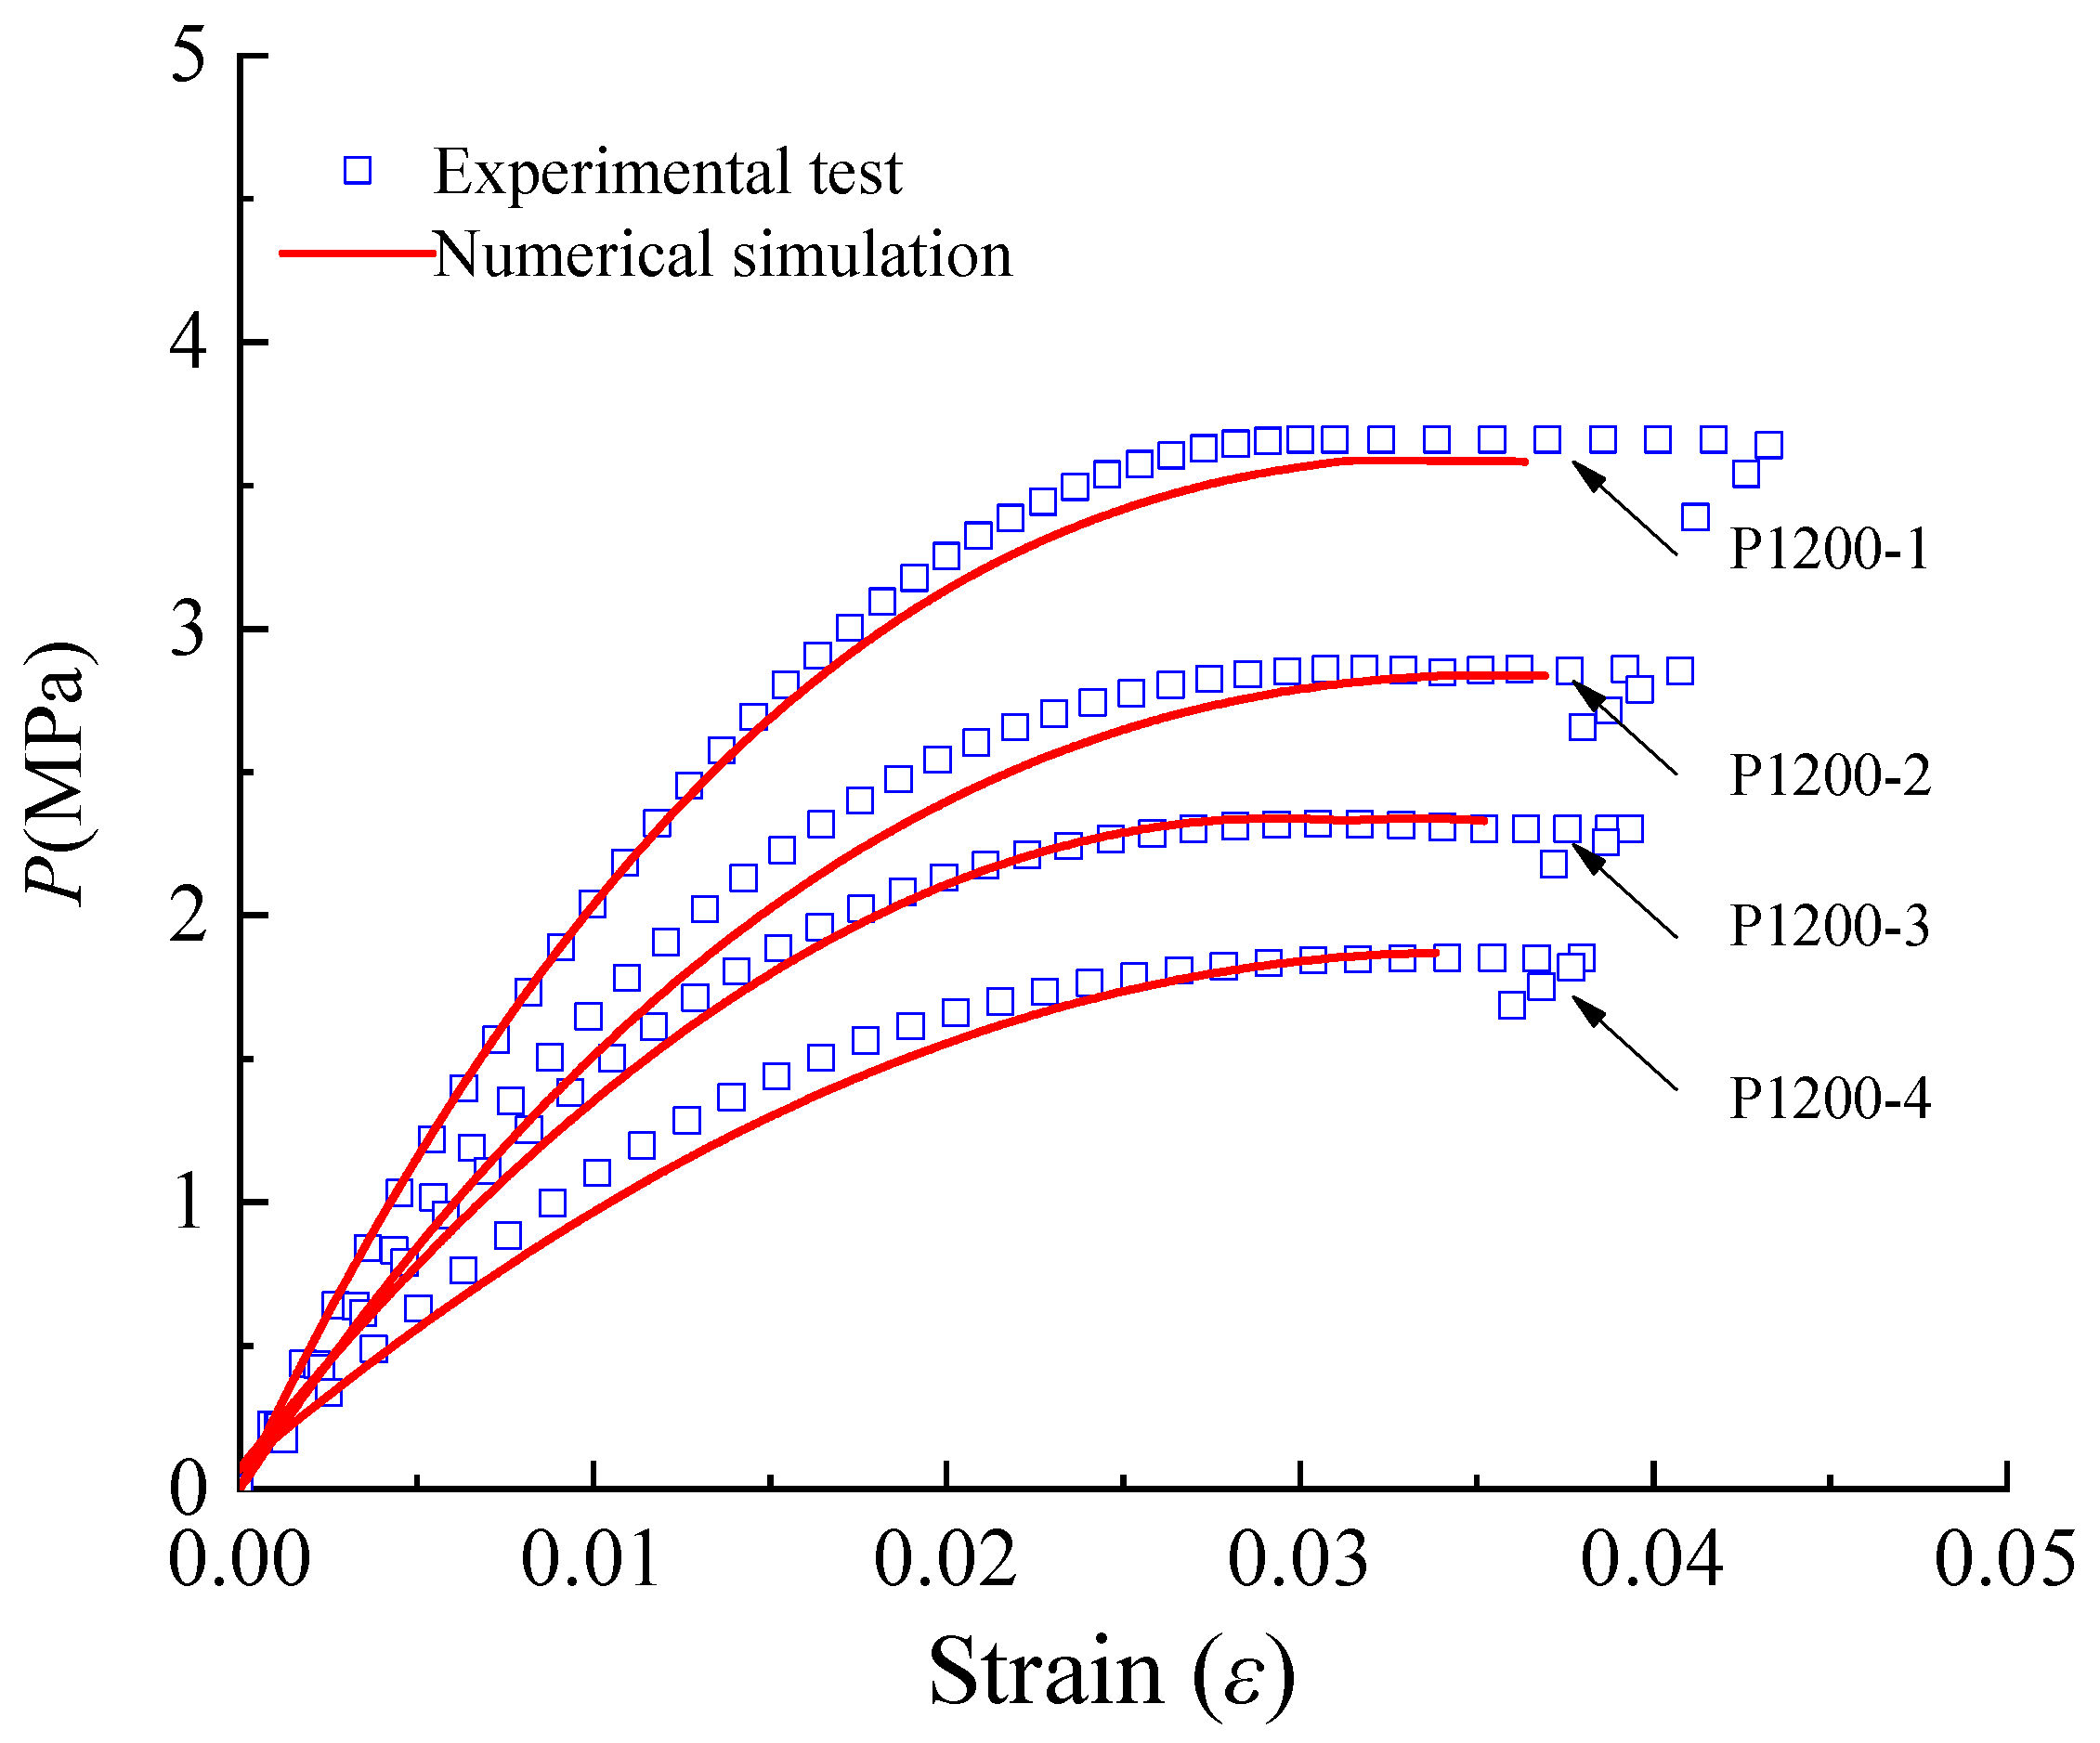
The burst pressure results obtained by the experiment, theoretical analysis, and numerical simulation are recorded in Table 3. Figure 19 illustrates the load–strain curves obtained in the FE model and experiment. When analyzing the load–strain curve, the simulation curve and test data show good consistency during the loading process. For P1200-1, the maximum internal water pressure achieved a value of P = 3.66 MPa and P = 3.58 MPa for the test data and simulation curves, respectively. The experimental and numerical simulation values of P1200-2, P1200-3, and P1200-4 were 2.90 MPa, 2.32 MPa, and 1.85 MPa, and 2.82 MPa, 2.29 MPa, and 1.83 MPa, respectively. There are differences in the material properties because of the manufacturing process and the impact of aging [40,41]. Figure 19 reveals that the increase in pipe wall thickness will increase the internal pressure bearing capacity.
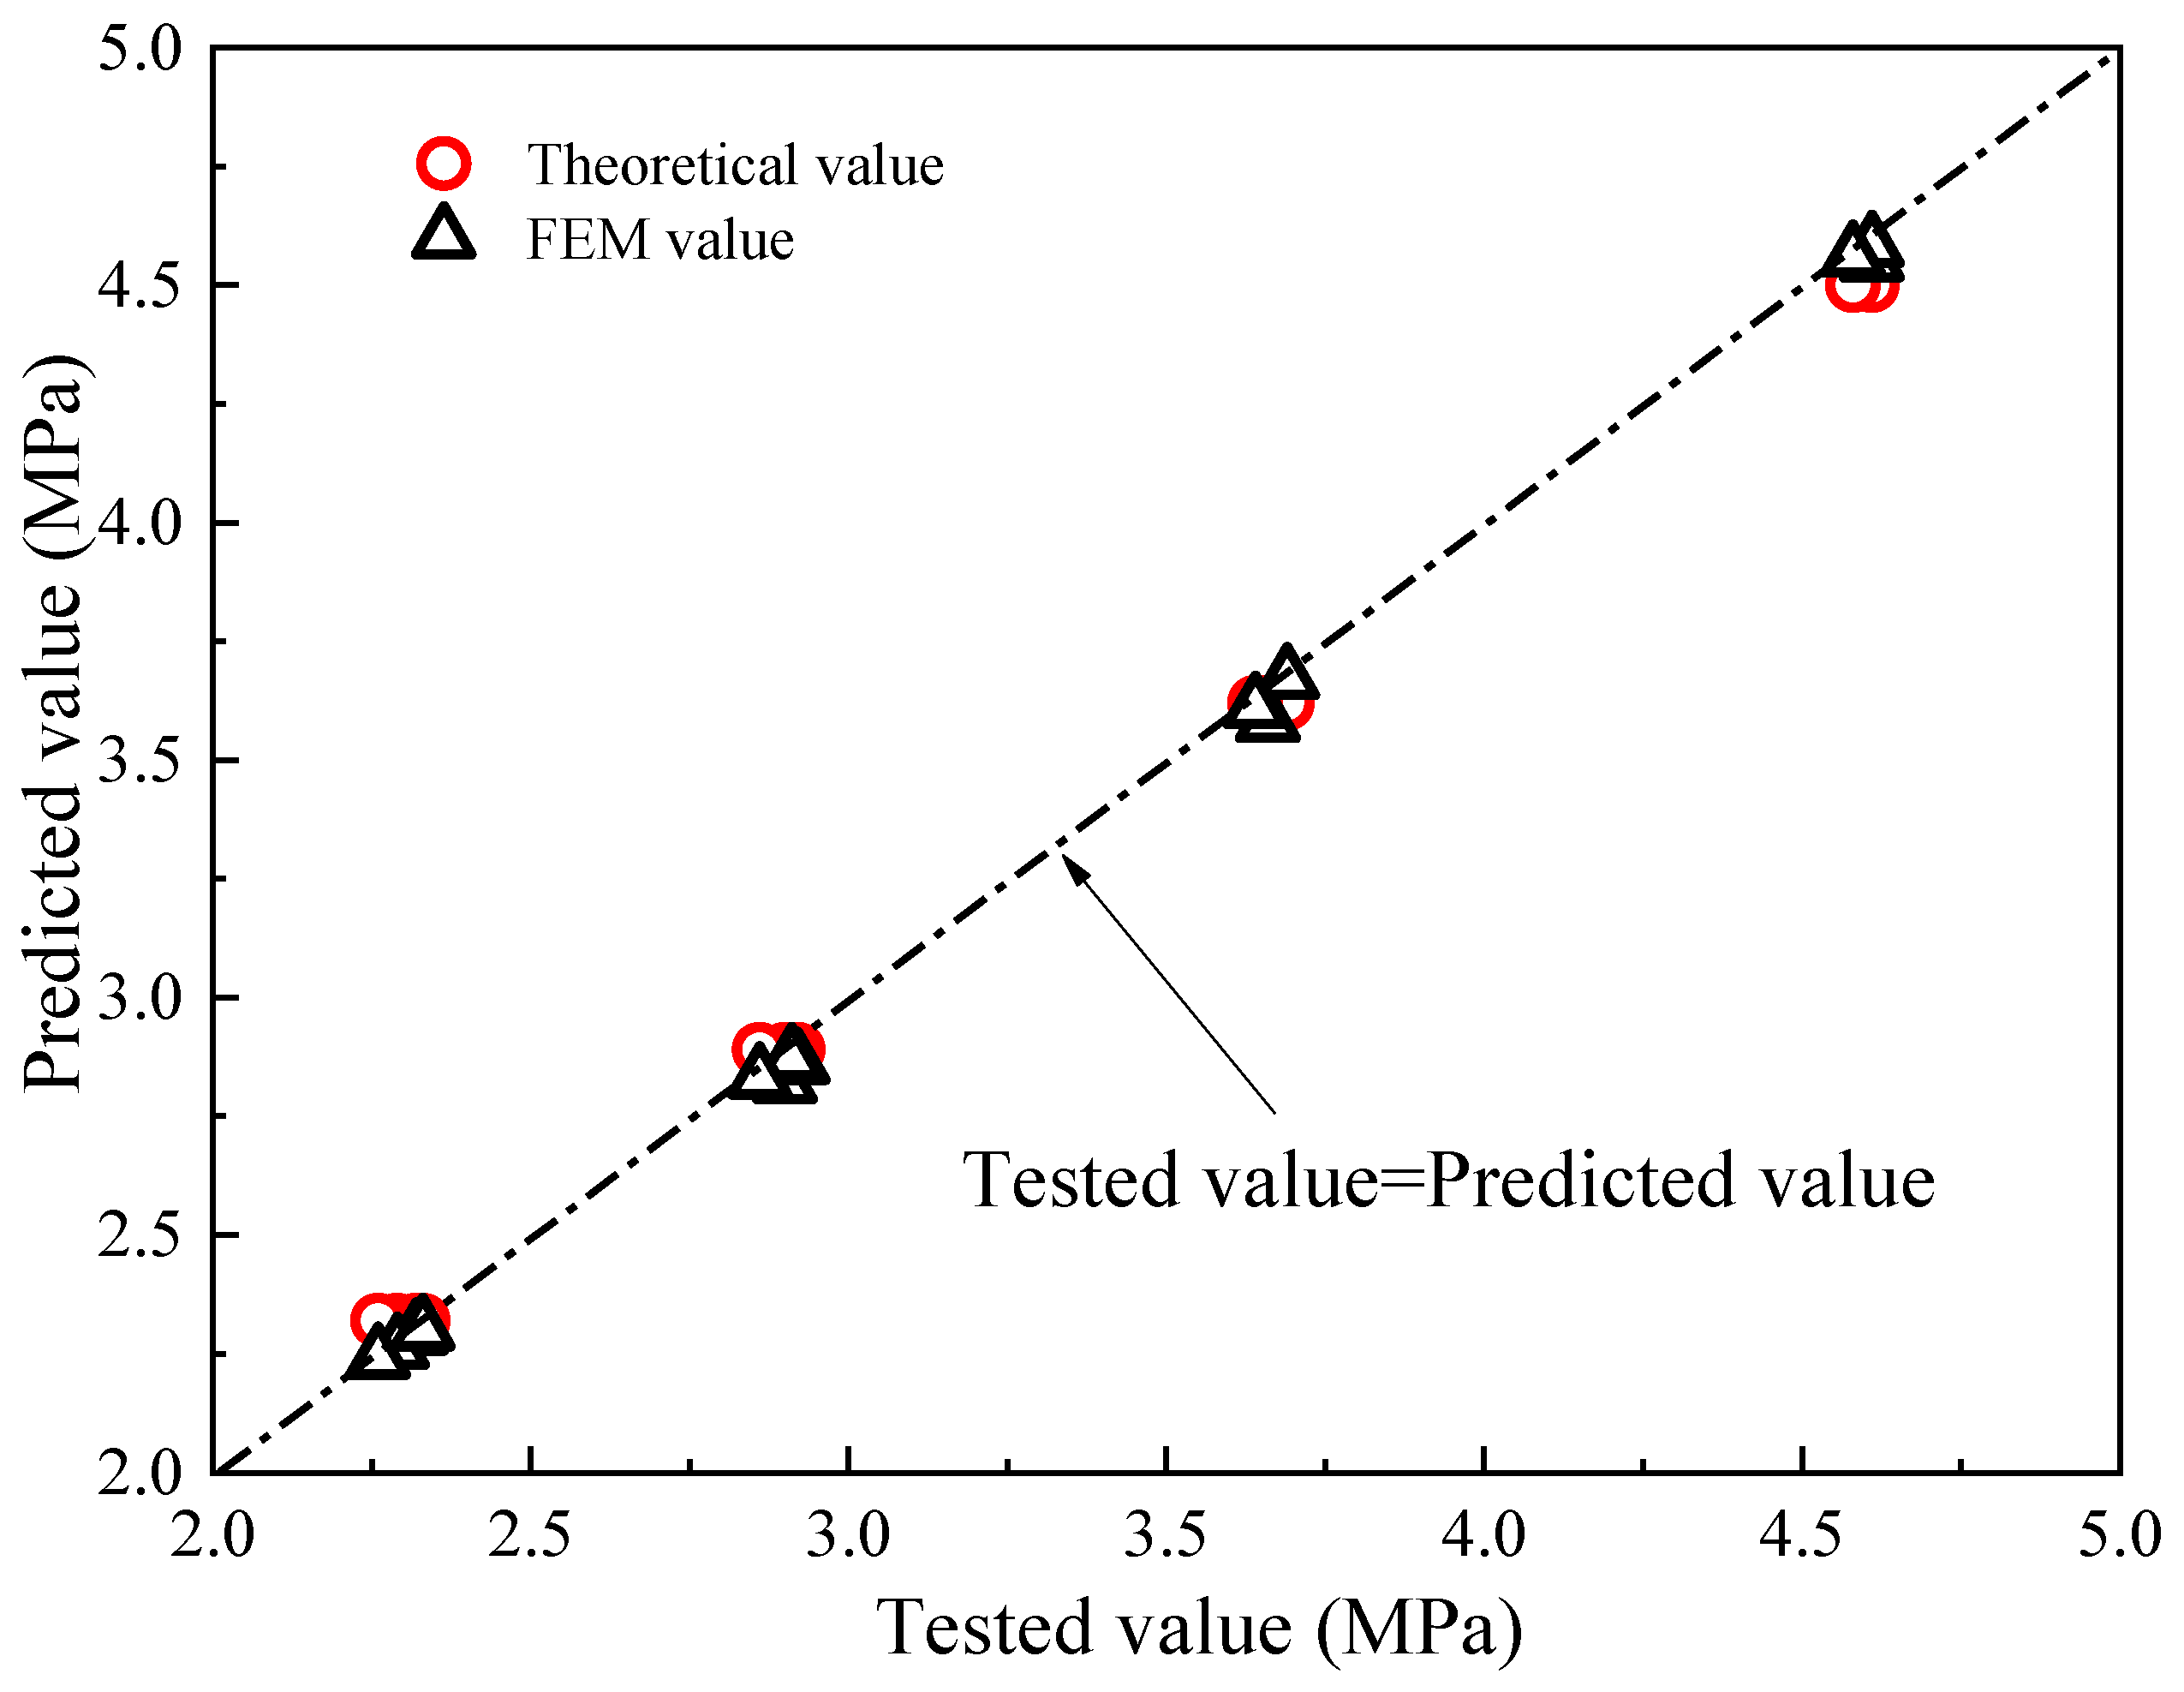
Figure 20 presents the correlation of the burst pressure calculated from Equation (15) with simulation and experimental results. As shown in Figure 20, the predicted values obtained from ASSY and FEM in this study are in good agreement with the ones that appeared in the burst tests.
Root mean square error (RMSE), mean absolute error (MAE), maximum error (ME), and correlation coefficient (R2) were chosen as the model’s predictive ability evaluation indicators to verify the performance of the ASSY burst pressure prediction model proposed in this paper.
where yi and ỹi are the tested value and predictive value obtained by various yield criteria.
Table 4 shows the statistical results of various models. As shown in Table 4, the RMSE, MAE, and ME of the ASSY model and FEM approach were 0.05, 0.4, 0.11 and 0.04, 0.04, and 0.08 respectively. The evaluation index values were sorted from small to large as FEM < ASSY < von Mises < Tresca < TSSY, indicating the FEM model had the smallest prediction error, followed by the ASSY model. This confirms that the FEM approach and ASSY solution have a higher degree of coincidence, and the von Mises solution model is better than the TSSY and Tresca solutions.
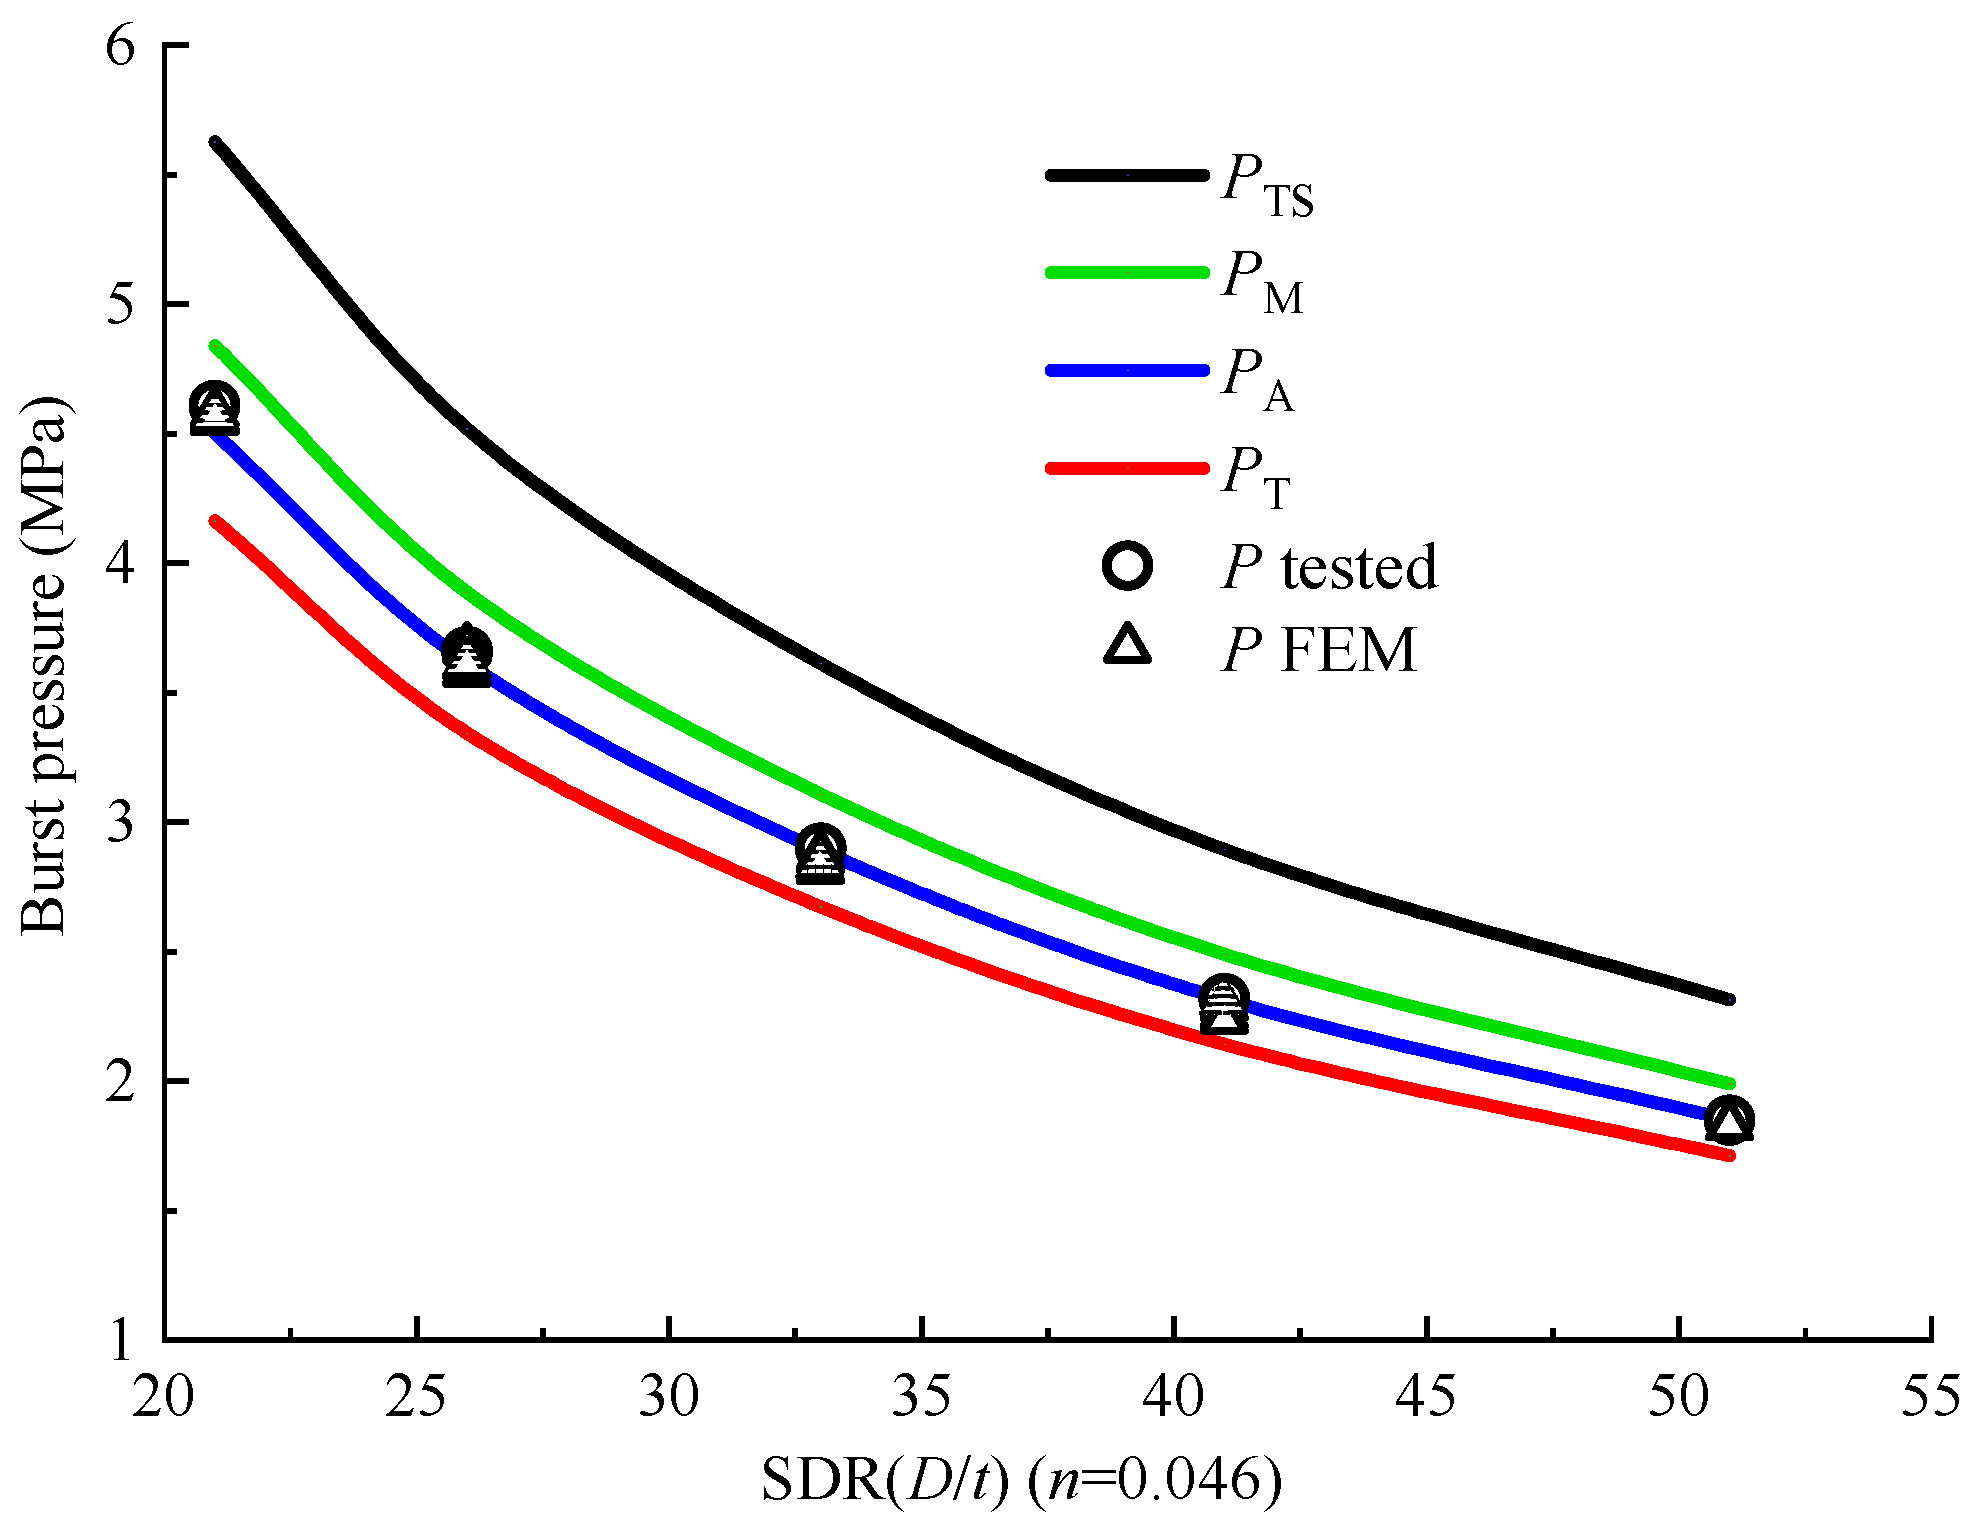
5.3. Discussion of Burst Pressure
In the burst pressure tests, 16 full size tests were carried out, and the burst pressures of those specimens were obtained. However, the experiments data indicated that the burst pressures decreased with increased SDR. Hence, theoretical approaches and various full size experimental data of burst pressure for PVC pipes were compared in Figure 21. The data from the 16 full size tests carried out in the experimental study were involved for various SDR grades ranging from 21 to 51. It can be seen from Figure 21 that the same trend of burst pressure derived from the four failure criteria was observed while the ASSY solution was the closest to the test data. However, significant differences have also been noticed in these methods; the TSSY overestimated the burst pressure of pipe and provided the upper limit of burst pressure while the Tresca solution did just the opposite. Based on other yield criteria such as Mises and ASSY, the burst pressure is between those two approaches. In the comparison of Mises and ASSY results, ASSY results are closer to the experimental test values.
Normally, nominal stress is used as the primary parameter of materials for safety assessment. Therefore, to directly address the role of the yield criteria solution, we analyzed the corresponding equivalent stress σe and hoop stress σθ in burst pressure solutions. The equivalent stress and hoop stress can be expressed as
The strain hardening exponent is a key parameter that affects stress. Figure 22 and Figure 23 show the variation of equivalent stress and hoop stress determined from Equations (18) and (19). The hoop stress was greatly affected by the yield criterion; however, when it comes to equivalent stress, a relatively smaller effect can be observed. In Figure 22 and Figure 23, both stresses decreased with the increase of the hardening index value and equivalent stress and the hoop stress obtained by ASSY and von Mises criteria was between the four yield criteria.
6. Conclusions
In this study, the ASSY criterion, a new multiaxial yield criterion based on the average shear stress, was proposed and a theoretical prediction method was derived for PVC pipe burst pressure based on the ASSY yield criterion. Moreover, a series of PVC pipe burst tests and numerical simulations were implemented to verify the proposed theoretical model. Furthermore, the sensitivity of parameters such as strain hardening exponent to burst pressure was discussed by comparing the ASSY solution with the approach determined by the Tresca, TSSY, and von Mises criteria.
Based upon the theoretical prediction and experimental and FE verification, the primary conclusions can be summarized as follows:
- (1)
- The comparison between the theoretical value of the ASSY approach with the experimental and numerical results confirmed that the burst pressure solution-based ASSY can fit test data for PVC pipes well and is more applicable and accurate than other criteria.
- (2)
- The test data revealed that the ASSY approach exhibited excellent performance in evaluating PVC pipe burst pressure. The TSSY approach and Tresca criterion provided an upper and lower bound, respectively, while they overestimated or underestimated burst pressure to a certain extent.
- (3)
- The theoretical value of water burst pressure was reduced with increasing strain hardening exponent n-value, while it increased with increasing SDR. The equivalent stress and the hoop stress derived from the four theoretical solutions showed a similar tendency. However, a significant discrepancy among them can be recognized.
Consequently, we are convinced that the ASSY approach proposed in this study can be applied as a practical tool for evaluating the PVC pipe bursting pressures.
Author Contributions
Conceptualization, J.Y. and S.H.; methodology, J.Y.; software, J.Y.; validation, J.Y. and S.H.; formal analysis, J.Y.; investigation, J.Y.; resources, J.Y.; data curation, J.Y.; writing—original draft preparation, J.Y.; writing—review and editing, J.Y. and S.H.; visualization, J.Y.; supervision, J.Y. and S.H.; project administration, J.Y. and S.H.; funding acquisition, S.H. All authors have read and agreed to the published version of the manuscript.
Funding
This work was funded by the National Natural Science Foundation of China (51739008).
Institutional Review Board Statement
Not applicable.
Informed Consent Statement
Not applicable.
Data Availability Statement
Not applicable.
Acknowledgments
This work was supported by the National Natural Science Foundation of China (51739008).
Conflicts of Interest
The authors declare no conflict of interest.
Nomenclature
| b | Material parameter | ỹi | Predictive value |
| C | Material parameter | α | The tensile and compression strength ratio |
| D | Pipe mean diameter | β | Material parameter |
| D0 | Initial diameter | σ′ | Uniaxial true stress |
| E | Young’s modulus | σA | Equivalent stress based on ASSY |
| k | Coefficient determined by yield criterion | σc | Compressive strength |
| K | Strengthening coefficient | σe | Equivalent stress |
| L | Pipe length | σM | Equivalent stress based on Mises |
| n | Strain hardening index | σt | Uniaxial engineering tensile strength |
| Pi | Internal pressure | σt′ | Uniaxial true tensile strength |
| PA | Burst pressure based on ASSY | σT | Equivalent stress based on Tresca |
| Pb,TES | Burst pressure determined by TES criterion | σTS | Equivalent stress based on TSSY |
| Pb,TI | Burst pressure determined by TI criterion | σr | The radial stress |
| Pb,ZS | Burst pressure determined by ZS criterion | σθ | The hoop stress |
| PM | Burst pressure based on the von Mises yield criterion | σz | The axial stress |
| PN | The nominal pressure of pipe | σy | The yield strength |
| Ps | Tested burst pressure | ε′ | Uniaxial true strain |
| PT | Burst pressure based on the Tresca yield criterion | εt′ | Uniaxial true tensile strain |
| PTS | Burst pressure based on TSSY | εt | Uniaxial engineering strain |
| t | Wall thickness | εr | The radial stress |
| t0 | Initial wall thickness | εθ | The hoop stress |
| yi | Tested value | εz | The axial stress |
References
- Jemii, H.; Bahri, A.; Boubakri, A.; Hammiche, D.; Elleuch, K.; Guermazi, N. On the mechanical behaviour of industrial PVC pipes under pressure loading: Experimental and numerical studies. J. Polym. Res. 2020, 27, 1–13. [Google Scholar] [CrossRef]
- Folkman, S. Water Main Break Rates in the USA and Canada a Comprehensive Study; Utah State University Buried Structures Laboratory: Logan, UT, USA, 2018; pp. 1–48. [Google Scholar]
- Wéber, R.; Huzsvár, T.; Hős, C. Vulnerability analysis of water distribution networks to accidental pipe burst. Water Res. 2020, 184, 116178. [Google Scholar] [CrossRef] [PubMed]
- Zhao, Z.; Li, S.; Zhou, Y. Analysis of Chinese Pipe Burst Events Reported by Web Media in 2013. In Proceedings of the American Society of Civil Engineers International Conference on Pipelines and Trenchless Technology, Xiamen, China, 21 November 2014; pp. 320–333. [Google Scholar]
- Ayed, L.; Hafsi, Z. Experimental and Numerical Investigations of Multi-leaks Detection in a Nonhomogenous Pipeline System. Arab. J. Sci. Eng. 2021, 3, 1–11. [Google Scholar] [CrossRef]
- Adewole, J.K.; Jensen, L.; Al-Mubaiyedh, U.A.; von Solms, N.; Hussein, I.A. Transport properties of natural gas through polyethylene nanocomposites at high temperature and pressure. J. Polym. Res. 2012, 19, 9814. [Google Scholar] [CrossRef]
- Citarella, R.; Giannella, V.; Lepore, M.A.; Fellinger, J. FEM-DBEM approach to analyse crack scenarios in a baffle cooling pipe undergoing heat flux from the plasma. AIMS Mater. Sci. 2017, 4, 391–412. [Google Scholar] [CrossRef]
- Fellinger, J.; Citarella, R.; Giannella, V.; Lepore, M.A.; Sepe, R.; Czerwinski, M.; Herold, F.; Stadler, R. Overview of fatigue life assessment of baffles in Wendelstein 7-X. Fusion Eng. Des. 2018, 136, 292–297. [Google Scholar] [CrossRef] [Green Version]
- Peres, F.M.; Schön, C.G. An alternative approach to the evaluation of the slow crack growth resistance of polyethylene resins used for water pipe extrusion. J. Polym. Res. 2007, 14, 181–189. [Google Scholar] [CrossRef]
- Duong, B.P.; Kim, J.; Jeong, I.; Kim, C.H.; Kim, J.-M. Acoustic Emission Burst Extraction for Multi-Level Leakage Detection in a Pipeline. Appl. Sci. 2020, 10, 1933. [Google Scholar] [CrossRef] [Green Version]
- Ge, P.; Xia, H.; Liu, Q.; Shi, C.; Xiao, W.; Jia, X.; Xu, Y. Prediction of ultimate burst pressure and comparison of failure criteria for thermoplastic composite pipes. IOP Conf. Ser. Earth Environ. Sci. 2021, 725, 012004. [Google Scholar] [CrossRef]
- Germain, Y. Burst pressure prediction of polyamide pipes. Polym. Eng. Sci. 1998, 38, 657–661. [Google Scholar] [CrossRef]
- Zheng, J.; Shi, J.; Shi, J.; Zhong, S.; Rao, J.; Li, G.; Li, X. Short-term burst pressure of polyethylene pipe reinforced by winding steel wires under various temperatures. Compos. Struct. 2015, 121, 163–171. [Google Scholar] [CrossRef]
- Zhou, W.G.; Huang, X. Model error assessments of burst capacity models for corroded pipeline. Int. J. Press. Vessel. Pip. 2012, 99–100, 1–8. [Google Scholar] [CrossRef]
- Law, M.; Bowie, G. Prediction of failure strain and burst pressure in high yield-to-tensile strength ratio linepipe. Int. J. Press. Vessel. Pip. 2007, 84, 487–492. [Google Scholar] [CrossRef]
- Mattos, H.D.C.; Paim, L.; Reis, J. Analysis of burst tests and long-term hydrostatic tests in produced water pipelines. Eng. Fail. Anal. 2012, 22, 128–140. [Google Scholar] [CrossRef]
- Zhu, X.-K.; Leis, B.N. Evaluation of burst pressure prediction models for line pipes. Int. J. Press. Vessel. Pip. 2012, 89, 85–97. [Google Scholar] [CrossRef]
- Cooper, W.E. The Significance of The Tensile Test to Pressure Vessel Design. Weld. J. Weld. Res. Suppl. 1957, 36, 49–56. [Google Scholar]
- Law, M.; Bowie, G. Failure strain in high yield-to-tensile ratio linepipes. J. Pipeline Syst. Eng. 2006, 5, 25–36. [Google Scholar]
- Giannella, V.; Citarella, R.; Fellinger, J.; Esposito, R. LCF assessment on heat shield components of nuclear fusion experiment “Wendelstein 7-X” by critical plane criteria. Procedia Struct. Integr. 2018, 8, 318–331. [Google Scholar] [CrossRef]
- Giannella, V.; Fellinger, J.; Perrella, M.; Citarella, R. Fatigue life assessment in lateral support element of a magnet for nuclear fusion experiment “Wendelstein 7-X”. Eng. Fract. Mech. 2017, 178, 243–257. [Google Scholar] [CrossRef] [Green Version]
- Chen, Z.; Zhu, W.; Di, Q.; Wang, W. Prediction of Burst Pressure of Pipes with Geometric Eccentricity. J. Press. Vessel. Technol. 2015, 137, 061201. [Google Scholar] [CrossRef] [Green Version]
- Sudduth, R.D. Comparison of the failure conditions for creep, stress relaxation, and constant strain rate measurements to predict pipe burst for two ABS materials using the universal viscoelastic model. J. Appl. Polym. Sci. 2004, 93, 247–260. [Google Scholar] [CrossRef]
- Zhang, Y.; Ben Jar, P.-Y. Comparison of Mechanical Properties between PE80 and PE100 Pipe Materials. J. Mater. Eng. Perform. 2016, 25, 4326–4332. [Google Scholar] [CrossRef]
- Gerdeen, M. Effect of strain gradient and curvature on forming limit diagrams for anisotropic sheets. J. Mater. Shap. Technol. 1991, 9, 253. [Google Scholar]
- Majid, F.; Safe, M.; Elghorba, M. Burst behavior of CPVC compared to HDPE thermoplastic polymer under a controlled internal pressure. Procedia Struct. Integr. 2017, 3, 380–386. [Google Scholar] [CrossRef]
- Guidara, M.A.; Bouaziz, M.; Schmitt, C.; Capelle, J.; Taïeb, E.H.; Azari, Z.; Hariri, S. Structural integrity assessment of defected high density poly-ethylene pipe: Burst test and finite element analysis based on J-integral criterion. Eng. Fail. Anal. 2015, 57, 282–295. [Google Scholar] [CrossRef]
- Chen, Y.; Hong, Z.; Zhang, J.; Xin, L.; Jing, Z. Failure analysis of high strength pipeline with single and multiple corrosions. Mater. Des. 2015, 67, 552–557. [Google Scholar] [CrossRef]
- Mondal Chandra, B.; Dhar Sutra, A. Finite-element evaluation of burst pressure models for corroded pipelines. J. Press. Vessel. Technol. 2017, 139, 021702. [Google Scholar] [CrossRef]
- Hasan, M.; Khan, F.; Kenny, S. Identification of the Cause of Variability of Probability of Failure for Burst Models Recommended by Codes/Standards. J. Press. Vessel. Technol. 2011, 133, 041101. [Google Scholar] [CrossRef]
- Jafari, S.; Alashti, R.A.; Hosseinipour, S.J. Comparison of Ductile Fracture Models on Load Bearing Capacity of a Dented Aluminum Pipe Subjected to Internal Pressure. Arab. J. Sci. Eng. 2014, 39, 8031–8049. [Google Scholar] [CrossRef]
- Wang, N.; Zarghamee, M.S. Evaluating Fitness-for-Service of Corroded Metal Pipelines: Structural Reliability Bases. J. Pipeline Syst. Eng. Pract. 2014, 5, 04013012. [Google Scholar] [CrossRef]
- Ma, B.; Shuai, J.; Liu, D.; Xu, K. Assessment on failure pressure of high strength pipeline with corrosion defects. Eng. Fail. Anal. 2015, 32, 209–219. [Google Scholar] [CrossRef]
- Rezaei, H.; Ryan, B.; Stoianov, I. Pipe Failure Analysis and Impact of Dynamic Hydraulic Conditions in Water Supply Networks. Procedia Eng. 2015, 119, 253–262. [Google Scholar] [CrossRef] [Green Version]
- Yu, M.-H. Twin shear stress yield criterion. Int. J. Mech. Sci. 1983, 25, 71–74. [Google Scholar] [CrossRef]
- Zhu, X.-K.; Leis, B.N. Average shear stress yield criterion and its application to plastic collapse analysis of pipelines. Int. J. Press. Vessel. Pip. 2006, 83, 663–671. [Google Scholar] [CrossRef]
- Zike, S.; Sørensen, B.F.; Mikkelsen, L.P. Experimental determination of the micro-scale strength and stress-strain relation of an epoxy resin. Mater. Des. 2016, 98, 47–60. [Google Scholar] [CrossRef] [Green Version]
- Payghan, V.; Jadhav, D.N.; Savant, G.Y.; Bharadwaj, S. Design & Analysis of Steam Drum Based on ASME Boiler and Pressure Vessel Code, Section VIII Div.2 & Div.3. Appl. Mech. Mater. 2016, 852, 511–517. [Google Scholar] [CrossRef]
- Guidara, M.A.; Bouaziz, M.A.; Schmitt, C.; Capelle, J.; Hariri, S. Burst Test and J-Integral Crack Growth Criterion in High Density Polyethylene Pipe Subjected to Internal Pressure; Springer International Publishing: Berlin/Heidelberg, Germany, 2015; pp. 391–399. [Google Scholar]
- Benyahia, H.; Tarfaoui, M.; EL Moumen, A.; Ouinas, D.; Hassoon, O. Mechanical properties of offshoring polymer composite pipes at various temperatures. Compos. Part B Eng. 2018, 152, 231–240. [Google Scholar] [CrossRef]
- González-Arévalo, N.; Velázquez, J.; Díaz-Cruz, M.; Cervantes-Tobón, A.; Terán, G.; Hernández-Sanchez, E.; Capula-Colindres, S. Influence of aging steel on pipeline burst pressure prediction and its impact on failure probability estimation. Eng. Fail. Anal. 2021, 120, 104950. [Google Scholar] [CrossRef]
Figure 1.
The proportion of broken water pipes and failures [2].
Figure 1.
The proportion of broken water pipes and failures [2].

Figure 2.
Failure cause of PVC pipes [2].
Figure 2.
Failure cause of PVC pipes [2].

Figure 3.
Stress state of double shear element.

Figure 4.
The yield surfaces of the unified strength theory.

Figure 5.
The power exponential constitutive model.

Figure 6.
The force and deformation of the cylindrical unit under internal pressure.

Figure 7.
Stress–strain curve of PVC material and tensile loading device: (a) tensile testing and (b) stress–strain curve.
Figure 7.
Stress–strain curve of PVC material and tensile loading device: (a) tensile testing and (b) stress–strain curve.

Figure 8.
Schematic diagram of PVC pipe samples.

Figure 9.
The burst test schematic.

Figure 10.
Equipment of burst pressure test (a) P1200-1 and (b) P160-1.

Figure 11.
Pipe model and finite-element mesh (P1200-1).

Figure 12.
Criteria for the pipe burst pressure.

Figure 13.
Typical specimen failure of short-term burst tests.

Figure 14.
Internal pressure loading curve.

Figure 15.
Internal water pressure–strain curve.

Figure 16.
Pressure–displacement curve in burst process.

Figure 17.
The process of the pipe under pressure (P1200-1).

Figure 18.
Von Mises stress distribution during pressurization (P1200-1).

Figure 19.
Numerical and experimental stress–strain curves.

Figure 20.
Correlation between predicted value and measured value.

Figure 21.
The relationship between burst pressure and SDR.

Figure 22.
Variation of equivalent stress with strain hardening exponent n.

Figure 23.
Variation of hoop stress with strain hardening exponent n.


Table 1.
PVC material tensile testing result.
| Parameters | σy (MPa) | σt (MPa) | εt | E (MPa) | σt′ (MPa) | εt′ | n | K |
|---|---|---|---|---|---|---|---|---|
| value | 43.67 | 45.15 | 0.047 | 1259.43 | 47.28 | 0.046 | 0.046 | 57.05 |
Table 2.
Pipe specimen geometry and test results.
| Pipe Number | Length (L/mm) | Wall Thickness (t/mm) | Mean Diameter (D/mm) | SDR(D/t) | Burst Pressure (Ps/MPa) |
|---|---|---|---|---|---|
| P1200-1 | 1800 | 45.9 | 1200 | 26 | 3.66 |
| P1200-2 | 1800 | 36.7 | 1200 | 33 | 2.90 |
| P1200-3 | 1800 | 29.4 | 1200 | 41 | 2.32 |
| P1200-4 | 1800 | 23.5 | 1200 | 51 | 1.85 |
| P630-1 | 1200 | 30.0 | 630 | 21 | 4.61 |
| P630-2 | 1200 | 24.1 | 630 | 26 | 3.69 |
| P630-3 | 1200 | 19.3 | 630 | 33 | 2.92 |
| P630-4 | 1200 | 15.4 | 630 | 41 | 2.29 |
| P315-1 | 800 | 15.0 | 315 | 21 | 4.61 |
| P315-2 | 800 | 12.1 | 315 | 26 | 3.64 |
| P315-3 | 800 | 9.7 | 315 | 33 | 2.91 |
| P315-4 | 800 | 7.7 | 315 | 41 | 2.26 |
| P160-1 | 800 | 7.7 | 160 | 21 | 4.58 |
| P160-2 | 800 | 6.2 | 160 | 26 | 3.64 |
| P160-3 | 800 | 4.9 | 160 | 33 | 2.86 |
| P160-4 | 800 | 4.0 | 160 | 41 | 2.33 |
Table 3.
Comparison of burst pressure results.
| Pipe Number | Test Value (MPa) | Theoretical Value (MPa) | Error (%) | FEM Value (MPa) | Error (%) |
|---|---|---|---|---|---|
| P1200-1 | 3.66 | 3.62 | −1.09 | 3.58 | −2.19 |
| P1200-2 | 2.90 | 2.89 | −0.34 | 2.82 | −2.76 |
| P1200-3 | 2.32 | 2.32 | 0.00 | 2.29 | −1.29 |
| P1200-4 | 1.85 | 1.85 | 0.00 | 1.83 | −1.08 |
| P630-1 | 4.61 | 4.50 | −2.39 | 4.55 | −1.30 |
| P630-2 | 3.69 | 3.62 | −1.90 | 3.67 | −0.54 |
| P630-3 | 2.92 | 2.89 | −1.03 | 2.86 | −2.05 |
| P630-4 | 2.29 | 2.32 | 1.31 | 2.26 | −1.31 |
| P315-1 | 4.61 | 4.50 | −2.39 | 4.58 | −0.65 |
| P315-2 | 3.64 | 3.62 | −0.55 | 3.61 | −0.82 |
| P315-3 | 2.91 | 2.89 | −0.69 | 2.87 | −1.37 |
| P315-4 | 2.26 | 2.32 | 2.65 | 2.24 | −0.88 |
| P160-1 | 4.58 | 4.50 | −1.75 | 4.56 | −0.44 |
| P160-2 | 3.64 | 3.62 | −0.55 | 3.61 | −0.82 |
| P160-3 | 2.86 | 2.89 | 1.05 | 2.83 | −1.05 |
| P160-4 | 2.33 | 2.32 | −0.43 | 2.3 | −1.29 |
Table 4.
Statistical comparison of burst pressure prediction.
| Evaluation Indicators | RMSE (MPa) | MAE (MPa) | ME (MPa) | R2 |
|---|---|---|---|---|
| ASSY solution | 0.05 | 0.04 | 0.11 | 0.99960 |
| FEM approach | 0.04 | 0.04 | 0.08 | 0.99975 |
| TSSY solution | 0.78 | 0.77 | 1.05 | 0.99962 |
| Tresca solution | 0.28 | 0.27 | 0.45 | 0.99960 |
| von Mises solution | 0.22 | 0.21 | 0.26 | 0.99961 |
Publisher’s Note: MDPI stays neutral with regard to jurisdictional claims in published maps and institutional affiliations. |
© 2021 by the authors. Licensee MDPI, Basel, Switzerland. This article is an open access article distributed under the terms and conditions of the Creative Commons Attribution (CC BY) license (https://creativecommons.org/licenses/by/4.0/).
Share and Cite
MDPI and ACS Style
Yang, J.; Hu, S. Estimation of Burst Pressure of PVC Pipe Using Average Shear Stress Yield Criterion: Experimental and Numerical Studies. Appl. Sci. 2021, 11, 10477. https://0-doi-org.brum.beds.ac.uk/10.3390/app112110477
AMA Style
Yang J, Hu S. Estimation of Burst Pressure of PVC Pipe Using Average Shear Stress Yield Criterion: Experimental and Numerical Studies. Applied Sciences. 2021; 11(21):10477. https://0-doi-org.brum.beds.ac.uk/10.3390/app112110477
Chicago/Turabian StyleYang, Jinhui, and Shaowei Hu. 2021. "Estimation of Burst Pressure of PVC Pipe Using Average Shear Stress Yield Criterion: Experimental and Numerical Studies" Applied Sciences 11, no. 21: 10477. https://0-doi-org.brum.beds.ac.uk/10.3390/app112110477
Note that from the first issue of 2016, this journal uses article numbers instead of page numbers. See further details here.