
Systematic Experimental Evaluation of Function Based Cellular Lattice Structure Manufactured by 3D Printing


Department of Industrial and Manufacturing Engineering, NED University of Engineering and Technology, Karachi 75270, Pakistan
*
Author to whom correspondence should be addressed.
Appl. Sci. 2021, 11(21), 10489; https://0-doi-org.brum.beds.ac.uk/10.3390/app112110489
Submission received: 7 September 2021
/
Revised: 22 October 2021
/
Accepted: 27 October 2021
/
Published: 8 November 2021
Abstract
:Additive manufacturing (AM) has a greater potential to construct lighter parts, having complex geometries with no additional cost, by embedding cellular lattice structures within an object. The geometry of lattice structure can be engineered to achieve improved strength and extra level of performance with the advantage of consuming less material and energy. This paper provides a systematic experimental evaluation of a series of cellular lattice structures, embedded within a cylindrical specimen and constructed according to terms and requirements of ASTMD1621-16, which is standard for the compressive properties of rigid cellular plastics. The modeling of test specimens is based on function representation (FRep) and constructed by fused deposition modeling (FDM) technology. Two different test series, each having eleven test specimens of different parameters, are printed along with their replicates of 70% and 100% infill density. Test specimens are subjected to uniaxial compressive load to produce 13% deformation to the height of the specimen. Comparison of results reveals that specimens, having cellular lattice structure and printed with 70% infill density, exhibit greater strength and improvement in strength to mass ratio, as compared to the solid printed specimen without structure.
1. Introduction
Additive manufacturing (AM), mostly referred to as 3D printing, is known as the family of processes used to manufacture parts by accumulating thin layers of material over the previously deposited one. The pattern of deposition follows 3D CAD data available through slicing of a digital model. Each layer is deposited on x-y plane, whereas layer upon layer deposition in z direction determines the height of the 3D printed object. Application areas of AM are automotive sector [1], aerospace applications [2], marine, oil and gas sector, heavy machinery, consumer sector [3], biomedical field [4], architectural miniature models, civil construction works [5,6], food industry [7], and repair works of degraded parts [8]. The variety in AM processes is created by processes designed to use a variety of materials, at different physical conditions, and during the time of manufacture [9].
In 1991, three AM commercial machines, based on unlike processes, were introduced: Fused Deposition Modeling (FDM) by Stratasys, Solid Ground Curing (SGC) by Cubital, and Laminated object manufacturing (LOM) by Helisys [10]. Among all of the AM machines, FDM is third in top of the line machines, for its characteristics of producing functional parts of complex geometry, using various thermoplastic materials safely within a closed environment [11].
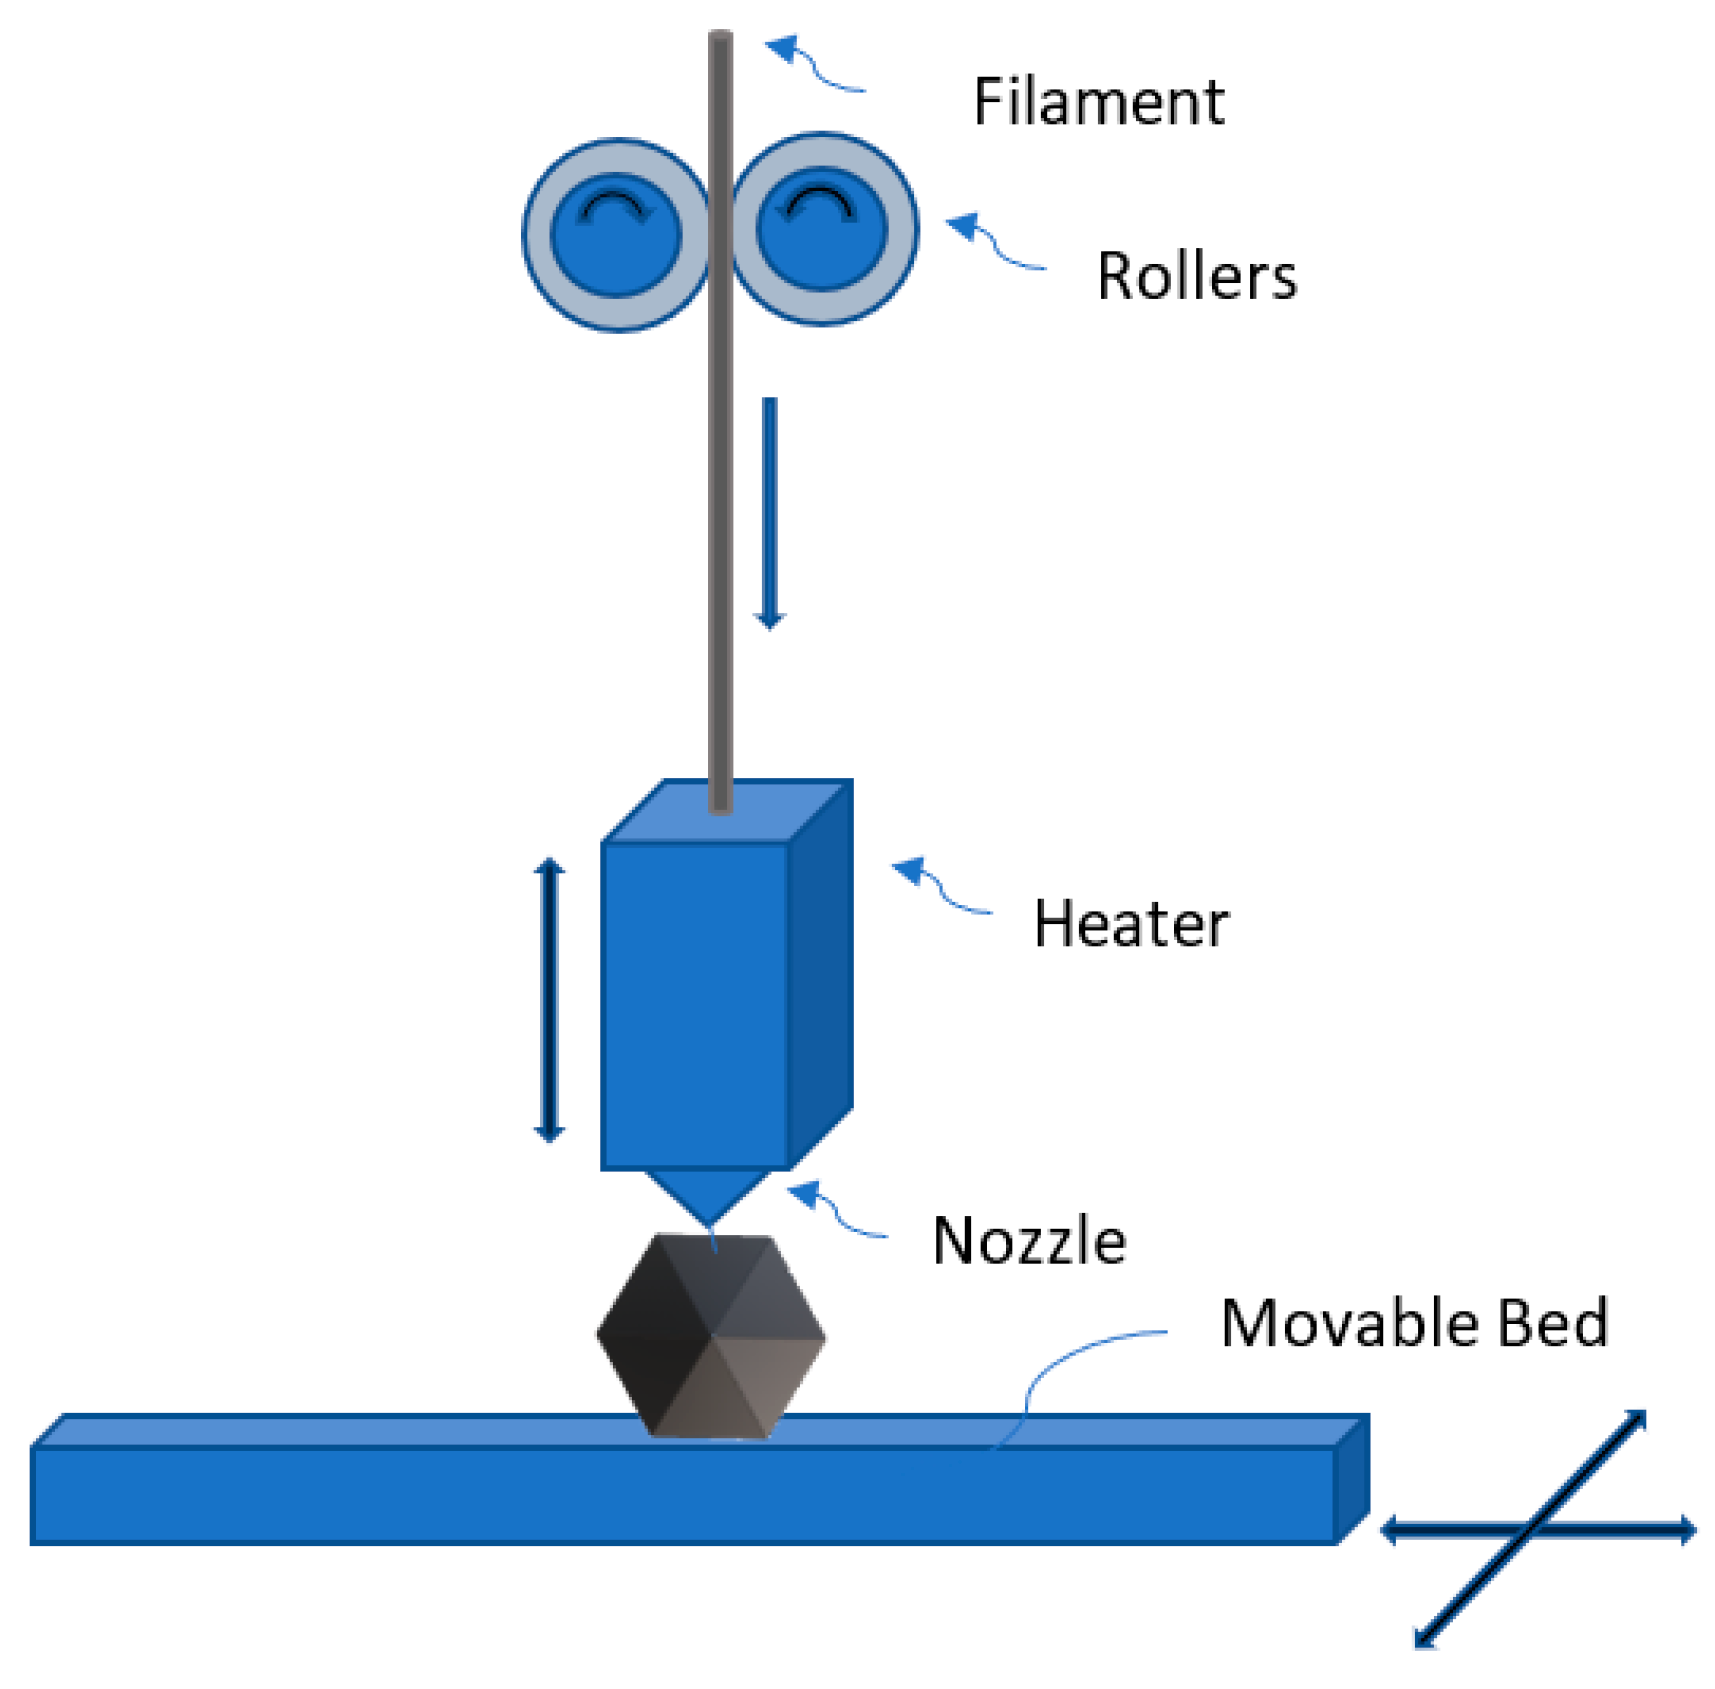
FDM process involves a layer-by-layer deposition of material extruded through a nozzle. During extrusion, the nozzle is following a predefined path, created according to the geometry of each layer. The commonly used material is plastic or wax, supplied in the form of filament, heated through heating coils. Heating coils are attached to the nozzle such that the material can be maintained at 0.5 °C above the melting temperature before extrusion. Extruded material fuse and solidify immediately over the previously deposited layer. Thus, a layer-by-layer deposition of material is carried out on a heated platform, which allows minimum distortion in part. After completion of a single layer, space is provided according to the diameter of the nozzle for the next layer, as shown in Figure 1.
During slicing operation for FDM printing, supports are added to eliminate risk of collapsing the material at areas, freely hanging and extending outwards, beyond the main geometry of the model. Break away type of support structures can be easily removed after the completion of the building process [12]. Along with the support structure, infill material is specified during slicing operation. Infill is the amount of material used to fill inside the cavity of the model, specified, in percentage, of cross sectional areas, ranging from 100% infill to 0% infill material to build the model [13].
Cellular structures are ordered materials that are constructed by the repetition of a unit cell [14]. The promising properties of these materials are their lightweight construction, higher strength and energy absorption with minimum material consumption. The principles that drive the properties of cellular solids depends on the material, the joining pattern of cell through the edge, face, or vertices, and the relative density of the structure [15,16,17]. Cellular structures can be segregated as natural occurring or artificially produced by humans, which include structures made up of cells with open or closed boundaries, randomly distributed or periodic, and 2D or 3D in structure [11]. Nature has provided an unlimited variety of these structures around and within us. Most common naturally occurring cellular structures are wood [17], bone structure [18], corals and cork [15], toucan beak [19], and many more. Humans get the inspiration from the variety of design and use of these structures, by nature, and adopt them in their construction.
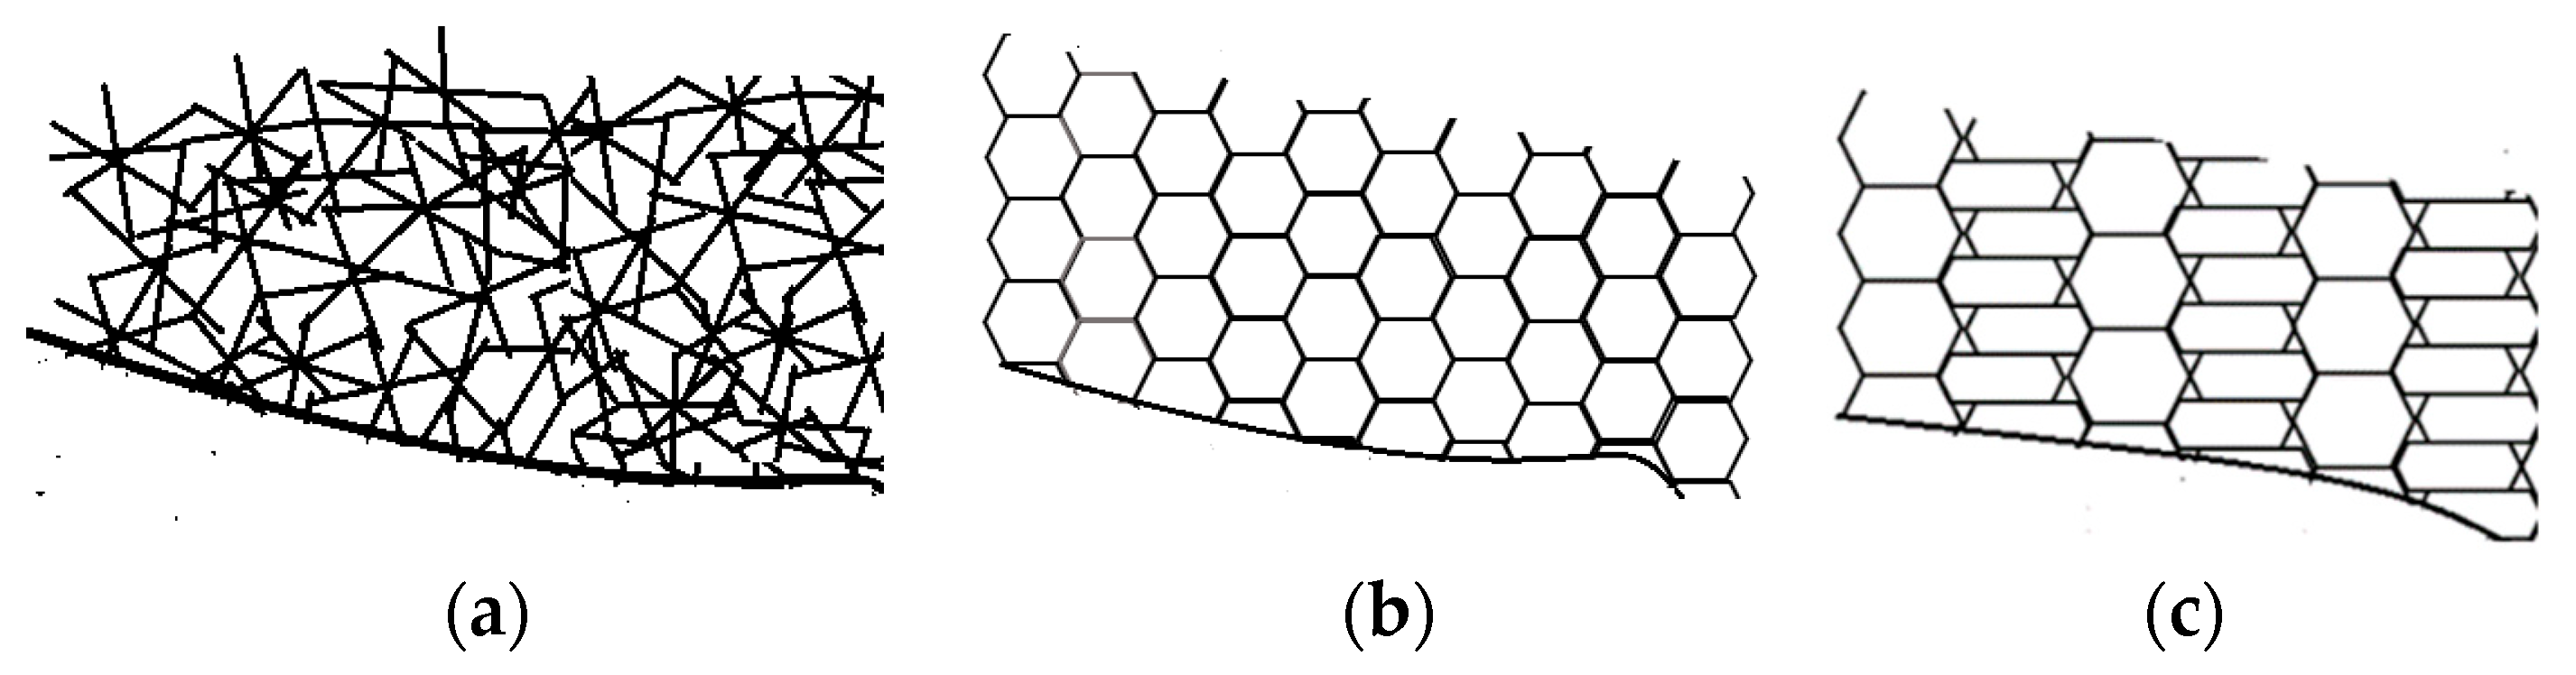
Lattice structure, initially defined by Gibson and Ashby as three dimensional cellular structure having cell walls, follows random orientation in space [15]. Although initially defined, many researchers do have their own understandings for lattice structure, based upon the definition by Gibson and Ashby, as lattice structure does not rely completely on the dimensions and connecting style of the struts and nodes. In general, lattice structure is defined as being composed of interconnected cells, arranged in a repeated manner, to build a three dimensional structure, whereas the cells are an assembly of struts and nodes [20,21,22,23]. Based upon the placement pattern of unit cells in three dimensional Euclidean space, lattice structures are divided into three categories [24]:
- Disordered lattice structure: The distribution of unit cells within the defined space do not follow any pattern, and is arbitrary and unplanned, as shown by Figure 2a.
- Periodic lattice structure: Here, the distribution of unit cells is repeated periodically, having the same topology, geometry, and size, as shown in Figure 2b.
- Pseudo-periodic lattice structure: Also known as conformal lattice structure, as depicted in Figure 2c, each unit cell holds the same topology with variations in shape and size.
Modeling of cellular lattice structure depends on traditional approaches related to surfaces: boundary representation and voxels (discrete volume representation). It is observed that these approaches are successful, up to some extent, and limited by design complexities of regular cellular lattice structure. The problems intensify further when modeling irregular cellular lattice structure. For such cases, each representation requires time to render the object and larger processing power, which mostly exceeds the processing power of computing machines. Qualitative problems are related to precision, operability, and manufacturability. Surface generated through boundary and voxel representation are problematic to manufacture due to defects (cracks, self-intersection, false and residual polygons) created during modeling, which produces an approximate instead of an exact geometry. Both representations are not supported for parametrization. If parameters are changed, the user needs to regenerate using a high-level procedure [25]. Most of the associated problems of the traditional approach to modeling, as stated above, are addressed by the function-based approach. Some recent research claims that implicit functions are markedly suitable for porous as well, as it can successfully be used for geometric modelling of objects, including cellular lattice structure [25,26,27,28].
To investigate properties of cellular lattice structure, several different geometries of unit cells are used by researchers to construct them. Wang et al. utilized a unit truss with five strut members to generate an octet truss conformal cellular lattice structure [29,30]. A complete design and experimental analysis study were conducted by Beyer for cellular lattice structure [31]. Three different types of structures: square pyramidal, tetrahedral, and kagome sourced structure are produced and tested for compressive and flexural strengths. The experimental results were analyzed and compared with the corresponding strengths of the solid structure, which shows the strengths are close to the solid structure. The research findings from Beyer triggered researchers to investigate the potential of truss lattice structures and surface network structures, in compression, to extend their application areas. The study performed by Jansson et al. compares network structures based on truss-lattices and periodic surfaces. The structures were designed and analyzed by Finite element software Abaqus, and the findings show the periodic surface networks are much stiffer than truss lattice structures [32]. Several lattice structures are generated through periodic octet cell, including Octet, Cross, FrameCross, InsideCross, and OctetFramed to measure their performance in compression [21]. Experimental study, by Ravari et al. and Lyibilgin et al. [33,34], was conducted to investigate the mechanical properties of variety of different cellular lattice structures including circle, square, triangle, diamond, honeycomb, and BCCZ manufactured through FDM process. Kagome lattice structure was investigated by Gautum et al., whose study reveals that build orientation and printing imperfections have considerable effects on mechanical properties of the structure [35].
The acceptance of cellular lattice structure directly relates to the advancements and capabilities of AM processes to create design complexities without increasing manufacturing cost. Hence, it improves the feasibility to manufacture graded parts [14]. Through design complexities of cellular lattice structure, some of the properties of these structures can be influenced directly. An adjustment in topology and dimensions of the cell geometry of structure can lead to a physical retort of these structures to display properties unattainable by their base material [36], including mechanical, acoustic, and dielectric properties [37,38,39]. The higher strength to weight ratio, and structure thermal conductivity, makes lattice structures a suitable option for aerospace industry [40]. According to the details mentioned above, objects made up of cellular lattice structure provides the benefits of reduction in weight, material, larger surface area to volume ratio, and, for some particular AM processes, less time and energy requirements. It is therefore predicted that most digital fabricated solid objects will be constructed via cellular lattice structures in future [25].
Although it seems that a variety of unit cell types are used to generate cellular lattice structures, a detailed study, performed by Helou and Kara [41], highlights that unit cell types used in previous published research are very limited, around 40 in number, and not all of them are of new design. Some of them are derived from basic existing unit cell type. There exists an immediate requirement of innovative design of cellular lattice structures to be used for different situations and applications. An in-depth survey reveals that none of the researchers, used to generate series of lattice structures, investigated their mechanical performance in compression. We have taken this requirement as our main target of study, which involves design, construction, and investigation of the behavior of lattice structures. This study presented an innovative approach to optimize the use of infill material at the inner region by assigning values to percentage of infill material, frequency, and vertical shift, which determines the thickness and the distance between the bars of the cellular lattice structure. Function based approach is applied to the design and modeling of the series of cellular lattice structure, and performance of each member of series is determined through experimental investigation. The organization of the manuscript is according to the sequence of activities for study. Section 2 provides methodology and the information related to material, machines, process parameters, standard to follow, and modeling requirements of cellular lattice structure. Modeling details of a series of cellular lattice structures is discussed in Section 3. Section 4 provides details of the results of experimental evaluation, and finally, in Section 5, the results and findings are discussed. Section 6 provides the conclusion of the study.
2. Methodology
This section deals with step by step procedure, in detail, to design a series of internally built-in cellular lattice structure within objects of closed boundaries, such that each object contains a unique internal structure, with dimensions of details orders of magnitude lesser than the overall size of the object.
The concepts applied in this study are simple, and a basic knowledge of solid mechanics is needed for the calculations. The compressive strength (σc) will be calculated by dividing the compressive load (Fc) applied on the specimen by an initial cross sectional area of the specimen (AX-sectional). The strength to mass ratio will be calcualated through Equation (1).
where Ms is the measured mass of the specimen.
Strength to mass ratio = σc/Ms
2.1. Material
Acrylonitrile Butadiene Styrene (ABS) and Poly-lactic Acid (PLA) are the most commonly used materials in 3D printing for functional requirements. Most of the published research investigations considered ABS either for investigation or a printing test specimen [42,43,44,45,46]. For our research investigation, we are using PLA Filament from for the main structure, support structures, and infill structures. The material is used as received. The properties of the material [47,48,49] are shown in Table 1.
2.2. Printer and Parameters
Prusa i3, an open-source 3D printer, is used for printing test specimens. The selected printing parameters are given in Table 2.
2.3. Testing Procedure
Tinius Olsen Hydraulic Universal Testing Machine (300SL) is used for the execution of the experimental tests which meets ASTM E4, BS 1610, DIN 51221, EN 10002-2, and ISO 7500-1 standard. The machine is equipped with two hardened steel plates, both parallel to each other in a plane, perpendicular to the axis of the test specimen. The test specimen is loaded between the plates, ensuring that the outer surface of the specimen is parallel to the compression plates. The compression speed for test is adjusted as 2.5 mm/min, keeping it uniform from start of the compression until it reaches a strain level equal to of its original length, as in the ASTM standard document. During testing, magnitude of uniaxial compressive load and percent reduction in height are recorded for further use in calculations.
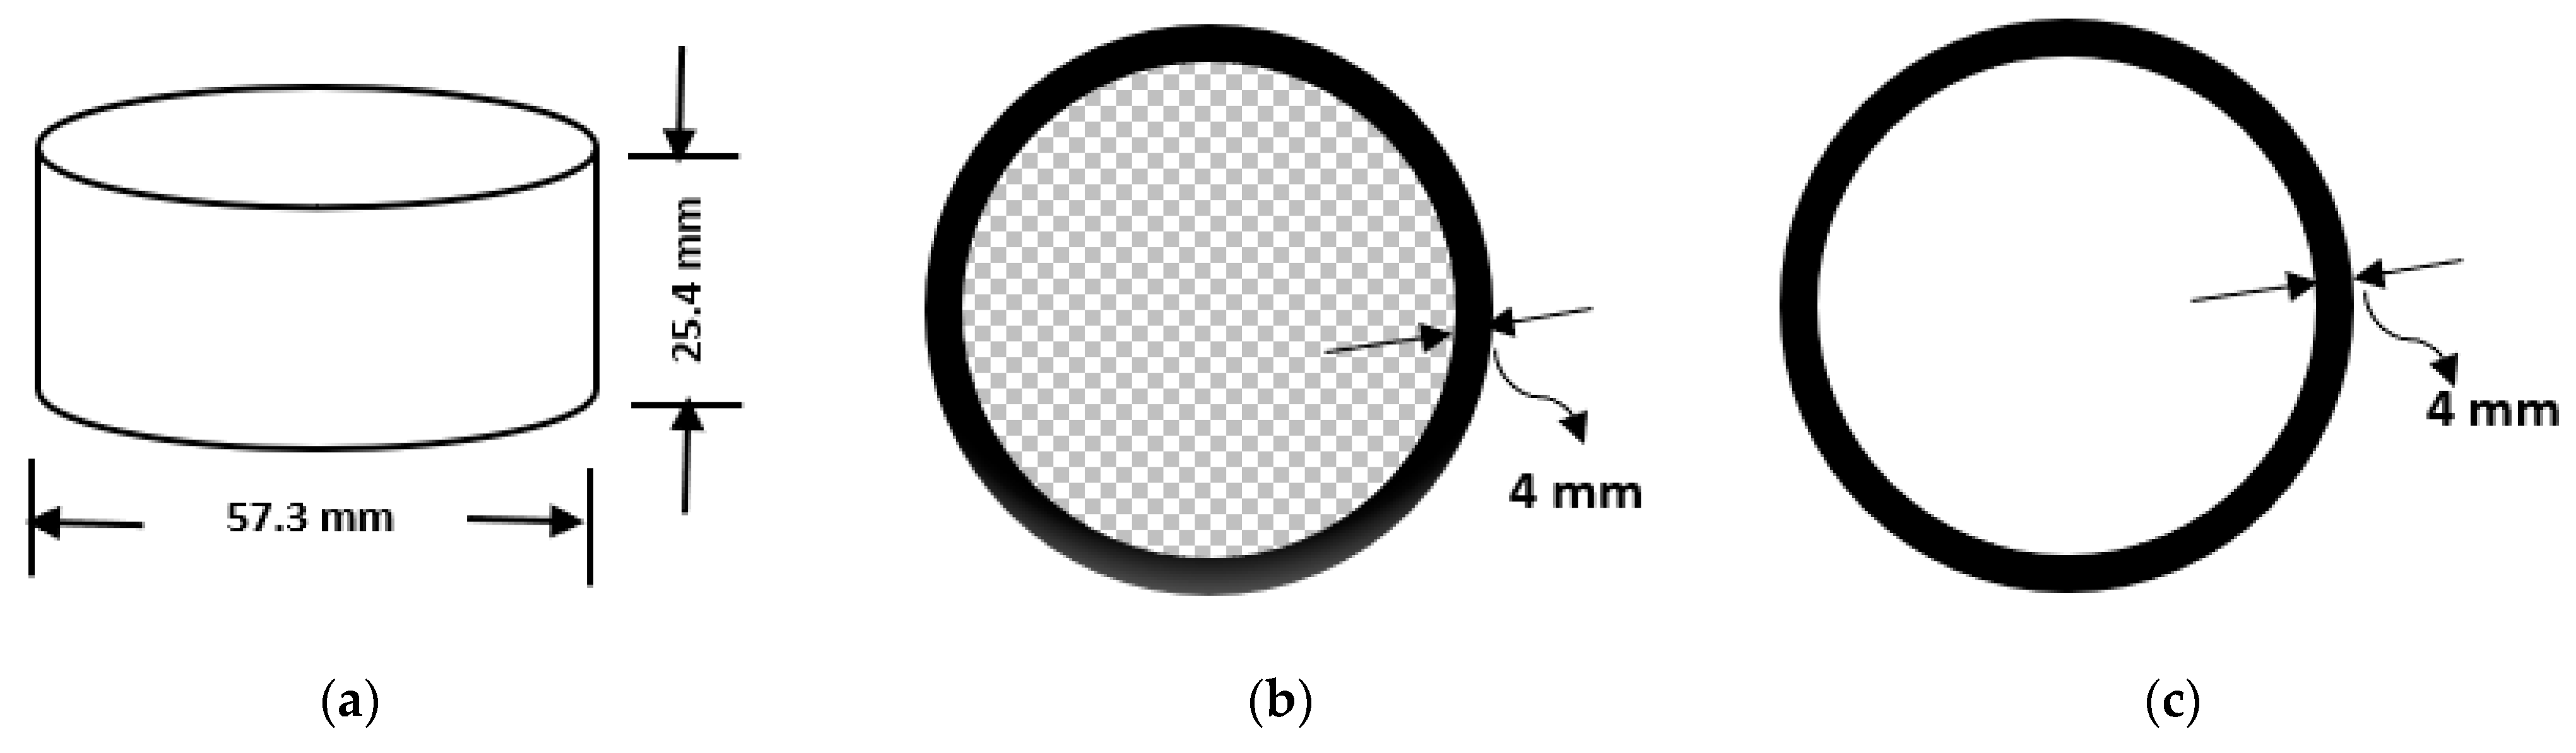
The test specimens are manufactured and tested according to “Standard test method for compressive properties of rigid cellular plastics” (ASTMD1621-16). Each test specimen for the study is around a closed cylindrical shell except the base, the diameter and height are calculated and kept at and , respectively, as shown in Figure 3a. With respect to the internal geometry, there are two different types of specimen, with one having cellular lattice structure inside the cylindrical shell, as shown in Figure 3b. The details of the geometry and dimensions of cellular lattice structure are presented in Section 3. The second type of specimen is a hollow cylindrical shell (will be called “solid part”), as shown by Figure 3c. The base of both type of specimen are not closed and the shell has a uniform wall thickness of 4 mm, as shown by Figure 3b,c. After printing, the masses of each specimen are calculated and measured through a digital scale, with readability up to 0.0001 g (0.1 mg). The masses of the specimen are mentioned in Section 4. The observed variations in calculated and measured masses were found to be less than 2% in all test specimens. For the study, we use the measured values of the masses.
3. Modeling of Cellular Lattice Structure
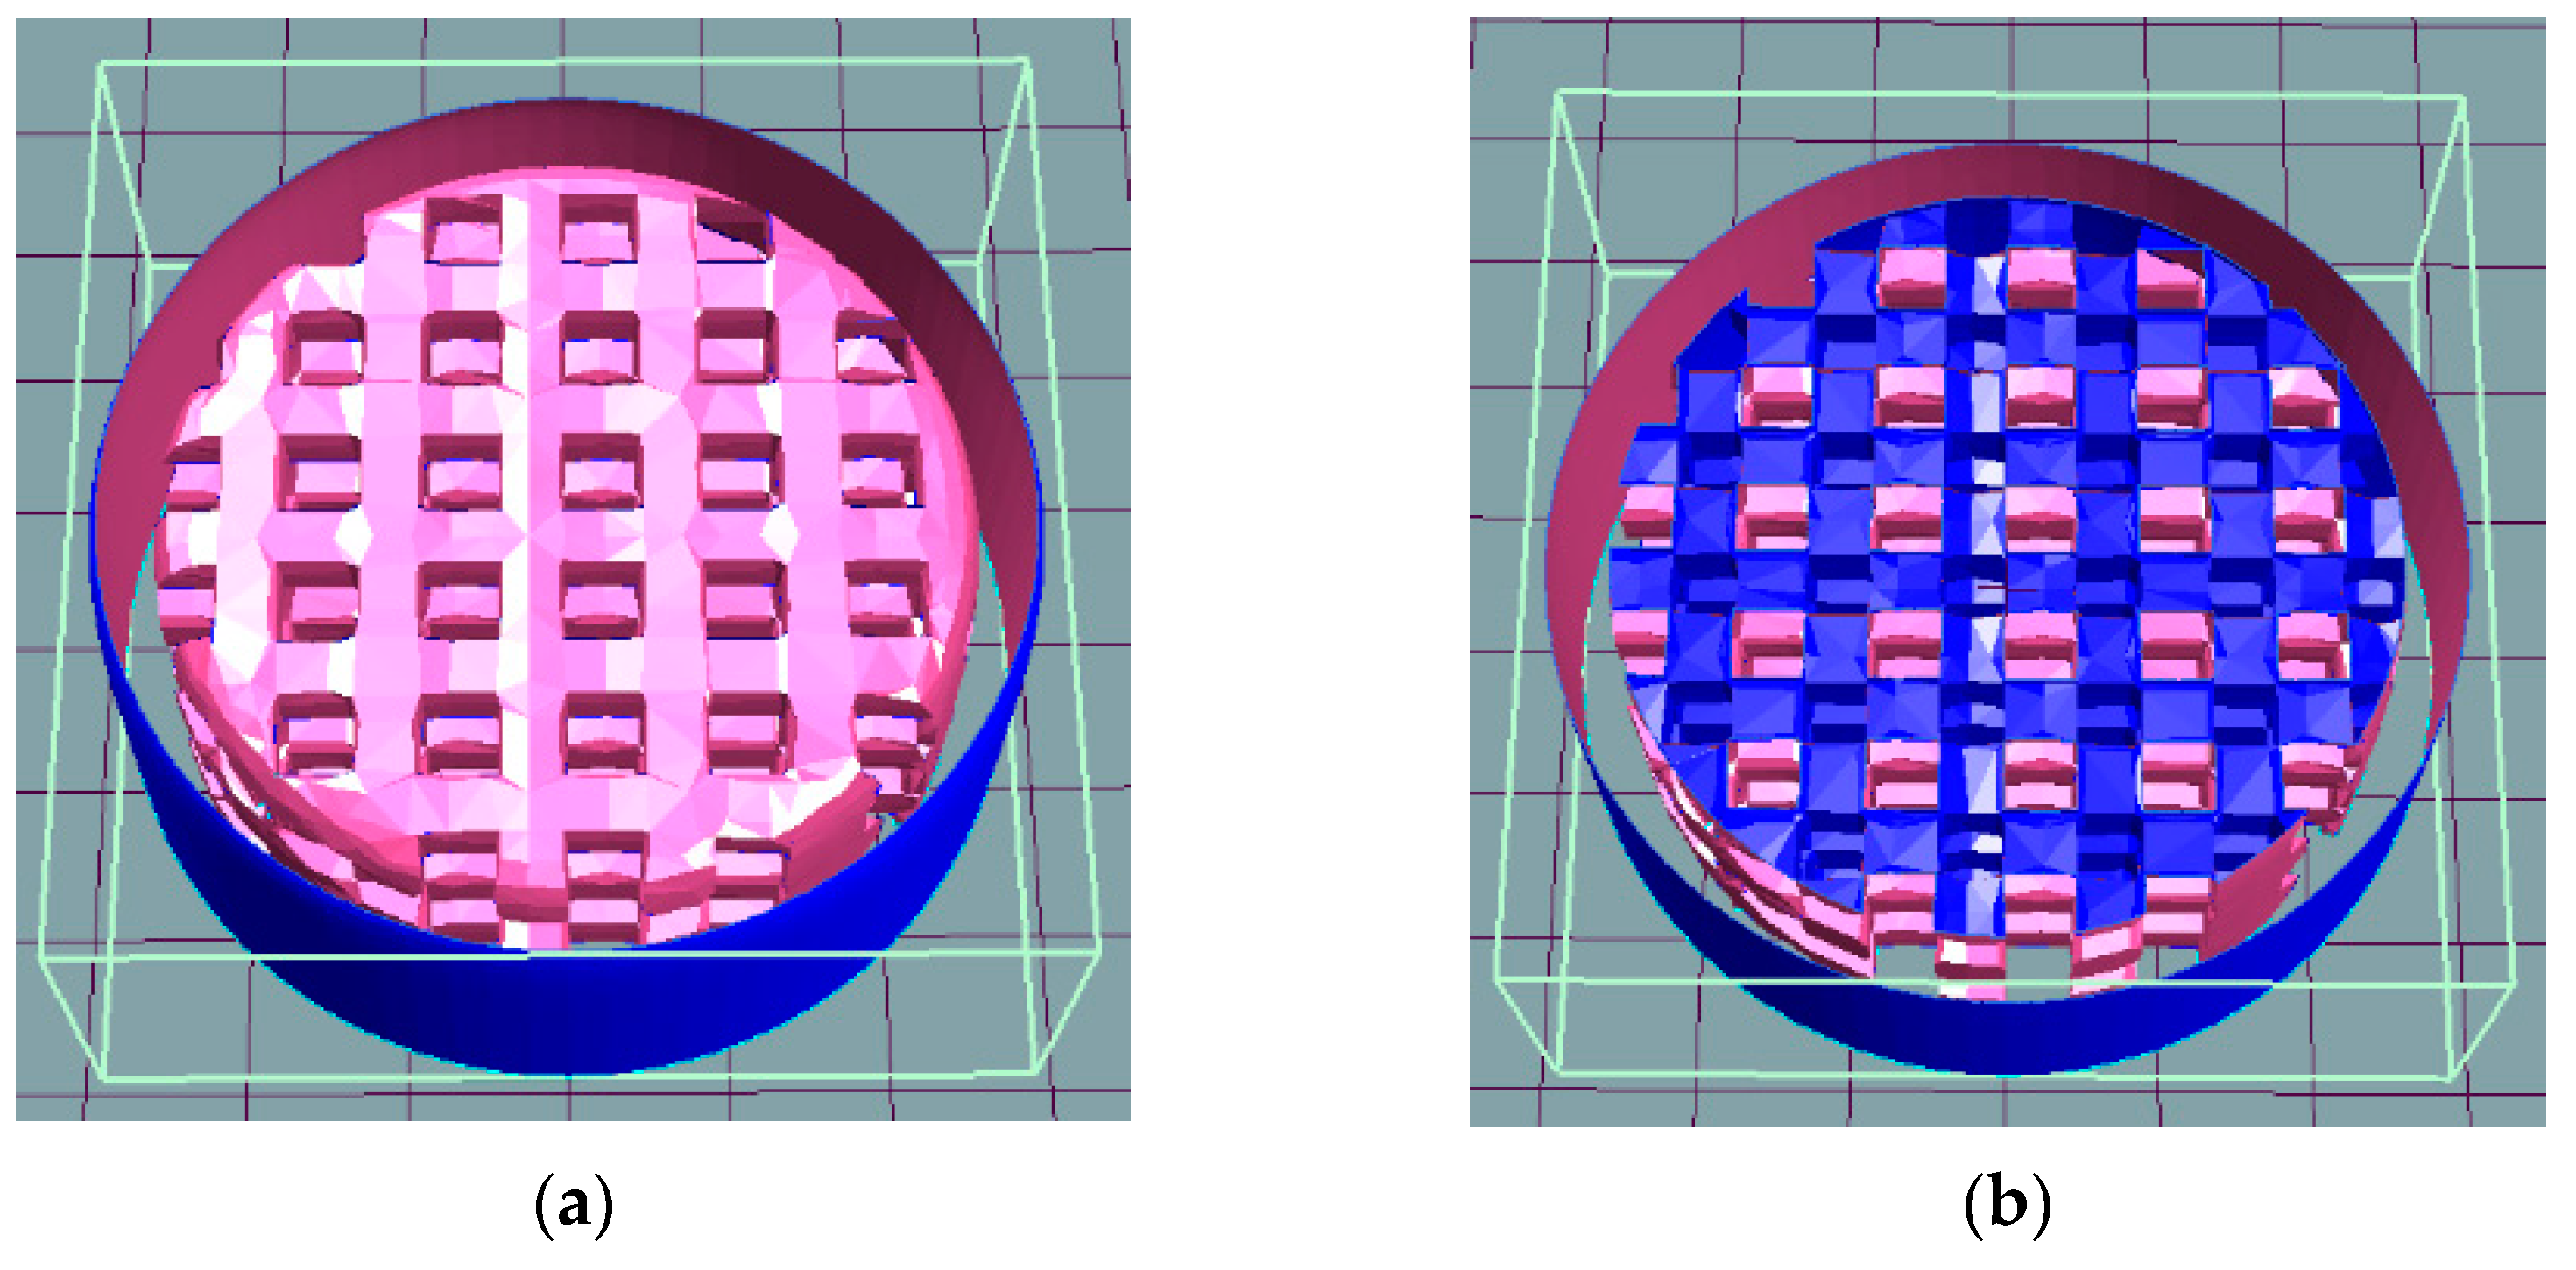
As discussed, use of functions are more efficient than boundary representation and voxel based modeling techniques. We propose to construct a series of objects having unique cellular lattice structure inside and within the closed boundaries, using trigonometric functions and -functions. For working with function representation, “HyperFun, a modeling language”, a simple specialized high level programming language and associated software, designed to set out function based models, is used [50]. To construct the series of cellular lattice structure within a closed cylinder, an algorithm is developed and given at the end of the section. The series is constructed by assigning values to variables, and used in sin function. The values of frequency are taken, which are 19 (f1) and 21 (f2), whereas the vertical shift is varied from “0” to “0.4” with an increment of “0.1”. Frequency controls the length of the period, and vertical shift controls the division within a period. The selected values of frequency and vertical shift are according to the size limitations of test specimen following the standard ASTMD1621-16 and printing capabilities of 3D printing machine. The internal lattice structure consists of intersecting vertical and horizontal hollow bars, generated through function representation, as shown in Figure 4a. Figure 4b provides the x-sectional view of the specimen through the bars to show the hollow regions of the bar.
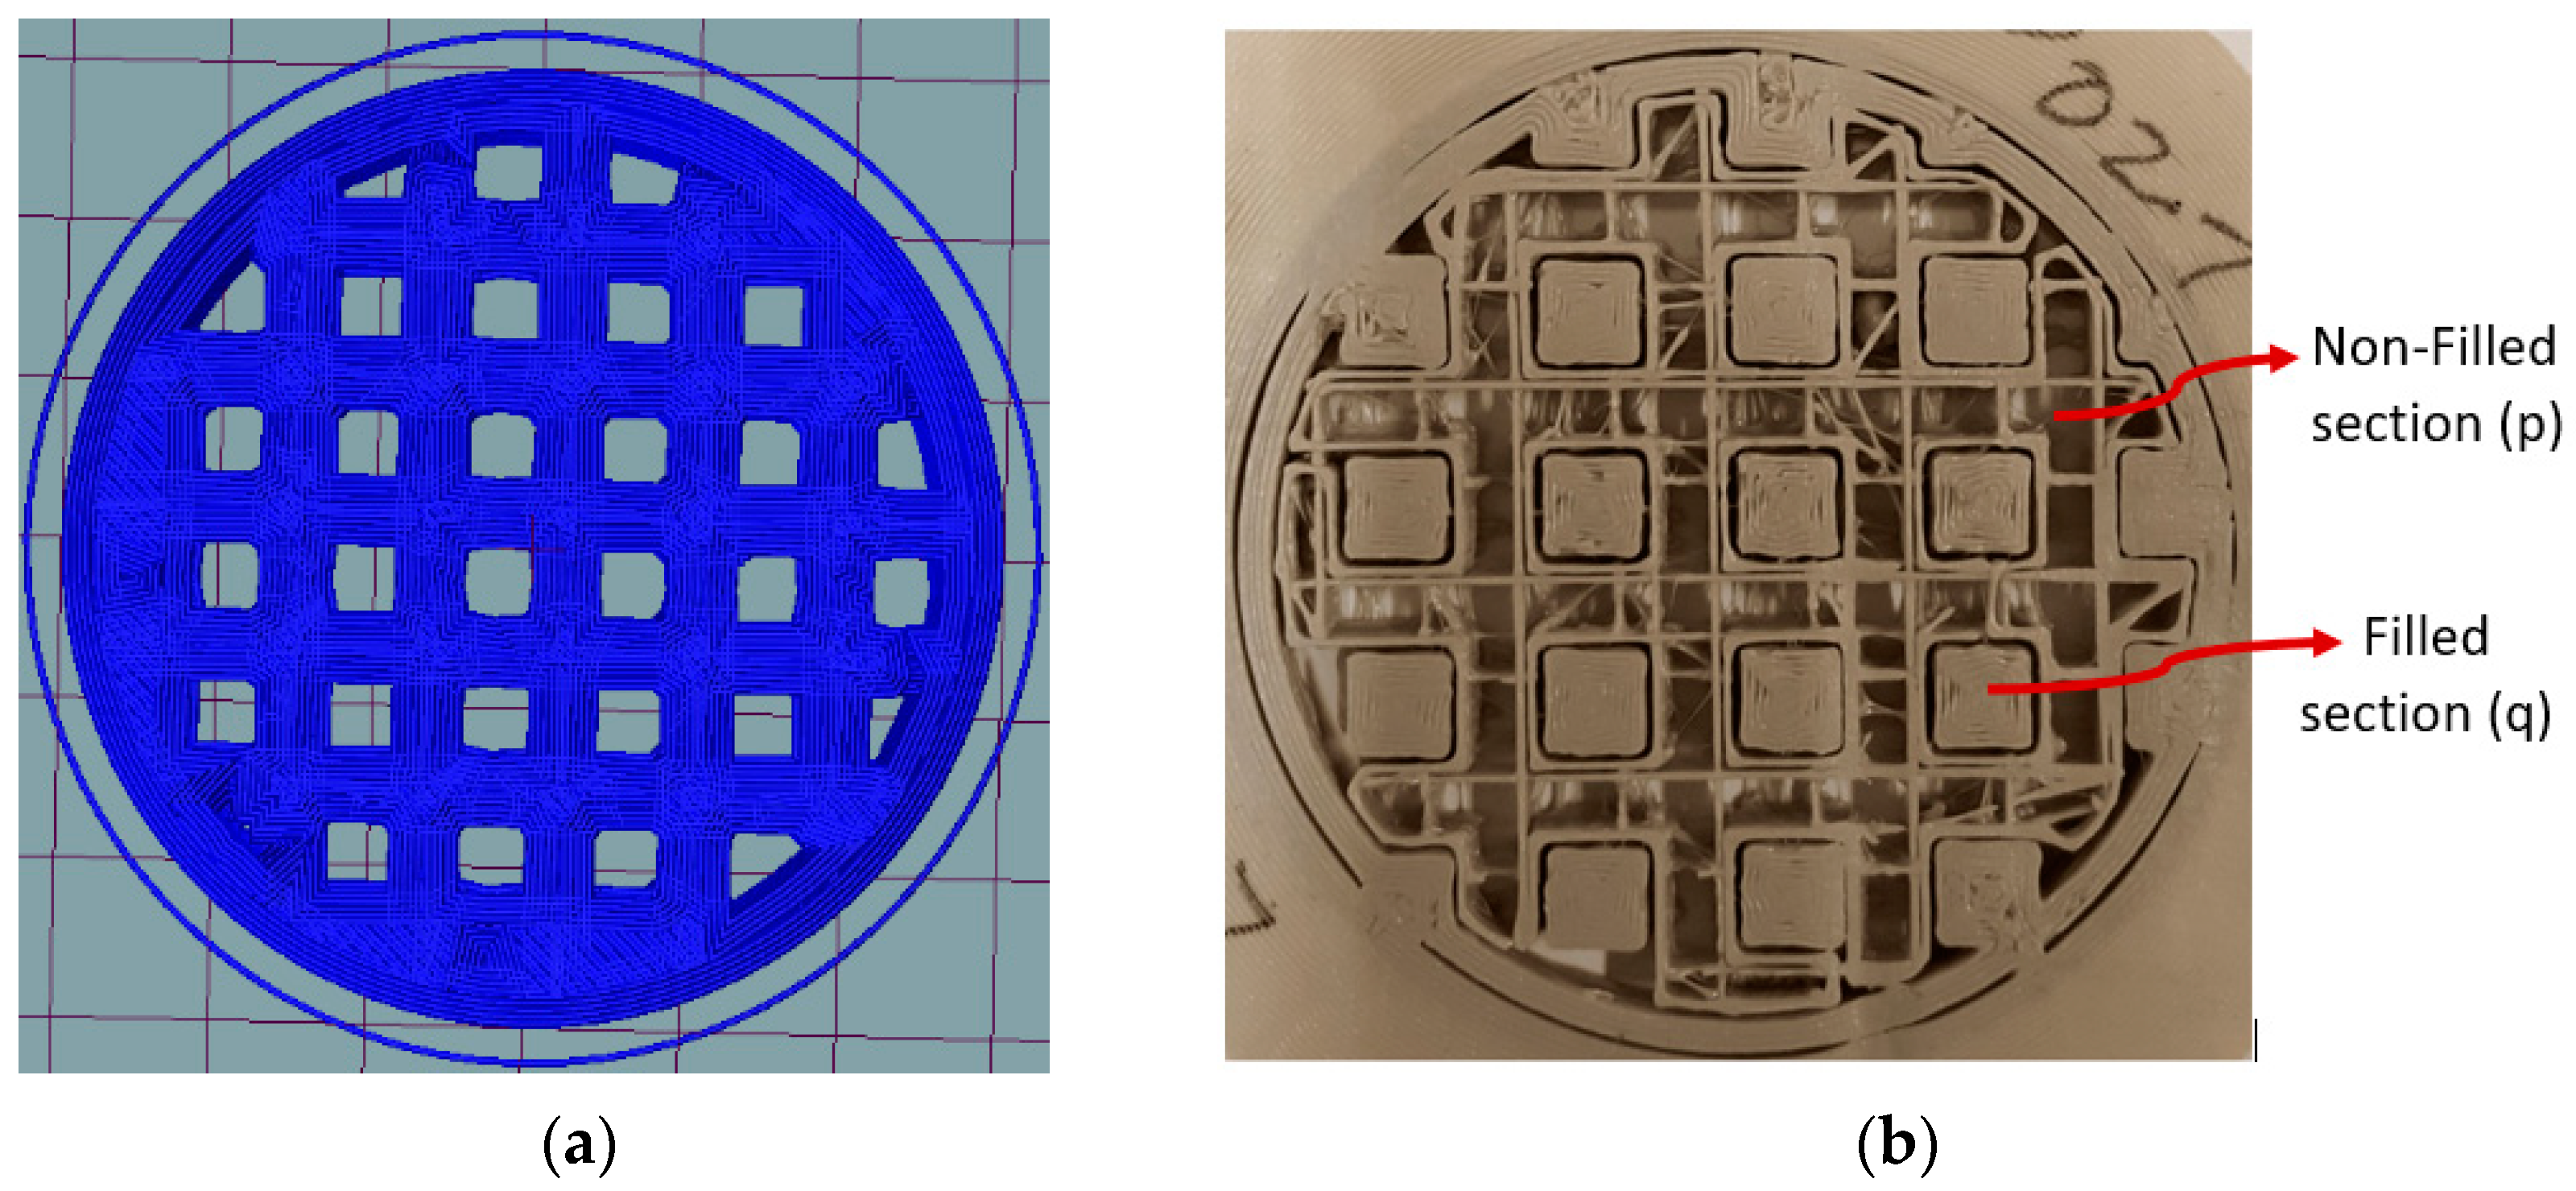
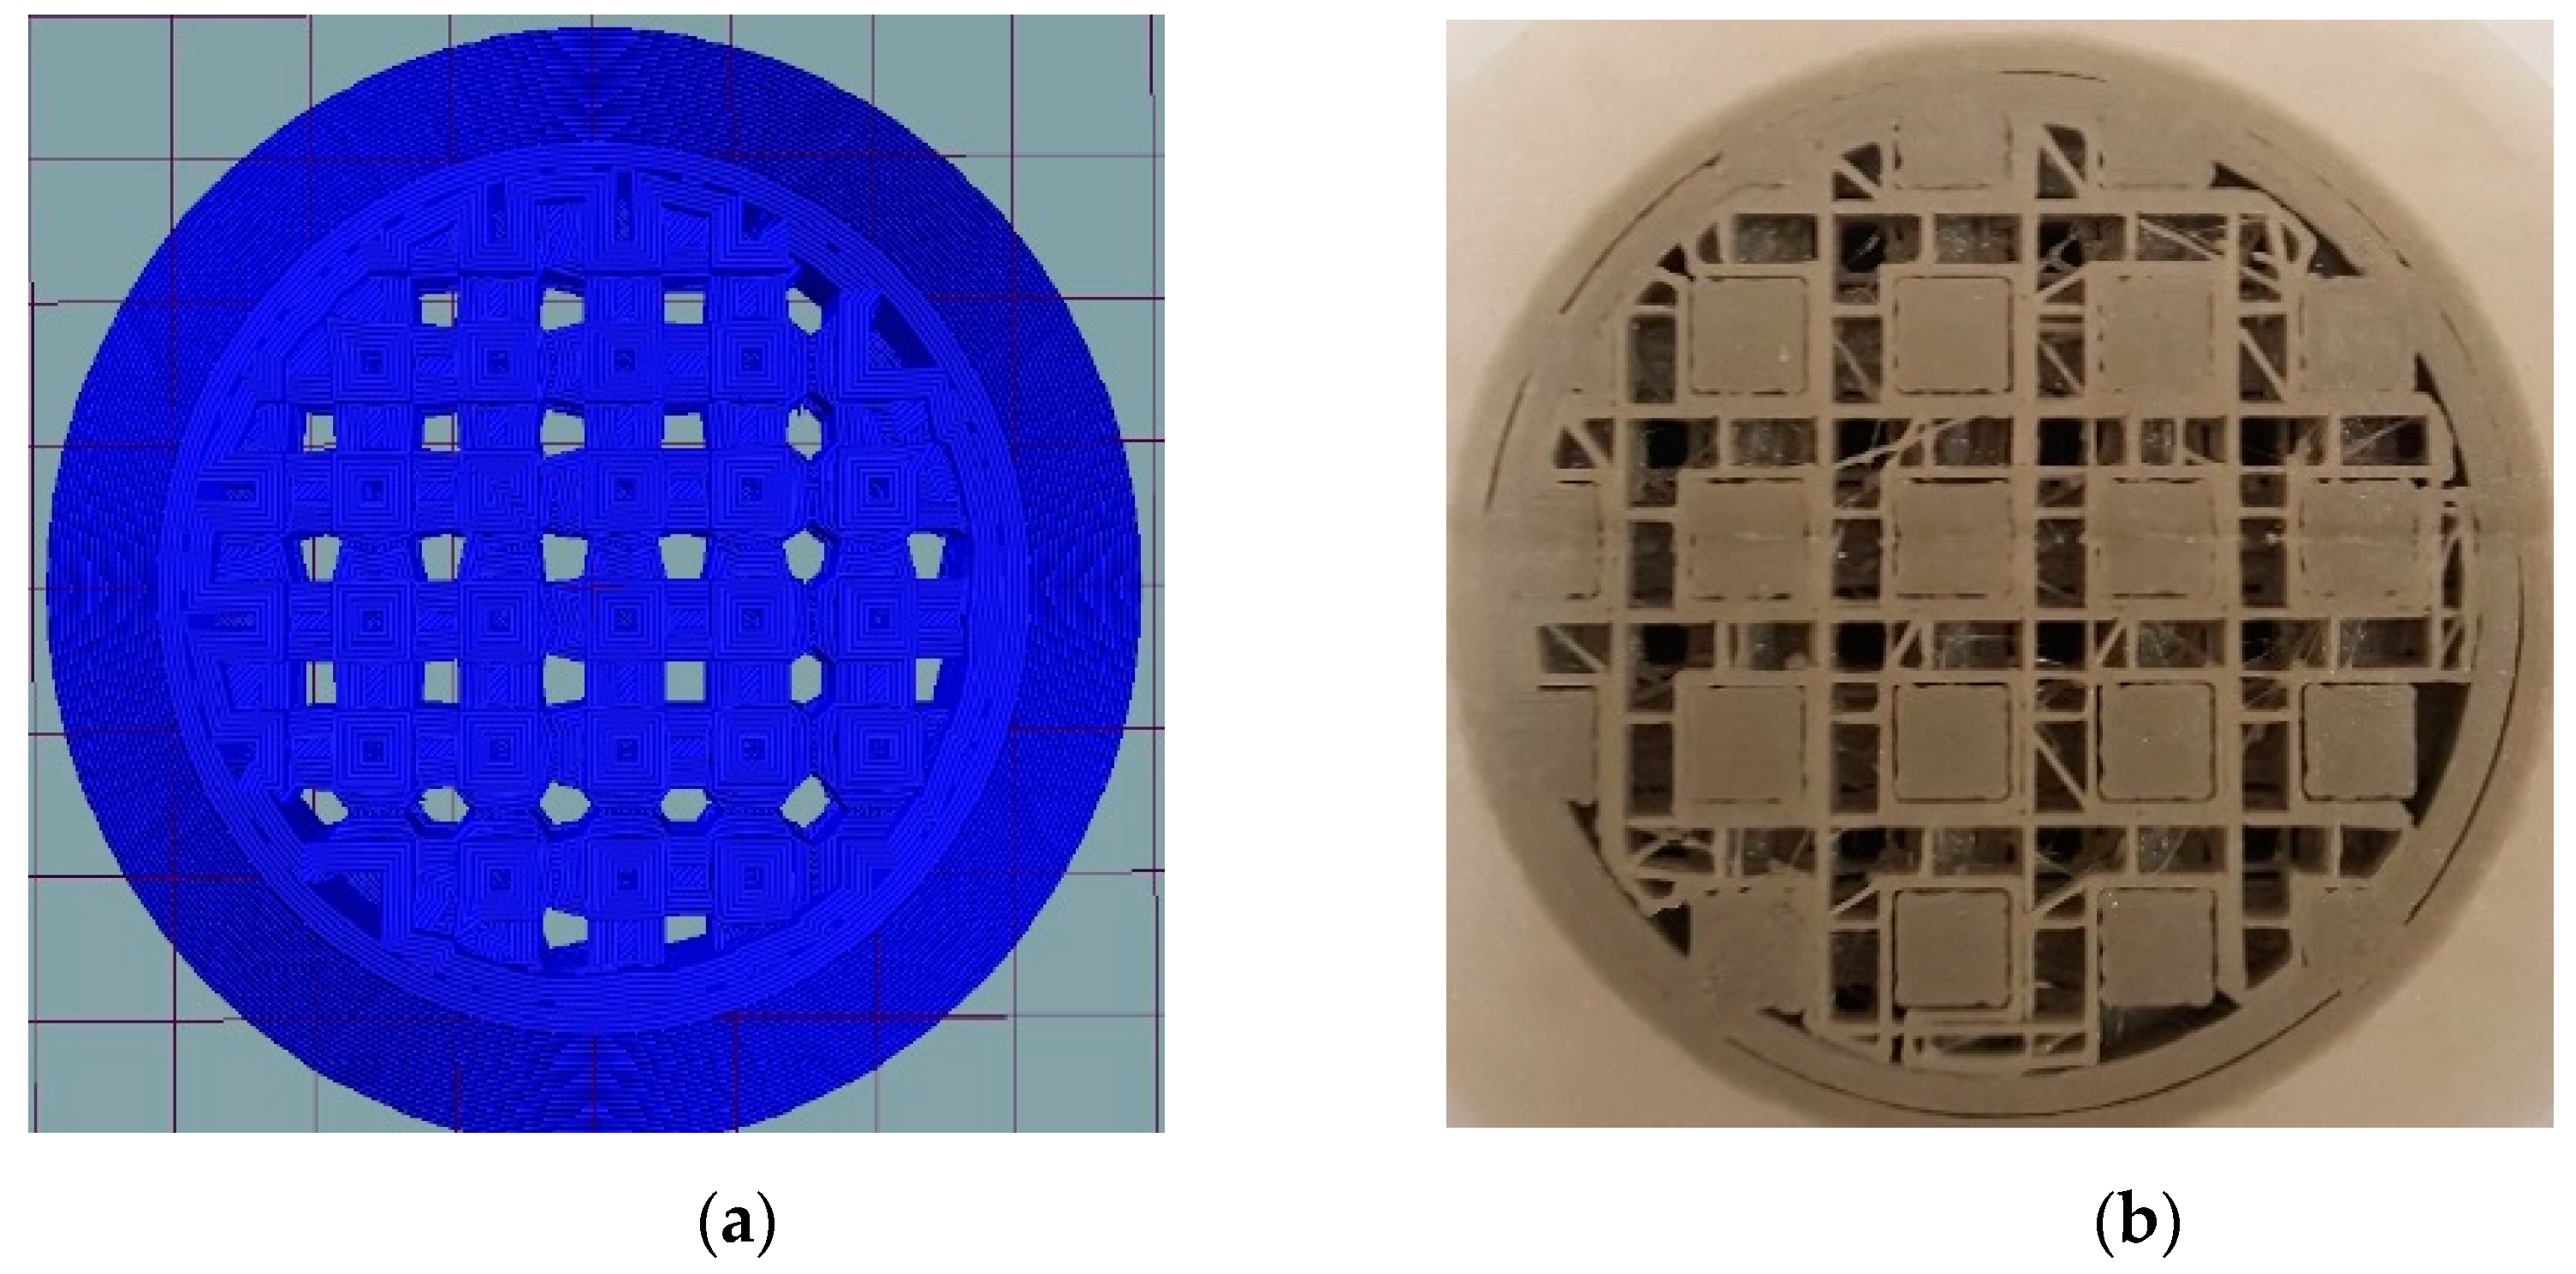
During printing, material accumulates to form the outer surfaces of the hollow bar, and the same material (PLA) accumulates in the space between the hollow bars to form intersecting vertical and horizontal column-like structure (solid bar). Some extra material is consumed to act as support material and provide support to hollow bars. Figure 5 and Figure 6 show the internal structure of a test specimen after rendering plus slicing and printing operations. The variation in the thickness of the hollow bars and material distribution for the same frequency and different values of vertical shift can be seen by comparing Figure 5a with Figure 6a and Figure 5b with Figure 6b, respectively.
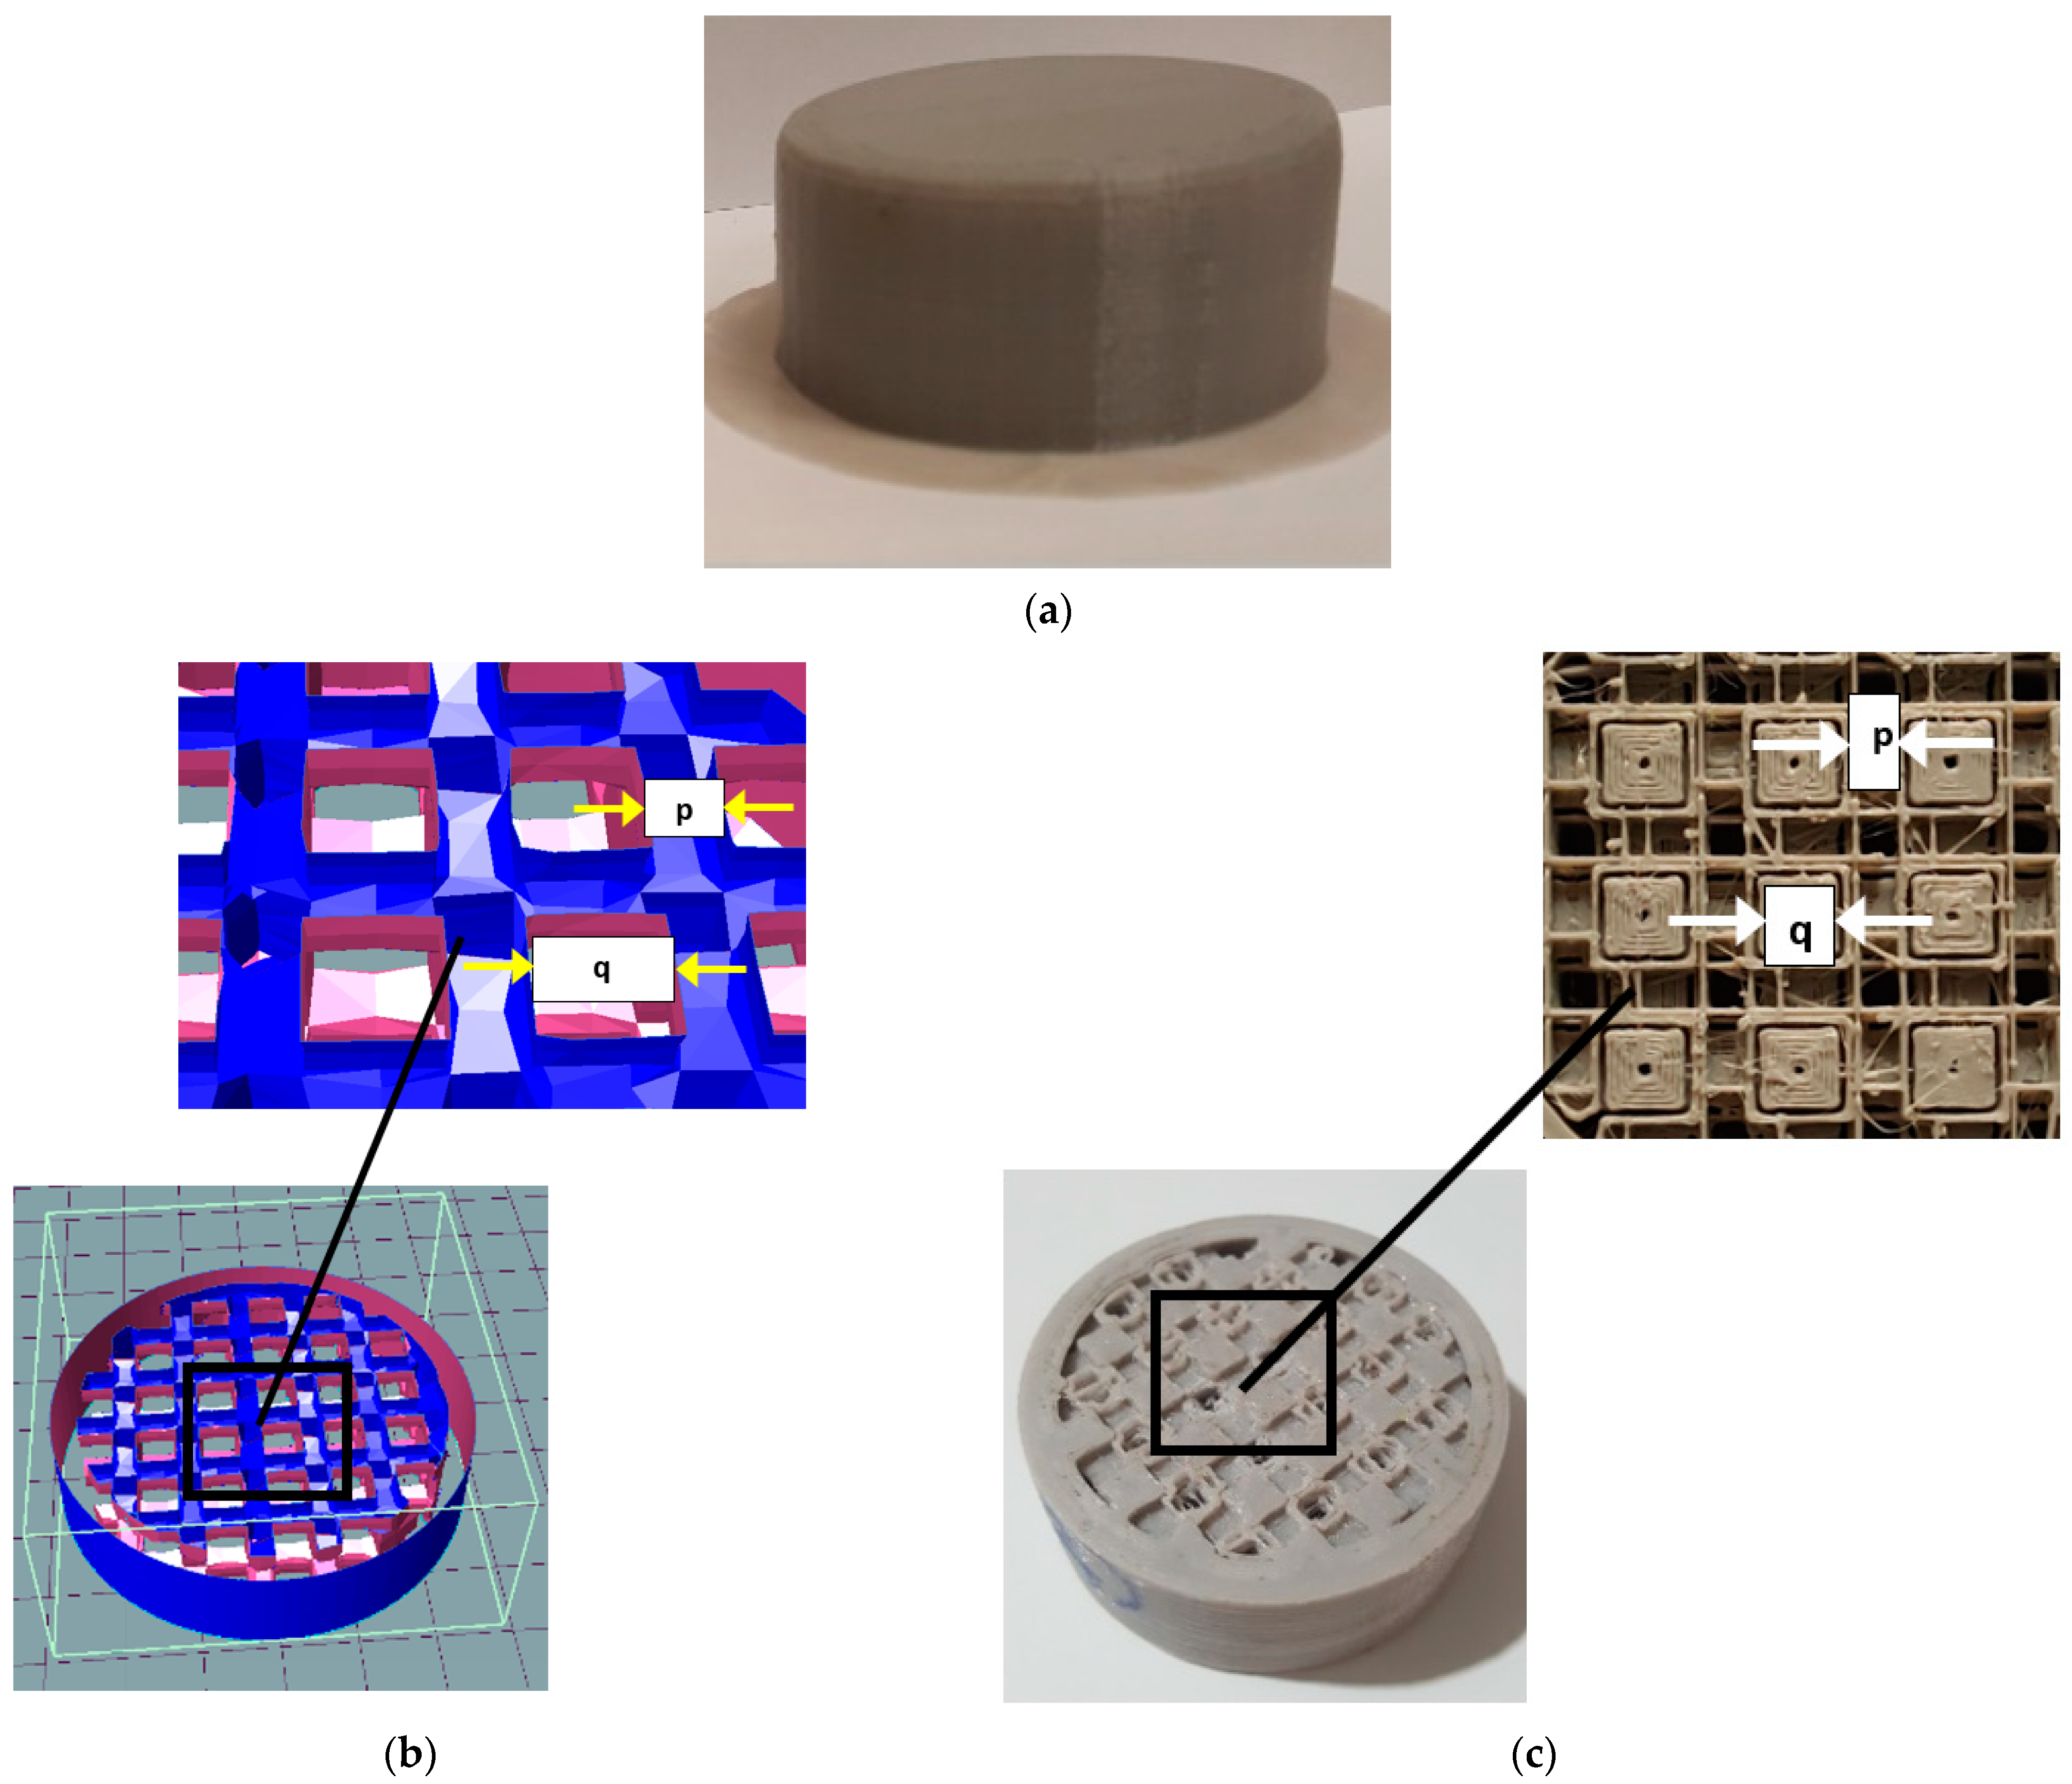
The outer shape, inside structure, and geometry of the rendered and printed test specimen is shown in Figure 7a–c, respectively. Figure 7b shows the magnified view of the internal structure containing the dimensions after rendering. Here, “p” is the thickness of the hollow bar and “q” is the distance between the hollow bars, which is empty space. The empty space between the hollow bars, shown in Figure 7b, is then fillled by the same material (PLA) during printing, as shown by Figure 7c, to form solid bars. Table 3 and Table 4 show dimensions “p” and “q” in millimeters related to each specific test specimen.
The Algorithm 1, presented below is used to construct ten unique compressive strength test specimens with built in cellular lattice structure by altering values of frequency (f) and vertical shift (v). According to the standard, five replicates should be constructed and tested for each type of specimen, but due to time constraints, three replicates are made and tested [51]. Average values of test results are considered for evaluation. Test specimens are constructed with and infill density, tested, and their results are compared with specimen of same infill density without internal structure (solid part). All the specimens are printed through Prusa i3, an open source 3D printer, keeping x-y plane of specimens parallel to the print bed. Top and bottom surfaces of specimens are made parallel after printing, and their dimensions are kept, according to ASTM 1621-16. The X-sectional views of specimens after rendering are presented in Table 5.
| Algorithm1 Construction of a cellular lattice structure within closed cylindrical object |
| Procedure: regular(x,y,z) Construct slabs orthometric to (x,y,z) axes: Construction of the bars by intersection operation: Perform blending union operation over the constructed bars: Construction of infinite lattice structure by union operation: . Construction of closed cylindrical shell: Insertion of lattice structure within closed cylindrical shell: . return: result. |
4. Testing of Built-In Cellular Lattice Structure
4.1. First Test Series
The first test series of eleven test specimens are constructed with infill density. Out of eleven, ten unique test specimens, having internal structure within them, are constructed, and one solid test specimen is constructed as indicated in Table 5. The specimens are constructed with infill density by using the regular infill pattern provided by the software Repetier-Host. Three replicates of each test specimen are made and tested. Table 6 and Table 7 show the data summary of the characteristics and results of the first test series.
4.2. Second Test Series
The second test series, of eleven test specimens, are constructed with 7 infill density. Out of eleven, ten unique test specimens, having internal structure within them, are constructed, and one solid test specimen is constructed as indicated in Table 5. The specimens are constructed with 7 infill density by using the regular infill pattern provided by the software Repetier-Host. Three replicates of each test specimen are made and tested. Table 8 and Table 9 show the data summary of the characteristics and results of the second test series.
5. Results and Discussion
Testing of series 1 and series 2 specimens was carried out as described in Section 3. We have not shown the raw data due to its high volume, including around one thousand points per specimen. In this section, we will discuss the method used to convert the data into useful information.
Our objective in the study is to determine the compressive strength of the structures, for which the load required to produce deformation in the height of the test specimen, is applied through a testing machine (Tinius Olsen). Once the data is received from the testing machine, it is imported to an excel sheet to record the amount of load and the subsequent deformation in the test specimen. The recorded data is used to determine the compressive strength and strength to mass ratios are calculated through Equation (1) From the load and subsequent deflection, data is used to calculate the amount of strength exhibited by the specimen against 13% axial deformation.
Figure 8a,b provides the graphical representation of the data points. An increasing trend in strength is observed for both 70% and 100% infill density specimens. Figure 8a provides the comparison, which shows that the solid specimen is much stronger, as compared to the specimen having an internal structure with 100% infill density. The performance of specimens with 70% infill density (see Figure 8b) is more valued, as all of the specimen are of greater strength than the solid specimen having a 70% infill density.
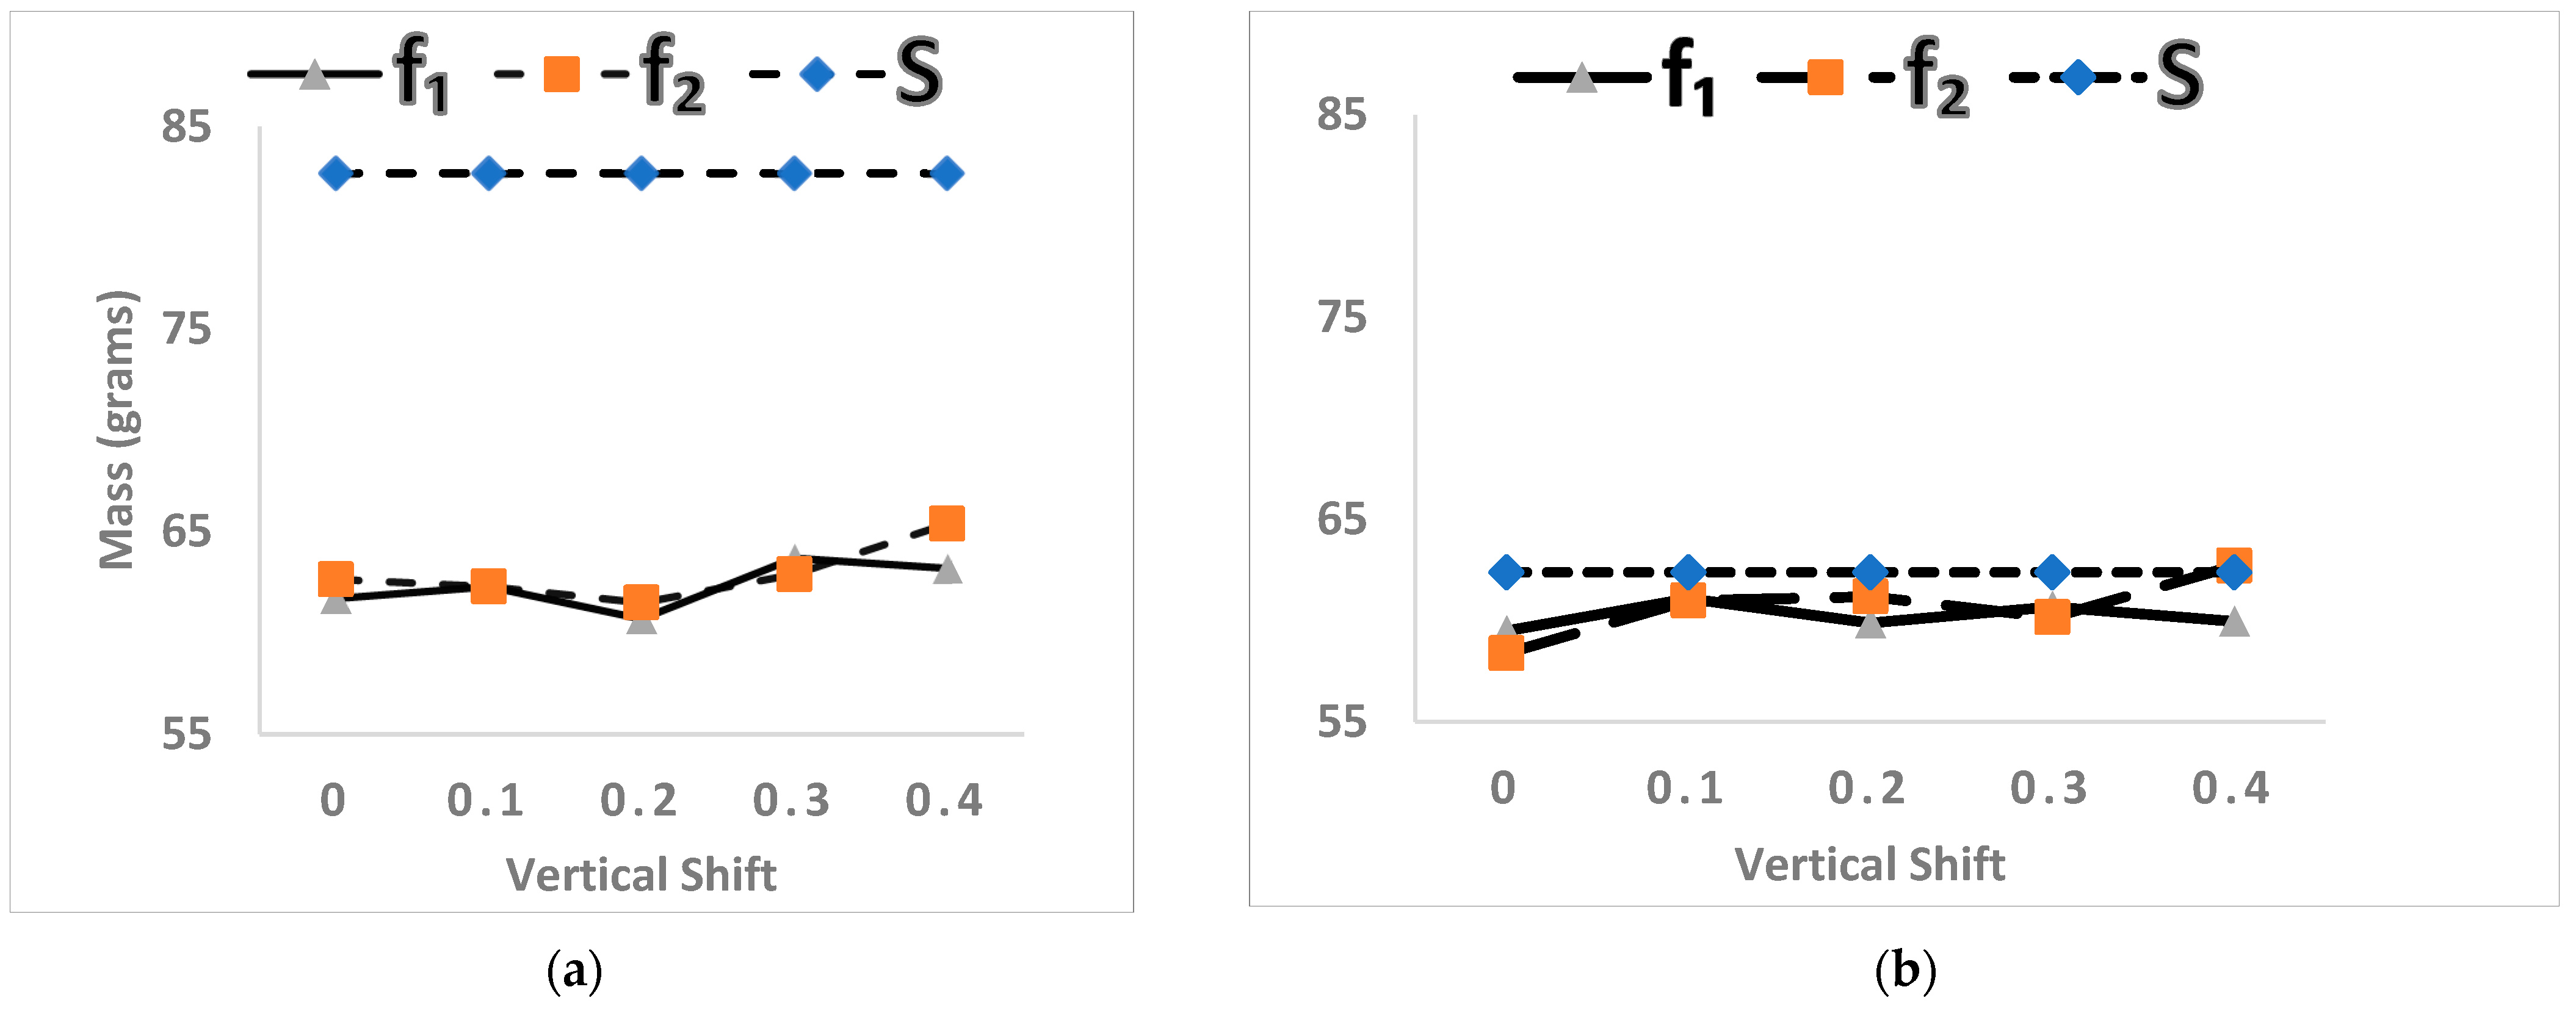
Figure 9a,b shows the relationship between specimen mass and vertical shift. Comparison between Figure 8a and Figure 9a show that, for 100% infill density, the strength of specimen mostly follows the same trend, where an increase in mass increases the strength of specimen. It is also observed that, with an increase in the value of vertical shift, the mass and the strength of the specimen mostly increases.
The response of the 70% infill density specimen shows better performance, as indicated by Figure 9b. Graphical representation of mass vs vertical shift shows that the masses of specimens with internal structure are equal to, or less than, the mass of solid specimen. A comparison between Figure 8b and Figure 9b reveals that the mass of specimen is not the only factor that contributes towards greater strength, as it can be seen that specimens of equal masses do not perform uniformly and have different values of strength.
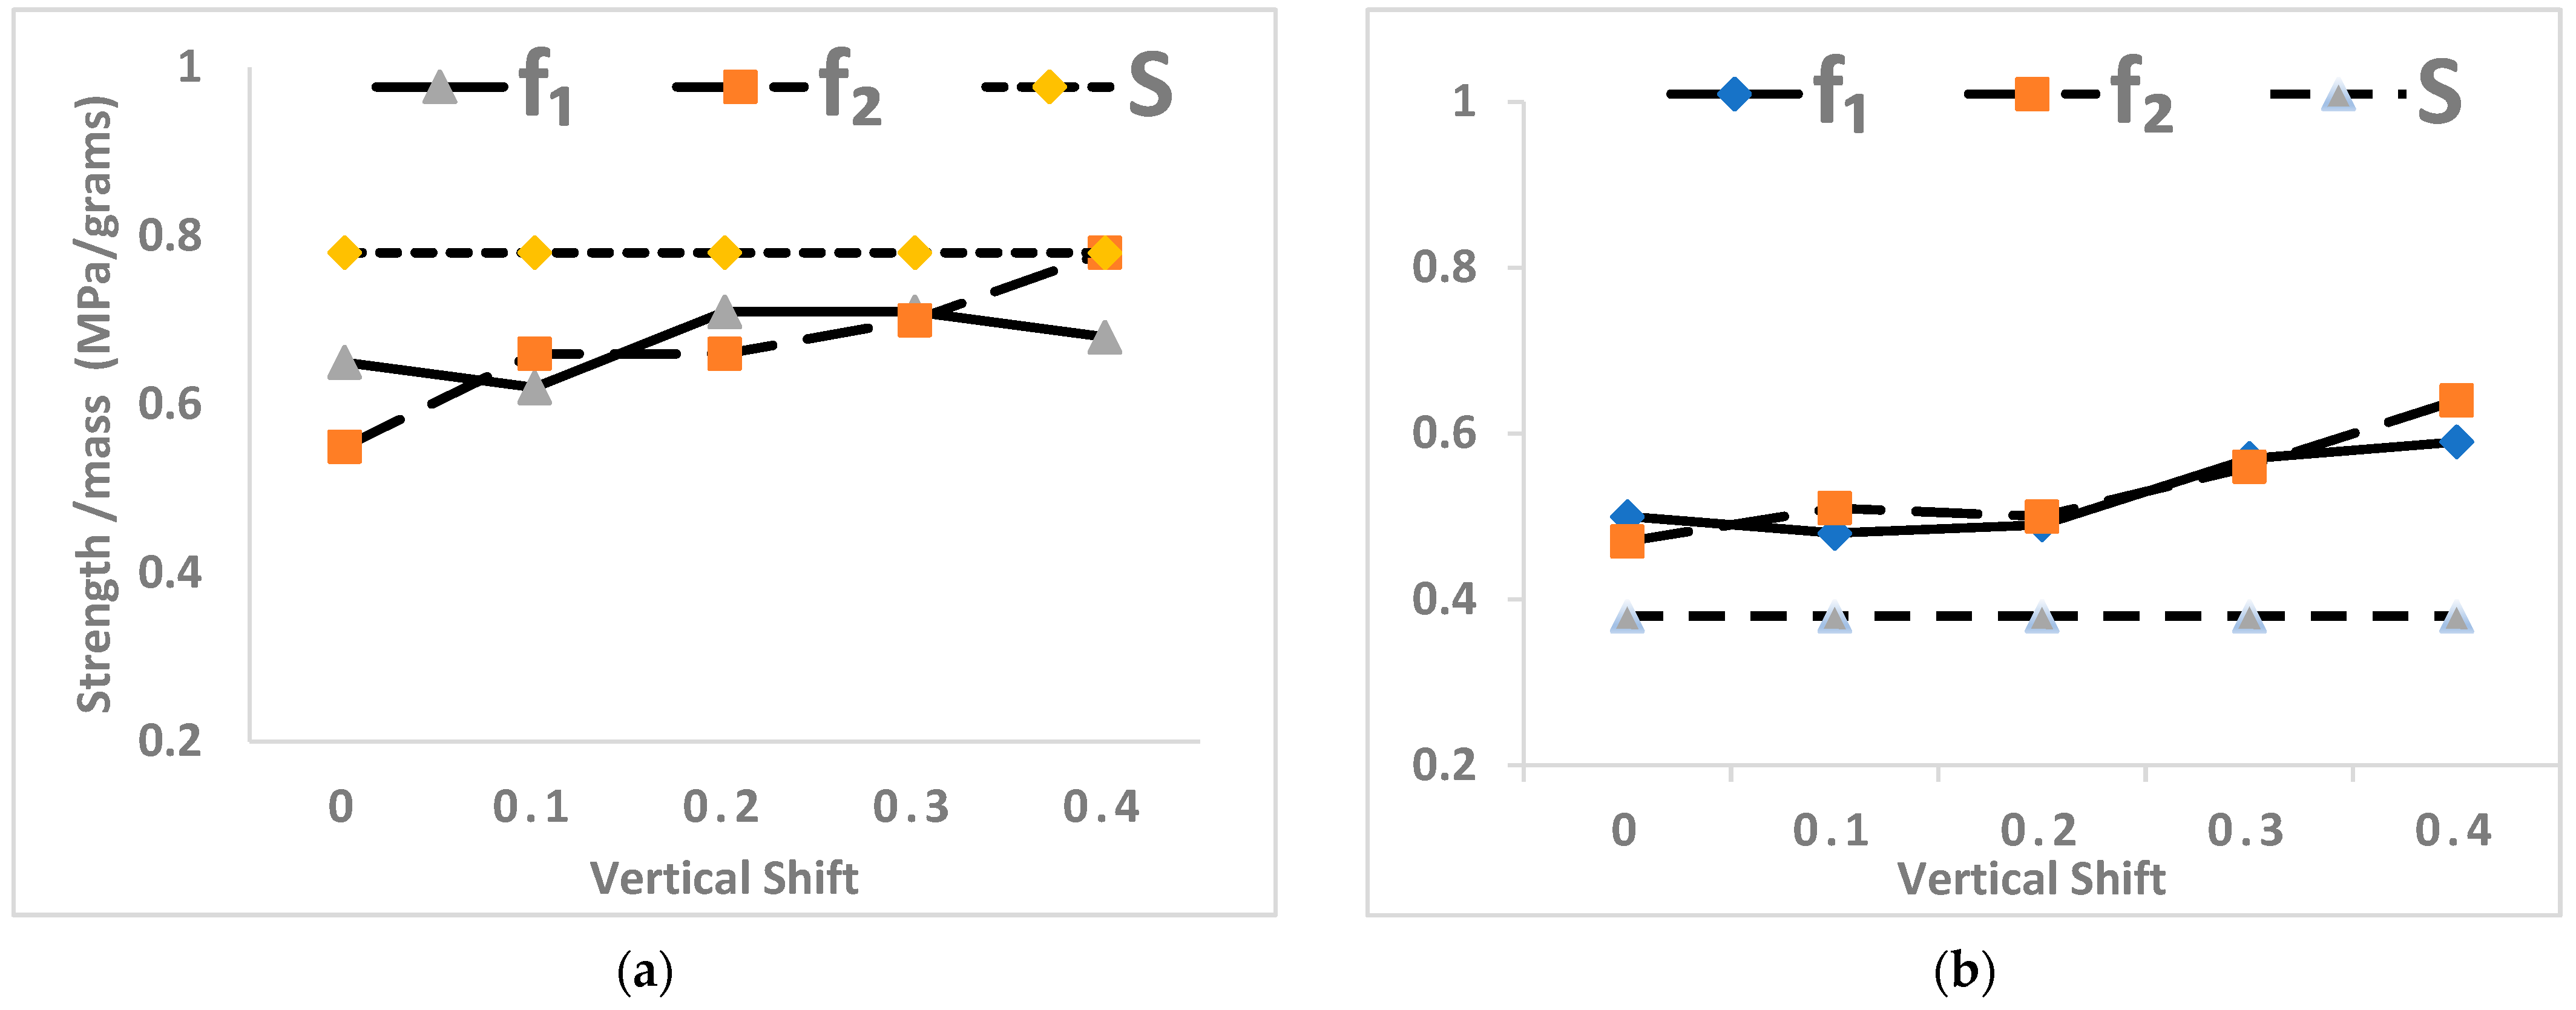
Figure 10a,b shows the strength to mass ratios versus vertical shift of specimens with 70% and 100% infill density. For 100% infill density specimens, a zigzag trend is observed for specimens with frequency f1 (19), and an increasing trend is observed for specimens with frequency f2 (21). The strength to mass ratio of solid specimens is higher than the values of 100% infill density with internal structure specimens, except for the specimen with frequency 21 and vertical shift 0.4, having the same value of strength to mass ratio. Similar results are observed through the research study of Beyer et al. [31] where the Kagome type of lattice structure performance in compression is equal, in magnitude, to the solid specimen. The performance of specimens with 70% infill density is highly regarded, including all the observations greater than the strength to mass ratio of solid specimens. A continuously increasing trend is observed for both frequencies.
Results of the second test series are more recognized, as the performance of each specimen of this series is much better than the solid specimen with infill density, as shown in Table 8 and Table 9. From the graphical representations in Figure 9 and Figure 10, it can be seen that, for minor increases in values of specimen mass, the range of improvement in strength to mass ratio in comparison to solid specimen, is from to . It is also observed that mass of the specimens range from 58.4 g to 62.72 g, and their performances are in the range of 27.8 MPa to 40.2 MPa i.e., for an improvement of in material, their performance is better than the specimen with the least values. For the first series, these values are with a increase in material and a 17.5 increase in strength is achieved.
Performance in the second series is further investigated and evaluated according to material distribution within the sample. Figure 8 and Figure 9 show that the amount of material utilized for the construction of specimens is, approximately, the same, but their strength to mass ratios are different and greater than the minor difference in their masses, if any. Comparing the values of strength to mass ratio show that higher values relate to frequency 21, and the material distribution in higher frequency specimens is more widened in the case of in contrast to specimens (refer to Table 3 and Table 4).
The thickness of solid bars is lesser for frequency 21 and compared to frequency 19 and, for such situations with the same masses of specimen, the much expanded material distribution of specimens with frequency 21 is justified. The solid bars serve as pillars internally and provide supports to the whole geometry. For these reasons, a greater level of compressive strength is achieved when comparison is made between 70% infill solid part and 70% infill cellular lattice structure specimens. The above research findings are supported through previous published research works by Chunze et al. [37,52]. Using Direct Metal Laser Sintering process (DMLS), similar observations are made when the unit cell sizes of the cellular lattice structure are reduced to 3 mm, 5 mm, and 7 mm, respectively, within the same volume fraction. With the reduction in the cell size, sizes of struts also decrease, and during manufacturing, the thinner struts cool down much rapidly, leading to finer microstructure and stronger struts. Therefore, as the dimensions of the struts reduce, improvement is observed in the strength and mechanical properties of the cellular lattice structure.
6. Conclusions
The research study has investigated the compressive strength of cellular lattice structure of two different test series manufactured by FDM technology. Comparisons of the results are made according to strength to mass ratio, compressive strength, and mass/density of the specimen.
The comparison among the 100% infill density specimen (solid specimen versus specimen with internal structure) shows that the solid specimen is much stronger, as it consumes more material. Samples of 100% infill density, with internal structure, perform much better than specimens with 70% infill density, which is evident from the data of specimens with frequency 21 and vertical shift of 0.4, printed with 100% and 70% infill density. Data of 100% infill specimen shows that, for a 4.2% increase in material, the strength rises to 26.6% higher than 70% infill specimen. Comparison within 70% infill specimen strength data suggests the use of specimens having internal structure instead of solid structure. These specimens show a balanced compressive strength property along with the benefit of material savings.
The study also shows that infill density, along with the pattern of material distribution, plays an important role for improvement in compressive strength. The results of the study can be successfully applied, according to compressive strength requirements, to different regions of objects under compression.
Author Contributions
Conceptualization, S.P. and M.F.; methodology, S.P.; writing-original draft preparation, S.P.; writing-review and editing, S.P., M.F. and M.A.K., supervision, M.F. and M.A.K. All authors have read and agreed to the published version of the manuscript.
Funding
This research was funded by NED University of Engineering & Technology through Grant no. Acad/50(48)/12403 dated 6 December 2016.
Institutional Review Board Statement
Not Applicable.
Informed Consent Statement
Not Applicable.
Data Availability Statement
Not Applicable.
Conflicts of Interest
The authors declare no conflict of interests.
References
- Guo, N.; Leu, M.C. Additive manufacturing: Technology, applications and research needs. Front. Mech. Eng. 2013, 8, 215–243. [Google Scholar] [CrossRef]
- Petrovic, V.; Gonzalez, J.V.H.; Ferrando, O.J.; Gordillo, J.D.; Puchades, J.R.B.; Griñan, L.P. Additive layered manufacturing: Sectors of industrial application shown through case studies. Int. J. Prod. Res. 2010, 49, 1061–1079. [Google Scholar] [CrossRef]
- Goguelin, S.; Flynn, J.M.; Essink, W.P.; Dhokia, V. A Data Visualization Dashboard for Exploring the Additive Manufacturing Solution Space. Procedia CIRP 2017, 60, 193–198. [Google Scholar] [CrossRef] [Green Version]
- Farré-Guasch, E.; Wolff, J.; Helder, M.N.; Schulten, E.A.; Forouzanfar, T.; Klein-Nulend, J. Application of Additive Manufacturing in Oral and Maxillofacial Surgery. J. Oral Maxillofac. Surg. 2015, 73, 2408–2418. [Google Scholar] [CrossRef]
- Krimi, I.; Lafhaj, Z.; Ducoulombier, L. Prospective study on the integration of additive manufacturing to building industry—Case of a French construction company. Addit. Manuf. 2017, 16, 107–114. [Google Scholar] [CrossRef]
- Paolini, A.; Kollmannsberger, S.; Rank, E. Additive manufacturing in construction: A review on processes, applications, and digital planning methods. Addit. Manuf. 2019, 30, 100894. [Google Scholar] [CrossRef]
- Wegrzyn, T.F.; Golding, M.; Archer, R.H. Food Layered Manufacture: A new process for constructing solid foods. Trends Food Sci. Technol. 2012, 27, 66–72. [Google Scholar] [CrossRef]
- Gu, D.; Meiners, W.; Wissenbach, K.; Poprawe, R. Laser additive manufacturing of metallic components: Materials, processes and mechanisms. Int. Mater. Rev. 2012, 57, 133–164. [Google Scholar] [CrossRef]
- Gibson, I.; Rosen, D.W.; Stucker, B. Additive Manufacturing Technologies; Springer: Berlin/Heidelberg, Germany, 2010. [Google Scholar]
- Wohlers, T.; Gornet, T. History of Additive Manufacturing; Wohlers Reports: OakRidge, CO, USA, 2014; p. 118. [Google Scholar]
- Nazir, A.; Abate, K.M.; Kumar, A.; Jeng, J.-Y. A state-of-the-art review on types, design, optimization, and additive manufacturing of cellular structures. Int. J. Adv. Manuf. Technol. 2019, 104, 3489–3510. [Google Scholar] [CrossRef]
- Mohamed, O.A.; Masood, S.; Bhowmik, J.L. Optimization of fused deposition modeling process parameters: A review of current research and future prospects. Adv. Manuf. 2015, 3, 42–53. [Google Scholar] [CrossRef]
- Baich, L. Impact of Infill Design on Mechanical Strength and Production Cost in Material Extrusion Based Additive Manufacturing. Master’s Thesis, Youngstown State University, Youngstown, OH, USA, 2016. [Google Scholar]
- Nsiempba, K.; Wang, M.; Vlasea, M. Geometrical Degrees of Freedom for Cellular Structures Generation: A New Classification Paradigm. Appl. Sci. 2021, 11, 3845. [Google Scholar] [CrossRef]
- Gibson, L.J.; Ashby, M.F. Cellular Solids: Structure and Properties, 2nd ed.; Cambridge University Press: Cambridge, UK, 1999. [Google Scholar]
- Ashby, M.F. The properties of foams and lattices. Philos. Trans. R. Soc. A Math. Phys. Eng. Sci. 2005, 364, 15–30. [Google Scholar] [CrossRef] [PubMed]
- Gibson, L.J. The hierarchical structure and mechanics of plant materials. J. R. Soc. Interface 2012, 9, 2749–2766. [Google Scholar] [CrossRef] [PubMed]
- Launey, M.E.; Buehler, M.J.; Ritchie, R.O. On the Mechanistic Origins of Toughness in Bone. Annu. Rev. Mater. Res. 2010, 40, 25–53. [Google Scholar] [CrossRef] [Green Version]
- Seki, Y.; Schneider, M.; Meyers, M. Structure and mechanical behavior of a toucan beak. Acta Mater. 2005, 53, 5281–5296. [Google Scholar] [CrossRef]
- Schaedler, T.A.; Carter, W.B. Architected Cellular Materials. Annu. Rev. Mater. Res. 2016, 46, 187–210. [Google Scholar] [CrossRef]
- Gorguluarslan, R.M.; Gandhi, U.N.; Mandapati, R.; Choi, S.-K. Design and fabrication of periodic lattice-based cellular structures. Comput. Des. Appl. 2015, 13, 50–62. [Google Scholar] [CrossRef] [Green Version]
- Helou, M.; Vongbunyong, S.; Kara, S. Finite Element Analysis and Validation of Cellular Structures. Procedia CIRP 2016, 50, 94–99. [Google Scholar] [CrossRef] [Green Version]
- Zok, F.W.; Latture, R.M.; Begley, M.R. Periodic truss structures. J. Mech. Phys. Solids 2016, 96, 184–203. [Google Scholar] [CrossRef]
- Dong, G.; Tang, Y.; Zhao, Y.F. A Survey of Modeling of Lattice Structures Fabricated by Additive Manufacturing. J. Mech. Des. 2017, 139, 100906. [Google Scholar] [CrossRef]
- Pasko, A.; Fryazinov, O.; Vilbrandt, T.; Fayolle, P.-A.; Adzhiev, V. Procedural function-based modelling of volumetric microstructures. Graph. Model. 2011, 73, 165–181. [Google Scholar] [CrossRef] [Green Version]
- Li, Q.; Hong, Q.; Qi, Q.; Ma, X.; Han, X.; Tian, J. Towards additive manufacturing oriented geometric modeling using implicit functions. Vis. Comput. Ind. Biomed. Art 2018, 1, 1–16. [Google Scholar] [CrossRef] [Green Version]
- Li, D.; Dai, N.; Jiang, X.; Shen, Z.; Chen, X. Density Aware Internal Supporting Structure Modeling of 3D Printed Objects. In Proceedings of the 2015 International Conference on Virtual Reality and Visualization (ICVRV), Xiamen, China, 17–18 October 2015; pp. 209–215. [Google Scholar] [CrossRef]
- Li, D.; Dai, N.; Jiang, X.; Chen, X. Interior structural optimization based on the density-variable shape modeling of 3D printed objects. Int. J. Adv. Manuf. Technol. 2015, 83, 1627–1635. [Google Scholar] [CrossRef]
- Wang, H.; Chen, Y.; Rosen, D.W. A Hybrid Geometric Modeling Method for Large Scale Conformal Cellular Structures. In International Design Engineering Technical Conferences and Computers and Information in Engineering Conference 2005; ASME: New York, NY, USA, 2005; Volume 47403, pp. 421–427. [Google Scholar] [CrossRef] [Green Version]
- Wang, H.V. A Unit Cell Approach for Lightweight Structure and Compliant Mechanism; Georgia Institute Of Technology: Atlanta, GA, USA, 2005; Available online: http://hdl.handle.net/1853/7561 (accessed on 20 October 2021).
- Beyer, C.; Figueroa, D. Design and Analysis of Lattice Structures for Additive Manufacturing. J. Manuf. Sci. Eng. 2016, 138, 121014. [Google Scholar] [CrossRef]
- Jansson, A.; Ekegren, J.; Pejryd, L. Numerical analysis of compression strength in network structures based on trusses, and periodic surfaces, aimed for additive manufacturing. Proc. Progress. Addit. Manuf. 2018, 662–670. [Google Scholar] [CrossRef]
- Karamooz-Ravari, M.R.; Kadkhodaei, M.; Badrossamay, M.; Rezaei, R. Numerical investigation on mechanical properties of cellular lattice structures fabricated by fused deposition modeling. Int. J. Mech. Sci. 2014, 88, 154–161. [Google Scholar] [CrossRef]
- Iyibilgin, O.; Yigit, C.; Leu, M.C. Experimental investigation of different cellular lattice structures manufactured by fused deposition modeling. In Proceedings of the 25th International Solid Freedom Fabrication Symposium on Additive Manufacturing, Austin, TX, USA, 4–6 August 2014; pp. 542–556. [Google Scholar]
- Gautam, R.; Idapalapati, S.; Feih, S. Printing and characterisation of Kagome lattice structures by fused deposition modelling. Mater. Des. 2018, 137, 266–275. [Google Scholar] [CrossRef]
- Alabort, E.; Barba, D.; Reed, R.C. Design of metallic bone by additive manufacturing. Scr. Mater. 2019, 164, 110–114. [Google Scholar] [CrossRef]
- Yan, C.; Hao, L.; Hussein, A.; Young, P.; Huang, J.; Zhu, W. Microstructure and mechanical properties of aluminium alloy cellular lattice structures manufactured by direct metal laser sintering. Mater. Sci. Eng. A 2015, 628, 238–246. [Google Scholar] [CrossRef]
- Christensen, J.; De Abajo, F.J.G. Anisotropic Metamaterials for Full Control of Acoustic Waves. Phys. Rev. Lett. 2012, 108, 124301. [Google Scholar] [CrossRef]
- Levy, U.; Abashin, M.; Ikeda, K.; Krishnamoorthy, A.; Cunningham, J.; Fainman, Y. Inhomogenous Dielectric Metamaterials with Space-Variant Polarizability. Phys. Rev. Lett. 2007, 98, 243901. [Google Scholar] [CrossRef] [Green Version]
- Bici, M.; Brischetto, S.; Campana, F.; Ferro, C.G.; Seclì, C.; Varetti, S.; Maggiore, P.; Mazza, A. Development of a multifunctional panel for aerospace use through SLM additive manufacturing. Procedia CIRP 2018, 67, 215–220. [Google Scholar] [CrossRef]
- Helou, M.; Kara, S. Design, analysis and manufacturing of lattice structures: An overview. Int. J. Comput. Integr. Manuf. 2017, 31, 243–261. [Google Scholar] [CrossRef]
- Uddin, M.S.; Sidek, M.F.; Faizal, M.A.; Ghomashchi, R.; Pramanik, A. Evaluating Mechanical Properties and Failure Mechanisms of Fused Deposition Modeling Acrylonitrile Butadiene Styrene Parts. J. Manuf. Sci. Eng. 2017, 139. [Google Scholar] [CrossRef]
- Balderrama-Armendariz, C.O.; Macdonald, E.; Espalin, D.; Cortes, D.; Wicker, R.; Maldonado-Macías, A. Torsion analysis of the anisotropic behavior of FDM technology. Int. J. Adv. Manuf. Technol. 2018, 96, 307–317. [Google Scholar] [CrossRef]
- Lee, C.; Kim, S.; Kim, H.; Ahn, S. Measurement of anisotropic compressive strength of rapid prototyping parts. J. Mater. Process. Technol. 2007, 187–188, 627–630. [Google Scholar] [CrossRef]
- Sood, A.K.; Ohdar, R.K.; Mahapatra, S.S. Experimental investigation and empirical modelling of FDM process for compressive strength improvement. J. Adv. Res. 2012, 3, 81–90. [Google Scholar] [CrossRef] [Green Version]
- Popescu, D.; Zapciu, A.; Amza, C.; Baciu, F.; Marinescu, R. FDM process parameters influence over the mechanical properties of polymer specimens: A review. Polym. Test. 2018, 69, 157–166. [Google Scholar] [CrossRef]
- Jamshidian, M.; Tehrany, E.A.; Imran, M.; Jacquot, M.; Desobry, S. Poly-Lactic Acid: Production, Applications, Nanocomposites, and Release Studies. Compr. Rev. Food Sci. Food Saf. 2010, 9, 552–571. [Google Scholar] [CrossRef] [PubMed]
- Farah, S.; Anderson, D.G.; Langer, R. Physical and mechanical properties of PLA, and their functions in widespread applications—A comprehensive review. Adv. Drug Deliv. Rev. 2016, 107, 367–392. [Google Scholar] [CrossRef] [PubMed] [Green Version]
- Makerbot PLA and ABS Strength Data. 2015. Available online: http://download.makerbot.com/legal/MakerBotRPLAandABSStrengthData.pdf (accessed on 10 July 2015).
- Pasko, A.; Adzhiev, V.; Cartwright, R.; Fausett, E.; Ossipov, A.; Savchenko, V. HyperFun project: A framework for collaborative multidimensional F-rep modeling. In Proceedings of the Eurographics/ACM SIGGRAPH Workshop Implicit Surfaces’ 99, Granada, Spain, 21–23 June 1999; pp. 59–69. [Google Scholar]
- Villalpando, L.; Eiliat, H.; Urbanic, R. An Optimization Approach for Components Built by Fused Deposition Modeling with Parametric Internal Structures. Procedia CIRP 2014, 17, 800–805. [Google Scholar] [CrossRef] [Green Version]
- Yan, C.; Hao, L.; Hussein, A.; Bubb, S.L.; Young, P.; Raymont, D. Evaluation of light-weight AlSi10Mg periodic cellular lattice structures fabricated via direct metal laser sintering. J. Mater. Process. Technol. 2014, 214, 856–864. [Google Scholar] [CrossRef]
Figure 1.
Process Schematic diagram for FDM Process.

Figure 2.
Categorization of lattice structure: (a) Disordered lattice structure; (b) Periodic lattice structure; (c) Pseudo-periodic lattice structure.
Figure 2.
Categorization of lattice structure: (a) Disordered lattice structure; (b) Periodic lattice structure; (c) Pseudo-periodic lattice structure.

Figure 3.
Dimensions of test specimen (a) Test specimen overall dimensions (b) X-sectional view of test specimen with internal cellular lattice structure (c) X-sectional view of hollow test specimen (solid part).
Figure 3.
Dimensions of test specimen (a) Test specimen overall dimensions (b) X-sectional view of test specimen with internal cellular lattice structure (c) X-sectional view of hollow test specimen (solid part).

Figure 4.
X-sectional views of test specimen with (a) complete lattice structure within the shell (b) internal structure of the hollow bar.
Figure 4.
X-sectional views of test specimen with (a) complete lattice structure within the shell (b) internal structure of the hollow bar.

Figure 5.
X-sectional top views of test specimen with frequency “19”and vertical shift “0” (a) after rendering plus slicing (b) after printing.
Figure 5.
X-sectional top views of test specimen with frequency “19”and vertical shift “0” (a) after rendering plus slicing (b) after printing.

Figure 6.
X-sectional top views of test specimen with frequency “19” and vertical shift “0.4” (a) after rendering plus slicing (b) after printing.
Figure 6.
X-sectional top views of test specimen with frequency “19” and vertical shift “0.4” (a) after rendering plus slicing (b) after printing.

Figure 7.
External and Internal geometry (a) Outer shape of the specimen after printing (b) X-sectional view, illustrating internal structure of the test specimen and related dimensions after rendering (c) X-sectional view illustrating internal structure of the test specimen and related dimensions after printing.

Figure 8.
Graphical representation of the relationship between strength versus vertical shift (a) with 100% infill density (b) with 70% infill density.
Figure 8.
Graphical representation of the relationship between strength versus vertical shift (a) with 100% infill density (b) with 70% infill density.

Figure 9.
Graphical representation of the relationship between mass versus vertical shift (a) with 100% infill density (b) with 70% infill density.
Figure 9.
Graphical representation of the relationship between mass versus vertical shift (a) with 100% infill density (b) with 70% infill density.

Figure 10.
Graphical representation of the relationship between strength to mass ratio versus vertical shift (a) with 100% infill density (b) with 70% infill density.
Figure 10.
Graphical representation of the relationship between strength to mass ratio versus vertical shift (a) with 100% infill density (b) with 70% infill density.


Table 1.
Mechanical properties of PLA.
| PLA Properties | Value | Units |
|---|---|---|
| Density | 1.24 | g/ |
| Compressive Strength (Peak, STD) | 17.9 | MPa |
| Young Modulus | 3.5 | GPa |
Table 2.
Printing Parameters of 3D Printer.
| Printing Parameter | Value | Units |
|---|---|---|
| Filament diameter | 1.75 | mm |
| Nozzle Diameter | 0.4 | mm |
| Print Temperature | 210 | °C |
| Bed Temperature | 50 | °C |
| Layer Height | 0.2 | mm |
| Print Speed | 50 | mm/s |
| Travel Speed | 150 | mm/s |
Table 3.
Thickness of hollow bars (non-filled sections) in millimeters (p).
| Frequency (f) | Vertical Shift (v) | |||||
|---|---|---|---|---|---|---|
| 0 | 0.1 | 0.2 | 0.3 | 0.4 | ||
| f1 | 19 | 4.2 | 4.5 | 4.8 | 5.3 | 5.3 |
| f2 | 21 | 3.8 | 4.3 | 4.5 | 4.9 | 4.9 |
Table 4.
Distance between bars (filled sections with 3D printed material) in millimeters (q).
| Frequency (f) | Vertical Shift (v) | |||||
|---|---|---|---|---|---|---|
| 0 | 0.1 | 0.2 | 0.3 | 0.4 | ||
| f1 | 19 | 4.2 | 3.9 | 3.6 | 3.3 | 3.1 |
| f2 | 21 | 3.8 | 3.3 | 3.1 | 2.9 | 2.7 |
Table 5.
X-sectional views of the test specimens constructed through Algorithm 1, given above.
| Type | Frequency (f) | Vertical Shift (v) | |||||
|---|---|---|---|---|---|---|---|
| 0 | 0.1 | 0.2 | 0.3 | 0.4 | |||
| Cellular Lattice Structure | f1 | 19 |  |  |  |  |  |
| f2 | 21 |  |  |  |  |  | |
| Solid Part | S | - |  | ||||
Table 6.
First test series results of test specimens with frequency 19 and 100% infill density.
| Type | f1 | v | Average Mass of Specimen (g) | Strength/Mass Ratio (MPa/g) | |
|---|---|---|---|---|---|
| Cellular Lattice Structure | 19 | 0 | 61.7 | 105 | 0.68 |
| 19 | 0.1 | 62.3 | 107 | 0.67 | |
| 19 | 0.2 | 60.7 | 113 | 0.71 | |
| 19 | 0.3 | 63.7 | 118 | 0.71 | |
| 19 | 0.4 | 63.2 | 117 | 0.7 | |
| Solid Part | - | - | 82.7 | 169 | 0.78 |
Table 7.
First test series results of test specimens with frequency 21 and 100% infill density.
| Type | f2 | v | Average Mass of Specimen (g) | Strength/Mass Ratio (MPa/g) | |||
|---|---|---|---|---|---|---|---|
| Cellular Lattice Structure | 21 | 0 | 62.65 | 90 | 0.59 | ||
| 21 | 0.1 | 62.3 | 107 | 0.67 | |||
| 21 | 0.2 | 61.5 | 106 | 0.66 | |||
| 21 | 0.3 | 62.9 | 115 | 0.7 | |||
| 21 | 0.4 | 65.4 | 132 | 0.78 | |||
| Solid Part | - | - | 82.7 | 169 | 0.78 | ||
Table 8.
Second test series results of test specimens with frequency 19 and 70% infill density.
| Type | f1 | v | Average Mass of Specimen (g) | Strength/Mass Ratio (MPa/g) | % Improvement in Strength/Mass Ratio | |
|---|---|---|---|---|---|---|
| Cellular Lattice Structure | 19 | 0 | 59.5 | 78 | 0.50 | 31.5 |
| 19 | 0.1 | 61.1 | 76 | 0.48 | 26.3 | |
| 19 | 0.2 | 59.9 | 76 | 0.49 | 28.9 | |
| 19 | 0.3 | 60.7 | 90 | 0.57 | 50.0 | |
| 19 | 0.4 | 59.98 | 92 | 0.59 | 55.2 | |
| Solid Part | - | - | 62.4 | 62 | 0.38 | - |
Table 9.
Second test series results of test specimens with frequency 21 and 70% infill density.
| Type | f2 | v | Average Mass of Specimen (g) | Strength/Mass Ratio (MPa/g) | % Improvement in Strength/Mass Ratio | |
|---|---|---|---|---|---|---|
| Cellular Lattice Structure | 21 | 0 | 58.4 | 72 | 0.47 | 23.6 |
| 21 | 0.1 | 61 | 81 | 0.51 | 34.2 | |
| 21 | 0.2 | 61.2 | 80 | 0.5 | 31.5 | |
| 21 | 0.3 | 60.17 | 89 | 0.56 | 47.3 | |
| 21 | 0.4 | 62.72 | 105 | 0.64 | 68.4 | |
| Solid Part | - | - | 62.4 | 62 | 0.38 | - |
Publisher’s Note: MDPI stays neutral with regard to jurisdictional claims in published maps and institutional affiliations. |
© 2021 by the authors. Licensee MDPI, Basel, Switzerland. This article is an open access article distributed under the terms and conditions of the Creative Commons Attribution (CC BY) license (https://creativecommons.org/licenses/by/4.0/).
Share and Cite
MDPI and ACS Style
Perween, S.; Fahad, M.; Khan, M.A. Systematic Experimental Evaluation of Function Based Cellular Lattice Structure Manufactured by 3D Printing. Appl. Sci. 2021, 11, 10489. https://0-doi-org.brum.beds.ac.uk/10.3390/app112110489
AMA Style
Perween S, Fahad M, Khan MA. Systematic Experimental Evaluation of Function Based Cellular Lattice Structure Manufactured by 3D Printing. Applied Sciences. 2021; 11(21):10489. https://0-doi-org.brum.beds.ac.uk/10.3390/app112110489
Chicago/Turabian StylePerween, Shaheen, Muhammad Fahad, and Maqsood A. Khan. 2021. "Systematic Experimental Evaluation of Function Based Cellular Lattice Structure Manufactured by 3D Printing" Applied Sciences 11, no. 21: 10489. https://0-doi-org.brum.beds.ac.uk/10.3390/app112110489
Note that from the first issue of 2016, this journal uses article numbers instead of page numbers. See further details here.