Article

A Sensitivity Analysis Approach for Assessing the Effect of Design Parameters in Reducing Seismic Demand of Base-Isolated Storage Racks

by
Oscar Álvarez
1,
Enrique Muñoz
1,2,
Nelson Maureira-Carsalade
1,* and
Ángel Roco-Videla
3
1
Departament of Civil Engineering, Universidad Católica de la Santísima Concepción, Concepción 4090541, Chile
2
Centro de Investigación en Biodiversidad y Ambientes Sustentables (CIBAS), Universidad Católica de la Santísima Concepción, Concepción 4090541, Chile
3
Programa de Magíster en Ciencias Químico Biológicas, Facultad de Salud, Universidad Bernardo O’Higgins, Santiago 8370993, Chile
*
Author to whom correspondence should be addressed.
Submission received: 13 October 2021 / Revised: 15 November 2021 / Accepted: 24 November 2021 / Published: 6 December 2021

Abstract

:
The most used global sensitivity analysis (GSA) method is based on variance. This is performed using Monte Carlo Sampling (MCS) or Latin Hypercube Sampling (LHS). It requires a large sample to obtain accurate estimates. Density-based methods, such as the GSA PAWN, have been developed to reduce the sample size without compromising the result. PAWN is simpler than other methods because it uses cumulative density functions (CDF) instead of probability density. This method has been widely used in areas such as environmental engineering with very good results, reducing computation time. However, its use in structural engineering is incipient. The PAWN method was used to classify the design variables of the isolation system in relation to their sensitivity, and in relation to the seismic response of industrial storage racks. The above was analyzed in terms of the effectiveness of each variable to reduce the seismic demand using a novel base isolation kinematic device (BIKD). Racks with different combinations of their structural parameters such as the number of storage levels, the height between them, and isolation period, among others, were studied. The dimensions of the racks were chosen to match those that would later be experimentally tested on shaking table. An earthquake whose response spectrum matched the design spectrum of current Chilean regulations, was considered as seismic forcing. The maximum base shear load, the displacement of the top level of storage and the floor drift were considered as target responses to be studied. Fixed base racks (FBR), as reference, and base-isolated racks (BIR) were analyzed. The results showed the effectiveness of using the BIKD system in reducing all three-target responses up to one order of magnitude. Additionally, it was determined that the parameters that have the greatest influence on the response correspond to the number of storage levels and the height between them, both for FBR and BIR.

1. Introduction

Industrial storage is an important need in every production process. Many products are stored in industrial storage racks since they provide a solution to the efficient use of space, allowing an adequate transfer and storage of products. There are different types of racks, the most used being the selective type [1].
The structure of the racks is generally made of steel, and they are composed of columns and beams that form moment-resistant frames in the longitudinal direction (i.e., parallel to the aisles). In the cross aisle direction, the resistant system is of the reticulated type, having several levels of storage or platforms where the products are arranged [2].
To facilitate the transit of operators and customers between selective racks, they are designed narrowly in one of their two horizontal directions, cross the aisles, and parallel to the aisles, the latter being much longer. These structures are arranged within industrial warehouses with open spaces and leaving aisles between the racks to allow the loading and unloading operation. Industrial storage selective racks can be very slender in one of the two horizontal directions and can be capable of withstanding high vertical loads [3].
The foregoing means that selective racks, as well as their content, are vulnerable to seismic action, with the risk of physical damage or fatality for the people who walk near them. In Chile, after the evaluation of the damages caused by the earthquake on 27 February 2010, the identified needs arose the following actions: (i) increasing the stability of these structures; (ii) increasing the safety of the personnel and clients who operate around racks; (iii) reducing product losses and (iv) increasing the stability and serviceability of selective racks. These needs are of high interest in the industry, especially if it is found possible to maintain the continuity of operations after severe earthquakes, given the economic benefit that this entails.
One solution to the vulnerability of these structures is to add bracing in the longitudinal direction of the rack, which would improve its performance [4]. However, such a solution would reduce the storage capacity, being incorporated in sacrificial bays that cannot be used for storage [5]. Worldwide there are seismic protection systems to provide solutions to structures that are vulnerable to seismic action. Several investigations have been derived from this, seeking to analyze the performance of structures with this type of system [6,7,8,9]. Gutelius et al. [10] developed a base isolation system to protect sensitive electronic equipment such as computers and servers stored on moderate to low-height shelves. Later, a solution was developed to protect industrial storage racks and the goods stored in them from seismic action, with the consequent benefit of reducing the risk of damage to the people in transit near these structures. This device consisted of an isolation system that worked in the cross-aisle direction of the racks, incorporating damping by friction plates and elastomeric bearings [11,12]. The above was the first basal isolation device designed for industrial storage racks, whose technology has already been transferred to the industry.
The motivation for this research is based on the option of complementing and improving existing alternatives of base isolation. In this regard, Maureira-Carsalade et al. [13] developed a numerical model that reproduces the behavior of a novel base isolation kinematic device (BIKD). This device has significant tensile strength, similar to that of Pellegrino et al. [14]. Unlike Pellegrino’s isolator, the device allows racks to be seismically isolated from an earthquake that attacks them in any horizontal direction. Vertically, it is vertically very rigid, and its lateral stiffness is controlled by the tension of a post-tensioned element located inside. Such tension is transmitted from the BIKD to the superstructure through a connecting cable, allowing the isolator to resist relatively high levels of traction compared with the requesting axial load. In addition, it provides friction energy dissipation in the ball joint that serves as basal support [13,14].
Computational models for dynamic systems of structures can be highly expensive to run. This cost is increased when there are many parameters involved in the system, when the structure has many degrees of freedom, and/or when there is non-linearity involved in the system. Therefore, it is important to identify critical parameters of dynamic system models since it would simplify models, in order to simplify the model and reduce computational costs [15].
Sensitivity analysis (SA) determines how the variability of a given model’s outputs can be explained as a function of variations in its inputs. By studying this relationship, it is possible to identify factors or variables of greater and lesser importance on the results of interest of the model. SAs are classified into two groups: local sensitivity analysis (LSA) and global sensitivity analysis (GSA) [16].
The local sensitivity analysis considers the variability of the outputs versus the variation of one input parameter around a specific value, whereas the global sensitivity analysis considers the complete space of variability of the input factors. Another difference between them is that the LSA modifies one parameter at a time while the others remain unchanged, whereas the GSA allows the variation of all the parameters simultaneously to evaluate their influence on the outputs of a model [17].
One of the GSA methods widely used in structural engineering is a variance-based sensitivity method [18,19,20,21]. This method analyzes the variance of the output using Monte Carlo Sampling (MCS) or Latin Hypercube Sampling (LHS) techniques. Various investigations and applications can be found on this type of analysis to determine the sensitivity of the parameters in dynamic structural systems. Patelli et al. [18] proposed an efficient approach based on random sampling to estimate the upper limits of the total sensitivity indices. In this study, it was found that the number of evaluations required in the model was reduced using MCS. They applied this approach by analyzing the parameters that affect the variance of the maximum displacement of a specific point in a mechanical model of a long bridge, applying a harmonic load as input. Maciejewski & Krzyzynski [20] used variance-based sensitivity analysis to determine the sensitivity of the evaluation criteria in selecting the design parameters of a system. Through this analysis, the authors determined the optimal configuration of the system in terms of its design parameters. However, this method has limitations, one of which is that the generation of the output sample is very computationally demanding. This is a major limitation for the applicability of variance-based methods, especially since obtaining accurate estimates can require a large number of output samples. Another limitation of variance-based methods is that they implicitly assume that variance is a sensible measure for measuring uncertainty, which may not always be the case [16,22,23].
Due to the limitations of variance-based methods, a series of studies on density-based methods has recently been conducted. These density-based methods have been so named because they investigate the probability density function of the model output, rather than just its variance. One of the density-based GSA methods is the PAWN method [10,11,12,13,14,15,16]. This has been used successfully in various investigations focused on environmental and hydrological models [24,25]; however, its use was not found in the area of structural or earthquake-resistant engineering. Taking the latter into account, the application of the PAWN method in this engineering area is interesting and novel, since it has advantages over the GSA methods that have previously been used in this area. The advantages over the methods based on variance and density are detailed in Section 2.4 of this article.
Our hypothesis is that the incorporation of the BIKD would allow a significant reduction of the objective responses produced by seismic action, due to the decoupling of the structure with respect to the soil. Furthermore, by means of the SA, it is possible to classify the design variables according to their influence on the reduction of the structural response. This allows us to obtain the optimal design parameters for base-isolated racks using the BIKD. Therefore, this research aims to determine the parameters with the greatest influence on reducing the responses of interest in industrial storage racks, by incorporating the BIKD. To reach this objective, numerical models were elaborated, and simulations of time–history analysis were carried out in racks with different structural parameter conditions, considering fixed-base racks and base-isolated racks.

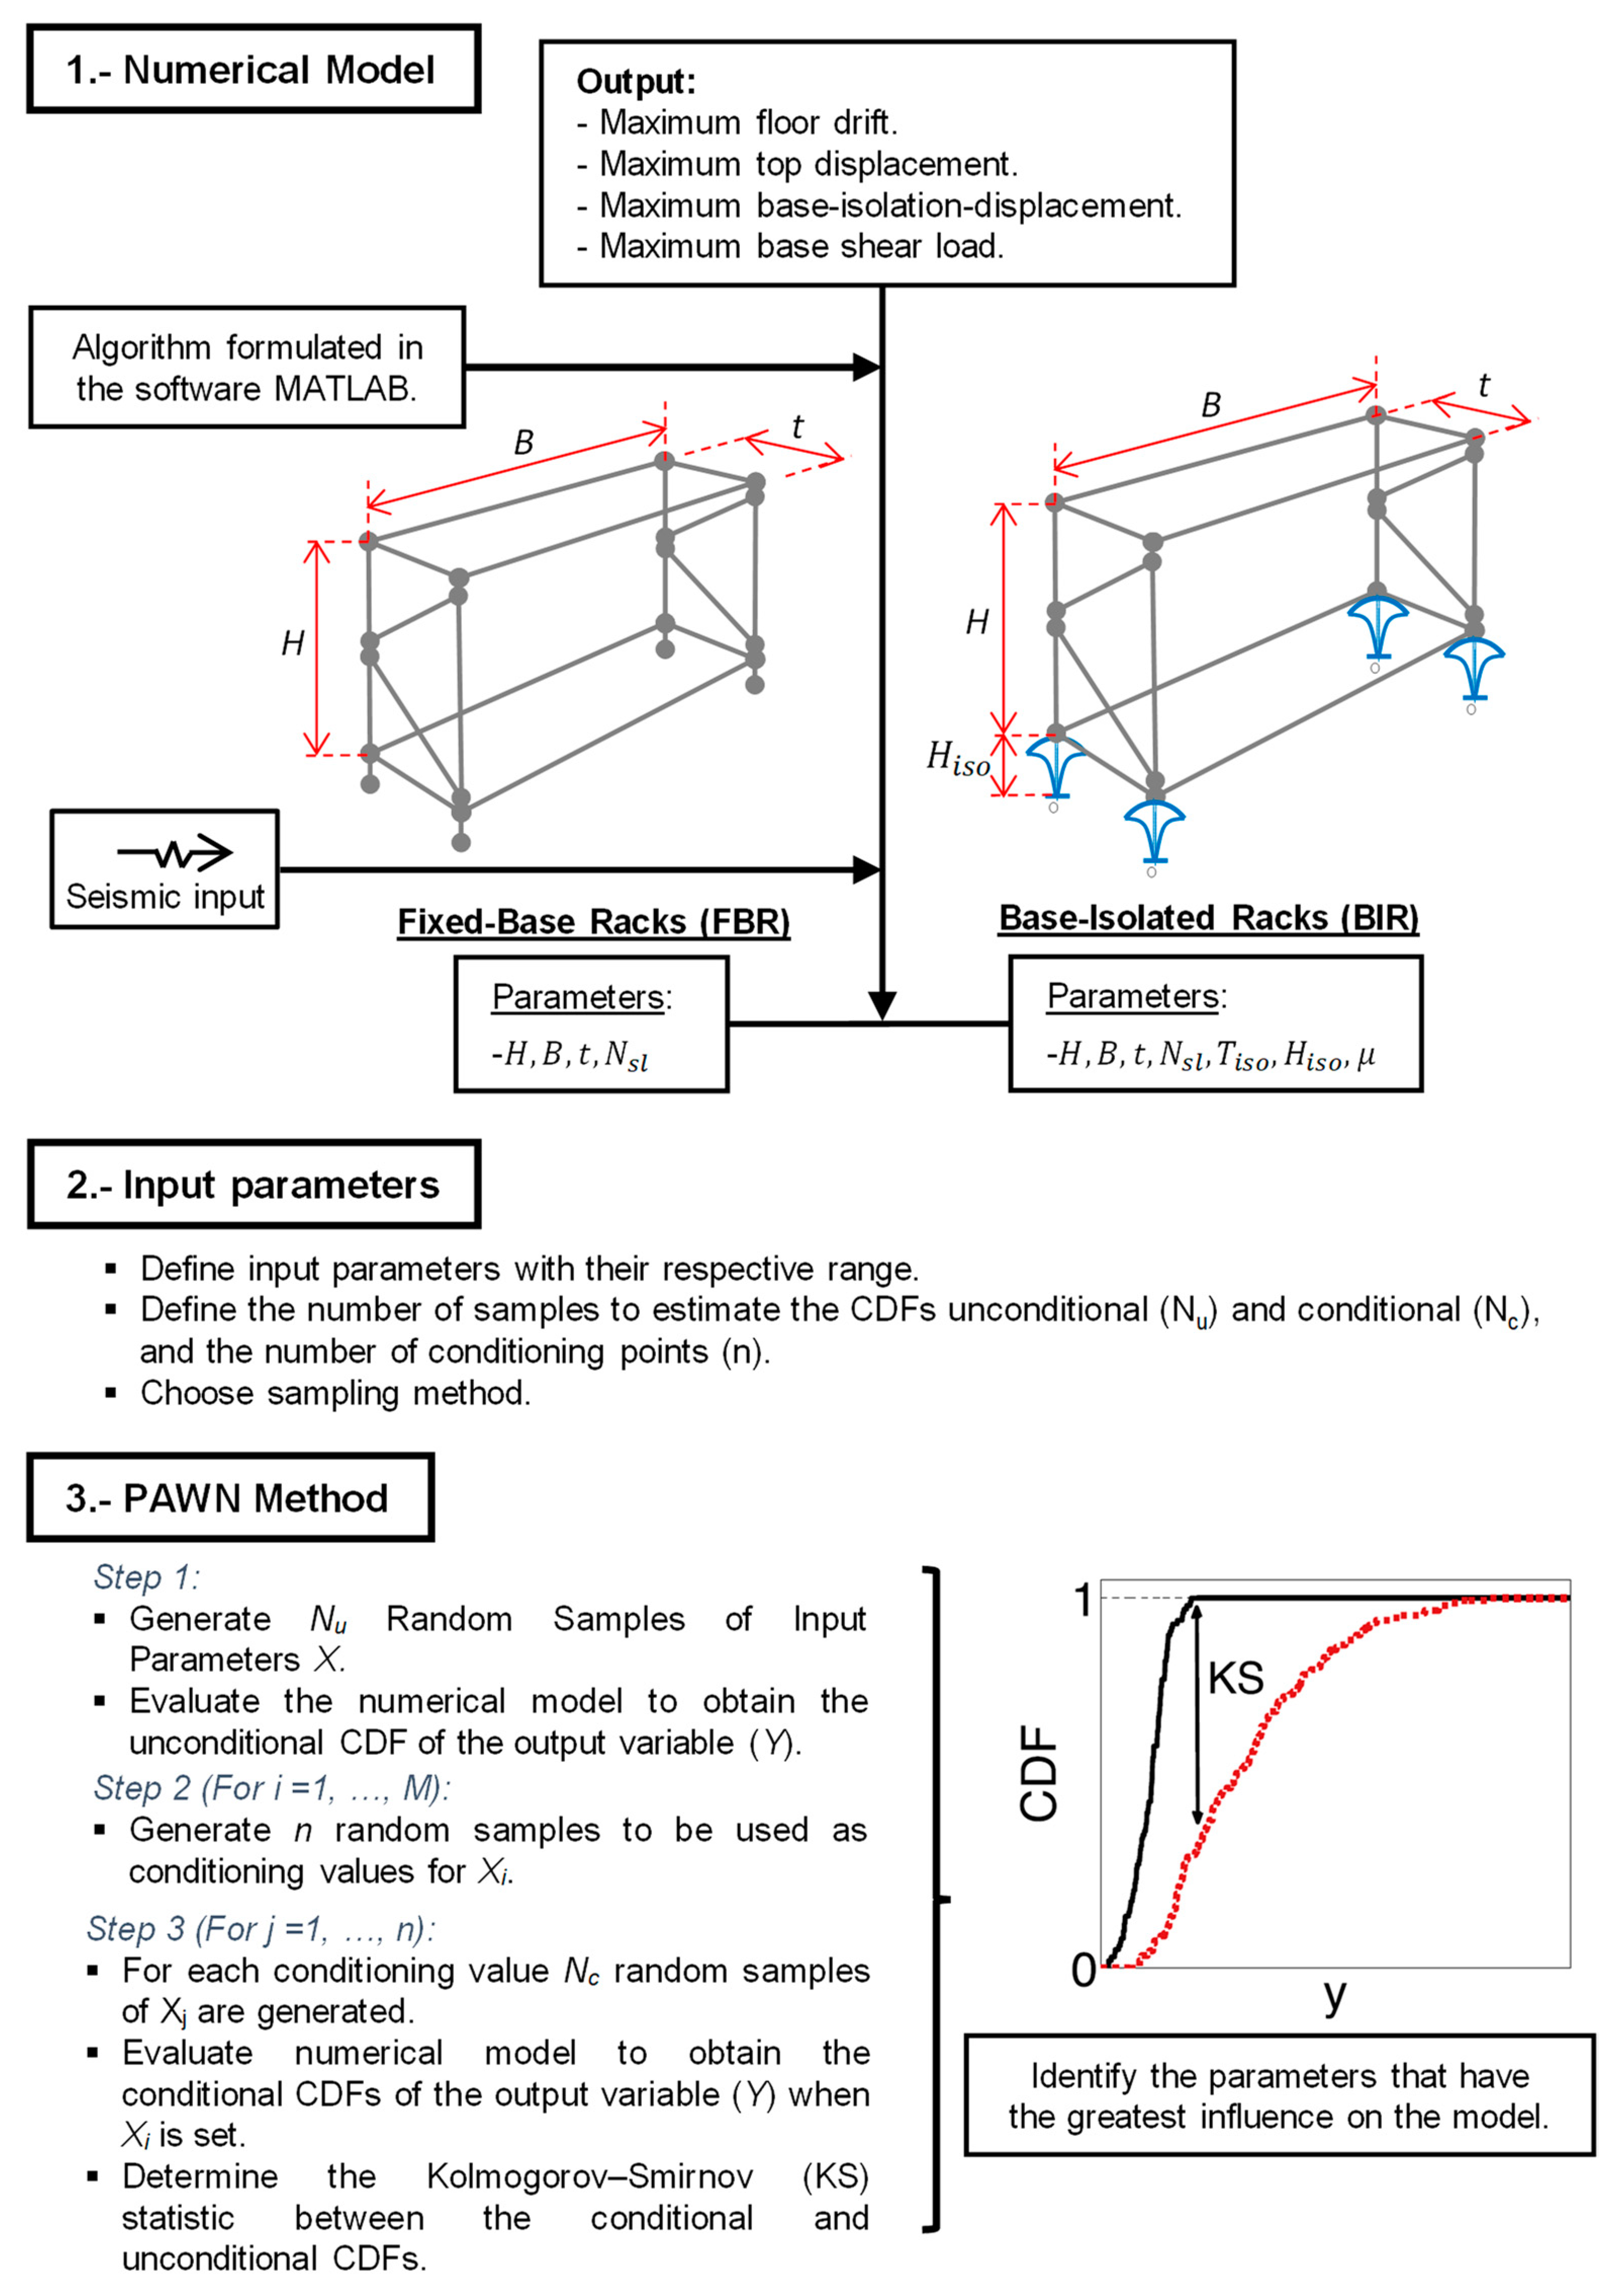
2. Materials and Methods

Selective racks were analyzed in this research, as these are the most commonly used in the industry [1].
Two formulations or structural models were made with different support conditions for the racks: (i) fixed at the base, and (ii) with base-isolation. In these formulations, the Euler–Bernoulli stiffness matrix and consistent mass matrix of a 3D bar element with 12 degrees of freedom (DoF) were considered for beams and columns. The elements of the lattice system of the rack in the cross aisle direction were considered as 2 DoF axial-bar-type elements. These were located between the columns to provide lateral stiffness in the cross aisle direction (Figure 1; Table 1). On each storage level of the racks, two pallets (1 ton each) were installed on the beams. Racks of between 2 and 6 load level (4 up to 12 pallets) were analyzed. Each level was modeled as a rigid diaphragm with 3 DoF, plus one vertical DoF at each beam–column connection node. The masses of the pallets were added as a 2 ton translational inertia in both horizontal directions plus the corresponding rotational inertia of mass around the vertical axis. Regarding the vertical DoFs, the mass of the pallets was considered as load and not as inertia. The analysis contemplates the incorporation of geometric stiffness matrices in the column and diagonal elements of the lattice, in the cross-aisle direction. This allows for the characterization of the geometric non-linear behavior and the P-Δ effect of the earthquake on the racks.
In the last decade, investigations have been carried out whose focus is on the non-linear behavior of beam–column connections, [26,27,28,29,30]. The dynamic response of this type of fixed base structures is influenced by the non-linearity of the connections; however, the focus of this research is on the classification of the design parameters of the rack and the isolation system. This was done according to the influence of said parameters in reducing the seismic demand on the rack. The relevance of this research is in the sensitivity analysis that requires the study of multiple scenarios. These increase exponentially as the number of parameters considered in the analysis increases, as well as increasing the numerical complexity of the mathematical models. The enormous computational time involved in incorporating non-linear plastic connections would make sensitivity analysis impractical in this case, given the number of parameters already considered. Due to the above, non-linear plastic behavior models were not implemented in the beam-column connections of the racks.
Experimental research has been carried out on scale models of the BIKD and functional prototypes of low strength and stiffness [13]. In recent months, the researchers co-authoring the present article have planned to conduct experimental trials of base isolated racks at 1:1 scale from 2 up to 6 storage levels. The BIKD to be used in the tested racks were designed and built with an adjustable height. We have decided not to mention that cost, as we know that such a small-scale production is not representative of the cost of the mass-produced device.
The results presented here will be later used to define the parameters of our experimental tests; hence, the reason why the length and width of the racks and isolation system studied here (Figure 2 and Table 2) have been set at 2 m ≤ B ≤ 3 m, t = 0.85 m and d = 0.06 m. Furthermore, only cases of single-bay racks were analyzed, because the size of the shaking table (2 m × 3 m in plant) used in the experimental tests only allows testing of this type of racks.
To analyze the effectiveness of implementing the BIKD system, the maximum base shear load, floor drift and displacement of the top level of storage were calculated. As seismic forcing, a frequency domain scaled real earthquake record was considered, as indicated in Section 2.3. A sensitivity analysis was performed on four and seven parameters for fixed base racks (FBR) and for base isolated racks (BIR), respectively. The influence of these parameters on the outputs of each model was quantified. The global sensitivity analysis method, PAWN (derived from the authors names, Pianosi & Wagener [16]), was applied to the models performing time-history analysis implemented in MATLAB to determine the sensitivity indicators and magnitudes of the target parameters of design.

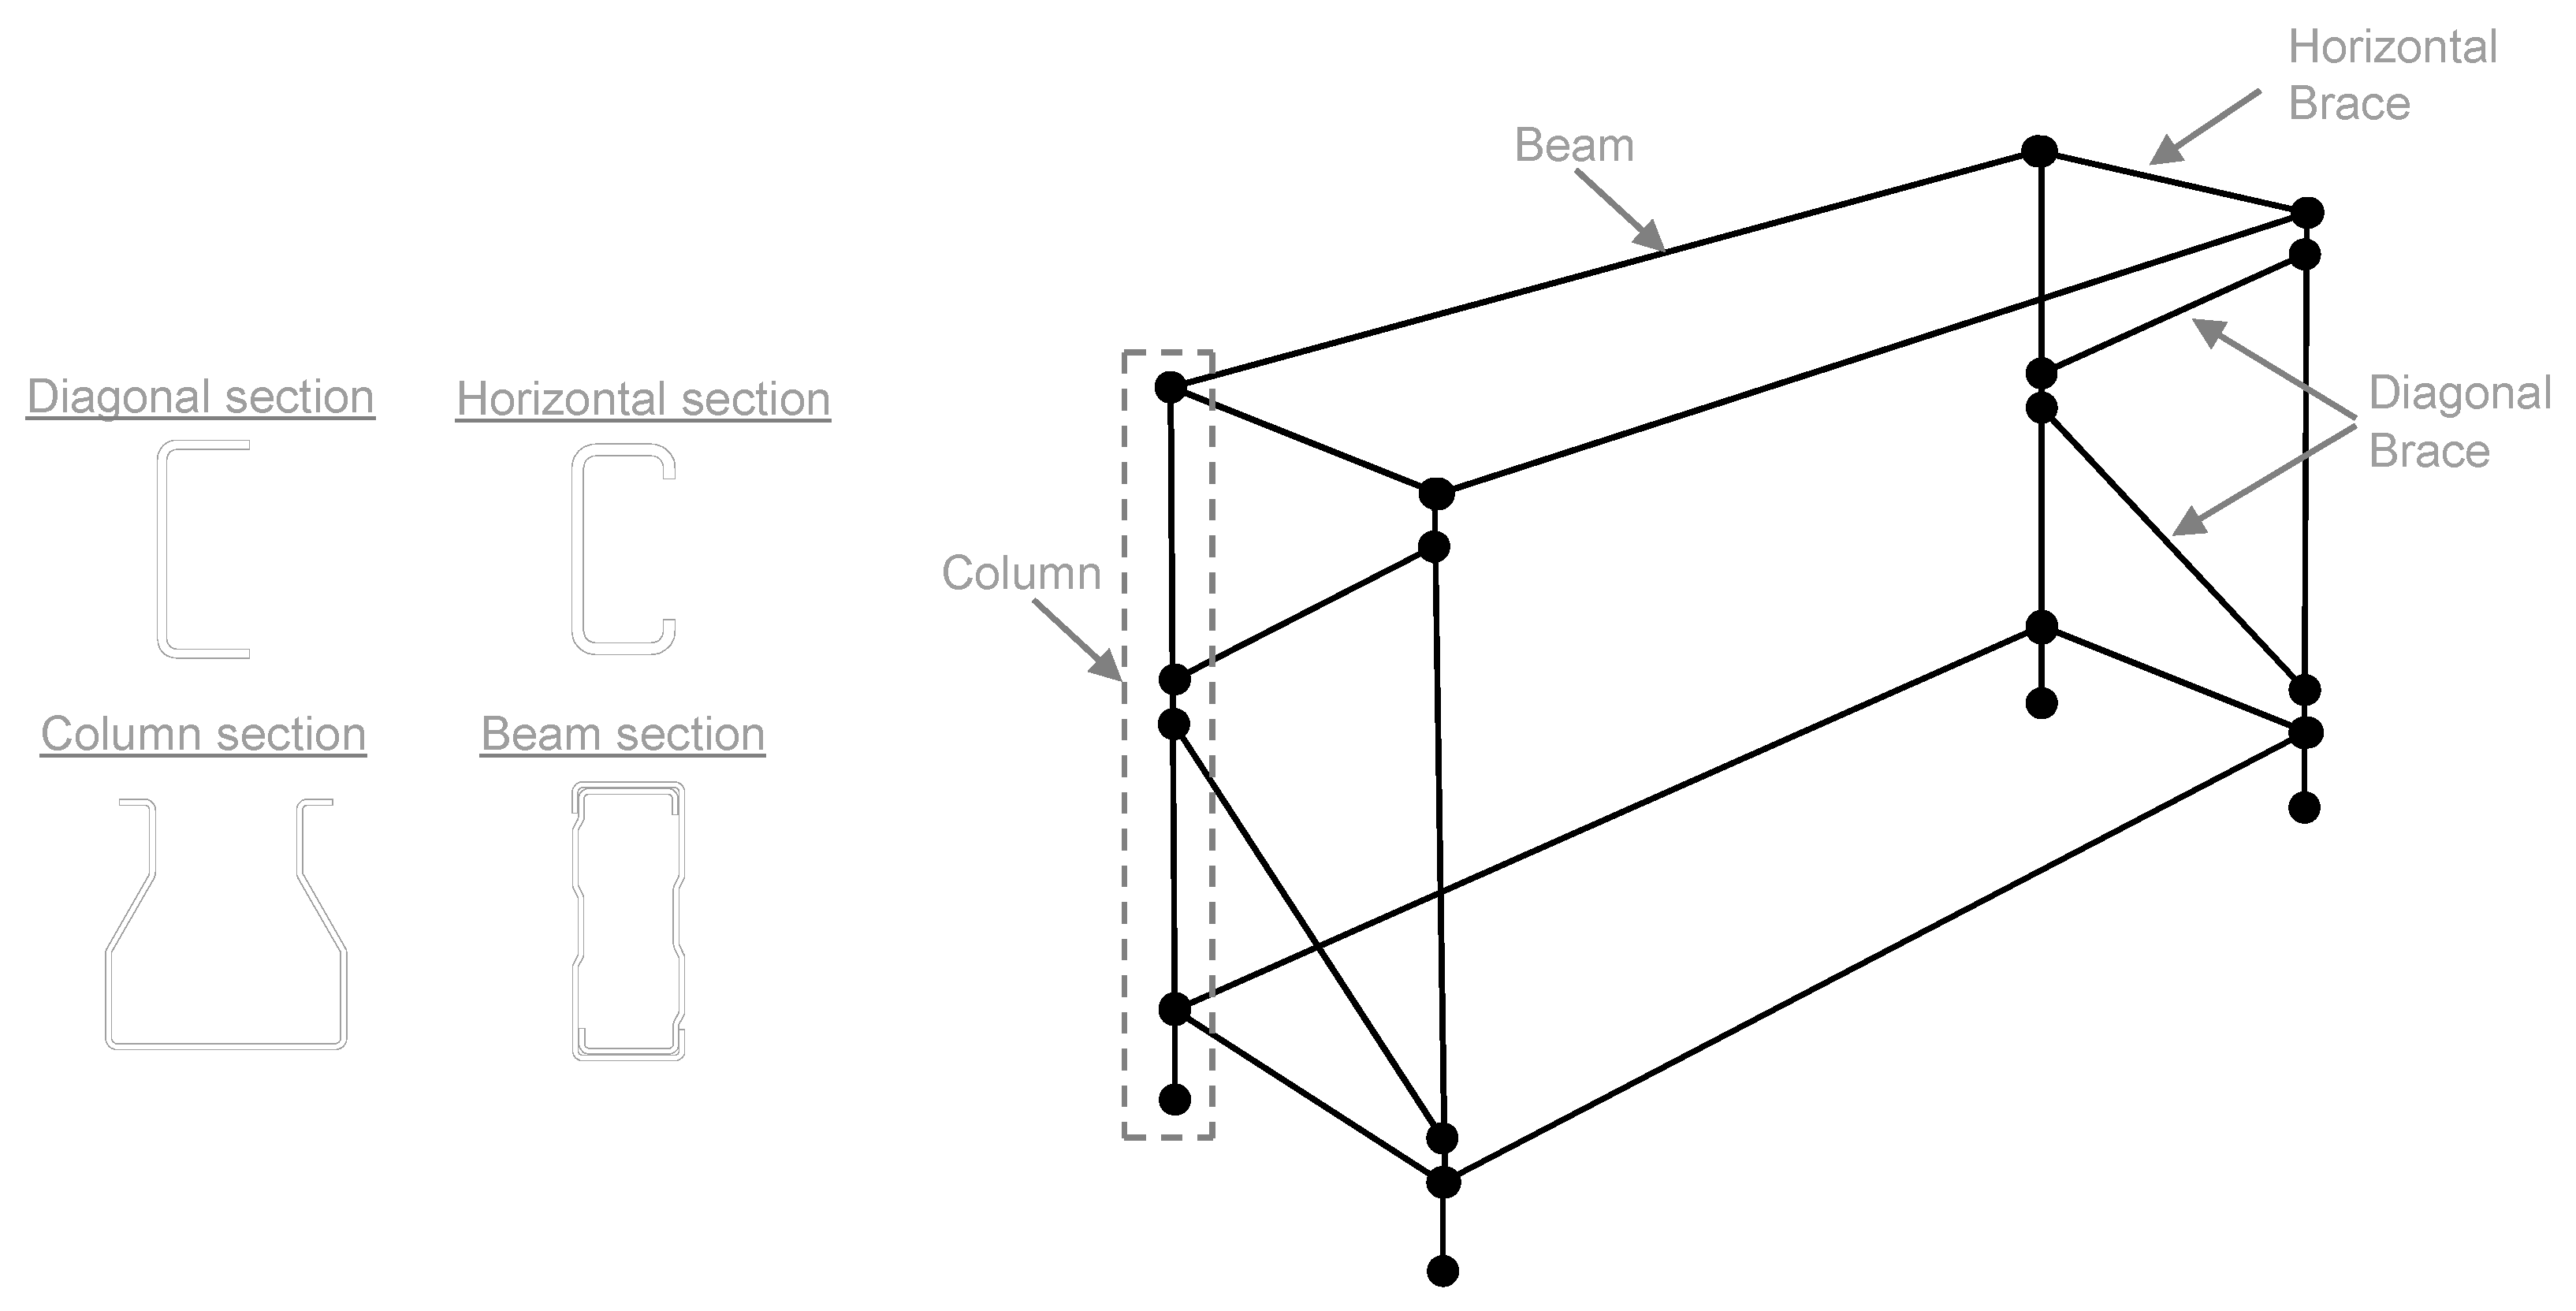
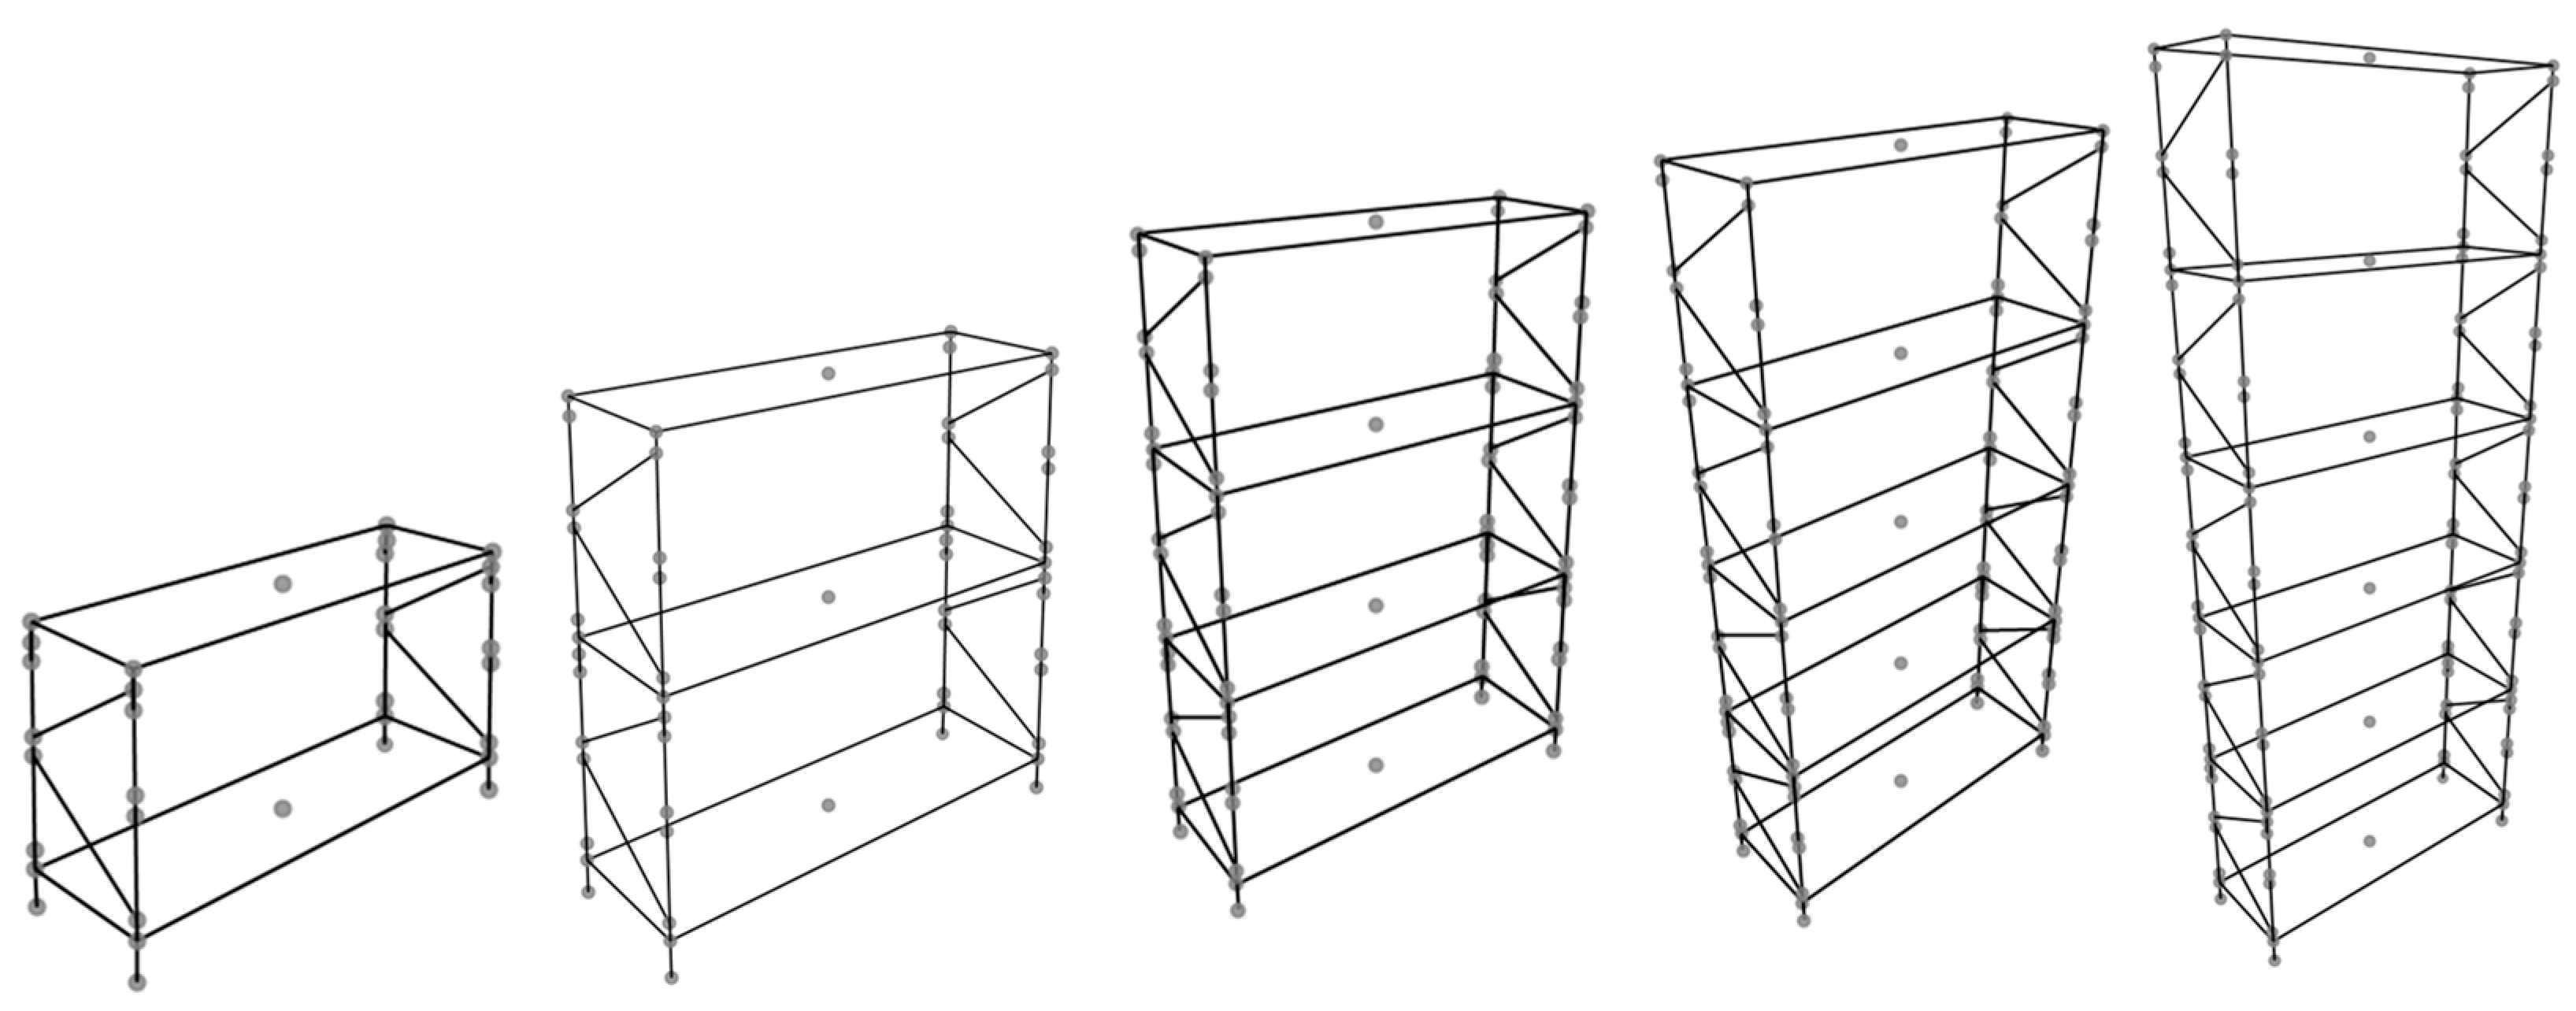
2.1. FBR Model Description

The schematic model of the selective rack typology analyzed is shown in Figure 1. In this research, the most common cross sections used for the structural elements were considered in the modeling [1,14,26,27,31,32]: TX 100 × 105 × 3, TC 100 × 50 × 2, CA 45 × 22 × 2 and C 58 × 22 × 2, for the column, beam, horizontal brace, and diagonal brace, respectively. Table 2 shows the properties of those element’s cross-sections.
In order to determine the response of these structures subjected to seismic action, a series of time–history analysis was performed. Then, through a GSA method, the parameters with the greatest influence on the maximum base shear load, floor drift and displacement of the top level of storage for the scenarios of FBR and BIR, were identified.
The structural models implemented for the FBR consider as input design parameters H, B and Nsl. The models of BIR consider, in addition to those previous mentioned, the parameters Tiso, Hiso and μ. The description and range of the parameters are shown in Table 2. In both models, FBR and BIR, the maximum values of base shear load, drift and displacement of the top level of storage were considered as target responses (Figure 2).
Due to the high computational cost required to analyze the influence of all combinations of possible values of the input design parameters, the Latin Hypercube Sampling (LHS) method was used. This method is more efficient in terms of speed, coverage of the sample space and computational cost than other sampling techniques such as Monte Carlo Sampling (MCS) [33]. Table 2 shows the ranges of the parameters used in the parametric analysis.
The material considered in the ball joint at the base of the BIKD was steel, for which a normal distribution was used in the friction coefficient (μ) with a mean of 0.5 and standard deviation of ±0.1 [34]. In the other parameters (Table 2) a uniform distribution was used since all the values within the defined range had the same probability of occurrence. The parameter Nsl directly modifies the formulation of the structural model because it is related to the number of elements in the analysis cases (Figure 3).

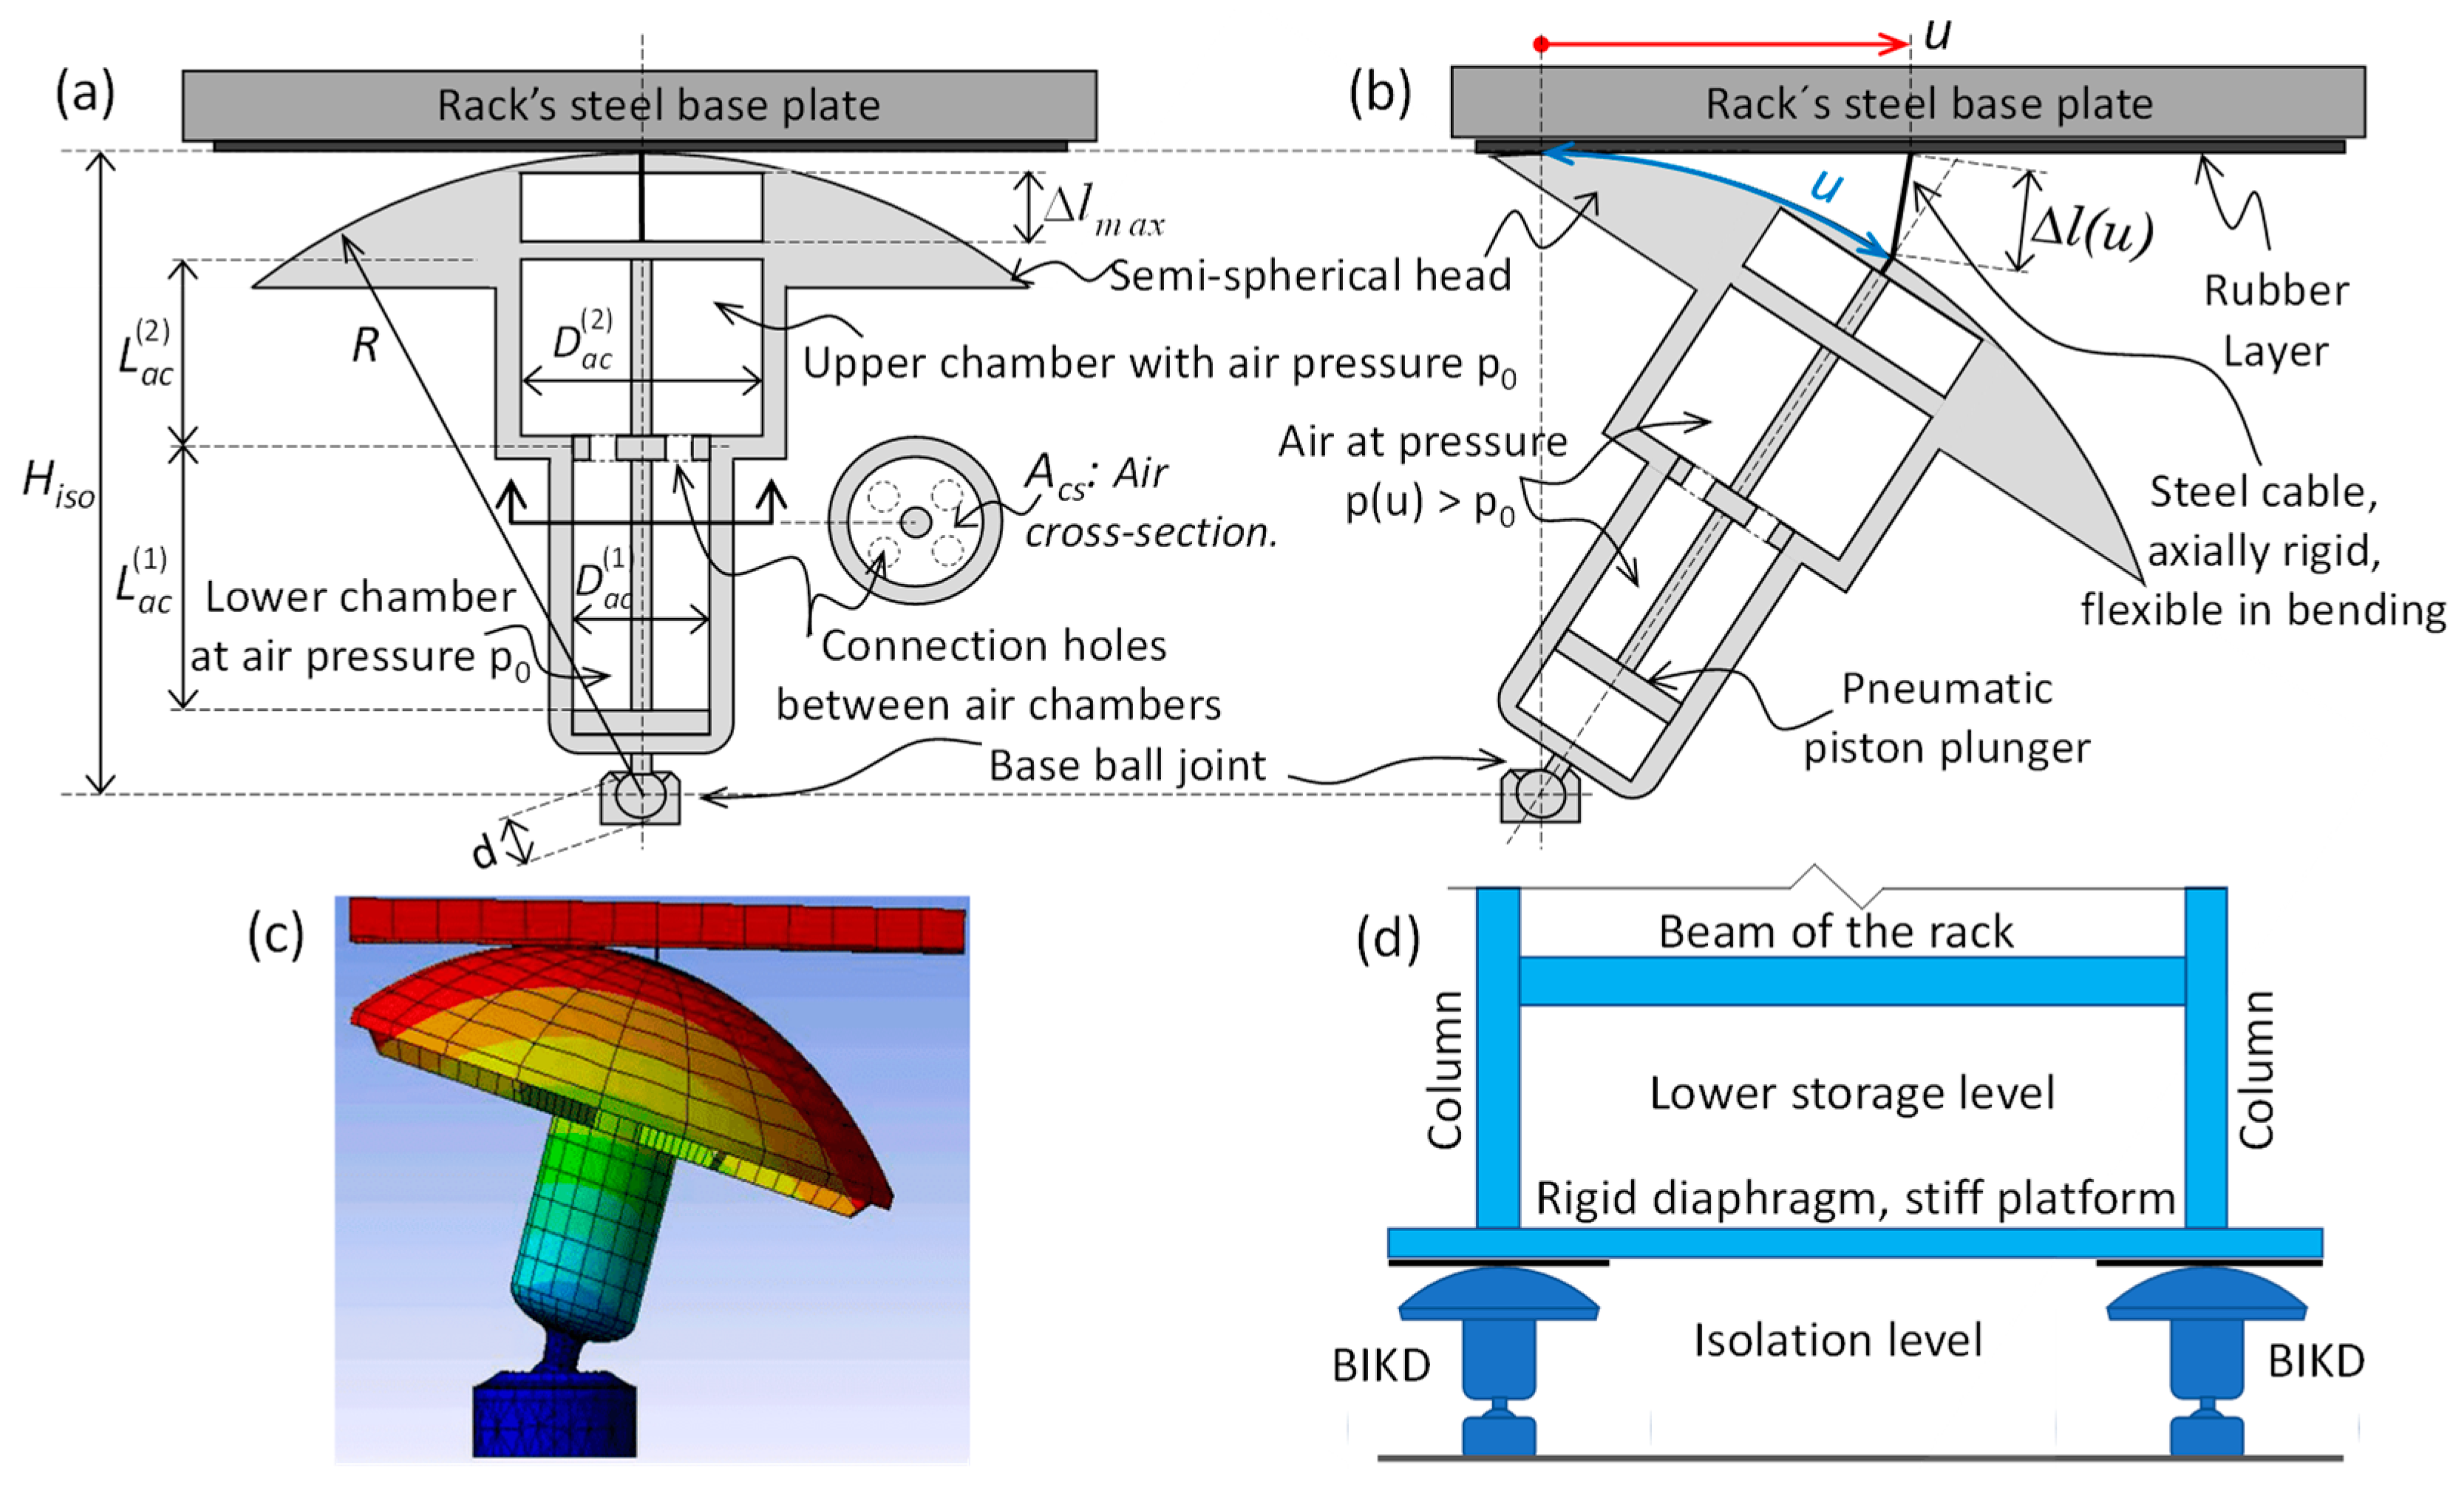
2.2. BIR Kinematic Device

The BIKD used in the modeling, links the superstructure with the substructure through a pivoted mechanism at its base (Figure 4). This device is vertically very rigid and the rotation with respect to its support at the base allows lateral displacement relative to the ground of the superstructure that rolls on it. It has an axially inextensible cable, which links the elastic element inside the isolator with the superstructure through a post-tensioning load and helps prevent it from up-lifting. The friction in the ball joint at the base of the BIKD’s support allows energy dissipation, due to the work between rotation and friction, which is proportional to the weight of the structure. The energy dissipation depends on the diameter of that ball joint and the type of materials in contact, since they modify the coefficient of friction and its effect on the lateral balance of the isolator [13].
The Figure 4 shows the diagram of the isolator, used with a compressed pneumatic piston as the elastic element. It is important to note that in this figure, two cylinders with different diameters are considered; this is not the case of this investigation where a cylinder with a constant diameter was considered, i.e., D e c ( 1 ) = D e c ( 2 ) in Figure 4.
In this research, the condition in which the isolator’s radius of curvature is constant and equal to its height was used (H = R in Figure 4a). In this way, the weight of the structure did not interact with the lateral stiffness of the BIKD, since the vertical projection of the contact point between the isolator and the superstructure passed through the center of the ball joint at the basal pivot (Figure 4b). Due to the above, the weight of the structure did not affect the lateral balance of the BIKD, because the eccentricity of that force was zero. Therefore, the lateral stiffness was determined only by the tension of the post-tensioned internal element and its stiffness [13].
Maureira-Carsalade et al. [13] have presented a detailed description of the conceptual development of the BIKD and the equations that govern its mechanical behavior. In the present paper, the authors describe the equations under the conditions in which the radius of curvature ( R ) is constant and equal to its height (Hiso). The reaction of the isolator against the superstructure (Fs) is given by Equation (1):
F s = T ( u ) H i s o   u + ( d 2 ) H i s o P e   μ   s i g n ( u ˙ )
The elongation Δl of the elastic element (the pneumatic piston in this case) that works in series with the cable connecting the isolator to the superstructure conditions the tension T(u), then both are defined by:
Δ l ( u ) = 1 2 R ( 1 + 1 36 ( u H i s o ) 2 ) ( u H i s o ) 2
T ( u ) = T o ( L a c L a c Δ l ( u )   )
where, To is the initial tension of the cable; T(u) is the tension of the cable due to a lateral displacement u; Pe is the vertical load of the superstructure against the BIKD, Pe = W + T(u), and W is the static weight of the structure transmitted to the BIKD, and the other parameters are defined in Table 2.
The BIKD used in the analyzes could resist up-lifting as long as the tensile load on the device was less than the tension of the post-tensioned elastic element inside T(u), according to Equation (3). This tensile strength was proportional to the lateral stiffness of the device, as observed in the first term of Equation (1). That is, the shorter the isolation period, the higher the isolator’s tensile strength and vice versa. This was consistent with the risk of up-lift in the isolation level, due to seismic loading. This was because short isolation periods generated less decoupling of the structure from the ground. This increased the risk of up-lifting, as did the tensile strength of the BIKD. However, in this research, the range of isolation periods was chosen between 3 and 5 s (Table 2). This was done in order to fit within the spectrum displacement zone, while ensuring better rack decoupling when using isolation. Due to the above, up-lift was not detected in any of the cases where base isolation was analyzed.

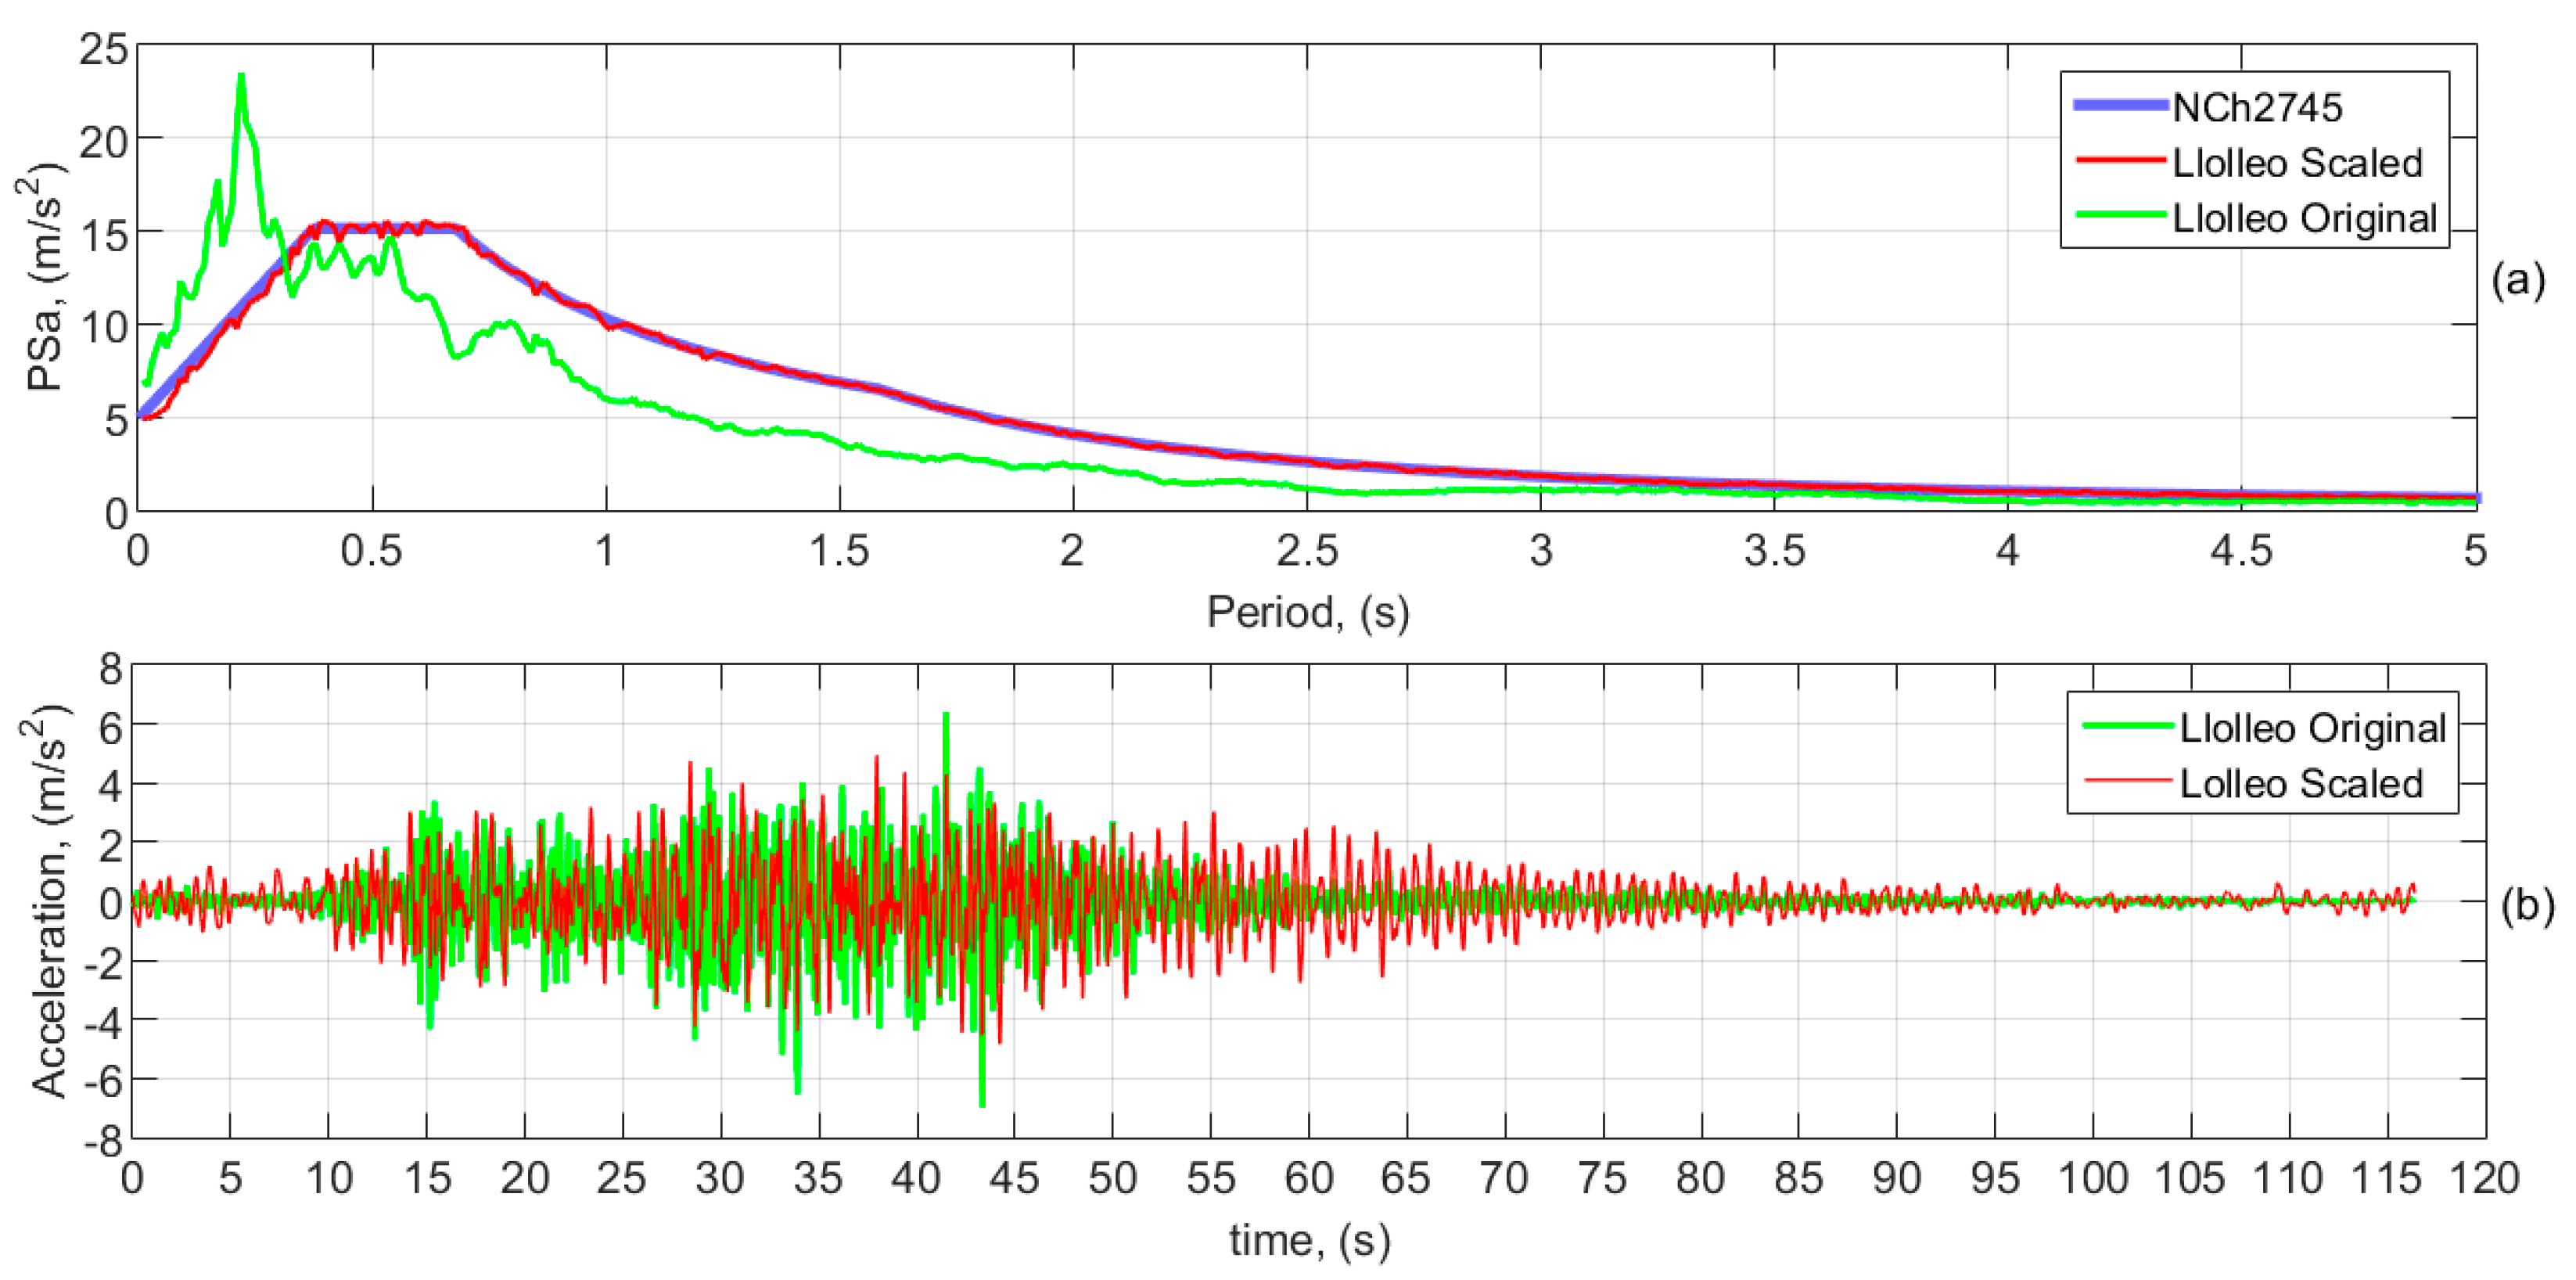
2.3. Time–History Analysis
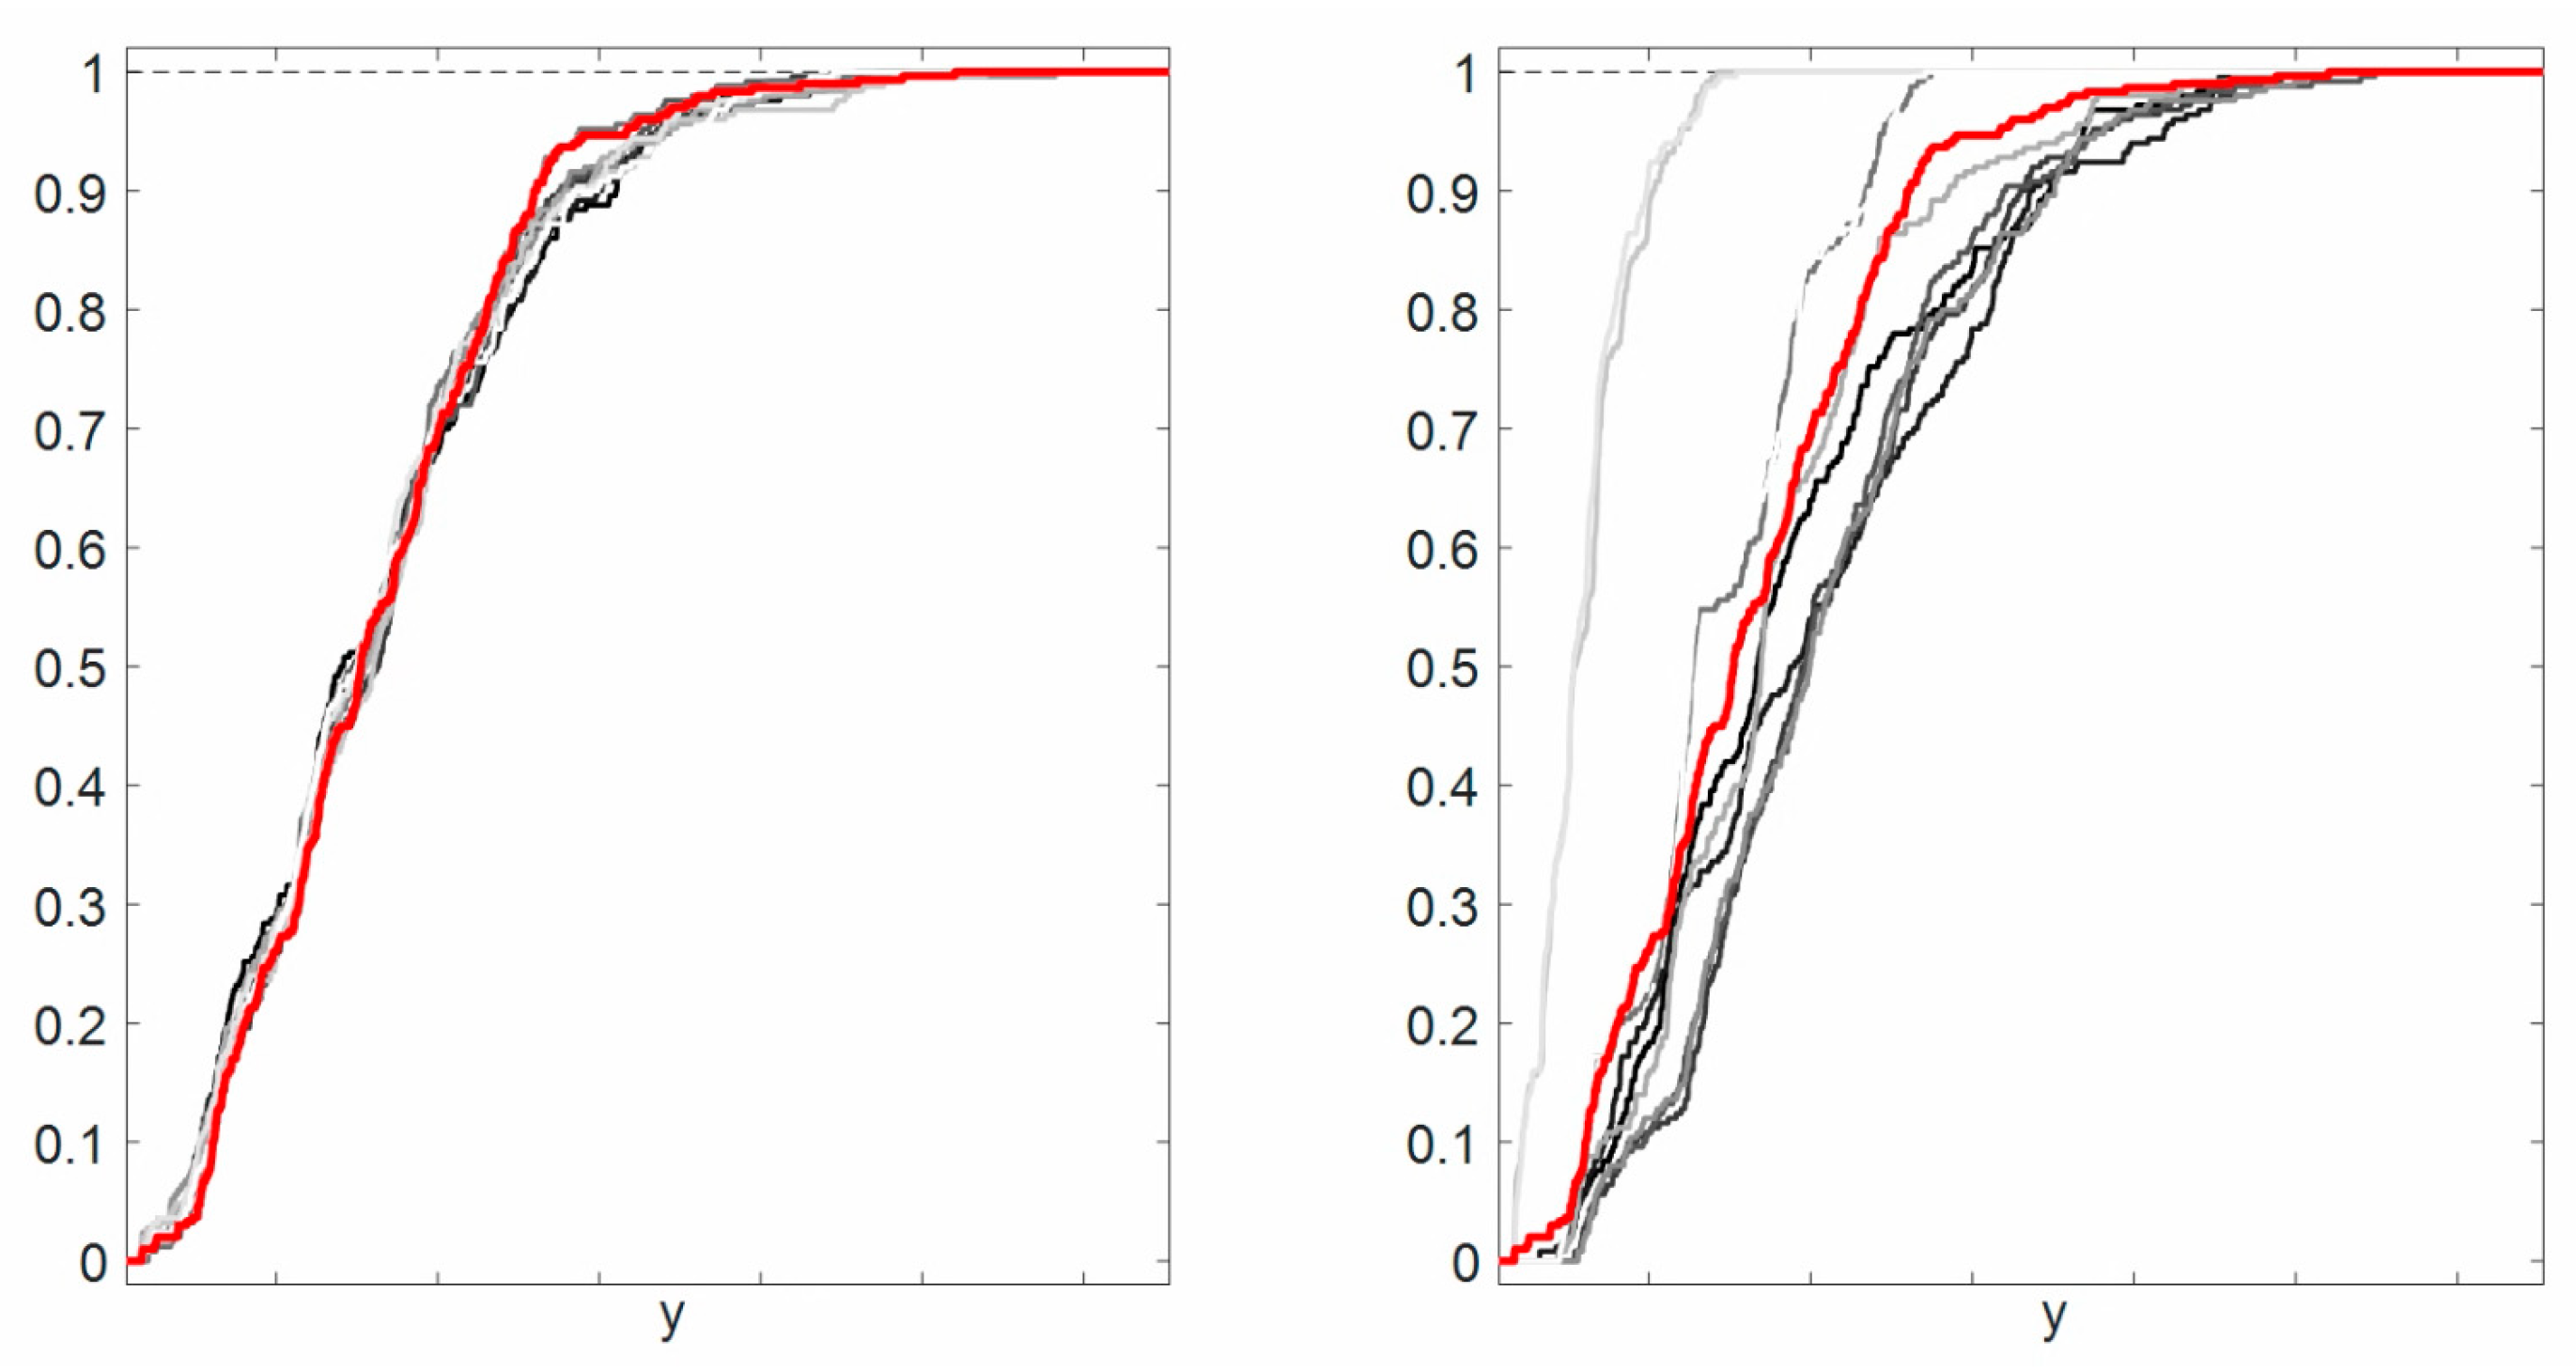
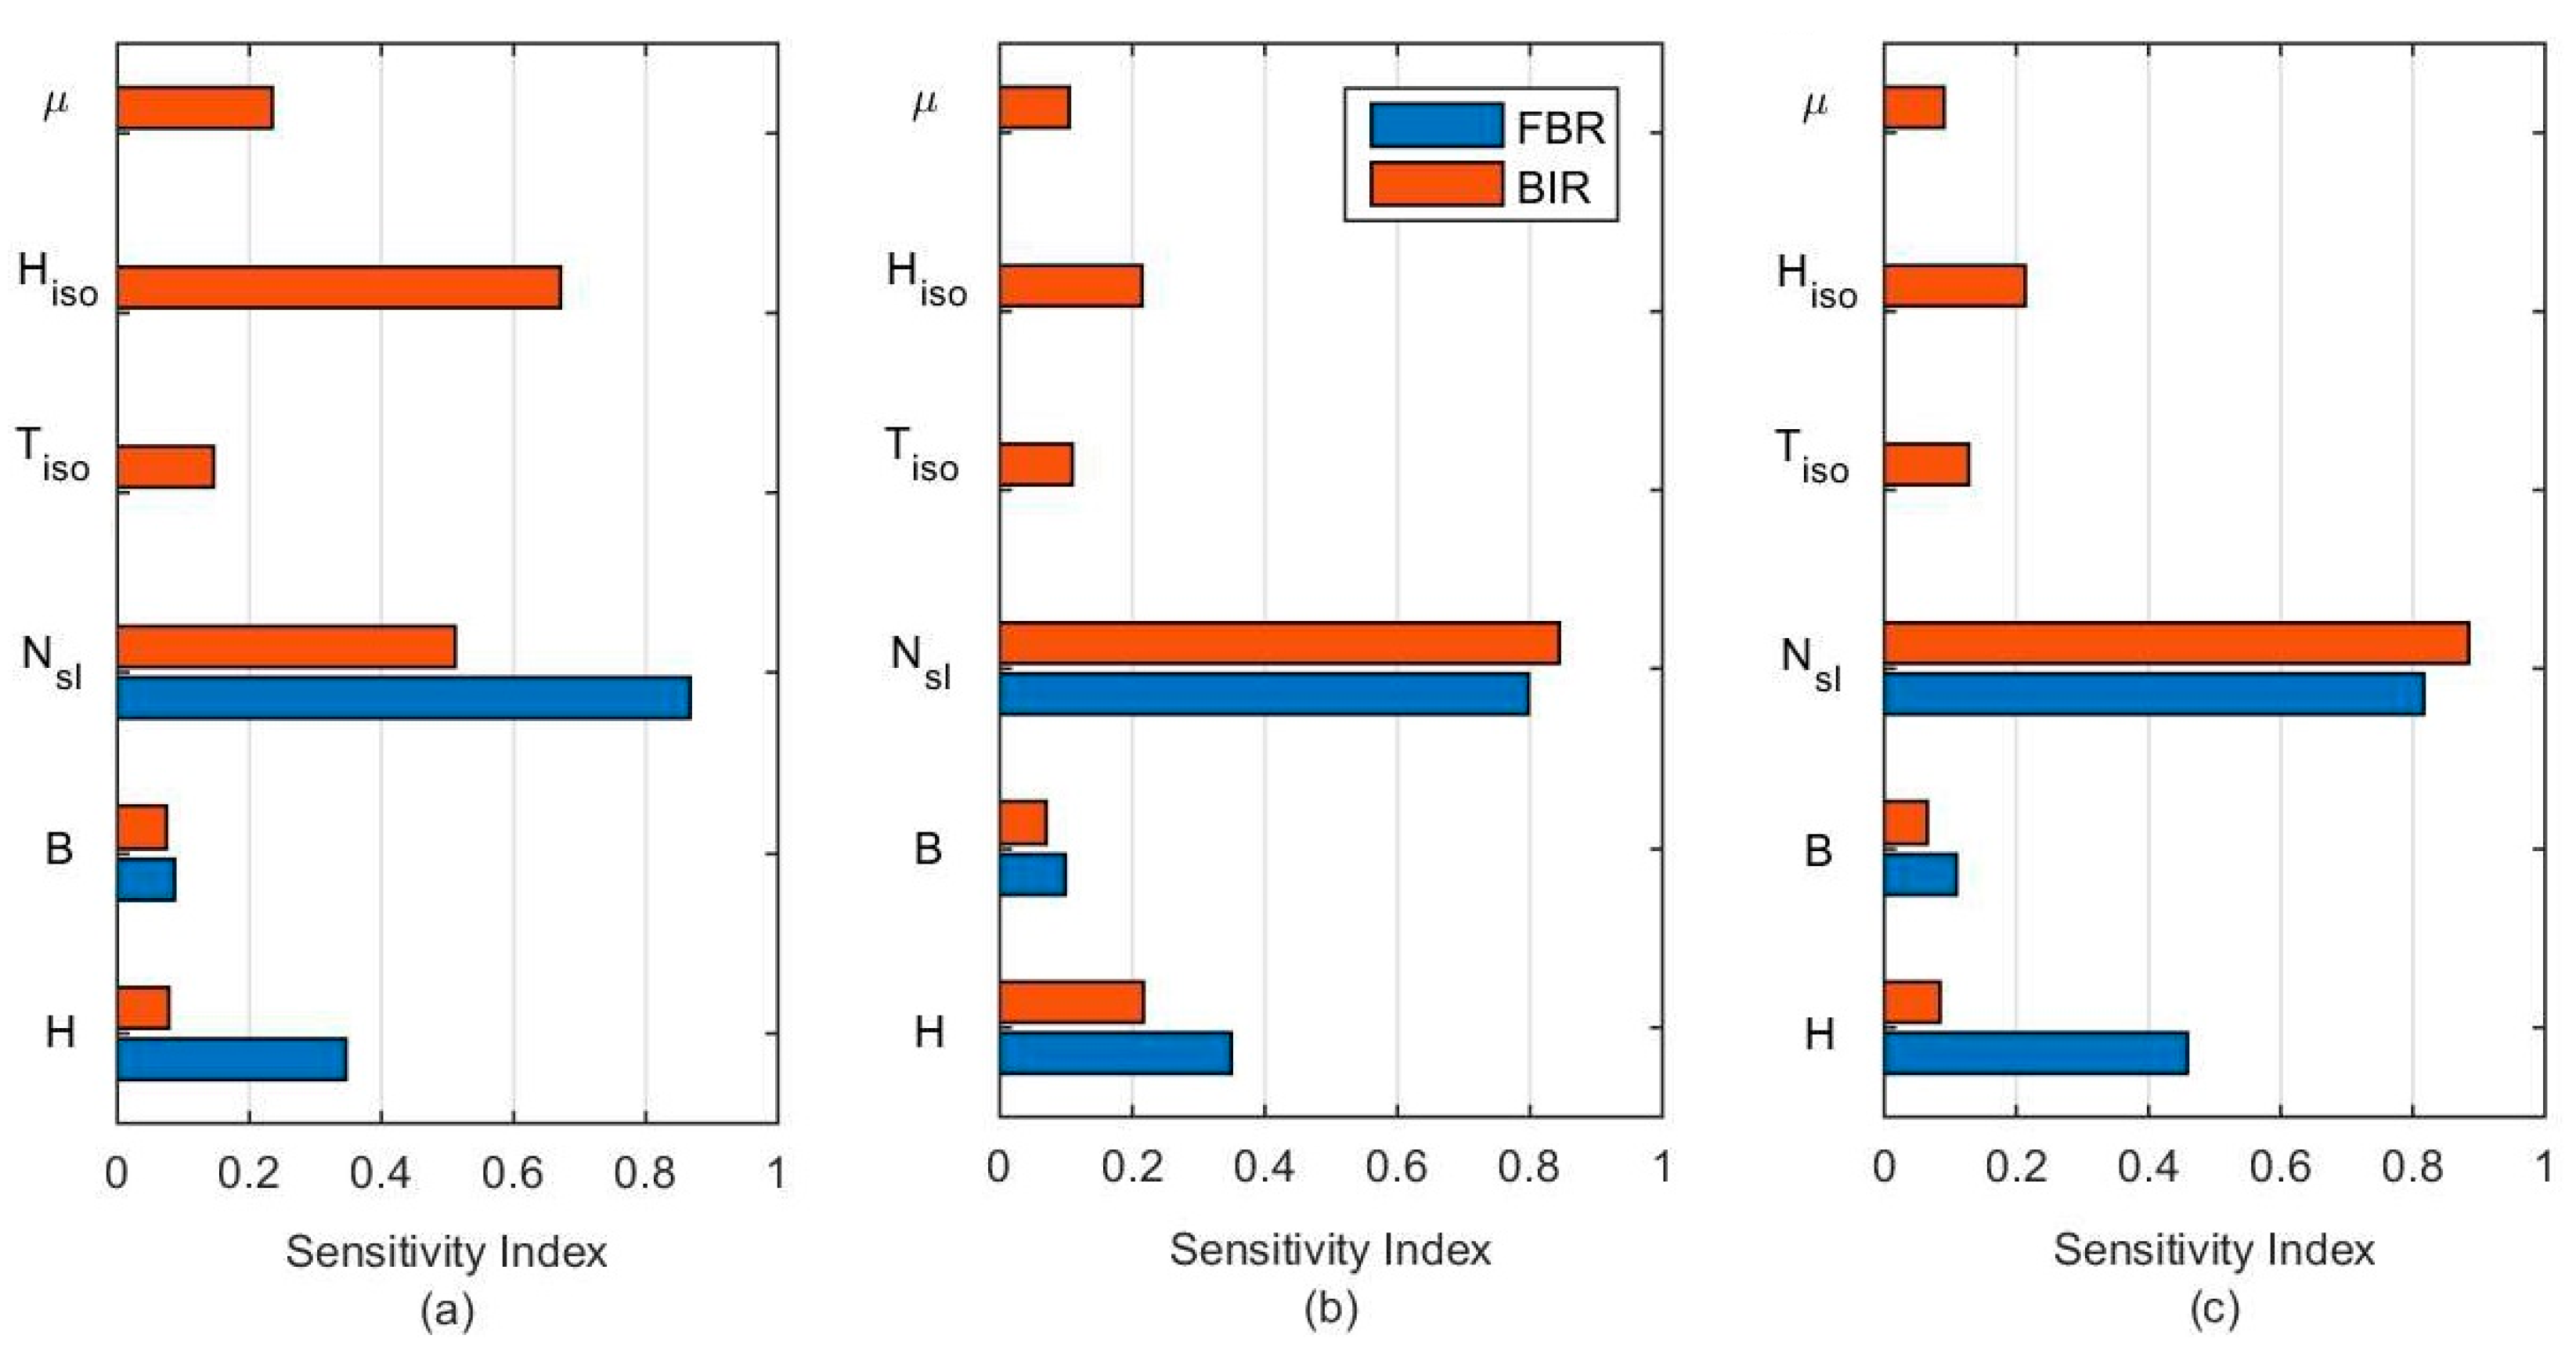
Time–history is a step-by-step dynamic structural analysis, in which a numerical model is subjected to the action of forcing, varying over time. This analysis seeks to reproduce the response of the structure to dynamic excitations such as earthquakes.
The models of FBR and BIR, with all the combinations of structural parameters selected in the statistical sampling, were subjected to a time-history analysis with seismic forcing. The record of the Llolleo earthquake of 3 March 1985, Chile, was used as external forcing. The event had a magnitude of 8.0 Mw and a peak ground acceleration (PGA) of 0.712 g. This was one of the most severe seismic events in central Chile, the most densely populated area of the country. Álvarez et al. [14] justify that it is acceptable to use only one seismic record in the dynamic analyzes, when said record has been scaled in the frequency domain to make its response spectrum fit with the design spectrum of any standard or design code. This is because within the range of 0.1 s to 10 s, it is possible to excite virtually any civil structure, achieving a good fit of the response spectrum of the scaled register with any spectrum of design of structures. Considering the above, only one Chilean seismic record, measured both in a high-risk seismic zone and on firm ground, can be scaled to a single target spectrum. The response of a linear system of 1 DoF, subjected to either of the two scaled registers will be virtually the same. Therefore, the results shown here are not only relevant to the particular earthquake used, but in line with the normative demand and the multiple sensitivity analysis cases considered.
The N10E component of the Llolleo record was scaled in the frequency domain to make its response spectrum match the NCh2745 design spectrum [35]. This spectrum was calculated considering the most demanding conditions, i.e., seismic zone 3 and type of soil III, building category B and 5% critical damping. Figure 5a shows the response spectrum of the Llolleo seismic record unmodified (original) and scaled in the frequency domain, together with the NCh2745 design spectrum considered as a seismic demand reference. Figure 5b shows the Llolleo seismic record unmodified (original) and scaled, plotted in the time domain.
The scaling of the register shown in Figure 5a allows the adjustment of its response spectrum with the design spectrum that establishes the regulatory requirements for seismic forcing. In this figure, it can be observed that for periods greater than 0.3 s, the design spectrum exceeds the response spectrum of the original record. This is conservative as it means that the demand for the scaled record will be greater than the original record for that range. However, as seen in Figure 5b, despite the great difference between the response spectra of the original and scaled response spectra, the time series of both seismic records are not that different.

2.4. PAWN Method

One of the advantages of the PAWN method is that the sensitivity indices derived from its application are independent of the probability distribution function and the cumulative distribution function. Therefore, they do not use a specific moment of output distribution to characterize the uncertainty, making them applicable regardless of the shape of the distribution.
PAWN uses density-based sensitivity indices, which are “moment-independent” indices because, by definition, they consider the entire probability distribution of the output rather than just one part of it [16]. The advantage of PAWN over other “independent-moment” methods is that it characterizes the output distributions by their cumulative distribution functions rather than their probability density functions, which makes PAWN easier to implement [36]. PAWN has the common use of the cumulative distribution function (CDF) with regional sensitivity analysis (RSA). However, it is very different in terms of the methods and purposes by which CDF is applied. The RSA considers variations in the CDF of the inputs, whereas PAWN considers variations in the CDF of the output. In RSA, the focus is on the input space and how the input distributions vary by conditioning the output. In contrast, the focus in PAWN is on the output and how the output distribution varies when an input is conditioned. With respect to variance-based sensitivity analysis indices, the main advantage of PAWN is that it can be applied regardless of the type of output distribution [16]. In contrast, in other SA methods (e.g., Sobol’s method, [37]), if the output distribution is multimodal or if it is highly skewed, the use of variance as a proxy for uncertainty can lead to contradictory results [22,38].
In order to identify the design parameters of the FBR and BIR with the greatest influence on the maximum responses of drift, displacement of the top storage level, and base shear load, the PAWN global sensitivity analysis method was used. This method generates a prioritization of the input parameters, quantitatively determining which parameters are the most influential in the model outputs by means of a sensitivity index Ti. This index is not conditioned to any assumed input value, because the dependence of the Kolmogorov-Smirnov statistic [39,40] on the value of xi is eliminated by the statistic on xi, as can be seen in Equation (4).
PAWN performs a sensitivity analysis of a model by characterizing the distribution of outputs by its CDF. The method measures the sensitivity of a parameter xi as the distance between the unconditional probability distribution of the output variable, Y , which is obtained when all inputs vary simultaneously, and the conditional distributions obtained by varying all inputs except x i [16]. To measure the distance between unconditional and conditional CDFs, the Kolmogorov-Smirnov statistic is used [39,40]:
K S ( x i ) = max y | F y ( y ) F y | x i ( y ) |
where, the unconditional CDF of the output Y is called F y ( y ) , and the conditional CDF when x i is set is called F y | x i ( y ) . Since F y | x i ( y ) explains what happens when variability due to x i is removed, the difference between this and F y ( y ) provides a measure of the effects of x i on Y . The limiting case occurs when F y | x i ( y ) coincides with F y ( y ) . In this case, it is deduced that by eliminating the uncertainty on x i , the output distribution is not affected, and it can be concluded that x i has no influence on Y (e.g., see Figure 6 left). On the other hand, if the difference between F y | x i ( y ) and F y ( y ) increases, the influence of x i also increases, which indicates that it is a conditional CDF, as seen in Figure 6 on the right.
Since KS (Equation (4)) depends on the value at which x i was set, the PAWN index, T i , considers a statistic (e.g., the maximum or the median) on all possible values of x i , that is:
T i = stat x i [ K S ( x i ) ]
where, T i varies between 0 and 1. The smaller the value of T i , the less influence x i has on the output. If T i = 0 , then x i has no influence on the output Y .
In this paper, a total of 6000 and 12,250 simulations were performed for the models of the FBR and BIR, respectively. The difference between the total simulation of both models was rooted in the number of input parameters that each model had. Pianosi et al. [17] recommend that the number of simulations be greater than 1000∙M, where M is the number of input parameters. However, for both types of structural model, convergence occurred for fewer simulations than Pianosi’s recommendation.

3. Results and Discussion

A comparison of the target responses (i.e., maximum base shear load, drift and displacement of the top storage level) was made for FBR and BIR.
Additionally, the maximum base shear load, Q 0 m a x , was normalized with respect to the seismic weight ( P s ) of each structure to obtain the maximum normalized base shear load, Q ^ 0 m a x = Q 0 m a x / P s . This was done in order to compare the results between racks with a different number of storage levels, independent of their masses. This is in addition to obtaining a “kind of seismic coefficient” (considering a coefficient of importance equal to 1), to compare it with the minimum seismic coefficient ( C m i n = 0.25 ( A 0 / g ) ) of NCh2369 [41]. This standard currently governs the seismic design of industrial structures, including racks. The comparison of the Q ^ 0 m a x with the C m i n is due to the fact that very flexible structures (such as those with base isolation) have very long fundamental periods and, therefore, they are in the displacement zone of the design spectrum. This means that its design is conditioned by the minimum base shear load of the corresponding regulation.

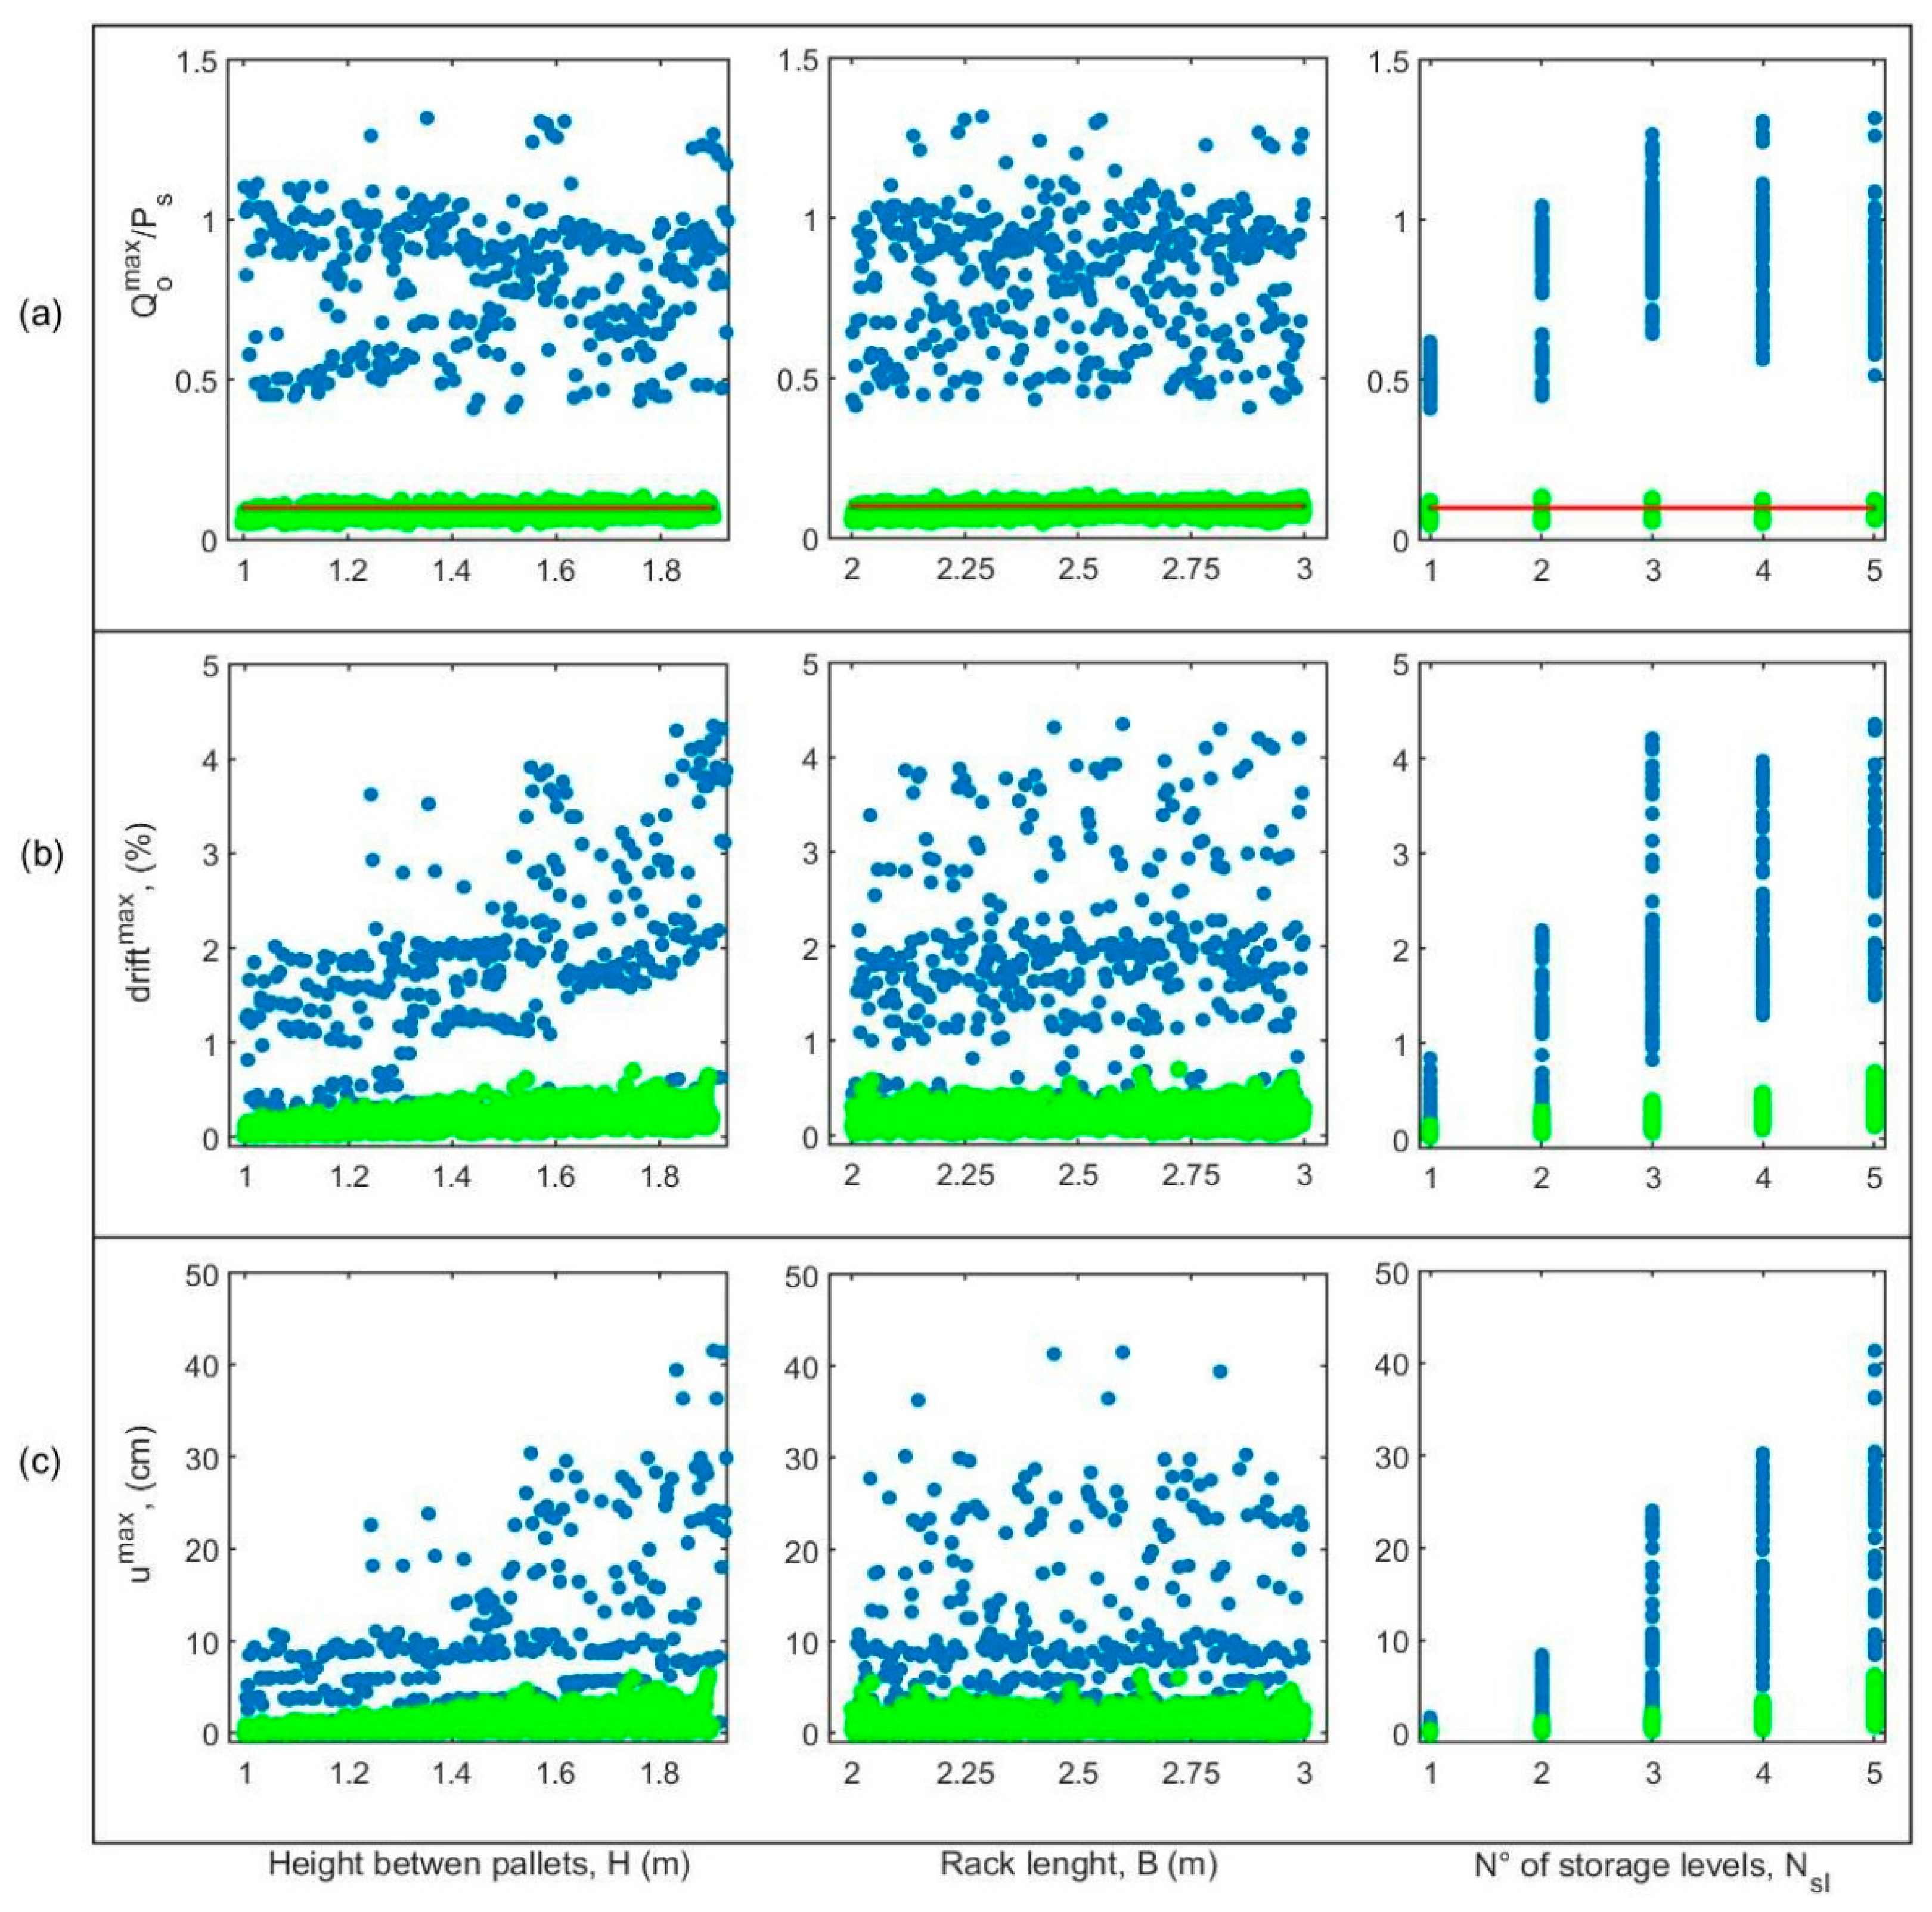
3.1. Target Responses of FBR and BIR

Figure 7 and Figure 8 show the results of the target responses: maximum base shear load ( Q o m á x ) normalized by the seismic weight ( P s ), maximum drift and maximum displacement of the top storage level, for all FBR and BIR analyzed. Figure 7a,d,g and Figure 8a,d,g of both figures show the scatter plot. Figure 7c,f,i and Figure 8c,f,i show the output response of the unconditional and conditional cumulative distribution curves (CDF) when setting a parameter xi. Figure 7b,e,h and Figure 8b,e,h show the Kolmogorov-Smirnov (KS) statistic. The value of KS corresponds to the maximum difference in the vertical axis between the conditional and unconditional CDFs for the output variables, where random values of the input parameter are set. In these figures, circles of various gray colors are observed in the KS statistic, whereas in the CDFs these are represented by lines with the same color. The variation of the gray colors corresponds to the number of conditioning points of a certain input parameter. In other words, they represent all the set values of the parameters. In this way, by setting the input parameter to a certain value, it is possible to explain what happens when the variability of said parameter is eliminated.
As mentioned in Section 2.4, the influence of the parameters on the target response in the conditional and unconditional CDF graphics (Figure 6), is represented by how far the conditional CDFs (gray lines) are from the unconditional CDFs (red lines). For the parameters that were not influencing the response, it was observed that their conditional CDFs tended to overlap with the unconditional CDFs. The above suggests that the particular response of the model was insensitive to these parameters. This can be corroborated with the KS statistic in Figure 7 and Figure 8. In Figure 7b,c, it can be observed that in BIR, the parameter that had the greatest influence on the maximum normalized base shear load ( Q ^ o m á x ) was the height of the BIKD ( H i s o ). Whereas in rows of Figure 7e,f,h,i and Figure 8e,f,h,i, it can be observed that the parameters with the greatest influence on the maximum drift and displacement were N s l and H . The influence of H i s o in the response Q ^ o m á x corroborates with the scatter plot of Figure 7a. The relationship between this parameter and Q ^ o m á x is explained by the fact that H i s o is related to a variation in the lateral stiffness of the BIKD, particularly for large displacements. The lower the parameter, the greater the u/Hiso ratio, and the greater the elongation of the elastic element Δl inside the BIKD—Equation (2)—for the same lateral displacement u. Due to the above, the tangent stiffness of the BIKD—term T(u)/Hiso in Equation (1)—grew at a higher rate as the lateral displacement u increases. This is so because when the BIKD had a low height, the tension of the elastic element T(u)—Equation (3)—grew at a higher rate as u increased, than in the case when the height was large. Therefore, with a higher the value of H i s o , the lateral stiffness of the BIKD was practically constant, whereas for low values of this parameter an increase in the tangent lateral stiffness of the BIKD was observed as the lateral displacement increased. From the results shown in Figure 7a, it can be observed that in a range of H i s o approximately between 0.3 m and 0.5 m there was a significant variation in the response Q ^ o m á x . However, for values greater than 0.5 m the response tended to be constant. The value of Q ^ o m á x was lower for values of H i s o > 0.5 m because the BIKD does not stiffen due to the large lateral displacements, which resulted in a lower demand for base shear load compared with the case with 0.3 m < H i s o < 0.5 m.
The parameters N s l and H had the greatest influence on the maximum values of the drift and displacement of the top storage level of the rack (Figure 7e,f,h,i and Figure 8e,f,h,i). This is also observed in the scatter plot corresponding to rows of Figure 7d,g and Figure 8d,g, showing how the magnitude of the output variables increased as these parameters increased. The foregoing is explained due to the fact that by increasing either of these two parameters the structure became more slender and, therefore, more flexible and susceptible to greater displacement and deformation.
The foregoing is valid for both FBR and BIR, which indicates that flexibility in these types of structures is important to take into consideration in the design. The parameters that are related to flexibility require special attention, being the ones that have the most influence on the response of the system. In the case of the FBR, the are the parameters were Nsl and H. In the case of BIR, in addition to the previous parameters, Hiso was added, which is related to the flexibility of the isolation system. The fact that the parameter Tiso does not show relevant sensitivity in relation to the reduction in demand is highlighted, despite being a parameter directly related to the stiffness of the isolation system. This was due to the range of values considered for this parameter (Table 2). In this range, the structure was in the displacement zone of the design spectrum where the deformation demand was constant. This range was chosen to achieve the seismic isolation effect, due to the great flexibility of the racks considered in the analyzes.
When observing the results shown in the bands of Figure 7d,g, a tendency to the reduce the floor drifts and the displacement of the isolation level was observed when increasing the Hiso. This was because the isolation system became more flexible (as evidenced in Equation (1)). With the above, the fundamental period of the structure moved to the right of the spectrum (Figure 5a) causing the demand for spectral acceleration to decrease.
In Figure 7d,g and Figure 8d,g, marked increases are observed in the corresponding responses for high values of the parameter H, with respect to low values of it. This is because as H increased, the superstructure became more flexible. This was also reflected in the sensitivity of this parameter in both FBRs and BIRs. This parameter is also related to the stability of the structure, since the higher H was, the less stable the structure was, accentuating the displacements due to second-order effects.

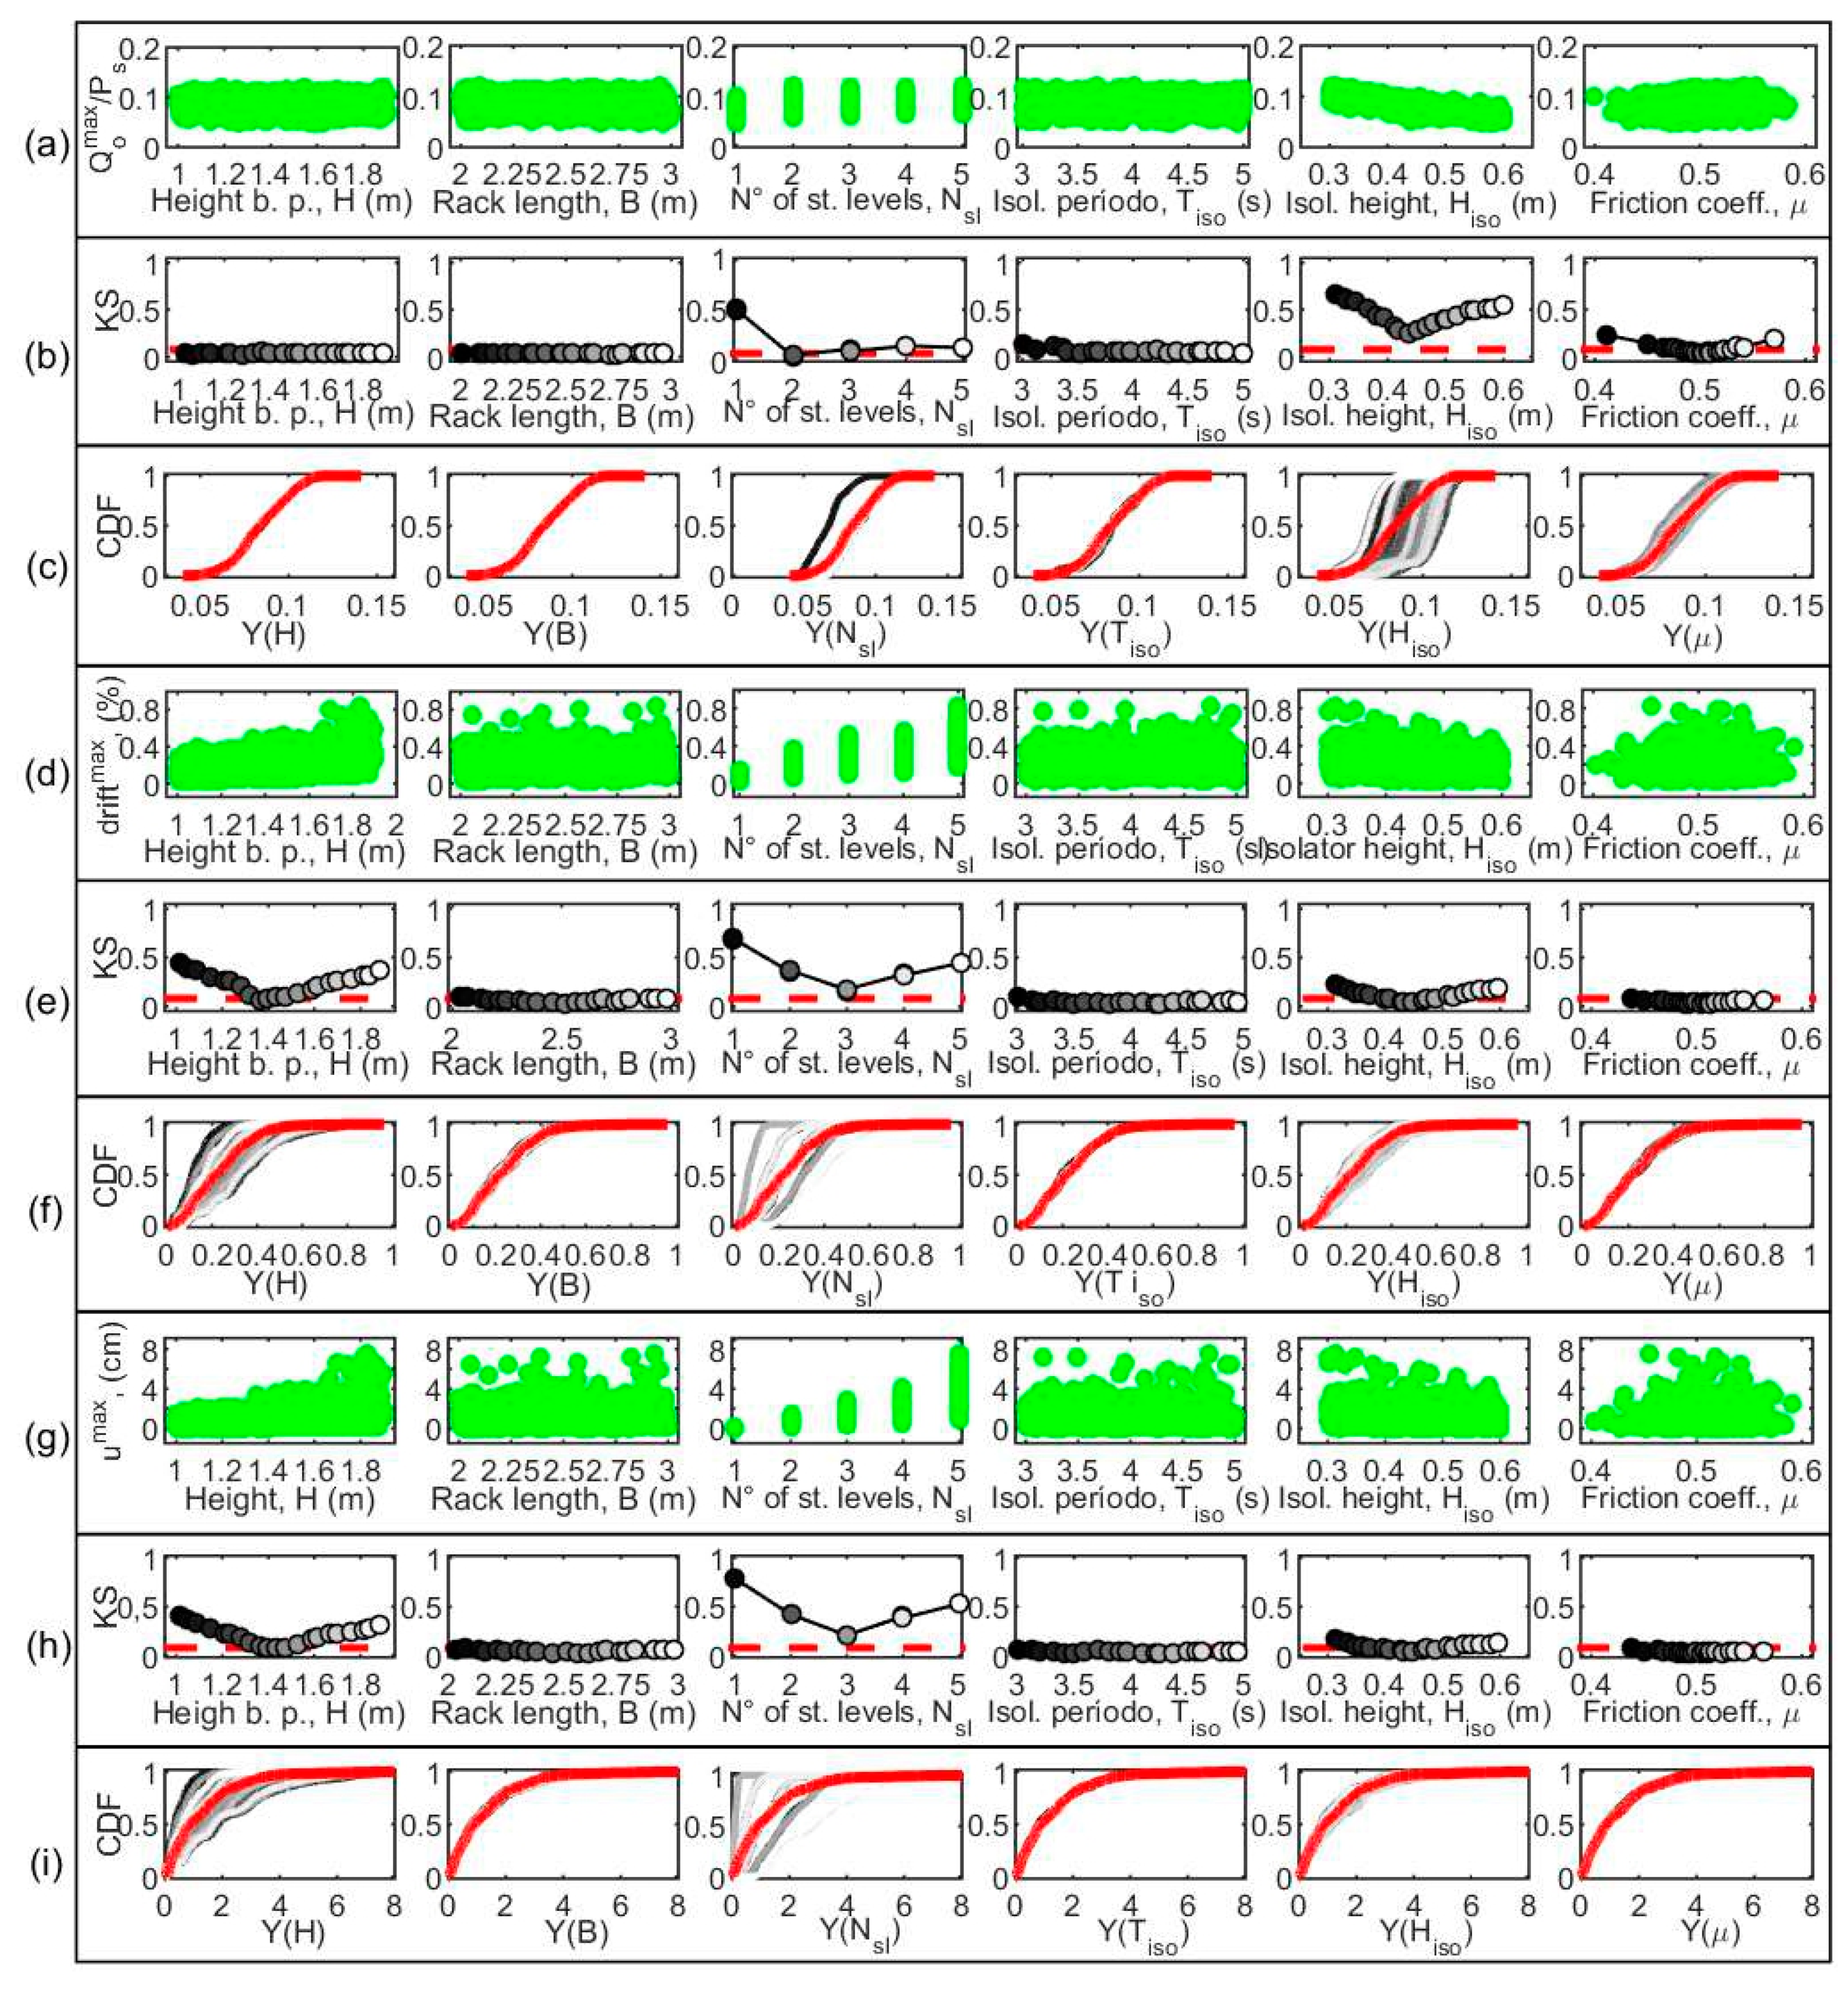
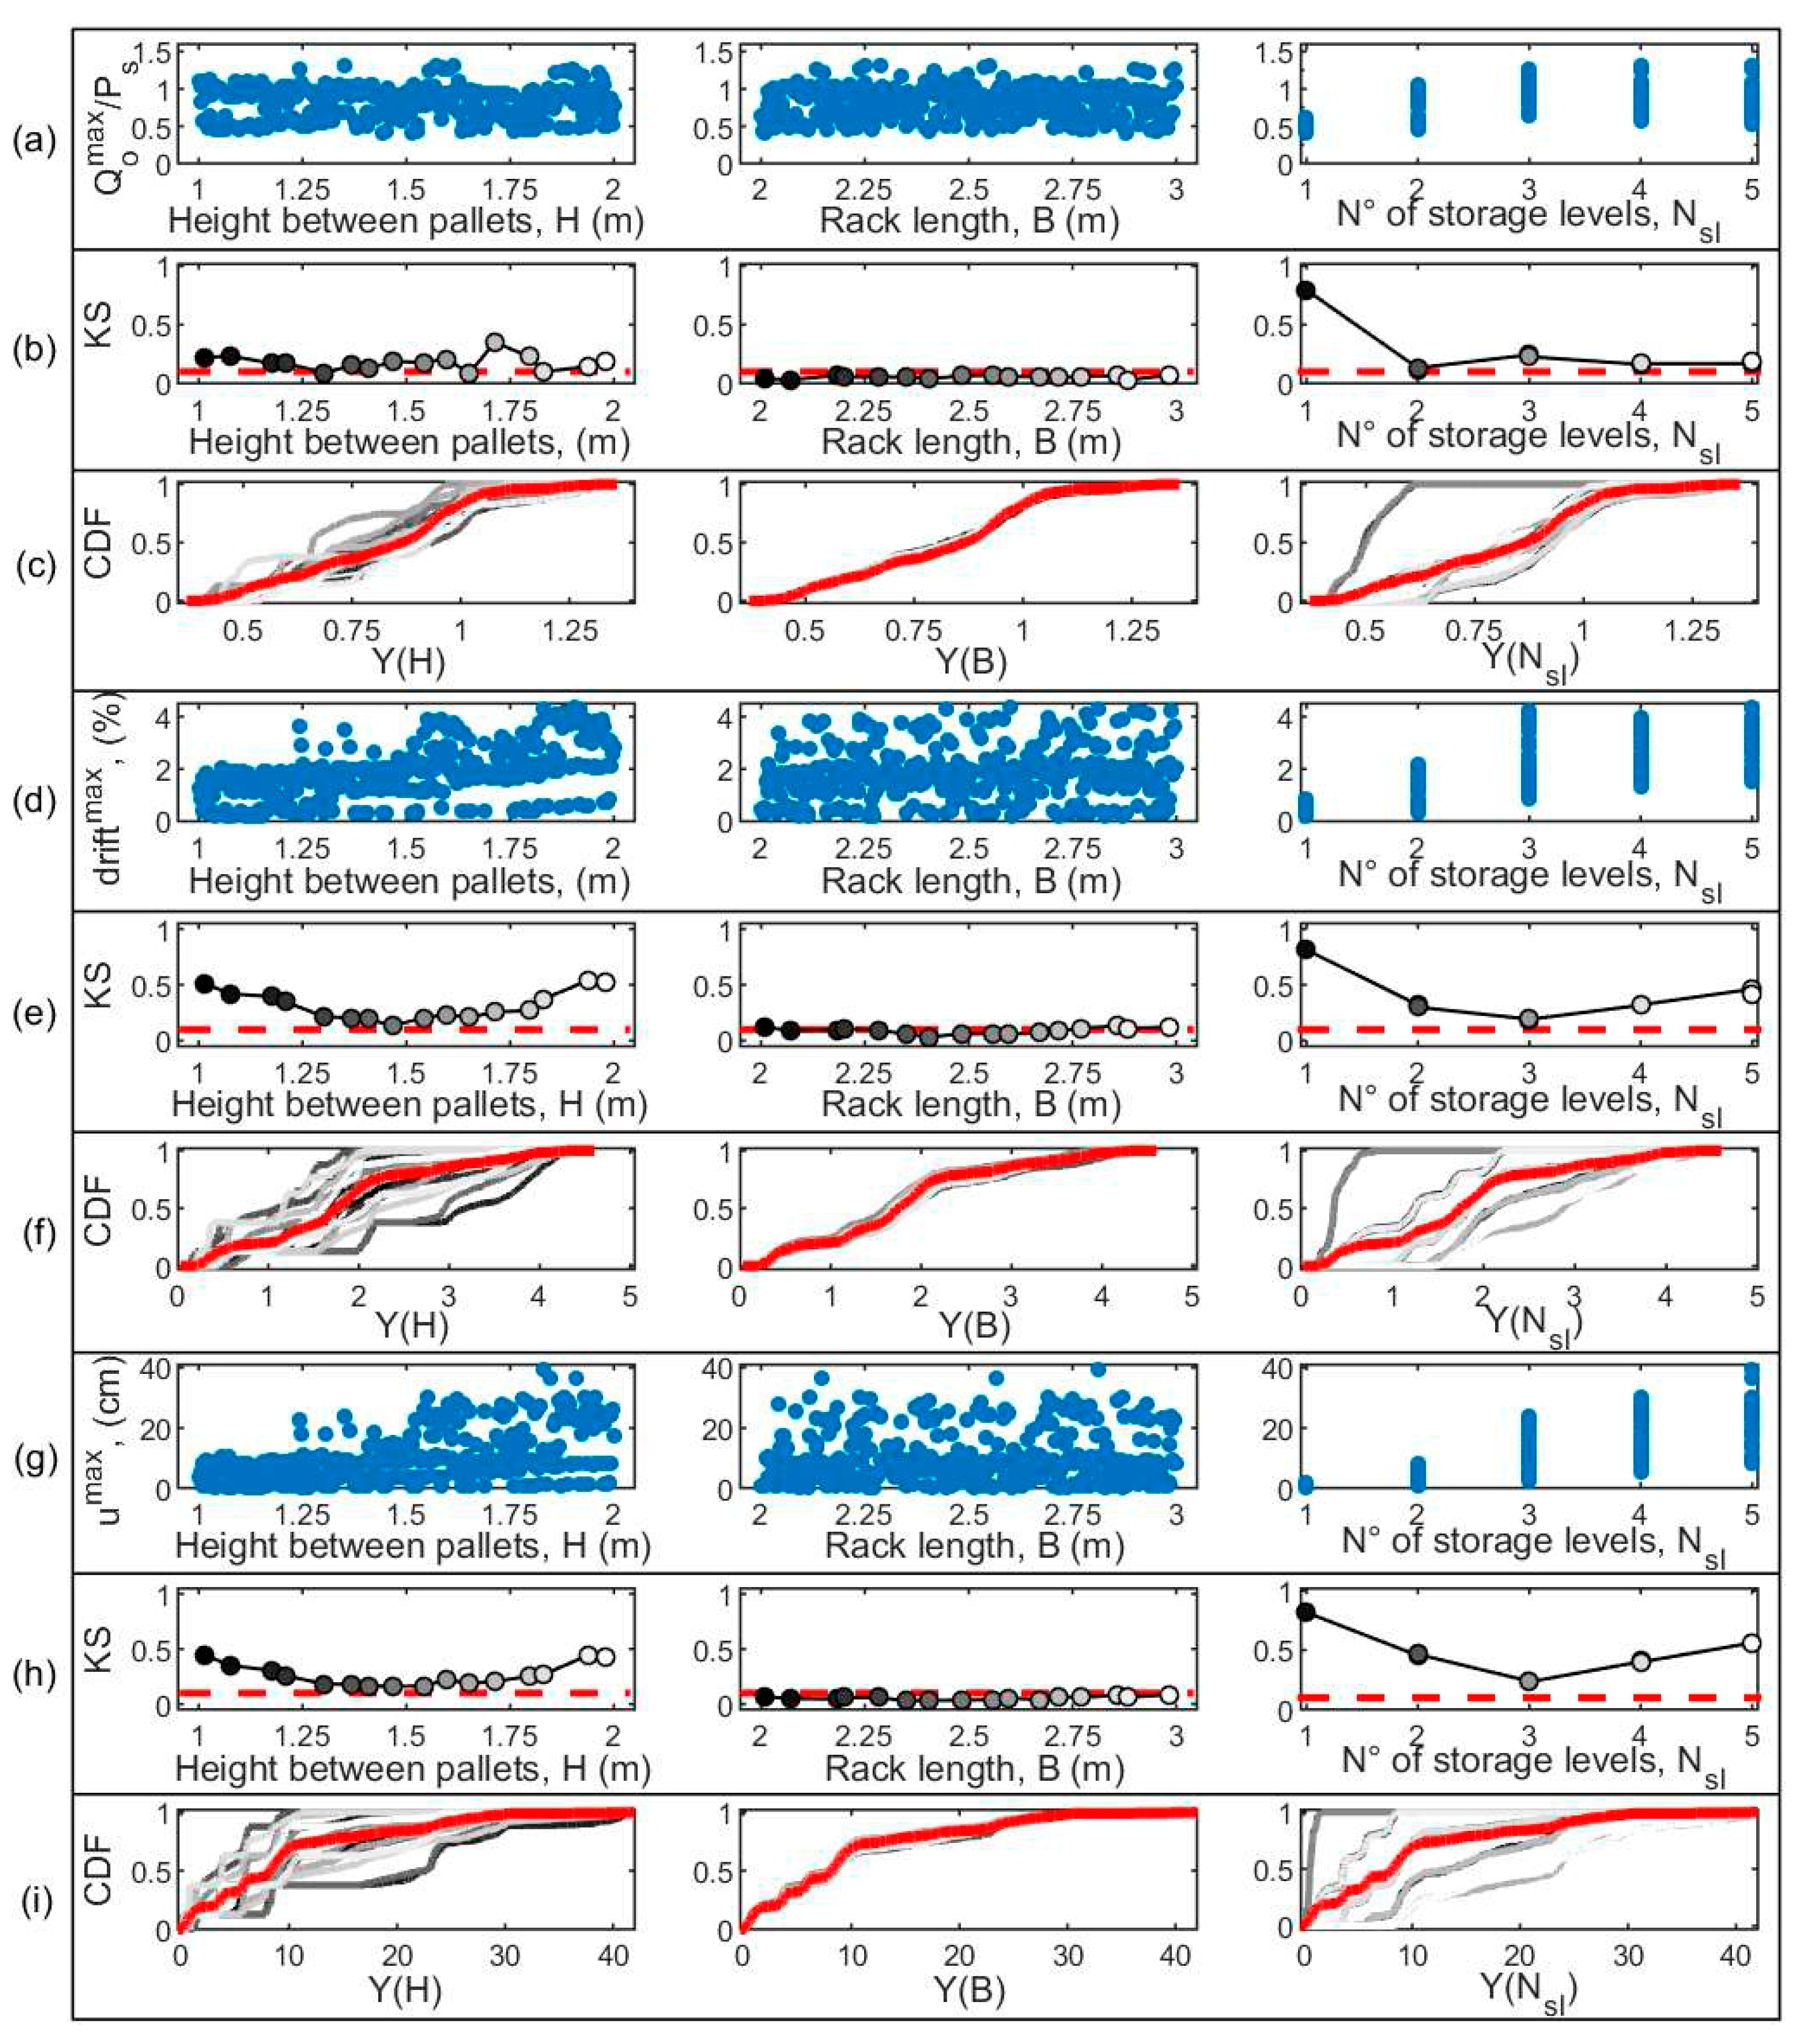
3.2. Base Isolation Effectiveness Analysis

Figure 9 shows the target responses of the maximum normalized base shear load ( Q ^ o m á x ), with maximum drift (%) and maximum displacement of the top rack umax (cm) for the FBR (blue color) and BIR (green color). The responses are plotted against the parameters analyzed, height between pallets (H), span length (B) and the number of storage levels (Nsl), which are the parameters that both, FBR and BIR, have in common. The minimum seismic coefficient, Cmin = 0.1 of the NCh2369 standard, is indicated with the red line for a seismic zone 3 (the one with the highest seismic risk).
In Figure 9, it can be observed that there was a decrease in all the target responses, indicating that the use of the isolation system was effective in reducing seismic demand. In Figure 9a it can be observed that Q ^ o m á x was reduced by one order of magnitude when incorporating base isolation, with respect to the case with a fixed base. In addition, as a result of base isolation, practically all the racks should be designed with the minimum basal shear load requirements of the current standard. In Figure 9b,c, it can be observed that with the implementation of base isolation, the maximum drift and the maximum displacement had a reduction close to 85%, in relation to the same rack with a fixed base.
In Figure 10, the sensitivity indices for the FBR and BIR are shown. In the case of the FBRs, the isolator’s parameters (e.g., H a i s ,   T a ) are not incorporated. From Figure 10, it can be seen that all the target responses were sensitive to the input parameters N s l , H and B , with N s l and B having the greatest and least influence on the outputs, respectively.
In the case of the sensitivity indices of the BIRs (Figure 10a), it can be observed that the parameters that had the greatest influence on the maximum base shear load were H i s o and N s l , where Nsl and H showed a greater influence on the maximum drift and maximum displacement (Figure 10a,b). The latter was because these parameters made the racks more slender and, therefore, more flexible and susceptible to large displacements.
From Figure 10, it can be seen that the parameter with the least influence on the target outputs or responses corresponded to the rack length in the direction parallel to the aisles ( B ). On the other hand, regarding the parameters of the isolation system, the isolation period ( T i s o ) had the least influence on target responses. The reason for this apparent anomalous behavior was explained in Section 3.1. The foregoing is consistent with the results shown in the figures in the previous sections.
Seismic isolation seems to be a viable alternative to solve the problem of personal safety and property integrity due to the collapse of racks or falling objects as a result of earthquakes. Filiatrault et al. [42] present a summary of the experimental results of the seismic rack isolation device patented by Pellegrino et al. [11]. From the experimental tests, it was determined that the floor drift reached values of approximately 4% in the first level of the fixed base rack; however, in the rack with the Pellegrino isolation system, the floor drifts were less than 0.7% at all levels.
With the implementation of the BIKD described by Maureira-Carsalade et al. [13], the numerical simulations of the analyzed industrial storage racks, it was determined that the decrease in floor drift was from 4.5% in the case of FBR, to values lower than 0.7% in the cases of BIR. These values indicate that the BIKD system could have the same benefits as the existing alternatives. However, the BIKD system has the advantage that it can seismically isolate the rack from the effects of the earthquake acting in any horizontal direction. This system increases the stability of these structures and reduces the seismic demand on them by appropriately choosing the design parameters, as indicated in this investigation. The BIKD system could lead to benefits such as: (i) increasing the safety of the personnel and clients that operate around the racks; (ii) reducing product losses; (iii) increasing the serviceability of racks and consequently; (iv) a faster return to normal industrial activities after the occurrence of a severe seismic event.

4. Conclusions

The results derived from this research show the effectiveness of the use of the base isolation kinematic device (BIKD) system, presented by Maureira-Carsalade et al. [13]. For the analyzed scenario, we obtained a reduction in the target responses of maximum base shear load, and drift and displacement of the top storage level, of 90%, 86% and 85%, respectively.
With the implementation of the BIKD system, the maximum displacement of the highest level of the rack in the direction parallel to the aisles, did not exceed 6 cm. This implementation resulted in a reduction of 85%, compared with the same racks that had a fixed support condition at the base. This implies that such an isolation system can reduce the response of racks, even in their most flexible direction. The above represents an advantage over the isolator described by Pellegrino et al. [11]; the BIKD system studied here allows the structure to be isolated from earthquakes in any horizontal direction. This has the benefit of reducing the response in the directions parallel to the aisles and across the aisles. This advantage offers security for both clients and workers who frequent these structures, avoiding the possibility of colliding with adjacent racks.
It was observed that, with the use of the BIKD system, the industrial storage racks must be designed practically with the minimum requirements of the current standard (NCh2369 for Chile). The results showed a reduction of one order of magnitude in the normalized maximum base shear load, with respect to the FBR.
The height of the BIKD, Hiso, was the parameter that most influenced the maximum base shear load. For values Hiso < 0.5 m, this affected the lateral stiffness of the isolation system for large displacements. In isolators with Hiso > 0.5 m, their lateral stiffness remained practically independent of this parameter, so there was no benefit of using a greater height in the isolator. However, with Hiso < 0.5 m, the over-stiffening to the isolation system increased the demand for base shear load. Therefore, the use of isolators with a height close to 0.5 m, and no higher, is recommended.
Finally, we determined that the parameters that had the greatest influence on the maximum displacement of the top of the racks and floor drift were the number of storage levels (Nsl) and the height between storage levels (H), in both FBR and BIR. This is due to the flexibility in these structures having a great influence on their response. Increasing these parameters contributed to greater flexibility. Consequently, the parameter with the least influence on the response of the system was the length of the rack in the direction parallel to the aisles (B).

Author Contributions

Conceptualization, O.Á., E.M. and N.M.-C.; methodology, O.Á., E.M. and N.M.-C.; software, O.Á.; validation, O.Á.; formal analysis, O.Á.; investigation, O.Á., E.M. and N.M.-C.; writing—original draft preparation, O.Á.; writing—review and editing, E.M., N.M.-C. and Á.R.-V.; visualization, N.M.-C. and Á.R.-V.; supervision, E.M. and N.M.-C.; project administration, N.M.-C.; funding acquisition, N.M.-C. All authors have read and agreed to the published version of the manuscript.

Funding

The authors acknowledge the Project awarded “CONICYT FONDEF/CONCURSO IDeA I+D, FONDEF/CONICYT 2020 Folio ID19I10081”. The financing granted to the project entitled “Seismic protection of industrial storage racks through the implementation of a base isolation device with tensile strength”. The authors also acknowledge for the financial contribution of the DI-FME 08/2021 fund from the “Dirección de Investigación de la Universidad Católica de la Santísima Concepción”.

Institutional Review Board Statement

Not applicable.

Informed Consent Statement

Not applicable.

Data Availability Statement

Not applicable.

Conflicts of Interest

The authors declare no conflict of interest.

Abbreviations

Abbreviations used in the body of the article.
AbbreviationMeaning
GSAGlobal Sensitivity Analysis
MCSMonte Carlo Sampling
LHSLatin Hypercube Sampling
PAWNGlobal sensitivity analysis method, from the author’s names: Pianosi & Wagener
CDFCumulative Distribution Function
BIKDbase isolation kinematic device
FBRFixed Base Rack
BIRBase Isolated Racks
SASensitivity Analysis
LSALocal Sensitivity Analysis
DoFDegree of Freedom
RSARegional Sensitivity Analysis
KSKolmogorov-Smirnov (the statistic parameter)

References

  1. Tang, Z.; Clifton, G.; Lim, J.; Maguire, J.; Teh, L. Increasing seismic resilience of pallet racking systems using sliding friction baseplates. In Proceedings of the 2017 New Zealand Society for Earthquake Engineering (NZSEE) Conference, Wellington, New Zeland, 27–29 April 2017. [Google Scholar]
  2. Teh, L.H.; Hancock, G.J.; Clarke, M.J. Analysis and design of double-sided high-rise steel pallet rack frames. J. Struct. Eng. 2004, 130, 1011–1021. [Google Scholar] [CrossRef] [Green Version]
  3. Uma, S.R.; Beattie, G. Observed performance of industrial pallet rack storage systems in the canterbury earthquakes. Bull. N. Zealand Soc. Earthq. Eng. 2011, 44, 388–393. [Google Scholar] [CrossRef] [Green Version]
  4. Gabbianelli, G.; Francesco, C.; Nascimbene, R. Seismic Vulnerability Assessment of Steel Storage Pallet Racks. 2020. Available online: http://hdl.handle.net/20.500.12076/7355 (accessed on 24 November 2021).
  5. Bernuzzi, C. European and United States approaches for steel storage pallet rack design: Part 1: Discussions and general comparisons. Thin-Walled Struct. 2015, 97, 308–320. [Google Scholar] [CrossRef]
  6. Chen, J.; Liu, W.; Peng, Y.; Li, J. Stochastic seismic response and reliability analysis of base-isolated structures. J. Earthq. Eng. 2007, 11, 903–924. [Google Scholar] [CrossRef]
  7. Matsagar, V.A.; Jangid, R.S. Influence of isolator characteristics on the response of base-isolated structures. Eng. Struct. 2004, 26, 1735–1749. [Google Scholar] [CrossRef]
  8. Castaldo, P.; Palazzo, B.; Della Vecchia, P. Seismic reliability of base-isolated structures with friction pendulum bearings. Eng. Struct. 2015, 95, 80–93. [Google Scholar] [CrossRef]
  9. Liu, C.; Fang, D.; Yan, Z. Seismic Fragility Analysis of Base Isolated Structure Subjected to Near-fault Ground Motions. Period. Polytech. Civ. Eng. 2021, 65, 768–783. [Google Scholar] [CrossRef]
  10. Gutelius, J.B., Jr.; McIntosh, S.C.; Notohardjono, B.D. Computer Equipment Having an Earthquake Damage Protection Mechanism. U.S. Patent No. 6,059,251, 21 July 1998. [Google Scholar]
  11. Pellegrino, J.B.; Courtwright, J.A.; Michael, R. Storage Rack Vibration Isolators and Related Storage Racks. U.S. Patent No. 7,263,806, 10 April 2006. [Google Scholar]
  12. Michael, R.J.; Courtwright, J.A.; Ferro, E.B.; Filiatrault, A.; Higgins, P.S.; Wanitkorkul, A. Development of a new base isolation system for seismic isolation of steel pallet storage racks. In Proceedings of the 9th US National and 10th Canadian Conference on Earthquake Engineering (9USN10CEE), Toronto, ON, Canada, 25–29 July 2010; Volume 10. [Google Scholar]
  13. Maureira-Carsalade, N.; Pardo, E.; Oyarzo-Vera, C.; Roco, A. A roller type base isolation device with tensile strength. Eng. Struct. 2020, 221, 111003. [Google Scholar] [CrossRef]
  14. Álvarez, O.; Maureira, N.; Nuñez, E.; Sanhueza, F.; Roco-Videla, Á. Numerical study on seismic response of steel storage racks with roller type isolator. Metals 2021, 11, 158. [Google Scholar] [CrossRef]
  15. Wojtkiewicz, S.F.; Johnson, E.A. Efficient sensitivity analysis of structures with local modifications. I: Time domain responses. J. Eng. Mech. 2014, 140, 04014067. [Google Scholar] [CrossRef]
  16. Pianosi, F.; Wagener, T. A simple and efficient method for global sensitivity analysis based on cumulative distribution functions. Environ. Model. Softw. 2015, 67, 1–11. [Google Scholar] [CrossRef] [Green Version]
  17. Pianosi, F.; Beven, K.; Freer, J.; Hall, J.W.; Rougier, J.; Stephenson, D.B.; Wagener, T. Sensitivity analysis of environmental models: A systematic review with practical workflow. Environ. Model. Softw. 2016, 79, 214–232. [Google Scholar] [CrossRef]
  18. Patelli, E.; Pradlwarter, H.J.; Schuëller, G.I. Global sensitivity of structural variability by random sampling. Comput. Phys. Commun. 2010, 181, 2072–2081. [Google Scholar] [CrossRef] [Green Version]
  19. García-Moreno, A.I.; González-Barbosa, J.J.; Hurtado-Ramos, J.B.; Ornelas-Rodríguez, F.J.; Ramírez-Pedraza, A. Análisis de la sensibilidad en un modelo de calibración cámara-LiDAR. Rev. Int. Métodos Numéricos Cálculo Diseño Ing. 2016, 32, 193–203. [Google Scholar] [CrossRef] [Green Version]
  20. Maciejewski, I.; Krzyzynski, T. Global Sensitivity Analysis of the Vibration Reduction System with Seated Human Body. Shock Vib. 2018, 2018, 3732746. [Google Scholar] [CrossRef] [Green Version]
  21. Kala, Z.; Valeš, J. Global sensitivity analysis of lateral-torsional buckling resistance based on finite element simulations. Eng. Struct. 2017, 134, 37–47. [Google Scholar] [CrossRef]
  22. Borgonovo, E.; Castaings, W.; Tarantola, S. Moment independent importance measures: New results and analytical test cases. Risk Anal. Int. J. 2011, 31, 404–428. [Google Scholar] [CrossRef]
  23. Zadeh, F.K.; Nossent, J.; Sarrazin, F.; Pianosi, F.; Van Griensven, A.; Wagener, T.; Bauwens, W. Comparison of variance-based and moment-independent global sensitivity analysis approaches by application to the SWAT model. Environ. Model. Softw. 2017, 91, 210–222. [Google Scholar] [CrossRef] [Green Version]
  24. Sedighian, S.; Kim, S.H.; Cho, S.Y.; Kim, M.J.; Kim, D.H.; Cha, D.W. Parameter ranking system of indoor radon concentration in South Korea, Case studies: Dokdo island, Yang Pyeong and Nae Gi. Int. J. Environ. Res. 2015, 9, 1233–1236. [Google Scholar]
  25. Gillies, K.; Krone, S.M.; Nagler, J.J.; Schultz, I.R. A computational model of the rainbow trout hypothalamus-pituitary-ovary-liver axis. PLoS Comput. Biol. 2016, 12, e1004874. [Google Scholar] [CrossRef] [Green Version]
  26. Yin, L.; Tang, G.; Li, Z.; Zhang, M.; Feng, B. Responses of cold-formed steel storage racks with spine bracings using speed-lock connections with bolts I: Static elastic-plastic pushover analysis. Thin-Walled Struct. 2018, 125, 51–62. [Google Scholar] [CrossRef]
  27. Yin, L.; Tang, G.; Zhang, M.; Wang, B.; Feng, B. Monotonic and cyclic response of speed-lock connections with bolts in storage racks. Eng. Struct. 2016, 116, 40–55. [Google Scholar] [CrossRef]
  28. Bernuzzi, C.; Simoncelli, M. An advanced design procedure for the safe use of steel storage pallet racks in seismic zones. Thin-Walled Struct. 2016, 109, 73–87. [Google Scholar] [CrossRef] [Green Version]
  29. Gusella, F.; Orlando, M.; Thiele, K. Evaluation of rack connection mechanical properties by means of the Component Method. J. Constr. Steel Res. 2018, 149, 207–224. [Google Scholar] [CrossRef]
  30. Jovanović, Đ.; Žarković, D.; Vukobratović, V.; Brujić, Z. Hysteresis model for beam-to-column connections of steel storage racks. Thin-Walled Struct. 2019, 142, 189–204. [Google Scholar] [CrossRef]
  31. Saravanan, M.; Marimuthu, V.; Prabha, P.; Surendran, M.; Palani, G.S. Seismic characterization of cold formed steel pallet racks. Earthq. Struct. 2014, 7, 955–967. [Google Scholar] [CrossRef]
  32. Simoncelli, M.; Tagliafierro, B.; Montuori, R. Recent development on the seismic devices for steel storage structures. Thin-Walled Struct. 2020, 155, 106827. [Google Scholar] [CrossRef]
  33. Pilger, G.G.; Costa, J.F.C.; Koppe, J.C. Improving the Efficiency of the Sequential Simulation Algorithm Using Latin Hypercube Sampling. In Geostatistics; Springer: Banff, Canada, 2004. [Google Scholar] [CrossRef]
  34. Romero, C. Tribological behavior of an austenitic stainless steel in a ball on ring tribometer. Ingenius. Rev. Cienc. Tecnol. 2017, 18, 64–72. [Google Scholar] [CrossRef] [Green Version]
  35. INN. Análisis y Diseño de Edificios con Aislación Sísmica; NCh2745 Of. 2013; INN: Santiago, Chile, 2013. [Google Scholar]
  36. Pianosi, F.; Wagener, T. Distribution-based sensitivity analysis from a generic input-output sample. Environ. Model. Softw. 2018, 108, 197–207. [Google Scholar] [CrossRef] [Green Version]
  37. Sobol’, I.Y.M. On sensitivity estimation for nonlinear mathematical models. Mat. Modelirovanie 1990, 2, 112–118. [Google Scholar]
  38. Liu, H.; Chen, W.; Sudjianto, A. Relative entropy-based method for probabilistic sensitivity analysis in engineering design. J. Mech. Des. 2006, 128, 326–336. [Google Scholar] [CrossRef]
  39. Kolmogorov, A.N. Sulla determinazione empirica di una legge di distribuzione. Giorn. Ist. Ital. 1933, 4, 83–91. [Google Scholar]
  40. Smirnov, N.V. On the estimation of the discrepancy between empirical curves of distribution for two independent samples. Bull. Math. Univ. Moscou. 1939, 2, 3–14. [Google Scholar]
  41. INN. Diseño Sísmico de Estructuras e Instalaciones Industriales; NCh2369 Of. 2003; INN: Santiago, Chile, 2003. [Google Scholar]
  42. Filiatrault, A.; Higgins, P.S.; Wanitkorkul, A.; Courtwright, J.A.; Michael, R. Experimental seismic response of base isolated pallet-type steel storage racks. Earthq. Spectra 2008, 24, 617–639. [Google Scholar] [CrossRef]
Figure 1. Basic structuring of each level of the racks analyzed.
Applsci 11 11553 g001
Figure 2. Conceptual model of analysis and flow diagram of the PAWN method.
Applsci 11 11553 g002
Figure 3. Basic structuring of racks with the different storage levels analyzed (from 2 up to 6).
Applsci 11 11553 g003
Figure 4. Scheme of the BIKD used with a compressed pneumatic piston as elastic element (a) undeformed equilibrium position, (b) deformed position with maximum displacement, (c) Three-dimensional scheme of the finite elements model of the device, and (d) Installation diagram of a rack on the isolation system. The figures (a,b) were adapted from [14].
Applsci 11 11553 g004
Figure 5. (a) Design spectrum of NCh2745, Llolleo’s spectrum scaled to NCh2745 and Llolleo’s original spectrum. (b) Llolleo’s earthquake original and scaled to fit NCh2745 spectrum of design.
Applsci 11 11553 g005
Figure 6. Illustrative CDF examples of a model with Y output. Red lines indicate unconditional CDFs, F y ( y ) , and gray lines indicate conditional CDF, F y | x i ( y ) .
Applsci 11 11553 g006
Figure 7. Scatterplot, Kolmogorov-Smirnov Statistics (KS) and conditional and unconditional CDFs of the target responses. Rows (ac) are the maximum base shear load ( Q o m á x ) normalized by the seismic weight ( P s ); (df) are maximum drift and (gi) are maximum displacement ( u m a x ) of BIR.
Applsci 11 11553 g007
Figure 8. Scatterplot, Kolmogorov-Smirnov Statistics (KS) and conditional and unconditional CDFs of the target responses. Rows (ac) are for the maximum base shear load ( Q o m á x ) normalized by the seismic weight (Ps); (df) are for the drift; and (gi) are for the maximum displacement of the top of the FBR ( u m a x ).
Applsci 11 11553 g008
Figure 9. Scatter Plots of: (a) the maximum normalized base shear load ( Q o ), (b) drift of the top of rack respect to its base, and (c) displacement ( u m á x ) of FBR (blue points) and BIR (green points). The red lines in the figures in row (a) indicate the minimum seismic coefficient of NCh2369, Cmin = 0.1.
Applsci 11 11553 g009
Figure 10. Sensitivity indices. (a) maximum base shear load, (b) maximum drift and (c) maximum displacement of the top storage level.
Applsci 11 11553 g010
Table 1. Properties of the cross-sections of the structural elements of the racks.
ProfileA [cm2]Ix [cm4]Iy [cm4]rx [cm]ry [cm]Cw [cm6]
TX 100 × 105 × 39.95138.88135.003.683.743740
TC 100 × 50 × 28.13122.4931.2138.8219.59461.3
CA 45 × 22 × 2 1.785.21.021.710.764.562
C 58 × 22 × 21.999.721.112.210.755.882
Table 2. Range of design parameters used in the analysis with LSH model.
ParameterDescriptionRange
HHeight between pallets (m)1–1.9
BRack length in direction parallel to the aisle (m)2–3
tShort direction beam length (m)0.85
NslNumber of storage levels2–6
TisoIsolation period (s)3–5
HisoIsolator height (m)0.3–0.6
μCoefficient of friction between materials in the BIKD´s ball joint0.4–0.6
dDiameter of the ball joint at the base support of the BIKD (m)0.06
Publisher’s Note: MDPI stays neutral with regard to jurisdictional claims in published maps and institutional affiliations.

