Article

Exergoeconomic and Environmental Analysis and Multi-Objective Optimization of a New Regenerative Gas Turbine Combined Cycle

by
Ali Baghernejad
1,2,* and
Amjad Anvari-Moghaddam
2
1
Mechanical and Aerospace Engineering Department, School of Engineering, Garmsar Branch, Islamic Azad University, Garmsar 3581631167, Iran
2
Department of Energy (AAU Energy), Aalborg University, 9220 Aalborg, Denmark
*
Author to whom correspondence should be addressed.
Submission received: 1 November 2021 / Revised: 22 November 2021 / Accepted: 2 December 2021 / Published: 6 December 2021

Abstract

:
Combined cycle systems have an important role in power generation. In the present study, three different configurations of combined Brayton and Rankine cycle system are studied from the perspective of energy, exergy, exergoeconomic and environmental perspectives. Results indicate that it depends on the preferences and criteria of each decision maker to select the best configuration among the three proposed configurations as the final configuration. For the purpose of parametric analysis, the effect of changing various parameters such as compressor pressure ratio, gas turbine inlet temperature on the output work, exergy efficiency, exergy-economic and environmental parameters is studied. In addition, an attempt is made to optimize the performance of combined cycle systems considering three objective functions of exergy efficiency, total cost rate and exergy unit cost of produced electricity.

1. Introduction

The increasing use of fossil fuels in recent years has had negative environmental impacts on the living environment of Earth’s inhabitants. The most significant effects of this very high increase in atmospheric pollutants, much of which comes from fossil fuels can be attributed to ozone depletion, global warming, and greenhouse gases emission. Meanwhile, the rate of increase in carbon dioxide emissions, one of the most important pollutants in the atmosphere, is concerning. The production and consumption of energy and its various types of products such as heat energy, cold energy and electrical energy are one of the main issues in human life. Power generation cycles are one of the main sources of electricity generation, and today the combined Brayton–Rankine power generation cycles have received much attention due to their higher efficiency as well as less environmental pollution than the Brayton cycle and the Rankine cycle alone [1,2,3]. Many efforts have been made to improve the performance of the Brayton and Rankine cycles so far but the most common of which is the combined cycle system, with the Brayton cycle acting as an upper cycle and using the turbine exhaust gas as an actuator for the Rankine cycle as a lower cycle. As an example, Brayton–Rankine combined cycle and gas Brayton-air Brayton combined cycle are examined in [4,5]. Although the combined cycle with the Rankine cycle has higher output and efficiency but the use of the gas Brayton-air Brayton combined cycle in hot and dry places where there is insufficient water to cool the condenser is a good choice [6]. In addition, the gas turbine outlet airflow and regenerator exhaust gas are still at a high temperatures, and can be used in various heating applications.
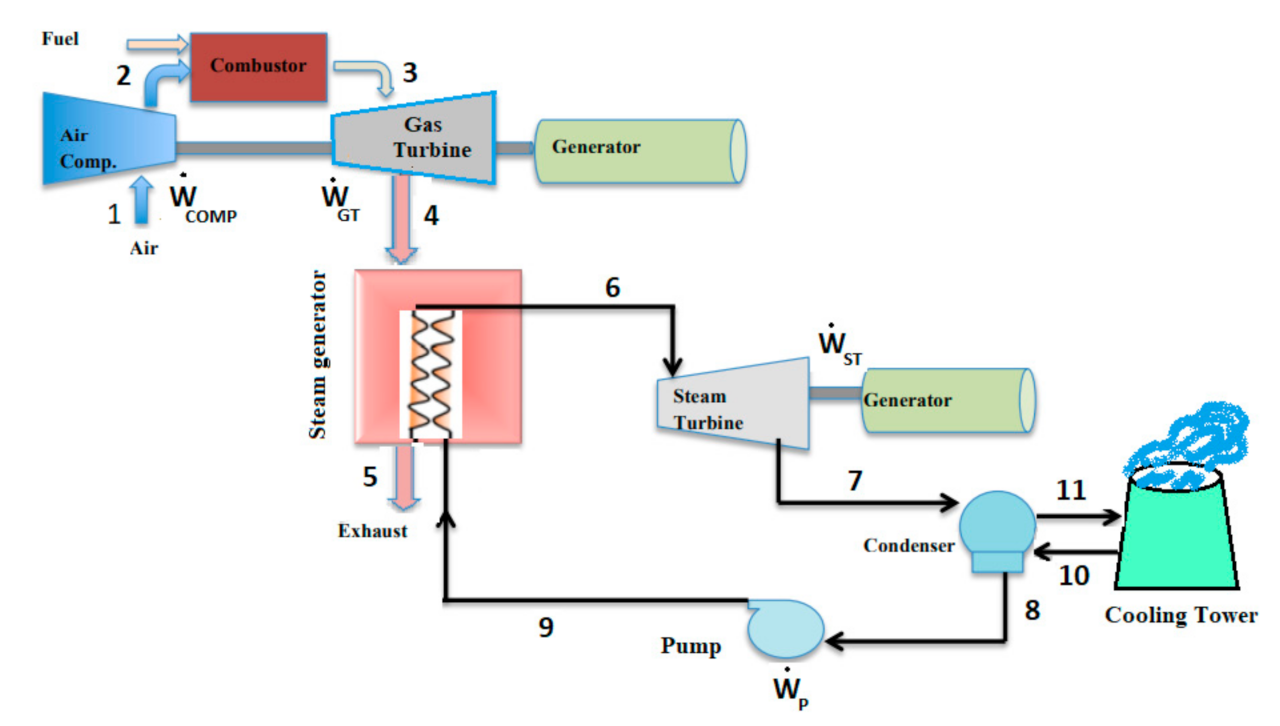
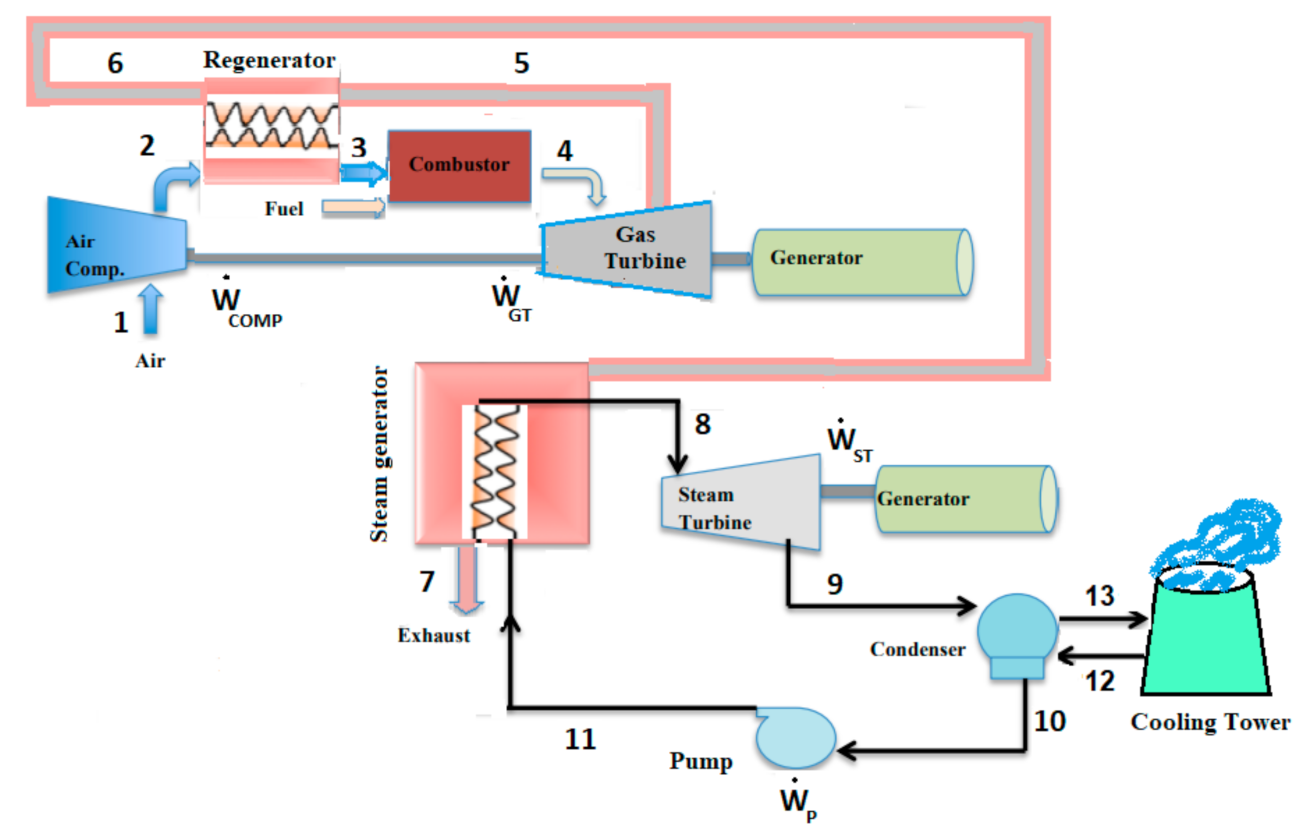
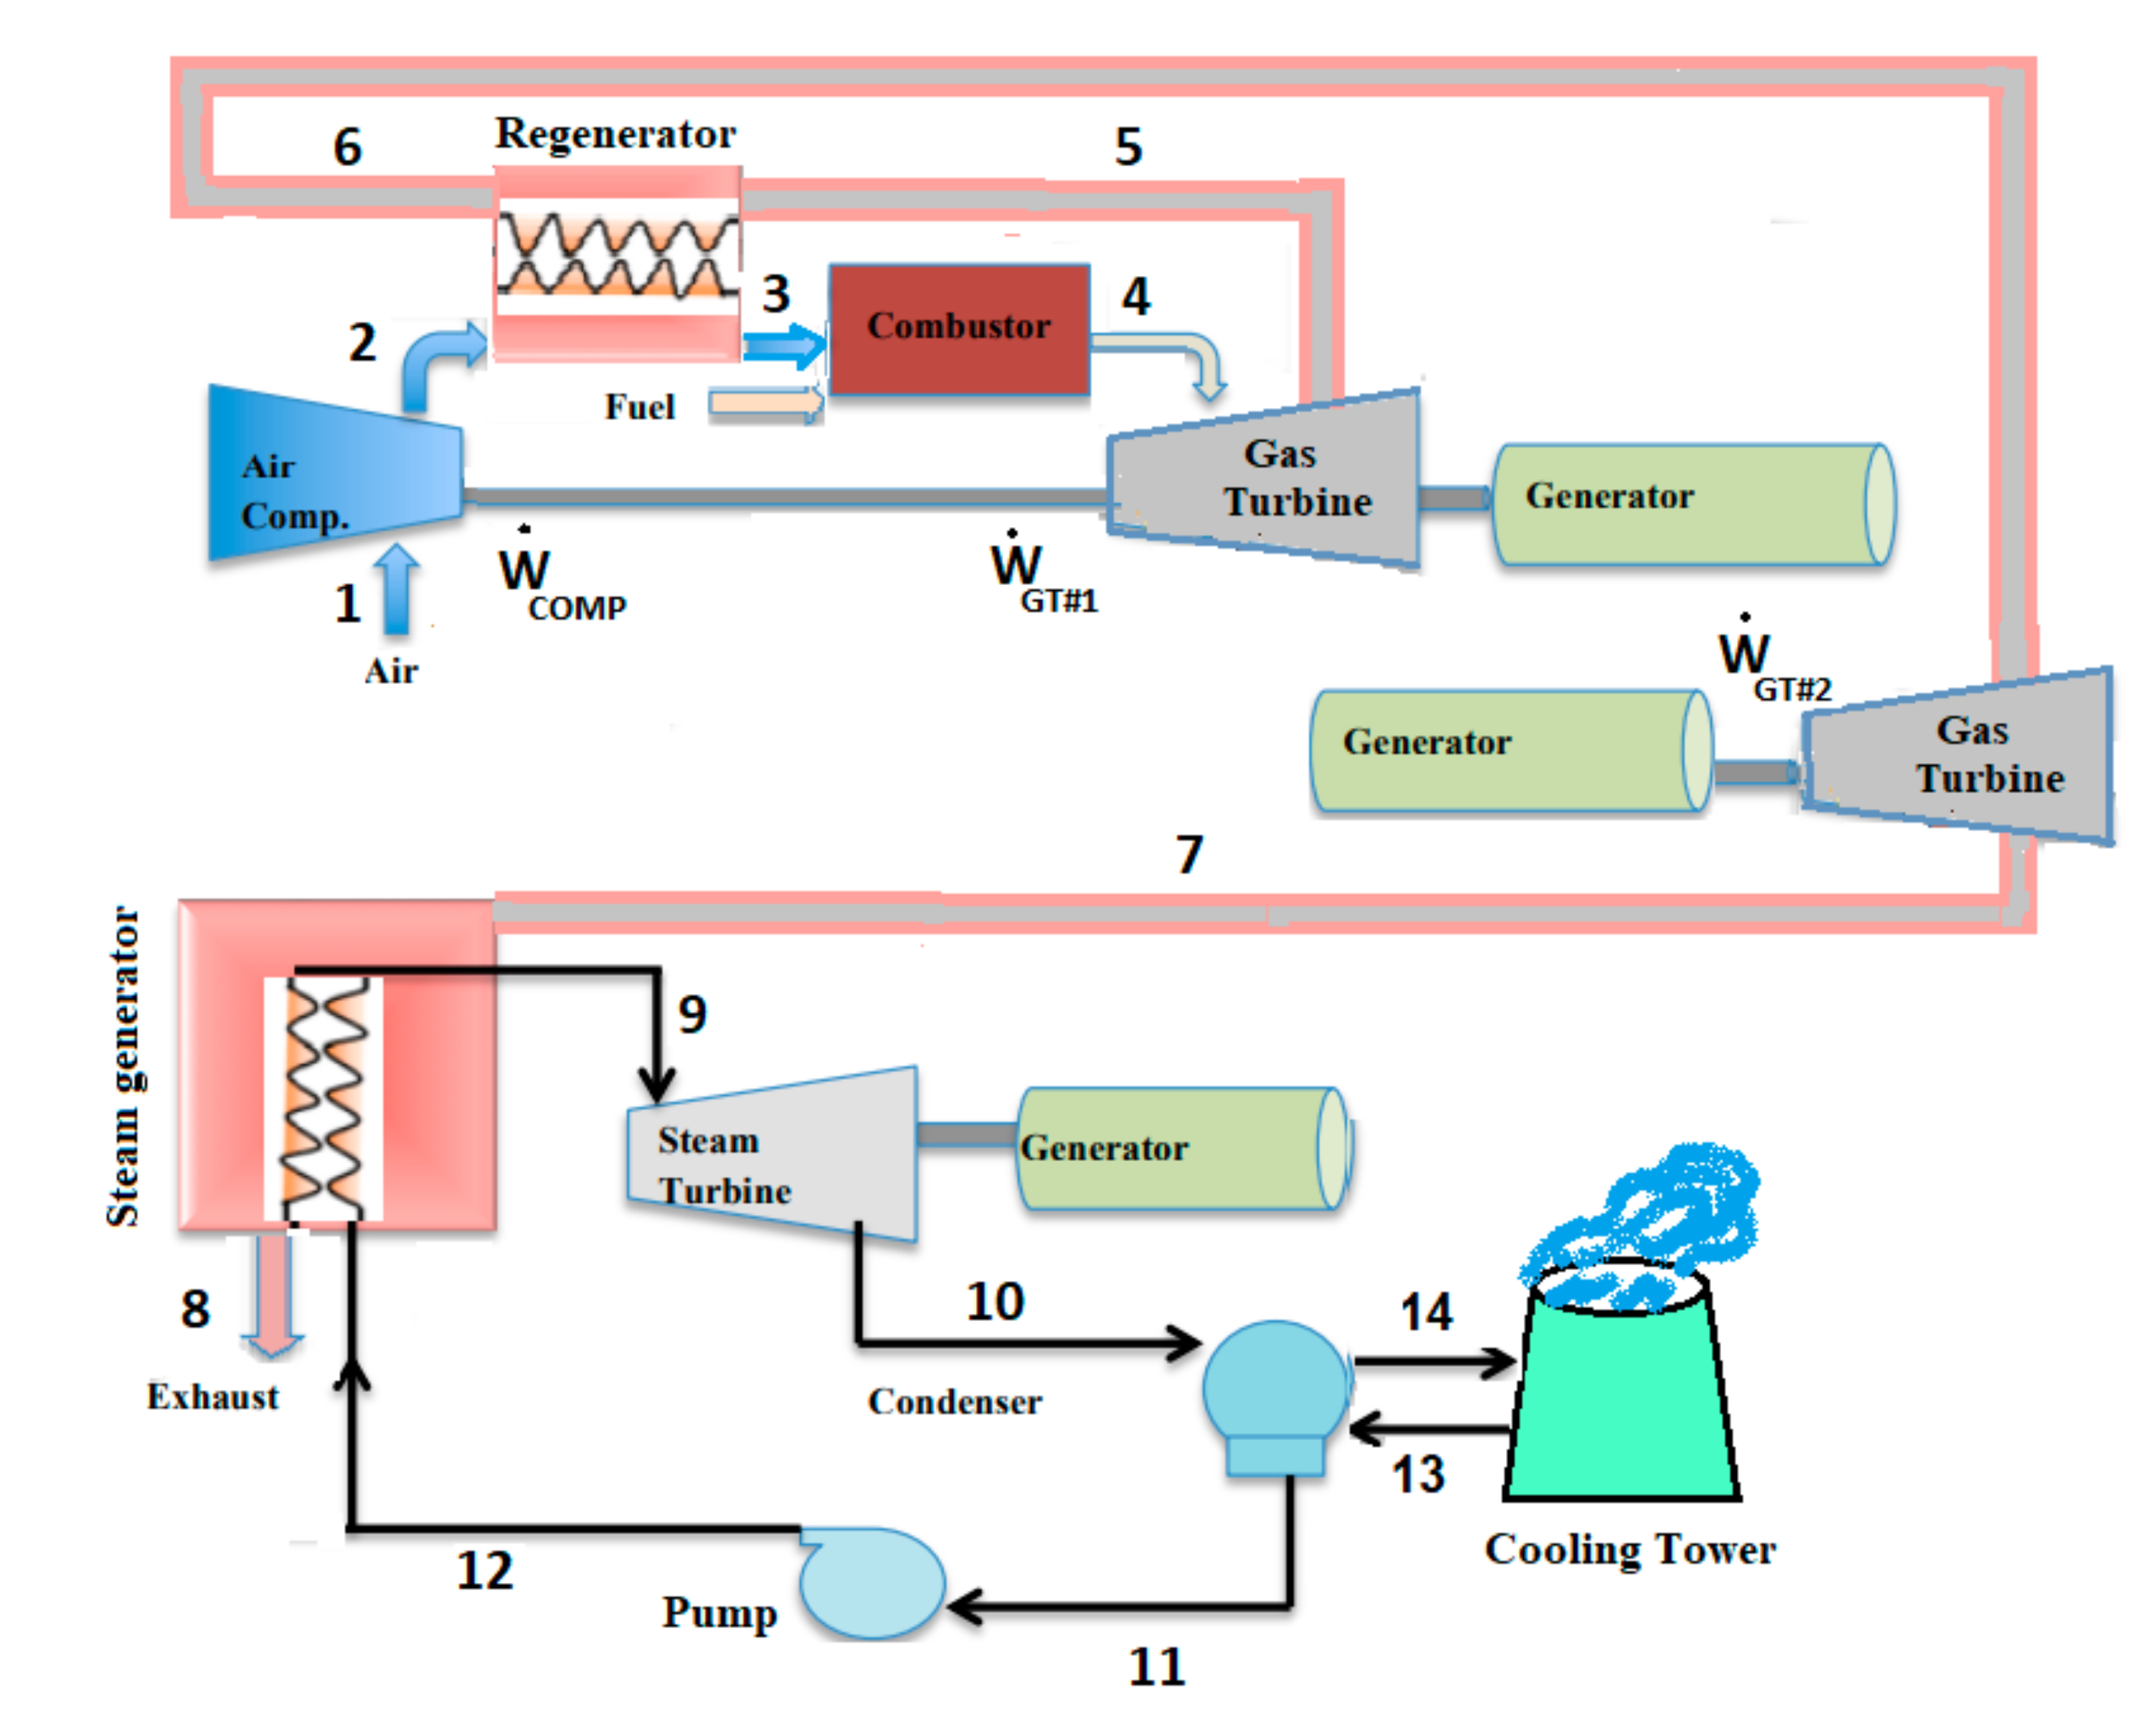
The conventional Brayton cycle consists of three main components: compressor, combustion chamber and gas turbine. Usually, air enters the compressor in the ambient pressure and temperature and after the pressure and temperature rise, it enters the combustion chamber and after the combustion, the mixture of gases with high pressure and temperature enters the gas turbine to generate power. However, the other components can be added to improve Brayton’s cycle performance. For example, using a regenerator in Brayton cycle can help improve its performance regenerative Brayton cycle absorbs some of exhausted waste heat within the regenerator to decrease the required heat injection within the combustion chamber with the same output power at low to moderate pressure ratios. Therefore, the regenerative Brayton cycle is a higher efficiency alternative for the basic one at a low-pressure ratio [7,8]. The use of the regenerator in the basic gas turbine cycle and the new regenerative Brayton cycle is compared in terms of output power and energy efficiency [9]. The basic difference between the new regenerative cycle and the original one is that hot airflow does not completely expand to the atmospheric pressure before entering the regenerator. The hot airflow expands to the certain pressure above the atmospheric pressure through the first gas turbine and enters the regenerator to preheat the outlet compressor airflow. Then it enters the second turbine and expands to the atmospheric pressure. According to the results of [9], although using the new regenerative Brayton cycle results in a reduction in engine output power, but due to a significant reduction in fuel consumption in the combustion chamber, it remarkably increases energy efficiency compared to the basic Brayton cycle and the regenerative Brayton cycle. In [9], the performance of Brayton cycles (basic Brayton cycle, regenerative Brayton cycle and new regenerative Brayton cycle) is compared only from the energy point of view considering the output work and energy efficiency.
In recent years, various studies have been performed on the use of the Brayton cycle and Rankine cycles as well as the combined cycle to generate power [10,11,12,13,14,15,16,17,18,19,20,21,22,23,24,25,26,27]. Nami and Anvari-Moghaddam [10] suggested a solar-assisted biomass-based tri-generation system to provide domestic energy demands and studied from the perspectives of thermodynamics and sustainability. In their proposed combined system, gas and steam turbines are considered as the main power generation systems, while the chiller and an auxiliary heat exchanger exploit the thermal energy content of the effluent. They investigated the influence of some decision parameters on the performance of the system in the summer/winter conditions as well. Their results revealed that the pressure ratio of the air compressor leads to the system performance optimizing while the performance of the system has a linear relation with the gas turbine inlet temperature and cold end temperature difference within the air heater. Performance optimization of an integrated solar combined cycle system which generates 400 MW power from the exergoeconomic perspective is performed by Baghernejad and Yaghubi [11]. Considering the sum of the initial cost rate and the exergy destruction cost rate as the objective function, optimum results showed a decrease of 11% in the total cost rate. In addition, the cost of electricity generation in gas turbines and steam turbines in the optimum case were 7.1% and 1.17% lower than the base case design, respectively. Moreover, parametric study was performed to determine the effect of different parameters on the system performance. Nami et al. [12] investigated a municipal waste-driven tri-generation (cold, heat, and power) system and assesses how this solution helps for easier integration of energy sectors from the view of thermodynamic, thermoeconomic, and thermoenvironmental perspectives. Their results of the assessments showed that the proposed trigeneration system may effectively operate in any energy systems with simultaneous cold, heat, and power demands. Mansouri et al. [13] presented the effect of changing the number of pressure levels of heat recovery steam generator on the exergy efficiency of the combined cycle. They modeled three types of combined gas turbine cycles. In one model, a gas turbine with a two-pressure heat recovery steam generator was used and in the other two models, a gas turbine with a three-pressure heat recovery steam generator (with and without preheaters). The results showed that increasing the number of pressure levels in the heat recovery steam generator reduces the exergy loss in the heat transfer process of the cycle and the sensible increase in the exergy efficiency of the whole cycle. The results also showed that the best performance of heat transfer from the outlet gas is related to the three-pressure combined cycle with preheater. From an economic point of view, their results also showed that increasing pressure levels in the heat recovery steam generator has economic justification. Ahmadi et al. [14], simulated and optimized a multipurpose cogeneration system consisting of a gas turbine, a dual-pressure steam Rankine cycle, an absorption chiller cycle, a power generation cycle and an ejector coolant, a heat exchanger that produce domestic hot water and electrolyzer. The system is designed for the simultaneous generation of power, cooling, hot water and hydrogen, they considered exergy efficiency and overall cost function (including fuel costs, equipment purchases and maintenance costs, exergy destruction costs, and environmental costs caused by carbon dioxide emissions) as optimization objective functions. Finally, parametric analysis was performed to investigate the change of design parameters on the relevant objective functions. An exergy and economics comparison between simple Brayton gas cycle with the solar collector and the combustion chamber as well as optimization is made by Soltani et al. [15]. In their study, exergy efficiency and overall cost rate are selected as the objective functions and the design parameters are compressor isotropic pressure ratio, inlet temperature, isotropic efficiency of the turbine, regenerator effectiveness, number of concentrating mirrors and outlet temperature. Their optimization results show that the amount of exergy efficiency and the cost rate are 52.73% and 10,851.47 $/hυ respectively for fossil fuel alone and the 41.6% and 20,296.9 $/hr for hybrid Brayton gas cycle. Olivenza-Leon et al. [16] examined the Brayton gas cycle from the perspective of the first law of thermodynamics. In their study, they used the regenerator, concentrated solar collector and combustion chamber to increase the temperature of the compressor exhaust gas such that the hot fluid and gas output from the collector and the combustion chamber transfer heat energy by means of two separate heat exchangers to the Brayton cycle operating fluid. By a complicated mathematical and thermodynamic model, the performance of the solar collector, combustion chamber, heat exchangers and other major components of the cycle is related to the overall energy efficiency. In addition, the effect of various factors such as ambient temperature and compressor pressure ratio on the energy efficiency are examined. A utilization of the waste heat and geothermal heat sources in a centralized domestic heating, cooling and electricity network was carried out by Nami et al. [17]. In their study, both geothermal and waste heat are applied to run domestic-scale combined cooling, heating and power (CCHP) units to meet the thermal and electrical demands of a residential area as the case study. It is showed that the designed CCHPs not only meets the local energy demand in a sustainable way, but also delivers surplus thermal and electrical energy to the main grids. Anvari et al. [18] investigated the combined cycle of gas turbine and organic Rankine cycle with middle-heater to generate heat and power simultaneously from the perspective of energy and exergy. In their studied cycle, the high temperature dissipated outlet gas from the gas turbine enters the steam generator and after generating the output heat and lowering the temperature, is used as the organic Rankine cycle actuator. Baghernejad et al. [19] evaluated and optimized the performance of a new triple production system from the exergoeconomic and environmental perspective. They showed that dissipated energy of gas turbine and solar energy can be used as a driving for steam cycle and also dissipated steam energy is applied for hot water heat exchanger and absorption chiller. The results showed that the optimum unit cost of exergy products decreased by 11.5% and overall exergy efficiency increased from 44.38% to 56.07%. A combined Brayton and Rankine cycle with a capacity of 50 MW from an energy and economic perspective was examined by Saghafifar et al. [20]. In their work, the heliostat collector and combustion chamber are used as the simultaneous stimulation of the Brayton cycle and the hot exhaust gases from the gas turbine are used as the vapor cycle actuator. Mohammadi et al. [21] investigated a co-generation system of power, heat and cooling including the upper Brayton gas cycle, organic Rankine cycle and the lower absorption cryogenic cycle from a thermodynamic perspective. In the next step, parametric analysis is performed to study the effect of different factors on the output parameters of cycle. Their results indicated that the proposed hybrid system could produce 30 kW of power, 8 kW of cooling and 7.2 ton of hot water with an overall efficiency of 67.6%. In addition, the results of parametric analysis showed that compressor pressure ratio and turbine inlet temperature are two important factors in changing system performance. The impact of using two different types of fuel, namely natural gas and diesel fuel, on the performance of the Brayton–Rankine hybrid system from the perspective of energy, exergy, economic and environmental examined and compared by Khoshkar et al. [22]. Their results show that the efficiency can be achieved 43.11% and 42.03% using the fossil fuel and diesel fuel under similar conditions. In addition, the annual cost of using diesel fuel is about twice the cost of operating with natural gas fuel. Ahmadi et al. [23] investigated and optimized a combined gas Brayton and Rankine cycle from an exergy, exergy-economic and environmental perspective. Parametric analysis is then performed to study the effect of compressor pressure ratio and Brayton gas turbine inlet temperature on the exergy efficiency and overall cost rate. The results showed that the highest amount of exergy destruction and cost rate occurred in the combustion chamber. The increase in Brayton turbine inlet temperature also results in a lower rate of exergy destruction cost of the combined cycle. Goodarzi et al. [24] examined different configurations of the Brayton cycle including the simple Brayton cycle, the regenerative Brayton cycle, and the regenerative Brayton cycle with the specified mass fraction from an energy perspective. In the proposed new configuration, the fractional of the output fluid of the first turbine goes to the regenerator and the rest goes to the second turbine. The results showed that the use of the regenerative cycle over the simple cycle leads to an increase in energy efficiency (due to the reduction in fuel required by the combustion chamber inlet) and a decrease in the output work. In another study, Goodarzi [25] examined and compared five different configurations including two Brayton and regenerative Brayton configurations and three Brayton gas cycle, simple reverse Brayton and regenerative reverse Brayton configurations from an energy perspective. In the new proposed configuration, the output gas mixture of the first turbine enters the second turbine and then goes to the regenerator. The results showed that at a certain range of pressure ratio, the use of regenerator improved the performance of the system. Saghafifar and Gadalla [26] studied the performance of the hybrid gas Brayton and air Brayton system with simultaneous actuator of combustion chamber and solar collector from a thermoeconomic perspective. The performance of the system is such that the upper exhaust gases from the turbine are used as an actuator for heat exchanger of lower cycle. Parametric analysis and optimization are performed to reduce the cost of electricity generation in the hybrid system. Anvari et al. [27] analyzed the performance of the combined Brayton cycle and Rankine cycle power generation system from the exergoeconomic and environmental perspective. Biomass and solar energy are used as the upper Brayton cycle actuator in their system and the exhausted gas from the upper Brayton cycle is used as the Rankine cycle actuator. The results showed that by adding solar power to the system, the output power increased by 30% and carbon dioxide emissions decreased by 22%.
Most research on the combined cycle systems have focused on the effect of different parameters on the Rankine cycle steam generator or the use of different configurations in the lower cycle to recover the gas turbine cycle dissipative energy, and so far, no comprehensive comparison has been made in the various configurations of the Brayton cycle of combined cycle power generation, which is the main motivation for the present study. Therefore, the results of this research represent over the possibility of recovering waste heat and determination of design parameters in the possible configurations of the combined cycle power plant with the purpose of power production. The main goals of the present paper are to manage the waste heat from the gas turbine to the Rankine cycle and to evaluate some possible configurations from the view of energy, exergy, exergoeconomics and environmental perspectives. In this research, the performance of different configurations of combined Brayton and Rankine cycle system is simulated and compared in terms of energy, exergy, exergy-economic and environmental factors. Performance of the three different configurations of the gas turbine cycle in [8] has been compared only from the energy point of view. In the present study, exhaust gases from the gas turbine cycle are used in the Rankine cycle and the performance of three different configurations of the combined cycle systems are comprehensively investigated from the perspective of energy, exergy, exergy-economic and environmental aspects. In addition, an attempt is made to optimize the combined cycle systems considering three objective functions of exergy efficiency, total cost rate and exergy unit cost of produced electricity. After analyzing and comparing the performance of the systems, parametric analysis to investigate the effect of changing various parameters such as compressor pressure ratio, gas turbine inlet temperature on the output work, exergy efficiency, exergy-economic and environmental parameters is studied.

2. System Description

Three different combined cycle systems are considered in the present study. Figure 1 shows the combined simple Brayton and Rankine cycle (first configuration). The Brayton cycle of this configuration consisting of a compressor, a gas turbine, and a combustion chamber, and has no regenerator. Air enters to the compressor and is supplied to combustion chamber with highest cycle pressure. It absorbs heat from fuel within the combustion chamber and a high temperature gas enters the turbine and then is exhausted to the atmosphere at the gas turbine outlet after producing power. Figure 2 schematically shows a combined regenerative Brayton and Rankine cycle (second configuration). The Brayton cycle of this configuration contains a regenerator for preheating the compressed airflow at the compressor outlet by hot exhausting airflow after the gas turbine. Figure 3 shows a new combined regenerative Brayton and Rankine cycle (third configuration). The basic difference between the new combined cycle and the basic one is that the exhausted gases do not completely expand to the atmospheric pressure before entering the regenerator in the regenerative Brayton cycle of this configuration. The mixture of gases with high pressure and temperature enters the first gas turbine to generate power. At the output of the first gas turbine, the mixture of exhaust gases expands to certain pressure above the atmospheric pressure to meet the required power of compressor. Then the hot exhaust gas of the first gas turbine enters the regenerator to preheat the outlet compressor airflow. In the second gas turbine, the exhaust gases expand to atmospheric pressure and supply the cycle’s output power. In the Rankine cycle of all three configurations, exhaust gases from the gas turbines expand to atmospheric pressure and with passing through the steam generator, the working fluid is converted to superheated steam. Superheated steam goes to the steam turbine and generates power. The steam turbine outlet fluid in the condenser discharge heat into the medium and the outlet saturated fluid from the condenser is pumped up by pump and returned to the steam generator.
In order to simulate and exergy analysis of the combined cycle systems (Figure 1, Figure 2 and Figure 3) the following assumptions are considered [28,29]:
  • The systems operate in the steady state condition;
  • The kinetic and potential energies in the various components are ignored;
  • The pressure loss in the pipelines is negligible;
  • In order to calculate the air and gas mixture properties in the Brayton cycle, ideal gas mixture relationships are used;
  • The combustion chamber fuel is assumed to be natural gas with 100% methane and is considered as ideal gas;
  • Heat loss from the combustion chamber is assumed to be 2% of the lower heating value of the fuel and other components operate adiabatically;
  • Combustion in the combustion chamber is assumed to be complete;
  • Pressure losses in the gas side and air side of the regenerator are assumed 3% and in the combustion chamber and the gas side of steam generator are considered 5%. Pressure drops through other process units of the configurations are neglected;
  • The output flow of steam generator in the Rankine cycle is superheated and the degree of superheating is specified according to the exhaust gas temperature in the second and the third configurations and is constant in the first configuration (the difference between the evaporator saturation temperature and the output steam temperature in the steam generator);
  • The minimum temperature difference between the two hot flow streams of the steam generator is assumed to be 20 °C;
  • The minimum exhaust gas temperature is assumed to be 70 °C;
  • The condenser outlet fluid and pump inlet is the saturated liquid;
  • Compressor, turbines and pump have specific isentropic efficiency;
  • For the exergy analysis, ambient temperature and pressure are considered as reference;
  • Chemical exergy is considered for the fuel in the combustion chamber while it is ignored in other flow streams of systems;
  • The molar percentage of the inlet air components to the combustion chamber are given in Table 1.

3. Thermodynamic Analysis

First, it should be noted that the mass properties of gases based on the ideal gas law are calculated from the product of the mass fraction of each component in the property of each ideal gas component. As an example, for enthalpy:
h m i x = c i h i
In the above relation, ci is the mass fraction of each component of the mixture of ideal gases and hi is a mass-based enthalpy. The following relation is used to the properties based on molar:
h ¯ m i x = M m i x h m i x  
where M m i x is molecular mass of mixture obtained from the following relation:
M m i x = y i M i  
In the above relation, yi is the mole fraction and Mi is the molecular mass of each component.

3.1. Energy Balance Equation

The energy balance equation of a control volume deals with all its input and output energies. The first law of thermodynamics, also called the law of energy stability, is defined as follows [28]:
Q ˙ W ˙ + i m ˙ i ( h i + v i 2 2 + g Z i ) e m ˙ e ( h e + v e 2 2 + g Z e ) = d E c v d t  

3.2. Entropy Balance Equation

The second law of thermodynamics is sometimes called the law of entropy as it introduces the important property called entropy. It is important to understand the meaning of reversible. All natural and artificial processes are irreversible, i.e., generate entropy by friction, heat flow or mass flow. Unlike energy, entropy is not conserved; analysis of the second law provides information as to where the real inefficiencies in a system lie. Entropy generation is associated with thermodynamic irreversibility, which is common in all types of heat-transfer processes. The equations for the second law of thermodynamics (entropy generation) for each component are expressed as follows [28]:
S ˙ g e n = e m ˙ e s e i m ˙ i s i k Q ˙ T k + d S c v d t  
In the above equation T k is the heat source temperature and Q ˙ is the amount of heat transfer between the heat source and the operating fluid. When the system reaches a uniform state, d S c v d t = 0 . The internal irreversibilities in the system components are calculated using the expression s and the external irreversibilities are calculated using the Q ˙ T expression. In this study, we also ignore the internal irreversibility corresponding to the pressure drop in system components such as heat exchangers and pipes.

3.3. Exergy Analysis

Exergy analysis is a method of analysis based on the second law of thermodynamics that specifically evaluates the efficiency of the system, provides criteria for achieving ideal system performance, and more clearly identifies the causes and points of thermodynamic loss. As a result, exergy analysis can be used to improve the performance and optimization of energy systems [28]. Energy efficiency is usually misleading because it does not meet the criteria for how well the system will function. In addition, the thermodynamic losses that occur in a system, usually by energy analysis, cannot be accurately identified and quantified. Exergy analysis allows many of the shortcomings of the energy analysis method to be overcome. As mentioned, exergy analysis is based on the second law of thermodynamics and is very useful in identifying the causes and points of energy loss and in determining the degree of system failure.

3.4. Exergy Destruction

Usually, the calculation of exergy destruction is the main purpose of exergy analysis of a system, because it causes this factor couses wastes of resources in thermal–chemical systems and in exergy analysis, methods for reducing these losses are usually explored and presented. Exergy balances can be used to determine the type and magnitude of energy loss in a component, as well as suggest ways to use fuel sources more efficiently. For a system in uniform state the exergy balance is written as follows [28]:
E x ˙ i + E x ˙ Q = E x ˙ e + E x ˙ w + E x ˙ D  
As E x ˙ e and E x ˙ i respectively the exergy flow rate of the system outlet and input to the system, E x ˙ Q the exergy rate corresponding to heat transfer, E x ˙ w the corresponding exergy rate of work transfer and E x ˙ D is equal to the exergy degradation rate. For each of the components of the system we have the following equations [28]:
E x ˙ i = m ˙ i e x i  
E x ˙ Q = Q i ˙ ( 1 T 0 T i )
E x ˙ e = m ˙ e e x e  
E x ˙ w = W ˙  
E x ˙ D = T 0 S ˙ g e n  
e x = e x p h + e x c h  
where T 0 is the dead state temperature and S ˙ g e n is the entropy generated by the irreversibilities in the system. In addition, e x p h and e x c h are physical and chemical exergies, respectively.
The relations used in the first and second law analysis of the system components in the third configuration are outlined in Table 2. These relations are also used for similar components in the first and second configurations.

4. Exergoeconomic Analysis

The first law of thermodynamics (energy balance) is most commonly used to evaluate the performance of systems. This rule is related to energy conservation and cannot explain the irreversibilities that commonly occur in different processes. Exergy analysis based on the second law of thermodynamics calculates the irreversibilities during a process and then can be combined with economic analysis to provide solutions to improve of the system performance. Exergoeconomic analysis, by combining the concepts of exergy and economics provides insights and strategies for improving the performance of the system that cannot be achieved exclusively by exergy analysis or economic analysis. It is clear that in the exergoeconomic analysis, the simultaneous reduction of the exergy destruction, exergy loss and the cost resulting from these losses as well as the economic cost of each component of the system are taken into account [28]. In recent years, many exergy-based economic analyses have been provided by researchers (such as exergoeconomic analysis, thermoeconomic analysis, etc.). One of the methods most frequently used by researchers is the fuel exergy, product exergy and exergy loss method that first described by Bejan [28]. An exergy rate balance for the system reads:
E x ˙ F = E x ˙ P + E x ˙ D + E x ˙ L  
where E x ˙ D and E x ˙ L denotes the rates of exergy destruction and exergy loss, respectively. Exergetic efficiency ε is the ratio between product and fuel:
ε = E x ˙ P E x ˙ F = 1 E x ˙ D + E x ˙ L E x ˙ F  
Table 3 lists the flows corresponding to the exergy of the fuel and product in the various components of the combined cycle system shown in Figure 3.
A cost balance applied to the kth component shows that the sum of cost rates associated with all exiting exergy streams equals the sum of cost rates of all entering exergy streams plus the appropriate charges (cost rate) due to capital investment and operating and maintenance expenses. The sum of the last two terms is denoted by Z ˙ . Based on the cost balance equation, the cost rate of input and output exergy flows of the system and finally, unit exergy cost of productions are calculated. Accordingly, for a kth component:
e N ( c e E ˙ e ) k + c w , k W ˙ k = c q , k E ˙ q , k + i N ( c i E ˙ i ) k + Z ˙ k  
In general, if there are Ne exergy streams exiting the component being considered, we have Ne unknowns and only one equation, the cost balance. Therefore, we need to formulate Ne−1 auxiliary equations. This is accomplished with the aid of the F and P principles in the SPECO approach [30]. Developing equation for each component of combined cycle system along with auxiliary costing equations (according to P and F rules) [30] leads to the following system of equations as indicated in Table 4. By solving the system of equations, the cost of unknown streams of the system is obtained. These are the average unit cost of fuel cf,k, average unit cost of product cp,k, cost rate of exergy destruction C ˙ D , k , cost rate of exergy loss C ˙ L , k , and the exergoeconomic factor, fk. Mathematically, these are expressed as [10]:
c f , k = C ˙ f , k E ˙ f , k  
c p , k = C ˙ p , k E ˙ p , k
C ˙ D , k = c f , k   E ˙ D , k
C ˙ L , k = c f , k   E ˙ L , k
f k = Z ˙ k Z ˙ k + C ˙ D , k + C ˙ L , k
The output power of the combined cycle systems is calculated from the following relation:
W ˙ n e t = W ˙ g t , 1 , 2 + W ˙ s t W ˙ p              
The overall exergy efficiency is calculated from the following relation:
η e x , n e t = W ˙ n e t E x ˙ f u e l              
The unit cost of the exergy produced electricity is the following equation:
c p , n e t = c e l W ˙ n e t W ˙ n e t              
Further, the final overall cost rate can also be obtained from:
C ˙ t o t = Z ˙ k + C ˙ D , k + C ˙ f u e l + C ˙ e n v
where C ˙ f u e l fuel is calculated from the following relation [31]:
C ˙ f u e l = m ˙ f u e l   c f u e l   L H V
where C ˙ e n v is obtained from the following relation [1]:
C ˙ e n v = c C O 2 m ˙ C O 2 + c N O m ˙ N O + c C O m ˙ C O
Which is cCO2 = 0.024 $/kg, cNO = 8.175 $/kg and cCO = 6.242 $/kg [28,29]. In addition, the unit cost of electricity generated is calculated from the following relation:
c e l , t o t = C ˙ e l ,   g t , 1 , 2 + C ˙ e l ,   s t W ˙ n e t

5. Environmental Analysis

In order to obtain an environmental analysis (CO and NOxemission values) from combustion of fuel in the combustion chamber, the adiabatic flame temperature must first be calculated. The adiabatic flame temperature in the combustion chamber is obtained from the following relationship: [28,29]:
T p z = A σ α e x p ( β ( σ + λ ) 2 ) π x θ y ψ z
In the above relation [1]:
π = P 3 P r e f ,   P r e f = 101.3   ( k P a )
θ = t 3 t r e f ,   T r e f = 300 ( K )
ψ = H C   A t o m i c   r a t i o
also
σ = ϕ , ϕ < 1
That is, the equivalence ratio of the combustion process is assumed to be a constant value. In addition, the values of x, y and z are calculated from the following equations [28,29]:
x = a 1 + b 1 σ + c 1 σ 2
y = a 2 + b 2 σ + c 2 σ 2
z = a 3 + b 3 σ + c 3 σ 2
The constants in the above relations, as well as A, α, β and λ, are presented in [28,29]. Finally, the amount of CO and NOx produced in gr/kg of fuel is calculated from the following equations [28,29]:
m N O x = 0.15 E 16 τ 0.5 e x p ( 71100 T p z ) P 3 0.05 ( Δ P 3 P 3 ) 0.5
m C O = 0.18 E 9 e x p ( 7800 T P Z ) P 3 2 τ ( Δ P 3 P 3 ) 0.5          
In the above relations τ is considered to be 0.002 s.

6. Results and Discussion

6.1. Exergoeconomic and Environmental Results

All equations related to the simulation of the combined cycle systems are simulated by EES software. Initially, in order to validate the programming code and simulation results, the irreversibility values of the various components of the simulated Brayton cycle in the present study are compared with the Brayton cycle of [28] with completely identical inputs according to Table 5. Table 6 reveals that there is a good agreement between the results of present program with the results of [28].
Input values used to simulate the combined cycle systems shown in Figure 1, Figure 2 and Figure 3 are listed in Table 7 [12,28]. It should be noted that due to the high temperature of the exhaust gas at point 4 in the first configuration, the inlet steam temperature to the steam turbine is considered 550 °C and this is the highest recommended value in the literature [11,13,20]. In the parametric analysis it is tried to keep the temperature difference of at least 20 °C in the hot side of steam generator. However, in the second and third configurations, considering that some of the exhaust gas energy from the gas turbine output is consumed in the regenerator, the maximum temperature of 550 °C is not achievable for the inlet of the steam turbine. Therefore, the temperature difference of the hot side of the steam generator is assumed to be 20 °C in the first and second configurations. Moreover, to move closer to the real plant case, the inter-cooler multistage centrifugal compressor with pressure ratio 10 is selected. It is true that the exergy efficiency calculations for inter-cooler multiple stage compressors is a little different, however, as this research aims to conduct a comparative study over three configurations of combined cycles, the overall conclusions remain valid due to considering similar conditions (without inter-cooler) for all the examined configurations. For the steam Rankine cycle, the condenser pressure is specified. In a typical steam turbine, the exhausted steam condenses in the condenser, and it is at a pressure well below atmospheric. Therefore, 10 kPa is selected for condenser pressure so that maximizes the energy extracted from the steam, resulting in a significant increase in net work and thermal efficiency. However, this parameter (condenser pressure) has also its engineering limits.
Using the input data according to Table 7 and the equations described in Table 2 and Table 3, the output results related to the energy, exergy, exergoeconomic and environmental analysis of the first to third configurations are calculated in Table 8. As seen in this table, the use of the regenerator in the second configuration, increase the combustion chamber inlet air temperature which reduces the fuel consumption in the combustion chamber compared to the first configuration. In the third configuration, expanding of the gas mixture is such that only the required work of the compressor needs to be supplied (in the first and second configurations, the mixture of gases expands to near atmospheric pressure), and this causes a rise in the inlet air temperatures into the regenerator and the combustion chamber and a decrease in the required fuel flow rate in the third configuration than the second configuration. However, the output power of the Brayton cycle in the first and second configurations is close to each other and the greater than the third configuration. In addition, in the third configuration, Rankine cycle output power is substantially less than the first and second configurations due to the lower steam turbine inlet temperature and reduced steam generation rate. In the first configuration, due to the absence of a regenerator, the temperature of the exhaust gas is high enough such that the maximum inlet temperature to the steam turbine (550 °C) is always provided. In the third configuration, the exhaust gases temperature decreases in three stages (first gas turbine, second gas turbine and regenerator) compared to the second configuration that is in two stages. For this reason, the temperature of the generated steam in the steam generator of the third configuration is lower than the other two configurations and this reduces the steam turbine output power. In the case of exergy efficiency, although the fuel consumption of the combustion chamber in the third configuration is lower than the other two configurations, the significant reduction in the output power reduces exergy efficiency more than the other configurations examined. On the other hand, the reduction in fossil fuel consumption and consequently the reduction of environmental pollutants in the third configuration has been a factor in reducing of the fuel cost rates, environmental cost rates and overall cost rates which is significantly less than the other two configurations. In addition, the less overall exergy destruction and the associated cost rate is another contributing factor in the reduction of overall cost of the third configuration in comparison to the other two configurations. Finally, the lowest exergy unit cost of generated electricity in the base case is obtained using the second configuration.
If a comparison is made between the results of exergy, exergoeconomic and environmental analysis calculated in Table 8 and energy analysis results presented in [9]. It can be seen that although the new regenerative Brayton cycle has better thermal and energetic performances than the original one and remarkably increases energy efficiency compared to the basic Brayton cycle and the regenerative Brayton cycle [9]; however, its integration with steam Rankine cycle has lowest exergy efficiency among the other possible configurations. Table 8 indicates that the first configuration has the highest exergy efficiency (48.76%), the second configuration has lowest exergy unit cost of electricity (22.93 $/GJ), and the third configuration has the lowest total cost rate (25,450 $/h). Therefore, it depends on the preferences and criteria of each decision maker to select the best configuration among the three proposed configurations as the final configuration based on energy analysis, exergy analysis or exergoeconmic analysis. Of course, if this new regenerative gas turbine combined cycle operates at this particular operational condition, it consists of smaller compressor and turbines. Hence, low occupation space, more controllability, quicker starting process, and safer dynamical operation may be encountered as other advantages for the new configuration of this combined cycle.
In addition, in order to better understand the performance of the combined cycle systems, the output values related to the energy and exergy rates of the various components as well as the exergy efficiency of the components of all three configurations shown in Figure 1, Figure 2 and Figure 3 are given in Table 9, Table 10 and Table 11. As can be seen in these tables, the highest amount of exergy destruction occurs in the combustion chamber for all three configurations due to the chemical reaction and in which the first configuration is higher than the other configurations. Another notable point is the higher exergy destruction rate in the steam cycle in the first configuration than the other configurations which is due to the higher mass flow rates in the first configuration. In this case, despite addition of a regenerator in the second configuration, and a regenerator and a second gas turbine in the third configuration, the higher exergy destruction in the steam cycle of the first configuration results in a higher overall exergy destruction than the other configurations. The highest exergy efficiency is related to the gas turbine and the lowest exergy efficiency is in the steam condenser among the components of all three configurations.
For exergy improvement of turbines, efforts should be focused on their isentropic efficiencies, however operation optimization is also needed. For exergy improving of heat exchangers such as condenser and steam generator, if the quantity and quality of heat and mass transfer at the lowest possible temperature difference could be maintained between the two fluids, the exergy destruction can be greatly reduced. Increasing the surface area of heat transfer may help to cut down the exergy destruction, but it is a design consideration and relates to the economic and spatial limits. In practice, a more reliable way is adopting thermal insulation for this equipment. The exergy destruction in combustion chamber occurs is caused due to various reasons such as unburnt fuel, incomplete combustion, and heat loss to the surrounding area through to the combustion process. Overall, it should be noted that some improvement for one component might result in larger exergy destructions in other components in the system, so the feasibility of improvement measures should be considered from the perspective of the whole system. For this reason, an optimization process is needed to reduce total exergy destruction of systems.
Table 12, Table 13 and Table 14 show the exergoeconomic results for all configurations. As it can be seen from these tables, the combustion chamber should be considered more than the other components economically since in each of the three configurations, the maximum value of Z ˙ k + C ˙ D , k belongs to this component. The steam generator and steam turbine in the first configuration, compressor and gas turbine in the second configuration, and regenerator and compressor in the third configuration are in the next position in terms of higher overall cost rates. In addition, as indicated in these tables, the combustion chamber has the lowest exergoeconomic factor in all three configurations. The value obtained for this component means that the exergy destruction cost prevails over the initial cost, which reduces the exergoeconomic factor. Moreover, it is worth noting that the total exergoeconomic factors for the first to third configurations are 7.53, 9.59, and 10.63 percent, respectively. The obtained values indicate that the exergy destruction cost rate has a significantly higher share than the initial equipment cost rate. As a result, the use of higher initial cost components can improve system performance. The exergy unit cost of electricity generated by the turbines in the first to third configurations is presented in Table 15. As shown in this table, the exergy unit cost of electricity in the Brayton cycle is lower than the Rankine cycle in the considered combined cycle systems. This indicates that the Brayton cycle in all three configurations perform better than the Rankine cycle.

6.2. Parametric Study

In this section, the effect of changing the Brayton compressor pressure ratio and the Brayton turbine inlet temperature on the performance of the combined cycle systems are investigated from the perspective of energy, exergy, exergy-economic and environmental factors. Note that for the purpose of parametric analysis, only the desired parameter is changed in the operating range and the rest of the inputs in the systems remain constant according to Table 7. The impact of changes in the compressor pressure ratio on the overall output power and the exergy efficiency of all configurations are examined in Figure 4 and Figure 5. As shown in these figures, the first to third configurations have the highest output power and exergy efficiency respectively. Increasing the compressor pressure ratio in the operation range reduces the overall output of the first configuration and increases the total power of the second and third configurations.
The effect of changes in the compressor pressure ratio on the overall cost rate and environmental cost rate of the configurations examined is shown in Figure 6 and Figure 7. As shown in Figure 6, the highest overall cost rates are related to the first and the third configurations, respectively. As mentioned, increasing the compressor pressure ratio reduces the required fuel flow in the first configuration, which significantly reduces the environmental cost rate and the required fuel cost as shown in Figure 7. In addition, in the first configuration, an increase in the compressor pressure ratio, reduces overall exergy destruction cost and increases overall initial cost which has a greater impact on the reduction of overall system cost. The performances of the second and the third configuration are similar in this case. In both the first and the second configurations, despite lower environmental cost rates due to reduced carbon monoxide and nitrogen monoxide emissions, the fuel cost rate, the exergy destruction cost rate, and the initial cost rate have increased, which increases the overall cost rate. In addition, the effect of changing the compressor pressure ratio on the exergy unit cost of electricity generated shown in Figure 8. As shown in this figure, despite the lower overall cost rate, the third configuration has the highest cost per unit of exergy generated. Further, according to this figure, the second configuration for the pressure ratio in the range of 8 to about 17.3 and the first configuration for the pressure ratio from 17.3 to 20 has the lowest exergy unit cost of electricity that makes it difficult to choose the best cycle from the exergoeconomic and environmental perspective. In this case, although the third configuration has the lowest overall cost rate, it results in the highest exergy unit cost of electricity generated during the operating range.
The effect of the Gas Turbine 1 inlet temperature on the overall output power of the configurations and the exergy efficiency are examined and shown in Figure 9 and Figure 10. As shown in this figure, increasing the inlet temperature of the turbine increases the overall output power in all three cases and the first and the third configurations achieve the highest output work and exergy efficiency, respectively. In all three cases, increasing the inlet temperature of the gas turbine, increase the enthalpy difference of the gas turbine, its output work and the overall work cycle of the upper cycle. On the other hand, increasing the inlet temperature of the gas turbine increases the required input fuel mass flow rate. This increase in fuel mass flow rate, increases the flow rate of the steam by increasing the temperature of the inlet gas, both factors increase the steam flow rate, which increases the steam cycle output. The simultaneous increase of upper and lower cycle work in all three configurations results in an increase in overall output work. As shown in Figure 10, the exergy efficiency of all configurations increases with increasing inlet temperature of Gas Turbine 1. However, despite of the increase in the required fuel flow and the corresponding exergy of the fuel, increasing of output work in all three configurations have the dominant effect, which increased the exergy efficiency.
Effect of inlet temperature change of the first gas turbine on the overall cost rate and environmental cost rate of the configurations examined are shown in Figure 11 and Figure 12. As shown in Figure 11, the increase in the inlet temperature of the gas turbine increases the overall cost rate and the first and the third configurations have the highest overall cost rate, respectively. In this case, increasing the gas turbine inlet temperature simultaneously increases the exergy destruction cost rate, the initial cost rate, the fuel cost rate, and the environmental cost rate as shown in Figure 12, which ultimately increases the overall cost. In addition, as shown in Figure 13, increasing the gas turbine inlet temperature, the highest cost per exergy unit belongs to the third, the first and the second configurations, respectively. In all three configurations, however, the exergy unit cost of electricity decreases at first and reaches to its minimum value at about 1235 °C and as the gas turbine inlet temperature rises above this value, the cost of the exergy unit increases again.

6.3. Multi-Objective Optimization Results

In order to optimize the performance of the combined cycle systems shown in Figure 1, Figure 2 and Figure 3, the following parameters are selected as design parameters: compressor pressure ratio, gas turbine inlet temperature, compressor isentropic efficiency, gas turbine isentropic efficiency, regenerator efficiency, steam generator pinch point temperature difference and condenser pressure. In addition, exergy efficiency, overall cost rate and exergy unit cost of generated electricity are considered as objective functions:
M a x i m i z e   η e x ( P r , c o m p , G T I T ,   η g t , η c o m p ,   ε r e g ,   Δ T P P , s g ,   P c o n d )            
M i n i m i z e   C ˙ t o t ( P r , c o m p , G T I T ,   η g t , η c o m p ,   ε r e g ,   Δ T P P , s g ,   P c o n d )            
M i n i m i z e   c e l , t o t ( P r , c o m p , G T I T ,   η g t , η c o m p ,   ε r e g ,   Δ T P P , s g ,   P c o n d )            
Furthermore, due to the existing temperature limitations, the design parameters investigated vary within the following ranges:
10 < P r , c o m p < 19        
1180 ( ° C ) < G T I T ( C o n f i g .1 ) < 1250 ( ° C )        
    1100 ( ° C ) < G T I T ( C o n f i g .2 , 3 ) < 1250 ( ° C )        
  0.8 < η g t < 0.88    
  0.78 < η c o m p < 0.88    
  0.55 < ε r e g ( C o n f i g .2 ) < 0.88    
  0.55 < ε r e g ( C o n f i g .3 ) < 0.7    
  10   ( ° C )   Δ T P P , s g < 25   ( ° C )    
  10   ( k P a )   P C o n d < 25   ( k P a )    
The Pareto approach to multi-objective optimization is the key concept to establish optimal set of design variables, since the concepts of Pareto dominance and optimality are straightforward tools for determining the best trade-off solutions among conflicting objectives [32,33,34]. Pareto optimum solutions using a multi-objective genetic algorithm [30,32] for the combined simple Brayton and Rankine cycle (config. 1), combined regenerative Brayton and Rankine cycle (config. 2) and new combined regenerative Brayton and Rankine cycle (config. 3) presented in Figure 14, Figure 15 and Figure 16, respectively. In the multi-objective optimization, a process of decision making for the selection of the final optimal results from the available solutions is required. In selection of the final optimum point, it is desired to achieve the better magnitude for each objective than its initial value of the problem. The related values of design variables in the optimum case are given in Table 16. The output values and objective functions of three configurations shown in Figure 1, Figure 2 and Figure 3 including the exergy unit cost of electricity, the total cost rate and exergy efficiency in the optimum cases are listed in Table 17. As can be seen from this table, the trend of the overall values is in accordance with the base case such as the largest amount of total output power and exergy efficiency belongs to the first configuration which results in the highest overall cost rate for this configuration. On the other hand, the lowest overall amount of power, exergy efficiency and overall cost rate belongs to the third configuration. Further, the lowest exergy unit cost of electricity produced is obtained by the second configuration. On the other hand, in all three configurations studied, the overall exergoeconomic factor is below 20%, indicating that the rate of exergy destruction cost dominates over the initial cost rate. In addition, the comparison of results in the Table 17 (optimum case) and Table 8 (base case) indicates that the optimization process leads to a decrease in the exergy unit cost of products and systems total cost and an increase in the exergetic efficiency. Therefore, improvement for all objectives has been achieved using optimization process. According to this table, optimization process improves the total performance of the system in a way that the exergy efficiency is increased from 48.76% to 49.6% for the first configuration, from 47.92% to 48.28% for the second configuration, and from 39.29% to 43% for the third configuration. Exergy unit cost of generated electricity is reduced from 23.66 $/GJ to 22.36 $/GJ for the first configuration, from 22.93 $/GJ to 21.13 $/GJ for the second configuration, and from 24.89 $/GJ to 23.28 $/GJ for the third configuration. In addition, this table indicates that the exergoeconomic factor for the studied systems is increased from 7.53 to 14.47 for the first configuration, from 9.59 to 14.78 for the second configuration, and from 10.63 to 17.96 for the third configuration. Although these improvements achieve with 38.87%, 16.38% and 57.58% increase in the capital investment cost of the first, the second and the third configurations, respectively, from studied combined cycle systems. Moreover, environmental emmision costs decrease 57.7%, 6.7% and 29.52% in the optimum cases for the first, the second and the third configuration, respectively.

7. Conclusions

In the present study, three different configurations of the combined cycle system are analyzed from the perspective of energy, exergy, exergy-economic and environmental. The results of the comprehensive analysis on these three configurations reveals that the first, the second and the third configuration are the best among the other systems if exergy efficiency, exergy unit cost of generated electricity, and overall cost rate are the objective functions, respectively. The first configuration has the highest exergy efficiency (48.76%), the second configuration has lowest exergy unit cost of electricity (22.93 $/GJ) and the third configuration has the lowest total cost rate (25,450 $/h). Therefore, it depends on the preferences and criteria of each decision maker to select the best configuration among the three proposed configurations as the final configuration. For the purpose of parametric study, the effect of changing in the Brayton designed parameters in the operating range such as the compressor pressure ratio and the turbine inlet temperature on the performance of the combined cycle systems are investigated from the perspective of energy, exergy, exergy-economic and environmental. Moreover, the application of exergoeconomic multi-objective optimization shows that the total performance of combined cycle systems improved significantly in a way that:
  • The exergy efficiency is increased from 48.76% to 49.6% for the first configuration, from 47.92% to 48.28% for the second configuration, and from 39.29% to 43% for the third configuration.
  • Exergy unit cost of generated electricity is reduced from 23.66 $/GJ to 22.36 $/GJ for the first configuration, from 22.93 $/GJ to 21.13 $/GJ for the second configuration, and from 24.89 $/GJ to 23.28 $/GJ for the third configuration.
  • Exergoeconomic factor for the studied systems is increased from 7.53 to 14.47 for the first configuration, from 9.59 to 14.78 for the second configuration, and from 10.63 to 17.96 for the third configuration.
  • However, these improvements achieve with 38.87%, 16.38% and 57.58% increase in the capital investment cost of the first, the second and the third configurations, respectively from studied combined cycle systems.
For the future works, it is very good idea to do more research on these configurations of gas turbine combined cycle systems from a purely economic point of view, taking into account the costs of return, and the reliability, etc. This is because the focus of the present study was mainly on the investigation of thermodynamics, exegoeconomics and environmental aspects of these integrated systems.

Author Contributions

Conceptualization, A.B.; methodology, A.B.; software, A.B.; investigation, A.A.-M.; writing—original draft preparation, A.B.; writing—review and editing, A.A.-M.; supervision, A.B. All authors have read and agreed to the published version of the manuscript.

Funding

Amjad Anvari-Moghaddam acknowledges the support of “HeatReFlex-Green and Flexible Heating/Cooling” project funded by Danida Fellowship Centre and the Ministry of Foreign Affairs of Denmark under the grant no. 18-M06-AAU.

Institutional Review Board Statement

Not applicable.

Informed Consent Statement

Not applicable.

Data Availability Statement

Not applicable.

Conflicts of Interest

The authors declare no conflict of interest.

Nomenclature

C p Specific heat (kJ/kg K)
C ˙ Exergy cost rate ($/h)
eSpecific exergy (kJ/kg)
E ˙ Exergy rate (kW)
e k c h Standard chemical exergy rate of kth compnent
fExergoeconomic factor
hSpecific enthalpy (kJ/kg)
IIrreversibility (kW)
m ˙ Mass flow rate (kg/s)
PrPressure ratio
PPressure (bar)
Q ˙ Heat transfer rate (MW)
RGas constant (kJ/kg K)
sSpecific entropy (kJ/kg K)
TTemperature (°C)
WWork (kJ)
W ˙ Work rate (MW)
yMolar fraction
Z ˙ Capital investment ($/h)
Greek symbols
ε Effectiveness
η Exergy efficiency
Subscripts
0Dead state
aAmbient
ccCombustion chamber
compCompressor
condCondenser
cvControl volume
chChemical
DDestruction
eExit
envEnvironmental
FFuel
gtGas turbine
iInlet
kComponent
LLoss
mixMixture
oOutlet
PProduct
pPump
phPhysical
QHeat transfer
regRegenerator
revReversible
sgSteam generator
stSteam turbine
wWork

Abbreviation

Config.Configuration
GTITGas turbine inlet temperature
PPPinch point

References

  1. Taimoor, A.A.; Siddiqui, M.E.; Abdel Aziz, S.S. Thermodynamic Analysis of Partitioned Combined Cycle using Simple Gases. Appl. Sci. 2019, 9, 4190. [Google Scholar] [CrossRef] [Green Version]
  2. Koç, Y.; Yağlı, H.; Kalay, I. Energy, Exergy, and Parametric Analysis of Simple and Recuperative Organic Rankine Cycles Using a Gas Turbine–Based Combined Cycle. J. Energy Eng. 2020, 146, 5. [Google Scholar] [CrossRef]
  3. Valencia, G.; Duarte, J.; Isaza-Roldan, C. Thermoeconomic Analysis of Different Exhaust Waste-Heat Recovery Systems for Natural Gas Engine Based on ORC. Appl. Sci. 2019, 9, 4017. [Google Scholar] [CrossRef] [Green Version]
  4. Gutierrez, J.C.; Valencia Ochoa, G.; Duarte-Forero, J. Regenerative Organic Rankine Cycle as Bottoming Cycle of an Industrial Gas Engine: Traditional and Advanced Exergetic Analysis. Appl. Sci. 2020, 10, 4411. [Google Scholar] [CrossRef]
  5. Ghazikhani, M.; Khazaee, I.; Abdekhodaie, E. Exergy analysis of gas turbine with air bottoming cycle. Energy 2014, 72, 599–607. [Google Scholar] [CrossRef]
  6. Alizadeh, S.M.; Ghazanfari, A.; Ehyaei, M.A.; Ahmadi, A.; Jamali, D.H.; Nedaei, N.; Davarpanah, A. Investigation the Integration of Heliostat Solar Receiver to Gas and Combined Cycles by Energy, Exergy, and Economic Point of Views. Appl. Sci. 2020, 10, 5307. [Google Scholar] [CrossRef]
  7. Wu, C.; Chen, L.; Sun, F. Performance of a regenerative Brayton heat engine. Energy 1996, 21, 71–76. [Google Scholar] [CrossRef]
  8. Sharma, O.P.; Kaushik, S.C.; Manjunath, K. Thermodynamic analysis and optimization of a supercritical CO2 regenerative recompression Brayton cycle coupled with a marine gas turbine for shipboard waste heat recovery. Therm. Sci. Eng. Prog. 2017, 3, 62–74. [Google Scholar] [CrossRef]
  9. Goodarzi, M. Comparative energy analysis on a new regenerative Brayton cycle. Energy Convers. Manag 2016, 120, 25–31. [Google Scholar] [CrossRef]
  10. Nami, H.; Anvari-Moghaddam, A. Modeling and Analysis of a Solar Boosted Biomass-Driven Combined Cooling, Heating, and Power Plant for Domestic Applications. Sustain. Energy Technol. Assess 2021, 47, 101326. [Google Scholar] [CrossRef]
  11. Baghernejad, A.; Yaghoubi, M. Exergoeconomic analysis and optimization of an Integrated Solar Combined Cycle System (ISCCS) using genetic algorithm. Energy Convers. Manag. 2011, 52, 2193–2203. [Google Scholar] [CrossRef]
  12. Nami, H.; Anvari-Moghaddam, A.; Arabkoohsar, A. Thermodynamic, Economic, and Environmental Analyses of a Waste-Fired Trigeneration Plant. Energies 2020, 13, 13102476. [Google Scholar] [CrossRef]
  13. Mansouri, M.T.; Ahmadi, P.; Kaviri, A.G.; Jaafar, M.N.M. Exergetic and economic evaluation of the effect of HRSG configurations on the performance of combined cycle power plants. Energy Convers. Manag. 2012, 58, 47–58. [Google Scholar] [CrossRef]
  14. Ahmadi, P.; Dincer, I.; Rosen, M.A. Thermodynamic modeling and multi-objective evolutionary based optimization of a new multigeneration energy system. Energy Convers. Manag. 2013, 76, 282–300. [Google Scholar] [CrossRef]
  15. Soltani, R.; Keleshtery, P.M.; Vahdati, M.; KhoshgoftarManesh, M.H.; Rosen, M.A.; Amidpour, M. Multi-objective optimization of a solar-hybrid cogeneration cycle: Application to CGAM problem. Energy Convers. Manag. 2014, 81, 60–71. [Google Scholar] [CrossRef]
  16. Olivenza-León, D.; Medina, A.; Hernández, A.C. Thermodynamic modeling of a hybrid solar gas-turbine power plant. Energy Convers. Manag. 2015, 93, 435–447. [Google Scholar] [CrossRef]
  17. Nami, H.; Anvari-Moghaddam, A.; Arabkoohsar, A. Application of CCHPs in a Centralized Domestic Heating, Cooling and Power Network—Thermodynamic and Economic Implications. Sustain. Cities Soc. 2020, 60, 102151. [Google Scholar] [CrossRef]
  18. Anvari, S.; Khalilarya, S.; Zare, V. Exergoeconomic and environmental analysis of a novel configuration of solar-biomass hybrid power generation system. Energy 2018, 165, 776–789. [Google Scholar] [CrossRef]
  19. Baghernejad, A.; Yaghoubi, M.; Jafarpur, K. Exergoeconomic optimization and environmental analysis of a novel solar-trigeneration system for heating, cooling and power production purpose. Sol. Energy 2016, 134, 165–179. [Google Scholar] [CrossRef]
  20. Saghafifar, M.; Gadalla, M. Thermo-economic analysis of conventional combined cycle hybridization: United Arab Emirates case study. Energy Convers. Manag. 2016, 111, 358–374. [Google Scholar] [CrossRef]
  21. Mohammadi, A.; Kasaeian, A.; Pourfayaz, F.; Ahmadi, M.H. Thermodynamic analysis of a combined gas turbine, ORC cycle and absorption refrigeration for a CCHP system. Appl. Therm. Eng. 2017, 111, 397–406. [Google Scholar] [CrossRef]
  22. Mohammadi, K.V.A.; Joda, F.; Boozarjomehry, R.B. Exergic, economic and environmental impacts of natural gas and diesel in operation of combined cycle power plants. Energy Convers. Manag. 2016, 109, 103–112. [Google Scholar] [CrossRef]
  23. Ahmadi, P.; Dincer, I.; Rosen, M.A. Exergy, exergoeconomic and environmental analyses and evolutionary algorithm based multi-objective optimization of combined cycle power plants. Energy 2011, 36, 5886–5898. [Google Scholar] [CrossRef]
  24. Goodarzi, M.; Kiasat, M.; Khalilidehkordi, E. Performance analysis of a modified regenerative Brayton and inverse Brayton cycle. Energy 2014, 72, 35–43. [Google Scholar] [CrossRef]
  25. Goodarzi, M. Usefulness analysis on regenerator and heat exchanger in Brayton & inverse Brayton cycles at moderate pressure ratio operation. Energy Convers. Manag. 2016, 126, 982–990. [Google Scholar] [CrossRef]
  26. Saghafifar, M.; Gadalla, M. Thermo-economic analysis of air bottoming cycle hybridization using heliostat field collector: A comparative analysis. Energy 2016, 112, 698–714. [Google Scholar] [CrossRef]
  27. Anvari, S.; Jafarmadar, S.; Khalilarya, S. Proposal of a combined heat and power plant hybridized with regeneration organic Rankine cycle: Energy-Exergy evaluation. Energy Convers. Manag. 2016, 122, 357–365. [Google Scholar] [CrossRef]
  28. Bejan, A.; Tsatsaronis, G.; Moran, M.J. Thermal Design and Optimization; John Wiley & Sons: Hoboken, NJ, USA, 1995. [Google Scholar]
  29. Baghernejad, A.; Yaghoubi, M.; Jafarpur, K. Exergoeconomic comparison of three novel trigeneration systems using SOFC, biomass and solar energies. Appl. Therm. Eng. 2016, 104, 534–555. [Google Scholar] [CrossRef]
  30. Baghernejad, A.; Yaghoubi, M. Multi objective exergoeconomic optimization of an integrated solar combined cycle system using evolutionary algorithms. Int. J. Energy Res. 2010, 35, 601–615. [Google Scholar] [CrossRef]
  31. Nami, H.; Arabkoohsar, A.; Anvari-Moghaddam, A. Thermodynamic and Sustainability Analysis of a Municipal Waste-Driven Combined Cooling, Heating and Power (CCHP). Plant. Energy Convers. Manag. 2019, 201, 112158. [Google Scholar] [CrossRef]
  32. Baghernejad, A.; Yaghoubi, M.; Jafarpur, K. Optimum power performance of a new integrated SOFC-trigeneration system by multi-objective exergoeconomic optimization. Int. J. Electr. Power Energy Syst. 2015, 73, 899–912. [Google Scholar] [CrossRef]
  33. Nikolaidis, T.; Li, Z.; Jafari, S. Advanced Constraints Management Strategy for Real-Time Optimization of Gas Turbine Engine Transient Performance. Appl. Sci. 2019, 9, 5333. [Google Scholar] [CrossRef] [Green Version]
  34. Wang, F.; Zhou, L.; Wang, B.; Wang, Z.; Shafie-khah, M.; Catalão, J.P.S. Modified Chaos Particle Swarm Optimization-Based Optimized Operation Model for Stand-Alone CCHP Microgrid. Appl. Sci. 2017, 7, 754. [Google Scholar] [CrossRef] [Green Version]
Figure 1. Schematic of the combined simple Brayton and Rankine cycle (Config. 1).
Applsci 11 11554 g001
Figure 2. Schematic of the combined regenerative Brayton and Rankine cycle (Config. 2).
Applsci 11 11554 g002
Figure 3. Schematic of the new combined regenerative Brayton and Rankine cycle (Config. 3).
Applsci 11 11554 g003
Figure 4. Effect of compressor pressure ratio change on the overall output power.
Applsci 11 11554 g004
Figure 5. Effect of compressor pressure ratio change on the overall exergy efficiency.
Applsci 11 11554 g005
Figure 6. Effect of compressor pressure ratio change on the overall cost rate.
Applsci 11 11554 g006
Figure 7. Effect of compressor pressure ratio change on the environmental cost rate.
Applsci 11 11554 g007
Figure 8. Effect of compressor pressure ratio change on the exergy unit cost of produced electricity.
Applsci 11 11554 g008
Figure 9. Effect of gas turbine inlet temperature change on the overall output power.
Applsci 11 11554 g009
Figure 10. Effect of gas turbine inlet temperature change on the overall exergy efficiency.
Applsci 11 11554 g010
Figure 11. Effect of gas turbine inlet temperature change on the overall cost rate.
Applsci 11 11554 g011
Figure 12. Effect of gas turbine inlet temperature change on the environmental cost rate.
Applsci 11 11554 g012
Figure 13. Effect of gas turbine inlet temperature change on the exergy unit cost of produced electricity.
Applsci 11 11554 g013
Figure 14. Pareto optimal solutions for the configuration shown in Figure 1.
Applsci 11 11554 g014
Figure 15. Pareto optimal solutions for the configuration shown in Figure 2.
Applsci 11 11554 g015
Figure 16. Pareto optimal solutions for the configuration shown in Figure 3.
Applsci 11 11554 g016
Table 1. Molar percentages of the inlet air components into the combustion chamber.
ComponentsMolar Percentage (%)
Nitrogen77.48
Oxygen20.59
Carbon dioxide0.03
Steam1.9
Table 2. Energy and exergy relations used in the combined cycle system shown in Figure 3.
ComponentEnergy EquationExergy EquationIrreversibility
Compressor η c o m p = h 2 s h 1 h 2 h 1
W ˙ c o m p = m ˙ a i r ( h 2 h 1 )
E x ˙ D , c o m p = E x ˙ 1 + W ˙ c o m p E x ˙ 2 i c o m p = m ˙ a i r ( T 0 ) ( s 2 s 1 )
Regenerator ε r e g = T 3 T 2 T 5 T 2
m ˙ a i r ( h 3 h 2 ) = m ˙ g a s ( h 5 h 6 )
Q ˙ r e g = m ˙ a i r ( h 3 h 2 )
E x ˙ D , r e g = E x ˙ 2 + E x ˙ 5 E x ˙ 3 E x ˙ 6 i r e g = m ˙ a i r ( T 0 ) ( s 3 s 2 ) + m ˙ g a s ( T 0 ) ( s 6 s 5 )
Combustion chamber Q ˙ c c = m ˙ f u e l L H V E x ˙ D , c c = E x ˙ 3 + E x ˙ f u e l E x ˙ 4 i c c = m ˙ g a s ( T 0 ) ( s 4 s 3 )
First gas turbine η g t , 1 = h 4 h 5 h 4 h 5 s
W ˙ g t , 1 = m ˙ g a s ( h 4 h 5 )
E x ˙ D , g t , 1 = E x ˙ 4 W ˙ g t , 1 E x ˙ 5 i g t , 1 = m ˙ g a s ( T 0 ) ( s 5 s 4 )
Second gas turbine η g t , 2 = h 6 h 7 h 6 h 7 s
W ˙ g t , 2 = m ˙ g a s ( h 6 h 7 )
E x ˙ D , g t , 2 = E x ˙ 6 W ˙ g t , 2 E x ˙ 7 i g t , 2 = m ˙ g a s ( T 0 ) ( s 7 s 6 )
Steam generator Q ˙ s g = m ˙ s t   ( h 9 h 12 ) E x ˙ D , s g = E x ˙ 7 + E x ˙ 12 E x ˙ 8 E x ˙ 9 i s t , s g = m ˙ g a s ( T 0 ) ( s 8 s 7 ) + m ˙ s t ( T 0 ) ( s 9 s 12 )
Steam turbine η s t = h 9 h 10 h 9 h 10 s
W ˙ s t = m ˙ s t ( h 9 h 10 )
E x ˙ D , s t = E x ˙ 9 W ˙ s t E x ˙ 10 i s t = m ˙ s t ( T 0 ) ( s 9 s 10 )
Condenser m ˙ s t   ( h 10 h 11 ) = m ˙ 13 ( h 14 h 13 )
Q ˙ c o n d = m ˙ s t ( h 10 h 11 )
E x ˙ D , c o n d = E x ˙ 10 + E x ˙ 13 E x ˙ 11 E x ˙ 14 i s t , c o n d = m ˙ s t ( t 0 ) ( s 11 s 10 ) + m ˙ 13 ( t 0 ) ( s 14 s 13 )
Pump W ˙ p = m ˙ s t   . v 11   . ( P 12 P 11 ) η P E x ˙ D , p = E x ˙ 11 + W ˙ p E x ˙ 12 i s t , p = m ˙ s t ( t 0 ) ( s 12 s 11 )
Table 3. Fuel and product exergy in various components of Figure 3.
ComponentFuel ExergyProduct Exergy
Compressor W ˙ c o m p E x ˙ 2 E x ˙ 1
Regenerator E x ˙ 5 E x ˙ 6 E x ˙ 3 E x ˙ 2
Combustion chamber E x ˙ 3 + E x ˙ f u e l E x ˙ 4
First gas turbine E x ˙ 4 E x ˙ 5 W ˙ g t , 1
Second gas turbine E x ˙ 6 E x ˙ 7 W ˙ g t , 2
Steam generator E x ˙ 7 E x ˙ 8 E x ˙ 9 E x ˙ 12
Steam turbine E x ˙ 9 E x ˙ 10 W ˙ s t
Condenser E x ˙ 10 E x ˙ 11 E x ˙ 14 E x ˙ 13
Pump W ˙ p E x ˙ 12 E x ˙ 11
Table 4. Cost balance and auxiliary equations of combined cycle system shown in Figure 3.
ComponentCost Balance EquationAuxiliary Equation
Compressor c 1 E x ˙ 1 + c e l , g t , 1 W ˙ c o m p + Z ˙ c o m p = c 2 E x ˙ 2 c 1 = 0
Regenerator c 2 E x ˙ 2 + c 5 E x ˙ 5 + Z ˙ r e g = c 3 E x ˙ 3 + c 6 E x ˙ 6 c 5 = c 6
Combustion chamber c 3 E x ˙ 3 + c f u e l E x ˙ f u e l + Z ˙ c c = c 4 E x ˙ 4 c f u e l = 12   ( $ G j )
First gas turbine c 4 E x ˙ 4 + Z ˙ g t , 1 = c e l , g t , 1 W ˙ g t , 1 + c 5 E x ˙ 5 c 4 = c 5
Second gas turbine c 6 E x ˙ 6 + Z ˙ g t , 2 = c e l , g t , 2 W ˙ g t , 2 + c 7 E x ˙ 7 c 6 = c 7
Steam generator c 12 E x ˙ 12 + c 7 E x ˙ 7 + Z ˙ s g = c 8 E x ˙ 8 + c 9 E x ˙ 9 c 7 = c 8
Steam turbine c 9 E x ˙ 9 + Z ˙ s t = c e l , s t w ˙ s t + c 10 E x ˙ 10 c 9 = c 10
Condenser c 10 E x ˙ 10 + c 13 E x ˙ 13 + Z ˙ s t , c o n d = c 11 E x ˙ 11 + c 14 E x ˙ 14 c 10 = c 11
Pump c 11 E x ˙ 11 + c e l , s t W ˙ p + Z ˙ p = c 12 E x ˙ 12 -
Table 5. Input values for Brayton cycle of the system according to data reported in [28].
ParameterValue
Ambient   temperature   ( ° C )25
Ambient pressure (kPa)101.3
Overall produced power of gas turbine cycle (MW)30
Compressor pressure ratio 10
Gas   turbine   inlet   temperature   ( ° C )1246.85
Regenerator   outlet   air   temperature   ( ° C )576.85
Gas turbine isentropic efficiency0.86
Compressor isentropic efficiency 0.86
Table 6. Comparative results obtained between present programming code and Brayton cycle of the system studied in [28].
ComponentsIrreversibility (MW)
(Present Programming Code)
Irreversibility (MW)
[28]
Compressor2.092.12
Regenerator2.552.63
Combustion chamber25.3425.48
Gas turbine2.993.01
Table 7. Input data to simulate the combined cycle systems shown in Figure 1, Figure 2 and Figure 3.
ParameterValue
Ambient   temperature   ( ° C )25
Ambient pressure (kPa)101.3
Inlet air mass flow rate (kg/s)491.55
Compressor pressure ratio10
Isentropic efficiency of compressor and gas turbine 0.86
Regenerator effectiveness0.7
Inlet   temperature   of   the   first   gas   turbine   ( ° C )1200
Lower   heating   value   of   fuel   ( k J k m o l ) 802,361
Fuel   inlet   temperature   ( ° C )25
Fuel inlet pressure (kPa)1200
Saturation   temperature   of   steam   generator   ( ° C )290
Steam   side   temperature   difference   of   the   steam   generator   in   the   sec ond   and   third   configurations   ( ° C )20
Steam   turbine   inlet   temperature   in   the   first   configuration   ( ° C )550
Condenser pressure (kPa)10
Isentropic efficiency of pump0.8
Isentropic efficiency of steam turbine0.85
Pinch   point   temperature   difference   of   steam   generator   and   condenser   ( ° C ) 10
Cooling   water   inlet   temperature   to   condenser   ( ° C )25
Table 8. Output values for different configurations of the present study.
Calculated ParametersConfig. 1Config. 2Config. 3
Inlet   temperature   to   combustion   chamber ,   T i n l e t , c c ( ° C ) 337.7612.7729.9
Inlet   temperature   to   steam   turbine ,   T i n l e t , s t ( ° C ) 550427.1323.2
Fuel   mass   flow   rate ,   m ˙ f u e l ( k g / s ) 11.117.7485.446
Steam   mass   flow   rate ,   m ˙ s t ( k g / s ) 10342.6114.52
Gas   turbine   power ,   W ˙ g t ( M W ) 164.4150.598.48
Steam   turbine   power ,   W ˙ s t ( M W ) 11641.5712.23
Net   power ,   W ˙ n e t ( M W ) 280.4192.1110.71
Fuel   exergy ,   E x ˙ f , c c ( M W ) 574.96400.86281.76
Exergy   efficiency ,   η e x , n e t ( % ) 48.7647.9239.29
Exergy   destruction ,   E x ˙ D , t o t ( M W ) 274.83176.78130.33
Capital   investment   cost ,   Z ˙ t o t ( $ / h r ) 150912541051
Exergy   destruction   cost ,   C ˙ D , t o t ( $ / h r ) 18,51411,6188842
Fuel   cost ,   C ˙ f u e l ( $ / h r ) 24,01016,74011,766
Environmental   cost ,   C ˙ e n v , t o t ( $ / h r ) 826047953791
Total   cost ,   C ˙ t o t ( $ / h r ) 52,29334,40625,450
Exergy   unit   cost   of   electricity ,   c p , n e t ( $ GJ ) 23.6622.9324.89
Table 9. Energy and exergy analysis of Config. 1.
Component W ˙ o r   Q ˙   ( k W ) E x ˙ D   ( k W ) η e x   ( % )
Compressor160,05811,33692.92
Combustion chamber544,390184,59367.89
Gas turbine 324,42517,08095
Steam generator342,59531,58782.64
Steam turbine116,96419,28485.85
Condenser226,59710,77027.7
Pump966.9181.581.22
Table 10. Energy and exergy analysis of Config. 2.
Component W ˙ o r   Q ˙   ( k W ) E x ˙ D   ( k W ) η e x   ( % )
Compressor160,05811,33692.92
Regenerator149,29910,74089.02
Combustion chamber379,652114,96071.32
Gas turbine 310,57916,15695.06
Steam generator128,69912,45981.34
Steam turbine41,971692085.85
Condenser87,128414127.7
Pump399.775.0581.22
Table 11. Energy and exergy analysis of Config. 3.
Component W ˙ o r   Q ˙   ( k W ) E x ˙ D   ( k W ) η e x   ( % )
Compressor160,05811,33692.92
Regenerator251,31419,28789.11
Combustion chamber266,85476,66972.79
First gas turbine 160,058649396.1
Second gas turbine 98,483794592.53
Steam generator39,348525057.38
Steam turbine12,368203985.85
Condenser27,117128927.7
Pump136.225.5881.22
Table 12. Exergoeconomic analysis of Config. 1.
Component C ˙ D   ( $ / h ) Z ˙   ( $ / h ) C ˙ D   +   Z ˙   ( $ / h ) f   ( % )
Compressor830.8500.2133137.58
Combustion chamber11,75827.6911,785.690.23
Gas turbine 1175275.31450.318.98
Steam generator217424024149.94
Steam turbine1641340.61981.617.19
Condenser916.51211037.511.66
Pump18.524.3822.919.15
Total system18,513.821509.1720,022.997.53
Table 13. Exergoeconomic analysis of Config. 2.
Component C ˙ D   ( $ / h ) Z ˙   ( $ / h ) C ˙ D   +   Z ˙   ( $ / h ) f   ( % )
Compressor854.1500.21354.336.93
Regenerator760.6112.3872.912.86
Combustion chamber697427.697001.690.395
Gas turbine 1144236.41380.418.71
Steam generator822.3137.61019.913.49
Steam turbine622.1163.6785.720.82
Condenser372.346.51418.8111.11
Pump8.152.3610.4922.32
Total system11,557.551226.6612,784.219.59
Table 14. Exergoeconomic analysis of Config. 3.
Component C ˙ D   ( $ / h ) Z ˙   ( $ / h ) C ˙ D   +   Z ˙   ( $ / h ) f   ( % )
Compressor916.7500.21416.935.3
Regenerator1485112.81597.87.05
Combustion chamber456127.694588.690.603
First gas turbine 499.9120619.919.35
Second gas turbine 611.7113.4725.115.64
Steam generator404.292.1496.318.56
Steam turbine220.869.55290.3523.95
Condenser139.614.48154.0839.9
Pump3.371.0914.46124.46
Total system8842.271051.319893.5810.63
Table 15. Unit cost of exergy for the produced electricity by turbines in all configurations.
Exergy Unit CostConfig. 1Config. 2Config. 3
Exergy   unit   cost   of   produced   electricity   by   the   first   gas   turbine ,   c e l , g t , 1 ( $ GJ ) 20.33220.92922.46
Exergy   unit   cost   of   produced   electricity   by   the   sec ond   gas   turbine ,   c e l , g t , 2 ( $ GJ ) - - 23.429
Exergy   unit   cost   of   produced   electricity   by   the   steam   turbine ,   c e l , s t ( $ GJ ) 28.33230.16536.61
Table 16. Design variables of configurations shown in Figure 1, Figure 2 and Figure 3 in the optimum case.
Design VariablesConfig. 1Config. 2Config. 3
Compressor pressur ratio, Pr191016.47
Gas turbine inlet tempreture, GTIT (°C)12131171181
Isentropic   efficiency   of   gas   turbine ,   η g t 0.880.880.88
Isentropic   efficiency   of   compressor ,   η c o m p 0.8440.8690.856
Effectiveness   of   regenerator ,   ε r e g - 0.80.7
Pinch   point   temperature   of   steam   generator ,   Δ T P P , s g ( ° C ) 101010
Condenser   pressure ,   P c o n d ( k P a ) 101010
Table 17. The values of the output parameters and objective functions corresponding to the optimal case.
Output ParameterConfig. 1Config. 2Config. 3
Exergy   efficiency ,   η e x , t o t ( % ) 49.648.2843
Total   cost ,   C ˙ t o t ( $ / s ) 10.818.3156.83
Total   exergy   unit   cost   of   produced   electricity ,   c e l , t o t ( $ / GJ ) 22.3621.1323.28
Inlet   air   temperature   to   combustion   chamber ,   T i n l e t , C C ( ° C ) 468.8619.5736.3
Inlet   steam   temperature   to   steam   turbine ,   T i n l e t , s t ( ° C ) 550381.4327.7
Fuel   mass   flow   rate ,   m ˙ f u e l ( k g / s ) 9.697.225.18
Steam   mass   flow   rate ,   m ˙ steam ( k g / s ) 69.9531.0315.88
Gas   turbine   power ,   W ˙ gt ( M W ) 170.4151.8117.6
Steam   turbine   power ,   W ˙ s t ( M W ) 78.7628.5413.48
Net   power ,   W ˙ n e t ( M W ) 249.2180.2131.1
Fuel   exergy ,   E x ˙ f , c c ( M W ) 502.5373.48304.96
Exergy   destruction ,   E x ˙ D , t o t ( M W ) 227.8157.4133.3
Capital   investment   cost ,   Z ˙ t o t ( $ / s ) 0.5820.4050.46
Exergy   destruction   cost ,   C ˙ D , t o t ( $ / s ) 3.442.342.1
Fuel   cost ,   C ˙ f u e l ( $ / s ) 5.8174.333.53
Environmental   cost ,   C ˙ e n v , t o t ( $ / s ) 0.9681.240.74
Exergoeconomic   factor ,   f   ( % ) 14.4714.7817.96
Publisher’s Note: MDPI stays neutral with regard to jurisdictional claims in published maps and institutional affiliations.

